Embed Size (px)
Citation preview
7/29/2019 Kc 3118711875
http://slidepdf.com/reader/full/kc-3118711875 1/5
I. Kullayamma, P. Madhavee Latha /International Journal of Engineering Research and
Applications (IJERA) ISSN: 2248-9622 www.ijera.com
Vol. 3, Issue 1, January -February 2013, pp.1871-1875
1871 | P a g e
Retinal Image Analysis for Exudates Detection
I. Kullayamma*, P. Madhavee Latha*** Assistant Professor, Department of Electronics and Communication Engineering, SV University, Tirupati
** M.Tech Student, Department of Electronics and Communication Engineering, SV University, Tirupati
ABSTRACT This project proposes a glaucomatous
image classification using texture features within
images and it will be classified effectively based on
feature ranking and neural network. In additionwith, an efficient detection of exudates for retinal
vasculature disorder analysis performed. The
states of retinal blood vessels can be used to detect
some diseases like diabetes. The important texture
features can be found by using the Energy
distributions over wavelet subbands. This system
uses different wavelet features obtained from the
daubechies (db3), symlets (sym3), and bi-
orthogonal (bio3.3, bio3.5, and bio3.7) wavelet
filters. The energy signatures obtained from 2-D
discrete wavelet transform subjected to different
feature ranking and feature selection strategies.The energy obtained from the detailed coefficients
can be used to distinguish between normal and
glaucomatous images with very high accuracy.
This performance will be done by artificial neural
network model. The exudates are also detected
effectively from the retina fundus image using
segmentation algorithms. Finally the segmented
defect region will be post processed by
morphological processing technique for smoothing
operation.
Keywords-F eature extraction, glaucoma, image
texture, neural network, wavelet transforms.
1. IntroductionGlaucoma is an eye disease and is the leading
causes of blindness. In Glaucoma the optic nerve is
damaged. This damages vision in the affected eye(s)
and lead to blindness if not treated. It is normallyassociated with increased fluid pressure in the eye.
Glaucoma is divided into two types, "open-angle"and "closed-angle" glaucoma. Closed-angleglaucoma appears suddenly and is painful and also
visual loss progresses quickly. Open-angle, chronicglaucoma progresses at a slower rate and patientsmay not notice they have lost vision until the diseasehas progressed significantly. In closed angled
Glaucoma, fluid pressure in the eye increases becauseof inadequate fluid flow between the iris and thecornea.
For the detection and management of glaucoma
recent advances in biomedical imaging offerseffective quantitative imaging alternatives. Manual
analysis of eye images is fairly time consuming, andthe accuracy of parameter measurements varies between experts. Automated clinical decision supportsystems (CDSSs) are used to get effective decision
support systems for the identification of disease inhuman eyes. In CDSS, features extracted from theimages are structural features or texture features.
Proper orthogonal decomposition (POD) is atechnique that uses structural features for the
identification of glaucomatous progression. Wavelettransforms (WT) in image processing are used toobtain the texture features. In WT, the content of theimage is represented in frequency domain. `Thegoal of this paper is to develop an algorithm which
automatically analyze eye ultrasound images andclassify normal eye images and diseased glaucomaeye images and also finds the exudates present in the
diseased eye image. Here, discrete wavelet transform(DWT) using daubechies wavelet, symlets waveletand biorthogonal wavelet are used to extract features.
Wavelet Energy signatures are calculated from theseextracted features. Probabilistic Neural Network isused to automatically analyse and classify the imagesas normal or abnormal eye images. K-means
Clustering technique is applied lastly to find theexudates present in the abnormal eye images. Thisscheme will reduce the processing time currentlytaken by the technologist to analyze patient images.
2. SYSTEM ANALYSIS2.1. Existing System
2.1.1. Threshold based SegmentationA simple method of image segmentation is
the thresholding method. Thresholding is used to
extract a part of the image. Thresholding is classifiedinto Hard thresholding and Soft thresholding.Thresholding` is based on a clip-level (or a thresholdvalue) to turn a gray-scale image into a binary image.The key of this method is to select the thresholdvalue. In hard thresholding, pixel having intensitylower than threshold are set to zero and the pixels
having intensity greater than the threshold are set to255 or left at their original intensity. As the value of the threshold is increased, the image becomes too
dark. Several popular methods are used in industrylike the maximum entropy method, Otsu's method(maximum variance), and k-means clustering.
Recently, methods are developed for thresholdingcomputed tomography (CT) images, in which the
7/29/2019 Kc 3118711875
http://slidepdf.com/reader/full/kc-3118711875 2/5
I. Kullayamma, P. Madhavee Latha /International Journal of Engineering Research and
Applications (IJERA) ISSN: 2248-9622 www.ijera.com
Vol. 3, Issue 1, January -February 2013, pp.1871-1875
1872 | P a g e
thresholds are derived from the radiographs insteadof the (reconstructed) image.2.1.2. Design Steps
(1) Set the initial threshold T= (the maximum
value of the image brightness + the
minimum value of the image brightness)/2.
(2) Using T segment the image to get two setsof pixels B (all the pixel values are less thanT) and N (all the pixel values are greater than T);
(3) Calculate the average value of B and Nseparately, mean ub and un.
(4) Calculate the new threshold: T= (ub+un)/2
(5) Repeat Second steps to fourth steps uptoiterative conditions are met and getnecessary region from the brain image.
The method fails to produce accurate result and
provide optimal threshold for accurate imagesegmentation.2.1.3. Proper orthogonal decomposition (POD)
In this method, pixel-level information is used togauge significant changes across samples that arelocation or region specific. The measurement of texture features, on the other hand, is roughly definedas the spatial variation of pixel intensity (gray-scalevalues) across the image. Textural features are, thus,not bound to specific locations on the image
techniques, including spectral techniques, areavailable to determine texture features.2.2. Proposed System
Automatic glaucomatous image classification usingwavelet based energy features followed by neuralnetwork classifier and fundus exudates detectionthrough clustering model. These Modules includes
the following methodologies,
• Discrete wavelet transforms• Energy feature Extraction• Artificial Neural Network Training and
Classification
• Segmentation using clustering model• Morphological Process
2.2.1. Requirement Specification2.2.1.1. Software Requirement
• MATLAB 7.5 and above versions• Image Processing Toolbox
2.2.1.2 Hardware Requirements
• Pentium(R) D CPU 3GHZ• 1 GB of RAM• 500 GB of Hard disk
2.3. System Implementation2.3.1. Discrete Wavelet TransformWavelet transform is an efficient tool to represent an
image. The wavelet transform allows multi-resolutionanalysis of an image. The wavelet transform hasreceived attention in image processing due to its
flexibility in representing non-stationary image
signals. Wavelet transforms are the most powerfuland widely used tool in image processing. The
applications of Wavelet transforms are Imagecompression, such as still image compression, imagedenoising and watermarking. Wavelet-codingschemes at higher compression ratios avoid blockingartifacts. Because of their inherent multi -resolution
nature, wavelet-coding schemes are especiallysuitable for applications where scalability andtolerable degradation are important.Wavelet Transform (WT) are used to analyze non-stationary signals, i.e., signals whose frequency
response varies in time, as Fourier Transform (FT) isnot suitable for such signals.To overcome the limitation of FT, Short Time
Fourier Transform (STFT) was proposed. In STFT,the signal is divided into small segments, where thesesegments (portions) of the signal are assumed to bestationary. For this purpose, a window function "w"
is chosen. The width of this window in time must be
equal to the segment of the signal. By STFT, one canget time-frequency response of a signal
simultaneously, which can’t be obtained by FT.
Where the length of the window is (t-) in time suchthat we can shift the window by changing value of
t,and by varying the value we get differentfrequency response of the signal segments. Multi-resolution is not possible with STFT.The wavelet transform (WT) is developed as an
alternate approach to STFT to overcome theresolution problem. The wavelet is not having afixed-width sampling window. The transform is
computed separately for different segments of the
time-domain signal at different frequencies. Thisapproach is called Multi-resolution Analysis (MRA),as it analyzes the signal at different frequencies
giving different resolutions.Discrete Wavelet transforms are implementedthrough sub-band coding. By using DWT we canavoid time complexity. The DWT is useful in image
processing because it simultaneously localise signalsin time and scale. The 1-D DWT can be extended to 2-D transform using separable waveletfilters. With separable filters, applying a 1-Dtransform to all the rows of the input and thenrepeating on all of the columns can compute the 2-D
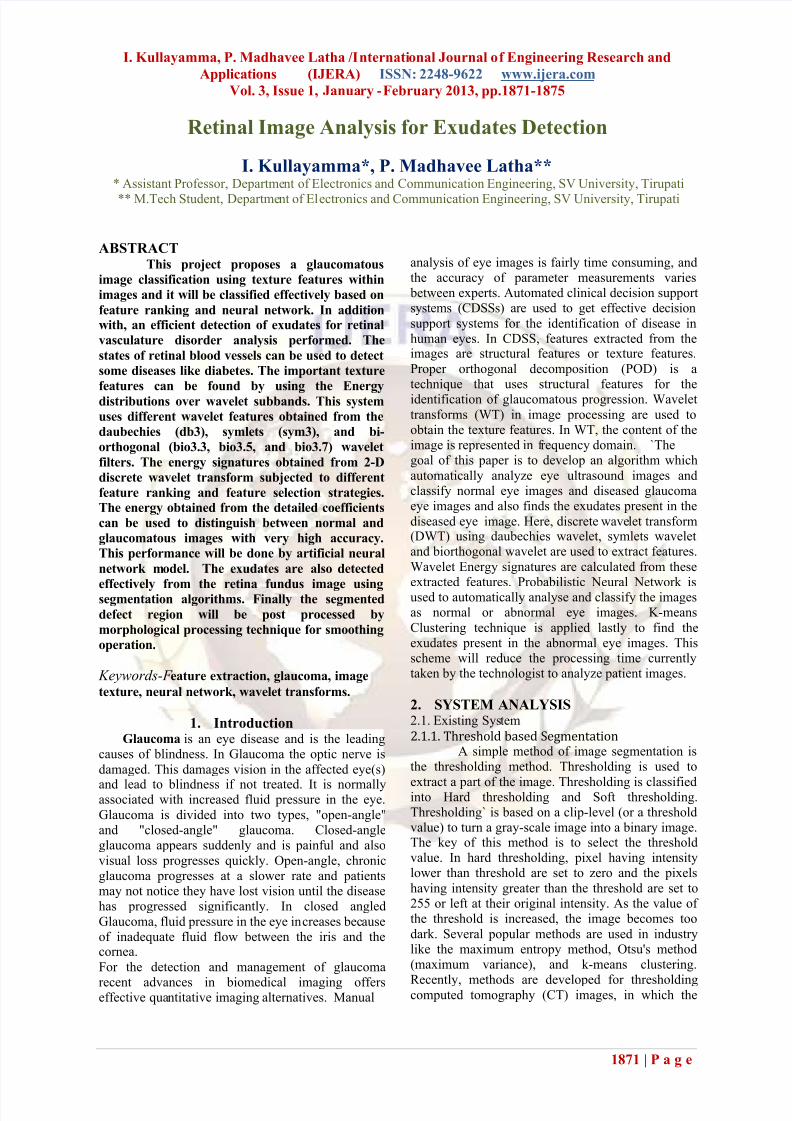
transform. When one-level 2-D DWT is applied to animage, four transform coefficient sets are created.The four sets are LL, HL, LH, and HH, where the
first letter corresponds to applying either a low passor high pass filter to the rows, and the second letter refers to the filter applied to the columns.
(a) (b) (c)
Figure 1 Block Diagram of DWT (a) Original Image(b) Output image after the 1-D applied on Row input
7/29/2019 Kc 3118711875
http://slidepdf.com/reader/full/kc-3118711875 3/5
I. Kullayamma, P. Madhavee Latha /International Journal of Engineering Research and
Applications (IJERA) ISSN: 2248-9622 www.ijera.com
Vol. 3, Issue 1, January -February 2013, pp.1871-1875
1873 | P a g e
(c) Output image after the second 1-D applied oncolumn input.The Two-Dimensional DWT (2D-DWT) convertsimages from spatial domain to frequency domain. Ateach level of the wavelet decomposition, each
column of an image is first transformed using a 1Dvertical analysis filter-bank. The same filter-bank isthen applied horizontally to each row of the filteredand sub sampled data. One-level of waveletdecomposition produces four filtered and sub
sampled images, known as sub bands. The upper andlower areas of Fig. 1 respectively, represent the low pass and high pass coefficients after vertical 1D-
DWT and sub sampling. The result of the horizontal1D-DWT and sub sampling to form a 2D-DWToutput image is shown in Fig.1.We can use multiple levels of wavelet transforms to
concentrate data energy in the lowest sampled bands.
The straight forward convolution implementation of 1D-DWT requires a large amount of memory and
large computation complexity. An alternativeimplementation of the 1D-DWT, known as the liftingscheme, provides significant reduction in the memoryand the computation complexity. Lifting also allows
in-place computation of the wavelet coefficients.The lifting approach computes the same coefficients
as the direct filter-bank convolution.2.3.2. Energy FeaturesThe wavelet filters decomposed the image intoapproximation and detailed coefficients in the
horizontal, vertical and diagonal orientation. The
features averaging coefficient and energy areextracted and it is determined by:
2.3.3. Probabilistic Neural Networks
Neural networks are predictive models which are based on the action of biological neurons.The neural network used to refer to a network or
circuit of neurons. A biological neural network ismade up of a group or groups of chemicallyconnected or functionally associated neurons. Asingle neuron in a network is connected to manyother neurons. The number of neurons and theconnections in a neural network are extensible.
Artificial Neural Networks are composed of interconnecting artificial neurons. This uses acomputational or mathematical model for information
processing. Artificial Neural networks are simple
compared to biological neural network and thesenetworks have good predictive ability and low
generalization error. The original “Perceptron” modelwas developed by Frank Rosenblatt in 1958.Rosenblatt’s model has three layers, (1) a “retina”
that supplies inputs to the second layer, (2)“association units” that combine the inputs with
weights and trigger a threshold step function whichfeeds to the output layer, (3) the output layer whichcombines the values.The training of a neural network is performed by a particular function by adjusting the values of the
connections between elements. Neural Networks areused in various fields like Pattern recognition,Identification, Classification, Speech, Vision and
Control systems. Neural networks are used to solve problems which are difficult for conventionalcomputers and human beings.Probabilistic Neural Network (PNN) is a feed
forward network. It is designed from the Bayesian
network and a algorithm called Kernal Fisher discriminant analysis. Probabilistic networks perform
classification where the target variable is categorical.In PNN, the operations are done in four stages: (1)Input layer: Each neuron in this layer represents a predictor variable. (2) Pattern layer: It contains
neurons that stores the value of the variable and thetarget value. A hidden neuron calculates Euclideandistance. (3) Summation layer: This layer has pattern
neurons. The pattern neurons add value for the class.(4) Output layer: The output layer compares theweighted votes of the target and uses the largest vote
for the prediction of target category.
PNNs are used for classification problems. When aninput is applied, the first layer computes distances
from the input vector to the training input vectors and produces a vector. The second layer sums thesecontributions for each class of inputs and produces avector of probabilities. Ttransfer function on the
output of the second layer picks the maximum of these probabilities, and produces a 1 for that classand a 0 for the other classes. The PNN classifier
presented good accuracy, very small training time,robustness to weight changes, and negligibleretraining time.2.3.4. Image Segmentation
Segmentation is the process of partitioning a digitalimage into groups of pixels which are homogeneouswith respect to some criterion. Different groups must
not intersect with each other, and adjacent groupsmust be heterogeneous. Segmentation algorithms arearea oriented instead of pixel-oriented. The result of segmentation is the splitting up of the image intoconnected areas. The segmentation is concerned withdividing an image into meaningful regions. Imagesegmentation can be done in three different
philosophical perspectives. Regions in an image are agroup of connected pixels with similar properties. Inthe region approach, each pixel is assigned to a
particular object or region. In the boundary approach,the attempt is to locate directly the boundaries that
7/29/2019 Kc 3118711875
http://slidepdf.com/reader/full/kc-3118711875 4/5
I. Kullayamma, P. Madhavee Latha /International Journal of Engineering Research and
Applications (IJERA) ISSN: 2248-9622 www.ijera.com
Vol. 3, Issue 1, January -February 2013, pp.1871-1875
1874 | P a g e
exist between the regions. In the edge approach, theedges are identified first and then they are linkedtogether to form required boundaries. The result of image segmentation is a set of segments thatcollectively cover the entire image.
2.3.5. Clustering methodsThe K-means algorithm is the simplest method inunsupervised classification. It is an iterativetechnique that is used to partition an image into K clusters. The basic algorithm is:
1. Choose K initial cluster centers, either randomly or based on some heuristic
2. Assign each pixel in the image to the cluster
that minimizes the distance between the pixel and the cluster center.
3. Re-compute the cluster centers by averagingall of the pixels in the cluster
4. Repeat steps 2 and 3 until convergence is
attained (e.g. no pixels change clusters)Distance is the squared or absolute difference
between a pixel and a cluster center. The difference istypically based on pixel color, intensity, texture, andlocation, or a weighted combination of these factors.
K can be selected manually, randomly, or by a
heuristic.The drawback of the K-means algorithm is the
number of clusters is fixed. Once K is chosen, itreturns K clustercenters. This algorithm is guaranteedto converge, but it may not return the optimalsolution. The quality of the solution depends on the
initial set of clusters and the value of K .
3. ConclusionThis project implemented a glaucomatous image
classification using texture features and it will beclassified effectively based on artificial neuralnetwork. Here, probabilistic neural network was usedfor classification based on unsupervised leaning
using wavelet energy features and target vectors. Inaddition with, an efficient detection of exudates for retinal vasculature disorder analysis was performed.
This abnormal region detection was successfullydone by using clustering algorithm which is used to provide better segmentation result and performanceaccuracy. Finally this system is very useful to
diagnose the retinal diseases for early detectionvision loss and diabetics.3.1. Advantages
Accurate image classification
Accurate executes detection
It is useful in diabetic diagnosis
Better performance compared to previous
methods.3.2. Result
o Automatic Image Classification categorized
into
Normal
Abnormal(Glaucomatous andexudates)
o Image Segmentation for exudates detection
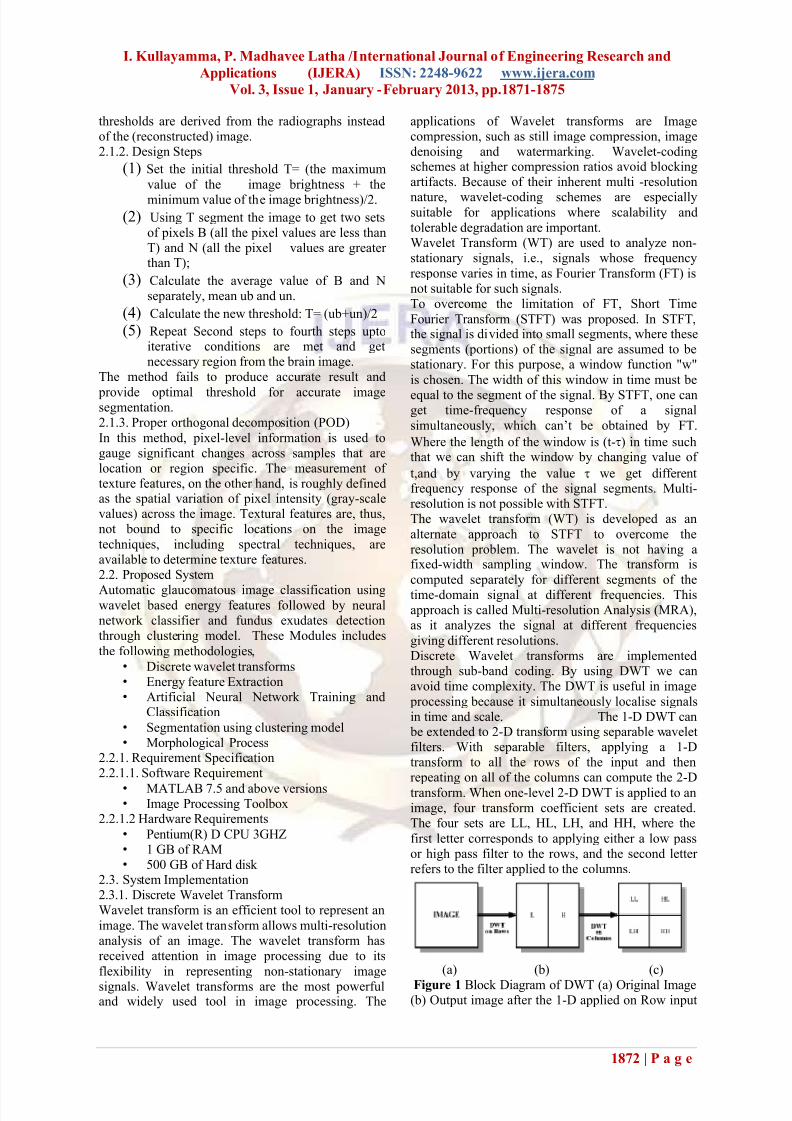
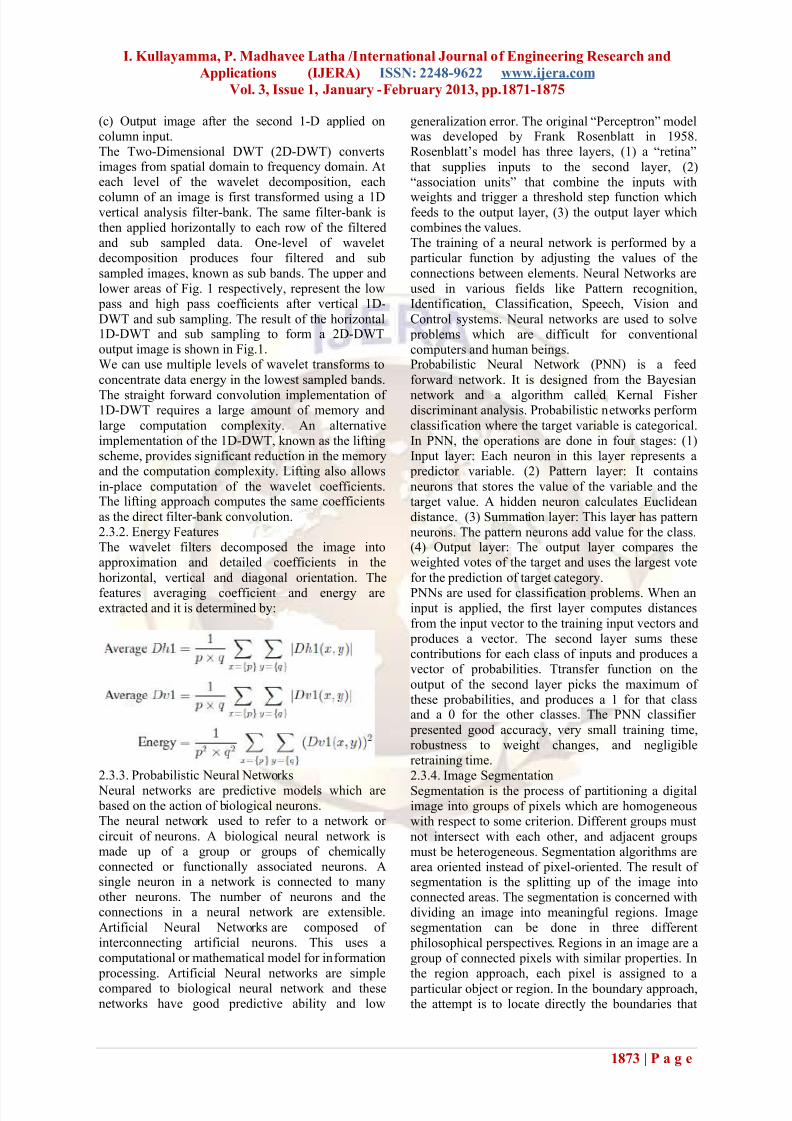
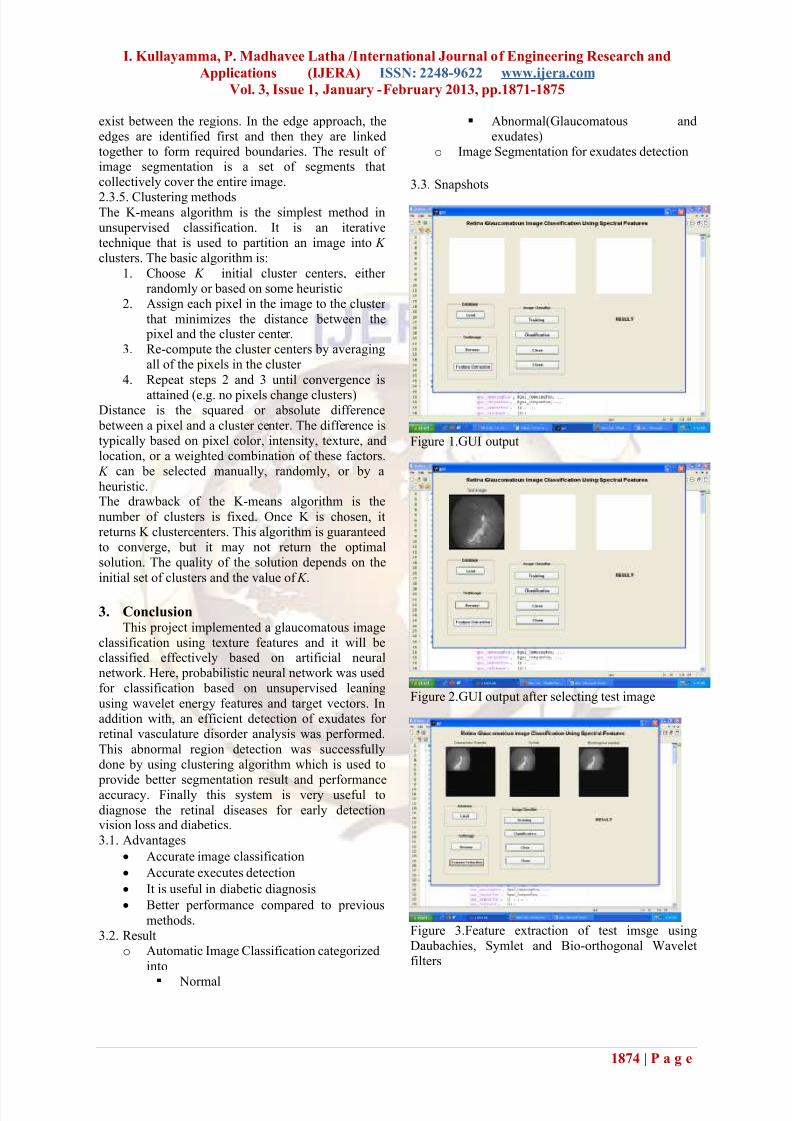
3.3. Snapshots
Figure 1.GUI output
Figure 2.GUI output after selecting test image
Figure 3.Feature extraction of test imsge usingDaubachies, Symlet and Bio-orthogonal Waveletfilters
7/29/2019 Kc 3118711875
http://slidepdf.com/reader/full/kc-3118711875 5/5
I. Kullayamma, P. Madhavee Latha /International Journal of Engineering Research and
Applications (IJERA) ISSN: 2248-9622 www.ijera.com
Vol. 3, Issue 1, January -February 2013, pp.1871-1875
1875 | P a g e
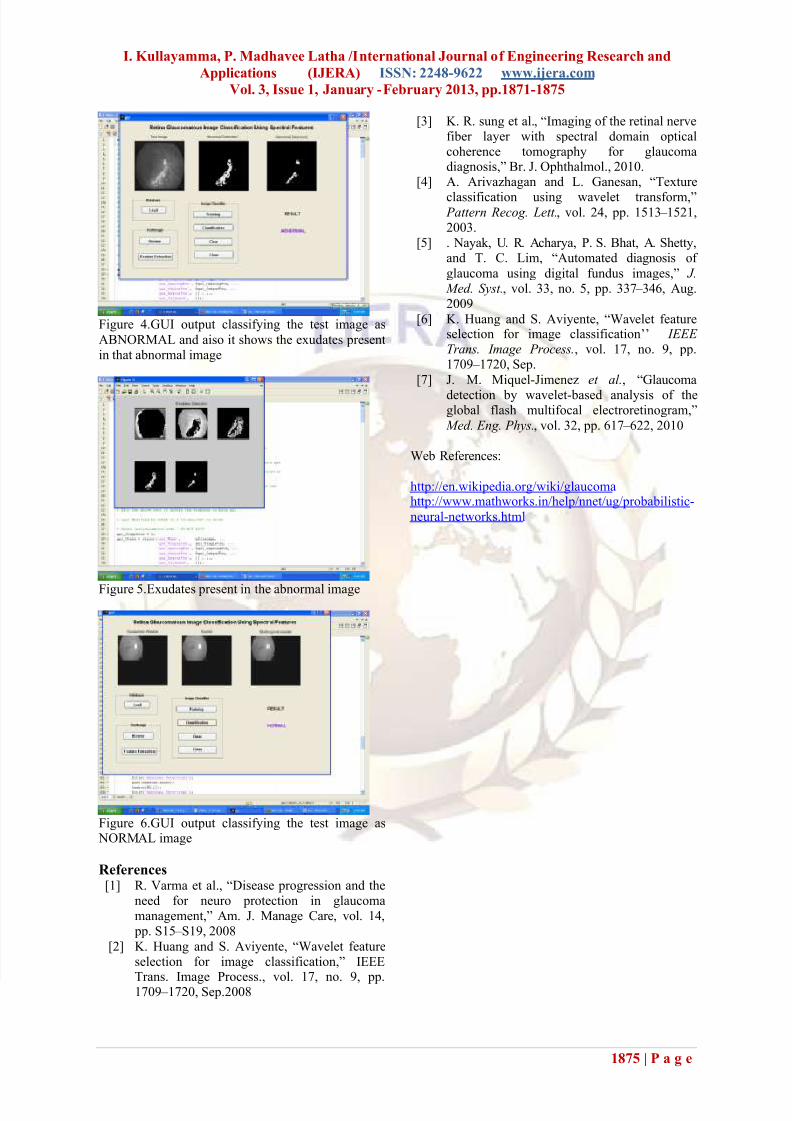
Figure 4.GUI output classifying the test image as
ABNORMAL and aiso it shows the exudates presentin that abnormal image
Figure 5.Exudates present in the abnormal image
Figure 6.GUI output classifying the test image as NORMAL image
References[1] R. Varma et al., “Disease progression and the
need for neuro protection in glaucomamanagement,” Am. J. Manage Care, vol. 14, pp. S15 – S19, 2008
[2] K. Huang and S. Aviyente, “Wavelet featureselection for image classification,” IEEE
Trans. Image Process., vol. 17, no. 9, pp.1709 – 1720, Sep.2008
[3] K. R. sung et al., “Imaging of the retinal nervefiber layer with spectral domain opticalcoherence tomography for glaucomadiagnosis,” Br. J. Ophthalmol., 2010.
[4] A. Arivazhagan and L. Ganesan, “Texture
classification using wavelet transform,” Pattern Recog. Lett., vol. 24, pp. 1513 – 1521,2003.
[5] . Nayak, U. R. Acharya, P. S. Bhat, A. Shetty,and T. C. Lim, “Automated diagnosis of
glaucoma using digital fundus images,” J. Med. Syst., vol. 33, no. 5, pp. 337 – 346, Aug.2009
[6] K. Huang and S. Aviyente, “Wavelet featureselection for image classification’’ IEEE Trans. Image Process., vol. 17, no. 9, pp.1709 – 1720, Sep.
[7] J. M. Miquel-Jimenez et al., “Glaucoma
detection by wavelet-based analysis of theglobal flash multifocal electroretinogram,”
Med. Eng. Phys., vol. 32, pp. 617 – 622, 2010
Web References:
http://en.wikipedia.org/wiki/glaucoma http://www.mathworks.in/help/nnet/ug/probabilistic-
neural-networks.html


![Le Châtelier’s principle. The significance of Kc values Kc = Products Reactants Kc = Products Reactants If Kc is small (0.001 or lower), [products] must](https://img.pdfslide.us/doc/110x75/56649cff5503460f949cff35/le-chateliers-principle-the-significance-of-kc-values-kc-products-reactants.jpg)