Embed Size (px)
Citation preview

Global Business StrategyMultinational Corporations Venturing into Emerging Markets
Springer Texts in Business and Economics
Kazuyuki Motohashi
Springer Texts in Business and Economics
Kazuyuki MotohashiKazuyuki Motohashi

Springer Texts in Business and Economics

More information about this series at http://www.springer.com/series/10099

Kazuyuki Motohashi
Global Business Strategy Multinational Corporations Venturing into Emerging Markets

Kazuyuki Motohashi Graduate School of EngineeringDepartment of Technology Management for Innovation The University of Tokyo Bunkyo-ku , Tokyo , Japan
ISSN 2192-4333 ISSN 2192-4341 (electronic) Springer Texts in Business and Economics ISBN 978-4-431-55467-7 ISBN 978-4-431-55468-4 (eBook) DOI 10.1007/978-4-431-55468-4
Library of Congress Control Number: 2015935567
Springer Tokyo Heidelberg New York Dordrecht London © The Editor(s) (if applicable) and The Author(s) 2015. The book is published with open access at SpringerLink.com. Open Access This book is distributed under the terms of the Creative Commons Attribution Noncommercial License, which permits any noncommercial use, distribution, and reproduction in any medium, provided the original author(s) and source are credited. All commercial rights are reserved by the Publisher, whether the whole or part of the material is concerned, specifi cally the rights of translation, reprinting, reuse of illustrations, recitation, broadcasting, reproduction on microfi lms or in any other physical way, and transmission or information storage and retrieval, electronic adaptation, computer software, or by similar or dissimilar methodology now known or hereafter developed. The use of general descriptive names, registered names, trademarks, service marks, etc. in this publication does not imply, even in the absence of a specifi c statement, that such names are exempt from the relevant protective laws and regulations and therefore free for general use. The publisher, the authors and the editors are safe to assume that the advice and information in this book are believed to be true and accurate at the date of publication. Neither the publisher nor the authors or the editors give a warranty, express or implied, with respect to the material contained herein or for any errors or omissions that may have been made.
Printed on acid-free paper
Springer Japan KK is part of Springer Science+Business Media (www.springer.com)

v
Pref ace
In the fi rst decade of this century, the global economic environment has seen tremendous changes. The most signifi cant is the rise of emerging countries. The share of global GDP accounted for by developed nations such as Japan, the United States, and European countries has dropped from almost 80 % in 2000 to about 60 % in 2010. I estimate that this share will fall to around 50 % by 2020 and to about 40 % by 2030. Meanwhile, emerging countries such as China, India, and Brazil are increasing their market presence. In terms of population, the picture of a global economy centering on developed nations, in which those countries that represent 10 % of the population generate 90 % of the wealth, is disappearing. It is becoming increasingly important for global companies to develop business strategies to adapt to this new era.
This book systematically summarizes the business strategies of global compa-nies that are addressing the rise of emerging countries. While in the past, textbooks on international management and global business theory were mainly based on developed countries, this book is characterized by a primary focus on strategies for emerging countries, where the business environment is quite different from that of developed nations. Among these emerging countries, China and India are discussed because they are believed to be the two chief economic powers of the twenty-fi rst century. The book contains case studies of companies operating in those countries to allow readers to obtain some understanding of how business fi elds differ from those in developed nations.
Also, instead of a narrow discussion of how overseas businesses differ from domestic businesses, the book’s content focuses on the concept of an overall business strategy for an enterprise that aims to become a true global company draw-ing on all of its management resources. For a number of Japanese companies, more than half their sales come from overseas markets, and their overseas subsidiaries hire signifi cantly more employees than their domestic ones. However, their gover-nance structure is still centered on the head offi ce in Japan and is generally far from an optimum global management organization that takes advantage of diversity in countries into which they have expanded. I believe that it is crucial for Japanese companies to improve their business organizations on a global scale, given the fact that the main business battlegrounds have moved from Japan to overseas, to emerg-ing countries in particular.

vi
I hope this book helps fi rms to make a signifi cant leap forward in becoming true global companies.
The contents of this book were originally prepared for the course “Global Business Strategy and Policy” in the Department of Technology Management for Innovation, Graduate School of Engineering, The University of Tokyo. Both theo-ries and case studies in the area of international management studies for graduate level education are contained here. The book can be used as a textbook for graduate- level management education, as in business schools, and for senior-level under-graduate students. The case studies it presents are on Japanese fi rms expanding into emerging counties such as China and India, but these stories can be applied to mul-tinational enterprises in general, including European and U.S. fi rms. At the same time, comparative analyses of multinationals across countries are also provided in the theory sections, enabling readers to understand specifi c factors associated with global strategies in a particular country, namely, Japan. Therefore, this book can be useful in courses that focus on Japanese (or other Asian) business studies.
Without the input, support, and contributions of many people, I could not have been able to complete this book. First of all, I would like to thank everyone at the companies taking part in the case studies. They have kindly accepted my visits to headquarters and local operation sites all over the world and have provided a diver-sity of useful information. In addition, I would like to acknowledge the new insights, inspiration, and advice of all students who have taken my classes. I am deeply indebted to many other individuals, including my colleagues at The University of Tokyo and friends at my former employer, METI (Ministry of Economy, Trade and Industry) of the Japanese Government, for their substantial intellectual input. All of them have contributed integral parts of the contents of this book.
This present volume is based on Global Keiei Senryaku , a Japanese-language publication by the University of Tokyo Press in 2013. This English edition contains expanded chapters and is written for students and researchers throughout Asia and the world. I would like to thank the University of Tokyo Press for allowing me to publish this English edition. I also thank my assistants, Ms. Miwa Abe and Ms. Mariko Niimura, for their support in formatting tables and fi gures.
Tokyo, Japan Kazuyuki Motohashi
Preface

vii
Contents
1 Introduction: Needs for New Global Strategies ................................... 1 1.1 Is the World Flat? ........................................................................... 1 1.2 Global Strategies for Emerging Countries ..................................... 4 1.3 Perspective of Global Business Strategies ..................................... 6 1.3.1 Directions of Global Strategies ........................................ 6 1.3.2 Products and Services for “Good-Enough”
Product Markets ............................................................... 7 1.3.3 Strengthening Cost Competitiveness ............................... 8 1.3.4 Creating Strong Business Models
That Discourage Catch Up ............................................... 11 1.3.5 Need for Strategies to Respond to Local Needs ............... 13 1.3.6 Management Strategies Integrated at the Global Level ... 14 1.4 Structure of This Book ................................................................... 15 References ................................................................................................. 17
Part I Global Business Strategy
2 Management Strategies for Global Businesses ..................................... 21 2.1 Introduction .................................................................................... 21 2.2 Concepts of Corporate Management Strategy Theory ................... 22 2.2.1 Scope of Management Strategy ....................................... 22 2.2.2 The Three Cs and SWOT Analysis
in Management Strategy .................................................. 23 2.2.3 Global Strategies and Differences in Internal
and External Business Environments ............................... 26 2.2.4 Is China a Market or a Factory? ....................................... 28 2.2.5 Value Chains and Global Strategy .................................... 33 2.3 Relationship Between Headquarters and Local Entities ................ 35 2.4 Summary ........................................................................................ 38 References ................................................................................................. 40
3 Changes in the Global Economic Environment ................................... 41 3.1 Introduction .................................................................................... 41 3.2 Long-Term Economic Growth by Country .................................... 42

viii
3.3 The Global Economic Forecast for 2030 ....................................... 46 3.4 Competitiveness Rankings: IMD’s World Competitiveness
Yearbook ......................................................................................... 49 3.5 Summary ........................................................................................ 54 References ................................................................................................. 55
4 Comparison of Economic Institutions in China and India ................. 57 4.1 Introduction .................................................................................... 57 4.2 Comparative Institutional Analysis of China and India ................. 59 4.2.1 Overview .......................................................................... 59 4.2.2 China: State-Led Strategic Foreign Investment Policies .. 64 4.2.3 India: The Steady Progress of a Democratic State ........... 65 4.2.4 Comparison of Political Systems ..................................... 66 4.2.5 Comparison of Economic Systems .................................. 68 4.3 Global Strategy Implications .......................................................... 71 4.3.1 Institutional Voids ............................................................. 71 4.3.2 Importance of Informal Institutions ................................. 74 References ................................................................................................. 76
5 New Business Model as Response to Competition from Emerging Economies ..................................................................... 77
5.1 Emergence of Threats Associated with Rise of Emerging Economies ................................................................. 77
5.2 Moving from a “Product-Centric” to a “Customer Value” Model ................................................................................. 79
5.3 Product Architecture and Technological Catch-Up ........................ 81 5.4 Business Models That Are Diffi cult to Be Imitated ....................... 85 5.5 Infrastructure Exporting as a Systems Integration Business .......... 87 5.6 Conclusion...................................................................................... 90 References ................................................................................................. 91
6 India’s Neemrana Industrial Park for Japanese Firms ....................... 93 6.1 Introduction .................................................................................... 93 6.2 Background of Neemrana Industrial Park ...................................... 94 6.3 DMIC: Delhi Mumbai Industrial Corridor ..................................... 96 6.4 India’s Industrial Infrastructure ...................................................... 98 6.5 Companies Operating at Neemrana Industrial Park ....................... 99 6.6 The Smart Factory Concept at Neemrana Industrial Park .............. 102 6.7 Signifi cance of This Case Study and Suggested Questions ........... 103
Part II Fundamentals of Strategic Planning
7 Alliance-Based Global Strategy ............................................................. 107 7.1 Introduction .................................................................................... 107 7.2 Wholly Owned Subsidiary or Joint Venture
with Local Companies.................................................................... 108
Contents

ix
7.3 Alliance Forms and Management Methods ................................... 110 7.4 Governments as Alliance Partners in PPP
Infrastructure Businesses ............................................................... 114 7.5 Conclusion...................................................................................... 118 References ................................................................................................. 119
8 Hitachi Construction Machinery: Becoming a Wholly Owned Chinese Entity ............................................................................ 121
8.1 Introduction .................................................................................... 121 8.2 Hitachi Construction Machinery (China) Co., Ltd......................... 122 8.2.1 Background ...................................................................... 122 8.2.2 Creation of a Joint Venture ............................................... 123 8.2.3 Dissolution of the Joint Venture and the Move
to a Wholly Owned Subsidiary ........................................ 125 8.2.4 Post-joint Venture Management ....................................... 127 8.2.5 China’s Business Environment and Its Risks ................... 128 8.3 Global and Chinese Construction Machinery Markets .................. 130 8.4 A Company with Balanced “Hardware,” “Software,”
and “Regions” ................................................................................ 133 8.5 Importance of This Case Study and Suggested Questions ............. 134 Reference .................................................................................................. 135
9 Marketing Theory in Global Business Context .................................... 137 9.1 Global Strategy and Marketing in Emerging Countries ................. 137 9.2 Steps in Marketing Strategy ........................................................... 138 9.3 Marketing, Planning, and Execution: The 4Ps ............................... 141 9.4 Market Analysis Examples: China and India ................................. 146 9.5 Is the Premium Market a Volume Zone? ........................................ 149 9.6 The Bottom of the Pyramid Business............................................. 151 9.7 Conclusion...................................................................................... 152 References ................................................................................................. 154
10 Shiseido Marketing in China ................................................................. 155 10.1 Introduction .................................................................................... 155 10.2 Corporate Timeline and Overview ................................................. 156 10.3 Shiseido’s Global Business ............................................................ 158 10.4 China’s Cosmetics Market and Shiseido’s China Expansion ........ 162 10.5 Marketing Strategy in China .......................................................... 165 10.6 Competition with Western Brands ................................................. 167 10.7 Signifi cance of This Case Study and Suggested Questions ........... 170
References ................................................................................................. 171
11 International R&D Management .......................................................... 173 11.1 Introduction .................................................................................... 173 11.2 Foreign R&D Activities of Japanese Companies........................... 174
Contents

x
11.3 R&D Internationalization Theory .................................................. 178 11.3.1 Merits and Demerits of Foreign R&D Centers ................ 178 11.3.2 Activities of Foreign R&D Centers .................................. 181 11.3.3 Selecting a Destination Country....................................... 183 11.4 Reverse Innovation ........................................................................ 184 11.5 Conclusion ..................................................................................... 186
References ................................................................................................. 188
12 Multinationals’ R&D in China and India ............................................. 191 12.1 Introduction .................................................................................... 191 12.2 China .............................................................................................. 192
12.2.1 Overview .......................................................................... 192 12.2.2 R&D Objectives and Regional Diversity ......................... 195 12.2.3 Differences Due to the Nationalities of Foreign Firm ...... 197 12.3 India ............................................................................................... 198
12.3.1 Overview .......................................................................... 198 12.3.2 Market-Driven R&D in Maruti Suzuki ............................ 201 12.3.3 Reverse Innovation at GE Healthcare .............................. 203 12.3.4 Organizational Management of Local R&D Centers ....... 204 12.4 Conclusion ..................................................................................... 207
References ................................................................................................. 208
13 Thailand’s National Science and Technology Development Agency and Japanese Firms ................................................................... 211
13.1 Introduction .................................................................................... 211 13.2 Thailand as a Business Destination ............................................... 212
13.3 Thailand’s Science and Technology Policy and a NSTSDA Overview .............................................................. 213
13.4 NSTDA and R&D Activities of Japanese Firms in Thailand ........ 215 13.4.1 Shiseido Thailand ............................................................. 215 13.4.2 Polyplastics Technical Solution Center ............................ 217 13.5 Thailand’s R&D Environment from the Perspective
of Foreign Firms ............................................................................ 218 13.6 Main Themes of This Case Study and Points for Consideration ... 220
References ................................................................................................. 221
14 Suzuki Motor’s Expansion in India ....................................................... 223 14.1 Introduction .................................................................................... 223 14.2 Suzuki Motors Corporation and Its Overseas Business ................. 224 14.3 Suzuki’s Business in India ............................................................. 227 14.4 Supply Chain Creation and Local Development Infrastructure ..... 232
14.5 India’s Automotive Industry: Huge Opportunities and Increasing Competition ........................................................... 234
14.5.1 Hyundai Motor India (HMI) Limited ............................... 237 14.5.2 Tata Motors ...................................................................... 238
Contents

xi
14.5.3 Mahindra & Mahindra...................................................... 239 14.5.4 Toyota Kirlroskar Motors ................................................. 239 14.5.5 Honda Siel ........................................................................ 239 14.6 Signifi cance of This Case Study and Suggested Questions ........... 241 References ................................................................................................. 241
15 Strategy Integration at the Global Level .............................................. 243 15.1 Main Points of This Text and Remaining Topics ........................... 243 15.2 Knowledge Management in Global Corporations ......................... 244 15.3 Diversity in Overseas Entities ........................................................ 246 15.4 Organizational Structure Within Global Corporations .................. 248 15.5 Conclusion ..................................................................................... 251 References ................................................................................................. 253
Index ................................................................................................................. 255
Contents


xiii
List of Figures
Fig. 1.1 GDP of Japan, the US, China, and India (USD in billions) ........... 4 Fig. 1.2 UN population estimates (in order of highest
population as of 2010) ................................................................... 5 Fig. 1.3 Global business strategy for developing nations ............................ 7 Fig. 1.4 Trends in exchange rates and overseas revenues ........................... 9 Fig. 1.5 Subsidiaries by country and year of establishment ........................ 10
Fig. 2.1 SWOT analysis .............................................................................. 24 Fig. 2.2 Is China a market or a factory? ...................................................... 29 Fig. 2.3 AAA framework ............................................................................ 31 Fig. 2.4 Porter’s value chain. The integration of procurement
and logistics, procurement, and logistics ....................................... 32 Fig. 2.5 Activities of overseas entities by corporate function ..................... 34 Fig. 2.6 I-R Grid .......................................................................................... 35 Fig. 2.7 Comparison of corporations in Japan, the US,
and Europe in I-R grid ................................................................... 36
Fig. 3.1 Per capita GDP in U.S. dollars (developed countries) ................... 42 Fig. 3.2 Per capita GDP in U.S. dollars (developing countries) ................. 43 Fig. 3.3 Changes in shares of GDP (in nominal U.S. dollars) .................... 46 Fig. 3.4 Changes in per capita GDP ............................................................ 48
Fig. 4.1 Per capita GDP of China and India ................................................ 60 Fig. 4.2 Inward foreign direct investment of China
and India (billions of dollars) .......................................................... 61 Fig. 4.3 Share of value added by type of ownership
among Chinese manufacturers ....................................................... 69
Fig. 5.1 Product architectures and business models .................................... 85
Fig. 6.1 Map of Neemrana Industrial Park and surrounding area ............... 94 Fig. 6.2 Map of DMIC and High-Speed Railway ....................................... 97
Fig. 7.1 Comparison of business transaction types ..................................... 111 Fig. 7.2 Structure of PPP (Public Private Partnership) ............................... 114 Fig. 7.3 Risk sharing between public and private entities ........................... 116

xiv
Fig. 8.1 Hydraulic excavator ....................................................................... 124 Fig. 8.2 Structure of HCMC and its subsidiaries ........................................ 129 Fig. 8.3 Global demand for hydraulic
excavators (units: in thousands) ..................................................... 131 Fig. 8.4 Chinese demand for hydraulic excavators
(units: in thousands) ....................................................................... 132
Fig. 9.1 4Ps of Marketing ............................................................................ 142 Fig. 9.2 Share of volume zone in China and India ...................................... 146 Fig. 9.3 Disposable income distribution in China and India (2011) ........... 148
Fig. 10.1 Structure of Shiseido group companies in China (as of 2012) ..................................................................... 164
Fig. 11.1 Number of foreign subsidiaries and R&D facilities by year of establishment ................................................................ 174
Fig. 11.2 Types of R&D internationalization ................................................ 176 Fig. 11.3 Typology of overseas R&D activities ............................................ 181 Fig. 11.4 Sales destination of products designed in emerging nations ......... 185
Fig. 12.1 Trend of R&D/Sales by ownership type ........................................ 193 Fig. 12.2 External R&D expenditures/total R&D by ownership type .......... 194 Fig. 12.3 External R&D expenditures/total R&D by home country ............. 197 Fig. 12.4 Attractiveness of FDI destination by host country ........................ 199 Fig. 12.5 Evolutionary model of overseas R&D activities ............................ 205
Fig. 13.1 R&D/GDP by country (%) ............................................................ 219
Fig. 14.1 Locations of major car manufacturer in India ............................... 238 Fig. 14.2 Price range of car by model in India (As of 2010) ........................ 240
Fig. 15.1 Comparison of organization of global corporations ...................... 250
List of Figures

xv
List of Tables
Table 2.1 CAGE analysis: favorable conditions of China and India for US fi rms ............................................................... 27
Table 3.1 IMD World Competitiveness Yearbook indices ......................... 51 Table 3.2 Rankings of Japan, the U.S., and China (2013) ........................ 52
Table 4.1 Major politics and economics events in China and India ......... 62
Table 5.1 Comparison of product-centric and service-centric models ..... 80
Table 8.1 Global construction machinery manufacturers’ revenue (fi scal year 2011) ......................................................... 122
Table 8.2 Hitachi Construction Machinery’s revenue by region .............. 122 Table 8.3 Development of Hitachi Construction Machinery (China) ....... 125
Table 9.1 Product and market matrix ........................................................ 139 Table 9.2 Example of market segmentation .............................................. 140 Table 9.3 Matrix analysis of customer needs and technology
competitiveness ......................................................................... 149
Table 10.1 Development of Shiseido Company Ltd. .................................. 157 Table 10.2 Shiseido’s revenue by division and region
(units: in JPY 100 million) ........................................................ 159 Table 10.3 Shiseido’s operating margin by division and region ................. 159 Table 10.4 Shiseido’s major businesses and subsidiaries ........................... 159 Table 10.5 Development of Shiseido in China ........................................... 163 Table 10.6 Shiseido’s brand in China by channel
type (as of 2012) ....................................................................... 165 Table 10.7 Prices of main products by Shiseido
in China (as of 2009, in RMB) .................................................. 166 Table 10.8 Profi tability of global cosmetics manufacturers
(units: USD million) ................................................................. 168 Table 10.9 Shares of global cosmetic manufacturers
in global market (%) ................................................................. 169 Table 10.10 Shares of global cosmetic manufacturers
in Chinese market (%) .............................................................. 169

xvi
Table 11.1 Overseas R&D facilities by region and industry ...................... 176
Table 12.1 Comparison of R&D-related indices ........................................ 195 Table 12.2 Number of patent applications by fi rms (USPTO patents) ....... 200
Table 13.1 R&D share by sector (%) .......................................................... 219
Table 14.1 Suzuki overseas investments ..................................................... 225 Table 14.2 Financial performance of Suzuki Motors ................................. 226 Table 14.3 Number of passenger vehicle sales by region
(units: in thousands) .................................................................. 227 Table 14.4 Financial performance of Maruti Suzuki .................................. 230 Table 14.5 Development of Maruti Suzuki ................................................. 231 Table 14.6 Number of production and sales by Maruti Suzuki .................. 232 Table 14.7 Market size of automotives by country
(units: 10,000s of vehicles) ....................................................... 235 Table 14.8 Sales volume by car segment in India ....................................... 236 Table 14.9 Sales volume by manufacturer in India ..................................... 237
Table 15.1 Comparison of overseas subsidiary by type .............................. 247
List of Tables

xvii
About the Author
Kazuyuki Motohashi is a professor in the Resilience Engineering Research Center and the Department of Technology Management for Innovation, Graduate School of Engineering, The University of Tokyo. Until this year, he had held various positions at the Ministry of Economy, Trade and Industry (METI) of the Japanese Government, and served as an economist at the Organisation for Economic Co-operation and Development (OECD) and an associate professor at Hitotsubashi University. His research interests cover a broad range of issues in economic and statistical analy-
sis of innovation, including economic impacts of information technology, interna-tional comparison of productivity, global infrastructure business strategy, and national innovation systems focusing on science and industry linkages and small and medium-sized enterprise (SME) innovation and entrepreneurship policy. Dr. Motohashi earned a Master of Engineering degree from The University of Tokyo, an MBA from Cornell University, and a Ph.D. in business and commerce from Keio University. For further details, please see: http://www.mo.t.u-tokyo.ac.jp/

1© The Author(s) 2015K. Motohashi, Global Business Strategy, Springer Texts in Business and Economics, DOI 10.1007/978-4-431-55468-4_1
1 Introduction: Needs for New Global Strategies
1.1 Is the World Flat?
Electronics City, an agglomeration of IT companies, lies approximately 40 min away by road from Bangalore, India. Stepping into the Infosys headquarters located here reveals a world completely different from the rest of India, with its roadside vendors, auto rickshaws, and overwhelming disorderliness. From its expansive campus with its well-manicured lawns, rows of modern buildings, cafeterias, put-ting greens, and gyms, Infosys provides IT services to the world’s largest corpora-tions. Among the striking buildings in the campus, a pyramid-shaped studio located at the center of the campus draws much attention. The studio contains advanced broadcasting equipment and supports a local TV station. This studio enables world-wide connectivity by way of a high-speed satellite link, and the studio’s interiors compel one to question their whereabouts. In such a setup, one may feel the world to be fl at. Thomas Friedman, a US journalist and author of “The World Is Flat” (Friedman 2005 ), states that economic activities have enabled the disappearance of national borders in today’s world, through ongoing liberalization of international trade and investment brought about by information revolution and organizations such as the WTO. The book mentions Infosys from the outset, stating that the author arrived at the concept of a “fl at world” through an interview with the company’s former CEO, Nandan Nilekani.
Infosys is said to be one of the top three IT service companies in India, along with Tata Consultancy Services (TCS) and Wipro. Infosys handles offshore IT development of the world’s top fi nancial and manufacturing companies and has recently expanded its operations into higher value-added services, such as packaged software development and consulting, through which it is beginning to threaten the business of the world’s largest IT service companies such as IBM and Accenture. I have visited the Infosys’ Bangalore campus in March 2010, when revenues were still low because of the effects of the fi nancial crisis triggered by the Lehman shock in September 2008. While the impact of the crisis was great, because more than

2
80 % of Infosys’ revenues come from western companies, a high percentage of which comes from the fi nancial sector, there was no indication of trouble at Infosys as was among Japanese companies during that period. Though one must discount the self-assured temperament unique to Indians, a review of the 2011 income state-ment shows that Infosys recorded historically high revenues and profi ts and that the average pace of revenue and profi t growth in the 5-year period beginning in 2007 has remained constant at 20 %.
The Infosys campus in Bangalore is connected via the Internet to all parts of the world 24 h a day, and one can experience a “fl attened world” there, with no discern-ible way of knowing whether one is in India or some other part of the world. However, upon exiting the campus gates, one is immediately pulled back into reality that one is in India. The Infosys campus is visible only as a point on the Google Map, and while this type of “fl attened world” may be found scattered throughout Bangalore, these are mere points, and the rest of India is a completely different world which is far from the world described in Thomas Freedman’s book.
Immediately before visiting Infosys in Bangalore, the author had the opportunity to visit several corporations at the Neemrana Industrial Park located near Delhi. The park is a 2-h drive away from Delhi, and is home to production operations of various Japanese automotive companies such as Nissin Brake and Mitsui Prime Chemicals. The park has a management committee that comprises companies located there to compile issues arising within the park. The Japan External Trade Organization (JETRO) represents these companies in dealings with Indian government entities. The details on this arrangement can be found in case studies contained in this vol-ume. The author concluded that the companies in the park face several issues that are unimaginable in Japan, such as that of water shortages. The Neemrana Industrial Park is located in the desert state of Rajasthan, where rainwater is scarce. Therefore, the government has imposed water harvesting regulations that prohibit the con-sumption of groundwater in excess of annual rainfall. The companies here comply with these regulations by increasing their land area in relation to the size of their buildings and reusing wastewater within the park. In addition, the Indian tax system is very complicated, requiring companies to hire local consultants or else run the risk of dealing with local tax authorities. Furthermore, responses to active labor unions are required, and daily electrical outages force companies to install power generation equipment on site. These are some of the many issues faced by compa-nies at Neemrana and across India.
Similar to Infosys, some companies are connected to the world via the Internet with information moving freely without regard to international borders, thereby enabling business transactions on a global level in a fl attened world environment. Conversely, companies operating in India face local issues that are unthinkable in Japan, such as of those at the Neemrana Industrial Park. Depending on the industry, type of business, country, or region, the world may indeed be fl at and exist as if there were no national borders. However, a world with national borders creates high bar-riers. In reality, these two worlds co-exist, making it necessary for companies to
1 Introduction: Needs for New Global Strategies

3
analyze the type and signifi cance of the barriers that exist in the countries and regions they enter, and consider strategies appropriate to the circumstances.
In addition, when devising mid- and long-term strategies, it is important to envi-sion the gradual change of future “barriers” over time. The world is witnessing a gradual decrease in barriers over time; in other words, the world is undoubtedly becoming fl atter. For example, India has relaxed its foreign investment regulations, allowing for stimulating foreign fi rm activity within the country. The Neemrana Industrial Park was created through Japanese-Indian government agreements to promote the local expansion of Japanese parts suppliers of large-scale automobiles and motorbike manufacturers such as Honda and Suzuki, which have production facilities located near Delhi. Through JETRO’s representation of the companies in the park with the Indian government, problems that would have been otherwise dif-fi cult for smaller companies to solve individually, have a higher probability of reso-lution. By having a public organization act as an intermediary, investment barriers in India are lowered, thereby producing a relatively fl atter world. In August 2011, the Japan–India Comprehensive Economic Partnership Agreement became effec-tive. On the basis of this agreement, it is expected that the operating environment for Japanese companies in India will witness continuous improvement.
The WTO was established in 1995 after replacing the General Agreement on Tariffs and Trade (GATT). Up until that time, trade liberalization efforts such as tariff agreements were conducted through GATT. The areas under negotiation have since broadened, with continued negotiations on creating a level playing fi eld across a range of areas such as government procurement and intellectual property that can become barriers to overseas investment. In addition, free trade agreements and eco-nomic partnership agreements, which create deeper economic partnerships on a regional level between countries, are becoming active. Compared with the North American Free Trade Agreement (NAFTA) and the European Union (EU), efforts on regional partnerships had a slow start in Japan; however, with the 2002 economic partnership agreement with Singapore, Japan has gone on to sign agreements with many Asian countries and the Association of Southeast Asian Nations (ASEAN) countries. The aforementioned economic partnership agreement with India devel-oped from these various negotiations, and the trend toward realizing a fl atter world is likely to continue.
In “The World Is Flat,” Friedman notes that the globalization typifi ed by Infosys is the third historical wave brought about by the IT revolution (Friedman 2005 ), fol-lowing the fi rst wave of Columbus discovering new continents and the second wave of improved distribution effi ciencies brought about by steam ships and the industrial revolution. The innovations of improved computer performance and information and communication technology via the Internet drastically changed our society and global economy and undoubtedly impacted the fl attening of the world. While the barriers of national borders are being lowered by technology through reduced ship-ping and information transmission costs, the WTO and regional economic partner-ships show that the world is also fl attening by way of economic systems.
1.1 Is the World Flat?

4
0
2000
4000
6000
8000
10000
12000
14000
16000
1980
1982
1984
1986
1988
1990
1992
1994
1996
1998
2000
2002
2004
2006
2008
2010
China Japan US India
Fig. 1.1 GDP of Japan, the US, China, and India (USD in billions)
1.2 Global Strategies for Emerging Countries
Japan has a per capita GDP of more than $50,000, and a population of over 100 million. It is a superior market from the global perspective, but it lacks prospects for exponential future economic expansion. On the other hand, developing market economies such as China and India are experiencing rapid growth. In 2010, China’s nominal GDP was approximately CNY 40 trillion, compared with Japan’s JPY 480 trillion. Considering the March 2012 exchange rate of CNY/JPY 13, China’s GDP was greater than Japan’s at approximately JPY 520 trillion, replacing Japan as the second largest economic superpower in the world. Since the bursting of Japan’s bubble economy in 1991, Japan has experienced stagnation on a nominal basis, while the Chinese economy has experienced a phenomenal growth of approximately 2.7 times in real terms in 2000–2010 (an annual growth rate of 10.4 %) and approxi-mately 4.9 times on a nominal basis (an annual growth rate of 17.3 %) (Fig. 1.1 ). As of 2010, the Indian economy was positioned at approximately one-third the size of Japan’s, and is experiencing profound economic growth as well. During the 2000–2010 period, the Indian economy averaged at a 7.4 % economic growth in real terms
1 Introduction: Needs for New Global Strategies
5
(13.3 % on a nominal basis), which, while not as spectacular as that of China, is still consistently strong.
A country’s GDP can be subdivided into per capita GDP by dividing the GDP value with the total population. Compared with developed countries such as Japan and the US, China, India, and other developing countries present a higher rate of economic growth because of the improvements in the standard of living and the increase in the per capita GDP exceeding that of the population. This trend is fore-casted to continue, and population forecasts for developing nations are optimistic on the whole. Figure 1.2 lists the top 10 countries by population; the US and Japan are the only developed nations that feature on that list. While the US population is esti-mated to increase in the future, population of Japan is estimated to shrink to the 12th most populous country in the world by 2030. Conversely, while China’s one-child policy has resulted in lowering the population growth, India, Indonesia, and other highly populated countries are expected to grow in the future.
Although Japanese markets have reached maturity, developing countries are expected to grow, thereby making their markets attractive. In addition, the world is fl attening, and many Japanese companies are taking on the challenges of running global businesses. However, in reality, national borders are still proving to be high barriers, and many companies struggle with operating environments different from those found in Japan. Creating global strategies and a path on the international stage is unavoidable if Japanese companies are to grow in the future, and this growth is possible in developing countries such as China, India, Indonesia, and Brazil rather than developed regions of Europe or the US. With signifi cant differences in
0 500 000 1 000 000 1 500 000 2 000 000
China
India
USA
Indonesia
Brazil
Pakistan
Nigeria
Bangladesh
Russia
Japan
2010
2015
2020
2025
2030
Fig. 1.2 UN population estimates (in order of highest population as of 2010)
1.2 Global Strategies for Emerging Countries

6
taxation, regulations, and other aspects of business environments from developed countries, the barriers of national borders in developing countries are higher. Accordingly, overcoming these barriers and seizing business opportunities requires the creation of solid global strategies and innovative business solutions rather than expanding overseas as a simple extension of domestic business models.
1.3 Perspective of Global Business Strategies
1.3.1 Directions of Global Strategies
How should Japanese companies shape their global business strategies, considering the growing importance of developing nations in the global economy? The economic growth of developing countries such as China and India signifi es attractive new mar-kets for Japanese corporations. It is critical to the growth of Japanese companies that they expand into these markets. However, the economic growth of developing coun-tries is the result of their efforts to catch up with developed ones economically. During that process, companies in developing countries will eventually acquire technological capabilities and become major threats to Japanese corporations. These local compa-nies can set competitive prices by providing products and services at low cost by tak-ing advantage of factors such as low local wages. In response to such actions, Japanese corporations must provide greater value to customers to compensate for the price dif-ference in the products and services offered. Competition with these local companies is on a local as well as international level, including Japanese markets. For example, Suntech and JA Power are two Chinese companies with top market share in the pro-duction of solar panel. Chinese companies began producing solar panels by imple-menting full turnkey systems that integrated the solar panel production process from raw materials to the fi nished product, enabling the production of general-purpose crystalline solar cells with a certain amount of effi ciency in electricity generation. The competitive advantage held by manufacturers in developed countries, such as Sharp (Japan) and Q Cells (Germany), was quickly lost because manufacturing technology originally held by panel manufacturers was incorporated into manufacturing equip-ment. Technologically, Chinese electronics companies and other high-tech industries have quickly caught up and are threatening developed countries’ companies, includ-ing Japan, that have traditionally differentiated themselves on the basis of their tech-nological prowess. Therefore, while the growth of developing countries presents an “opportunity” for Japanese companies through growing markets, it concurrently poses “threats” through the emergence of competitive local companies.
However, the “threats” by companies electing to forgo global markets and focus exclusively on the domestic market cannot be avoided. Therefore, as Japanese com-panies aggressively incorporate new “opportunities” into their business models, it is critical that they consider strategies to minimize the damages caused by these “threats.” Three important directions of global strategies are as follows: (1) respond to “good-enough” product markets, (2) strengthen cost competitiveness, and (3) create strong business models in which it is diffi cult to catch up (Fig. 1.3 ).
1 Introduction: Needs for New Global Strategies

7
1.3.2 Products and Services for “Good-Enough” Product Markets
China is an economic giant that has overtaken Japan to become the world’s second largest economy. However, China’s population is ten times that of Japan, and the per capita GDP is approximately USD 5,000 or one-tenth that of Japan. On average, the standard of living in China is still low, requiring products appropriate for these cir-cumstances. China has large income disparities, and many households are said to have income greater than the average Japanese household. However, this so-called wealthy class comprises a small part of China’s overall population of 1.3 billion. On the other hand, it is not realistic for Japanese companies to compete with local com-panies for providing products to lower-than-average income classes, given the over-whelming cost competitiveness of local companies. Accordingly, it is more effective for Japanese companies to provide products and services to middle- and
Growth in China, India, and other
Developing Nations
Expansion of
new markets
(opportunities)
Emergence of
new competitors
(threats)
Respond to “good-enough”product
markets
Strengthen cost competitiveness
Create business models that make it
difficult to catch up
Country-
Specific
Strategies
Global
Integration
Strategies
Fig. 1.3 Global business strategy for developing nations
1.3 Perspective of Global Business Strategies

8
upper-income classes that have strong purchasing power, despite their relatively low income levels compared with the wealthy class. These middle- and upper-income classes are called a “volume zone” and are witnessing rapid expansion in develop-ing countries such as China and India. For example, in China, high-ticket consumer electronics such as televisions and refrigerators are premium products for the aver-age Chinese; these products were traditionally purchased only by the wealthy. However, China’s recent economic growth resulted in growth among the middle class, thereby making these products a common item in most urban homes. These products are sold by local companies such as Haier and Hisense; however, Japanese consumer electronics manufacturers hold high repute for their brands in China. Therefore, if products can be offered at prices that are affordable to the middle class, they are likely to become popular sellers. In addition, products with a certain level of quality and high cost performance attract the wealthy. The market for “good- enough” products by foreign companies in China’s consumer electronics market is growing rapidly (Gadiesh et al. 2007 ).
An important rule in a “good-enough” product market is product development that has just the level of quality demanded by customers. High-quality products will be priced commensurately high, which may be problematic for products that target the volume zone. On the other hand, it is necessary to differentiate premium-priced products from products marketed by local companies. In the “Innovator’s Dilemma,” Christensen states that when the speed of a product’s technological progress exceeds the level of technology demanded by customers, low-priced products with lower functionality and quality (i.e., destructive innovation) enter the market, creating market completion for products that are based on their high level of technology (Christensen 2001 ). When developing products for developing countries, there is a high likelihood that customer demand for product functionality and quality will be lower than that in Japan. Therefore, it is important for companies to determine the product level that target customers will accept, and develop products at that “good- enough” level.
1.3.3 Strengthening Cost Competitiveness
When providing products for “good-enough” markets, it is important to strengthen the cost competitiveness of the overall company. In light of the rise of companies from developing countries such as China, strengthening cost competitiveness is necessary not only for competing in local markets but also for global competition in Japan and elsewhere.
On this point, Japanese companies have been continually working on local pro-duction in low-cost regions such as Southeast Asia and China. Overseas production began in earnest among Japanese companies in the mid-1980s, originally as a coun-termeasure to rising domestic production costs resulting from a stronger yen. Figure 1.4 shows the relationship between various globalization measures such as exchange rate fl uctuations, Japanese export volumes, and overseas revenues. The rise in the yen following the 1985 Plaza Accord resulted in an expansion in overseas
1 Introduction: Needs for New Global Strategies

9
production. The yen continued to strengthen slowly thereafter, and overseas produc-tion resumed rapidly after 2000. In 2000, overseas revenues among manufacturers were greater than export revenues, and while revenues dropped somewhat after the 2008 global fi nancial crisis, they have recently trended upward again.
Figure 1.5 shows the number of subsidiaries, both domestic and foreign, of Japanese companies by year of establishment and country as of 2011. The graph indicates that the movement overseas to developing countries began with invest-ment in New Industrial Economies (NIES) and ASEAN countries. Backed by the strong yen, Japanese electronics manufacturers and automakers began to aggres-sively enter these regions during the latter half of the 1980s. Investment in China began to grow rapidly thereafter during the 1990s, after China implemented liberal-ization policies to the outside world and began to aggressively seek foreign invest-ment. During the latter half of the 1990s, the number of overseas subsidiaries drastically reduced, with many companies suspending new overseas investment due to domestic issues resulting from the 1997 economic recession brought about by failures of large economic institutions. In the 2000s, investment in NIES and ASEAN countries remained fl at while investment in China again picked up dramati-cally. This was perhaps brought about by China’s entry into the WTO in December 2001 and improvements in China’s business environment.
The entry into the overseas market, primarily of production facilities, focused on China as a means to strengthen cost competitiveness. However, wages along China’s coastal regions, which have agglomerations of foreign fi rms, continue to rise, and
Fig. 1.4 Trends in exchange rates and overseas revenues ( Sources : Compiled from “Kaigai Jigyou Katsudou Kihon Chousa” (METI), “Boueki Toukei” (Ministry of Finance))
1.3 Perspective of Global Business Strategies

10
more companies are increasingly considering moving to the interior regions of China or to lower-cost countries such as Vietnam. However, when moving produc-tion facilities, companies cannot ignore logistical issues such as procurement of raw material and transportation costs, as well as costs associated with investments in production infrastructure and employee training. In addition, companies must con-sider a host of other factors when selecting new production bases, such as procuring land and dealing with different environmental regulations, tax laws, and investment incentives that are specifi c to each country.
Japanese companies are in the process of expanding production overseas for many years, although strengthening cost competitiveness of a company as a whole requires the consideration of overseas resources in areas of research and develop-ment (R&D). The results of an international comparison of R&D within foreign fi rms in China show that Japanese companies lag behind their European and US counterparts (Motohashi 2011 ). In terms of management of overseas R&D centers, Japanese headquarters exert strong control and do not facilitate open innovation between local subsidiaries, local corporations, and universities (Motohashi 2012 ). Till now, Japanese companies have been cost competitive by transferring production overseas; however, they must also consider the optimal global placement of overall operations, including R&D. Furthermore, creating partnerships with local fi rms can be used as a means to strengthen cost competitiveness to drive global business.
Fig. 1.5 Subsidiaries by country and year of establishment ( Source : Compiled from “Kaigai Shinshutsu Kigyou Database 2011” (Toyo Keizai Shinhousha 2011 ))
1 Introduction: Needs for New Global Strategies

11
However, joint ventures and strategic alliances increase the possibility of nurturing potential competitors; therefore, costs and benefi ts should be closely considered when selecting partners and forming alliances.
1.3.4 Creating Strong Business Models That Discourage Catch Up
We have discussed market efforts in developing countries and the use of manage-ment resources such as personnel within developing countries. However, as prep-aration for the eventual rise of local companies in developing countries, Japanese companies must create strong business structures that make it diffi cult for local companies to catch up. First, in terms of technology, every method possible should be exploited to increase the exclusivity of a company’s proprietary tech-nology. Policies that enable this exclusivity are as follows: (1) protection by intellectual property rights, (2) protection by know-how (trade secrets), (3) pro-tection by product design complexity, and (4) improvement in the speed of prod-uct development. None of these measures fully protect a company’s proprietary technology; therefore, inevitably, companies in developing countries will catch up in terms of technology. Therefore, while “product development speed” is crit-ical, generally, open innovation via outsourcing some aspects of development or external partnerships must be used to increase the speed of development. When doing so, companies must provide an overall balance because exclusivity of com-pany’s proprietary technology via know-how or design complexity decreases along with outsourcing or partnerships.
The manner in which companies create technology management policies differ in each industry and according to company size. For example, differences in the ability to maintain exclusivity of proprietary technology vary by industry and have been researched in Japanese National Innovation Survey by the Ministry of Education, Culture, Sports, Science and Technology. In this study, “protection by intellectual property rights” was effective for pharmaceutical companies, whereas “product complexity” and “development speed” were important for electronics fi rms (National Institute of Science and Technology Policy 2004 ). In addition, small- and medium-sized businesses fi nd it diffi cult to exercise rights even when they have intellectual property rights for their technology. For example, when a company becomes aware of its patents being violated in China, it becomes diffi cult for small companies to negotiate with IP violating company, litigate in court as necessary, and then win in court with the implementation of a cease-and-desist order or the payment of licensing fees. In these cases, it is more rational to focus on know-how or other methods rather than intellectual property rights.
In addition, protecting technology is not the only requirement to delay catch up by companies in developing countries. International innovation competition involves multiple players and is not conducted on a one-on-one basis with fi rms in develop-ing countries. International mergers and acquisitions (M&As) are more active; for example, Sanyo Electric sold its consumer electronics division to Haier in July
1.3 Perspective of Global Business Strategies

12
2011, one of China’s largest consumer electronics manufacturers. Sanyo Electric became a wholly owned subsidiary of Panasonic in 2010. The selling decision was made by Panasonic as it already owned a consumer electronics division and was merely rationalizing the overlap of management resources. However, from the per-spective of Panasonic and other Japanese consumer electronics manufacturers, undeniably, Haier was able to take a great technological leap through this acquisi-tion. Consequently, even after a company’s efforts to fervently protect its technol-ogy, leaking of proprietary technology and catching up may happen in various ways. Furthermore, changes in industry structure may result in an inability to differentiate technology. The solar panel case mentioned previously is one such example. Production technology for solar panels was integrated into production equipment as a full turnkey system. Therefore, Sharp, Q Cells, and other manufacturers were unable to differentiate themselves from companies in developing countries through production technology. As a result, Chinese manufacturers such as Suntech and JA Power installed large-scale production equipment and created their own general purpose solar panel market by manufacturing inexpensive products. Of course, in terms of the development of highly effi cient solar batteries, companies in Japan, Europe, and the US have superior technology, but mega solar systems (i.e., systems for electric utilities that generate electric power in the megawatts) that are the main-stay of the overall market require many panels across a broad area, making cost more important than effi ciency.
Such product commoditization can be observed in fl at panel televisions and digi-tal consumer electronics, where completely different business model is required to avoid this situation. To date, Japanese companies have pursued international busi-nesses under a “product” model, in which they develop high-performance products and export them to the rest of world. However, there are some products where this product model is no more effective. In particular, electronic products have a high rate of technological innovation, and generally, latest products often have a higher level of technology than what is demanded by customers (Christensen’s Innovator’s Dilemma). This makes it easy for local companies to produce destructive innova-tion, driving Japanese companies out of markets.
Accordingly, a revision of strategies is required in terms of the product model grounded in the idea that “good products sell” to the “customer value” model, in which the proposition of the products’ value is made to the customer. A product’s value is only realized after its use by the consumer and as such, maximizing its value for money becomes essential. A product’s value is gauged after it has been used by customers; therefore, maximization of customer value becomes essential. In the example on solar panels, the largest customers were mega solar operators. The goal of product development in maximizing customer value was not to increase electricity generation effi ciency, but rather to increase product durability and sim-plify maintenance. Thus, the customer value model requires companies to under-stand their product’s value from the customer perspective. In addition, the sale of a product should not signal the end of a relationship; instead, companies must maxi-mize the value of product services through the entire lifecycle of the product. Thus, the “customer value model” is called a “service model.” In a commoditized
1 Introduction: Needs for New Global Strategies

13
business, in which it is diffi cult to have a product model with an ongoing business, a breakthrough may be possible by differentiating itself with a “service model” that goes back to the basics of customer value.
Furthermore, companies can increase competitiveness by providing multifaceted services for sets of products rather than single products. Returning again to the solar panel example, these panels cost approximately half the total cost of a mega solar system. This is because they require mounts, foundation work, and power control systems. Moreover, critical technology is required to convert the direct current gen-erated by solar panels to alternating current and control unstable electricity to pro-duce stable voltage and frequency. By designing an overall system that could stabilize the current for an extended period beyond the mere panels, companies are able to avoid the commoditization of a single product model. Compared with single products that are easy to copy, such complex services have the benefi t of being dif-fi cult to replicate because they are large, multifaceted systems comprising multiple products. In pursuing a “customer value model,” companies make it diffi cult for competitors to catch up with these large, complex systems.
1.3.5 Need for Strategies to Respond to Local Needs
When creating a global strategy in a fl attened world, it is important to acknowledge that local markets, particularly in developing countries, will have barriers of differ-ent heights and types. Global strategies indicate pathways to overcome barriers and realize new business opportunities. Methods to overcome such barriers and exploit the differences in the business environments depends on the type of differences between Japanese and local markets. When proposing the Culture, Administration, Geography, and Economics (CAGE) format, Ghemawat states the necessity of ana-lyzing the differences between countries (Ghemawat uses the term “distance”) (Ghemawat 2007 ). CAGE represents culture, administration, geography, and eco-nomics, all of which are country specifi c. Physical distance, as represented by geog-raphy, has shrunk with the IT revolution and advancements in transportation technology; however, languages and lifestyle related differences (“Culture”) and various economic regulations, tax systems, and regulations on foreign investment (“Administration”) still exist as major differences among countries. Therefore, vast economic differences (“Economics”) exist in per capita GDP and wages.
Global businesses with operations expanding into new markets are akin to invest-ments in new ventures. In such cases, differences between the home and destination countries are considered as risk factors when making investment decisions. It is possible to estimate physical distance (“G”) and economic gaps (“E”) with a certain degree of accuracy. In addition, although it is diffi cult to quantitatively assess cul-tural differences (“C”), it is possible to estimate them to a certain degree using past case studies, including those from other companies. Thus, the administrative aspect (“A”) remains the one area of barriers and differences in global business environ-ment for which risk must be seriously evaluated. For example, in October 2006, companies in Shanghai’s Jiading District in China were demanded to leave the area
1.3 Perspective of Global Business Strategies

14
without prior notice. The district was designated as a new urban development area headed by the state. Many Japanese companies that became involved in this issue caused the government to also become involved. As of October 2012, this situation remains unresolved. In China, it is possible for the state decision to override a lease agreement for an industrial park, and there have been instances of companies forced to transfer and incur high losses. This example may be extreme, but there have been reports of such incidents in China on a daily basis. The system of contract law, which is the basis for business in developed countries, is imperfect in China; this imperfection is treated as an issue of particularly high risk because of the signifi cant impact on businesses caused by unforeseen changes.
Within developing countries, institutional barriers in business environments arise from domestic circumstances, whether in China, India, or elsewhere. These barriers differ according to the target country. Thus, conducting business operations in China requires an understanding of the institutional imperfections and differences that exist there; the same applies for India and Indian domestic circumstances. Strategies must be created in response to the needs and circumstances of each country.
1.3.6 Management Strategies Integrated at the Global Level
Finally, the issue relating to the integration of strategies created for individual coun-tries into a corporation as a whole must be solved. It is important that strategies for developing countries such as China and India, which have signifi cantly different economic environments than developing countries, be specifi c to the circumstances prevalent in those countries. However, the fi nal objective of management strategies in global businesses should be the optimal use of management resources distributed throughout the world and its integration for the benefi t of the company’s overall performance. The level of control exerted by headquarters on local entities, or alter-natively, the level of delegation to local entities for management decisions, is an issue of concern. Japanese multinational corporations, as compared with those in Europe or the US, are said to be headquarter oriented, with strong management systems exerting stringent controls over local entities (Bartlett and Ghoshal 1989 ). Until now, Japanese multinationals had focused on expanding production centers overseas. These production centers were managed by transferring production tech-nology from the headquarters to the subsidiaries, resulting in the production of goods that mimicked the parent factory. Therefore, in many instances, the facilities were operated under the tight control of the headquarters. In addition, the product- focused model of “make good products and they will sell” deprioritizes the research of local consumer needs. Accordingly, sales offi ces were focused on selling existing products rather than gathering information on local consumer needs.
However, capturing the growing “good-enough” product markets in developing countries requires more local R&D. Using ideas unique to the region to target cus-tomers and moving forward with local R&D that is refl ective of local needs cannot be accomplished by way of traditional, one-way decision making, in which deci-sions fl ow from the headquarters to local entities. Many large manufacturing
1 Introduction: Needs for New Global Strategies

15
companies in Japan generate higher revenues overseas. Moreover, an increasingly high percentage of their revenues come from developing countries. However, in such an environment, companies must not treat headquarters and local entities as separate entities, but rather consider corporate-wide strategies on a global basis. Doing so will enable companies to select countries and regions of future expansion and start the process of company-wide integration of strategies based on local area conditions.
1.4 Structure of This Book
This book is a summary of theoretical ideas and case studies for corporations in developed countries, including Japan, for designing strategies to maximize opportu-nities and minimize threats in business expansion into demerging countries. The case studies featured here focus on Asia, including China and India, and use exam-ples of Japanese manufacturers. The examples from China and India are used because of their geographical proximity to Japan and the importance of these two countries in the twenty fi rst century as economic powerhouses in the world econ-omy. However, the theories on global business strategy within this book are, of course, useful when considering business in other developing areas such as Russia, Eastern Europe, or Central and South America.
Japanese companies were used as a starting point to acknowledge how Japanese global corporations, which had conquered the global high-tech product market, should meet the challenges of a new era in developing countries. As stated previ-ously, we have stretched the limits of a product model in which “high-quality prod-ucts sell,” with one solution to this problem being strategic concepts based on service models (i.e., a customer value model). Accordingly, this book contemplates manufacturers in developed countries with relatively high levels of technology. Our main objective is to provide suggestions about requisite technological capability and technology management strategy to respond to the expansion of new markets and the rise of companies in developing countries.
This book deals with macro issues when considering global strategies at a company- wide level. Thus, more practical issues such as the optimum solution to labor issues in China and India or transfer pricing for ROI in local markets are not covered here. However, important issues that develop when pursuing global busi-ness are touched upon as much as possible within the case studies to provide a “boots-on-the-ground” perspective.
This book is divided into two sections: the fi rst half deals with global business strategy and the second discusses the fundamentals of strategic planning. Chapter 2 provides an overview of corporate strategy theories and proposes a framework to deepen the understanding of global strategy that acknowledges national barriers. Chapter 3 gives an overview of world economic environment and its long term tran-sition. It is shown that developed country centered world in 1990s becomes to be a divided world between developed and developing economies in 2030. Chapter 4 focuses on the contrasting examples of China and India and examines the strategies
1.4 Structure of This Book
16
that refl ect the differing institutional characteristics and business environments in these two countries. Chapter 5 discusses global strategies in developing countries and provides an operating model that specifi cally contemplates competition from developing countries. Furthermore, it explains the strategic planning process through the use of the overseas expansion of infrastructure operations as a case study for the shift from a single product model to a customer value model and of a multifaceted service business, as discussed earlier. Further, Chap. 6 provides a deeper understanding of operating strategy design by using India’s Neemrana Industrial Park as a case study of a manufacturing operation with a complex cus-tomer value model.
The second half of the book presents some important components to create cor-porate wide global business strategy, such as strategic alliance, marketing, and tech-nology management theory. Each of these is covered by both theory and case study. Chapters 7 and 8 cover strategic alliance. The theory contained in Chap. 7 begins with the issue of whether to create a wholly owned local subsidiary or partner with a local company, and then discusses management of strategic alliances and public–private partnerships (PPPs) for infrastructure businesses. These are examples of alli-ances with governments of destination countries. Chapter 8 uses Hitachi Construction Machinery (China) Co., Ltd. as a company case study, which made its entry into the market through joint ventures with local companies, but subsequently changed its organization to a wholly owned subsidiary. Next, Chaps. 9 and 10 discuss marketing strategy, with the theoretical part in Chap. 9 explaining standard marketing theory for customer segmentation and targeting before delving into marketing for “good- enough” product markets that are particularly important in developing countries. We also discuss the bottom of the pyramid (BOP) business that targets the poorest classes. The case study discussed in Chap. 10 examines Shiseido’s marketing activi-ties in China. Chapters 11 , 12 , 13 and 14 discuss the theory of technology manage-ment strategy within global businesses. The theory discussed in Chap. 11 examines the globalization of R&D and the management of overseas subsidiaries, followed by a discussion of the characteristics of Japanese companies and their future state with regard to R&D management within developing countries. Chapter 12 picks up China and India, to see more details of multinationals’ R&D activities in emerging economies. Chapter 13 discusses this further while examining the relationship between Thailand’s National Science and Technology Development Agency (NSTDA) and Japanese companies in Thailand as examples of open innovation pro-motion in developing countries. Chapter 14 examines Suzuki, an exemplary success story among Japanese companies in India, as well as its operating strategy and its integrative local development.
The book concludes with the issue of integrating strategies that differ by country at a global level in Chap. 15 . The ultimate goal of management strategy in a global company is to increase a company’s overall long-term profi tability while expanding internationally. Doing this requires the optimal setting of various parameters appro-priate to a company’s circumstances, stemming from factors including regional strategies that focus on certain countries or regions, level of headquarter control and the delegation of authority to local entities, and open strategies such as M&A and
1 Introduction: Needs for New Global Strategies

17
strategic alliances. In addition, there is no guarantee that strategies that were at one time optimal will continue to remain optimal because of competition or changes in market environment. The ability to optimally adjust strategies in response to chang-ing circumstances is critical when creating and implementing strategies for ever- changing developing countries. Furthermore, integrating overseas subsidiaries that operate under varying management environments require diverse managerial abili-ties; this is done to retain subsidiaries’ strength in addition to guidance that encom-passes the entire company. Because Japanese corporations tend toward standardized management led by headquarters, we discuss herein the hurdles that must be over-come, as well as the ways to overcome them, to become a truly global company.
Open Access This chapter is distributed under the terms of the Creative Commons Attribution Noncommercial License, which permits any noncommercial use, distribution, and reproduction in any medium, provided the original author(s) and source are credited.
References
Bartlett, A. C., & Ghoshal, S. (1989). Managing across borders: The transnational solutions . Boston: Harvard Business Press.
Christensen, C. (2001). The innovator’s dilemma: When new technologies cause great fi rms to fail (trans: Shunpeita, T.). Tokyo: Shoeisha.
Friedman, T. L. (2005). The world is fl at: A brief history of the twenty-fi rst century . New York: Farrar Straus & Giroux.
Gadiesh, O., Leung, P., & Vestring, T. (2007). The battle for China’s good-enough market. Harvard Business Review, 85 , 80–89.
Ghemawat, P. (2007). Redefi ning global strategy . Boston: Harvard Business School Press. Motohashi, K. (2011, August). Measuring multinational’s R&D activities in China by Patent data-
base: Comparison of European . Japanese and US fi rms, a paper presented at Academy of Management conference, San Antonio.
Motohashi, K. (2012, June). Managing competency creating R and D subsidiaries: Evidence from Japanese multinationals . TCER working paper series (Working Paper E-48). Tokyo: Tokyo Center for Economic Research.
National Institute of Science and Technology Policy. (2004). Statistics on innovation in Japan (Report on the Japanese National Innovation Survey 2003 (J-NIS 2003)). Tokyo: National Institute of Science and Technology Policy.
Toyo Keizai Shinhousha. (2011). Kaigai Shinshutsu Kigyou Database 2011 . Tokyo: Toyo Keizai Shinhousha.
References

Part I
Global Business Strategy

21© The Author(s) 2015K. Motohashi, Global Business Strategy, Springer Texts in Business and Economics, DOI 10.1007/978-4-431-55468-4_2
2 Management Strategies for Global Businesses
2.1 Introduction
This chapter examines management strategy theories for global businesses. What extent of company’s resources should be assigned to overseas operations, and what minimum percentage of revenues should come from overseas operations? Should investments be made in regions such as China or Southeast Asia with existing sub-stantial business establishments, or should expansions into new markets such as India, the Middle East, and Africa be considered? Which corporate functions should be transferred overseas? This chapter attempts to understand the theoretical aspects of decision-making in the allocation of management resources within global businesses.
We fi rst present an overview of corporate management strategy theory as a prem-ise to understand global strategy. The objective of management strategy is to effec-tively utilize corporate management resources, such as personnel and technology, in accordance with external environmental factors such as competition and customer needs. In that process, there is a resource-based management theory that empha-sizes on internal factors to create strategies that make use of the strengths of a com-pany’s internal resources. In addition, there is a positioning theory that emphasizes on external factors such as the selection of areas that are deemed suitable to acquire mid- and long-term profi ts through a company’s external environment analysis. These approaches are introduced herein, although in reality, a company’s internal factors and external environment infl uence each other, and change over time. Therefore, these two approaches must be considered together when setting a spe-cifi c management strategy.
With that in mind, we then examine global management strategies—those that acknowledge national borders. It is critical to understand the differences between environments across key business destinations and domestic business environ-ments. Advancements in telecommunications technology such as the internet, lower transportation costs, and elimination of trade barriers due to the initiatives of

22
international organizations such as WTO, are factors that have contributed to a fl atter world. However, as noted previously, national border barriers still exist, and are particularly evident in developing nations such as China and India. Global busi-nesses must understand differences in business environment that are signifi cantly different from their home countries, and overcome them or use local environments to their benefi t to capture attractive markets that exist on the other side of these barriers, as is the case with offshore software development. With that in mind, we review strategy designing theories. Finally, we examine corporate management strategy in case of global expansion. Specifi cally, we focus on the headquarters’ level of control in overseas operations. Corporate activities integrated on a global level require a certain level of control of overseas entities. However, the presence of national barriers indicates that there are management methods appropriate to business environments in which overseas entities operate. Thus, it is often more effective to delegate everyday operations to local entities. This chapter minutely analyzes the balance between headquarter control and local autonomy. Japanese corporations exert a stronger level of headquarters’ control compared with their western counterparts. In addition to international comparisons, I-R grid framework and current state of affairs are examined.
2.2 Concepts of Corporate Management Strategy Theory
2.2.1 Scope of Management Strategy
Adopting management strategies within companies increases corporate value. Corporate activities result in economic profi t to company stakeholders, such as shareholders, employees, and important partners. Corporate strategy aims at mid- to long-term courses of action that maximizes the corporate value provided to stake-holders. For publicly traded companies, improvement in market capitalization will ultimately benefi t the company’s stakeholders. Corporate performance is often ana-lyzed in terms of profi tability ratios. However, a temporary improvement in profi t-ability ratios may sometimes hamper future profi t. For example, companies sometimes reduce the level of their investments that would otherwise positively impact future business performance, such as R&D activities. Even though this may temporarily improve profi t, a measure with no prospects of improving the long-term growth of a company will not increase its market capitalization, and therefore is not an appropriate management strategy. “Mid- to long-term” is part of the corporate strategy defi nition is because it accounts for the integration of corporate activities over an extended time period.
We examine corporate strategy in more detail. Policies regarding management methodologies and mid- and long-term corporate direction are classifi ed into four levels of abstraction: mission, objectives, strategies, and tactics (MOST).
The most abstract among them is “mission,” or the fundamental principles or vision of the company. The mission succinctly expresses the essence of the com-pany. For example, Morita Akio, Sony’s former Chairman, identifi ed Sony’s
2 Management Strategies for Global Businesses
23
mission as being “a pioneer.” This mission encapsulates the management’s direction that has provided the world with technologically advanced products, such as the transistor radio, Trinitron television, and Walkman. Sony believes in being a leader and does not follow other companies; its management policy has always maintained the challenge of pioneering new products.
“Objectives,” refer to specifi c objectives relating to the mission. Objectives are given a specifi c timeframe under which they need to be achieved. Large companies announce their 3–5-year management strategies called “mid-term management plans.” The objectives outlined in these plans may be, for example, to increase over-seas revenues to more than 50 % of total revenues within 3 years by strengthening global businesses.
“Strategies” refer to a company’s plan to achieve the objectives, and its contents detail its mid-term management plans. These strategies signifi cantly impact overall company management, such as new product development for the Chinese market to increase overseas revenues to greater than 50 % of total revenues or the acquisition of local companies to expand local distribution channels.
“Tactics” refer to the plan to execute strategies. The creation and execution of specifi c plans are often left to the discretion of divisions. Expansion of local chan-nels may be implemented by the marketing division, while new product develop-ment may be implemented by the development division. Thus, management meetings comprising the company president and division leaders typically discuss issues at a strategic level, and later share them with the rest of the company. Among Japanese corporations, global strategy is an increasingly important management strategy because overseas markets contribute to the increasing share of overall cor-porate revenues.
2.2.2 The Three Cs and SWOT Analysis in Management Strategy
The term “strategy” in the concept of “management strategy” was originally a mili-tary term, with Japanese characters derived from the ancient Chinese classic “The Art of War” by Sun-Tzu. A famous phrase from that work states that “if one knows one’s enemies and knows oneself, one will not be imperiled in a hundred battles.” When comparing it to management strategy, “oneself” might refer to corporate strengths and weaknesses, while “one’s enemies” might refer to competitors. Value is created from corporate activities when customers purchase products or services of a company. Thus, customer awareness is also important. Therefore, designing management strategies begins with the analysis of the three Cs which are “com-pany,” “competitors,” and “customers.”
SWOT analysis is a commonly used tool in the determination of corporate strat-egy. SWOT refers to “strengths, weaknesses, opportunities, and threats.” Strengths and weaknesses refer to internal management resources and correspond to the aforementioned “know oneself.” Therefore, it is important that the management identifi es corporate strengths and weaknesses, and develops necessary strategies that take advantage of strengths and avoid weaknesses. On the other hand,
2.2 Concepts of Corporate Management Strategy Theory

24
opportunities and threats are external to a company. Opportunities refer to a company’s business opportunities, for example, entering an overseas market to fi nd new customers. Threats, on the other hand, refer to powerful competitors or the expectation of heightened competition in the company’s business sphere because of deregulation. Management strategies set by companies should avoid areas with large threats and focus on areas with greater opportunities (Fig. 2.1 ).
Determining management strategies requires a combination of both internal (strengths and weaknesses) and external (opportunities and threats) factors. There are two theories regarding the areas where more emphasis should be placed. The fi rst is “Porter’s Positioning Theory” that emphasizes external factors. Porter’s the-ory of management strategy analyzes the forces that result in lower profi tability using the “Five Force” model (Porter 1980 ). The fi ve forces are outlined below:
1. Bargaining power of customers 2. Bargaining power of suppliers 3. Threat of new entrants 4. Threat of substitute products 5. Competitive rivalry within an industry
Under SWOT analysis, these factors focus on “threats” and suggest that manage-ment resources should be channeled toward areas where threats are relatively small.
On the other hand, the theory that emphasizes management resources in terms of corporate strengths (the “S” in SWOT) is called the “resource-based management strategy theory” (Barney 1986 , 1991 ). Sustained competitiveness is dependent on having management resources (technology, organizations, personnel, supplier net-works, etc.) that are rare and diffi cult to copy. This theory states that management strategy should be directed toward taking advantage of such strengths. The VRIO framework is used by this theory; we discuss this framework below.
Strengths
Opportunities
Weaknesses
Threats
Results of Internal Environment Analysis
Results of External Environment Analysis
Fig. 2.1 SWOT analysis
2 Management Strategies for Global Businesses

25
Value: Is the company’s technology far superior to that of its competitors? Does the company have better human resources than its competitors? Does the company have a network of powerful customers? Are the company’s assets of high value?
Rarity: Are the company’s assets rare compared with those of its competitors? Imitability: How diffi cult is it for competitors to imitate the company’s technology,
and can “rarity” be maintained for a certain length of time? Organization: Does the company have an organizational structure that can effec-
tively utilize available management resources?
Management resources that can affi rmatively answer the above questions can bring about sustained competitiveness; therefore, management strategies that can maximize the utility of such resources must be undertaken. Moreover, because the types of management resources provide an economic value change according to the environment in which a company is placed, there is an expanded theory called the “dynamic capability theory” that emphasizes the rearrangement of management resources in a dynamic fashion (Teece et al. 1997 ).
Needless to say, these two theories of management strategy are not in confl ict with each other, and must be used in conjunction when designing corporate strate-gies to maximize the value of a company’s internal management resources in response to external environments. Management strategies in Japanese corporations are generally based on a resource-based management theory that emphasizes inter-nal environments (Numagami 2009 ). Japanese corporate management is built on a long-term employment system based on stable relations. In addition, there is a strong tendency to build stable relationships with the network of suppliers and cus-tomers. Thus, resources such as technologies, personnel, and relationships with cus-tomers tend to be built over time, with corporate strategy designed around such management resources. Alternatively, the US and other Anglo-Saxon-based coun-tries have well-developed external labor markets with highly fl uid employment. In addition, dynamic changes in company structure due to M&A activities force com-panies to analyze external business environments and make a prudent realignment of management resources when attractive markets are found. Thus, Porter’s posi-tioning theory is more applicable.
However, as companies are becoming more global, the methods in which man-agement strategies were designed in the past to respond to varying market transac-tions and country-specifi c systems are beginning to break down. Many Japanese companies in a global business environment struggle because of a non-functioning Japanese-style management structure. For example, in its overseas subsidiaries, business models based on stable and long-term labor relationships and long-term customer and supplier relationships often do not work. There are exceptions to this, such as in the automotive industry where companies have launched a Japanese-style supply chain system overseas to great success. However, these cases are exceptions and creating management strategies requires a shift in thinking. Specifi cally, com-panies must strengthen their analysis of external environments, where they have not made much effort domestically in the past, and speed up changes in business domains using M&As or other entry methods.
2.2 Concepts of Corporate Management Strategy Theory

26
2.2.3 Global Strategies and Differences in Internal and External Business Environments
To adopt a global strategy as part of a corporation’s management strategy, it is fi rst necessary to analyze the differences in internal and external business environments. In doing so, we must be cognizant of countries and regions that are important to the global strategy. This is particularly important when considering business in coun-tries such as China and India that have signifi cantly different business environments from those in developed nations. In reality, some countries already have production centers and must be examined from the perspective of existing overseas networks. Moreover, in the case of parts manufacturers, it may be necessary to examine entry into specifi c countries because of key customer demands. In our discussion, we assume that the important countries have already been decided upon when contem-plating a global strategy.
First, we must understand the differences in business environments that exist between the domestic market and the countries in question. National barriers exist even in a “fl attened world”; therefore, we must fi rst grasp the signifi cance and types of barriers, and move on to examine the strategies to overcome them. In proposing the CAGE framework to explain the differences in domestic and foreign business environments, Ghemawat states four kinds of distances between a home and a for-eign country (Ghemawat 2007 ). We explain the CAGE framework as follows:
Cultural distance: differences in language, customs, religion, etc. Administrative distance: differences in foreign investment policy, regional eco-
nomic blocs (the existence or absence of free trade agreements), political prox-imity, currency, lack of colonial ties, etc.
Geographic distance: differences in transportation costs and times, time zones, etc. Economic distance: differences in income levels and wages, transparency in com-
merce practices, characteristics of corporate systems, etc.
Each of these principles is explained with specifi c examples. We use Ghemawat’s examples that examine the distance between China and India from the perspective of a US corporation (Table 2.1 ).
Low language barriers make India very attractive (short cultural distance). India was formerly a British colony, and English is widely spoken, this is not so in the case of China. In addition, a signifi cant portion of India’s elite are westernized, and have been to the UK and more recently to the US for further education. The founder of the CAGE framework, Ghemawat, is of Indian origin; he was employed at the Harvard Business School which also has several Indian professors. Moreover, there exist strong US–India elite class connections. On the other hand, China’s cultural attractiveness lies in its homogenous language and people; moreover, there are many Chinese-Americans. In contrast, language and customs vary greatly in India by region, making it diffi cult to take a one-size-fi ts-all approach across the Indian region in terms of expanding business operations there.
2 Management Strategies for Global Businesses

27
In terms of administrative distance, India and the US have similar legal systems, as the economic systems were built by a common colonizer—the UK. Moreover, India’s political system is said to be somewhat pro-American. Conversely, relations between China and the US have been somewhat strained in the past. From the Indian perspective, a further attraction is the “low long-term risk” that the country poses, although some may argue that point. An Indian characteristic is its entrenched dem-ocratic political system, which contrasts with the one-party rule of communist China. India follows a democratic political process to bring about major policy changes, while China most likely does so through a top–down approach. Therefore, in China, companies must always conduct business with an awareness of this inher-ent political risk.
Alternatively, the ease with which businesses can be created is a major attraction of China. In addition, it also provides incentives to foreign investments, such as the economic zones. China is said to be a country not of the “rule of law” but of the “rule of men,” thereby making the dealing of several business procedures simple and at the discretion of civil servants. India, however, has several business regula-tions, which need to be adhered to strictly. For such purposes, conducting business operations in China is certainly more attractive. In addition, economic zones in China were fi rst created in the 1980s, and this program has been a success, with many zones existing today, particularly along the coast. However, recently the Chinese government imposed stringent regulations toward foreign fi rms that build simple production centers within its borders; India has taken cues from China’s model of economic zones and has implemented a similar program.
In terms of geographical attractiveness, compared with India, China is relatively closer to the west coast of the US, and has the necessary infrastructure-support, such as harbors, in place. This deems China as more attractive than India. In assessing
Table 2.1 CAGE analysis: favorable conditions of China and India for US fi rms
Cultural aspects Administrative aspects Geographical aspects Economy aspects
India English-speaking, westernized elite
Common ruler (from the colonial era)
Specialized labor
Legal customs High profi tability
Political familiarity Westernized business customs Low political risk
China Standardized language
Ease of doing business Proximity to west coast of US
Large market
Chinese- Americans
Economic zones Ports and road infrastructure
Access to abundant labor and capital
East Asian manufacturing network
Supply chain network of foreign fi rms
Source : Compiled from Ghemawat ( 2007 ), Table 2.2 (p. 46)
2.2 Concepts of Corporate Management Strategy Theory

28
these regions as manufacturing centers, geographical proximity is an important fac-tor. Southeast Asia has well-developed infrastructure and a production network of component and product manufacturers that extend beyond national borders. Vietnam, Laos, and Myanmar neighbor China, and are connected via expressways. For example, the Pearl River Delta area of Shenzhen and Guangzhou has manufac-turing agglomerations in electronics and textiles. Moreover, travel routes are avail-able from these areas to Bangkok via continental expressways. While India’s major cities are situated along the coast, the traffi c network between the major cities remains incomplete because of the central mountain region, thus hindering the cre-ation of manufacturing centers.
In terms of economic attractiveness, India has many engineers in software and other fi elds. In addition, the market is not as competitive as China, making profi t-ability relatively higher for companies doing business there. Furthermore, manage-ments in India are familiar with the Western style of business, perhaps because of westernization of the elite class. Conversely, China’s corporate system is built on nationalized companies, and corporate governance is often not transparent. As illus-trated, India has superior soft-business infrastructure, while China has a large mar-ket with high wage levels. Moreover, the Chinese labor force is far superior to that of India and has more capital. Another benefi t of conducting business operations in China is the relatively greater number of foreign fi rms in the domestic supply chain system and in other business activities, thereby making it easier to form local partnerships.
2.2.4 Is China a Market or a Factory?
From the perspective of US companies, India and China are both distant and close within the CAGE framework. Given that, the question lies in how companies should globally expand based on the differences in domestic and foreign business environ-ments? Before introducing theories of global strategy, we fi rst examine whether China should be perceived as a market or a factory.
There are variations in the types of global businesses operating in China depend-ing on whether they perceive it as a market or a factory. Figure 2.2 classifi es these businesses in four ways, with its “advantage in production” axis, in which compa-nies view production in China as “being more advantageous than production in Japan,” and the “market advantage” axis, in which companies view China as having “a more attractive market than that of Japan.” One major “distance” critical in this case is the difference in income levels between Japan and China. China’s total GDP approximates that of Japan. However, China’s population is ten times that of Japan. Thus, the per capita GDP of China is less than one-tenth of that of Japan. Of course, China is a vast country with wide regional disparities. Many Chinese natives along coastal regions of Beijing and Shanghai have income levels higher than the Japanese. However, the country as a whole has low labor costs and its consumers prefer low- priced items, which is different from the case in Japan.
2 Management Strategies for Global Businesses

29
The top-right corner depicts the so-called “locally-produced, locally consumed” consumer products, produced in China for domestic consumption, such as vehicles and beer. High tariffs on vehicles in China and high transportation costs make local production more feasible. China’s auto market is second only to the US and is grow-ing annually, giving rise to manufacturing of vehicles primarily for domestic use. The percentage of transportation costs to the overall production costs for products such as beer are relatively high, rendering such consumer durables to be “locally- produced, locally-consumed.” With China’s entry into the WTO, foreign capital regulations in the distribution industry have been reduced, resulting in an increase in the expansion of retail stores such as convenience stores and supermarkets.
The lower-right corner applies to products that are manufactured in China and exported to the rest of the world, according to the “China as a factory” model, and applies to almost every known product. In particular, electronics and textiles are manufactured in the agglomerations at the Pearl River Delta area called “the facto-ries of the world.” These products are exported throughout the world. In addition, with Japanese food product manufacturers recently making forays overseas, there has been signifi cant development in frozen foods and vegetable production in China for the Japanese market.
Among other costs, China’s low labor and land costs, present a production advantage for many products. On the other hand, products that must be manufac-tured in Japan are limited to those requiring a high level of manufacturing technol-ogy. For example, high-end electronics such as ultra-slim laptops are manufactured in Japan. In addition, vehicles are manufactured in Chinese factories; however,
China as a manufacturing center
• Products (electronics, textiles, etc.)
• Frozen foods and vegetables
Made in China for China
• Automobiles (tariffs, transportation costs)
• Beer and other consumer goods
• Convenience stores, supermarkets, restaurants
Made in Japan for Japan
• High-end laptops
• High performance auto parts
Made in Japan for China
• Japanese brands (high-end rice, animation)
Japan
Japan
China
China
Prod
uctio
n Ad
vant
age
Market Advantage (Global Markets)
Fig. 2.2 Is China a market or a factory?
2.2 Concepts of Corporate Management Strategy Theory

30
high-performance automotive parts are often manufactured in Japan and then exported. These products are universal parts supplied throughout the world being manufactured specifi cally for the Chinese market. Finally, there are only few prod-uct categories that are manufactured in Japan exclusively for the Chinese market. Perhaps Japanese animation fi lms or high quality rice, sold as Japanese brands, can be placed in such a category.
The objective of management strategy from the perspective of globalization is the maximization of corporate value (i.e., long-term profi tability). There are two ways to increase profi tability: increase revenues or reduce costs. Our exercise of questioning China as a market or a factory effectively asks whether a company should elect to increase revenues (the market) or reduce costs (the factory) in its approach to conduct global business operations in China. A conclusion is arrived at by considering the distance in business environments between Japan and China. Generally, when viewing China as a market, the smaller the differences the better, as it becomes relatively easier to manufacture domestic Japanese products specifi -cally for the Chinese market. On the other hand, when viewing China as a factory, differences will be exploited; thus, the larger the differences the better.
This exercise considers how to conduct business operations in China with exist-ing products and services; it is not meant to provide answers to the strategic ques-tion of how to foster mid- and long-term growth in developing nations such as China and India. We have already discussed case studies on Japanese corporations enter-ing China as they are easy to understand. However, in case of India, there are very few Japanese products that can be sold in India as-is. Because of the high cost of Japanese consumer electronic products, Japanese companies lag behind Korean companies such as Samsung and LG. While the potential market for beverages and food products is large, food culture and customs are very different in India, making it diffi cult to expand the market for Japanese foods there. Specifi c local circum-stances must be taken into consideration while developing products and services for local markets.
In addition to the CAGE framework and its distances in terms of global busi-nesses, Ghemawat also proposes a three-axis “AAA” framework for global strate-gies, that comprises “aggregation,” as provided by domestic production; “adaptation,” or the localization of products for local markets; and “arbitrage,” which leverages distance. Figure 2.3 illustrates this framework. The horizontal axis balances adapta-tion and aggregation. Adaptation refers to the localization of products and services provided to a domestic market that refl ects the needs of that market. Aggregation refers to providing standardized global products for common needs in varying over-seas markets. Both adaptation and aggregation are parameters determined by global market characteristics; as the level of adaptation increases, a product will be more accepted by local markets, but will result in an increase in development costs, con-sequently, nullifying economies of scale for global markets. Companies must fi nd the ideal balance in terms of national and regional market differences as well as in the size of local markets.
“Arbitrage” is presented as the vertical axis. Adaptation and aggregation form the dimension that determines the extent to which distances in global businesses can be diminished, while “arbitrage” derives the value out of these distances. Typical
2 Management Strategies for Global Businesses

31
arbitrage strategy within global businesses can be seen in local production that exploits wage differences. India’s offshore software development, depicted in the “The World Is Flat” (Friedman 2005 ) is a good example of this. Many Japanese manufacturers have adopted this arbitrage position and have established production centers in China. Arbitrage is a widely used term in the fi nance industry, and arbi-trage trades refer to those trades that generate profi t by exploiting differences in interest rates within fi nancial markets. Financial products are quickly traded in the market even in case of a minute arbitrage opportunity; such actions in turn resolve market distortions. Arbitrage opportunities are likely in a global business environ-ment with national barriers. China has become popularly known as the world’s fac-tory, and companies world over are investing in China, in the hope of taking advantage of arbitrage trading opportunities. For the same reason, western compa-nies have concentrated offshore development in India.
We now return to examine the AAA framework by using the consumer electron-ics industry as an example. Consumer electronic products can be divided into white- goods products, such as washers and refrigerators, and audio/visual (AV) equipment, such as televisions and video cameras. Generally, overseas expansion can be exe-cuted effi ciently for white-goods products in terms of “adaptation” and for AV equipment in terms of “aggregation.” Sale of white-goods products is closely asso-ciated with country-specifi c lifestyles. For example, most washers in Europe are front-loading and have a vertically rotating drum; this design consumes relatively less electricity and water. Europe has a much stronger propensity to environmental awareness and has stringent energy conservation policy standards. On the other hand, washers in Japan and the US are typically top loading and spin horizontally; this design consumes relatively more water. Similarly, the capacity of refrigerators varies according to shopping frequency. In the US, consumers often buy goods in bulk because they can load them into their cars; this type of shopping requires rela-tively large refrigerators. Therefore, white-goods products must be localized for each market by observing how locals live. In lifestyle research centers located in developing nations such as China, Panasonic analyzes home environments and life-styles of local consumers by visiting their homes. Product development is,
Market globalization (demand side)
Production globalization (supply side)
Adaptation(local responsiveness)
Aggregation(economies of scale)
Arbitrage(value from differences)
Fig. 2.3 AAA framework
2.2 Concepts of Corporate Management Strategy Theory

32
therefore, based on information obtained in these lifestyle research centers so that products can be adapted to local market environments.
On the other hand, AV products such as televisions and video cameras are not impacted greatly by lifestyle differences. Of course, there are always differences such as in television’s broadcast systems and frequencies, but the basic functions are universal. Selling these products in developing nations requires an “aggregation” strategy to reduce costs and increase cost competitiveness. The price of AV products drops annually. Manufacturers in China and other developing nations are techno-logically catching up with Japanese manufacturers, and while Japan may have higher quality products, their acceptance rate in many markets will be diffi cult with-out price reductions. Sony has standardized the design of components that are not specifi c to any particular region, such as digital video processing chips, to increase television development effi ciency. In doing so, Sony has centralized development teams in Tokyo. In addition, Sony has strategized to distance itself from low price competition in developing nations by improving their brand image through their specialty shops, called “Sony Style.”
How is arbitrage used to the advantage of Panasonic and Sony? Both companies have production centers in low-cost regions such as China, and benefi t from the merits of arbitrage through cost differences. Moreover, they are in the process of shifting product development and design to developing countries such as China and India; however, teams located in Japan still play a central role in these functions. As indicated in Fig. 2.4 , companies must choose between adaptation and aggregation; however, it is noteworthy that arbitrage can be accomplished in combination with either.
Fig. 2.4 Porter’s value chain. The integration of procurement and logistics, procurement, and logistics ( Source : Porter 1980 )
2 Management Strategies for Global Businesses

33
2.2.5 Value Chains and Global Strategy
The AAA framework suggests ways to manage distances that have been recognized in the CAGE framework within international business expansion. This is effective when considering global business strategy, though this discussion remains highly abstract. The application of this framework to a more detailed corporate strategy requires further examination of corporate activities. We separate what we call “international business expansions” into components of corporate activities, and then consider how each activity contributes to an improvement in corporate value through globalization. The concept of value chains as proposed by Michael Porter breaks down a company’s internal functions and combines the value added by each function, leading to overall corporate value.
Figure 2.4 indicates manufacturers such as automakers. The automobile manu-facturing process begins with the procurement of parts. These parts are assembled into completed vehicles at factories, exported, and then sold to consumers via dealer networks, who provide post-sales services such as maintenance services. The entire process from vehicle production to post-sales service, through activities such as production and sales, are called primary value chain activities. However, the value- added activities for the company as a whole are not limited to such activities, and corporate functions exist to support divisions that provide these primary activities, such as divisions responsible for personnel management (human resources), R&D, and procurement.
Companies are organized along these functional divisions, with leaders of each function comprising the management team. These leaders are often directors and corporate offi cers. A clearer image of global strategy appears when each business unit considers increasing the value chain of activities in global expansion. The AAA framework becomes more crystallized when deliberated at the business unit level.
Figure 2.5 indicates in basic terms, the three R&D areas, procurement and manu-facturing, and sales and service as they apply to overseas expansions. First, for R&D, particularly research, it is vital to aggressively incorporate advanced technol-ogy from overseas markets. A typical example of this is the establishment of research centers in Silicon Valley or near Boston, and the conducting of joint research with local universities and research institutions. Developing products in response to local needs is also critical. As earlier stated, “adaptation” is critical for white-goods products, but it is executed only when differences in lifestyles are of signifi cant distance in term of the CAGE framework, the local market is of suffi cient size, and economic rationale for developing products with localized specifi cations is high. In addition, offshore development in regions such as China is a form of R&D “arbitrage.” Typically, outsourcing often refers to the offshore development performed by software companies; however, it may also imply internationalization of activities such as product development and design.
Next we look at procurement and manufacturing activities, which essentially utilize “aggregation,” or the expansion of production facilities from the domestic country (mother factories) to the overseas market. In this case, cost margins are pos-sible by arbitrage of wage differences and in the use of local suppliers. A key
2.2 Concepts of Corporate Management Strategy Theory

34
limitation to creating overseas production facilities is the risk associated with such high investments. In addition, there are signifi cant transaction costs associated with managing local labor and with decentralization of production facilities. Balancing both determines the fi nancial feasibility of localization. Generally, developing nations have higher tariff rates than developed nations, so that local production makes more economic sense as compared to exporting products to these countries. However, the recent entry of many developing nations into the WTO has resulted in a declining average tariff rate. In addition, regionally fl at economic zones, such as those created by the ASEAN Free Trade Agreement, an economic partnership agreement for ASEAN countries, are beginning to take shape. This is in turn caus-ing the production centers of Japanese corporations, which were formally spread throughout Asia, to be concentrated in single countries. Recently, ASEAN entered into economic partnership agreements with Japan, India, and China, and integration of production centers within Asia is expected to continue further.
Finally, we look at sales and service as critical toward understanding the needs of local customers, and as the function most essential for successful localization. Expanding product sales and services in each region requires activities rooted in that region, as well as the cooperation of local companies in networks such as dis-tribution and retail. Thus, there is a strong tendency toward “adaptation” within the AAA framework, with a high level of “arbitrage” from the perspective of highly utilized local sales staff. On the other hand, in cases where brand management is important, as is the case with cosmetics, companies must take care to balance aggre-gation and adaptation. For example, when Shiseido entered the Chinese market, it used both the SHISEIDO global brand and the “Aupres” brand that was created
R&D
Procurement Manufacturing Sales Service
・ Acquiring cutting-edge technology・ Product localization・ Offshore development
・ Labor costs・ Tariffs and import regulations・ Local suppliers
・ Customer needs・ Brand management・ Local service companies
Fig. 2.5 Activities of overseas entities by corporate function
2 Management Strategies for Global Businesses

35
specifi cally for the Chinese market. Separating the brands circumvented the possible damage that could be caused to its global brand while maintaining its ability to go after a large local customer segment (the volume zone) (refer to Chap. 9 for details).
2.3 Relationship Between Headquarters and Local Entities
So far we have examined global business strategy from the perspective of corporate activities. We continue our discussion by focusing on organizational aspects. Corporations establish local subsidiaries in various countries, and delegate opera-tions to them as a means of actively pursuing businesses on a global scale. An important issue to consider is the extent to which headquarters should control these local entities.
To examine this issue, we present the I-R (integration responsiveness) grid shown in Fig. 2.6 . Integration implies a strong central organizational structure with high control by the headquarters (i.e., global integration), while responsiveness implies a decentralized organizational structure with highly autonomous local entities (i.e., local responsiveness). The I-R grid was created by international business academ-ics, Prahalad and Doz ( 1987 ); this framework has been used extensively in the fi eld of international business.
Ghemawat’s AAA framework is closely tied to the I-R grid, in which aggregation corresponds to type I, in which fi rms are controlled by the headquarters (global integration), while adaptation corresponds to type R, in which voluntary responses of local subsidiaries are welcomed (local responsiveness). For example, consumer electronics can be largely classifi ed into two major groups: AV equipment such as televisions, and white-goods products such as washers and refrigerators. As previ-ously mentioned, the former group has standard functions independent of country or region, enabling companies to provide universally standardized products
Global standard product
Headquarter-oriented
Product localizationLocal entity-oriented
Glo
bal i
nteg
ratio
n
Local responsiveness Fig. 2.6 I-R Grid
2.3 Relationship Between Headquarters and Local Entities

36
(via aggregation), while the latter group is intimately tied to local lifestyles and must be localized according to market needs (via adaptation). The former has a type I organizational structure, while the latter has a type R one. Arbitrage, the fi nal “A” of the AAA framework, takes advantage of the differences between the domestic country and local markets. Overseas production leveraging wage differences takes a type I structure, with the home country playing a central role, while product devel-opment that uses local ideas takes a type R structure.
Bartlett and Ghoshal used the I-R grid to make a comparative analysis of 30 global corporations in Japan, the US, and Europe, and examine them by industry and country (Bartlett and Ghoshal 1989 ). The results of this comparison showed certain industry characteristics, similar to the differences in types of consumer elec-tronics, but more importantly, showed differences in positions within the I-R grid between countries. The locations of every Japanese, US, and European company are shown in the I-R grid (Fig. 2.7 ), with organizational structures of these companies classifi ed as global, international, or multi-national. “Global” companies refer to those companies with a high level of global integration, with headquarters taking the lead and operations being uniform throughout the world. Japanese companies typically fi t this pattern. On the other hand, “multi-national” companies have local entities with a high degree of autonomy and an overall corporate organization formed by groups of companies from multiple countries. Many European compa-nies fi t this pattern. “International” companies are somewhere in between, and many US companies fi t this pattern.
Many of Japan’s global corporations fl ourished along with high post-war eco-nomic growth. The Japanese domestic market grew alongside the growth in income levels, and durable goods such as consumer electronics and automobiles became
International(US)
Multi-national(Europe)
Glo
bal i
nteg
ratio
n
Local responsiveness
Global(Japan)
Trans-national
(?)
Fig. 2.7 Comparison of corporations in Japan, the US, and Europe in I-R grid
2 Management Strategies for Global Businesses

37
common. Companies became competitive with import substitutions under the control of foreign companies, followed by growing corporate internationalization with a stronger export mindset. In doing so, companies entered the overseas markets by exporting global products to Europe and the US. In addition, personnel manage-ment structures in Japanese companies are based on long-term, stable relationships, with the tendency to emphasize implicit knowledge such as culture and context. Accordingly, even while globally active, local entities were controlled by what were mere extensions of management structures in Japan.
On the other hand, Europe is an amalgamation of countries, each with its own language and lifestyles. Individually, each country is smaller than Japan, but Europe as a whole is a market several times the size of Japan. Having a single currency, economic equality among European nations has increased with the liberalization of the fl ow of people and goods within the region. However, culture-specifi c differ-ences exist among these nations and a multi-national approach becomes a prerequi-site from the outset of targeting the entire European market. US corporations are somewhere in between their Japanese and European counterparts. The US makes up an enormous market by itself, making a US-centric, centralized management style most effective. However, the US is a diverse country, originally comprising immi-grants from Europe; this is different from the homogenous nature of the Japanese culture and its people. Corporate management structures are based on a fl exible labor market, and US-based organizations are highly fl uid because of M&A activi-ties. Thus, management in local entities takes on a variety of structures.
By comparing Panasonic and Philips, two of the world’s leading consumer electronics manufacturers, we examine the differences in global management organizations between Japanese and European companies (this discussion is based on Bartlett ( 2009 )). Philips is headquartered in the Netherlands and has a decentralized management structure; marketing of its products are conducted by autonomous sales entities in each country. Philips has made considerable efforts to increase the control from its headquarters and make sales entities in each region follow a consistent, company-wide policy. However, Philips has not been very successful in doing so. On the other hand, Panasonic follows a centralized manage-ment system that consolidates the sales entities of each region under a marketing division in Japan. They have set up training and personnel systems for local employ-ees to enable a monolithic operating structure which folds local entities into the Panasonic group.
While multinational corporations have to consider nationality-based differences in the management of local entities, their positioning on the I-R grid changes according to their international business expansion. Figure 2.7 presents trans- national organizational structures that balance global integration and local responsiveness. Global companies from Japan, the US, and Europe are moving in this direction. When Panasonic had a global sales center in Japan and centrally managed overseas branches, each branch manager was required to visit the Osaka headquarters several times a year, and as often as every month (Bartlett 2009 ). However, the internet has enabled the use of economical video conferencing systems, which has signifi cantly
2.3 Relationship Between Headquarters and Local Entities
38
reduced the time and money spent on international meetings. The fl attening of the world brought about by advances in telecommunication has enabled the manage-ment of local entities using a headquarter-led global integration model.
On the other hand, many global companies have overseas revenues that exceed domestic revenues, making local autonomy in operating a business critical. In addi-tion, the primary battlegrounds for global businesses are shifting from developed to developing nations. The circumstances faced by local entities are often different from those faced by headquarters, making it reasonable to give more weight to local responsiveness. Furthermore, giving decision-making authority to local entities and improving local employee morale is critical to utilizing excellent local personnel. Balancing uniform company-wide activities and local entity autonomy requires a seamless organizational operation at a global level by doing away with company borders. For example, Panasonic has standardized internal rankings for manage-ment posts in domestic and overseas operations, and promotes local personnel to increase the fl uidity of management at the global level. Many companies in the US and Europe have achieved a fl at world environment with no apparent borders, oper-ating as trans-national organizations. Japanese companies are working toward the creation of organizational structures that balance headquarters’ control and local entity responsiveness.
2.4 Summary
In determining management strategies, global companies must focus on the dis-tances between domestic and destination markets, select destinations on the basis of those distances, and strategically consider how to reduce them. This requires new product development that takes products sold in the domestic country and matches them to local needs. Country-specifi c marketing will also be essential, thus incur-ring higher costs. In terms of economies of scale, it may be more effective for com-panies to develop global products to be launched into global markets. The risks associated with global businesses are very different from those in domestic busi-nesses. Political risks, exchange rate fl uctuations in local markets, and other factors must be accounted for; risk factors differ depending on a company’s focus of local-ization or global expansion. Thus, when determining global business strategies, companies must make major decisions of whether they wish to focus on localization or global expansion.
Furthermore, from the perspective of improving corporate value via cost reduc-tion, companies have the option of shifting production to developing nations with lower cost. However, while expanding production overseas may result in direct reductions in manufacturing costs, the increase in local management overhead costs may result in no cost reductions unless certain economies of scale are maintained. In addition, companies are exposed to risks distinct to global businesses from the
2 Management Strategies for Global Businesses

39
production perspective. China has witnessed increasing awareness in terms of labor rights, with labor unions demanding wage hikes. Unions have long been active in India, requiring a serious approach to handle labor disputes. Corporate earnings are greatly impacted when large strikes result in long-term factory closures. In addition, in industries such as the automotive industry, in which the production process com-prises a series of close partnerships within a supply chain, the halt of production in one factory impacts the entire supply chain. It is important that companies account for these costs and benefi ts when determining the validity of shifting a portion of corporate activities overseas. When using the CAGE or AAA frameworks, it becomes critical to extract micro-level factors in the targeted country, however, this may greatly impact profi tability.
In addition, these frameworks are created given an external business environ-ment that differs from the domestic country. In corporate management strategy theory, this is akin to the positioning theory that seeks areas of fi t to an external business environment. As previously mentioned, global strategies depend on the circumstances prevailing in the countries and regions, and will differ based on the types of products and services provided. Each company must have an understanding of the company’s strengths and weaknesses when creating management strategies. Differences in business environments between the domestic country and target mar-kets are not given; rather, companies must observe changes in global environments and trends. Speedy strategies that react to those changes are also important. In the case of the global cell phone market, demand in developing nations increased rap-idly, and at one point, mass-produced, low-cost products with limited functionality became popular. In that process, Nokia, Motorola, and other global corporations increased their market shares using models “adapted” for low-income regions. However, explosive popularity of Apple’s iPhone shifted the global market trend to highly functional smartphones. Nokia lost its market share and Motorola’s cell phone division was sold to Google. However, Samsung was able to quickly ride this trend, and attained signifi cant popularity. Thus, organizational capability that is able to dynamically change its corporate strengths, that is, management resources to external changes in the environment, becomes particularly essential in highly uncer-tain global businesses.
The fi nal issue is the management of local entities, in which headquarters of Japanese corporations have stronger control compared with their US and European counterparts. This is because of the impact of historical inertia of the standalone product model that provided high quality products at low cost which took over world markets. However, the rise of corporations from developing nations has led to the inability of Japanese corporations to compete on the standalone product model, as has been covered in Chap. 1 . The future pursuit of a customer value model in global business will require new product development and the creation of service models, all while precisely grasping the trends in target markets. As observed in the case of Panasonic, Japanese companies are searching for a balance in trans-national
2.4 Summary

40
management between global integration and local responsiveness. As they do so, the debate on the integration of a company’s global entities and activities across dif-fering countries and regions is important. We return to this topic in Chap. 13 , which contains the summary of this book.
Open Access This chapter is distributed under the terms of the Creative Commons Attribution Noncommercial License, which permits any noncommercial use, distribution, and reproduction in any medium, provided the original author(s) and source are credited.
References
Barney, J. B. (1986). Strategic factor markets. Management Science, 32 , 1231–1241. Barney, J. B. (1991). Firm, resources and sustained competitive advantage. Journal of Management,
17 , 99–120. Bartlett, C. (2009). Philips versus Matsushita: The competitive battle continues . Boston: Harvard
Business School Case. Bartlett, C., & Ghoshal, S. (1989). Managing across borders: The transnational solution . Boston:
Harvard Business School Press. Friedman, T. L. (2005). The world is fl at: A brief history of the twenty-fi rst century . New York:
Farrar Straus & Giroux. Ghemawat, P. (2007). Redefi ning global strategy . Boston: Harvard Business School Press. Numagami, T. (2009, September). Keiei Senryaku no Shikou. Tokyo: Nihon Keizai Shinbunsha. Porter, M. E. (1980). Competitive strategy: Techniques for analyzing industries and competitors .
New York: Free Press. Prahalad, C. K., & Doz, Y. L. (1987). The multinational mission: Balancing local demands and
global vision . New York: The Free Press. Teece, D. J., Pisano, G., & Shuen, A. (1997). Dynamic capabilities and strategic management.
Strategic Management Journal, 18 , 509–533.
2 Management Strategies for Global Businesses

41© The Author(s) 2015K. Motohashi, Global Business Strategy, Springer Texts in Business and Economics, DOI 10.1007/978-4-431-55468-4_3
3 Changes in the Global Economic Environment
3.1 Introduction
Understanding economic changes at the global level is critical to the formulation of global business strategies. In Chap. 1 , we provided an overview of the economies of newly developing countries, particularly China and India, although many other regions throughout the world—including Southeast Asia, Latin America, and Africa—are expected to become major markets. Advanced countries and regions, such as the U.S. and Europe, are currently the most promising overseas markets for Japanese companies, but how will the rankings of these advanced markets change in the future? In this section, we consider the changes in the global economic environ-ment by focusing on the changes in the GDP of countries around the world.
In addition to examining the long-term GDP growth rate of various countries, we fi rst discuss the determinants of economic growth that vary by country. Companies entering overseas markets must be prepared to make long-term investments span-ning 10 or 20 years. Therefore, it is critical to understand each country’s long-term economic trends. In this section, we discuss philosophies of long-term economic growth based on economic growth theory.
Next, in Sect. 3.3 , we introduce an economic forecast for various countries and regions for 2030. In addition to the GDP scale, we present forecasts for per capita GDP and describe how the advanced countries of Japan, the U.S., and Europe, as well as the developing nations, will change. Per capita GDP not only gives us the average income levels (i.e., purchasing power) but also is an indicator of labor costs. It is a fundamental concept used when expanding overseas and, as noted in Chap. 2 , is the most important metric for determining whether a country should be viewed “as a market or as a factory.”
Finally, we explain the concept of international competitiveness and its most common indicator, the IMD’s World Competitiveness Index. International competi-tiveness can be thought of as synonymous with a country’s long-term economic growth potential. The IMD created this index using qualitative data, such as the

42
quality of corporate management and governments, based on a questionnaire survey of managers from around the world. This is very valuable data for considering global strategies, as it provides diverse information on approximately 60 countries around the world.
3.2 Long-Term Economic Growth by Country
The world has many countries, and each country has a different pattern of economic level. Tremendous disparities exist among nations in terms of per capita GDP. In Japan and other advanced nations, per capita GDP is at a level of several tens of thousands of dollars, whereas some countries have per capita GDPs of only several hundred dollars. Figures 3.1 and 3.2 show post-World War II changes to per capita GDP by country and region (with purchasing power in 1990 U.S. dollars). We cre-ated two categories of per capita GDP as of 2008: developed nations with per capita GDP above $20,000 (the U.S., Singapore, Hong Kong, Japan, Western Europe, and Taiwan), and developing countries with per capita GDP below $10,000 (countries of
Fig. 3.1 Per capita GDP in U.S. dollars (developed countries)
3 Changes in the Global Economic Environment

43
the former Soviet Union, Eastern Europe, ASEAN countries, Latin American coun-tries, India, and African countries).
Japan caught up with the advanced nations of Western Europe and the U.S. dur-ing the post-war era. Japan’s per capita GDP surpassed Western Europe’s in the mid-1980s, but its growth stalled in the 1990s and it has fallen farther behind the U.S. in the recent years. Meanwhile, per capita GDP in the city-states of Singapore and Hong Kong is rapidly approaching that of the U.S. South Korea, Taiwan, and other new industrial economies (NIEs) experienced growth after the 1980s and have recently been approaching the level of Japan and Western Europe. When we exam-ine the trends in the developing nations (Fig. 3.2 ), China’s recent growth is particu-larly striking. In the past, the countries of the former Soviet Union (Russia and surrounding nations) and Eastern Europe had stronger economies than Japan; how-ever, the collapse of the Soviet Union in 1991 and subsequent economic chaos brought stagnation and reduced these countries to a level averaging that of the developing nations. However, economic growth in Russia and Eastern Europe has
Fig. 3.2 Per capita GDP in U.S. dollars (developing countries) ( Source : Angus Maddison’s long- term GDP growth statistics)
3.2 Long-Term Economic Growth by Country

44
recently surged, and these countries, along with China, appear to be catching up to the developed nations. The Southeast Asian countries of Indonesia, Malaysia, the Philippines, Thailand, and Vietnam have achieved startling economic growth since the 1980s. Although China surpassed them in the 2000s, they are still growing more rapidly than the developed nations. That being said, the countries of Latin America, India, and the countries of Africa face stagnated economic growth, and these econo-mies have remained at a low level of development. Africa, in particular, has been completely left behind in terms of global economic development. India’s growth rate picked up in the 2000s, and seems to have taken a step up from its former pov-erty levels, which are still seen in Africa.
Economic growth theory is a fi eld that researches these types of global economic growth patterns. Economic growth requires growth in the population (i.e., labor force), as well as the accumulation of capital and improvements to technology. Classical economic growth models, such as that of MIT’s Robert Solow, explain economic growth as occurring through exogenous technological innovations, popu-lation growth, and capital accumulation. As economic development progresses, companies automate their production processes and improvements are made to such infrastructure networks as roads, railways, electric power, and water and sewage systems across the entire nation, thereby increasing the capital stock per capita. Accordingly, economic growth exceeds the rate of population growth. The increased per capita economic growth witnessed to date is due to the worldwide occurrence of this phenomenon.
As capital accumulates, the marginal productivity of capital decreases and the economic growth rate slows. Accordingly, there tends to be a negative relationship between per capita GDP and economic growth rate, and this trend has been con-fi rmed in many studies. The classical model of Solow states that the speed of capital accumulation will ultimately falls below the population growth rate, and economic growth will decelerate to the speed of technological innovation, which is exoge-nously impacted by the population growth rate. In this basic model, economic growth is determined by levies imposed on the factors of production held by each country, and is not infl uenced by government policies for deregulation or to create innovation that are so often observed in growth policy roadmaps.
However, recent research focused on economic externalities caused by technol-ogy spillover effects, and a new theory has arisen that emphasizes on the importance of innovation on economic growth. This theory of endogenous economic growth focuses on technological innovation, which was treated as exogenous in the Solow model, and treats R&D activities as endogenous. A part of GDP is given over to capital accumulation as equipment investment; likewise, the portion given to R&D spending is allocated to knowledge accumulation. This knowledge (technology stock) is fundamental to such innovations as new products and production process improvements (Grossman and Helpman 1993 ). Unlike capital stock, knowledge and technology are intangible assets and thus can be shared with others. Through this characteristic of non-rivalry, investment in knowledge stock benefi ts not only the investors, but the whole of society. Accordingly, policies to promote R&D through
3 Changes in the Global Economic Environment

45
subsidies and tax measures can spur the rapid accumulation of knowledge stock and ultimately increase the rate of economic growth. This theory of endogenous eco-nomic growth allows for the use of investments in infrastructure as well as in educa-tion and other human capital, similar to investments with economic externalities. It is a useful model for evaluating growth strategies.
Robert Barrow and Xavier Sala-i-Martin used economic growth data from 87 countries to conduct a quantitative analysis of long-term economic growth determi-nants (Barro and Sala-i-Martin 2003 ). Taking 10-year average economic growth rates (divided into three 10-year periods from 1965 to 1995) as a non-explanatory variable, they ran a multiple regression analysis using per capita GDP for the initial year in each 10-year period, as well as the following variables.
• Variables related to human capital, such as the percentage of male adults who received higher education, infant mortality rates, and birthrates.
• Variables related to the macroeconomic environment, such as ratio of capital investment to GDP, the rate of infl ation, and trade indices.
• Variables related to socioeconomic systems, such as the degree of democrati-zation, the effectiveness of courts, and government expenditures as a percent-age of GDP.
As can be seen from this theoretical model of economic growth, there is a signifi -cant correlation between these explanatory variables and the economic growth rate. We conducted an analysis of whether, in addition to the above variables, regional characteristics lead to differences in economic growth. The results of this analysis clearly show that Japan, China, South Korea, and other countries in East Asia enjoy a higher economic growth rate than elsewhere. Research, including a research proj-ect by the World Bank, has been conducted on Asian economic development that demonstrates the infl uence of investment in human resources and a stable macro-economic environment (World Bank 1993 ). However, these variables are already part of the estimation model and, moreover, show that East Asia has high economic growth. In other words, the results suggest a regional characteristic that can, per-haps, be termed an Asia Model that goes beyond economic growth models. Research by MIT’s Daron Acemoglu and others shows that economic growth during the colo-nial era varied according to the colonial power (Acemoglu et al. 2001 ). Compared with British colonies, colonies controlled by Spain were slow in forming property rights systems governed by the rule of law, and this slowed the development of market economies. The results of this study showed that, in addition to controlling economic variables, those colonies had lower economic growth rates. Thus, when considering international competitiveness (or long-term economic growth), such institutional factors as the historical background and overall socioeconomic circum-stances of each country should also be considered, in addition to economic variables that are explained by economic growth theories. We discuss this in greater detail in Chap. 3 by way of a comparison of China and India.
3.2 Long-Term Economic Growth by Country

46
3.3 The Global Economic Forecast for 2030
In October 2003, Goldman Sachs published a report entitled “Dreaming with BRICs: The Path to 2050.” This report predicted that China’s GDP would surpass Japan’s by 2015, and that, by 2040, it would overtake that of the U.S., becoming the largest in the world; India’s economy was predicted to be the same size as Japan’s around 2030. The report highlighted the BRICs’ economies. In the 10 years since the report was published, China’s economic growth has accelerated; its GDP exceeded that of Japan in 2009.
We built a long-term economic growth model for 80 countries to understand how the economic balance between developed and developing nations in the global economy would change. The model did not examine most African nations (only South Africa, Egypt, Algeria, and other larger countries were included) or small island nations; however, it did cover more than 90 % of the world’s overall GDP as of 2010 (Motohashi 2014 ).
Figure 3.3 shows the 2030 forecast of GDP shares (in US dollars) by country and region, based on this model. The share held by the developed nations (Japan, North American countries, and Western European countries) was about 85 % until 1990. This percentage began to shrink in 2000 and is expected to drop to almost 40 % by 2030. Japan’s share of the global economy was 15 % until 2000, but will contract to less than 5 % in 2030. Japan’s position in the global economy will become mar-ginal. On the other hand, China’s share will grow to approximately 18 % by 2030, and India’s will increase to about 6 %. The shares of Brazil and other Latin American countries, Russia and other Eastern European/Eurasian countries, and Middle
Fig. 3.3 Changes in shares of GDP (in nominal U.S. dollars)
3 Changes in the Global Economic Environment

47
Eastern and African countries will grow. These estimates also show that by 2030, China’s GDP will be as large as that of the U.S., and India’s GDP will surpass Japan’s.
These estimates were generated by reverse-engineering of calculations for growth factors, i.e., by forecasting investments in labor and capital, and then adding total factor productivity (TFP) to calculate potential economic growth. When fore-casting long-term economic growth, it is important to factor in changes in the com-position of the population. As a simple explanation of our model structure, we fi rst determine investment in labor by forecasting the future working-age population (those between 20 and 65 years of age) using UN population estimates. For capital stock, we subtract depreciation from the starting point (2010) for future projections, and then add new equipment investment to determine next-period capital stock (the perpetual inventory method). Repeating these steps enables us to determine the path of capital accumulation. Equipment investment is determined by the savings rate (the I–S balance), and the savings rate is affected by the ratio of elderly people in the population (or the ratio of elderly to working-age individuals). This is because an aging society increases consumption in society overall, and lowers the savings rate. Furthermore, total factor productivity (TFP) is set to an annual rate of 1 % for all countries. While it may be possible to use past trends in the TFP of each country, we set our baseline at a certain value due to issues with the accuracy of our statisti-cal data, and then adjusted this value by country and period as necessary. Even if we were to set the post-2010 TFP growth rate to 2 % rather than 1 % for Japan alone, the share of Japan’s GDP would only rise by 1.2 %, i.e., from 4.3 to 5.5 %. Furthermore, it is rare for a country to have an average long-term TFP growth rate of more than 2 %, and it is hard to imagine that political instability, i.e., wars, or other large external shocks causing negative TFP would not occur. Accordingly, any assumptions we made on TFP are not likely to have much of a negative impact on the accuracy of the results of our forecast.
In “ The World Is Flat ,” Thomas Friedman discussed the notion that the world is becoming “fl atter,” with less awareness of national borders due to internet-based innovations and negotiated trade via the WTO or FTAs (free trade agreements) and EPAs (economic partnership agreements). To be sure, when one visits the campus of Infosys in Bangalore, India, the subject of the beginning of the book, one does get a sense of this “fl attening.” The campus is located in a beautiful park-like complex, replete with modern buildings. The company’s many engineers provide IT services primarily to Western companies. The department that offers maintenance services for remote computers, work the same hours as their clients. Thus, people in India work in the time zones of eastern U.S. as well as the European continent. The power of the internet allows people to experience such a fl attened world.
However, when Infosys employees step off their corporate campus, they are greeted with the roadside stalls and motorized rickshaws that are common in India. Sales per capita at Infosys is less than one-tenth that of IBM. Compared with the U.S., wages in India are very low. Of course, the rise of Infosys and other Indian IT companies puts downward pressure on U.S. software engineers’ compensation.
3.3 The Global Economic Forecast for 2030
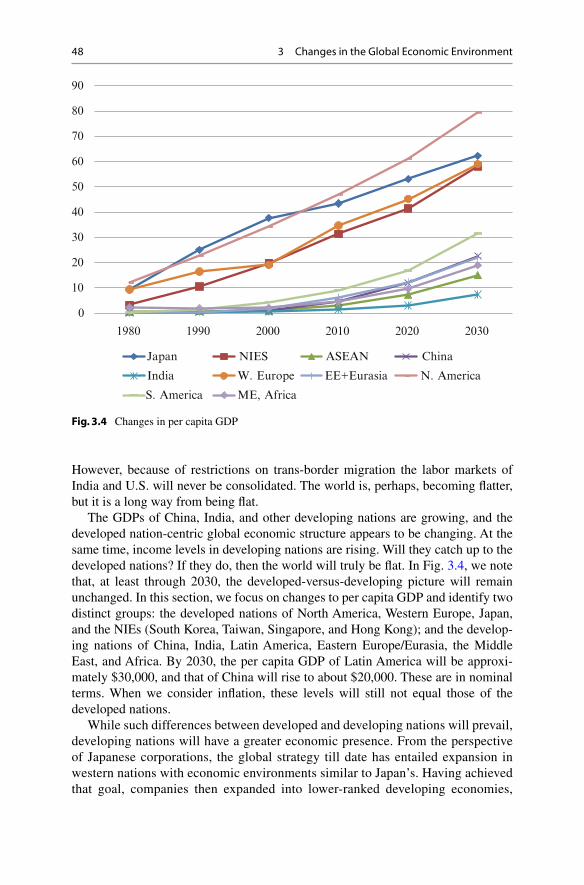
48
However, because of restrictions on trans-border migration the labor markets of India and U.S. will never be consolidated. The world is, perhaps, becoming fl atter, but it is a long way from being fl at.
The GDPs of China, India, and other developing nations are growing, and the developed nation-centric global economic structure appears to be changing. At the same time, income levels in developing nations are rising. Will they catch up to the developed nations? If they do, then the world will truly be fl at. In Fig. 3.4 , we note that, at least through 2030, the developed-versus-developing picture will remain unchanged. In this section, we focus on changes to per capita GDP and identify two distinct groups: the developed nations of North America, Western Europe, Japan, and the NIEs (South Korea, Taiwan, Singapore, and Hong Kong); and the develop-ing nations of China, India, Latin America, Eastern Europe/Eurasia, the Middle East, and Africa. By 2030, the per capita GDP of Latin America will be approxi-mately $30,000, and that of China will rise to about $20,000. These are in nominal terms. When we consider infl ation, these levels will still not equal those of the developed nations.
While such differences between developed and developing nations will prevail, developing nations will have a greater economic presence. From the perspective of Japanese corporations, the global strategy till date has entailed expansion in western nations with economic environments similar to Japan’s. Having achieved that goal, companies then expanded into lower-ranked developing economies,
0
10
20
30
40
50
60
70
80
90
1980 1990 2000 2010 2020 2030
Japan NIES ASEAN China
India W. Europe EE+Eurasia N. America
S. America ME, Africa
Fig. 3.4 Changes in per capita GDP
3 Changes in the Global Economic Environment

49
although on a smaller scale. In the future, however, companies must aim their strategic focus on developing countries, particularly newly developed countries experiencing high growth.
A brief comment on the trend in Japan’s per capita GDP: until 2010, Japan’s per capita GDP was as high as that of the U.S., but by 2030 this gap is expected to increase, and Japan’s per capita GDP will be in a par with those of Western Europe and the NIEs. Japan’s relative decline among the developed nations is due to its aging population. The working-age population will decline as a percentage of the overall population, and this will bring down the per capita productivity. In addition, the aging society will lead to a decline in the savings rate, along with a deceleration in the rate of capital accumulation as equipment investment contracts. Japan’s elderly (those 65 and older) in 2010 comprised just under 40 % of the population. This will increase to more than 50 % by 2020, and almost 60 % by 2030. Population aging is seen in all developed nations, although the ratio of the elderly in the popula-tions of Europe, North America, and the NIEs will all average around 40 %. Thus, the aging rate in Japan is extraordinarily high even among developed nations and, accordingly, GDP growth will be slower in Japan than in other countries.
3.4 Competitiveness Rankings: IMD’s World Competitiveness Yearbook
Countries’ economic growth rates are infl uenced by many factors, such as innovation and type of economic infrastructure, as well as capital stock, population, and other elements of production. Where should a company develop its business globally? Companies must carefully survey both the current circumstances and future outlook of the economic environment of candidate countries. When doing so, a valuable resource is the World Competitiveness Yearbook , published by IMD, an international manage-ment development center and business school located in Lausanne, Switzerland.
IMD gathers as many indices related to international competitiveness as possible for compilation in the World Competitiveness Yearbook , which it has published since 1989. The Global Competitiveness Index , published by the World Economic Forum (WEF) of Davos fame, is a similar index. This group worked with IMD until 1995, after which it published its own index.
These reports gather enormous amounts of data from countries worldwide related to national economic competitiveness, and then rank countries using weighted aver-ages of these data. Incidentally, Japan’s recent rankings are 24th of 60 in the IMD index ( 2013 ), and 10th of 144 in the WEF index ( 2012 ). These rankings greatly differ in their method of calculation and the factors used, although the IMD’s rank-ings get the most attention. The IMD index is older, and the 248 factors that form the basis of the overall rankings and far outnumber those used by the WEF (111). The IMD index ranked Japan as number one for 4 years in a row from 1989, the year of the index’s inception, to 1993. However, in the latter half of the 1990s, Japan quickly fell in the rankings, and continues to struggle. We shall offer an explanation of the IMD indices before considering the appropriateness of its assessment.
3.4 Competitiveness Rankings: IMD’s World Competitiveness Yearbook

50
The IMD’s competitiveness rankings consolidate various types of statistical data, such as GDP, technology research and investment, workers’ compensation levels, and fi nancial market size, in addition to qualitative assessments based on question-naire responses provided by 4,200 corporate managers throughout the world. In addition to an overall ranking, countries are also ranked in various hierarchical cat-egories (Table 3.1 ). Major categories consist of four factors: economic performance, government effi ciency, business effi ciency, and infrastructure. These major factors are further broken down into subfactors. As can be seen from the content of the major factors, IMD’s philosophy of international competitiveness is to examine the effi ciency of both public and private sectors in achieving economic performance, which is an output index. Moreover, the conditions of both hard and soft infrastruc-ture that support economic activity on a nationwide basis are included. Thus, there is a mixture of both input and output indices, with the overall index being calculated as a weighted average of the various scores assigned to the abovementioned data.
The IMD’s philosophy of international competitiveness was infl uenced by Michael Porter’s Competitive Advantage of Nations . In this book, Porter explains the diamond model that consists of four components of production: human resources and technology, corporate strategy, demand conditions for product markets, and related industries (Porter 1990 ). In addition, Porter correlates these components and emphasizes on the impor-tance of understanding them in the context of an overall system. Among the subfactors relating to business effi ciency, the IMD’s competitiveness index primarily uses items related to Porter’s framework, such as indices related to productivity, indices related to such production resources as labor markets and capital markets, and indices critical to business strategy, such as customer satisfaction. Moreover, technology, which is of increasing importance in terms of productivity, are dealt with as infrastructure.
In addition to economic indices directly related to the abovementioned corporate activities, the IMD’s index is distinctive for also considering effi ciency in the public arena and social policies related to the people’s quality of life. For example, in the fi eld of economics, it has been shown that the level of political risk and transparency in government policymaking are related to a country’s growth. Moreover, securing public healthcare services and the safety of citizens has the effect of increasing a country’s attractiveness, thereby stimulating the entry of overseas businesses. However, these factors have an indirect impact on economic performance. While, perhaps, appropriate for comparing developed countries with developing countries, where large gaps exist in the level of social infrastructure, it is diffi cult to compare two developed nations that are at almost the same level. Furthermore, as with “adaptability in response to change” and “propensity toward social uniformity,” in a sense, some of these variables enter into the realm of national identity and values, and their relationship with international competitiveness is unclear.
Another issue with the IMD rankings is that they are based on questionnaires given to corporate managers. In the overall index, the ratio of hard data based on statistics to opinion data is said be about 2:1. In assessing the various subfactors for each country, it is possible that some global managers may not very well understand Japan’s situation. In that case, global public opinion may infl uence the assessments. The stagnation of the Japanese economy since 1990 is a well-known fact, but the
3 Changes in the Global Economic Environment

51
Tab
le 3
.1
IMD
Wor
ld C
ompe
titi
vene
ss Y
earb
ook
indi
ces
Com
posi
te
inde
x E
cono
mic
pe
rfor
man
ce
Dom
estic
eco
nom
y G
DP,
GD
P gr
owth
, per
cap
ita G
DP,
eco
nom
ic g
row
th f
orec
ast,
etc.
Inte
rnat
iona
l tra
de
Bal
ance
of
paym
ents
, tra
de b
alan
ce, t
rade
to G
DP
ratio
, etc
.
Inte
rnat
iona
l inv
estm
ent
Dir
ect i
nves
tmen
t fl o
ws
abro
ad, d
irec
t inv
estm
ent fl
ow
s in
war
d, p
ortf
olio
in
vest
men
t, et
c.
Em
ploy
men
t E
mpl
oym
ent,
empl
oym
ent g
row
th, u
nem
ploy
men
t rat
e, e
tc.
Pric
es
Con
sum
er p
rice
infl a
tion,
pur
chas
ing
pow
er p
arity
, apa
rtm
ent a
nd o
ffi c
e re
nts,
etc
.
Gov
ernm
ent
effi c
ienc
y Pu
blic
fi na
nce
Fisc
al s
urpl
us (
defi c
it), f
orei
gn c
urre
ncy
rese
rves
, pub
lic fi
nanc
e m
anag
emen
t, et
c.
Fisc
al p
olic
y Ta
x re
venu
es c
olle
cted
, per
sona
l inc
ome
tax
rate
, cor
pora
te ta
x ra
te, s
ocia
l sec
urity
co
ntri
butio
n ra
te, e
tc.
Inst
itutio
nal f
ram
ewor
k C
entr
al b
ank
polic
y, a
dapt
abili
ty o
f go
vern
men
t pol
icy,
bri
bery
and
cor
rupt
ion,
etc
.
Bus
ines
s le
gisl
atio
n Ta
riff
s, f
orei
gn in
vest
ors,
com
petit
ion
legi
slat
ion,
cre
atio
n of
fi rm
s, la
bor
regu
latio
ns, e
tc.
Soci
etal
fra
mew
ork
Ris
k of
pol
itica
l ins
tabi
lity,
pri
vate
pro
pert
y ri
ghts
, Gin
i coe
ffi c
ient
, gen
der
ineq
ualit
y, e
tc.
Bus
ines
s ef
fi cie
ncy
Prod
uctiv
ity a
nd e
ffi c
ienc
y L
abor
pro
duct
ivity
leve
ls a
nd g
row
th, p
rodu
ctiv
ity b
y in
dust
rial
sec
tor,
etc.
Lab
or m
arke
ts
Com
pens
atio
n le
vels
, wor
ker
mot
ivat
ion,
em
ploy
ee tr
aini
ng, s
kille
d la
bor,
etc.
Fina
ncia
l mar
kets
V
entu
re c
apita
l, st
ock
mar
kets
, fi n
anci
al in
stitu
tiona
l tra
nspa
renc
y, e
tc.
Man
agem
ent p
ract
ices
A
dapt
abili
ty to
cha
nge,
cor
pora
te g
over
nanc
e, c
usto
mer
sat
isfa
ctio
n,
entr
epre
neur
ship
, etc
.
Atti
tude
s an
d va
lues
A
ttitu
des
tow
ard
glob
aliz
atio
n, fl
exib
ility
, val
ue s
yste
m, e
tc.
Infr
astr
uctu
re
Bas
ic in
fras
truc
ture
Po
pula
tion,
tran
spor
tatio
n sy
stem
s, lo
gist
ics
man
agem
ent,
ener
gy c
osts
, etc
.
Tech
nolo
gica
l inf
rast
ruct
ure
Mob
ile p
hone
dis
sem
inat
ion,
inte
rnet
use
rs, h
igh-
tech
exp
orts
, etc
.
Scie
ntifi
c in
fras
truc
ture
To
tal e
xpen
ditu
re o
n R
&D
to G
DP,
num
ber
of R
&D
per
sonn
el, n
umbe
r of
pat
ent
gran
ts, n
umbe
r of
Nob
el p
rize
win
ners
, etc
.
Hea
lth a
nd e
nvir
onm
ent
Hea
lth in
fras
truc
ture
, lev
el o
f re
cycl
ing,
CO
2 em
issi
ons,
env
iron
men
tal r
egul
atio
ns, e
tc.
Edu
catio
n R
atio
of
educ
atio
n ex
pend
iture
s to
GD
P, h
ighe
r ed
ucat
ion
achi
evem
ent,
Eng
lish
profi
cie
ncy–
TO
EFL
sco
res,
illit
erac
y ra
te, e
tc.
Sour
ce : C
ompi
led
by th
e au
thor
fro
m th
e IM
D W
orld
Com
peti
tive
ness
Yea
rboo
k
3.4 Competitiveness Rankings: IMD’s World Competitiveness Yearbook

52
global opinion on Japanese economy is becoming harsher. These indices already incorporate factors related to economic performance, but it is possible that a down-ward bias exists due to opinion surveys that are increasingly critical of the Japanese government and Japanese corporations.
However, when it comes to the breadth of factors related to international com-petitiveness, the IMD world competitiveness index is signifi cant in that it gathers comprehensive data that enables international comparisons. These include many important factors used in various discussions on international competitiveness. Recently, the IMD began offering downloads of prior years’ data via the Internet, a valuable service that opens up their database on competitiveness. Data aggregation methods infl uence the rankings in the composite index, but the data is very useful for examining the rankings by factor in detail.
Japan’s overall ranking in the 2013 IMD world competitiveness index is 24th of 60 countries. Is this an appropriate ranking? Let us assess the validity of this ranking by comparing Japan, the U.S. (composite ranking of 1), and China (21). Table 3.2
Table 3.2 Rankings of Japan, the U.S., and China (2013)
Japan U.S. China
Composite ranking 24 1 21
Economic performance
Domestic economy 5 1 3
International trade 56 9 20
International investment 16 1 8
Employment 12 22 1
Prices 53 6 42
Government effi ciency
Public fi nance 60 55 14
Fiscal policy 37 26 55
Institutional framework 17 11 13
Business effi ciency
Business legislation 29 12 55
Societal framework 24 22 44
Productivity and effi ciency 28 5 31
Labor markets 39 18 3
Financial markets 13 1 32
Management practices 18 13 40
Attitudes and values 35 15 30
Infrastructure
Basic infrastructure 27 6 8
Technological infrastructure 21 2 20
Scientifi c infrastructure 2 1 8
Health and environment 8 19 54
Education 28 18 45
Source : Compiled by the author from the IMD World Competitiveness Yearbook
3 Changes in the Global Economic Environment

53
shows the rankings of these three countries by factor. Rankings where Japan appears in the top 10 are “domestic economy,” “scientifi c infrastructure,” and “health and environment.” On the other hand, in some areas, Japan ranks below 50 (i.e., in the bottom 10), namely, “international trade,” “prices,” and “public fi nance.”
The score for “domestic economy” is heavily weighted toward the size of a coun-try’s GDP or economy. Accordingly, countries with large economies are at an advantage. Japan, the U.S., and China are the top three countries in terms of GDP, and the U.S. and China are therefore ranked 1st and 3rd, respectively. The size of a country’s economy illustrates the size of its domestic market, so a larger economy is a good thing for that country’s companies. “Scientifi c infrastructure” is the ratio of R&D spending to GDP, as well as the number of scientifi c papers and patents generated by a country. When considering a country’s competitiveness, this can be thought of as an indicator of a country’s level of innovation. Along with Japan, the U.S. and China both rank highly in this area. “Health and environment” is a mixture of indices, such as average life expectancy, level of public health, carbon dioxide emissions, renewable energy, and energy effi ciency. While these have no direct rela-tionship to economic growth, they do indicate improvements in the quality of life, something that cannot be measured by economic indicators. In regard to this factor, China signifi cantly falls in the rankings.
Japan’s ranking in “international trade” is low. This index is calculated using the balance of trade and ratio of imports and exports to GDP. In contrast to the domestic economy index, countries with large economies are less reliant on trade, so large countries tend to fall in the rankings. However, when direct investment leads to the establishment of overseas bases, an alternative effect on trade emerges; thus, this factor must be viewed in conjunction with the next one, “international investment.” In this area, Japan ranks 16th, because while Japan’s level of direct investment abroad is high, the level of internal direct investment brings the country down in the rankings. At the same time, the U.S. makes strong international investments both internally and externally, and is ranked 1st in this area. Despite the absence of infl a-tion, Japan’s low ranking in “prices” is due to its persistently high price levels from a global perspective. Finally, in regard to “public fi nance,” Japan continues to run a fi scal defi cit, much like the U.S. In contrast, China has no glaring issues regarding its fi nances. Even apart from this, the Japanese government is given low marks overall in areas such as “fi scal policy” and “institutional framework.”
As we examine factors related to business effi ciency, we see that the U.S. is ahead, followed by Japan, and then China. Japan, in particular, trails the U.S. in such areas as “business legislation,” “productivity and effi ciency,” and “fi nancial markets.” For its part, China lags Japan in “business legislation,” “societal frame-work,” and “fi nancial markets.” China is 3rd in “labor market.” This indicator is derived from labor costs, labor-relations, and the quantity and quality of labor. China’s labor costs and quantity are such that it has a high ranking.
Lastly there are the indices related to infrastructure. The gap between Japan and the U.S. is large especially in “basic infrastructure” and “technological infrastruc-ture.” “Basic infrastructure” comprises a number of items, such as land area, trans-portation and energy infrastructure, and the working-age population. “Technological
3.4 Competitiveness Rankings: IMD’s World Competitiveness Yearbook
54
infrastructure” refers to the level of dissemination of telecommunications and broadband networks, as well as human elements, such as IT skills and the number of qualifi ed engineers. Japan’s aging society lowers its ranking in basic infrastruc-ture, which cannot be helped. However, it does seem rather strange that Japan’s technological infrastructure lags that of the U.S. and is at about the same level as China’s. A closer examination shows that Japan’s ranking is lowered by its ratio of investment in telecommunications costs and infrastructure to GDP.
In summary, the factors that raise Japan’s competitiveness ranking are as follows.
• A high per capita GDP and a domestic market with a large population • The country’s science and technology-related activities, as seen by R&D and
patents • High energy effi ciency and an environmentally conscious economic system • Health and longevity, and a safe and secure living environment
However, the following factors are among those that bring down Japan’s ranking.
• Inaction on fi scal defi cits and government ineffi ciency • An aging society and slowdown of economic activity • A high cost structure
As we have seen this far, the IMD World Competitiveness Yearbook uses a broad range of indices, and one cannot help but get the sense that it is a hodge-podge of data. However, this shows that international competitiveness is a multi-faceted con-cept, and these various factors intermix in a complex fashion. In addition, the IMD includes factors that have no direct relationship with economic activities, such as environmental aspects and public safety. Some concepts expand upon the traditional idea of GDP, such as green GDP, which incorporates depletion of natural resources in conjunction with economic activity, or Gross National Happiness (GNH), which measures the overall happiness of a nation’s people. The IMD index can also be thought of as extending beyond mere economic performance to encompass environ-mental and social value aspects.
3.5 Summary
In this chapter, we discussed key macro environmental aspects of the world econ-omy as we considered global business strategy. In 1990, developed countries’ econ-omies, led by Japan, the U.S., and Europe, comprised more than 80 % of the world’s GDP. However, this share has gradually declined, and it is predicted to fall to about 40 % by 2030. To date, the activities of multinational corporations have focused on developed nations, although the importance of newly industrializing countries such as China and India is continuing to grow. Small developing countries, with
3 Changes in the Global Economic Environment

55
relatively small amounts of per capita capital accumulation, will have higher GDP growth than developed countries. The per capita GDP (or income levels) will also increase at a faster rate than in the developed countries, although we note that, when we examine the timeline through 2030, the overall picture of developed versus developing nations’ income levels does not change. In other words, the economies of developing nations will grow, but “economic distance,” explained in the previous chapter, will remain.
Moreover, other distances in global business, particular cultural and administra-tive distances, are unlikely to decrease rapidly. Developing countries without mature capitalist economies have institutional characteristics that vary by country. These developing countries have a much smaller international fl ow of people compared with developed nations, so cultural distances are unlikely to be affected by global-ization. In other words, developing countries require global strategies that are adapted to each country. Furthermore, it must be kept in mind that the large coun-tries of China and India have CAGE (cultural, administrative, geographic, eco-nomic) distances internally as well. These countries have vast disparities in their per capita income levels. In India, the administrative framework varies by state, and regional languages are spoken alongside English and Hindi. To be sure, the major trend is to steer toward global strategies that target newly industrializing countries, but creating specifi c global strategies will require suffi cient awareness of the diver-sity among the newly industrializing countries.
Open Access This chapter is distributed under the terms of the Creative Commons Attribution Noncommercial License, which permits any noncommercial use, distribution, and reproduction in any medium, provided the original author(s) and source are credited.
References
Acemoglu, D., Johnson, S., & Robinson, J. A. (2001). The colonial origins of comparative devel-opment: An empirical investigation. American Economic Review, 91 , 1369–1401.
Barro, R. J., & Sala-i-Martin, X. I. (2003). Economic growth . Cambridge: MIT Press. Grossman and Helpman. (1993). Innovation and Growth in the Global Economy . Cambridge: MIT
Press. IMD. (2013). World competitiveness yearbook . Lausanne: IMD. Motohashi, K. (2014). The sun rises Again: Revitalization of Japan’s industrial competitiveness
(Hi ha mata takaku, Sangyo Kyosoryoku no Saisei). Tokyo: Nikkei Publishing Ltd. (in Japanese).
Porter, M. (1990). Competitive advantage of nations . New York: Free Press. World Bank. (1993). East Asia miracle: Economic growth and public policy . Washington, DC: The
World Bank. World Economic Forum. (2012). WEF index 2012 . Geneva: World Economic Forum.
References

57© The Author(s) 2015K. Motohashi, Global Business Strategy, Springer Texts in Business and Economics, DOI 10.1007/978-4-431-55468-4_4
4 Comparison of Economic Institutions in China and India
4.1 Introduction
Global business strategies must conform to business environments in target coun-tries and regions. As repeatedly expressed herein, while the world is becoming fl at-ter, there still are signifi cant barriers in the form of national borders. Chapter 2 discussed ideas and strategies to understand the differences in business environ-ments because of these barriers. According to the CAGE distance framework, the differences in business environments due to national borders are wide-ranging and consist of cultural, administrative, geographical, and economic factors. These dif-ferences may be observed in the languages, religions, economic systems, and living standards present in each country. This chapter discusses a more fundamental prin-ciple of “institutional theory” in the context of differing business environments between nations, and examines its relationship to global strategy.
The 1993 Nobel laureate in economics, Douglas North, developed a theory that countries not only have codifi ed “formal” institutions such as laws, but also have just as important and implicitly presented “informal” institutions such as the code of conduct and practices. North expounded on the relationship of these institutions to economic performance (North 1990 ). Among economic theories based on market transactions, such as product and labor markets, the fi eld of “institutional econom-ics” as developed by North, which studies the relationship between economic activi-ties and informal constraints such as the code of conduct and practices, continues to be researched.
The behaviors of corporations and individuals within an economic society do not necessarily abide by the formal institutions, but they are often determined by infor-mal restraints such as taboos and customs. This tendency is particularly apparent in developing nations such as China and India because these nations have been slow to enact various rules regarding economic transactions (corporate law, contract law for private transactions, property law including intellectual property, etc.). Even when laws have been codifi ed, the enforcement of these rules has often been insuffi cient.

58
For example, China has made three major revisions to its patent laws since their enactment in 1985, and intellectual property institutions are being strengthened because of calls for “indigenous innovation.” However, the state of intellectual property protection in China is far removed from the country’s tough patent system. China also implemented antimonopoly laws in 2008. However, its enforcement makes it appear like the objective is to protect domestic industry and limit foreign corporations.
It would appear that these countries are conforming to global standards by inte-grating modern legal structures from foreign countries and codifying them into rules; however, because the inertia of informal rules of economic transaction prac-tices and societal behaviors is so strong, the enforcement of rules are quite literally all over the map. With the help of the WTO and regional economic partnership agreements, an international alignment according to formal economic rules is shap-ing. However, informal rules such as country-specifi c societal norms and customs do not change easily, and some doubt the hypothesis of converging into one global system. A concept often used within institutional economics is that of “path depen-dency.” The thinking goes that because practices and rules for economic transac-tions are formed during a country’s process of achieving economic development—a process that is determined by differing historical backgrounds and economic devel-opments depending on a country—there exists several equilibriums. For example, some countries drive cars on the right side of the road, whereas others drive on the left. There are various theories as to why this difference exists; one of them is that the position of doors in horse-drawn carriages differed in England and France, but whatever the case, there is some historical background for this phenomenon. However, once a practice like this is set, it is extremely expensive to change and things remain in a state with several equilibriums. Incidentally, there is a fi eld of study called “comparative (or historical) institutional analysis” that uses game the-ory to model path dependency and a state of multiple equilibriums to explain differ-ences in institutions among countries (Aoki 2010 ; Grief 2006 ).
Institutions in various countries, including informal institutions, can be charac-terized as game rules for conducting economic activities. An examination of global business strategy cannot be engaged in without an understanding of these game rules. In Chap. 2 , we discussed the state of global strategy considering primarily codifi ed formal institutions. In this chapter, we progress one step further and con-sider the impact of institutions in economic society, including unwritten rules, on global strategy. Chapter 1 featured a company in an industrial park in Shanghai’s Jiading district that was suddenly ordered by the government administration to exit the park. Codifi ed rules granted contractual authority to companies within this industrial park to use the property for a specifi c length of time. However, the deci-sion by the government administration can overturn this contract. These rules are not explicitly codifi ed, but they nonetheless exist. Property rights in many regions of India are vague, and when discussions with local farmers in Tata Motor’s appro-priation of land in West Bengal did not go well, Tata made the decision to pull out of its planned factory construction.
4 Comparison of Economic Institutions in China and India

59
Once events like these occur, they become diffi cult to solve. Thus, it is important to increase our understanding of institutions, including their informal rules in coun-tries, where a corporation is expanding, to understand possible strategies to avoid risk, or at least to keep losses from risks to a minimum. In this chapter, we compare and contrast China and India as we consider the relationship between economic societal institutions and global business. First, we examine foreign investment pol-icy differences between the two countries. We then explicate institutional differ-ences that arise because of the differences in each country’s political and economic systems. Further, we examine views on global strategy on the basis of the institu-tional differences in India and China. In doing so, we also explain risk management as it applies to global business.
4.2 Comparative Institutional Analysis of China and India
4.2.1 Overview
The People’s Republic of China was established in 1949 as a communist country under the leadership of Mao Tse-tung. Under the patronage of the then Soviet Union, a socialist state was created, but the Cultural Revolution, which lasted from 1966 to 1976, caused great turmoil. With the death of Mao Tse-tung in 1976, Deng Xiaoping took over the country’s leadership, and in 1978, began implementing a policy of reform and opening up the nation that started the nation’s economic devel-opment. Deng Xiaoping’s economic policies enabled economic development by attracting foreign corporations, and in the 1990s, China implemented full-scale policies to further open the country’s economy. As a result, direct foreign invest-ment in China skyrocketed, and the number of Japanese companies investing in China grew rapidly. Currently, China is known as the “factory of the world,” and consumers throughout the world cannot live without Chinese-made products. Since the 1990s, China’s economic growth has consistently been at a high level of around 10 %, and as we have seen in Chap. 1 , the country’s economy has surpassed Japan, making China an economic giant second only to the US.
On the other hand, the Republic of India gained independence from the British Empire in 1947, at which time it was established as a social democracy headed by Jawaharlal Nehru, who served as the country’s fi rst prime minister. Each state in India has an independent economic system, and taxes and regulations are extraordinarily complex. In 1980, the regulations were relaxed to allow partial participation of foreign capital, but the impact of that relaxation was very limited compared with China. Because of the lack of basic infrastructure such as roads and electricity, India has many handicaps as a manufacturing base. Yet, recently, the rapid growth of the IT service industry, pri-marily in software development and business process outsourcing (BPO), has greatly changed India’s image internationally. While China is the “factory of the world,” India is the “world’s software developer.” The size of the Indian economy in terms of GDP is
4.2 Comparative Institutional Analysis of China and India

60
still small, at about one-third the size of Japan’s, but recent growth has been remarkable, and the country is predicted to be a giant market in the future.
Figure 4.1 shows the per capita GDP trends for China and India. The per capita GDP was about the same for both countries until 1990, but after that time, China’s growth began to outstrip that of India. As of 2010, the per capita GDP was USD$4,400 for China versus India’s USD$1,300, showing a huge gap. The source of this gap is thought to be the difference in policies for attracting foreign capital.
As shown in Fig. 4.2 , direct foreign investment in China has been on an increas-ing trend since the 1990s. In contrast, for the most part, India had no visible direct foreign investment until about 2005, and only began to grow from 2006. Foreign investment growth in both countries declined in 2009 because of the fi nancial crisis brought on by the Lehman Brothers’ bankruptcy, but the cumulative total invest-ment to date is still overwhelmingly large in China. Deng Xiaoping, who directed policies to open up China to the outside world, visited Wuhan, Shenzhen, Zhuhai, Shanghai, and other southern Chinese cities in 1992, personally witnessing the eco-nomic development of this economic zone made possible through the allowance of foreign investment, and confi rmed the effect of an economic development model relying on attracting foreign capital. As a result, in his “southern tour speech,” Deng declared his intent to expand the reform that attracted foreign capital—which up to that point was restricted to certain regions —all over China. As a result, investments in China by foreign fi rms began in earnest.
Another turning point for direct investment in China came with their WTO mem-bership in 2001. Until the 1990s, foreign investment in China was made at the
0
500
1000
1500
2000
2500
3000
3500
4000
4500
1980
1982
1984
1986
1988
1990
1992
1994
1996
1998
2000
2002
2004
2006
2008
2010
China India
Fig. 4.1 Per capita GDP of China and India ( Source : United Nations Statistics Division data)
4 Comparison of Economic Institutions in China and India

61
request of the Chinese government authorities. However, China’s WTO member-ship sent a message that the Chinese government would create an environment for investment that accorded with international rules, thereby reducing investment risks for foreign fi rms. In addition, the WTO membership paved way for deregulation such as the gradual elimination of foreign capital regulations in service industries like fi nance and distribution, which had a tremendous impact on direct investment.
The Indian economic policy, on the other hand, still has marked remnants of protectionism for domestic industries, and investment risk is still a signifi cant issue for foreign fi rms. When India gained its independence in 1947, Prime Minister Nehru implemented the concept of planned economy from the then Soviet Union, controlling the domestic economic activities through various regulations. These regulations were not only for foreign transactions but also for domestic operations, and the phrase “License Raj” (“Raj” is a term that means “rule” or “reign,” and was used during the period of British colonial rule) became a cynical phrase implying that Indian people were ruled by licenses rather than the British. The situation has signifi cantly improved since then, but there are still many signifi cant barriers to investment, such as labor laws to protect workers, business registrations, and a com-plex tax code. In addition, manufacturers are impacted by the lack of infrastructure such as roads and railways. On the fl ipside, IT services and software, which are not as affected by the lack of physical infrastructure, have seen a tremendous amount of investment, primarily from European and US fi rms. That said, India created special economic zones in 2005, developed industrial parks, and worked to lure foreign capital to its manufacturing industries. In addition, the government began relaxing foreign investment regulations since the early 2000s, resulting in direct domestic investment growing rapidly since 2006 (Table 4.1 ).
0
20000
40000
60000
80000
100000
120000
140000
160000
180000
200000
1990
1991
1992
1993
1994
1995
1996
1997
1998
1999
2000
2001
2002
2003
2004
2005
2006
2007
2008
2009
2010
China India
Fig. 4.2 Inward foreign direct investment of China and India (billions of dollars) ( Source : ADB Key Indicators for Asia and the Pacifi c 2011 (August 2011))
4.2 Comparative Institutional Analysis of China and India

62
Table 4.1 Major politics and economics events in China and India
India Year China
Bombay (Mumbai) Stock Exchange 1875
Independence from British 1947
1949 Country was formed
1959 15 million deaths due to starvation
1966 Start of Cultural Revolution
1976 End of Cultural Revolution
1978 Liberalization of economy, aggressive implementation of direct domestic investment
1979 Start of “One Child” policy
Deregulation policies focused on automotive industry
1980 Decision to create economic zones in Shenzhen, Zhuhai, Shangtou, and Xiamen
First fi nancial reform
Start of the “Contract Responsibility System”
1981
1982 Start of agriculture reforms; implementation of “Farmer Management Responsibility System”
Deregulation of consumer electronics and software sectors
1984
1985 Coastal cities opened to foreign investment; creation of economic technology development zones
1986 Implementation of Management Responsibility System to split ownership and management of state-owned enterprises
1989 Tiananmen Square incident
1990 Shanghai Stock Exchange open
Economic rebuilding and deregulation of foreign investment
1991
Gradual elimination of import licenses and lowering of tariff rates
Deregulation of foreign investment infl ow
Liberalization of foreign exchange 1992 Deng Xiaoping’s Southern Tour Speech; support for economic reforms and policies for accelerated economic growth
Reform of commerce bank system
Deregulation of interest rate system Decision on path toward “socialist market economy” National Stock Exchange established
Authorization for foreign investors to trade shares of publicly traded Indian companies
1993 Start of state-owned enterprise privatization
Removal of dual exchange rates
(continued)
4 Comparison of Economic Institutions in China and India

63
Table 4.1 (continued)
India Year China
National Stock Exchange (NSE) open 1994 Second fi nancial reform
Implementation of foreign exchange system reforms (offi cial RMB exchange rate devalued by 50 %, move to fl oating exchange rate system)
International trade surplus
WTO Membership 1995 Implementation of Commerce Bank Law
Complete liberalization of interest rates and disposal of bad bank debt
1997 Foreign banks to trade RMB (restricted to Shanghai’s Pudong region)
July: Return of Hong Kong
September: Full implementation of stock system for state-owned corporations
October: Tariff reductions from 23 to 17 % on more than 4,800 products
Liberalization of foreign stock investment regulations
1999 March: Acceptance of privately owned companies
November: Decision to develop western China
December: Return of Macao
Aggressive implementation of direct domestic investment
2000
Acceptance of foreign majority ownerships outside of banking insurance, telecommunications, and private aviation. Most industries allowed 100 % foreign ownership
2001 March: Beijing wins 2008 Olympics bid
December: WTO membership
2003 Authorization for foreign investors to trade shares of publicly traded Chinese companies
Creation of economic zones 2005
100 % foreign investment in real estate development allowed
Maximum percentage of foreign investment in fi nancial and telecommunications industry fi rms raised to 74 %
Foreign investment approval process greatly simplifi ed
2006 Start of foreign stock investment liberalization
Source : Various
4.2 Comparative Institutional Analysis of China and India

64
Japanese corporate investments into China and India are at USD$66.5 billion and USD$13.6 billion, respectively (till end of 2010), and investment in India is approaching to roughly one-fi fth of Japan’s investment in China. However, a closer examination reveals that Chinese investments cover a breadth of industries ranging from manufacturing industries such as automotive and electronics to retail and fi nancial services. Indian investment, on the other hand, is primarily in the automo-tive industry.
4.2.2 China: State-Led Strategic Foreign Investment Policies
Deng’s policies, which began in 1978, opened the country to trade and lifted the ban on direct investment from foreign countries. The following year the Joint Management Law (the Sino-Foreign Mutual Corporate Investment Law) was passed, creating institutional foundations for enticing foreign fi rms through the introduction of foreign capital, transfer of technology, and promotion of exports. In addition, in 1980, the Chinese government established four economic zones—Shenzhen, Zhuhai, Shantou, and Xiamen—to experiment with economic develop-ment models to attract foreign fi rms. The government developed infrastructure to lure foreign fi rms to these zones and implemented preferential policies such as tax breaks for these fi rms. In 1984, the country opened 14 coastal cities to foreign investment, including Shanghai, Tianjin, and Dalian, and in 1986, regional restric-tions on independent investments by foreign fi rms were lifted through the passage of the Foreign Enterprise Law. In 1988, almost all coastal regions became a part of the coastal economic liberalization zone through the government’s implementation of a coastal zone economic development strategy.
Market reforms accelerated as a result of Deng’s 1992 southern tour speech, and the investment of foreign capital into the country began in earnest. Between 1995 and 1997, the Chinese government began opening up domestic markets with the goal of acquiring WTO membership, and also started liberalizing trade by imple-menting measures such as reducing tariffs. In the latter half of the 1990s, China attracted foreign capital with abundant preferential policies and cheap labor as weapons, thereby establishing itself as the “factory of the world.” A plan to develop western China kicked off in 1999, and the opening up of China to foreign markets moved from coastal regions to the country’s interior. In 2001, China became a mem-ber of the WTO, and with further loosening of foreign capital restrictions in the service industries, China saw a dramatic rise in the amount of direct investment.
The methods of capitalization in China include independent foreign capitaliza-tion (wholly owned fi rms) and joint capitalization in the form of a joint venture with a Chinese fi rm. Until the 1990s, direct investment in China was often done at the request of local governments, and many of those investments were made as joint ventures with local fi rms. However, with China joining the WTO in 2001, the coun-try gradually eliminated restrictions on foreign capital. This relaxation applied not only to the manufacturing industry but also to service industries such as distribution and fi nance, with many industries freely able to decide whether to create a wholly
4 Comparison of Economic Institutions in China and India

65
owned subsidiary or joint venture. However, it is important to note that industries such as the automotive industry, which are viewed as strategically critical by the Chinese government, have their own rules. For example, in the automotive industry, foreign fi rms are not allowed to establish a wholly owned subsidiary, and are restricted to less than 50 % ownership in joint ventures.
In the 11th 5-year plan that began in 2006, the Chinese government clarifi ed its stance on the selection of investments by foreign fi rms and outlined its goal for becoming a “technology nation” with heightened competitiveness of Chinese fi rms. In January 2008, the government enacted a labor contract law that improved worker compensation, as well as a new corporate income tax law that eliminated preferen-tial income tax breaks on foreign fi rms. Currently, the Chinese government hopes to bring in high-tech companies and environmental fi rms that will contribute to the development of the country, rather than simple manufacturers and assemblers that have, to date, dominated China’s landscape. Given the reductions in preferential policies for foreign capital, the rise in labor costs, and a stronger Chinese currency, foreign fi rms are beginning to change their investment strategies in China. Some foreign fi rms are examining a setup of bases in nearby countries such as Vietnam to distribute their risk, in what is known as a “China Plus One” strategy.
4.2.3 India: The Steady Progress of a Democratic State
Deregulation in India began in 1980 when Indira Gandhi became the prime minister. The automotive and electronics sectors were pioneers in this deregulation. Suzuki used it as a chance to acquire a leg-up in the market, creating the Maruti Suzuki joint venture with the state-owned Maruti Udyog Limited. However, at the start of the 1980s, economic liberalization policies had not been fully put in place and, other than Suzuki in 1982, no other expansion into India’s passenger vehicle market by foreign fi rms was allowed. While Toyota, Mazda, Mitsubishi, and Nissan formed joint ventures and technological alliances in the commercial vehicle market in India, their results were poor and they were forced to exit the market.
In addition, deregulation in the 1980s was done in an extremely closed market, with extraordinarily strict regulations on trade. The tariffs were high and limits were placed on import volumes. All imports of consumer goods were forbidden; imports of capital goods, raw materials, and work-in-process goods were sometimes allowed, but import licenses were required for any goods that could be manufac-tured domestically.
In the latter half of the 1980s, India fell into budget defi cits and received assis-tance from the IMF and World Bank. From early 1990s, India worked to rebuild the country by implementing new economic policies. The country fi rst improved its trade system, aiming to liberalize trade by gradually abolishing import licenses and reducing tariffs. Further, authorization for direct foreign investment, while varying by industry, was granted automatically to a certain extent, and the time it took to obtain authorization shortened. It was in this period that DaimlerChrysler, GM, and Ford as well as Japanese automakers’ direct investment in India grew rapidly. At the
4.2 Comparative Institutional Analysis of China and India

66
same time, investors from foreign institutions were allowed to trade shares of public companies.
However, the Indian government did not begin its full-scale analysis to entice foreign capital until after the year 2000. India had a strong aversion to foreign capi-tal because of its days under the British colonial rule, and the deregulation of for-eign investment was only gradually accomplished. A major turning point in India on foreign capital regulation occurred in 2002 when the Indian government’s Department of Commerce changed the theretofore one-off approval system for direct investment into a “negative” system. In doing so, industries not on a govern-ment list were automatically granted investment approval. In addition, industries such as electric transmission, fi nancial services, and real estate were deregulated in 2005. The aggressive investment by foreign fi rms that occurred beginning in 2005 was because of policy measures that were put in place in India at that time.
Further, India enacted an Economic Zone Law in 2005, and as a result, hundreds of plans for construction are said to currently exist throughout the country. These economic zones have the aim of spurring exports and consist of many wholly owned subsidiaries of foreign concerns across a range of industries. The companies in the economic zones enjoy preferential treatment under the tax system. However, despite having received permission to do so, only a portion of the zones have undertaken construction, with many unable to establish construction plans because of local resistance.
4.2.4 Comparison of Political Systems
Both China and India began as countries during the latter half of the 1940s, and both countries modeled their economic policies on the planned economy of the Soviet Union that existed at the time. For different historical reasons, both countries had completely closed their doors to the outside world at the time of their independence: China due to international political tensions between east and west, and India due to its past as a British colony. While they started at similar places economically, the two countries’ political systems were completely different. China is, in reality, under one party rule of the Communist Party. On the other hand, India chose the path of democracy and elects its central and local government leaders by popular vote. This difference in political structures leads to very different investment envi-ronments from the perspective of foreign fi rms.
In comparing both countries, Tarun Khanna poses an interesting question, “Why can China build cities overnight, yet India can’t build a single road?” (Khanna 2007 ). This question captures the essence of institutional differences between China and India. Under the leadership of Deng Xiaoping in the 1990s, China aggressively pursued policies to open itself to foreigners. This was carefully done by fi rst exam-ining the results of experimental policies in certain regions, and then determining it to be the path to take for the entire nation. In addition, India dramatically reformed its trade system in the 1990s, gradually opening its doors to the outside world. However, this was done as a decision to rebuild after running budget defi cits, a
4 Comparison of Economic Institutions in China and India

67
decision that was forced upon them because of the fear of impending bankruptcy. In democratic India, the leaders of the nation cannot establish policies that went against the people’s will. One can easily imagine that because of its history as a British colony, the national sentiment was to oppose opening the country to foreigners. In these circumstances, a strong motive such as a national crisis was necessary to pro-mote the path to reform.
Let us examine the political systems of China and India in greater detail. The legislative body in China is called the National People’s Congress, comprised of members from provinces, autonomous prefectures, and directly controlled munici-palities who are elected by their respective People’s Congresses. People’s Congresses are organized for each local government organization below provinces—the cities and prefectures—and citizens may only participate in elections at the prefecture level and lower. However, many delegates are essentially recommended by local organizations of the Chinese Communist Party and are “elected” by the people through a vote of confi dence. These delegates themselves elect the National People’s Congress members; therefore, it is unlikely that members who are critical of the Communist Party will ever be elected. The National People’s Congress not only fulfi lls its responsibility as a lawmaking organ but also acts as a supreme authority, even in areas of administration, judiciary, and prosecution. The National People’s Congress is made up of roughly 3,000 members from across China, even though important policy decisions for the country are essentially made by the Communist Party’s Central Committee, which had nine members as of September 2012. While these nine are ranked, decisions are made by a majority vote. The top ranking mem-ber is the head of state. Personnel decisions such as the heads of local administrative organizations in provinces and directly controlled municipalities are also essentially appointed by the Communist Party, making China a state run by one organization: the Communist Party.
On the other hand, India is a democracy much like Japan. India has many politi-cal parties, with candidates from each party competing for seats in the national parliament (bicameral parliament, consisting of upper and lower houses). It is dif-fi cult for one party to gain a majority, so coalitions are the norm, with a prime min-ister selected from among the representatives. In the 2009 general election of the Lok Sabha, or lower house, the United Progressive Alliance (UPA), India’s largest party and a coalition led by the Indian National Congress, became the ruling party. The minority coalition is the National Democratic Alliance, with the Bharatiya Janata Party, or BJP, at its core. In general, the Indian National Congress takes up liberal policies of economic reform, while the BJP favors conservative policies for domestic protectionism. However, as a farming nation, the opinions of the country’s farmers are important during election time, and domestic policies are always given priority over issues of foreign concern. With so many political parties, administer-ing a government is also diffi cult. Another factor making political decision-making in India diffi cult is that state governments, which also hold direct elections, wield strong infl uence in the administration of policy.
These differences in political structure are well expressed in Khanna’s observa-tion that “China can build cities overnight, but India cannot build even a single
4.2 Comparative Institutional Analysis of China and India

68
road.” Likewise, these differences are prevalent in the development of foreign investment policies implemented since the 1990s. China implemented coherent policies with the aim of economic development through enticement of foreign fi rms. However, in India, things have not progressed as smoothly. Although India fi nally implemented policies favorable to foreign investment in earnest beginning in the 2000s, economic zone constructions have not moved forward as expected. This is because of the political power of landowner famers and the time taken to appropri-ate land. As the line “India cannot build even a single road” suggests, improvements on roads and railway infrastructures, in addition to the industrial parks, are not pro-gressing as planned, instead becoming a barrier to attracting foreign investment.
4.2.5 Comparison of Economic Systems
From the perspective of political structure, China is proceeding more smoothly in implementing policies for foreign investment and economic development. However, from the perspective of economic systems, particularly corporate activities and mar-ket mechanisms, India is superior. In his book, Tarun Khanna asked the question, “Why can large companies be created in China, with only a handful of them being competitive internationally?” India has companies such as Infosys that is hailed in the book “The World Is Flat,” and Tata Motors, a well-known manufacturer of pas-senger vehicles. In addition, Mittal, India’s steel manufacturer, merged with Europe’s Arcelor to become the world’s largest steel company.
China’s Communist Party created an economic system in which, pursuant to the construction of a socialist state, the state owns all assets and distributes these assets to the citizenry. Formerly, China had privately owned companies similar to the Tata Group, but they escaped to Taiwan, Hong Kong, and other locales when the People’s Republic of China was established. With the economic reforms of Deng Xiaoping starting in 1978, the country began integrating competition via market mechanisms into the domestic planned economy. The country did away with the system of wealth distribution through state-owned corporations that followed planned production activities, as well as price controls, implementing a system of free trade of goods in product markets. The reforms for state-owned corporations were put in place and many companies moved to become joint stock entities with limited shareholders or limited liability corporations. Figure 4.3 lists the changes in share of total value added by form of ownership among Chinese manufacturers (20,000–40,000 medium- and large-sized fi rms). The state-owned corporations commanded over 70 % share in 1995, but decreased to roughly 20 % in 2011. On the other hand, limited liability corporations (or joint stock companies) had the greatest share increase. The greatest change occurred in the period from the latter half of the 1990s to the fi rst half of the 2000s because of the reforms for state-owned companies that were put in place from 1998 to 2000 by then prime minister, Zhu Rongji. The aim of those reforms was to “grab the large and free the small,” i.e., the state would directly control large fi rms, whereas small fi rms would be converted to joint stock entities and its corporate activities liberalized. The State-Owned Assets Supervision
4 Comparison of Economic Institutions in China and India

69
and Administration Commission (SASAC) was created in 2003 to keep manage-ment of all state-owned enterprises in one place. However, companies that had been converted to joint stock fi rms often had the government or government personnel as major shareholders, so a large portion of the Chinese economy was still essentially under the control of national or local governments.
Until it was revised to allow for individual ownership of assets in 1999, making possible the creation of fully private fi rms, private companies were forbidden under the Chinese Constitution. It was possible to manage private businesses as entities called “individual companies,” but revisions to laws allowed for purely private man-agement of fi rms as companies. However, while the number of private companies in China is large, most are small businesses because everything in the business world in China happens with government involvement. For example, when funding from fi nancial institutions becomes necessary for a new venture, banks will prioritize funding to private corporations backed by the government for its perceived low risk. Under competitive circumstances, there should be banks that will take risks and invest in powerful private fi rms. However, most large banks are state-owned, with once again bringing the overall industry under the strict control of the state. Huawei Technologies is one of the few private Chinese companies that is internationally competitive. Founded in 1988 as a wholesaler of telecommunications equipment manufactured overseas, Huawei has become a truly global vendor with half of its
Fig. 4.3 Share of value added by type of ownership among Chinese manufacturers ( Source : Estimates compiled from China National Bureau of Statistics data)
4.2 Comparative Institutional Analysis of China and India

70
revenues from switches, cell phones, and other telecom equipment sold outside China. However, even Huawei had diffi culty raising capital when it was starting out.
The importance of government relations is not limited to raising capital. As observed in Fig. 4.3 , state-related businesses account for a great share of the Chinese economy. Accordingly, the counterparties to the private companies that operate in China are state-related businesses. In a B2C business model, sales channels are necessary to deliver a company’s products to consumers. Because deregulation in the distribution market, whether wholesale or retail, has been delayed, companies are forced to do business with companies having some connection with the govern-ment. Thus, the bureaucracy in China—and in its background, the Communist Party—has spread its net wide across economic activities, making it impossible to do business without touching its network.
However, India has an economy primarily driven by private companies. The core companies among these are multifaceted group companies such as the Tata, Reliance, and Birla Group. For example, the Tata Group began as a textile mill in Bombay (today’s Mumbai) in 1870, and continued to grow its operations after Indian independence. Among its group companies are Tata Motors, the third largest passenger vehicle maker in India, and Tata Consultancy Service (TCS), India’s larg-est IT services fi rm. Other group companies span a broad array of industries includ-ing power, steel, and wireless services. There are companies like Infosys, which started in 1981 with the equivalent of 30,000 yen in capital, and has grown to become one of the few world-class IT service company today that threatens the dominance of IBM. Unlike China, the Indian government was historically seen as something that got in the way of private business. Since the economic reforms of 1991, government organizations are said to have become more supportive of busi-ness activities (Capelli et al. 2011 ), although the situation is completely different from China, where government organizations are the primary drivers of business.
The greatest structural difference in Chinese and Indian companies is that those in China are built through their various relationships with government, whereas those in India are private companies that compete in the midst of market mecha-nisms. Of course, the maturity of product and fi nancial markets in India is nowhere near that of developed countries. The remnants from the era under the “License Raj” regulatory scheme, when activities were heavily bound, still exist in the complex systems for establishing and ending companies, taxes, and labor. In wholesale or other distribution industries, India has stricter regulations than even China and its infrastructure lags. Many government regulations mean that opportunities also increase for civil servants to exercise discretion at the local level, which is one rea-son briberies given to civil servants are rampant. However, the situation is quite different from China, where governmental decision-making at the national and local levels impacts every aspect of business.
The differences between these two countries are evident in the way risk is man-aged in running the national economy. In India, manufacturers, distributors, banks, and various other companies each assess risk and reward under the mechanism of a market economy, and then engage in business activities. Further, codifi ed rules such as corporate and labor laws as well as fi nancial market regulations are created with
4 Comparison of Economic Institutions in China and India

71
the intent to complement market mechanisms. The companies are able to engage in business, assuming that their counterparties and funding partners are going to act in accordance with the weighted risks and rewards. Trust in these market mechanisms exists as a code of conduct in Indian business.
In China, business owners do not take on all the risk themselves, rather the government shoulders a portion of that risk. In return, the state demands that the business act in alignment with bureaucratic objectives. The Communist Party man-ages the state, and advancement in the party hierarchy is said to be determined in provincial and municipal level “tournament games,” where economic growths at one local government is pitted against another (Xu 2011 ). This system led to local gov-ernments battling over one another to attract foreign fi rms, and as a result, it enabled China to maintain high economic growth rate to date on the basis of liberal policies. The policies themselves are not decided at the central government level, which simply sets a certain direction and leaves the rest to the discretion of heads of local govern-ments, so that they might compete more effectively. As such, it is imperative for com-panies to surmise the views of the local government when doing business in China.
Although China is implementing reforms such as state-owned enterprise reforms and the creation of corporate law to move toward a market-based economy utilizing market mechanisms, the behavior of economic entities in the country follows the informal rules of a socialist state. As a result, capital and fi nancial markets continue to be immature, making it diffi cult for companies that are internationally competi-tive to be formed. The 11th 5-year plan that began in 2006 has the creation of “indigenous innovation” as its key objective, which aims for new inventions that are internationally competitive to be home-grown, rather than be produced by import-ing technologies from the West or Japan as was done in the past. Local governments must now implement specifi c policies based on this vague goal. However, innova-tion is only a possibility through constant competition and ingenuity of individual companies. Thus, it will be diffi cult to obtain this goal if corporate managements run their organizations while gauging the local government’s mood and reaction as they have done so far. Therefore, there are few companies in China that can compete internationally, even though the country has large state-owned corporations.
4.3 Global Strategy Implications
4.3.1 Institutional Voids
The diffi culty of managing a global business in emerging countries arises because the local institutions in their respective economic systems are very different from those of the developed nations. As discussed in the previous section, China and India have great differences in their institutions. We stated that Indian institutions are built on the foundation of market mechanisms, but that the effectiveness of these mechanisms in the country is not even close to that of developed nations. On the other hand, China’s economic system is unique with the government’s direct involvement in every aspect of economic activity; however, it has more effi cient
4.3 Global Strategy Implications

72
markets than those in India, such as the product and labor markets. The institutional differences by country strongly correlate to the level of effi ciencies in diverse mar-kets such as product, capital, and labor markets. We term nonfunctioning market mechanisms as “institutional voids,” and introduce a methodology for analyzing global strategies on the basis of this term.
“Institutional voids” are economic institutions such as product, capital, or labor markets that have matured in developed nations, but have not reached a suffi cient level of maturity in emerging markets, thus creating a void (Khanna and Palpu 2010 ). These researchers defi ne the difference between emerging and developing countries by the degree of void. The emerging countries are countries like India and China that have immature economic institutions compared with developed nations, but have somewhat of an institutional foundation, thereby limiting the size of the void. On the other hand, developing countries are countries that do not have an institutional base, where the institutional void is so excessively large that companies accustomed to operating in developed nations with no institutional voids must use completely different business models to succeed there.
We use the above defi nition in our discussion of “emerging countries,” but must provide clarity into certain institutional voids. We have created four classifi cations of voids:
1. Voids in product markets 2. Voids in capital markets 3. Voids in labor markets 4. Macroenvironments related to institutions
First, we discuss the voids in product markets, which are determined by the fol-lowing two factors: the extent products and services can be purchased by consumers on the basis of correct information, and whether market thickness can be secured with suffi ciently functioning competitive markets containing many buyers and sell-ers. Thus, the effi ciency of sales channels of wholesalers and retailers as well as the state of logistics and infrastructures are related to this type of void. When compar-ing China and India on these points, China might be said to have relatively smaller voids (i.e., more effi cient). The restrictions on foreign capital in the distribution industry have been signifi cantly relaxed in China, resulting in companies such as Carrefour and Walmart entering the Chinese market. However, India still has strict regulations on that industry. China also has more advanced infrastructure, making logistics more effi cient.
In the case of voids in capital markets, India has smaller voids, thus more effi -cient markets. As noted above with regard to bank lending, in China, government organizations exert heavy-handed control over lending by fi nancial institutions. In stock markets, China’s publicly traded corporations have only a portion of their shares available to the market and often more than half are owned by government- related entities (i.e., nonpublic enterprises). As a result, the true state of a publicly traded company is unclear based on the available fi nancial information, making information asymmetry between companies and investors a big concern. On the
4 Comparison of Economic Institutions in China and India

73
other hand, India has had bank fi nancing and stock trading since its colonial era, and as such, issues like the ones observed in China are relatively small.
Third, we discuss the voids in labor markets. This type of void is determined by how effi ciently labor demand (corporations) is matched with supply (i.e., workers). On this point, the void in China is relatively smaller. India has extremely strict labor regulations, and it is practically impossible for corporations of a certain size to sack employees. In addition, unions are very active and there are many selection biases when hiring employees. Differences in language depending on the region and lack of women entering the workforce also negatively affect labor market effi ciency. China has relatively higher worker mobility, and while there are heightened sense of worker entitlement and stronger regulations protecting workers, these issues are small in comparison with India.
Finally, macro environments relating to institutions encompass many areas including foreign capital regulations, broadcasting regulations, and regulations on the activities of foreign fi rms. We briefl y discuss Chinese media regulations. The content of newspapers, magazines, and other forms of media in the country are checked stringently. It is possible now for individuals to publish their own informa-tion on the Internet in the form of blogs or similar formats, but cyber-cops keep a close watch on Internet discussions, and objectionable opinions are censored on a daily basis. However, these information regulations apply to politically sensitive content, so economic information such as corporate fi nancials and product informa-tion is not impacted as much, making the impact of this factor on China’s institu-tional voids minimal.
Having listed these voids, the global strategy based on Khanna’s “institutional voids” is to select one of the following, depending on the circumstances: (1) repli-cating domestic business or (2) adapting to the local environment. This is similar to the discussion of “aggregate” and “adapt” in the AAA framework discussed in Chap. 2 . The former should be selected to achieve economies of scale or to leverage a global brand; the latter should be selected when voids are too large and a strategy of replication is unrealistic.
In addition, we have discussed the model of using voids as business opportunities (the model that could be called “arbitration” in the AAA framework). As an exam-ple of this, the German retail fi rm Metro Group has a cash-wholesale business in India called “Metro Cash and Carry,” which provides a wealth of clues as to how to accomplish the goal of this model. Metro Group’s business exploits India’s institu-tional void of an ineffi cient distribution system. The business was started as a cash and carry service in Bangalore in 2003, and has since expanded throughout India. However, India has regulations on the trade of agricultural products (trade on these products within India must be conducted in government-authorized markets called “mandis”), making it impossible for Metro Group to deal in agricultural products. This law was created during the 1950s to protect farmers, but is currently an impedi-ment to improving agricultural distribution. Agricultural products in India must be fresh, but a large amount of product goes waste during distribution, and even the government acknowledges the need to revise the law. At present, movements are afoot in some states to do so, but they have met with opposition in multiple states,
4.3 Global Strategy Implications

74
especially from masses of individual businessmen who buy and sell under the sys-tem of mandis. Metro Group is working hard in appealing to both farmers and con-sumers that eliminating the law will be benefi cial for both. When institutional voids become business opportunities, local systems are established in response to such voids; however, these local systems can also become large barriers. Businesses must assess the viability of conducting business by understanding these types of risks, and must be prepared to make long-term investments for the success of that business.
In addition, businesses have strategically important options of whether to tackle institutional voids alone or jointly with a local business. As deduced from the Metro Group example, businesses do not necessarily need to embrace voids; rather, it can be effective to work with local fi rms in making a long-term investment to reduce local voids. Other companies have entered the cash and carry business in India, for example, Tesco in the UK announced its intentions of partnering with the Tata Group to join the market. From the perspective of foreign fi rms, China and India are full of institutional defects, but companies are doing business within the confi nes of these local institutions. If a company recognizes a defect it believes will be diffi cult to overcome independently, there is value in considering a partnership with a local fi rm before conceding defeat entirely.
4.3.2 Importance of Informal Institutions
Compared with advanced nations in which market mechanisms function effectively, “institutional voids” concept begins by clarifying the institutional problems that beset emerging nations. Accordingly, the institutional market is an important topic studied within institutional economics, though these studies only incorporate a por-tion of the framework and does not incorporate informal institutions such as social codes of conduct and practices. Refl ecting back on our comparison of the overall economic institutions including informal institutions in China and India, let us now consider their implications in terms of global strategy.
First, we must emphasize the necessity of strengthening our understanding of institutions, including informal rules such as codes of conduct and practices in cor-porate economic activities, in addition to explicit rules such as economic laws that are part of economic institutions in target countries. In particular, informal rules are structured over time in the process of economic development, and refl ect the histori-cal background and political systems of that country. Thus, they are a critical factor underlying economic activities. In this regard, the desire of the government is clearly refl ected in various aspects of corporate economic transactions in China. In contrast, market competition among private companies drives the rules of the game in India. However, in our discussion of “institutional voids,” India is fragmented by complex regulatory systems and markets from the aspect of market mechanism effi -ciency, and it indicated how far away these are from the level of advanced nations. In both China and India, reforms are underway for the creation of corporate law and regulatory systems, and both countries are working on economic systems based on
4 Comparison of Economic Institutions in China and India

75
global standards in accordance with the WTO rules. However, even if codifi ed laws and guidelines change, actual economic activity will not change very easily because of entrenched informal codes of conduct. Thus, the likelihood of failure will increase if a company bases its business decisions only on codifi ed rules.
Next, the relationship with the government is particularly important for busi-nesses in emerging markets. China has a unique economy in which political pro-cesses that determine national leadership take place in the Communist Party, and economic development objectives are achieved through a system of “elimination tournaments” at the local government level. However, a common fact among emerg-ing markets is that local government policies and decision-making have a signifi -cant impact on global business. India has many institutional voids, but industrial policies such as government regulations and regional revitalization rules are making actual economic activities possible by fi lling market mechanism voids. In emerging nations with slow development of the private sector, government is often the partner of businesses. For example, in the next chapter, we examine infrastructure busi-nesses such as railways and water; in these businesses, even though the end con-sumer is the general public, the government acts as an intermediary as a B2G2C business. As such, it is important to maintain good relationships with government organizations and build business models that can accomplish a win-win relation-ship. In addition to revitalizing regional economies, local governments enforce poli-cies with various goals such as providing stable living environments for citizens and improving the environment. It is important to consider business strategies that not only generate profi tability but also contribute to these government objectives, or in other words, contribute to the value proposition for the government. Finally, let us discuss risk management as it relates to global strategy for emerging nations posing high levels of uncertainty. Investment decisions for a global business must consider various risks such as local macroeconomic environments, exchange rates, and other economic risks; labor relations, procured parts quality, and other operational risks; and societal risks such as opposition to foreign fi rms. It is possible to deal with economic risks to a certain extent using fi nancial instruments such as futures trading and options. Most operational risks are caused by institutional voids, and JETRO and others have published examples of how best to deal with them (JETRO 2006 ). It is possible to forecast these risks to a certain extent, and few have great impact as to cause a cessation of business operations. The most important risk to consider under the global business strategy are risks of policy changes, as we have observed in the sudden order for a company to leave the industrial park in Shanghai’s Jiading district. The risk of political instability such as a coup de’état is also great, but unlikely in our emerging nation subjects of China and India (unlike developing nations with huge institutional voids). Election results in India can impact policy direction, and it can be characterized as a policy risk in the broad sense of the term.
So how should companies react in the face of policy risk? These risks exist because of sudden changes in government policy and the breadth of discretion given to governments in the administration of policy. Thus, understanding the direction and breadth of these changes is, in effect, risk management, specifi cally, it is to recognize the policy objectives and priorities of the national and local governments.
4.3 Global Strategy Implications

76
In China, central and local governments publicize policy decisions made at the vari-ous levels. In India, policies change depending on election results at the national and state levels. Gathering and analyzing this kind of intelligence is a necessity. Of the two countries, China carries higher risks because policy making is done by a select number of central and local leaders. On the other hand, it is easier to ascertain the general direction of the country in case of India because issues are visible in election results. However, in either case, building win-win relationships with local governments is critical, as already discussed. Local corporate social responsibility, or CSR, activities are effective responses to societal risks such as opposition to for-eign fi rms in India and anti-Japanese sentiments in China. In any case, companies must realize the necessity for long-term investments in the countries in which they conduct business.
Open Access This chapter is distributed under the terms of the Creative Commons Attribution Noncommercial License, which permits any noncommercial use, distribution, and reproduction in any medium, provided the original author(s) and source are credited.
References
Aoki, M. (2010). Toward comparative institutional analysis. Tokyo: NTT Publishing Ltd., July 2007 (in Japanese).
Capelli, P., Singh, H., Singh, J., & Useem, M. (2011). The India way: How India’s top business leaders are revolutionizing management . Boston: Harvard Business Press.
Grief, A. (2006). Family structure, institutions and growth: The origins and implications of Western corporations. American Economic Review, 96 (2), 308–312.
JETRO. (2006, July). Chugoku business no risk management . Tokyo: Japan External Trade Organization (JETRO) (in Japanese).
Khanna, T. (2007). Billions of Entrepreneurs: How China and India are reshaping their futures and yours . Boston: Harvard Business School Press.
Khanna, T., & Palpu K. G. (2010). Wining in emerging markets: A roadmap for strategy and execu-tion. Boston: Harvard Business School Press.
North, C. D. (1990). Institutions, institutional change and economic performance . Oxford: Oxford University Press.
Xu, C. (2011). The fundamental institutions of China’s reforms and development. Journal of Economic Literature, 49 (4), 1076–1151.
4 Comparison of Economic Institutions in China and India
77© The Author(s) 2015K. Motohashi, Global Business Strategy, Springer Texts in Business and Economics, DOI 10.1007/978-4-431-55468-4_5
5 New Business Model as Response to Competition from Emerging Economies
5.1 Emergence of Threats Associated with Rise of Emerging Economies
Low economic growth has been estimated for developed countries, including Japan, because of decreasing population growth rate, with no future prospects for large market expansion. On the other hand, the rise of economic growth in developing countries, such as China and India, provide great opportunities for Japanese compa-nies. However, a high rate of economic growth can be realized in developing coun-tries only by catching up technologically with developed countries, and establishing competitive local companies that adopt modern management techniques used in developed countries. Therefore, in addition to providing opportunities for Japanese companies, the growth of developing countries indicates the threat of new competi-tors in international markets.
In particular, companies are technologically catching up and the shift among the players in the international high-tech market is evident. This indicates a high rate of technological innovation. For example, the dynamic random-access memory (DRAM) of Japanese electronics companies had a virtual monopoly in the interna-tional market during the 1980s and fi rst half of the 1990s. However, in the 1990s, Japanese companies faced fi erce competition from Samsung and other Korean com-panies, forcing them to exit the DRAM market. By 2012, Elpida, the last Japanese company in that market, sought protection under the Corporate Restructuring Act, leaving Japan with no DRAM manufacturers. Within semiconductor integrated cir-cuits (ICs), DRAM is a relatively standardized product, and thus Japanese compa-nies were unable to compete with Korean companies in terms of prices. Korean companies were able to lower their prices by large-scaled investments in equipment. As a backdrop, manufacturing technologies for ICs became incorporated into man-ufacturing equipment. The traditional model of IC manufacturers maintaining

78
competitiveness through manufacturing technology gave way to a model of price competitiveness through investments in the most advanced manufacturing equipment.
DRAMs are manufactured on the order of microns, and technologically catching up with other manufacturers in areas such as chipset integration and yield improve-ment is diffi cult. Thus, companies from China and other developing countries are not yet at the front line of international markets. However, as stated in Chap. 1 , Chinese solar panel manufacturers, such as Suntech and JA Power, already hold the highest global market share in terms of production volume. Silicon crystal-based solar panels are manufactured using processes similar to those used in the semicon-ductor industry, although the processes do not require highly precise technology as in DRAM. In addition, because companies can purchase turnkey production lines, cost competitiveness is more important than a manufacturer’s technological capa-bility. As a result, costs (e.g., land, buildings, wages), excluding manufacturing equipment costs, are relatively cheap in developing countries, making products manufactured there more competitive in international markets. Chinese companies have rapidly increased their market shares, leaving Japanese and German compa-nies, formerly the world’s top manufacturers, behind.
While Japan has no DRAM manufacturers within its semiconductor industry, Japanese companies are still internationally competitive in logic circuits markets used for specifi c applications such as electronic products and automobiles. However, similar to the fl ow of water from higher to lower levels, technological catch-up will eventually take place as Korean companies, followed by Chinese companies, close the gap. Accordingly, Japanese companies must differentiate their products with more advanced technology to respond to the competition from more cost competi-tive companies in developing countries.
Furthermore, it should be kept in mind that a high level of competitiveness alone is insuffi cient when competing against companies from developing countries. Using the example of the hard disk industry, Christensen showed the “Innovator’s Dilemma” regarding products from companies with superior technology being driven out of a market by late entrants through “destructive innovation” (Christensen 2001 ). This occurs when the pace of technological innovation exceeds the techno-logical standards demanded by customers. Companies owning advanced technol-ogy are strongly tempted to advance their own technology to differentiate themselves from the competition; however, the average consumer views these products as too advanced for their needs. At this stage, a company will not increase its competitive advantage by making further investments to increase its level of technology. Rather, providing low-cost products at the level of technology demanded by customers will maximize its value to those customers. In particular, in developing markets such as China and India, wage levels are lower than those in developed countries, requiring a product strategy that targets the “good-enough” market in the volume zone. Thus, it is likely that a product differentiation strategy based on technology will not work.
For Japanese companies to respond to the threats accompanying the rise of developing countries, they must consider not only technological advancement but also the overall business model. After World War II, Japanese manufacturers rapidly
5 New Business Model as Response to Competition from Emerging Economies

79
caught up with their European and US counterparts and become competitive in international markets. Through that process, the guiding principle was that only by improving product performance and quality through technology can the value to the customer be improved. However, when competing with countries, such as Korea and China, that followed Japan as well as in “good-enough” markets in developing countries such as China and India, the philosophy of “make good products and they will sell” often did not apply. Two important perspectives when evaluating business models in developing countries are “maximizing value creation for customers” and “product and service design that is diffi cult to replicate by companies in developing countries.” After discussing the basic concepts behind these two philosophies, we discuss specifi c policies to realize them. Finally, we discuss infrastructure-related services as an example of system integration services structured as diffi cult-to- replicate products and services. In particular, we discuss the issues encountered by Japanese companies overseas in the railroad industry and possible policies in response to these issues.
5.2 Moving from a “Product-Centric” to a “Customer Value” Model
The idea of “make good products and they will sell” stems from manufacturers on the supply side of a product, and is effective in case of a relatively high level of customer demand in relation to the product’s current state. However, as seen in “The Innovator’s Dilemma” by Christensen, particularly in products with high rates of technological progress, the products exceed the level of customer technology demands, causing the products to lose its effectiveness. For example, every time Microsoft releases a new version of Windows, it adds new functions. However, because of Microsoft’s focus on the design for Windows Vista, the consumers rated it poorly as a slow-responding system; subsequently, for the design of Windows 7, Microsoft focused on the lightness of the operating environment. Within the high- tech industry of electronics and software, companies are often product-centric, with an obsession for product performance and functionality. In developing countries, such as China and India, with growing markets, the average demand for product technology is often lower than that of developing countries. In these markets, com-panies must switch from a product-centric strategy to a “customer value model” that aims to maximize value to the customer.
Thus, it is helpful that these companies refer to “Service-Centered Logic for Marketing” (Vargo and Lusch 2004 ). This publication is an antithesis to traditional marketing theory built on product transactions and centers on the services that cus-tomers gain from products. As can be seen in Table 5.1 , according to the traditional marketing theory (under the product-centric model), products are the prime movers of business transactions, whose values are set by the companies that provide them. For example, the 4P marketing theory is a tool that examines a product, including its price, place, and promotion from the manufacturers’ perspective (see Chap. 9 for more information).
5.2 Moving from a “Product-Centric” to a “Customer Value” Model

80
In contrast, the new marketing theory proposed by Vargo et al. (i.e., the service- centric model) focuses on the service gained by the consumer using a product, with products as a means to which services are provided. Thus, the key component of an exchange in the market place is not the product itself, but the specialized knowledge and skills to implement the services that products provide as intermediaries. The specialized knowledge and skills are provided not only by the companies but also by the consumers, with consumers as collaborators in the creation of the product. In addition, it is ultimately the consumers that determine the value of these services, in contrast to the product-centric model, whose theory is from the viewpoint of the companies as providers Table 5.1 .
Using Microsoft Windows as an example, companies should not provide prod-ucts in which the focus lies on the design and functionality; rather, they should provide services that focus on the benefi ts that customers derive through the use of Windows. Windows is a computer operating system, which by itself has no utility. However, it is the base software that users need to browse the Internet, create docu-ments, and perform other tasks. From the user’s perspective, the services required from an operating system that would result in improved customer value are clearly not software loaded with rarely-used functions, but software that allow the applica-tions to run nimbly. As such, companies should not rely on the sale of traditional products that they have used to date, but rather consider selling, for instance, limited- term licenses currently provided to corporations and using cloud services to customize services for individual user needs. In doing so, businesses are no longer solely transacting on the functionalities of products themselves, but developing a service-centric business model that takes into account customers’ uses and benefi ts derived from the products.
Using this logic for businesses in developing countries opens new possibilities for Japanese corporations struggling against competition in terms of product costs. For example, in China, construction equipment manufacturer Komatsu commands a
Table 5.1 Comparison of product-centric and service-centric models
Product-centric model Service-centric model
Unit of market exchange
Products Specialized knowledge and skills embodied in the services and products that customers gain
Product role Key component of market exchange
Intermediary that creates customer value
Customer role Receiver of product Collaborator in services gained from products
Determiner of value
Corporations (value is attached to the product itself)
Customer (value determined by benefi t gained by customer; corporations are nothing more than proposers of value)
Source of value added services
Surplus created from exchanges of tangible products and management resources
Surplus created by exchanges of specialized knowledge and skills from products and services
Source : Compiled from Vargo and Lusch ( 2004 ), Table 2
5 New Business Model as Response to Competition from Emerging Economies

81
high market share in hydraulic excavators and large dump trucks used in mining. However, domestic manufacturer Sany Heavy Equipment recently increased its market share in low-cost equipment, intensifying market competition in that arena. Komatsu not only improved product durability and fuel effi ciency but also used GPS functionality installed on construction equipment to gather data and provided services such as maintenance inspections and driving advice. From the user’s per-spective, owners can grasp real-time data on their equipment usage, while receiving precise information on parts replacement and maintenance inspection from Komatsu, reducing the probability of sudden equipment breakdown. This signifi es Komatsu’s service-centric model, focusing on the usability of its construction equipment. Thus, apart from the construction equipment being transacted, more importantly, specialized knowledge on maintenance timing and know-how on fuel effi cient driving, acquired through data culled from equipment and stored in Komatsu’s databases is being transacted. Unlike a typical one-way arrangement of a sale of goods from a manufacturer to a customer, data is communicated between the two parties as they use the equipment, thereby making the system user friendly. When customers acknowledge the additional value to products through these ser-vices, companies can break away from cost performance competition. In other words, they can maintain competitive advantage in developing countries with a more holistic business model rather than a standalone product model.
5.3 Product Architecture and Technological Catch-Up
When the level of quality and functionality of products manufactured by companies in developing countries lag behind Japanese companies in terms of technology, these companies exceed the level of customer demand; Japanese companies cannot compete with them by simple technology differentiation. The previous paragraph noted the effectiveness of shifting from a standalone product model to a customer value model. However, the Innovator’s Dilemma is primarily encountered among electronic products with rapid technological innovation, and it is not seen in many other products. Japanese companies maintain a competitive edge through techno-logical dominance in B2B products such as electronics components, high function-ality materials, and industrial equipment. These products differ from B2C products in that they do not require conformance to the good-enough markets unique to developing countries and are diffi cult to commoditize. In addition, they may have unique manufacturing technologies and complex product structures, making it dif-fi cult for competitors to catch up. These product features can be summarized by the concept of product architecture (or design concepts). Herein, we examine the rela-tionship between product architecture and technological catch-up by companies in developing nation, and clarify the implications for a global strategy within Japanese corporations.
Slowing the pace of technological catch-up by companies in developing coun-tries requires lengthening the exclusive use of proprietary technology, methods of which include securing patents and intellectual property rights, preventing trade
5.3 Product Architecture and Technological Catch-Up

82
secret leaks, and reverse engineering via complex product structures. The most effective method varies by industry. For example, in the pharmaceutical industry, preserving rights via patents is effective, but in the electronics industry, many com-panies insist that product complexity works best (National Institute of Science and Technology Policy 2004 ). This is because pharmaceutical companies are able to protect their patent rights for compounds used in new medicines, while in the elec-tronics industry, multiple patents exists for one product, and the know-how of the best combination of these technologies often becomes important. In addition, busi-ness systems are not in place to enforce local intellectual property rights when con-ducting business in developing countries, and while it may be necessary to acquire intellectual property, acquisition alone does not suffi ciently protect technology. Thus, companies must take measures other than leveraging their intellectual prop-erty rights to maintain technological advantages. In particular, equipment-related products, such as consumer electronics, computers, automotive, and industrial equipment, can be internally analyzed by disassembling them, thus making them easy targets for imitation through reverse engineering. On the other hand, for manu-factured products such as electronics components, high-function plastics, and steel plates, process technology is critical, and technology leakage can be controlled through technology management within factories.
Equipment-related products function as fi nished goods after being assembled from multiple components. When considering a product strategy with competition from companies in developing countries, the concept of product architecture (i.e., design concepts) is crucial. Product architecture is typically of two types: modular and integral. Modular architecture includes parts with little mutual dependencies and structures that are formed by assembling modules into fi nished goods. On the other hand, products with integral architecture have highly mutual dependencies among parts, and overall product structures are integrated and cannot be categorized into modules. Products with modular architecture can be manufactured by assem-bling parts procured from external sources, making it diffi cult to differentiate the fi nished goods on the basis of manufacturing technology. Accordingly, competitors are likely to catch up technologically with these products. Conversely, products with integral architecture require calibration between components of optimal assembly for the overall product, thus creating high entry barriers for companies from developing countries.
With the modularization of product architecture, the performance of each com-ponent and functionality are concurrently strengthened, resulting in a faster pace of innovation (Baldwin and Clark 1997 ). On the other hand, for products with integral architecture, groups responsible for each component jointly discuss how to improve the overall product, thereby increasing transaction costs. Thus, the pace of innova-tions is slower, but the fi nished product has an affi nity to products that call for high quality and performance. This is because the design of each part and its assembly are optimized for the required performance and functionality. Specifi cally, elec-tronic products, with their short lifecycles and rapid technological progress, have modular architectures, while automobiles, comprising several parts, requiring high quality and performance, are designed with integral architecture (Fujimoto 2005 ).
5 New Business Model as Response to Competition from Emerging Economies
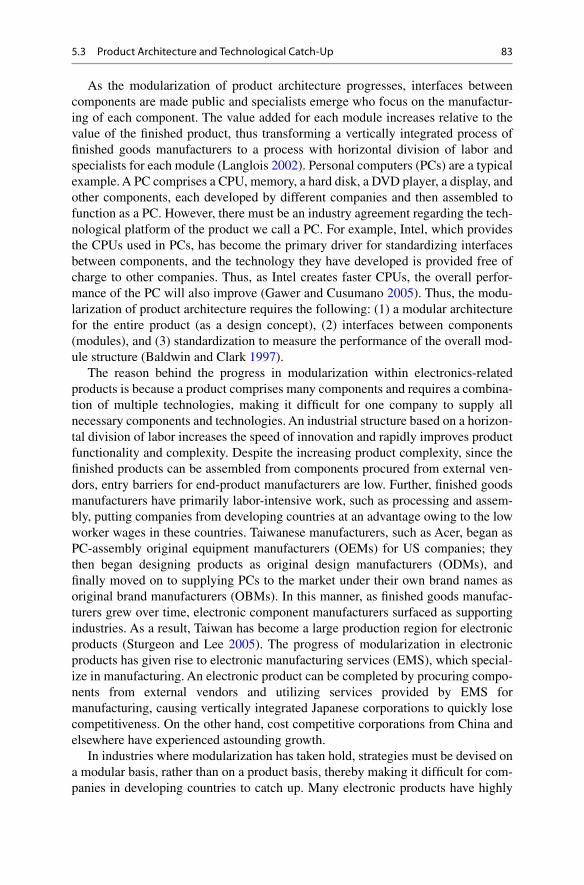
83
As the modularization of product architecture progresses, interfaces between components are made public and specialists emerge who focus on the manufactur-ing of each component. The value added for each module increases relative to the value of the fi nished product, thus transforming a vertically integrated process of fi nished goods manufacturers to a process with horizontal division of labor and specialists for each module (Langlois 2002 ). Personal computers (PCs) are a typical example. A PC comprises a CPU, memory, a hard disk, a DVD player, a display, and other components, each developed by different companies and then assembled to function as a PC. However, there must be an industry agreement regarding the tech-nological platform of the product we call a PC. For example, Intel, which provides the CPUs used in PCs, has become the primary driver for standardizing interfaces between components, and the technology they have developed is provided free of charge to other companies. Thus, as Intel creates faster CPUs, the overall perfor-mance of the PC will also improve (Gawer and Cusumano 2005 ). Thus, the modu-larization of product architecture requires the following: (1) a modular architecture for the entire product (as a design concept), (2) interfaces between components (modules), and (3) standardization to measure the performance of the overall mod-ule structure (Baldwin and Clark 1997 ).
The reason behind the progress in modularization within electronics-related products is because a product comprises many components and requires a combina-tion of multiple technologies, making it diffi cult for one company to supply all necessary components and technologies. An industrial structure based on a horizon-tal division of labor increases the speed of innovation and rapidly improves product functionality and complexity. Despite the increasing product complexity, since the fi nished products can be assembled from components procured from external ven-dors, entry barriers for end-product manufacturers are low. Further, fi nished goods manufacturers have primarily labor-intensive work, such as processing and assem-bly, putting companies from developing countries at an advantage owing to the low worker wages in these countries. Taiwanese manufacturers, such as Acer, began as PC-assembly original equipment manufacturers (OEMs) for US companies; they then began designing products as original design manufacturers (ODMs), and fi nally moved on to supplying PCs to the market under their own brand names as original brand manufacturers (OBMs). In this manner, as fi nished goods manufac-turers grew over time, electronic component manufacturers surfaced as supporting industries. As a result, Taiwan has become a large production region for electronic products (Sturgeon and Lee 2005 ). The progress of modularization in electronic products has given rise to electronic manufacturing services (EMS), which special-ize in manufacturing. An electronic product can be completed by procuring compo-nents from external vendors and utilizing services provided by EMS for manufacturing, causing vertically integrated Japanese corporations to quickly lose competitiveness. On the other hand, cost competitive corporations from China and elsewhere have experienced astounding growth.
In industries where modularization has taken hold, strategies must be devised on a modular basis, rather than on a product basis, thereby making it diffi cult for com-panies in developing countries to catch up. Many electronic products have highly
5.3 Product Architecture and Technological Catch-Up

84
complex core components. In the case of PCs, Intel supplies the logic element, which is the core component. Similarly, Japanese companies have technologies such as optical pickup modules (a device that reads information stored on a DVD via a laser) in DVD players and inverter control devices in air conditioners. Many companies in developing countries are unable to easily copy these technologies. International competitiveness on a product-specifi c basis can be measured using external trade statistics and examining metrics of Japan’s international competitive-ness (exports – imports (trade balance) / exports + imports (total trade volume)). Finished goods, such as electronic equipment for consumer use and computers, have decreased across the board since the latter half of the 1990s, while metrics for electronics components have risen. In addition, Japanese electronic components manufacturers have increased their global market share (Motohashi 2010 ).
On the other hand, with regard to a product with an integrated architecture, an automobile is a prime example. The impact of the automakers is large among the value-added activities of the overall product (Fujimoto 2005 ). Automobiles are complex products comprising several parts that may be custom-made to the end manufacturers’ specifi cations, which is contrary to electronic products, where com-pleted products are made by assembling standardized components. New model development is accomplished by automakers collaborating with parts manufactur-ers on parts design. Entry barriers in this arena are high for companies in developing countries. In Europe and the US, parts suppliers’ wages are relatively low compared with those of automakers, and the ratio of external sourcing of parts among vehicle manufacturers is said to be high to keep costs low (Takeishi et al. 2001 ). Nonetheless, overall product design is carefully managed by automakers, and as such, product architecture is not modular. However, new Chinese automakers Geely and Cherry began by assembling vehicles using parts bought from foreign automakers (a case of pseudo-open production) and gradually began their own development, techno-logically catching up with other automakers (Li et al. 2005 ). Still, the Chinese domestic market is dominated by foreign automakers, and vehicles manufactured by domestic automakers continue to demonstrate low quality and performance.
When considering competition strategies against companies in developing coun-tries at a product level, companies must understand the characteristics of their prod-ucts’ architectures. Particularly in industries with a high degree of modularization, companies must choose strategies to build competitive advantage by focusing on modules that are technologically diffi cult to copy. However, modules that can be manufactured with a certain degree of quality by local companies are subject to cost competition, resulting in a quick price decrease. Among these are components, such as solar panels, for which manufacturing technology has been integrated into pro-duction equipment, enabling the implementation of production lines as turnkey sys-tems. In industries with rapid technological innovation, companies must analyze not only the actions of competitors but also of related companies, such as materials and equipment suppliers.
In contrast, products with an integrated architecture make it diffi cult for compa-nies in developing countries to catch up, giving Japanese corporations the luxury of time. However, companies in China and India are gaining strength, making it
5 New Business Model as Response to Competition from Emerging Economies

85
critical for Japanese companies to continually pioneer new technology. In addition, from the perspective of architecture theory, the emergence of electric vehicles poses a signifi cant threat to the current automotive industry. Electric vehicles replace engines and transmission systems of traditional vehicles with motors and have a more modularized structure. There are various theories as to the potential ubiquity of these electric vehicles, but manufacturers must increase their competitiveness in core components (i.e., modules) in preparation for such a future.
5.4 Business Models That Are Difficult to Be Imitated
Products with highly modularized architectures are diffi cult to technologically dif-ferentiate, making it diffi cult for Japanese companies to compete against low-cost strategies adopted by companies in developing countries. Thus, we stated that, in developing countries, companies must consider a profi t model at the modular level at which products are comprised. Is there any other way for Japanese companies to survive this environment? This section discusses shifting to an integration service that provides systems of one product combined with others, rather than standalone products.
First, we review the characteristics of business models by product architecture, as shown in Fig. 5.1 . As previously stated, PCs are highly modularized products, though before their era, computers were products with integral structures. When IBM developed the System 360 in the 1960s, the design of computers became more
PCs
Electric Vehicles
Mainframes
Automobiles
Airplanes
Modular Product Architecture IntegralLow Functionality/quality/price High
Fast Innovation speed Slow
Modularization
Fig. 5.1 Product architectures and business models
5.4 Business Models That Are Diffi cult to Be Imitated

86
modular, with components such as a CPU, input/output device, memory storage, and other components created to be less interdependent. This enabled the develop-ment of large-scale computers in a short period of time. This increase in system development effi ciency paid big dividends for IBM (Baldwin and Clark 2000 ). However, the modularization of product architecture spurred the appearance of companies that specialized in each type of module, including IBM spinoffs, causing the downfall of IBM’s vertical integration model used in mainframe computers. On the other hand, Intel developed a CPU for use in PCs—an act of destructive innova-tion for mainframe computers. The progress in modular PC technology has been dramatic, with mainframes currently being used only in applications that require high-speed processing of large volumes of data. Many information systems have been replaced by servers that have modular architecture.
On the other hand, as stated in the previous paragraph, automobiles continue to be products with an integrated architecture. However, in electric vehicles, many of the components required in traditional vehicles, such as fuel, gasoline engines, and transmission systems, will become obsolete and the number of parts will drastically decrease. In addition, interdependency between parts will also reduce, making elec-tric vehicles modularized. As shown in Fig. 5.1 , modularization triggers a horizon-tal division of labor in industry structures, with fi nished goods being made by assembling components. As a result, these products lack in performance shown by products that have an integral architecture, but having lower costs as market compe-tition increases. Further, assembling fi nished goods becomes labor intensive; there-fore, the increase of developing countries often spurs further cost reduction. On the other hand, with modular innovation, the pace of technological innovation in fi n-ished products becomes faster (Baldwin and Clark 1997 ). This results in reduced time requirement for product performance to exceed the level demanded by custom-ers, increasing the likelihood of destructive innovation and further price erosion.
Product modularization results in a more competitive marketplace for companies from developed countries, including Japan. However, modularization in some types of products, such as airplanes, is unheard of. An airplane may have between one and two million different parts, making them more complicated than automobiles in terms of the order of magnitude. The process of developing new airplanes is of high duration. Airplane manufacturers procure parts from vendors only after completely thoroughly analyzing their technological characteristics. Airplane product technol-ogies have matured to a certain extent, with interfaces that divide the parts, more or less fi xed. However, the pace of performance improvements for each part differs, requiring an overall balance in the assembly of an optimized product (Brusoni et al. 2001 ). Greater modularization allows a faster pace of technological innovation because the modules encapsulate information inside and enable technological prog-ress regardless of the status of other modules. However, internal encapsulation of information is not performed in airplane manufacturing, which requires manufac-turers to consider the overall product composition after fi rst understanding the tech-nology of products procured from external sources. Therefore, airplane manufacturers and their parts vendors are loosely coupled. Airplane manufacturers
5 New Business Model as Response to Competition from Emerging Economies

87
are known as systems integrators because of their role in coordinating the overall system in all its scale and complexity (Brusoni et al. 2001 ).
Even within industries where modularization has progressed, Japanese compa-nies may be able to sustain by playing the role of a system integrator. With the modularization of large computers with integral architectures, IBM’s share prices fell drastically; however, IBM did not attempt to compete in the market with stand-alone products. Instead, they paved the way for a new path as a system integrator. Computer users have various IT systems needs. For example, a bank may wish to implement a high security accounting system that can quickly process large amounts of fi nancial information. In this case, a system integrator will combine appropriate hardware and software catering to the needs of the bank to provide a suitable IT system to customers, thereby increasing the value of their products. IT systems are industry-specifi c, and with its large customer base, analyzing the appropriate sys-tem to meet an industry’s needs is one of IBM’s strengths. Know-how is a rare management resource absent among young companies. Corporations from devel-oped countries, including those from Japan, have better business experience than companies from developing countries; similar management resources should exist from such business experiences. By moving from a business model based on out-right sale of products to one based on customer service as system integrators, will enable these companies to build competitive advantage over companies from devel-oping countries.
5.5 Infrastructure Exporting as a Systems Integration Business
According to METI, infrastructure investment between 2011 and 2020 in Asia is estimated at approximately USD eight trillion, of which 51 % is estimated to be energy related, such as power generation; 31 % to be transportation related, such as roads and railways; 13 % to be telecommunications related; and 5 % to be water and hygiene related (METI 2010 ). For example, India, a region of high economic growth, is only capable of meeting 80 % of its electricity needs during peak demand times, resulting in frequent power outages in the country. India also suffers from a lagging road and railway infrastructure, which remains an obstacle to manufacturers entering the market. On the other hand, the capital requirement to invest in such future infrastructure demands exceeds the amount that the Indian government has budgeted, so expectations are high for private capital. For Japanese companies, this presents a signifi cant business opportunity, and infrastructure exports have been highlighted in government growth strategies as an area that both the government and the private sector should undertake. We examine infrastructure exports as an example of system integration and evaluate ways to expand in developing countries.
Infrastructure services, such as roads, railways, water, and sewerage, are public utilities traditionally controlled by governments. However, in countries such as the UK and France, these services are outsourced to private undertakings through
5.5 Infrastructure Exporting as a Systems Integration Business

88
public–private partnerships (PPPs). While the responsibility to provide these services as public utilities may rest with the government, this arrangement is based on views that management by specialized businesses is more effi cient; moreover, this aids in effectively incorporating taxes. Governments in developing countries lack the expertise and fi nancial resources to effi ciently manage such large-scale public ser-vices and mitigate the gap between infrastructure supply and demand. Thus, gov-ernments aim to employ the PPP system for infrastructure improvement. PPP businesses for infrastructure services often operate within a build, operate, and transfer (BOT) system. Thus, government organizations outsource the building and operation of infrastructure to private businesses, and subsequently, the ownership of infrastructure is transferred back to the country at the end of the outsourcing period. These are typically long-term projects that last 20–30 years and are high-risk busi-nesses from the cash fl ow perspective, involving high expenditures in the initial construction period; these expenditures are then made up for through revenues gen-eration from infrastructure operation over the long-term. A special purpose com-pany (SPC) is typically established to run a BOT business. There are many dependent parties that profi t from these projects—investors as the creditors that fi nance the business, public organizations requesting the business, plant operators, and others. PPPs for infrastructure services are large, complex systems that involve many dif-ferent parties over a long period of time.
We now examine the characteristics of infrastructure businesses using a railway transportation service as an example. In addition to hardware infrastructure such as railcars, tracks, and train stations, providing transportation services for passengers or freight via railways requires operational and signaling expertise. The systems’ components are not deployed using modules, but are instead designed in an inte-grated fashion, through mutual collaboration. For example, the UK revised its rail-way laws in 1993 and broad deregulation was implemented. Specifi cally, a public organization called “RailTrack” was created to consolidate infrastructure manage-ment, such as tracks, bridges, stations, and operational planning. Further, railway operations and ownership and maintenance of rolling stocks were outsourced to a private company. However, this arrangement caused various problems (Gayer and Davies 2000 ). For example, a company managing a particular line decided that it was appropriate to increase the speed of trains on that line to improve passenger service—a change that required a signaling system be installed in the rolling stocks. However, a leasing company, which leased to other railway operating companies, was separately involved with the railcars. Changing the signaling system of certain cars was ineffi cient for the leasing company, since, depending on the line, they would be forced to use other cars. Accordingly, the leasing company did not agree to the installation of this signaling system, and therefore the decision to increase the speed of the line was postponed, with parties unable to respond to differing circum-stances and provide appropriate railway services. Issues such as the train schedule, signaling system, and rolling stock specifi cations form an integral structure, and an overall balance must be struck through mutual collaboration. Issues arose in this case when the operations providers were fragmented, and RailTrack was unable to function as a system integrator.
5 New Business Model as Response to Competition from Emerging Economies

89
The railway business provides a stable service through a purchase order that spans decades, requiring a fl exible operating structure to respond to technological progress and economic situations. Consequently, the rolling stocks and signaling systems (i.e., the technological aspects) that comprise the service must be provided in unison with planning and management that are in sync with customer and freight transportation demand (i.e., the organizational aspects). Developing countries’ capabilities to operate local railways is low; thus, there is a great need for an inte-grated system, from construction to transportation management, to be provided by developed countries. Japan provides high quality services in both long distance rail-ways, as seen in the Shinkansen, or bullet train, as well as urban systems, as seen around Tokyo. Thus, the heightened demand for infrastructure in developing coun-tries presents Japanese companies with signifi cant business opportunities.
However, Japanese companies have had a late start in expanding the railway business in developing countries that would oversee projects from construction to management. The track record of Japanese companies to date consists primarily of projects under a “standalone product model,” such as rolling stock’s delivery, and few Japanese companies have been involved in railway operations. On the other hand, Alstom, Siemens, Bombardier, and other Western railcar manufacturers are aggressively chasing the package-style railcar business. In the 1990s, the EU used an open access policy for railroads to create a “top and bottom” organization, sepa-rating ownership and management of structures, such as tracks and stations, from operation of the railcars. As a result, a public organization was responsible for the infrastructure (the “bottom”) as with the case of the UK, while railcar operations (the “top”) were outsourced to private businesses. Thus, train manufacturers man-aged the railway service operations, becoming more competitive as railway service companies. On the other hand, beginning in the 1980s, Japan split railway compa-nies by region as a means of reforming the national railways; the railway systems have been managed as one ever since, without “top” and “bottom” separation. Therefore, railcar manufacturers have not been able to build a knowledge base for operating railway businesses (Akizuki and Konagai 2010 ).
Accordingly, Japan Railways and private railway companies hold the key to future overseas expansions for the Japanese railway business. Taking advantage of Japan’s strengths in railway services, namely its safety and accuracy in train man-agement, requires the partnership of Japanese manufacturers to provide an inte-grated Japanese-style system as a package. However, the requirement of a high level of customer service is possibly higher in developed countries such as the US or Europe, rather than developing countries. A European team originally had the right of fi rst refusal for the Taiwan High Speed Rail (the so-called Taiwanese shinkan-sen), which was designed as per European standards, but Taiwanese authorities were nervous about the design’s earthquake resistance and ultimately chose Japan’s shinkansen. This led to not only the purchase of railcars and management systems, but also to the dispatching of train conductors from Japan Railways to provide guid-ance. This is an example of Japanese companies providing railway services down to the operational level. In this case, a Japanese system was selected because of its geographical similarities with Japan’s mountainous terrain and earthquake
5.5 Infrastructure Exporting as a Systems Integration Business

90
frequency. Infrastructure businesses such as railway systems need design and operation that respond to the geographical characteristics of each region. Therefore, it is imperative for companies to refi ne their targeted regions and formulate a proposal for such targets.
Moreover, Japanese companies must sort their technological (equipment and ser-vices) and organizational (management know-how) strengths, and clarify how each feature can enhance customer services. Package exports of an infrastructure busi-ness cannot merely be expanding Japanese business overseas as-is, considering the level of local customer demands and costs. Rather, companies need to fi lter the expertise required for core operations in current services, and then match that to the level demanded by the target region in terms of service levels and cost. In doing so, they must also consider how to differentiate themselves from their Western com-petitors and offer recommendations from the proposal stage that highlight the strengths of a coalition of Japanese companies.
5.6 Conclusion
In this chapter, we discussed how Japanese companies can best create business strategies while keeping in mind competition with local companies that emerge with the rise of developing countries, from the perspectives of a “customer value” model and product architecture theory.
The customer-centric model repudiates the corporation-leaning logic of “make good products and they will sell.” It focuses on services provided by products and displays the concept of rebuilding business models from the perspective of improv-ing customer value. A product-centric business strategy that chases product func-tionality and performance will lose effectiveness at a stage where product performance exceeds the level of customer demand. In developing countries such as China and India, “good-enough” product markets feature in a volume zone, and have a lower-than-average level of customer demand compared with markets in developed countries. Accordingly, competing with companies by using a strategy that emphasizes performance and functionality is diffi cult, and companies should instead design products and services from the perspective of maximizing customer value. The value customers seek from products is derived as they use those prod-ucts. Thus, companies must focus on services derived from products and create business models that increase customer satisfaction across the product’s lifecycle.
Next, companies must formulate strategies that correspond to the characteristics of product architecture. In particular, products with a modular architecture are easy for companies in developing countries to catch up with and will dramatically increase the competition faced by Japanese companies. In those situations, compa-nies must consider strategies to improve the technology or differentiate products at the modular level. In addition, companies may take the opposite approach and become system integrators, providing valuable systems for customers by combining multiple products. As can be seen in system integration services for information equipment, customers have various needs, and providing turnkey services that
5 New Business Model as Response to Competition from Emerging Economies

91
optimally combine IT systems is characteristic of integral architecture. This is because of the expertise required to optimally combine these products to meet cus-tomer needs, rather than the performance of the components themselves.
In this chapter, we discussed the export of infrastructure business packages, such as railway services, as examples of system integration services. Providing railway services requires knowledge of signaling systems and railcar management, in addi-tion to that of hardware infrastructure such as railcars, tracks, and stations. The fact that each system component is not modularized, but rather requires mutual collabo-ration for an integrated design, is characteristic of integral architecture. Japan’s rail-way services have a high level of safety and accuracy. However, competition among railway operators is absent in Japan unlike Europe, and the passiveness shown by Japan Railways and other private railway companies in pursuing overseas expan-sion has caused Japan to fall behind in overseas expansion. Moving forward with an overseas business will fi rst require Japan’s railway operators to clarify the extent of their expertise on system integration and management. With that done, they must formulate proposals to countries and regions that make use of Japan’s strengths.
Open Access This chapter is distributed under the terms of the Creative Commons Attribution Noncommercial License, which permits any noncommercial use, distribution, and reproduction in any medium, provided the original author(s) and source are credited.
References
Akizuki, S., & Konagai, M. (2010, July). Kaigai no Tetsudou Operator to no Renkei wo Tsuujita Kokunai Tetsudou Gaisha no Kaigai Jigyou Senryaku Scenario, Chiteki Shisan Souzou . Tokyo: Nomura Research Institute, Ltd.
Ando, H., & Motohashi, K. (2002). Nihon Keizai Kyoshoryoku no Koso . Tokyo: Nikkei Publishing Ltd. (in Japanese).
Baldwin, Y. C., & Clark, K. B. (1997). Managing in age of modularity. Harvard Business Review, 75 (5), 84–93.
Baldwin, Y. C., & Clark, K. B. (2000). Design rules: The power of modularity . Cambridge, MA: MIT Press.
Brusoni, S., Prencipe, A., & Pavitt, K. (2001). Knowledge specialization, organizational change and the boundaries of the fi rm: Why do fi rms know more than they make? Administrative Science Quarterly, 46 , 597–621.
Christensen, C. (2001). The Innovator’s Dilemma (trans: Shunpeita, T.). Shoeisha. Fujimoto, T. (2005). Architecture no Hikaku Yui ni Kan suru Ichi Kousatsu (RIETI Discussion
Paper Series 05-J-013). Research Institute of Economy, Trade, and Industry. Gawer, A., & Cusumano, M. (2005). Platform leadership (trans: Toshio, K.). Tokyo: Yuhikaku. Gayer, A., & Davies, A. (2000). Managing project-system interfaces: Case studies of railway proj-
ects in restructured UK and German markets. Research Policy, 29 , 991–1013. Langlois, R. N. (2002). Modularity in technology and organization. Journal of Economic Behavior
& Organization, 49 , 19–37. Li, C., Chen, J., & Fujimoto, T. (2005). Chuugoku Jidousha Sangyou to Seihin Architecture,
Chuugoku Seizougyou no Architecture Bunseki (T. Fujimoto, & J. Shintaku, Eds.). Chapter 8, Tokyo: Toyo Keizai, Inc.
Ministry of Economy, Trade, and Industry. (2010, August). White Paper on International Economy and Trade 2010. Tokyo: Ministry of International Trade and Industry.
References

92
Motohashi, K. (2010, April). Higashi Asia Electronics Database no Kouchiku to Nihon Kigyou no Kokusai Kyousouryoku no Bunseki (RIETE Discussion Paper Series 10-J-028).
National Institute of Science and Technology Policy. (2004, December). Report on the Japanese National Innovation Survey, Ministry of Education, Sports, Science and Technology National Institute of Science and Technology Policy (Ijichi, T., Iwasa, T., Odagiri, H., Keira, H., Koga, T., Goto, A., Tawara, Y., Nagata, A., Hirano, Y.)
Sturgeon, T., & Lee, J. (2005). Industry co-evolution: Electronics contract manufacturing in North American and Taiwan. In S. Berger & R. Lester (Eds.), Global Taiwan: Building competitive strengths in a new international economy (pp. 33–75). New York/London: M.E. Sharpe.
Takeishi, A., Fujimoto, T., & Ju, C. (2001). Jidousha Sangyou ni Okeru Module-ka: Seihin, Seisan, Choutatsu System no Fukugou Hierarchy, CIRJE-J41 . University of Tokyo Graduate School of Economics.
Vargo, S. L., & Lusch, R. F. (2004). Evolving to a new dominant logic for marketing. Journal of Marketing, 68 , 1–17.
5 New Business Model as Response to Competition from Emerging Economies

93© The Author(s) 2015K. Motohashi, Global Business Strategy, Springer Texts in Business and Economics, DOI 10.1007/978-4-431-55468-4_6
6 India’s Neemrana Industrial Park for Japanese Firms
6.1 Introduction
India is second only to China in terms of population. India’s economic growth since the mid-2000s has risen to around 8 %, and is now considered as having a promising future market. However, the driving force behind this economic growth is the coun-try’s service industry, particularly its IT service industry. As compared to China, India trails in its growth in the manufacturing industry. One reason for this gap is the lack of infrastructure in India. For a manufacturing industry to grow, basic infra-structure, such as power and water, and logistics facilities, such as roads, railways, and ports for imports and exports, are required. However, infrastructure develop-ment in India has not progressed as planned. Half of India’s population is under the age of 25, resulting in a relatively low average age. Therefore, creation of employ-ment opportunities for this younger generation is important. For this reason, it is necessary to promote the manufacturing industry having a high employment absorp-tion capacity. Infrastructure creation is thus an important policy issue for the Indian government.
The Neemrana Industrial Park for Japanese fi rms was created with the coopera-tion of the Japanese government and the state government of Rajasthan, situated to the southwest of Delhi. This project has become a highly anticipated one even within the Indian government. Industries in Rajasthan have focused on agriculture and mining such as for marble and cement. The relative lag in industrialization has motivated the Rajasthan state government to provide incentives to factories to set up operations such as automotive industries having high employment absorption capacity. On the other hand, India carries a relatively higher investment risk for Japanese companies for a variety of reasons than do other nearby Asian countries, such as China. These companies fi nd themselves forced to make investment deci-sions based on insuffi cient decision-making information, for example, the accessi-bility of infrastructure such as power and water necessary to operate factories, availability of effi cient and appropriate workers, or the ability to adequately respond

94
to various central or local government regulations and directives. Maruti Suzuki and Honda, which together comprise more than 40 % of India’s passenger cars, operate factories near Delhi and have strong incentives to attract parts and materials manu-facturers to India to strengthen cost competitiveness. Against this backdrop, Japan’s External Trade Organization (JETRO) has taken the lead in outfi tting the industrial parks to lure, primarily, Japanese auto-related companies to India, thereby reducing risks that individual companies otherwise could not handle.
6.2 Background of Neemrana Industrial Park
The Neemrana Industrial Park is located in the state of Rajasthan, and is approxi-mately 105 km southwest of Delhi’s Indira Gandhi International Airport (a 90 min drive). The Park faces National Highway 8, connecting Delhi and Mumbai. With the establishment of Phase III (1,166 acres), it will be the fi rst in India to be developed specifi cally for Japanese companies (Fig. 6.1 ).
India has pursued industrial decentralization policies aiming to balance develop-ment since the 1970s by providing industrial location guidance to underdeveloped and unindustrialized regions. In addition to the Delhi Special Area, the center of development since the latter half of the 1980s, development plans have expanded in the neighboring states of Uttar Pradesh (UP), Haryana, and Rajasthan (in part), all of which comprise the National Capital Region (NCR). These plans aim to relieve overpopulated conditions in the capital and decentralize economic activities.
Fig. 6.1 Map of Neemrana Industrial Park and surrounding area
6 India’s Neemrana Industrial Park for Japanese Firms

95
The NCR is a planned area adjacent to Delhi and is based in seven centers (Gurgaon, Faridabad, Noida, Ghaziabad, Sonipat, Greater Noida, and Meerut) located along the National Highways radiating outward from Delhi. It is near con-sumer markets centered in Delhi, and is a valuable base for the expansion of the Northern Indian market. Being based near the capital has many other advantages, such as better communication with government and other enterprises as well as procuring excellent labor. The nexus of industrial development is the industrial parks, and developmental corporations under the control of each state’s department of industries are responsible for the purchase, establishment, and sale of properties in the parks.
The Noida Business Park, situated in UP, is the largest industrial park in the NCR, and has been under development since 1976. Phase I saw the participation of smaller companies, while Phases II and III saw the participation of medium-sized companies. Plans to proceed with medium- and large-sized factories in this region, made up primarily of foreign auto makers, necessitated vast open spaces, and thus the Greater Noida industrial park was developed at a distance of about 10–15 km southeast of Noida. The foray of automakers into Greater Noida spurred the expan-sion of the auto parts market, thus currently making this region the greatest agglom-eration of auto industry companies. Suzuki (passenger cars in 1983) and Honda (motorcycles in 1984) built factories in Gurgaon, Haryana, during the 1980s. Gurgaon is located to the southwest of Delhi, making it possible to procure parts from nearby areas of Noida and Greater Noida, resulting in this region also having an agglomeration of auto industry companies.
In India today, Suzuki and Honda procure 80–90 % of parts locally, although this fi gure applies only to fi nished vehicles. Japanese parts manufacturers in India that supply to automakers, procure approximately 60 % of their raw materials interna-tionally. It is becoming more diffi cult, even within India, to compete in price, as low-cost cars such as the “Nano” made by Tata Motors are causing a stir with its INR 100,000 (about JPY 200,000) price tag. There is an increasing necessity for Japanese manufacturers to procure not only fi rst-tier parts, but also second- and even third-tier parts from local sources in the future to enable price competitiveness through cost reduction. Automakers await the entry of second- and third-tier Japanese parts suppliers into India, and when they do, these suppliers will need land for factories. These parts manufacturers are oftentimes small- and medium-sized fi rms, with low manpower or capital, making it diffi cult to independently enter the Indian market. Thus, JETRO’s initiative is essential by kicking off projects to build industrial parks for Japanese companies.
The issue is primarily location based. With sudden farmland expropriations to develop industrial parks, land prices have risen in Noida and Greater Noida in the state of UP. JETRO approached Faridabad and Gurgaon in the state of Haryana, but industrial parks have already been developed in these regions, causing land prices to skyrocket. Therefore, the state of Rajasthan, which had missed the development wave, came under JETRO’s radar. Rajasthan was originally a kingdom (name derived from “raja” or king and “stan” or country) with territories ruled over by a maharaja (a powerful king), today it is said to have a citizenry with an earnest
6.2 Background of Neemrana Industrial Park

96
nature. Vasundhara Raje, of the Bharatiya Janata Party (BPJ), became the fi rst female chief minister of the state in 2003 proves the change. Chief Minister Raje was very popular among those in the industry and had a reputation for being a wise and decisive leader. Further momentum for industrialization was gained by the aggressive efforts of the Chief of Industries in the Raje cabinet. The managing director of the Rajasthan State Industrial Development & Investment Corporation Ltd. (RIICO), a believer in the promotion of industrial development and having a deep understanding of economic development in China, enabled agreements with Japan to proceed smoothly.
RIICO created a Japan Desk, and appointed Anil Sharma as general manager. Mr. Sharma notes the characteristics of the state of Rajasthan as an ideal location for industry operations: “The laws and systems are well put together for India as a whole, compared with developing nations. India is a democracy, and laws and sys-tems don’t change according to the whims of government. Also, contracts are seen as things to be honored. Next, we have an abundant workforce. There have been 76 engineering fi rms established in the state of Rajasthan in the last 15 years, and the state has produced a tremendous number of IT and software-related companies. An Industrial Training Institute (ITI) has also been established to develop factory work-ers. Third, the electric power infrastructure is well developed compared with Haryana and Punjab near Delhi. Finally, there is policy support. Much support is given to lure industry here through RIICO.”
In regards to land, the plan has always been to sell property with RIICO as the landowner, causing the appropriation to be free of problems often inherent with complex land ownership. Another important factor was that this land was, for the most part, a desert, and therefore not appropriate for agricultural use. All 1,166 acres of Phase III of the Neemrana Industrial Park sitting alongside National Highway 8, in Rajasthan was provided as an industrial park for Japanese compa-nies. In July 2006, the Japanese government requested the state government of Rajasthan for (1) priority purchase rights for Japanese companies over a 2 year period (which in 2008 was extended for another year) and (2) a reduction in the state border tax (from 4 to 0.25 %). In that same month, JETRO and RIICO entered into a memorandum of understanding (MOU) to jointly support a “campaign to facilitate Japanese investment”. For the fi rst 6 months, not many companies were convinced to set up operations in Rajasthan, but with the Indian government’s focus on infra-structure development to lure foreign (particularly Japanese) companies, the cam-paign became a Japanese–Indian “Delhi Mumbai Industrial Corridor Project” (DMIC); these efforts came to be more broadly known.
6.3 DMIC: Delhi Mumbai Industrial Corridor
The Neemrana Industrial Park was an early bird project part of the larger DMIC project. It was an important joint Japan–India industry promotion proposal.
The DMIC “is a joint Japan–India project for a major industrial area connecting industrial parts and ports via freight railways and roads between Delhi and Mumbai,
6 India’s Neemrana Industrial Park for Japanese Firms

97
for the purpose of promoting foreign investment and exports.” (JETRO Delhi “DMIC concept explanatory material, December 2009”) By constructing approxi-mately 1,500 km of new freight railways between the interior political capital of Delhi and the industrial port city of Mumbai, it attempts to invigorate the Indian industry by outfi tting the railway as its key traffi c route, by building industrial parks, interior distribution facilities, and new ports along the railway corridor. Preparations for a high-speed railway scheduled for completion in 2016 are underway, and the Japanese government has committed toward contributing construction capital out of Offi cial Development Assistance (ODA) funds (Fig. 6.2 ).
This is a massive Indian project involving six states (Haryana, UP, Rajasthan, Madhya Pradesh, Gujarat, and Maharashtra) and multiple government organiza-tions (state departments of commerce, offi ces of chief ministers, planning commit-tees, departments of fi nance, infrastructure-related departments). The DMIC Development Corporation (DMICDC) was established in January 2008 as a pan- state special purpose development organization. The development of the DMIC Master Plan was completed in 2010, outlining a grand concept for constructing a total of 24 industrial cities across the six states by 2030. With acceleration of urban-ization among the Indian population, it is estimated that 40 % of India’s total popu-lation will live in urban areas by 2030. Because of this, the DMIC Master Plan calls for the job creation through construction of industrial parks and for the urban
Fig. 6.2 Map of DMIC and High-Speed Railway ( Source : JETRO Delhi materials from DMIC)
6.3 DMIC: Delhi Mumbai Industrial Corridor

98
development of surrounding regions as residential areas. The DMICDC oversees all these projects and assumes the role of developer in concert with state governments.
In India, the management of land not owned by citizens is the responsibility of state governments. Accordingly, actual urban development is carried out by state governments providing land to Special Purpose Companies (SPCs), which fi nance the DMIC project through funds to develop each urban area. Projects that have a high potential for commercialization, such as electric power projects, are under-taken as Public–Private Partnerships (PPPs), with the expectation of joint public private fi nancing. Projects of a more public nature, such as roads and water services, are managed directly by the SPCs as public works projects.
However, these development plans are still in their conceptual stages, and fund-ing will be necessary from the Indian government to proceed with future urban development. Also, the 24 new cities outlined by the Master Plan are, for the most part, to be established in vacant areas. It is unlikely that companies will set up operations in industrial parks with low infrastructure, and with no companies in hand to occupy an industrial park, private companies will be slow to invest in infrastructure.
It will take considerable time to carry out development according to the DMIC Master Plan, even though early bird development projects have been set up in advance of fi nalizing the Master Plan. The Neemrana Industrial Park is one such project, and a smart factory project bolstered by the Japanese government is also moving forward, as explained later. Another early bird project is a free trade and warehousing zone planned for construction in the state of Haryana by Mitsui Bussan. This will create an inland container depot (ICD) to directly transport con-tainers via high-speed railroads from ports to the ICD, and will enable customs clearance in inland areas. There are currently two ICDs, Dadri in Uttar Pradesh, and Tughlakabad in Delhi, although according to the DMIC Master Plan another ICD is expected to be built near Neemrana. The high-speed railway will not only be used to supply parts from Mumbai to Delhi, but is anticipated to signifi cantly contribute toward regional economic development due to its role as the key distribution chan-nel connecting the two large cities of Northern India and the medium-sized cities along its pat
6.4 India’s Industrial Infrastructure
Before explaining the details of the Neemrana Industrial Park, below is a quick overview of the infrastructure necessary for setting up manufacturing sites in India.
First are roadways, which are one method for overland transport. Most national highways, including National Highway 8 connecting Delhi and Mumbai, are two- lane drives, on which trucks, motorcycles, auto rickshaws, bicycles, livestock, and pedestrians commute. Accordingly, traffi c is often congested and high-speed trans-port is impossible.
6 India’s Neemrana Industrial Park for Japanese Firms

99
India ranks fourth in the world in terms of railway length, with a total of 633,332 km. However, only 28 % of these are electricity operated and only 25 % are double-tracked. Freight cars travel at a speed of only 23 km/h and although travel fares are low, freight shipments are expensive. Thus, it is cheaper to transport goods by truck.
The Indian federal government manages 12 main ports: Kandla, Mumbai, Jawaharlal Nehru, Mormugao, New Mangalore, Cochin, Tuticorin, Chennai, Ennore, Vishakhapatnam, Paradip, and Kolkata. These ports together handle 464 mn tons annually. Ports under the jurisdiction of state and local governments are termed as “non-major ports” (or “minor ports”). These ports handle a total of 160 mn tons annually. Northern India, which has no coastline, relies on container ship-ments from gateway ports in the western part of the country. India’s western ports handle 69 % of all container freight.
Stable electric power supply is another requirement for an industrial park. In 2010, electric power demand in India was 8.5 mn gigawatt-hour (GWh), an increase of more than six percent over the last 5 years. Peak electricity demand is estimated to increase as high as 120 GW, driving overall demand far higher than the country’s supply capacity of approximately one mn GWh. In addition, issues related to high transmission and distribution loss rates and theft of electric power decrease the elec-tric power availability for those who need it, making power outages a frequent occurrence. One reason for this is the strain on power company fee schedules. Fee schedules are constrained by low (or free) rates for farmers, which are offset by industries paying relatively higher fees, resulting in a cross subsidy of sorts. Companies pay high power bills to run their factories, and work with the frequent power outages and shortages. It is therefore common for large-scale factories to have in-house power generation.
Due to low groundwater levels and water contamination, water shortages are common in Northern India. In an attempt to limit the overuse of groundwater and promote its restoration, the Indian government has asked all states to enact rainwa-ter harvesting laws (regulations that mandate the return of water to nearby regions if groundwater usage in that region is in excess of rainwater in the region). Regions around Delhi have plans for constructing water desalination plants; however, there are as yet no prospects for solving water shortages.
6.5 Companies Operating at Neemrana Industrial Park
As of March 2012, 14 companies have set up operations in the Neemrana Industrial Park (Phase III for Japanese fi rms). While there were some cancelations by compa-nies that had planned to set up, particularly during the economic downturn on account of the Lehman Brothers bankruptcy, site sales in the Park have since recov-ered is at almost full occupancy as of 2012. Companies in the Park (and those plan-ning to set operations) hold regular meetings to share information, during which they discuss issues and solutions for building and operating factories, as well as compile requests to the state government and RIICO. These combined requests are
6.5 Companies Operating at Neemrana Industrial Park

100
more effective rather than an independent request. In addition, receiving approval from the administration can be extremely complicated, requiring the use of a local consultant at certain circumstances. Even in these cases, companies can share spe-cifi c information on “predatory” consultants, quality of local consultants, and dif-ferences in rates—information that cannot be obtained through JETRO—making the approval process relatively easier. JETRO’s investment coordinator manages negotiations with the development company regarding joint requests made at these meetings. Further, JETRO’s Delhi offi ce has opened a business support center that provides advice on Indian investments by an investment coordinator and helps solve a myriad of minor issues that arise from Japanese companies investing in India.
Below is an interview-based overview of the current status of three companies (auto parts maker Company A, auto materials maker Company B, and air- conditioning equipment maker Company C) engaging in business in the Neemrana Industrial Park.
Background and Status of Expansion in Neemrana • Company A ventured into India as a supplier of brakes, timing their entry to coin-
cide with the release of the Honda City 2008 model. Honda has a factory in Greater Noida; therefore, the company began its search for a property in Noida and areas to the south of Noida along National Highway 8, such as Haryana, Manesar, and Bawal. The industrial park in Bawal was completely sold out as of 2006. The company received word that Phase III of the industrial park in Bawal of approximately 1,100 acres in size would be developed, thus Company A sent a letter to the development company, HISC (Haryana Industrial State Corporation), requesting the purchase of 30 acres. However, the Company A did not receive any response on the tentative time or price of purchasing the property. Subsequently, the company heard of another industrial park being built in Neemrana in the state of Rajasthan. It learned that the cost of property in Haryana was INR 1,800 per square meter, while that in Neemrana was INR 970 per square meter. The com-pany analyzed the distance factor (Manesar was 20–30 min away from Neemrana) and lot size and decided to set up operations in Neemrana because Honda decided to build a factory in Tapukara, located in Rajasthan as well.
• On Company B’s entry the Indian market, they selected a site near Delhi in the north, near Honda and Maruti Suzuki, after considering Bawal, Manesar, and Noida, but soon realized that the land suitable for an industrial park was scarce. In coordination with JETRO and RIICO, the company was introduced to Neemrana, an industrial park for Japanese companies, making Neemrana a potential candidate as their location. They selected Neemrana as it was less expensive and clearly defi ned property rights (provided by the state government of Rajasthan). JETRO being the intermediary to Neemrana, Company B thought of negotiations with the local government as credible.
• After thoroughly analyzing India to set up operations, including Mumbai, Pune, and Bangalore, Company C found that Neemrana was the only place they could acquire a substantial amount of property on which they could begin construction in the near future. In addition, Company C’s Indian sales subsidiary was located in Gurgaon.
6 India’s Neemrana Industrial Park for Japanese Firms

101
Factory Operations • According to Company A, labor employment at Neemrana is inexpensive,
despite the expenses such as bus fares for training and commuting. Indian factory worker capacity is not very different from its Chinese counterparts, and Company A considers worker quality as satisfactory. The company uses local suppliers for some raw materials, although most of it is imported from countries like Japan, and aims to increase the percentage of locally sourced parts.
• Before beginning operations in its Neemrana factory, Company B produced materials in Thailand, which it then supplied to a fi nished goods manufacturer in India. These materials entered the country at the Mumbai port, which were then transported by rail. The company currently imports most of their raw materials, but fi nds the need locally procure so as to strengthen its future cost competitive-ness. The company employs 46 Indians and six Japanese workers, and plans to become more localized by gradually reducing the number of Japanese expatri-ates. Ceasing operations according to Indian law is complicated for companies with more than 100 employees, inhibiting the company’s progress as it considers expansion.
• Company C procures almost none of its materials locally, but instead imports them from countries such as Japan, Thailand, and China. Thus, the need to begin sourcing them locally is felt; however, they fi nd it diffi cult to do so because of quality and other issues.
Risk Factors in Indian Industrial Parks and Expansion into the Indian Market 1. Company A was aware of the issues related with electricity, water, and sewerage
when it conducted a feasibility study on entering the Indian market. It had already determined and created a budget to prepare and handle such issues.• According to Company A, several reports must be fi led with various depart-
ments of the Indian government, and the use of a local consultant is manda-tory. Inquiries and requests are compiled during information sharing meetings and are submitted to RIICO. A Japan desk has been created within RIICO, which has proven invaluable by providing a one-stop service.
• Company A also notes that local negotiations are diffi cult for Japanese com-panies, making it important to hire quality locals as heads of general affairs and other positions.
• Groundwater was the biggest issue for Company A, the fi rst company to begin operations at the Neemrana Industrial Park. Water shortages were evi-dent with the second company setting operations in the park, and conditions on methods for drawing water, and the amounts they could draw became more stringent. Company A negotiated with the government agency having juris-diction over water through JETRO and RIICO.
2. Company B conducted a feasibility study before its entry into India, analyzing labor management (union issues), infrastructure (e.g., focusing on electricity and water issues, and incorporating in-house power generation into their plans), and other issues.
6.5 Companies Operating at Neemrana Industrial Park

102
• Company B was not of the notion that water-related issues would pose a potential problem. Because of no wastewater facilities, the company took it upon itself to process its own wastewater, using it in a garden. It thus feels that factories with large amounts of wastewater will have problems. Receiving approvals for water was most cumbersome. Water harvesting regulations required the company to replace groundwater used in excess of the amount of rainfall. However, the region is a desert receiving little rainfall.
• Company B also reports of complicated taxation policies. Cases of double taxation, as well as several different types of taxes, such as duties, state taxes, excise taxes, and inter-state taxes, are imposed and are understood only by Indian consultants. The company has trouble understanding refunds such as incentives.
3. Company C also notes of a severe water-related problem. They were unaware of rainwater harvesting before setting up operations; however, they are able to com-ply with regulations because they own an expansive property. All companies in the park have water-related issues, and are working in association with JETRO to resolve them. As a result, RIICO is in the process of constructing a reservoir, and the water stored there will be distributed to each company. In addition, in- house power generation via diesel is expensive.
6.6 The Smart Factory Concept at Neemrana Industrial Park
The DMIC provides a tremendous opportunity to solve infrastructure issues and, as a project of the Indian government supported by the Japanese government, is per-ceived to be an opportunity to increase commerce in the surrounding area. In the summer of 2008, Hitachi set up a business support center in Delhi to develop new projects in India and also promulgated the concept of a joint energy center within the Neemrana Industrial Park, a joint-use facility to supply electricity to companies in the Park. Electric power supply is constantly constrained within India, and power outages are common lasting for few hours during the course of a day. These circum-stances have caused companies at the Park to move toward in-house generation, although the costs to do so are high and can lead to an operational slow down. Also, because water is necessary to run diesel-based, in-house power generation systems, the joint energy center will serve to conserve water.
However, companies operating in the same region have already implemented in- house power generation equipment, and so a proposal to install and jointly use new gas turbine generators was not adopted. In 2009, Hitachi obtained funding from the New Energy and Industrial Technology Development Organization (NEDO) for research into the feasibility of an interchangeable system to supply stable electric power supply to Indian industrial parks by implementing micro grids and smart grids that would connect approximately 40 in-house diesel power generators (power generating capability of 20,000 kilo watts) where companies may freely share power generated by such a system.
6 India’s Neemrana Industrial Park for Japanese Firms

103
Ultimately, technical challenges surfaced and it was concluded that deployment of such a system was too complicated. However, Hitachi’s efforts have endured as the smart factory concept in the Neemrana Industrial Park. This concept received certifi cation as an “outsourcing project for research on infrastructure export promo-tion” from the Ministry of Economy, Trade and Industry (METI) in Japan, and with Sumitomo Corporation acting as the managing company, feasibility studies were conducted on three projects: (1) an electric power generation project, (2) a water treatment project, and (3) a logistics project. The power generation project was led by Kansai Electric, and with an anticipated increase in demand for electric power caused by new companies beginning production within the Park, the company is planning an electric and heat supply operation based on a co-generation system using on-site gas turbines (or gas engines). The water treatment project was led by Hitachi, which considered providing a treatment system for on-site wastewater. As a result of the feasibility study, the wastewater treatment project was canceled due to anticipated demand shortages required to make the system economically feasible. However, groundwater levels at Neemrana are found to be dropping, and it is pos-sible that the project would become economically feasible in the event that the Rajasthan government imposed stricter water recovery regulations. The logistics project was led by Nihon Express, which considered a proposal to make logistics both inside and outside of factories more effi cient via a milk-run system. However, freight theft is common in India, and implementing the project was deemed as dif-fi cult because, among other reasons, procedures to handle theft of goods from mul-tiple companies were complex.
METI outsourced this survey of infrastructure exporting under a system created to promote exports of infrastructure packages, such as electric power and water. Specifi c projects have been initiated as a result of the Neemrana feasibility studies. Project entities are accumulating the necessary know-how, expected to be laterally expanding to similar projects at other industrial parks. The DMIC is a large-scale regional development project sponsored by both Indian and Japanese governments, and latent demand for electric power and water systems within the Neemrana region alone is thought to be signifi cant. However, companies in the industrial park are required to expand operations within the confi nes of their own production plans and are not used to moving in tandem with implementing large, joint-use systems to become more effi cient. Accordingly, the project entities providing infrastructure must make investments somewhat ahead of the curve, requiring them to forecast demand and ascertain profi tability by appropriate means.
6.7 Significance of This Case Study and Suggested Questions
This case study was conducted to increase the understanding of operating environ-ments in India from the perspective of manufacturers and cultivate a sense based on actual examples that having friendly relations with local governments (in this case, the government of the state of Rajasthan) is pertinent to expanding businesses
6.7 Signifi cance of This Case Study and Suggested Questions

104
within developing nations. Further, this case study highlights the support provided by the Japanese government owing to the expansion of automotive parts companies into India, thus infl uencing the industrial competitiveness of automakers.
Companies in the Neemrana Industrial Park are primarily parts and materials suppliers to local automakers such as Suzuki and Honda; we began our discussion with their expansion into India. However, there are many lessons to be learned from this case study in regards to risk management during a foreign expansion. In addi-tion, the smart factory concept used by industrial parks provides a basis for further consideration of the possibility of infrastructure operations (for example, the com-plex service operations case study in Chap. 5 ) in India.
Using this case study, the following questions can be considered to further deepen the understanding of global strategy:
• The Neemrana Industrial Park was created in cooperation between the Indian and Japanese governments. Why did both governments work together on this project? Why is government involvement needed?
• What are the risks for building factories in India? How can companies reduce their risk by locating their facilities within an industrial park, such as the Neemrana Industrial Park?
• The smart factory concept was the subject of a feasibility study sponsored by the Japanese government. Is this project feasible? Detail the feasibilities of electric power, water, and logistics services.
• It is thought that infrastructure services (electric power, water, logistics, etc.) provide extensive business opportunities in India. How should Japanese fi rms participate in these opportunities?
Open Access This chapter is distributed under the terms of the Creative Commons Attribution Noncommercial License, which permits any noncommercial use, distribution, and reproduction in any medium, provided the original author(s) and source are credited.
6 India’s Neemrana Industrial Park for Japanese Firms

Part II
Fundamentals of Strategic Planning

107© The Author(s) 2015K. Motohashi, Global Business Strategy, Springer Texts in Business and Economics, DOI 10.1007/978-4-431-55468-4_7
7 Alliance-Based Global Strategy
7.1 Introduction
When creating new operations overseas, companies must fulfi ll various require-ments, such as providing benefi ts for local employees, fi nding sources for materials and parts, creating logistics infrastructure including new distribution channels, and gaining regulatory approval for the operations. Instead of doing these tasks indepen-dently, it is more practical for companies to cooperate with local businesses. In addition, companies can reduce their overseas investment risk through joint ven-tures (i.e., joint investment companies) with local entities instead of creating wholly owned local subsidiaries. Without cooperation with a local company, it becomes diffi cult to smoothly launch new business operations in emerging nations such as China and India, which have business environments that are very different from those of advanced countries. As stated in Chap. 4 , these emerging countries do not possess adequate market mechanisms or economic legislations such as corporate law, making business transactions unpredictable. Alliances with local companies are effective in fi lling such institutional voids (Khanna and Palpu 2010 ). However, expanding operations via joint ventures with local companies does have the disad-vantage of diminished autonomy because of the intervention of local fi rm’s manage-ment. Even when companies decide that increasing headquarters’ control in a company-wide global strategy is an appropriate course of action, it is possible that the strategy might not come to fruition because of opposition by joint venture part-ners. In this chapter, we fi rst analyze the option of a joint venture with a local part-ner when expanding globally, and then present a formal discussion on strategic alliances. A joint venture is a form of alliance; however, companies can also form contractual alliances, such as licensing agreements and joint operating agreements. In addition, many relationships with strategic alliance partners extend to the long term, and alliance management skills after establishing a joint venture or entering into an agreement have a tremendous impact on performance. In this chapter, we

108
discuss the following three necessary management phases: (1) the alliance project development phase, (2) the alliance structure design phase, and (3) the alliance exe-cution phase.
Finally, we examine local government partnerships. As discussed in Chap. 5 , overseas infrastructure development operations often take the form of Public–Private Partnerships (PPPs), in which a government and a private industry jointly manage operations that have been the domain of local governments in the past. In emerging countries, many Western companies aggressively participate in infrastruc-ture operations such as water distribution, railways, and roadways. Moreover, there has been a lag in Japanese companies’ participation; however, the Japanese govern-ment has recently taken measures to encourage “infrastructure exports.” Currently, these infrastructure operations in emerging markets have gained momentum from both public and private sectors. As an example of an alliance with government or public institutions, we discuss infrastructure operations and deepen our understand-ing of management issues specifi c to PPPs which are different from alliances between private corporations.
7.2 Wholly Owned Subsidiary or Joint Venture with Local Companies
In this chapter, we discuss the options of establishing a wholly owned local subsid-iary and creating a joint venture with a local company. In joint ventures, the infl u-ence of the local partner on management varies in terms of the share of investment. As a general rule, if the parent company is the majority investor (i.e., 51 % or more of the total investment), it can control the operations for those matters that can be decided by the majority vote. However, critical management issues sometimes require a two-third vote or an agreement of a super majority, during which the com-pany cannot ignore the infl uence of a minority partner on the management.
Furthermore, in emerging countries, companies must exercise caution because government regulations often cap the level of investment by foreign fi rms. For example, in China’s automotive industry, foreign fi rms are limited to hold up to a maximum stake of 50 % in a joint venture. Toyota and Volkswagen have entered the Chinese market through joint ventures with local companies: Toyota partnered with the FAW Group and the Guangzhou Automobile Group Co., and Volkswagen part-nered with the FAW Group and the Shanghai Automotive Industry Corp. In emerg-ing countries, private companies are not adequately mature, and joint venture partners are often government owned. Toyota’s and Volkswagen’s joint venture partners are government owned. Therefore, in such cases, companies negotiate joint ventures with governments, making it diffi cult for companies entering the market to fi rmly negotiate conditions. In this book, we discuss the cases of Hitachi Construction Machinery (Chap. 8 ) and Shiseido (Chap. 10 ), and their entry into the Chinese mar-ket, as well as Suzuki Motor Corporation’s (Chap. 14 ) entry into the Indian market. In all of these cases, the governments in the host countries requested the companies to enter their markets as joint venture partners. Investment regulations for foreign
7 Alliance-Based Global Strategy

109
fi rms have recently begun to relax in emerging countries; however, even in cases where companies enter a market via a wholly owned local subsidiary, it is best to maintain good relations with the governments in the target countries.
We now summarize the strengths and weaknesses of wholly owned subsidiaries and joint ventures with the assumption that companies entering a market can freely choose either form. One advantage of a wholly owned subsidiary is the freedom of management toward the local entity. In particular, when entering via a globally inte-grated management as per I-R grid (i.e., “I”-type management) covered in Chap. 2 , a company must ensure that the local entity is given a certain degree of discretion in management. On the other hand, when entering via a joint venture, companies can mitigate their market entry risks. Suzuki Motor Corporation entered India in 1982 via a joint venture with Maruti Udyog with a total investment of 26 % in the venture. This was the fi rst case of a foreign company entering India’s automotive industry, thereby placing Suzuki in a high risk situation. This is why Suzuki decided to limit their level of investment. The Indian government, in fact, offered Suzuki to make a 40 % investment; however, Suzuki was adamant about maintaining the lowest pos-sible share, suffi cient for the company to exercise veto rights for important management- related decisions (where a three-quarters vote was required).
In addition, when companies expand overseas via joint ventures, their likelihood of having a smooth local launch increases. In the case of production facilities, such as factories, companies do not have much to gain technically from companies in emerging countries, but local sales necessitate the creation of customer relation-ships and retail and distribution channels, which can be diffi cult without support from local partners. Partnering with companies with already existing local channels enables the rapid launch of operations. Furthermore, when government-owned companies are joint venture partners, companies can make allies of the government, which is necessary in running operations in emerging countries. This model has many advantages for local operations.
When deciding between a wholly owned subsidiary and a joint venture, compa-nies must weigh the advantages of “freedom in managing the local entity” versus “local risk factors.” In other words, companies must balance between the expected profi t from the management resources of their joint venture partners (e.g., distribu-tion channels or local government relationships) and the costs related to those resources. For example, companies may discover that the retail stores and other parts of the distribution channel held by the joint venture partner are ineffi cient, and the benefi ts of using existing channels are low. In that case, local entities must create new distribution channels and strengthen their sales capability, despite the possibil-ity that the company cannot establish new sales routes as was hoped because of opposition from existing retail stores. On the other hand, if a joint venture partner has a powerful distribution channel, they are likely to demand more in return. How should companies respond to joint venture partners that predicate cooperation on receiving high-level product technology? Although this process is rather diffi cult to achieve, entering companies must clarify the joint venture partner’s management resources and the conditions of forming a joint venture, while both parties attempt to disclose information to each another during negotiations. This is particularly true
7.2 Wholly Owned Subsidiary or Joint Venture with Local Companies

110
for companies that speak different languages with different business environments. Accordingly, entering into a joint venture with a local company can be an effective means of reducing investment risks in the target country when a company signs a joint venture agreement. However, companies must be careful of the increased risk as compared with entering a new market as a wholly owned subsidiary.
The company’s ability to manage such an increased risk is signifi cantly depen-dent on its global business experience. The business environment, government rela-tions, and the types of risks that are manifest are different in target countries. Therefore, management style undertaken by the company in China should differ from the one undertaken in India. Risk analysis in each country should not only utilize various information sources and the advice of consulting fi rms, but also cre-ate a knowledge base of experiences of companies to create an infrastructure that makes the most of new project formulation.
In Chap. 2 , we stated that Japanese companies often use a “globally integrated” form of organization, compared with their European and US counterparts. However, as a result, Japanese companies often enter markets as wholly owned subsidiaries rather than create joint ventures. For example, according to the results of a 2005 survey on medium- to large-sized foreign manufacturing fi rms in China, the per-centage of foreign subsidiaries was approximately 60 % among Japanese compa-nies, and only approximately 40 % among Western companies (Motohashi 2011 ). Japanese companies lack the ex post risk management ability required for joint ventures, resulting in a higher percentage of wholly owned subsidiaries and increas-ing the likelihood of companies not enjoying the benefi ts offered by joint ventures. Typical Japanese companies striving for a transnational form of management orga-nization must strengthen their local orientation, for which reinforcing the manage-ment capability of joint ventures with local companies becomes critical.
7.3 Alliance Forms and Management Methods
For global businesses leveraging joint ventures, the economic value derived from the joint venture is an important consideration. Joint ventures require win–win situ-ations that are benefi cial to both the company and its alliance partners. Alliances include capital transactions with a partner company, as in the case of joint ventures, as well as agreement-based relationships, such as licensing or joint operating agree-ments, with local companies. In a discussion of whether a company should have a joint venture or a wholly owned subsidiary as per the preceding paragraphs, a com-parison is made for capital transaction between the case of an alliance with another partner and that of external transactions where the acquiring company has an initia-tive. When creating a local entity that is a wholly owned subsidiary, they can do so via green-fi eld investment or acquisition of a local entity. The latter is done as an external capital transaction and differs from a joint venture such that the transaction focuses on the acquiring company (Fig. 7.1 ).
Contract-based transactions sometimes require alliances with other companies and involve subcontracting or outsourcing while maintaining company focus.
7 Alliance-Based Global Strategy

111
Regarding the differences between capital transactions (joint ventures) and con-tract-based licensing and joint operating agreements, as was explained in the pre-ceding paragraphs, the joint infusion of capital from a foreign and a local company to create an entirely new local entity is characteristic of joint ventures. On the other hand, a license agreement does not involve new entity creation, but is rather a way to launch a new business in partnership with a local company on contract basis. For example, a foreign company may provide the technology with which a local com-pany manufactures products on the basis of a technology introduction agreement, and sells them to the local market. In doing so, as defi ned by the license agreement, the local company pays a certain percentage of revenue to the foreign company as a license fee. Joint operations, such as joint development or joint production, are man-aged by contract that decides capital splits and the attribution of results to achieve a specifi c operational goal held by multiple companies. We divide the management used to promote these alliances into three phases: (1) the alliance formulation phase, (2) the alliance structure design phase, and (3) the alliance execution phase (based on Kale and Singh ( 2009 )).
The alliance formulation phase begins with a search for a joint operation partner. For example, let us consider a Japanese consumer electronics manufacturer that is intent on entering the Chinese market and is in search of an alliance partner. It is a fact that operations in China will reduce the cost of production; however, for this they will require the creation of distribution channels. The manufacturer realizes that a local partner is necessary as this will not be feasible with company resources alone. What are the requirements of an optimal partner? Having complementary business resources are certainly important in forming an alliance. The Japanese consumer electronics manufacturer possesses production technology with superior
Joint
Venture
Wholly
owned
Subsidiar
License
Agreement/
Research
Sub-contract-
ing and
Outsourcing
Capital Transaction
Joint Operation
Company-based
Contract Base
Fig. 7.1 Comparison of business transaction types
7.3 Alliance Forms and Management Methods

112
low-energy requirement and functionality. However, from a price perspective, sell-ing these products will be diffi cult in China, therefore requiring the manufacturer to reduce production costs and trim functionality to localize the product. Furthermore, the company needs to establish distribution channels in the Chinese market. Integrating all of these requirements, we conclude that the optimal partner for this company will be a large consumer electronics manufacturer with a high market share and a certain amount of technical capability in China, thus creating a win–win situation for both parties. Assume that the Chinese consumer electronics manufac-turer asks for technology that it does not possess currently, such as energy- saving technology, in exchange for its distribution channels. The Japanese manufacturer must carefully analyze and respond to these demands with caution, for the risk of losing the deal because of inadequate incentives to form an alliance with the foreign company.
Selecting an alliance partner in this manner requires identifying business resources that are complementary to both parties and fi nding a form of partnership that is benefi cial to both. However, it is often the case that neither of the two parties fully understands the benefi ts of the alliance until it is operational. Thus, in addition to the complementarity of the business resources, consistency of management styles and a mutual commitment to the alliance is also important (Beamish 1987 ). For example, in terms of management styles, companies may choose to focus on short- term profi ts or build long-term businesses, or several other areas, such as respond to environmental issues. When these fundamental management philosophies are aligned, companies will most likely not hold adversarial opinions in their partner-ship. In terms of commitment, it is ideal for both parties’ managements to commu-nicate regarding the alliance and work constructively toward the goals of the alliance when any differences in opinion arise.
Deal formulation takes place at the alliance structure design phase: should a company create a capital partnership or an agreement-based partnership, and what specifi cally should the contents of the agreement look like? Large capital invest-ments by both parties of the joint venture require a strong commitment from both sides to jointly manage the business; this form of alliance has the benefi t of engen-dering an awareness of both parties being “in the same boat” (Hennart 1988 ). In addition, the rules for distributing results generated by the alliance are made clear by the levels of investment made by each party. However, establishing the new joint venture company entails a large sunk cost, making it diffi cult to rectify major course corrections in managing operations and compromising fl exibility. For example, after the initiation of joint venture operations, if the economic environment changes or results do not meet expectations, reaching an agreement to dissolve the joint venture can be diffi cult. Even for a single company, the decision to exit an unprofi t-able business is diffi cult and takes time. In the case of a joint venture, the decision must be made simultaneously by both companies.
On the other hand, efforts to create agreement-based alliances, such as those based on license agreements or joint operating agreements, enable a more fl exible
7 Alliance-Based Global Strategy

113
response to agreement changes or perhaps even dissolution of the joint operations. However, this fl exibility comes with limitations: neither party commits to the alli-ance. For alliances, the fact that both parties work together to create new value is critical, and often, alliances do not work if neither party is committed. In other words, agreement-based alliances are effective when both parties have clear delin-eations of responsibility and results are expected in a relatively short timeframe. On the other hand, capital-based alliances with clear commitment from both parties are required for building cooperative relationships over a long timeframe and across broad areas.
Finally, we discuss the alliance execution phase, a period when the joint venture is established or a license agreement has been entered into, and the alliance shifts into the execution stage. Returning to the example of a Japanese consumer electron-ics manufacturer entering the Chinese market, it is expected that the local company alliance will extend into the long term. On the other hand, the Chinese economic environment is rapidly changing, and urbanization, along with lifestyle improve-ment among Chinese citizens, is resulting in a change in demand for consumer electronics products. Accordingly, the process of going ahead with a partnership may be accompanied by unforeseen circumstances after the alliance agreement is signed, and appropriate corrections will need to be made through mutual discus-sions to analyze the direction of the alliance. Trust between the parties is important in this case. Repeating the process of negotiation, mutual understanding, commit-ment to compromise, and the execution of compromise consistently are necessary to build this trust (Ring and Van de Ven 1994 ). Alliance partners share highly con-fi dential information through this process, therefore, reducing the asymmetric nature of information among the parties. This results in clearer compromises on both parties and lesser indulgence in opportunistic behavior, which can be detrimen-tal to the other party. Building trust among alliance partners is the most effective means to reduce the risk of entering into an agreement—one of the demerits of joint ventures.
So far we have discussed the management of different types of alliances; we conclude with the overall countermeasures that a company may undertake. As pre-viously stated, alliance management differs by country, region, industry, and type of operation. Because alliances presuppose multiple parties, building effective rela-tionships greatly infl uences partnership results. Thus, using company experiences and organizational efforts in a potential alliance is critical toward the overall improvement of the alliance. Building alliance knowhow organizationally requires a department specialized in alliance management (Anand and Khanna 2000 ). Western companies, such as Hewlett-Packard, Eli Lilly, and Philips, have estab-lished such departments, thereby increasing the success rate of their alliances (Kale and Singh 2009 ). In Japan, efforts are being made to create such departments that focus on alliance management, particularly among pharmaceutical companies; however, Japanese companies still lag behind Western companies. Creating a dedi-cated alliance function at the fi rm is an effective means to accumulate knowhow from existing partnerships and to use this knowhow in new potential alliances.
7.3 Alliance Forms and Management Methods

114
(multiple)
Financial
Partner
Government
Users
Public
Institutions (e.g.,
Rail Companies)Special Purpose
Company (SPC)
(multiple)
Investors
Suppliers
PPP AgreementInvestment
Project Financing
Financing
Regulations
Monitoring (e.g.
fare approvals)
Service
Provision
Purchasing (construction, equipment, etc.)
Fig. 7.2 Structure of PPP (Public Private Partnership)
7.4 Governments as Alliance Partners in PPP Infrastructure Businesses
So far we have examined alliances between private corporations. This section ana-lyzes the issue of partnering with local governments as a means of expanding glob-ally. Using the example of PPPs, which mainly deal in infrastructure-related projects, such as roadways, railways, and waterworks, we summarize the salient features of partnering with governments and the management involved in such partnerships.
In Chap. 5 , we discussed the systems integration business in the context of infra-structure exports. For example, providing rail transportation services for people and freight requires the knowledge of signal systems, railcar management, and other operational factors, in addition to hardware infrastructure such as rolling stocks, railways, and stations. This, in turn, requires the creation of an overall consistent system that combines all of these elements, which are fi ne-tuned to function with all other parts. In addition, we discussed the necessity of systems integration, focusing on technical peculiarities to build such a large-scale system. In this chapter, we focus our discussion on the organizational aspects of managing actual operations, in particular, the partnering of public and private sectors to facilitate a successful venture.
Figure 7.2 presents a typical PPP business organizational structure. First, the government or public institution (in the case of railways, a business management agency such as a nationalized rail company) is the primary entity behind the public works service. The government (or public institution) enters into a PPP agreement with a special purpose company (SPC) established specifi cally for the purpose of maintaining the infrastructure—here both public and private entities manage the
7 Alliance-Based Global Strategy

115
business. One form of PPP agreement often used is the build, operate, and transfer (BOT) method. In such a method, the government subcontracts the building and operation of infrastructure, after which the private company transfers ownership of the infrastructure back to the government once the business is complete, over an extended period of 30–40 years. The business is operated according to the agree-ment entered into with the government, thus providing rail or other public services to ordinary users. The company is subject to safety regulations, fee approvals, and other forms of oversight. Many SPCs involve joint ventures with multiple compa-nies, in which an investment company provides the capital and the banks provides the project fi nance. In addition, the SPC orders construction services and equipment from construction companies, equipment manufacturers, and other suppliers to cre-ate the infrastructure. On the project’s entry to the business operation phase, the SPC subcontracts business management to specialists. Infrastructure companies such as Alstom and Bombardier in the railway business, and Veolia and Suez in the waterworks business are suppliers to specialty fi rms such as equipment manufactur-ers and business operation specialists; these infrastructure companies are often SPC investors.
When providing infrastructure and public services, the government (or public institution) normally places orders directly with suppliers in the form of public works projects, after which public institutions such as national railway or highway companies operate the infrastructure. However, in PPPs, capital procurement and operational risk are shared by both parties, and performance is often improved. Particularly in emerging countries, infrastructure demand exceeds public funding, and government agencies lack the necessary experience to operate the businesses. Thus, PPPs with their private specialty technology and knowhow are analyzed with high expectations. PPPs are a form of alliance between public and private sectors. Note that this is different from the subcontracting and outsourcing shown in Fig. 7.1 . In the case of public works projects, the government decides the infrastructure spec-ifi cations, and private companies place bids for the business, making these projects similar to outsourcing or subcontracting. In comparison, PPP agreements promote innovation within private companies in the process of infrastructure creation through business operation. Such a framework is created with the intention to increase pub-lic services’ return on investment (ROI). This does not imply that governments completely allocate the provision of public services to private companies. The gov-ernment must ultimately provide a stable, high-quality service to citizens, and mon-itor the activities of private companies, while being involved in the operation of the business as required. Alternatively, where continuing a business led by private com-panies has become diffi cult because of unforeseen changes in the economic envi-ronment at the time when the PPP alliance was created, government institutions can support the business itself through policy benefi ts and funding. Between public institutions that aim at increasing public welfare and for-profi t private corporations, there are, to a certain extent, contradictions in policy in the operation of the busi-ness, but ultimately, creating a relationship of trust between public and private sec-tors to establish a win–win situation is critical. This feature has a lot in common with alliance management between private companies.
7.4 Governments as Alliance Partners in PPP Infrastructure Businesses

116
There are general risks in the construction and operation of infrastructure proj-ects, such as economic changes and disasters, as well as business-specifi c risks such as construction delays or a decline in the number of users. On directly operating the business by a country, these risks fall on the country itself; however, in case of a PPP, the risk is shared between public and private sectors. The value added of PPP businesses arises from risk-sharing optimization. Figure 7.3 summarizes the various risks associated with infrastructure projects that are to be assumed by government (or public institutions) or the main driver of the business—the SPC. The overall project is divided into the infrastructure creation stage (engineering, procurement, and construction, (EPC)) and service stage (operation and management, (O&M)). In the EPC stage, the government assumes the risk of land acquisition and delays in administrative procedures. First, system design occurs before the EPC stages. This design is formulated by specialists and is based on the government’s business goals in terms of the public service, its scope, and service levels. The risk of design defi -ciencies is, of course, borne by the government. On the other hand, capital procure-ment for EPC is done by the SPC, and fi nance risk should be borne by the private sector. As for procurement and construction, necessary work should be given to equipment manufacturers and construction companies. For example, construction risk, such as delays in construction, should be borne by the private sector (the SPC and subcontracted construction company).
Once the infrastructure is in place, projects enter the O&M stage, with risks of administrative procedure delays, which push back the launch of services, and politi-cal risks that originate from regulatory and policy changes during the term of the PPP agreement. Therefore, these risks should be borne by the government. On the other hand, the SPC that operates the business should undertake the responsibility
EPC: Engineering, Procurement, and
Construction
Land acquisition/Delayed
administrative procedures/Design
deficiencies
FinanceContractor
management (e.g., construction delays)
O&M: Operation and Maintenance
Policy & regulatory changes/Delayed
administrative procedures
Offtakeinflation/Disasters
FinanceAsset & technology
corruptionContractor management
(e.g., service quality)
Government
SPC
Fig. 7.3 Risk sharing between public and private entities
7 Alliance-Based Global Strategy

117
of stably providing a certain level of service during the term of the PPP agreement. To do so, the management of the infrastructure service may be contracted to a spe-cialty company, in which case the risks in that agreement should be borne by private companies. Asset and technology obsolescence and fi nancial risk should be assumed by private companies in principle. In the O&M stage, depending on the businesses, both public and private sectors must consider the optimal sharing of risk. For exam-ple, the risks of infl ation or disasters cannot be controlled by either public or private entities. It is normal for both parties to clearly delineate how these risks are to be shared in the PPP agreement. Furthermore, using disaster insurance externalizes disaster-related risks, and the fees can be added to the operating costs of the busi-ness. Off-take risk (from users) is important during the O&M stage. However, the risk size depends on the nature of the infrastructure. For example, governments or public institutions enter into long-term service acquisition agreements for wastewa-ter treatment businesses because, generally, the amount of wastewater to be treated does not overly fl uctuate, thus creating a marginal off-take risk. On the other hand, in a railway business, the number of passengers, as well as long-term changes in them, cannot be accurately forecasted. In addition, fares must typically be approved by the relevant government agency; therefore, it is likely that such fares will be offered at subsidized rates—typical for a public service. Accordingly, these kinds of services have a high off-take risk. The off-take risk in railway services can become too large, and it is typical for governments to undertake a certain amount of risk as part of the PPP agreement, with provisions for government subsidies on fares when the number of expected passengers drastically falls (so-called ridership clause).
Emerging countries do not often have a legal code governing PPPs, and govern-ment agencies lack such knowledge. This sometimes causes negotiations for agree-ments and business operation to go awry. There are also great political risks due to agreements being trashed by political instability or regime changes. These political risks must be accepted as part of conducting business for private companies over-seas, and are likely to be the greatest risk factor in the infrastructure business within emerging countries. However, PPP businesses must not exclusively be perceived as businesses between governments and private companies; there is an analytical framework that accounts for the intent of service recipients, such as civic action in the partner nation (Kivleniece and Quelin 2012 ). This framework treats civic actions referred here as a force that confronts political risk with a bias toward the govern-ment’s objective of maximizing public interests in politicians’ election cycles. In democracies such as India, where one can relatively depend on the power of civic action, it is possible to minimize political risk by providing quality public services to local residents. Corporate social responsibility (CSR) activities are another effec-tive means to this end.
That said, in emerging countries with little government experience in PPP busi-nesses, one cannot depend on risk sharing, as shown in Fig. 7.3 . Generally, in these cases, it is appropriate to have an agreement that offers a high degree of indepen-dence to private operators, which, to the extent possible, does not allow interference by the partner government through monitoring of the business. However, in such a case, the private company must bear a larger share of risk. Accordingly, the needs
7.4 Governments as Alliance Partners in PPP Infrastructure Businesses
118
may be high for PPP businesses in emerging countries, but in reality, the risks are too high for private companies to independently undertake, and therefore not many companies enter the infrastructure businesses in these countries. Japanese compa-nies, in particular, have a strong track record as equipment suppliers, such as water treatment membranes for water projects and train cars for railway systems, but have not participated as operators of these businesses. Infrastructure exports have been prioritized in the government policy and measures have been taken to strengthen the trade insurance system and utilize offi cial development assistance (ODA). However, conducting risk analysis for projects or countries and painstakingly negotiating the required risk sharing with the partner government agencies is what is required the most. In doing so, companies must select businesses that are in high demand in specifi c countries to develop compelling proposals that have merit for these coun-tries too. It will also be effective to partner with local companies or companies in countries, such as Singapore, that are working actively on expanding infrastructure businesses in India and China.
7.5 Conclusion
In this chapter, we discussed alliance strategy and management for global busi-nesses. The creation of a local entity presents pros and cons to wholly owned sub-sidiaries and joint ventures. In summary, selection of the tradeoff is between reducing pre-market entry risk (joint ventures) and post-market entry risk (wholly owned subsidiaries). Reducing ex post facto risk through joint ventures requires a management appropriate to each phase in an alliance: alliance formulation, alliance structure design, and alliance execution. It is also effective for companies to create a knowledgebase of alliance experience and establish a specialized division that focuses on alliances to effectively move forward with new deals. Companies with a high level of alliance management capability can reduce the ex post facto risk of joint ventures, and thus opt to make business transformations through alliances with local companies.
In this chapter, we discussed the expansion of global businesses through alli-ances based on the creation of complementary relationships with local companies. Strategic international alliances can take on the forms of co-specialization (partner-ships with complementary assets), co-option (selective partnerships with competi-tors) to pursue scale merit at a global level, and learning and internalization with the objective of strengthening internal capabilities through an alliance (Doz and Hamel 1998 ). Co-option is prominent in the electronics industry, which requires speedy business decision-making and scale merit. On the other hand, learning and internal-ization is appropriate to the automotive industry, where it is critical to increase pro-ductivity by adopting strength in production and other technologies that differ from one company to another. Japanese companies tend to exhibit the “not invented here” syndrome and lag behind in terms of creating international alliances. However, alli-ance strategy is an important component in a company’s management strategy from a global perspective, and it is thus important for companies to deepen their under-standing of various forms of alliances and proactively work on these alliances.
7 Alliance-Based Global Strategy

119
We concluded this chapter by discussing government alliances in the form of infrastructure businesses through PPPs. They do not merely involve the subcon-tracting of operations by governments to private corporations, and must be under-stood as an alliance between public and private sectors to increase business values by sharing business risks and maximizing benefi ts to both parties that form the alliance. Governments in emerging countries possess limited ability to manage PPP businesses, thus private companies have no other option but to undertake excess risk. Despite the high risks, the incentives to pursue infrastructure business-related PPPs in emerging countries is strong, and such business opportunities abound. Japanese companies must therefore carefully analyze the underlying risks related to infrastructure projects and make business proposals on the basis of governments’ needs in these countries, and patiently negotiate the sharing of appropriate risk lev-els. Companies may also fi nd it effective to enter into alliances with local compa-nies in negotiating projects with governments in host countries.
Open Access This chapter is distributed under the terms of the Creative Commons Attribution Noncommercial License, which permits any noncommercial use, distribution, and reproduction in any medium, provided the original author(s) and source are credited.
References
Anand, B., & Khanna, T. (2000). Do fi rms learn to create value? The case of alliances. Strategic Management Journal, 21 (3), 295–315.
Beamish, P. (1987). Joint ventures in LDCs: Partner selection and performance. Management International Review, 27 (1), 23–27.
Doz, Y. L., & Hamel, G. (1998). Alliance advantage: The art of creating value through partnering . Boston: Harvard Business School Press.
Hennart, J. (1988). A transaction cost theory of equity joint venture. Strategic Management Journal, 9 (2), 141–158.
Kale, P., & Singh, H. (2009). Managing strategic alliances: What do we know now and where do we go from here? Academy of Management Perspectives, 26 (2), 45–62.
Khanna, T. & Palpu K. G. (2010). Wining in emerging markets: A roadmap for strategy and execu-tion . Boston: Harvard Business School Press.
Kivleniece, I., & Quelin, B. V. (2012). Creating and capturing value in public-private ties: A private actor’s perspective. Academy of Management Review, 27 (2), 272–299.
Motohashi, K. (2011). Chapter 1. Shinkoukoku Shijou ni Muketa Gijutsu Keiei Management: Nihon Kigyou no Genjou to Kadai. In W. Toshiya (Ed.), Global Business Senryaku . Tokyo: Hakuto Shobo.
Ring, P., & Van de Ven, A. (1994). Developmental processes of cooperative interorganizational relationships. Academy of Management Review, 19 (1), 90–118.
References

121© The Author(s) 2015K. Motohashi, Global Business Strategy, Springer Texts in Business and Economics, DOI 10.1007/978-4-431-55468-4_8
8 Hitachi Construction Machinery: Becoming a Wholly Owned Chinese Entity
8.1 Introduction
In 1995, Hitachi Construction Machinery Co., Ltd. (HCM) established a Chinese subsidiary, Hitachi Construction Machinery (China) Co., Ltd. (HCMC). Since then, the company has established close relations with the city of Hefei in the Anhui Province and has steadily built a strong business reputation of being a quality com-mitted local fi rm. HCM’s operations in China began as a joint venture (JV) with a local, state-owned fi rm, Hefei Mining Equipment (Hefei Mining). Later dissolving this JV, HCM now operates as a wholly owned subsidiary. HCM’s China business is often cited as a successful example of a global business, although the road to acquir-ing that success was not often smooth and included negotiations with the JV partner and the creation of an internal management system.
In 1970, HCM spun off from Hitachi Ltd. to become an independent construc-tion machinery manufacturer. It currently holds the world’s third largest market share in construction machinery manufacturing following Caterpillar and Komatsu (Table 8.1 ).
Apart from HCM’s widely popular hydraulic excavator, the company is also globally known for its other construction machinery, such as wheel loaders, mini excavators, dump trucks, cranes, and forklifts. The company does not rely too heav-ily on demand from any one specifi c region, and its sales headquarters in Japan manage operations in six regions throughout the world, in addition to Japan: North America, EMEA (Europe, Russia, and the Middle East), China, Asia-Pacifi c, India, and Africa (as of October 2012).
Responsible for this global expansion is the powerful “Made by Hitachi” brand that delivers the same quality no matter its country of origin. Along with the increase in headcount as a result of the group’s overall expansion, HCM has built an educa-tion system for global employees and has aggressively attracted employees from overseas companies to its research institute in Kasumigaura, Japan, built in 2007. The Kasumigaura Institute offers programs for language instruction, development

122
of overseas application skills, and strengthening in areas of specialization. In addi-tion, the increasing demand in emerging markets has accelerated the transfer of production technology to overseas manufacturing locations to reduce costs. In 2005, HCM created the “Global Production Improvement Headquarters,” sending welders and other skilled technicians to visit foreign plants and partner companies to improve quality. Seen from a company-wide perspective, in 2011 HCM’s global operations remained high, with overseas sales constituting 75 % of its total. However, the Chinese share of overseas revenue is the largest; therefore, making it a strategically important market for HCM (Table 8.2 ).
8.2 Hitachi Construction Machinery (China) Co., Ltd
8.2.1 Background
Since the latter half of the 1980s, HCM has implemented a global strategy of expan-sion by creating sales and manufacturing bases in North America, Europe, and Asia. The construction machinery market in the 1980s was dominated by Chinese-made hydraulic excavators that sold for CNY 400,000 apiece. By comparison, HCM’s hydraulic excavators were CNY 800,000. However, Chinese excavators did not meet customer requirements in China; therefore, second hand excavators by Japanese manufacturers are imported and mainly used in China. In the beginning in
Table 8.1 Global construction machinery manufacturers’ revenue (fi scal year 2011)
Company Revenues (100 millions of yen)
Caterpillar 15,734
Komatsu 18,431
Hitachi Construction Equipment
7,738
Volvo Construction Equipment 7,279
Case New Holland 3,038
Source : Corporate annual reports
Table 8.2 Hitachi Construction Machinery’s revenue by region
Units: M yen 2004 2005 2006 2007 2008 2009 2010
Japan 150,029 203,425 238,549 248,733 213,703 171,700 172,700
US 91,490 119,222 125,129 88,518 79,178 37,200 62,400
EMEA 92,304 132,647 195,209 291,942 180,843 97,000 131,600
APAC 75,423 103,608 126,280 184,021 151,148 141,200 202,400
China 38,797 67,555 71,286 127,323 119,295 158,700 204,800
Total 448,043 626,457 756,453 940,537 744,167 605,800 773,900
Source : Hitachi Construction Machinery Co., Ltd
8 Hitachi Construction Machinery: Becoming a Wholly Owned Chinese Entity

123
the 1990s, HCM was attracted to China not for its factories, but for its markets, because it anticipated strong Chinese economic development. After evaluating manufacturing sites in China, HCM established a list of candidates in several regions. Around this time, China was coming off Deng Xiaoping’s Southern Tour Speech, which for the city of Hefei meant pressure to bring in foreign capital. Hefei was searching for a JV partner for the local powerhouse, Hefei Mining. Hitachi was already well known in China at the time and its brand name was the source of gov-ernment incentive for the JV.
The head of the Anhui Province, Hui Liangyu, as well as Hefei’s mayor, Zhong Yongsan, played key roles in the initial stage of HCM’s into China. Former Deputy General Manager of HCMC, Norio Hirota, noted the fervent invitations of Mayor Zhong to HCM (Japan Association for the Promotion of International Trade 2004 ):
As China began to attract foreign capital, Mayor Zhong approached Qiu Yonghan, known for being highly knowledgeable about Japan, serving as an economic advisor to the city of Hefei, while he was on a trip down the Three Gorges, and repeatedly informed to him about the level of urgency with which China wanted to bring in foreign capital into Hefei. Because of an introduction from Qiu Yonghan’s company, Hefei was included in a feasibility study that listed strong equipment manufacturers. Therefore, a relationship with Hefei began, and Mayor Zhong invited all involved parties to visit our company’s factory. Interactions of company executives and the parties associated at the factory, resulted in clearing of any doubts about Mayor Zhong’s fervency toward the introduction of foreign capital; it was just as Qiu Yonghan had described. (Interviews with Norio Hirota, July–October 2009)
On witnessing the mayor’s zeal and the support system put in place by the city government, Hirota refl ected that “the support system of the mayor’s city govern-ment and its strong leadership was an important factor in our decision to enter into the JV at Hefei, and this became a key to resolving issues that arose later.” (Interviews with Norio Hirota, July–October 2009)
For HCMC, the city of Hefei was attractive for reasons other than the mayor’s warm invitation. Hefei Mining, a worthy partner for HCM, was located there. In addition, Hefei is the capital of the Anhui Province and government organizations are concentrated there, making it easier to gain necessary approvals to operate a business. Additionally, Hefei has the China University of Science and Technology, a well-respected school, providing not only a readily available quality workforce, but also cheap labor because of Hefei’s location toward the interior. Other factors included the ease of distribution due to the presence of a port, proximity to areas in need of construction machinery, and the ease in securing a vast site of 360,000 square meters.
8.2.2 Creation of a Joint Venture
In April 1995, a JV called “Hefei Hitachi Excavating Equipment Co., Ltd.” was cre-ated in the economic technology development zone outside Hefei, some distance from Hefei Mining. The JV was primarily involved in the production of hydraulic
8.2 Hitachi Construction Machinery (China) Co., Ltd

124
excavators. The major shareholders were HCM, Hefei Mining, and Mitsubishi Shoji, in addition to Qiu Yonghan’s investment company, the Qiu Yonghan Group. The company began with a total of 320 employees, with HCM bringing over 20 expatriates from Japan and 300 employees from Hefei Mining. HCM was respon-sible not only for sales, manufacturing, production technology, production manage-ment, and procurement functions, but was also in charge of management, because it had a 55 % majority stake and had provided the chairman of the board and general manager of the JV. At the time, it was rare for foreign fi rms to control management of JVs in China, and there were complicated negotiations regarding which side would lead the company. However, these diffi culties were overcome through the efforts of the Hefei government. The JV primarily focused on sales and manufactur-ing of construction machinery. It procured simple parts (plate structures from welded steel plate, for example, booms, arms, and buckets) domestically, and imported all strategic parts (cylinders, engines, and hydraulic pumps) from Japan (Fig. 8.1 and Table 8.3 ).
Hefei Mining was a typical, large-scale, state-owned company with 2,500 employees with its own dormitories, hospitals, and schools. Although regarded as a quality manufacturer of mining equipment, it was incapable of designing the equip-ment independently, and the WY-type hydraulic excavators it produced, although less than half the price of Hitachi-manufactured excavators, exhibited poor perfor-mance and broke down quickly. With foreign fi rms’ entry into the Chinese market via the market-liberalizing policies of the Chinese government, Hefei Mining’s con-struction machinery quickly lost its market competitiveness. After the merger, HCMC made several proposals to revive Hefei Mining’s operations; they also con-structed a parts factory for HCMC within Hefei Mining that employed about 300 workers. This parts factory received technical guidance from HCMC. It primarily manufactured plate structures and supplied them to the JV, using production facili-ties and jigs loaned by HCMC.
Boom
Arm
Bucket
Cylinder
EnginePump
Fig. 8.1 Hydraulic excavator
8 Hitachi Construction Machinery: Becoming a Wholly Owned Chinese Entity
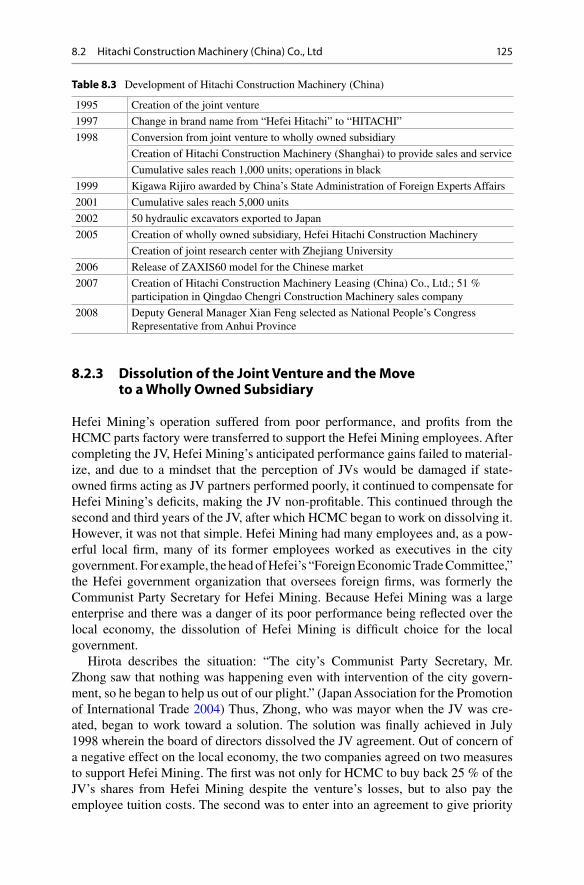
125
8.2.3 Dissolution of the Joint Venture and the Move to a Wholly Owned Subsidiary
Hefei Mining’s operation suffered from poor performance, and profi ts from the HCMC parts factory were transferred to support the Hefei Mining employees. After completing the JV, Hefei Mining’s anticipated performance gains failed to material-ize, and due to a mindset that the perception of JVs would be damaged if state- owned fi rms acting as JV partners performed poorly, it continued to compensate for Hefei Mining’s defi cits, making the JV non-profi table. This continued through the second and third years of the JV, after which HCMC began to work on dissolving it. However, it was not that simple. Hefei Mining had many employees and, as a pow-erful local fi rm, many of its former employees worked as executives in the city government. For example, the head of Hefei’s “Foreign Economic Trade Committee,” the Hefei government organization that oversees foreign fi rms, was formerly the Communist Party Secretary for Hefei Mining. Because Hefei Mining was a large enterprise and there was a danger of its poor performance being refl ected over the local economy, the dissolution of Hefei Mining is diffi cult choice for the local government.
Hirota describes the situation: “The city’s Communist Party Secretary, Mr. Zhong saw that nothing was happening even with intervention of the city govern-ment, so he began to help us out of our plight.” (Japan Association for the Promotion of International Trade 2004 ) Thus, Zhong, who was mayor when the JV was cre-ated, began to work toward a solution. The solution was fi nally achieved in July 1998 wherein the board of directors dissolved the JV agreement. Out of concern of a negative effect on the local economy, the two companies agreed on two measures to support Hefei Mining. The fi rst was not only for HCMC to buy back 25 % of the JV’s shares from Hefei Mining despite the venture’s losses, but to also pay the employee tuition costs. The second was to enter into an agreement to give priority
Table 8.3 Development of Hitachi Construction Machinery (China)
1995 Creation of the joint venture
1997 Change in brand name from “Hefei Hitachi” to “HITACHI”
1998 Conversion from joint venture to wholly owned subsidiary
Creation of Hitachi Construction Machinery (Shanghai) to provide sales and service
Cumulative sales reach 1,000 units; operations in black
1999 Kigawa Rijiro awarded by China’s State Administration of Foreign Experts Affairs
2001 Cumulative sales reach 5,000 units
2002 50 hydraulic excavators exported to Japan
2005 Creation of wholly owned subsidiary, Hefei Hitachi Construction Machinery
Creation of joint research center with Zhejiang University
2006 Release of ZAXIS60 model for the Chinese market
2007 Creation of Hitachi Construction Machinery Leasing (China) Co., Ltd.; 51 % participation in Qingdao Chengri Construction Machinery sales company
2008 Deputy General Manager Xian Feng selected as National People’s Congress Representative from Anhui Province
8.2 Hitachi Construction Machinery (China) Co., Ltd

126
to Hefei Mining for parts to support the company’s production volumes. When refl ecting upon on the dissolution of the JV, Hirota mentioned of the deep impres-sion that Zhong’s words left on him: “You are now free to make your way in the market without any hindrance, but you will fi nd it diffi cult!”
As Zhong said, after the JV was dissolved the company ran into various issues, including contract defaults. Hefei Mining was dissatisfi ed with the price-setting rules outlined in the above mentioned agreement and intentionally made late ship-ments before fi nally halting these shipments altogether. Because HCMC had entered into an agreement that did not allow procurement from other vendors, it had a tre-mendous impact on HCMC’s production lines. Therefore, HCMC proved that Hefei Mining breached the contract merely 3 months after signing the agreement and cancelled the prioritized procurement agreement. A failure to maintain standard practices in international trade on the part of Hefei Mining, such as not returning equipment, manufacturing counterfeit HCMC parts, and supplying HCMC parts to other manufacturers, led HCMC to take legal measures and the two companies entered into arbitration. There are two methods in China for legally resolving dis-putes: litigation in court and arbitration via organizations created for that purpose. Litigation in China is mostly similar to civil litigation in Japan. However, arbitration is not done in court, and when disputes arise decisions are handed out by mutually agreed upon arbitrators. Sales contracts in China generally have conditions regard-ing arbitration of disputes. In the event that no such condition exists in a sales con-tract, neither company can request arbitration. Disputes between foreign and domestic fi rms fall primarily under the Chinese International Economic Trade Arbitration Committee (CIETAC), which took 4 years to pass judgment in the HCMC case, handing down its fi nal fi ndings in 2003. However, under the Chinese system, if the conditions of an arbitration decision are not enacted within 6 months of the decision, then the arbitration decision is no longer in effect and litigation becomes impossible thereafter. HCMC’s former JV partner used this to its advan-tage, not abiding by the decision of arbitration before it expired in August 2003. In the end, HCMC recovered the loaned jigs and manufacturing equipment as the city government forced Hefei Mining’s top management into taking action. In addition to these direct troubles with Hefei Mining, company employees close to Hefei Mining disclosed confi dential information, thus sabotaging production. Resentful terminated employees forced the company into labor arbitration.
Hirota commented, “We thought a joint venture was a good idea because of the Chinese government’s policies for foreign capital introduction at the time, and to secure employees and sales channels, but in reality we faced many troubles with our joint venture partner. Also, because companies do not generally know the inside details of our joint venture partners in China, it can be diffi cult to ascertain their real fi nancial status. For example, it is diffi cult for foreign companies selling and pro-ducing locally to know the actual production cost of the joint venture’s products. This is because the accounting system in China is unique, and the joint venture company normally holds accounting information close to the vest.”
8 Hitachi Construction Machinery: Becoming a Wholly Owned Chinese Entity

127
8.2.4 Post-joint Venture Management
HCMC worked on product quality control, developing their resellers, and under-standing market needs while expanding their business in China. Because it provided thorough direction on technical and quality issues from the time its subsidiary was created, currently, from a technical perspective, the welding, assembly, and other areas in its Chinese products are indistinguishable from its Japanese counterparts.
Because of briskness of demand and a skyrocketing used-vehicle market, work previously done with small- and mid-sized hydraulic excavators was accomplished through the use of mini excavators, making HCMC’s operating environment extremely diffi cult; Japanese-style excavators did not fi t the needs of the Chinese market, and so, with the cooperation of its distributors, HCMC researched on how customers were using their equipment. The result of this research was the develop-ment of the ZAXIS60 mini excavator, specifi cally designed for the Chinese market. The ZAXIS60 has the durability of a mid-sized excavator, increased horsepower, a faster front arm, and other features that refl ect the needs of Chinese operators more closely. This Chinese model has been received well, resulting in the company being able to increase its market share in the mini excavator market, which was previously an oligopoly by Korean manufacturers.
Although the company had huge operating losses at the outset of its establish-ment, as a result of the above efforts, HCMC realized an annualized profi t within 3 years (1998). In the decade between 1998 and 2008, revenues grew dramatically. Even in the initial stages when the company’s revenues were small, its market share stood at 30 %. The company sold only 30 units in 1996, growing to more than 5,000 in 2003. However, due to tighter auto loan policies, including loans for con-struction machinery implemented by the People’s Bank of China in 2004 and 2005, the number of units subsequently sold dropped to around 3,500. Yet, sales fi gures recovered after 2006, and the company sold more than 10,000 units in 2008. HCMC expanded production in 2008 due to a lack of capacity; however, with the impact of the economic crisis in the fall of 2008 and the wearing off of the Chinese govern-ment’s measures to bolster the economy, production of equipment in recent times has been sluggish.
HCMC succeeded in producing low cost machinery at the same level of quality expected in Japan; this has been a source of strength for HCMC overall. In 2007, HCMC began exporting products to other countries, and has made many innovations toward technological improvement and personnel development, such as creating a school for technical development and sponsoring a skills competition. The Hitachi Technical School is a joint collaboration with a local vocational training school that provides training for second- and third-year students. In their fi rst year, students learn the basics, such as reading design drawings and welding in theory, while in the sec-ond year they are taught to weld (lean practice) and other work. In 2008 the school received more than 1,000 applications, out of which it accepted 200. Graduates are given priority placements at HCMC. In addition, since 2007, HCM has sponsored an annual international skills competition that includes all factories in HCM group com-panies worldwide. In 2008, measuring and painting events were included.
8.2 Hitachi Construction Machinery (China) Co., Ltd

128
When running a JV in the Chinese market, companies often use the sales channels of their JV partner. However, because HCMC became a wholly owned subsidiary, it had no sales network, and therefore the process of creating resellers was cumber-some. Customer service creates future demand, however, because Chinese resellers were unaware of the concept of customer service that exists in other countries, HCMC needed to exhaustively teach its resellers that service was something that was directly tied to revenue. In the early stages, 80 % of its resellers were state- owned businesses that thought of customer servicing as incomprehensible and sub-sequently, but they are dropped out from HCMC partners. In 1998, HCMC split its manufacturing and sales functions, creating HCM Shanghai (HCMS), which man-ages 28 resellers. As an incentive, HCMS has 1-year agreements with each reseller. Operating times for hydraulic excavators in China have increased to 20 h daily, including weekends, a fi gure much higher than in Japan. The company has placed service personnel at each reseller, sending these personnel to repair broken down machinery, a system that was set up to meet the needs of customers requiring imme-diate repairs. In 2008, for the fi rst time, HCMC invested in a Shandong reseller, Qingdao Chengri Construction Machinery Co., Ltd., and is in the planning stages of creating a direct sales structure. Elle Construction Machinery (Tianjin) Int’l Trade Co., Ltd. imports HCM machinery to China, catering to those customers who insist on having “Made in Japan” products. As a means of further expanding its sales channels and retaining customers, HCMC created the Hitachi Construction Machinery Leasing (China) Co., Ltd. Direct purchases are currently the most com-mon way to purchase machinery in China, and leases make up only 10 % of sales. In Japan, however, the reverse is true, with 70 % of acquisitions made via leasing. Late lease payments are increasing due to the economic crisis, and bad debt preven-tion is a concern.
As of October 2012, HCMC had almost ten subsidiaries and affi liated companies in China, each of which is managed by the China division at HCM’s headquarters (Fig. 8.2 ).
8.2.5 China’s Business Environment and Its Risks
The complexity of running a business in China generally boils down to “sudden policy changes,” especially the frequent changes in customs inspection standards. When importing an engine into China, one must fi le monthly applications, even though the annual total number of engines is already established. Thus, a sudden change in policy may cause the number of permissible imports to be lower than the previously set annual total. Also, even though imports may have tariffs levied on them as fi nished goods, the tariff rate is often left to the whim of the customs offi cer. China also poses land use risks. For example, although a company may have a 50-year lease agreement to use a property, it may suddenly be asked to return the property. Preferential policies set by local governments are also subject to risk, which may be eliminated by central government policies. Hirota explains “I learned the importance of maintaining relationships through the many troubles we faced
8 Hitachi Construction Machinery: Becoming a Wholly Owned Chinese Entity

129
Cus
t. s
vc.
Mac
hine
ry
Cra
ne s
ales
For
klift
prod
. &
sal
es
Clien
ts
Mac
hine
ry
Com
pone
nts
Mac
hine
ry
Mac
hine
ry
plat
e st
eel
Hitac
hi C
onst
ruct
ion
Mac
hine
ry C
o., L
td.
Hitac
hi C
onst
ruct
ion
Mac
hine
ry (
Chi
na)
Co.
, L
td.
Hitac
hi C
onst
ruct
ion
Mac
hine
ry (
Sha
ngha
i)
Elle
Con
st. M
ach.
(T
ianj
in)
Inte
rnat
iona
l T
radi
ng C
o., L
td.
Hef
ei H
itac
hi E
xcav
ator
sQ
ingd
ao C
heng
ri C
onst
. M
ach.
Hitac
hi C
onst
ruct
ion
Mac
hine
ry L
easing
(C
hina
) C
o., L
td.
27 R
esel
lers
Hitac
hi S
umitom
o H
eavy
Ind
ustr
ies
Con
stru
ctio
n C
rane
(Sha
ngha
i)
Mac
hine
ryM
achi
nery
Hef
eiJi
gang
Rili
Hea
vy I
ndus
try
Co.
,Ltd
.
TC
M (
Anh
ui)
Co.
Ltd
.
Tai
wan
sal
es
Elle
Con
st. M
ach.
Co.
Ltd
.
Cust
omer
s
*Not
a s
ubsidi
ary;
sal
es o
f Ja
pan-
mad
e m
achi
nery
onl
y
Fig
. 8.2
St
ruct
ure
of H
CM
C a
nd it
s su
bsid
iari
es (
Sour
ce : I
nter
view
s w
ith H
itach
i Con
stru
ctio
n m
achi
nery
per
sonn
el)
8.2 Hitachi Construction Machinery (China) Co., Ltd

130
and while confronting various risks.” To build relationships based on trust, Central government offi cials must be treated cordially on their visits. Compensation stan-dards must be clarifi ed to employees, with employee benefi ts made available to them according to Chinese practices (such as the distribution of moon cakes in mid- autumn). HCMC was one of only fi ve companies recognized as an A-grade business by the Anhui Province Taxation Bureau for its efforts in maintaining good relation-ships with local government and employees. This made things convenient for the company in a number of ways. Hirota says, “We can solve most issues through our networking and legitimate activities.”
Aside from “sudden policy changes,” China presents risks in regard to debt col-lection. Construction machinery products in China are often sold in installments, and many customers do not pay even if they have the cash to do so. HCMC has fought exhaustively to obtain payment through litigation. The advent of GPS moni-toring systems made possible through recent technological advances, allows HCMC to remotely monitor the location and operating information of its equipment. Therefore, in case of delayed customer payments, HCMC can have its equipment as inoperable. The company also set a down payment of 30 % in an effort to reduce non-payment.
Protecting intellectual property is an increasingly important issue for conducting business in China. The country as a whole has a low awareness of the necessity of protecting IP, which has become a constraint on the sale of new products. For exam-ple, because the number of quality local parts manufacturers is limited, a parts man-ufacturer may supply multiple customers. Sometimes price, design, or other information may leak from these suppliers to competitors. Preventing these techno-logical leaks by former employees is also an important issue. Dealing with this problem is diffi cult; HCMC employees are rigorously trained and are required to sign non-disclosure and non-compete agreements.
8.3 Global and Chinese Construction Machinery Markets
The internationally highest selling fi ve types of excavating and loading machinery are as follows: hydraulic excavators, mini excavators, wheel loaders, bulldozers, and backhoes. Of these, hydraulic excavators have the largest share. Since 2008, due to urban infrastructure and resource development in China, India, and other emerg-ing nations, global demand for hydraulic excavators has risen sharply. These coun-tries have more than a 60 % market share, which now dwarfs that of Japan, North America, or other developed markets (Fig. 8.3 ).
Evidently, whether a construction machinery manufacturer succeeds is abso-lutely dependent upon its success in China and other emerging markets. HCM ranks third in global sales. Caterpillar, ranking fi rst, is strong in transportation equipment such as wheel loaders, but weak in hydraulic shovels. HCM, on the other hand, is overwhelmingly strong in hydraulic excavators, but weaker in transportation equip-ment. Number two Komatsu’s strength lies in its optimum balance of products in its portfolio.
8 Hitachi Construction Machinery: Becoming a Wholly Owned Chinese Entity

131
In examining country-wise demand for hydraulic machinery, China has the larg-est market for hydraulic excavators in the world. Demand for hydraulic excavators diminished somewhat in 2009 due to the 2008 economic crisis, although the impact of the crisis was set off by the Chinese government’s economic policies (infrastruc-ture construction in the country’s interior). In examining region-wise demand struc-tures, the Huadong region, including its coastal areas that are experiencing ongoing development, has the largest market. However, it is expected that future demand will originate from the interior sources such as large government development proj-ects in western China and plans to promote growth in northeastern China. These trends are becoming particularly evident in light of lessened construction demand from export bases along the coast due to the recent economic crisis (Fig. 8.4 ).
In terms of competition for the Chinese market, Japan clearly has the largest share, dueling with its second place counterparts in South Korea (Doosan Infracore and Hyundai Heavy Industries). Hyundai Heavy Industries’ share of the six-ton-or- larger hydraulic excavator market dropped signifi cantly between 2002 and 2008, with Komatsu gaining some market share during that period. As of 2008, HCM held a market share of slightly less than 20 %, Komatsu of more than 20 %, and Doosan Infracore, Hyundai Heavy Industries, and Caterpillar each held between 10 and
0
50
100
150
200
250
2000
2001
2002
2003
2004
2005
2006
2007
2008
2009
2010
Japan Europe NA
China APAC Other
Total Global Demand
Fig. 8.3 Global demand for hydraulic excavators (units: in thousands) ( Source : Hitachi Construction machinery)
8.3 Global and Chinese Construction Machinery Markets

132
20 %. In the less-than-six-ton hydraulic excavator market segment, in which Doosan Infracore had a virtual monopoly, Hyundai Heavy Industries, HCM, and Komatsu increased their market share from 2002 to 2008, while that of Doosan Infracore dropped dramatically. As of 2008, Hyundai Heavy Industries and Doosan Infracore each had a 30 % market share, while HCM had nearly 20 % and Komatsu less than 10 %. As seen from these fi gures, Komatsu is HCM’s largest competitor in China in the six-tons-or-larger segment, while Doosan Infracore and Hyundai Heavy Industries are the largest competitors in the less-than-six-ton segment. Komatsu has a long history in the Chinese market, fi rst exporting fi nished products to China in the 1950s and subsequently working to help state-owned enterprises on technology improvements during the late-1970s through the mid-1990s. Their serious efforts to enter the Chinese market began in 1995, with the creation of three JVs around that time: Komatsu Changlin Construction Machinery Co., Ltd. and Komatsu Changlin Foundry Corporation, both with Changlin Co., Ltd.; and Komatsu Shantui Construction Machinery Co., Ltd, with Shantui Construction Machinery Co., Ltd. Komatsu currently has eight production facilities in China, procures most of its parts locally, and is dramatically increasing its share in the Chinese market. However, Komatsu also faces issues, such as slow decision-making, due to the JV arrange-ment and sales channel distribution problems resulting from using the JV sales net-work. Doosan Infracore belongs to the Doosan Group and is a Korean manufacturer
0
50
100
150
200
2006
2007
2008
2009
2010
2011
2012(Forecast)
Foreign Manufacturers Domestic Manufacturers
Fig. 8.4 Chinese demand for hydraulic excavators (units: in thousands) ( Source : Hitachi Construction machinery)
8 Hitachi Construction Machinery: Becoming a Wholly Owned Chinese Entity

133
of construction machinery. In 2007, the company announced its mid-term goal of becoming the world’s third largest construction machinery manufacturer after Caterpillar and Komatsu by 2012. Within Korea, Doosan competes with the general heavy industries manufacturer, Hyundai Heavy Industries.
In addition to foreign fi rms, local companies in China have increased their com-petitiveness. This is due to startups being established by engineers from former foreign fi rms, the purchase of strategic parts, and the supply of low cost parts. The market share of these local fi rms has risen to 20–30 %. For example, Sany Group Co., Ltd. is a large construction machinery manufacturer that looms as a fi erce com-petitor. Sany Group is a private company listed on the Shanghai Stock Exchange. In 2007, the company planned to construct factories in India and the state of Georgia in the US. Sany focuses on research and development, and has more than 2,000 employees dedicated to R&D, which is about 10 % of its total employees. In addi-tion, it pays higher wages compared with other companies in the industry, and is said to attract top talent.
8.4 A Company with Balanced “Hardware,” “Software,” and “Regions”
HCMC has steadily improved its performance to date, although it faces barriers to achieve further gains. In addition to Komatsu from Japan, the Korean companies have focused on small-sized excavators, and apart from the world’s largest construc-tion machinery manufacturer, Caterpillar, other local companies such as Sany Group are becoming strong competitors within the Chinese market.
Ever since the economic crisis, Sichuan redevelopment construction and govern-ment economic stimulus measures worth four trillion yuan (approximately JPY 56 trillion) for projects such as public works infrastructure in the Sichuan Province, the demand for construction machinery has increased in the country’s interior. However, HCMC’s resellers have a weak presence in the interior, which has caused a drop in market share. Furthermore, an increase in demand stemming from public works investment in China ceased, causing a larger than anticipated drop in demand for construction machinery.
According to HCMC’s general manager, “the question of which is better, a JV or wholly owned subsidiary, depends on the JV partner. We had disagreements with our partner, and therefore chose to create a wholly owned subsidiary, but I think there are positives to a JV if one can fi nd a good partner. For example, foreign fi rms fi nd it diffi cult to obtain information regarding contracts for public works projects, and a company with a JV partner might be able to win more contracts.”
Another issue is the best use of high-quality workforce. For example, when HCM implemented fi nance and accounting systems in China, a young Chinese employee was sent to Japan for 4 months. Before his visit, the employee understood no Japanese, but studied Japanese during the non-working hours during his 4 month stay, learning to read and write the language for the most part. China has many human resources who possess a strong desire and extensive ability to learn, and using them well has many advantages for HCM on a whole.
8.4 A Company with Balanced “Hardware,” “Software,” and “Regions”

134
HCM Global is expanding production not only in China, but also in the emerging markets such as Indonesia and India. In September 2007, the company built a manu-facturing facility in Indonesia for ultra-large hydraulic excavators used in large structures in the Cibitung plant that has operated since 2001. In India, HCM sells hydraulic excavators through Tercon Construction Equipment as a JV with the Tata Group (of which HCM has 40 % ownership). This venture has approximately 50 % of the Indian market. In March 2010, HCM increased its ownership in the JV to 60 %, and has aggressively begun to operate as a subsidiary within India.
HCM’s 2011–2013 mid-term plan titled “Go Together 2013” lists the three axes of its management foundation: hardware (products), software (services), and regions. The plan states that a balanced strengthening of these axes is critical.
The theme of the fi rst axis “hardware” is “strengthening what is already strong.” For example, the company aims to further improve the development, production, sales, and service capabilities of its cornerstone product—hydraulic excavators—and thereby accelerate its growth. In addition to hydraulic shovels, the company aims to increase its competitiveness in mini excavators, wheel loaders, dump trucks, cranes, and forklifts as its next cornerstone product. Due to increased awareness of rising energy prices and global environmental issues, HCM aims to focus on the development of energy-saving technologies. In terms of “software,” HCM aims to differentiate itself from its competition by providing a total solution that combines qualities of all its group companies in system sales, repair services, rentals, used and refurbished equipment, fi nancing, and logistics.
Finally, HCM aims to strengthen its sales and service network and expand its market share in emerging markets, or “regions.” To quickly provide products that precisely respond to market needs in each region of the world, HCM is aiming toward the localization of its business by locating engineers throughout the world. They are exploring diversity in its organizations, including new human resource systems that provide positions to quality local personnel. Caterpillar, Komatsu, and other global players are also committed to emerging markets, and Korean fi rms must be analyzed closely, due to their low cost strategies. For the HCM group, mov-ing ahead toward the localization for each country and region may lead to decentral-ization of management resources. HCM stands at a strategic crossroads as it moves forward with global-minded management, whether to further strengthen its response to the Chinese market that accounts for a large share of its global revenues or to make long-term investments in regions such as India.
8.5 Importance of This Case Study and Suggested Questions
HCMC entry into the Chinese market started as a JV with a local fi rm. However, it is an important case study from the standpoint of a company that ultimately became a wholly owned subsidiary after facing several drawbacks, the process of which has been depicted vividly. It unfolds the realities of the post-hoc JV risks, as explained in Chap. 7 . HCM perhaps did not have the option to set up operations in China as a
8 Hitachi Construction Machinery: Becoming a Wholly Owned Chinese Entity

135
wholly owned subsidiary because companies entering the Chinese market in the mid-1990s did so at the behest of the government. This situation is far widely dif-ferent from the foreign capital deregulation that companies enjoy today, but it nev-ertheless provides valuable information to global companies as they consider how to balance reducing market entry risk as a JV versus the increased risk they experi-ence from entering into the JV.
There are hints to be gleaned and considerations to be made regarding the neces-sity of alliance strategies in light of increasing competition between foreign and local fi rms. Furthermore, HCM operates worldwide, and not just in China. This case study provides the basis for further refl ection regarding the positioning of Chinese operations and the integration of management strategies on a global level.
Using this case study, the following questions can be considered to further deepen the understanding of global strategy.
• What are the various strengths and weaknesses of JV’s and wholly owned sub-sidiaries as a company expands into foreign countries?
• What did the mayor of Hefei mean when he said, “You will fi nd it diffi cult!” after the HCM JV was dissolved?
• As competition with other foreign and local fi rms increases, what strategy should HCMC pursue?
• For HCM overall, should its focus be on strengthening operations in China or in Indian and other emerging markets?
Open Access This chapter is distributed under the terms of the Creative Commons Attribution Noncommercial License, which permits any noncommercial use, distribution, and reproduction in any medium, provided the original author(s) and source are credited.
Reference
Japan Association for the Promotion of International Trade. (2004, February). Kokusai Boueki . Tokyo: Japan Association for the Promotion of International Trade.
Reference

137© The Author(s) 2015K. Motohashi, Global Business Strategy, Springer Texts in Business and Economics, DOI 10.1007/978-4-431-55468-4_9
9 Marketing Theory in Global Business Context
9.1 Global Strategy and Marketing in Emerging Countries
Advancements in emerging countries present new market opportunities for Japanese corporations; however, to do so, they must confront the threats posed by local com-panies playing catch up by moving from a “build it and it will sell” product model to a customer value model that maximizes the value to the customer. To overcome this dilemma, companies must understand markets in these emerging countries (i.e., customer needs) at product- and service-planning levels, accordingly design products and services that maximize value to the target customers, and create chan-nels to get these products and services to the consumers. These activities comprise marketing activities.
Compared with their counterparts in the West, Japanese companies have little understanding of marketing activities. Japanese companies heavily emphasize sales. In Europe and the US, marketing and sales denote different functions, but in Japan, they are often mixed. The Japanese word for sales, eigyou , refers to activities that increase the revenue from existing products, for example, a sales representative visiting customers in an effort to book orders. Marketing, on the other hand, is based on a principle that encompasses a strategic philosophy that determines the types of customers—including new customers—a company should target, and the types of products that should be developed to increase customer satisfaction. With the “build it and it will sell” concept, marketing is not essential, and sales activities alone are suffi cient. However, a customer value model that designs products and services that maximize customer value requires a company to grasp the needs of its customers and prioritize marketing activities.
Marketing activities can be divided into two main steps. The fi rst is a strategic step of segmentation of market information by customer type, and the selection of a target customer group. In taking such a step to facilitate global businesses, the CAGE framework explained in Chap. 2 is valuable to analyze the differences between a company’s home country and other countries. A company will have a

138
deep understanding of the history of its own country, and the CAGE framework will provide hints to deepen a company’s understanding of other target countries. A company must gather important points from the CAGE framework to develop mar-keting strategies and conduct a more detailed analysis using market survey data and various types of statistical data.
The second step moves into execution with the careful consideration and imple-mentation of product, price, place, and promotion based on the aforementioned strategies. These elements are collectively called the 4Ps of marketing. For exam-ple, in Shiseido’s marketing in China, covered in the next chapter, the company switched its brand names and distribution channels when selling its products to high-income and middle-income consumers. Companies must, thus, select the right target customers and 4P marketing mix on the basis of a marketing strategy, and execute the plan accordingly.
In this chapter, we discuss the important concept of the “good enough market” as we examine marketing strategies in emerging countries. The average income levels in these countries are lower than those in developed countries; however, they consti-tute a rapidly expanding middle class who wish to own low-cost products with a certain level of quality. This is called the “volume zone.” Reducing a product’s functionality to what is required by customers in an effort to minimize costs is one way in which companies can develop products for particular markets, thereby enabling high returns in the huge markets within emerging countries. In this chapter, we discuss the strategy for the “good enough” product market in both China and India as we analyze the markets in each country.
We conclude this chapter by examining the bottom of the pyramid strategy or BOP. Of the entire global population of approximately six billion people, four bil-lion have an annual income of less than USD 1,500. This amounts to living on an income of just a few dollars per day. BOP businesses require strategies to target this lowest level of the population pyramid. In India, consumer packaged goods (CPG) manufacturer Unilever and the micro-fi nancing giant ICICI Bank both target the BOP layer. Among Japanese companies, Ajinomoto’s work on improving nutrition in Ghana is one such example. BOP has been the focus of attention for companies thinking about their global business; it is a business model that provides valuable hints for companies’ business in emerging countries, such as relationships with local governments and nongovernmental organizations (NGOs).
9.2 Steps in Marketing Strategy
Using SWOT analysis described in Chap. 2 to clarify the internal management resources of a company (its strengths and weaknesses) and the external manage-ment environment (opportunities and threats), steps in marketing strategy can help determine a company’s direction as it invests in new management resources. In this step, companies create management strategies; however, it requires a more detailed analysis to move to the execution phase of specifi c product development and distri-bution channel creation.
9 Marketing Theory in Global Business Context
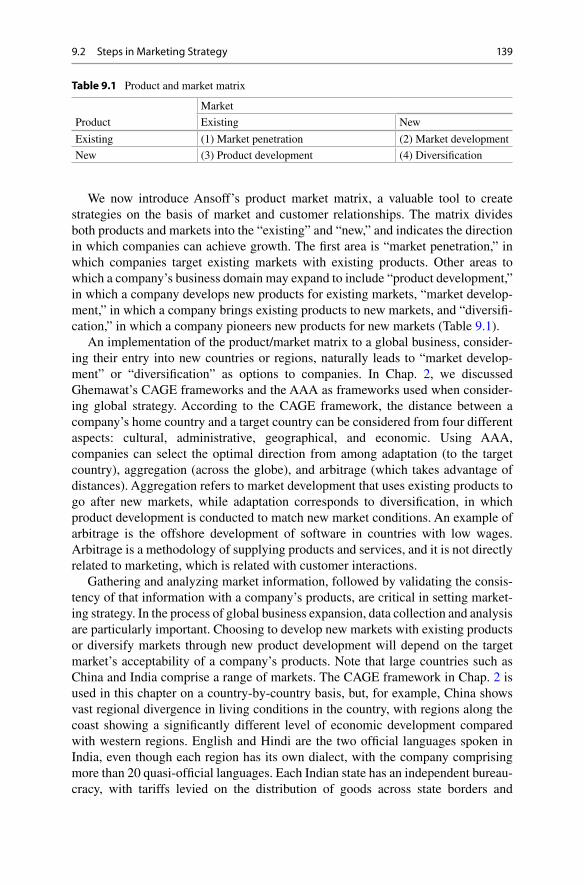
139
We now introduce Ansoff’s product market matrix, a valuable tool to create strategies on the basis of market and customer relationships. The matrix divides both products and markets into the “existing” and “new,” and indicates the direction in which companies can achieve growth. The fi rst area is “market penetration,” in which companies target existing markets with existing products. Other areas to which a company’s business domain may expand to include “product development,” in which a company develops new products for existing markets, “market develop-ment,” in which a company brings existing products to new markets, and “diversifi -cation,” in which a company pioneers new products for new markets (Table 9.1 ).
An implementation of the product/market matrix to a global business, consider-ing their entry into new countries or regions, naturally leads to “market develop-ment” or “diversifi cation” as options to companies. In Chap. 2 , we discussed Ghemawat’s CAGE frameworks and the AAA as frameworks used when consider-ing global strategy. According to the CAGE framework, the distance between a company’s home country and a target country can be considered from four different aspects: cultural, administrative, geographical, and economic. Using AAA, companies can select the optimal direction from among adaptation (to the target country), aggregation (across the globe), and arbitrage (which takes advantage of distances). Aggregation refers to market development that uses existing products to go after new markets, while adaptation corresponds to diversifi cation, in which product development is conducted to match new market conditions. An example of arbitrage is the offshore development of software in countries with low wages. Arbitrage is a methodology of supplying products and services, and it is not directly related to marketing, which is related with customer interactions.
Gathering and analyzing market information, followed by validating the consis-tency of that information with a company’s products, are critical in setting market-ing strategy. In the process of global business expansion, data collection and analysis are particularly important. Choosing to develop new markets with existing products or diversify markets through new product development will depend on the target market’s acceptability of a company’s products. Note that large countries such as China and India comprise a range of markets. The CAGE framework in Chap. 2 is used in this chapter on a country-by-country basis, but, for example, China shows vast regional divergence in living conditions in the country, with regions along the coast showing a signifi cantly different level of economic development compared with western regions. English and Hindi are the two offi cial languages spoken in India, even though each region has its own dialect, with the company comprising more than 20 quasi-offi cial languages. Each Indian state has an independent bureau-cracy, with tariffs levied on the distribution of goods across state borders and
Table 9.1 Product and market matrix
Product
Market
Existing New
Existing (1) Market penetration (2) Market development
New (3) Product development (4) Diversifi cation
9.2 Steps in Marketing Strategy

140
different regulations imposed on companies. Thus, we see that distances exist among various aspects of the CAGE framework even within a single country, and each country may have a variety of markets.
Therefore, a marketing strategy must be selected by fi rst segmenting and then targeting markets. Market segmentation can be conducted in many ways, as indi-cated in Table 9.2 . The fi rst type is segmentation using geographical variables. Climate and lifestyle vary by area. The same applies to language, as seen in the case of India. Attributes of population segmentation such as gender, age, or income lev-els are also important. For products that target the youth or the elderly, a change in specifi cations may be necessary. In addition, companies should consider segmenta-tion by household income levels when considering the establishment of businesses in emerging countries. The “good enough” product market in China and India, explained later in greater detail, targets the rapidly growing middle classes in these countries. When examining China’s disposable income distribution, it is observed that the top 10 % have an average annual income of approximately USD 32,000, while the lower 10 % have an average income of only USD 950—a disparity of more than 30 times. Newly developing nations, such as China, generally have large wage disparities, thus increasing the importance of segmentation by income level and the creation of a marketing plan that sets specifi c targets.
In addition, market segmentation and targeting can be conducted using psycho-logical variables such as lifestyle, and behavioral variables such as product usage. Geographical characteristics and population attributes can be understood using existing statistical data and fi gures from survey companies; however, companies must also conduct their own market research to understand consumers’
Table 9.2 Example of market segmentation
Variables Segment example
1. Geographical variables Kanto, Kansai
Region Cold/hot, seasons
Climate Urban, suburban, rural
Population density
2. Demographic variables Teens, youth, middle-aged, seniors
Age Male, female
Gender Married, unmarried
Family composition +JPY 30 million
Income Blue-collar, white-collar
Work
3. Psychological variables Enjoys sports, outdoors
Lifestyle Enjoys new things, conservative
Personality
4. Behavioral variables Economical, functional, prestige
Sought-after benefi ts Non-user, light user, heavy user
Usage
Source : Adapted from Diamond Inc. (2002) chart on p. 55
9 Marketing Theory in Global Business Context

141
psychological and behavioral variables. Rogers’ diffusion model of innovation (Rogers 2007 ) is often used to classify consumer personalities. Sociologist Everett M. Rogers researched the diffusion process of new products and services and clas-sifi ed users into several groups in the following order of adoption: innovators (those who are fi rst to adopt), early adopters, early majority, and laggards. There is a wide chasm between innovators and early adopters, and for high-tech products, crossing this chasm in marketing is crucial (Moore 2002 ). Thus, understanding the psycho-logical attributes of target customers is critical when introducing innovative prod-ucts into a market.
We now summarize the steps in marketing strategy. First, companies must collect market information and analyze it, by considering the strengths and weaknesses of their products, as well as the consistency of their products with market characteris-tics in light of relevant data. Companies should align their goals with a management strategy and direction for global businesses, as shown in the CAGE and AAA frameworks. Ansoff’s product/market matrix is effective to match products and markets. In deciding whether to target new markets in line with the strengths of a company’s products (market development), or to develop new products that meet local needs in global markets where the company already has business operations (diversifi cation), companies must perform SWOT analysis that consider both inter-nal management resources and external business environments. Creation of a mar-keting strategy is the goal of this step, and the strategy must be decided upon in the process of matching products and markets.
9.3 Marketing, Planning, and Execution: The 4Ps
The process of creating a specifi c marketing plan on the basis of a marketing strat-egy is referred to as the 4Ps of marketing. It includes product, price, place, and promotion, each of which is explained in the following paragraphs (Fig. 9.1 ).
The fi rst element, product, includes a psychological value that consumers place on products that is derived from branding and design, in addition to the more direct value that is derived from functionality and performance. Among large consumer durables, delivery, installation, and other post-sales services should be thought of as part of product composition. Within target markets, companies must begin by devel-oping basic concepts for products and services that most effectively meet customer needs. Next, they must design specifi c products not on the basis of function but on design and post-sales service. For example, Japanese consumer electronics products generally come with a warranty from the manufacturer, who agrees to repair the item free of charge within 1 year of purchase in case the item malfunctions for rea-sons that are not the fault of the user. Such a service is provided by the product’s quality management. In contrast, China’s consumer electronics giant Haier does not provide a warranty but has built competitive advantage by emphasizing post-sales services for its products. In the event of product malfunction, Haier deploys person-nel to service the product within a few hours in case of the problem, instead of providing a warranty. In sum, companies must consider aspects such as post-sales
9.3 Marketing, Planning, and Execution: The 4Ps

142
services in addition to product quality and functionality when developing their product concepts.
The brand is another item that can be put into product classifi cation within mar-keting plans. Some brands are tied to company names, while others are tied to prod-uct names. The brand value of the former is in the company name itself, as in the case of Sony, which is known for its innovative products, or Toyota, which is known for its cars of high-quality. The latter is managed on a product-by-product basis. For example, the Procter & Gamble (P&G) categorizes its cosmetics business into the premium SKII brand and the mass market-oriented Olay brand. In the next chapter, we analyze Shiseido’s marketing in China. It developed a brand of cosmetics called Aupres catering to the Chinese market, in addition to its global SHISEIDO brand. SHISEIDO brand cosmetics were exported to China and targeted the wealthiest consumers. The management at Shiseido therefore decided that it must develop new products that cater to a larger section of the market if they want to seriously expand in China. However, Shiseido decided to use a different brand name to market these new products, thereby downplaying the connection with Shiseido, as a measure to safeguard it against the potential risk of lowering the value of the SHISEIDO brand. This type of brand management is an important element in marketing planning.
The next element is price. The following aspects must be considered when deter-mining the price of products and services:
• Cost of products and services • Price elasticity in the market • Prices of competitive products
Generating a profi t by providing products and services requires that prices be set higher than costs. However, costs include both fi xed costs, such as R&D and asset depreciation, as well as variable costs, such as materials and manufacturing labor.
Product/service characteristics
Brand strategy
Price setting
Versioning
Channel
LogisticsMedia selection
Sales
Product Price
Place Promotion
•
•
• ••
•••
Fig. 9.1 4Ps of Marketing
9 Marketing Theory in Global Business Context

143
In the case of fi xed costs, the average cost of products and services decreases as the sales volume increases, making it necessary to estimate demand and be aware of when revenues will exceed average costs. Moreover, companies must have an understanding of the price elasticity of its products and services. Products with a high degree of price elasticity suffer from lagging sales as prices increase, making it diffi cult to increase the prices of such products. On the other hand, the demand for necessities does not change signifi cantly even when prices increase. These products have low price elasticity and increasing their prices is relatively easy. Finally, in terms of the pricing of competitive products, if companies fi nd it diffi cult to differ-entiate with competitive products on product quality, functionality, or post-sales service, they will also fi nd it diffi cult to set prices higher than that of their competi-tors. For example, the recent price wars among manufacturers of fl at-panel televi-sions have resulted in a considerable drop in the average sales price of these products. As a result, sales have grown; however, even the largest manufacturer, Samsung, has made almost no profi t. Thus, when price wars occur among products that are largely similar, all vendors are forced to drop their prices to the bare minimum.
In addition, companies must think dynamically in terms of price strategies over a product’s lifecycle. Price strategies for new products at the time of their introduc-tion include “cream-skimming” and market penetration pricing. Cream-skimming refers to the strategy of setting prices at a high level to “skim” customers who do not mind paying premium prices (i.e., upper-class individuals with high reservation prices for products). For example, when Intel introduces new CPUs, it generally sets a high price for premium users (Ogawa 2009 ). In contrast, market penetration pric-ing sets the prices of new products on the low end. Products with network externali-ties infl uenced by a number of users have an incentive to draw a large number of users as quickly as possible. This phenomenon can be seen in the recent example of the standards competition in the high-end DVD market between the Blu-ray and HD-DVD formats.
There are various other strategies to set prices, such as creating various grades for one product, as in the case of automobiles; bundling complementary products, as in the case of mobile carriers that generate revenue through telecommunication fees while selling mobile phones at low cost; or versioning, where content is sold at different prices depending on the product release timing (e.g., releasing paperback versions of books after hardcover versions).
The third element is place, that is, the method of providing a product or service. Products developed by manufacturers need to reach customers by some means. Retailers provide these places and, depending on the product, they may also provide a complex distribution route that includes wholesalers. On the other hand, some companies provide products directly to consumers without going through a middle-man (so-called disintermediation) via e-commerce over the Internet. “Place” relates to the channels that a company uses to deliver its products and services to customers.
When expanding a business into emerging countries such as China and India, dealing with these channels is a major issue. First, retailers or distributors, such as
9.3 Marketing, Planning, and Execution: The 4Ps

144
wholesalers, often face market-entry regulations imposed on foreign companies, which often require the partnership with a local company. For example, China joined the WTO in 2001, resulting in the elimination of most regulations for foreign retailers and wholesalers, with the exception of certain industry types. Large foreign supermarkets and convenience store chains are expanding into the Chinese market, though local companies still hold the major market share. India has more stringent regulations than China, and has delayed the entry of foreign fi rms into its market segments. Retailers in particular still face stringent regulations on foreign compa-nies, and while there are some signs of deregulation, there are also political issues that make the prospects of dramatic improvements in the short term diffi cult. Accordingly, companies have found it necessary to build relationships with local companies and carefully manage these alliances. For example, Shiseido sells its products using specialty stores as its marketing strategy. In regional urban areas with no large-scale department stores, Shiseido has established superior quality cos-metics stores as specialty stores and trains beauty consultants in terms of personal sales. Shiseido has also established an incentive system that awards retailers with high sales volumes. Retailers can request to terminate their agreements with Shiseido at the time of agreement renewal, but most retailers opt for a long term agreement as Shiseido specialty stores.
Logistics, or the timely movement of products to a designated location, is another important element of “place.” In India, fresh foods often go bad because of issues in logistics. Lagging infrastructure, such as roads and rail freight, is another major issue; however, the impact of inadequate skilled business logistics personnel in management, warehousing, and transportation optimization is prominent. Logistics services in India present a tremendous business opportunity, and many Japanese companies, including trading companies, are beginning to enter this domain. China and India are geographically vast, with typically high logistics costs. Therefore, making local logistics more effi cient is critical.
The fi nal P is “promotion,” or sales promotion activities. Despite the selection of target markets that companies think will effi ciently use their business resource strengths and develop products and services to match those markets, revenues do not increase without properly marketing them to customers. Sales promotions are held to effectively promote the process from capturing the attention of potential customers through a purchase. The behavioral patterns of consumers are explained below in the AIDMA steps:
Attention: the product captivates the attention of potential customers Interest: they become interested in a product Desire: they desire the product Memory: their desire is no longer just a passing one, and the customer is seriously
considering the product Action: customers make the purchase
Potential buyers begin by focusing the targeted product. They may view a televi-sion commercial featuring the latest digital camera, and move on to the next step, in
9 Marketing Theory in Global Business Context

145
which the product makes an impression, whereby they become interested in the product. They then develop the desire to purchase the digital camera. However, even though they may want to purchase the product, it may be a passing one. Therefore, for a purchase, this desire must remain in the customer’s memory. Finally, consumer behavior ends when the customer goes to a consumer electronics store and pur-chases the digital camera.
The means by which companies invest their efforts in promotions depend on the AIDMA process. In the fi rst stages of gaining attention and interest, advertisements using videos or graphical images can be an effective way to create a product’s impression. A variety of mass media, such as television commercials and newspa-per and magazine advertisements, can be used to accomplish this. In addition, pub-lic relation (PR) activities centered on an event or word-of-mouth networks are also effective in the fi rst half of the AIDMA process. Promotional tools include samples and gifts, product displays, pamphlets, or coupons. The human element, such as promotions involving salespeople in stores that provide advice to customers, is also important. Such promotions enable an engagement with customers that display a certain level of interest or desire for a particular product and are effective in the lat-ter half of the AIDMA process.
However, the AIDMA model of consumer behavior has recently become obso-lete and has morphed into the AISAS model: the fi rst two aspects, “attention” and “interest,” remain the same; however, the fi nal three comprise “search,” “action,” and “share.” The widespread use of the Internet is accompanied by greater use of e-commerce comparison sites. Moreover, consumers can easily purchase products over the Internet, thus shortening the process that begins by becoming interested in a product and ends with going to a store to make a purchase. Using our example of a digital camera, consumers fi rst become interested in a product, search for it over the Internet, review its functions, and compare it with other products. They then purchase the product of their choice (the “action”), and share information about the product over the Internet by writing about it on blogs and social media such as Twitter. As word-of-mouth regarding the product begins to accumulate, it becomes an important source of information for the next potential purchaser.
The development of the Internet and social media has resulted in a downward trend in revenues from traditional mass media advertising sources of television and newspapers. On the other hand, Internet advertising revenues have grown because of the advantage of effectively reaching potential customers with a certain level of interest in the product by changing product advertising content based on search terms, as in the case of Google’s keyword-based advertising services. The online environment in emerging countries such as China and India are no different than those in developed countries. Thus, the effectiveness of promotions using the rules of AISAS-based consumer behavior will only increase.
Note that the marketing methods discussed so far in this chapter do not apply to online markets. For example, recommendation techniques can be used in e- commerce on the basis of consumer keyword searches or purchasing history. Instead of market segmentation and targeting, companies can respond to individual consumer attri-butes on the Internet. Companies can use large volumes of data (“big data”)
9.3 Marketing, Planning, and Execution: The 4Ps

146
available on the web to respond to consumer trends in real time; tracing consumer behavior patterns on the basis of this data is critical. In addition, companies must modify the 4Ps to market fl exibly on the basis of the circumstances, rather than using the traditional method of creating marketing strategies systematically from marketing surveys. Marketing using big data is an advanced area, and the usage of the Internet has witnessed an increase even in emerging countries.
9.4 Market Analysis Examples: China and India
We use the examples of China and India in our discussion on marketing strategy creation. We do not analyze the details of marketing plans with specifi c products and services, but rather show the primary direction for strategy in these two emerg-ing countries. The most important thing to consider for companies from advanced nations, including Japan, in terms of a business strategy in emerging countries is the difference in the economy between the home and target countries. An analysis of income levels and purchasing power of customers in target countries is important, particularly from the marketing perspective. However, data on average income lev-els in countries with great income disparities has little value. Information on house-hold income distribution is important, and companies can use it to segment the market and consider the classes that should be targeted.
Figure 9.2 indicates the percentage of households in China and India with more than USD 10,000 in disposable income. These countries are experiencing rapid eco-nomic growth, and the number of households that purchase durable goods such
0%
5%
10%
15%
20%
25%
30%
35%
40%
1990
1991
1992
1993
1994
1995
1996
1997
1998
1999
2000
2001
2002
2003
2004
2005
2006
2007
2008
2009
2010
2011
China India
Fig. 9.2 Share of volume zone in China and India ( Source : Author’s estimates based on Euromonitor data)
9 Marketing Theory in Global Business Context

147
consumer electronics and cars, or those that take regular vacations is witnessing considerable growth. We have set USD 10,000 in disposable income for households as our delineator of the “volume zone.” In the 1990s, 1–2 % of households in both countries featured above this income line, and the numbers grew more rapidly after 2000. Growth in China was particularly signifi cant, with more than 35 % of house-holds reporting more than USD 10,000 of income. However, this graph is in USD; therefore, we must discount for infl ation.
Purchasing power parity (PPP) of consumers in both countries must be evalu-ated. It measures a country’s purchasing power while adjusting for international price levels. For example, prices in Japan are relatively higher than those in China. Thus, on comparing household income levels in both countries, the purchasing power of households in China is, in real terms, greater than that in Japan. As of 2012, the purchasing power parity values of Japan, China, and India were 144, 53, and 44 (keeping that of the US at 100), respectively. In other words, while price levels in Japan are 1.44 times that of the US, those of China and India are is 0.53 and 0.44 times, respectively. This indicates that prices in Japan are approximately three times higher than those in China and India, thereby making the purchasing power of a Chinese household with USD 10,000 in annual income equivalent to a household earning USD 30,000 in Japan. However, note that purchasing power parity is a mea-sure of the entire country’s average. Products with large differences in domestic and international prices are daily necessities such as personal services or foodstuffs that are diffi cult to import from overseas; thus, the percentage of these products con-sumed by households with high income levels is low. On the other hand, goods such as automobiles and high-end consumer electronics have a marginal price disparity among Japan, China, and India. Therefore, companies must note that data income levels that are used to calculate the average purchasing power are too high to be considered in marketing strategies by advanced countries.
Figure 9.3 indicates the distribution of disposable income in Japan, China, and India to better understand the market environments in these countries. More than 70 % of households in Japan have an annual disposable income of greater than USD 45,000, while the percentages in China and India are 3 and 1 %, respectively. Even when accounting for purchasing power, companies must recognize that the Chinese and Indian markets are very different from those in advanced countries. When Japanese companies expanding internationally to the US and European markets, the aspect of “aggregation” of the AAA framework was often used as a strategy. But premium markets, in which it is possible to use this strategy, comprise only a small portion of overall Chinese and Indian markets. However, as seen in Fig. 9.3 , average income levels in China and India are rising at a rapid pace. Households above the quasi-advanced level of USD 25,000 in annual income are nearly 10 % of the total households in China, and the total number of such households is approximately the same as that in Japan. In the next 5–10 years, it is likely that these countries will have premium markets as large as those in advanced nations.
However, in the shorter term, companies must analyze the strategies for targeting the middle classes below the volume zone. Among the assumptions of marketing strategies targeting this group, adaptation (for local markets) is required for
9.4 Market Analysis Examples: China and India

148
providing products that will be accepted in local markets with somewhat low income levels. Companies must, therefore, reduce the functionality and performance of products in order to sell them at a price which is lower than the price of the same product for domestic market. In addition, companies must review the entire value chain of a product, from materials procurement and the manufacturing processes, through distribution and post-sales service, in pursuing a low price model. Companies might have to form an alliance with a local company to improve their cost competitiveness.
The middle market offered by China and India is often termed as the “good enough market.” When the pace of a product’s technological innovation is rapid and a certain level of technology fulfi lls consumer demands, high-end products do not necessarily sell well even in premium markets with high-income levels. The innova-tor’s dilemma causes destructive innovation, and when products become commod-itized, the good enough market makes its appearance regardless of the income levels. According to an analysis of the Chinese television receiver market as of 2005, the shares of high-end market (dominated by foreign fi rms such as Sony and Panasonic), the mid-market (fl at-panel televisions made by Chinese companies), and the low-end market (CRT televisions made by Chinese companies) were 13, 62, and 25 %, respectively, and the mid-market—a good enough market—was rapidly growing (Gadiesh et al. 2007 ). However, at the end of 2009, Sony introduced a low- cost LCD television into the Chinese market (a 32″ model that sold for CNY 3,000), and by 2010, the premium market had all but dried up. This example indicates that waiting for premium markets to take hold in emerging countries is not an effective strategy.
2%
64%
82%
9%
27%
15%
19%
6%
1%
71%
3%
1%
0% 20% 40% 60% 80% 100%
Japan
China
India
Up to $10K $10K to $25K
$25K to $45K More than $45K
Fig. 9.3 Disposable income distribution in China and India (2011) ( Source : Author’s estimate based on Euromonitor data)
9 Marketing Theory in Global Business Context

149
Table 9.3 Matrix analysis of customer needs and technology competitiveness
Technological competitiveness
Customer needs
Product performance < Customer needs Enables the differentiation of performance and quality
Product performance > Customer needs Does not enable the differentiation of performance and quality
Large gap with local companies
High-quality, high-cost strategy (expect expansion of premium market)
Good enough quality, low-cost strategy, partnerships with local companies
Local companies play catch up
Strategy of using R&D investment to slow down catch up
Acquisition of local companies, management localization
Source : Adapted from Gadiesh et al. ( 2007 ), p. 85
9.5 Is the Premium Market a Volume Zone?
While companies from advanced countries may have high expectations for the premium markets in China and India, in which they do well, companies that have prioritized short-term profi ts must undertake an adaptation strategy for local mar-kets by targeting the volume zone of the middle-class. Industries that easily fall prey to the innovator’s dilemma because of a high rate of technological innovation can-not have any expectations of a premium market and must, instead, pursue the good enough market. Should a company prioritize the premium market, or should it take the low-price path to succeed in an emerging country? This question is important in determining a global strategy.
These strategy options can be summarized by customer needs in the target mar-ket and technology competition in the local market (Gadiesh et al. 2007 ). In terms of customer needs, companies must ascertain whether the demand for a product’s performance or quality has risen or whether the specifi cations of high-end products are too high for the market to absorb. In case of growing demands to improve prod-uct performance, there may be room for differentiation with local products in terms of performance and quality by companies from advanced countries. However, if that is not the case, then lower costing local products are suffi cient for the market. Therefore, there are no incentives to purchase high-cost, high-function products, and there is a high likelihood of becoming involved in a price war with local com-panies. In addition, in terms of technological competition, the strategies undertaken by companies from advanced countries will vary with the size of the gap separating them and local companies (Table 9.3 ).
First, we consider cases in which there exist customer requirements for product quality and functionality. Business-to-business (B2B) products such as high- performance materials used in automotive parts, industrial equipment, and con-struction equipment for the most part fi t this category. Customers have an incentive to constantly improve productivity, thus creating high demands for performance and quality. In addition, durable consumer goods, such as cars and air conditioners, often fi t this category. Because these products are often used over an extended
9.5 Is the Premium Market a Volume Zone?

150
period, customers often demand energy-saving features and high quality. Cases in which there is a large technological gap between entering and local companies in terms of consumer durables, strategies that target premium markets with high- quality, high-function products are reasonable. On the other hand, companies must plan to differentiate products that local companies can technologically catch up with, and those that are easily prone to price wars. Companies must plan to shift away from the stand-alone product model explained in Chap. 5 and move to a cus-tomer value model, thereby building an operating model that will make it diffi cult for local companies to catch up.
Next, companies must seriously consider a low price strategy for good enough markets in industries where they face diffi cult competition against cheap local prod-ucts and where customer demands for product functionality and quality are fully satisfi ed. As seen in China’s television market, electronics products fi t this category because of their high rate of technological innovation. Even in this case, a company must respond differently depending on the size of the technological gap between it and local companies. If a company is technologically superior and cannot be easily imitated by local companies, it can, to a certain extent, differentiate its products from low price local products on functionality and quality. However, since compa-nies must provide products at a lower price than markets in the home country, they must develop products for the local market that have only the functionality and level of quality that customers there need. In addition, it is necessary that companies make the value chain of suppliers, manufacturing processes, and distribution chan-nels more effi cient to cut costs, and realize a low-cost model that depends on alli-ances with local companies in many areas. On the other hand, companies fi nd it diffi cult to respond to markets where customers’ product needs are satisfi ed, and more so when those products are made by companies in emerging countries that are already technologically on par. Companies cannot differentiate their products on technology in such a case, and must instead compete directly in terms of price. Considering that the headquarters head the company from advanced nations, com-peting in terms of price with local companies will be diffi cult unless that company has a high level of productivity. Thus, companies may opt to acquire a local com-pany and make the management more effi cient, but they will need to create a man-agement structure on the basis of local personnel to avoid the rising operating costs.
Should companies in advanced countries opt for a low price strategy in good enough markets within emerging countries, they must be careful not to fall prey to cannibalization of their high-end products made for premium markets. Manufacturers such as Sony and Panasonic have a brand image that conveys quality and perfor-mance. They therefore need to make marketing plans for quality levels, prices, dis-tribution channels, and other areas such that their brand value is not damaged when competing in terms of price. Shiseido ensures that cannibalization does not occur through brand management, using the global SHISEIDO brand made for premium markets and the Aupres brand for products in the Chinese market. This point should be noted by companies pursuing a low price strategy where they already have some history of selling to premium markets.
9 Marketing Theory in Global Business Context

151
9.6 The Bottom of the Pyramid Business
As mentioned earlier, BOP signifi es the lowest level in the income class distribution pyramid. Of the global population of approximately six billion people, two-thirds or four billion live on only a few dollars a day. The BOP business derives profi t from these poorer classes, but at the same time, it involves the people in these lower classes in the process of operating this business by providing opportunities to par-ticipate in society to those who otherwise have no stable employment. In addition, some companies have businesses that aim to improve the living conditions of those who struggle with poor nutrition or sanitation; they often partner with international organizations or NGOs that are working on poverty issues. Companies expanding their global business are expected to contribute to society through work on environ-mental issues or in other areas. Global corporations face the growing need of bal-ancing their traditional for-profi t businesses with non-profi t activities, and thus can gain some important suggestions from the BOP business model.
The BOP model does not merely comprise activities that contribute to society. A business must generate profi ts, therefore requiring companies to understand from where value is derived. Simply put, a value added is created by eliminating the “poverty penalty” of the poor who live in conditions without a reliable social system or business environment. For example, in Mumbai, India, there is a large slum area called Dharavi, as well as a wealthy neighborhood called Warden Road. The book Next Market (Prahalad 2005 ) compares no collateral consumer fi nancing for both of these areas and notes that whereas annual interest rates in wealthy neighborhoods are 12–18 %, they are 600–1,000 % in the slums. Similarly, the book compares prices for water, telephone, diarrhea medicine, and rice, and observes that all of these prices are higher in the slums, where a “poverty penalty” is imposed. High- quality public utility services are not provided in slum areas, and higher credit risks imply higher service fees. If some sort of system can be implemented to enable credit transactions in these areas, new businesses can be established to promote value creation.
Microfi nance is an example of a business system that reduces the poverty penalty in fi nancial services. In such a system, locals become bankers and provide small loans. Borrowers use this funding to fi nance small businesses such as shops or indi-vidual services, thereby contributing to the creation of new businesses in that region. Key to this service are the reduction in credit risk whereby local citizenry become bankers as well as a personal relationship with borrowers. Bankers receive income from the interest generated when loans are paid back, creating incentives for the lenders to make loans corresponding to their ability to repay. Having many locals acting as bankers reduces the risk of bad debt, and the system generates a profi t from the low interest. The system of microfi nance is relatively simple, and though it began in Bangladesh through Muhammad Yunus and his Grameen Bank, it has since spread to countless operations in India as well as across the African continent. It has been accompanied by criticism as well, owing to the unreasonable amount of
9.6 The Bottom of the Pyramid Business

152
profi t made by some banks by charging high interest rates, and the accumulation of excess debt by some borrowers, thereby becoming unable to repay their loans.
Marketing costs can become an entry barrier for manufacturers wanting to expand to a BOP business. First, a solid business cannot be built around BOP with-out products that have the prospect of a certain amount of demand from the poor who make up the target market. These people often live in limited communities, making it diffi cult for companies to understand market needs. In addition, many people are simply living day to day, causing large fl uctuations in demand. Furthermore, creating distribution channels to deliver products to customers entails exorbitant costs. In such a business, where low-priced products are sold in large volumes, high demand volatility can be fatal. Thus, partnering with various players is ideal for running a successful BOP business. For example, market needs of the poor can be obtained from detailed information held by NGOs that provide local assistance. Product distribution can be built through tie-ups with banks that provide microfi nance and by leveraging the local banker network.
Hindustan Unilever (the Indian subsidiary of the European CPG manufacturer Unilever) formed alliances with multiple parties to create a successful soap business in India. It fi rst launched a global public–private partnership (PPP) to promote the idea of washing hands with soap to improve hygiene in India. It held promotional activities to instill the custom of using soap when washing hands in conjunction with the World Bank and USAID. In the process, it partnered with approximately 400 NGOs and conducted local seminars on how to use soap. It employed sales-women in rural areas referred to as shakti , who educated locals on hygiene and offered advice in addition to selling products. The company led with the societal goal of improving rural hygiene and was successful in generating royalties and cre-ating a brand image for its products.
Several Japanese companies have also begun similar efforts, such as Ajinomoto’s nutrition improvement program in Ghana. However, only a few companies have been successful in BOP businesses. P&G invested USD ten million worldwide in a project to sell a powder that cleans water, but later realized the diffi culty of generat-ing profi ts from the sale of the product and instead turned it into a philanthropic enterprise (Karamchandani et al. 2011 ). BOP businesses benefi t society by solving poverty issues that invigorate rural areas or improve nutrition and hygiene; however, companies must balance these efforts by actually creating a profi table business. BOP businesses require the creation of ecosystems that involve a broad range of players, from public organizations for developmental assistance and NGOs to local communities. Thus, companies that run these businesses must fi rst understand the objectives of each organization they work with, and then act as coordinators in win–win joint efforts.
9.7 Conclusion
In this chapter, we discussed methodologies for the planning and execution of mar-keting strategies, and examined case studies targeting China and India. Global aggregation strategies are often not effective for companies in advanced countries,
9 Marketing Theory in Global Business Context

153
including those in Japan, which attempt to expand their home country business into global markets. Business environments and customer needs are often markedly different in target countries, thereby requiring companies to deepen their under-standing of these markets. Large countries such as China and India have great income disparities, wherein wealthy classes have lifestyles on par with those in advanced countries, while poor classes make less than USD 1,000 per year. Because of the various customer classes due to differences in regional characteristics and lifestyle, market segmentation and targeting of specifi c customers become impor-tant. Therefore, companies can choose marketing plans according to the 4Ps: devel-oping a product according to local circumstances; setting a price; arranging distribution channels for products and services (i.e., place); and implementing pro-motions that provide product information to potential customers.
In this chapter’s case studies, we examined the high-growth trends in the middle class—the volume zone—in terms of the hierarchical distribution of disposable income. Households with disposable income greater than USD 10,000 have been increasing rapidly in both China and India since 2000, and as of 2011 they have accounted for 36 and 15 %, respectively, of their overall national markets. However, a large gap still exists between these countries and Japan, where most households have above USD 45,000 in disposable income. Thus, acquiring customers from the middle classes of both countries requires a low price strategy.
However, companies in advanced countries effectively target wealthy classes that are similar to markets in their home country; therefore, they must carefully consider whether to pursue a low price strategy for a good enough market. In this chapter, we introduced a matrix to analyze customer needs and competitive environ-ments with local companies, as a framework to determine strategic options. There are few incentives to purchase high-priced, high function products even for the wealthy, when the ascending curve of customer needs for product functionality and performance is somewhat satisfi ed. In such a case, companies must select a low price strategy for good enough markets. However, if companies possess technology superior to that of their local competitors, they can partner with local companies using their technology as leverage. Should companies fi nd it diffi cult to differentiate products because of technological catch up by local competitors, their only hope of success is to beat their competitors in terms of prices. Accordingly, companies may also have the option of continuing operations without major changes by acquiring a local company. On the other hand, in case of an increase in the demand for product functionality and performance, it is possible to pursue the premium market using a high price/high function strategy if the company has superior technology. To avoid the quick catch up of local competitors in terms of technology, a company can invest in R&D or build a business model that makes catch up diffi cult.
We conclude this chapter by discussing the BOP business that targets the bottom- most classes of the world’s population. Companies taking this path must operate their business with a proper balance of for-profi t and non-profi t activities, combin-ing the business with social contribution objectives such as solving poverty issues or improving nutrition and hygiene. There are few success stories in the BOP mar-ket; however, the value of providing services required by the poverty-stricken is large because companies partner with a broad range of stakeholders such as public
9.7 Conclusion

154
organizations that provide developmental aid, NGOs, and local communities. Companies conducting business globally will fi nd it worthwhile to consider this business model in some form.
Open Access This chapter is distributed under the terms of the Creative Commons Attribution Noncommercial License, which permits any noncommercial use, distribution, and reproduction in any medium, provided the original author(s) and source are credited.
References
Diamond Inc. (2002). MBA management book. Tokyo: Diamond Inc. Gadiesh, O., Leung, P., & Vestring, T. (2007). The battle for China’s good-enough market. Harvard
Business Review, 85 , 80–89. Karamchandani, A., Kubzansky, M., & Lalwani, N. (2011). Is the bottom of the pyramid really for
you? Harvard Business Review, 89 , 107–111. Moore, J. (2002, January). Chasm (trans: Kawamata Seiji). Tokyo: Shoeisha. Ogawa, K. (2009, July). Management text marketing Nyuumon . Tokyo: Nikkei Sangyo Shinbunsha. Prahalad, C. K. (2005, December). Next market “Hinkonsou” wo “Koukyaku” ni Kaeru Jisedai
Business Senryaku (Wharton Keiei Senryaku Series) (trans: Skylight Consulting). Tokyo: Nikkei BP.
Rogers, E. M. (2007). Innovation Fukyuugaku (trans: Aoike Shin’ichi & Uno Yoshiyasu). Tokyo: Sanno Daigaku Shuppanbu.
9 Marketing Theory in Global Business Context

155© The Author(s) 2015K. Motohashi, Global Business Strategy, Springer Texts in Business and Economics, DOI 10.1007/978-4-431-55468-4_10
10 Shiseido Marketing in China
10.1 Introduction
Shiseido is a leading Japanese cosmetics manufacturer that has been in operation for more than a century. With growth in domestic and international markets, specially those of emerging nations such as China, international development within the cos-metics industry is growing in importance. In Shiseido’s mid-term management plan covering the 3 years between 2011 and 2013, the company continued to strive toward its goal of being a “global player representing Asia with its origins in Japan.” The company outlined four growth strategies: the “global megabrand” strategy, the “Asia breakthrough” strategy, the “new frontier” strategy, and the “customer fi rst” strategy. These strategies state that China’s market will receive top priority as engine of growth, where signifi cant management resources will be invested.
Shiseido set shop in China in 1981, upon request from the Beijing government, the time at which it began a partnership with a local company. Shiseido has a longer history in China’s cosmetics market than any other foreign fi rm. Under the leader-ship of the company’s current honorary chairman, Yoshiharu Fukuhara (he was head of the international division in 1981 at the time of its entrance into China), Shiseido set up a joint venture (JV) in 1991 and established the “Aupres” brand, developed exclusively for sale in China, as one of the top brands in the market. The global brand “Seseido,” the “ZA” brand targeting a younger audience, and the “Uno” brand for men are high selling brands, thus establishing the business in China as a source of growth for Shiseido on the whole.
However, the Chinese market is under the radar of every cosmetic company worldwide, and competition in the country is intensifying. Apart from traditional department store channels, specialty shops, drugstores, and other cosmetics distri-bution channels are becoming more broadly available, making it necessary to mar-ket to a wider clientele. In addition, Shiseido is quality-oriented, establishing itself as a highly reliable brand. However, maintaining this brand name necessitates not only consideration for product safety but also preservation of relationships with the

156
Chinese government through strict compliance to its regulations and aggressive CSR activities.
Shiseido continues to explore new operating strategies in China to strengthen its brand within the market and transition itself from a Japanese cosmetics manufac-turer into a global player representing Asia, including China.
10.2 Corporate Timeline and Overview
Shiseido’s founder, Arinobu Fukuhara, was a chief pharmacist in a naval hospital. He aimed toward the practical application of the pharmaceutical system in Japan, a country where in 1872, Chinese herbal medicine was still very much the norm. Fukuhara began Shiseido as a western-style pharmacy, the fi rst in Japan. The name “Shiseido” originates from a phrase in the Chinese classic text I Ching : “Zhì zāi kūn yuán, wàn wùzī shēng” (“How wonderful is the virtue of the land! All things are born here.” The fi nal two characters, “zī shēng,” are pronounced “shisei” in Japanese and mean “born here”). In 1888, Shiseido launched the sale of Japan’s fi rst tooth-paste. This paste, at the time, was eight times more expensive than abrasive powders for cleaning teeth, but nevertheless was popular because of its ability to remove stains on teeth and alleviate bad breath. In 1915, Fukuhara’s third son, Shinzo, an experienced photographer, took over the company, beginning Shiseido’s foray into cosmetics, launching “Eudermin” in the market. Eudermin, a product that is sold even today, is a scientifi cally derived facial lotion based on western medicine. Shiseido has strived to develop products of scientifi cally high quality, even within its cosmetic products lineup, comparable to pharmaceuticals.
One of Shinzo Fukuhara’s favorite sayings was “let the products do all the talk-ing.” To that end, he put his best efforts into product names, containers, and packag-ing, which evoked the “product.” The camellia fl ower trademark used by Shiseido for more than 120 years was designed by Shinzo himself. The fi rst Miss Shiseido, the predecessor to today’s in-store beauty consultants (“BCs” as they are popularly known) who help customers with beauty-related issues, debuted in 1934 (Table 10.1 )
From the post-war period through the fi rst half of the 1980s, a time of high eco-nomic growth, Shiseido experienced soaring sales in its domestic market. This strong growth is attributed to its business model, which consisted of voluntary chain stores built over a resale system in which stores were obligated to sell products in their retail stores at set prices. However, the bursting of the economic bubble in the latter half of the 1980s began a long period of stagnation for the company, coincid-ing with further diversifi cation of consumer preferences, buying patterns, sales channels, and pricing. In addition, the resale system for cosmetics was abolished in 1997, kicking off a price war. In an attempt to boost fl agging sales, Shiseido consis-tently introduced new brands and products into the market, diluting its sales efforts and beginning a vicious cycle of introducing numerous new products, dispersing marketing investments, reducing the power of their brand, and experiencing poor sales. The company then attempted to limit the number of brands, but with stagnant unit sales, competition in the Japanese market became fi ercer and business remained
10 Shiseido Marketing in China

157
Table 10.1 Development of Shiseido Company Ltd.
Date Events
September 1872 “Shiseido Pharmacy” established in Tokyo’s Ginza district
September 1915 Camellia fl ower selected as corporate trademark
December 1923 Creation of the chain store system
January 1937 Launch of Shiseido’s “Camellia Club”
September 1939 Completion of Shiseido Chemistry Research Laboratories (subsequently, the Number 1 Research Center, followed by the Shiseido Research Center in Shin-Yokohama)
May 1949 Listed on the Tokyo Stock Exchange
June 1957 Creation of Taiwan Shiseido Co., Ltd. (manufacturing began April of following year)
October 1959 Creation of Shiseido Trading Co., Ltd. (which changed its name to Shiseido Fine Toiletry Co., Ltd., and later merged with FT Shiseido Co., Ltd.)
August 1965 Creation of Shiseido Cosmetics (US), later consolidating with Shiseido International Corporation and currently known as Shiseido Americas Corporation
August 1968 Creation of Shiseido Cometici (Italy)
July 1980 Creation of Shiseido Deutschland and Shiseido France
February 1986 Acquisition of France’s CARITA
August 1988 Creation of Shiseido International Corporation, now known as Shiseido Americas Corporation
September 1988 Acquisition of US’ Zotos
January 1990 Creation of Shiseido America Incorporated
October 1990 Creation of Beauté Prestige International in France
October 1991 Completion of Gien Factory in France
November 1991 Creation of Shiseido Cosmenity Co., Ltd. (currently, “Shiseido Fitit”)
December 1991 Creation of Shiseido Liyuan Cosmetics Co., Ltd., a joint venture with Beijing Liyuan Co., Ltd.
July 1992 Completion of the Number 2 Research Center (currently Shiseido Research Center (Kanazawa Hakkei))
April 1995 Consolidation of 15 sales companies into Shiseido Cosmetics Sales Co., Ltd. (now operating as Shiseido Sales Co., Ltd.)
December 1995 Creation of Shiseido International Co., Ltd.
December 1996 Acquisition of Helene Curtis’s North America Professional Division
February 1998 Creation of joint venture, Shanghai Zotos Citic Cosmetics Co., Ltd.
September 1998 Creation of joint venture, Shiseido Dah Chong Hong Cosmetics Co., Ltd.
May 2000 Purchase of majority control of Laboratories Decleor S.A.S. in France Acquisition of Bristol-Myers Squibb’s “Sea Breeze” brand Acquisition of “NARS” brand in the US
June 2000 Completion of the new Research Center (Shin-Yokohama)
October 2000 Creation of FT Shiseido Co., Ltd., transferring toiletry business to it from Shiseido Co., Ltd.
(continued)
10.2 Corporate Timeline and Overview

158
sluggish because of a further decline in sale prices. In an effort to break out of this long period of slow growth, management reforms were put in place at the beginning of 2005 to expand overseas profi ts and create a post-resale domestic business model. In addition to securing a double-digit revenue growth overseas led by China, the company also greatly improved its profi tability by disposing unprofi table divisions.
However, the latter half of the 2000s witnessed a stronger impact of new domes-tic distribution channels, such as drugstores and internet shopping, leaving Shiseido to fi ght diffi cult battles because of its dependence on department stores and spe-cialty shops. In April 2012, Shiseido began a new marketing campaign that com-bined its traditional strength of in-store beauty consultants with information offered via the web to individual customers by creating a special web page “ Watashi +.” As domestic sales weakened, overseas sales became more important because revenues in Asia and Oceania regions, particularly China, were increasing (Tables 10.2 and 10.3 ).
As of March 2012, the Shiseido group had 94 consolidated subsidiaries globally. The company’s businesses cover manufacturing and sale of cosmetics, cosmetics tools, toiletries, hair and beauty products, beauty foods, and pharmaceuticals, as well as research and other services for each of the businesses (Table 10.4 ).
10.3 Shiseido’s Global Business
Shiseido began its global operations in 1957 with sales of cosmetics in Taiwan. At the time, importing of cosmetics was banned in Taiwan; therefore, Shiseido began local production. In 1957, Shiseido Taiwan’s marketing strategy was a system of chain stores with in-store beauty instruction, because the company realized an inad-equate cosmetic-related knowledge among consumers in the country. Later, Shiseido
Table 10.1 (continued)
Date Events
May 2003 Headquarters moved to Shiodome offi ce (in Tokyo’s Minato-ku)
December 2003 Creation of Shiseido (China) Investment Co., Ltd. in Shanghai
March 2006 Closing of factories in Maizuru and Itabashi (consolidating six manufacturing sites into four)
May 2006 Transfer of sanitary products business to Unicharm Group
May 2007 Creation of Shiseido Russia wholly owned subsidiary
April 2008 Creation of Shiseido Vietnam wholly owned manufacturing company
July 2008 Creation of Shiseido Business Solution Co., Ltd.
March 2009 Dissolution of Shiseido Boutique Co., Ltd. and Beauty Technology Co., Ltd.
March 2009 Withdrawal from Boutique business
January 2010 Agreement to acquire Bare Escentuals in the US
Source : Various reference materials
10 Shiseido Marketing in China

159
Table 10.2 Shiseido’s revenue by division and region (units: in JPY 100 million)
2007 2008 2009 2010 2011
Total 7,235 6,903 6,442 6,707 6,824
Domestic cosmetic: 4,239 3,976 3,838 3,584 3,538
Global 2,788 2,757 2,504 3,026 3,197
Other 208 170 100 97 89
Overseas
Japan 4,607 4,300 4,081 3,838 3,813
US 566 507 457 855 822
Europe 1,038 1,000 824 843 905
Asia/Oceania 1,024 1,096 1,080 1,171 1,297
Source : 2012 Shiseido annual report
Table 10.3 Shiseido’s operating margin by division and region
2007 (%) 2008 (%) 2009 (%) 2010 (%) 2011 (%)
Total 8.8 7.2 7.8 6.6 5.7
Domestic cosmetic 10.1 8.1 10.1 9.3 8.3
Global 6.3 5.5 3.8 3.0 2.6
Other 4.8 5.1 10.5 11.4 9.9
Overseas
Japan 6.5 4.0 5.6 4.1 3.0
US 6.1 5.6 6.0 1.6 5.0
Europe 8.3 7.8 6.5 7.2 5.5
Asia/Oceania 15.5 15.3 13.9 14.3 11.4
Source : 2012 Shiseido annual report
Table 10.4 Shiseido’s major businesses and subsidiaries
Line of business Primary divisions Major companies
Domestic cosmetics business
Cosmetics division (manufacture and sales of makeup, makeup tools, and toiletry products)
Headquarters
Professional division (manufacture and sales of hair and beauty products)
Shiseido Sales Co., Ltd.
Healthcare division (manufacture and sales of beauty food products and general medical supplies)
Shiseido Fitit Co., Ltd.
Other (manufacture and sales of domestic OEM products and catalog sales products)
Shiseido International Co., Ltd.
FT Shiseido Co., Ltd.
Shiseido Professional Co., Ltd.
Shiseido Beauty Salon Co., Ltd.
Shiseido Medical Co., Ltd.
Etc.
10.3 Shiseido’s Global Business

160
aggressively expanded its sales network into Asia, Europe, and the US under the “SHISEIDO” global brand, focusing on its specialty: anti-aging and skin-whitening products.
Shiseido aims to expand operations in Southeast Asian markets, with a strong-hold in China. The “SHISEIDO” brand in Taiwan is highly sought-after. In Vietnam, Shiseido has been selling skin care and makeup products under the “SHISEIDO”
Table 10.4 (continued)
Line of business Primary divisions Major companies
Overseas cosmetics business
Cosmetics division (manufacture and sales of makeup, makeup tools, and toiletry products)
Headquarters
Professional division (manufacture and sales of hair and beauty products)
Shiseido America Corporation
Shiseido America Incorporated
Zotos International Incorporated
Shiseido International Europe
Shiseido International France
Shiseido Deutscheland
Shiseido Cometici (Italy)
Shiseido Europe
Beauté Prestige International
Laboratories Decleor S.A.S.
Shiseido (China)
Investments Co., Ltd.
Shanghai Zotos Citic
Cosmetics Co., Ltd.
Shiseido Liyuan Cosmetics Co., Ltd.
Taiwan Shiseido Co.,
Ltd.
Etc.
Other Frontier science division (manufacture and sales of cosmetics materials, pharmaceuticals, and medical-use cosmetics)
Headquarters
Other (sales of clothing and fashion accessories, beverages, etc.)
The Ginza Co., Ltd.
Shiseido Parlor Co., Ltd.
Etc.
Source : 2012 Shiseido annual report
10 Shiseido Marketing in China

161
brand through agent stores since 1997. In response to growing needs caused by the high growth of the cosmetics market, accompanied by dramatic economic growth, Shiseido created Shiseido Cosmetics Vietnam Co., Ltd., and began operations in January 2010. On the other hand, a JV with the large local manufacturer Amore Pacifi c in the 1990s marked the beginning of Shiseido into the Korean market, but signifi cantly strong local manufacturers and sales channels for which the general merchandising store market was critical, left them at around the 10th place in the country. Shiseido is yet to enter the Indian market in earnest, though they do have imported products for sale in luxury hotels and department stores via local distributors.
Although Shiseido has been successful in Asian markets, with the exception of Korea, it has fought way more diffi cult battles in the US market. In addition to the SHISEIDO brand that they introduced in the US more than 40 years ago, Shiseido has aggressively expanded by acquiring other domestic brands such as “Zotos,” “ZIRH,” and “NARS.” However, the US market is more price sensitive than the Japanese market, and North American operations have suffered losses for several years. In 2008, bold structural reforms, such as consolidation and elimination of US subsidiaries, reduced the losses. Nevertheless, business again became sluggish because of the impact of the global economic crisis caused by the crash in the fi nan-cial markets. Shiseido acquired Bare Escentuals, a natural cosmetics manufacturer in the US, to rally its US business, and is expanding globally with Bare Escentuals’ “Bare Mineral” as a global strategic brand.
Shiseido began cosmetics sales in Europe with its 1968 entry into the Italian market. It entered the French market in 1980 through a JV with Pierre Fabre. France is, of course, the center of the fashion, cosmetics, and perfume industries, and is the source of the most up-to-date beauty information in the world. This meant that if Shiseido could be successful in the French market, the country in which top brands vie for business, it would be recognized in cosmetics markets throughout the world. In Europe, fragrances command approximately 30–40 % of the overall cosmetics market. However, this was a completely new arena for Shiseido at the time. Shiseido built a foundation there, in the heart of the fragrance industry, and is now beginning to attract the attention of the world’s perfume industry through collaborations with leading designers, image consultants, perfumers, and marketing directors. To respond to the uniqueness of the French market and successfully enter local mar-kets, Shiseido created a subsidiary for a fragrance brand in France, “Beauté Prestige International,” and has recently implemented a strategy to make its entrance into the rest of Europe. For example, Shiseido purchased 100 % of Swiss resellers’ outstand-ing shares to strengthen operations there, and began sales in Switzerland in January 2010.
By capitalizing its overseas operations, overseas sales as of December 2011 accounted for 44.3 % of overall growth, spanning across 87 countries and regions. With 11 overseas factories and seven R&D centers in the US, Europe, China, and elsewhere, the company is actively pursuing a path of globalization.
10.3 Shiseido’s Global Business

162
10.4 China’s Cosmetics Market and Shiseido’s China Expansion
The central theme of Shiseido’s global strategy is expansion into Asian markets. Sales in China, in particular, are of high priority because it is an enormous market with high growth expectation. With a population of 1.3 billion and high economic growth, China experienced active sales growth in its cosmetics market, growing into a formidable one. The world’s leading cosmetics manufacturers have begun produc-ing cosmetics within China, thereby intensifying competition. Shiseido has per-formed well in the market despite this competition, and SHISEIDO has gained popularity as Chinese women have become more fashion conscious.
In sync with China’s reforms aimed at opening the country, the Chinese cosmet-ics industry has grown rapidly since the 1990s, continuing to experience double- digit annual growth to this day. In 1990, the size of the Chinese cosmetics market was a mere CNY four billion, as opposed to its 2011 growth of almost 30 times, at CNY 112.2 billion (Yano Research Institute ( 2012 )). Japan’s cosmetics market in 2010 was approximately JPY 1.5 trillion, and it can be said that China is soon approaching this level. In addition, skin and hair care products are its major product lines, similar to Japan. Unlike European and US markets, makeup and fragrance products have a smaller share in the market, but are said to be the future engines for growth in the Chinese cosmetics market.
Shiseido’s entrance into the Chinese market goes back to 1981, when it sold imported products in ultra-luxury department stores and hotels after approval by the Beijing government. In 1983, with the fi nalization of the First Technology Cooperation Agreement with the Beijing government, Shiseido began production of the “Hau Zi” series of shampoo and conditioner products. Through this collabora-tion, Shiseido built a relationship of mutual trust with the Beijing government, resulting in the 1991 JV with the Beijing Liyuan Co., Ltd., through a request by the Beijing government, thus creating Shiseido Liyuan Cosmetics Co., Ltd. (SLC), with Shiseido Shiseido (China) Investments Co., Ltd., and Beijing Liyuan Co., Ltd. own-ing 40, 25, and 35 %, respectively, penetrating the Chinese market. At the time, cosmetics in China were sold by weight; however, Haruyoshi Fukuhara, the presi-dent of Shiseido at the time, unilaterally determined that the formation of the JV was the right thing to do. When the JV began in 1991, the domestically produced high-end cosmetics market was non-existent, and so Shiseido explored methodi-cally the positioning of the cosmetics made by SLC within the market. Thus, the brand name of “AUPRES,” which had European connotations was set, and, as a way to ensure identifi cation of product quality as a result of Japan’s superior manufactur-ing technology, “by SHISEIDO” was tacked onto the name. While the quality of these products was comparable to that of imported foreign brands, the prices were set at CNY 80–100, lower than the average CNY 200 of the imported goods. Cosmetics by local manufacturers at the time were sold at CNY 10–20, thus having concerns about its prices being too high. However, they stood fi rm, believing in the importance of its high-end brand strategy (Table 10.5 ).
10 Shiseido Marketing in China

163
Yu Okazawa, who guided interactions with the Beijing government during two assignments in China during the 1980s and 1990s, and who boosted marketing for AUPRES, remarked, “We constantly faked stoicism for the sake of our pride in those early years.” The company carefully researched high-end department store locations and customer demographics in an effort to make AUPRES the number one brand in cosmetic sales, only expanding its channels in a limited fashion. From these efforts, AUPRES became the top-selling brand at Yaohan, a department store catering to foreigners, and the products’ increasingly strong reputation led to many inquiries from retail stores. However, the company focused on gaining top market share within their used channels, and thus put off short-term retail expansion, taking pains to ensure the products’ establishment as a high-end brand. Okazawa also remarked, “At SLC, we were starting a factory, and would have very much liked to increase our points of sale to maintain high factory utilization, but we prioritized establishing ourselves as a high-end brand” (from a February 2010 interview). AUPRES was designated as the offi cial cosmetic brand of Chinese athletes during the 2000 Sydney Olympics as well as the 2004 Athens Olympics, and is currently a widely popular brand sold throughout China.
While establishing its position in the high-end cosmetics market, Shiseido cre-ated a JV, Shanghai Zotos Citic Cosmetics Co., Ltd. (SZC), with Shanghai’s CITIC
Table 10.5 Development of Shiseido in China
1980 Yoshiharu Fukuhara, Intl. Vice President (current honorary chairman) visits China and forms effective relationship with Beijing government offi cials
1981 Sales of cosmetics, soaps, and toothpaste in Yaohan and other high-end department stores and hotels
1983 Production technology agreement with Beijing government for haircare products
1991 Creation of “Beijing Liyuan Co., Ltd.” joint venture with Liyuan Co., Ltd. (currently known as Shiseido Liyuan Cosmetics Co., Ltd.)
1994 Production and sales of AUPRES brand made for Chinese market
1998 Creation of Shanghai joint venture with CITIC (Shanghai Zotos Citic Cosmetics Co., Ltd., “SZC”)
2000 Development of Aupres J’s brand of cosmetics for men
2001 Creation of Shiseido China Research Center Co., Ltd. (a wholly owned subsidiary created inside a Beijing joint venture company)
2003 Creation of Shiseido (China) Investments Co., Ltd. in Shanghai
2004 Start of chain store business
2005 Shiseido China Research Center Co., Ltd. moved to a new stand-alone building
2006 Sales of Urara brand, full-scale rollout of chain store business
2008 Creation of training centers for beauty consultants Selected as cosmetics sponsor for Shanghai World Expo Creation of Shiseido Life Quality Beauty Center
2010 Began selling “DQ” products especially made for drugstores; began professional line targeting high-end hair salons
2011 30th anniversary of Chinese operations; began “Shiseido Dream Come True Human Resources Project”
Source : Various reference materials
10.4 China’s Cosmetics Market and Shiseido’s China Expansion

164
in 1998. This venture aimed to provide products to middle-class consumers. SZC, like SLC, began as an entity with both a sales group and a factory to roll out local production in China, and began by manufacturing and selling the “Za” brand for the Chinese market. Furthermore, SZC’s products did not use the Shiseido name any-where to avoid damaging Shiseido’s image as a high-end cosmetics brand (note that the “S” in SZC stands for “Shanghai,” not “Shiseido”).
In 2003, the company created Shiseido China Co., Ltd. as a holding company for SLC, SZC, and other companies, and made SCH responsible for sales, while SZC specialized in the manufacturing of products for the middle-class market. This was made possible with China’s entry into the WTO, allowing foreign fi rms to create stand-alone sales companies. Za products were primarily sold in department stores, although, in 2004, the company began its specialty store business with the “Pure&Mild” product, exclusively made for the Chinese market. In 2006, the com-pany further developed the “Urara” brand for its specialty stores. Through its spe-cialty stores, SCH invested in sales efforts of its Za, Pure&Mild, and Urara brands without the Shiseido name, while simultaneously marketing SHISEIDO imported products in high-end department stores. In 2010, it developed a new brand, “DQ,” for sale at drugstores (i.e., stores that sell both cosmetics and pharmaceuticals), a distribution channel that was expected to grow in the future.
In 2001, Shiseido created Shiseido China Research Center Co., Ltd. (SRC) as a wholly owned subsidiary focused on R&D, leveraging the abundant Chinese medi-cine and beauty methods nurtured over China’s long history. This subsidiary is responsible for tasks such as discovering new materials in traditional Chinese herbal medicine and application of such materials for product development, researching cosmetics awareness and beauty practices among Chinese women, and developing products for the Chinese market. As of 2012, Shiseido’s Chinese subsidiaries (excluding Hong Kong) included the SCH holding company, with SLC, SZC, and SRC falling under it (Fig. 10.1 ).
Shiseido also invests heavily in CSR activities within China. Since 2005, the company has participated in state projects aimed at “improving the appearance of Chinese women” of all ages. Furthermore, Shiseido has supported tree-planting projects, the opening of the Hope Elementary School, and artists. Unique to the cosmetics industry, it has taught women with bruises, white spots, scars, and other
Shiseido (China) Co., Ltd.(SCH)
Shiseido Liyuan Cosmetics Co., Ltd. (SLC)
Primary shareholders: Shiseido Group (approx. 70%), Beijing Li Yuan Co., Ltd. (approx. 30%)
Shanghai Zotos Citic Costmetics Co., Ltd. (SZC)
Primary shareholders: Shiseido Group (approx. 90%), CITIC Group (approx.10%)
Shiseido China Research Center Co., Ltd. (SRC)
Primary shareholder: Shiseido Group
Fig. 10.1 Structure of Shiseido group companies in China (as of 2012)
10 Shiseido Marketing in China

165
serious skin troubles how to conceal them with cosmetics. In May 2010, Shiseido became the cosmetics industry sponsor of the Shanghai World Expo, the fi rst Japanese company to be a sponsor for that exposition. As the cosmetics manufactur-ers selected by the Shanghai World Expo Coordination Bureau, Shiseido provided cosmetics, perfumes, and sunscreen to event personnel as well as instructions on makeup application.
10.5 Marketing Strategy in China
Distribution channels for cosmetics can be classifi ed into three groups: department stores, specialty stores, and drugstores. Shiseido has implemented a product strat-egy for each of these channels in China. High-end products such as the “Clé de Peau Beauté” or SHISEIDO are imported and sold at high-end department stores. AUPRES and its higher-end version SUPREME AUPRES, both made exclusively for the Chinese market, are sold in department stores. In addition, there are other brands, such as ELIXIR, HAKU, Pure&Mild, and Za, which appeal to a wider range of middle, class consumers than the aforementioned prestige brands; they are distributed through specialty shops and drugstores (Tables 10.6 and 10.7 )
The primary battlefi elds for top class imported cosmetics, such as Estée Lauder, Christian Dior, Chanel, SK II, and Lancôme, are high-end department stores. Shiseido’s products that compete in this space are their global brands Clé de Peau Beauté (CPG) and SHISEIDO. The AUPRES category, developed for the Chinese market and manufactured in China, is targeted at a marginally lower demographic and priced not only for the well-to-do class, but is within reach for professional women on a budget. In 2006, Shiseido began to compete with premium products from European and US cosmetics manufacturers by selling Supreme Aupres in the CNY 180–480 price range at high-end department stores in Shanghai and Beijing.
Table 10.6 Shiseido’s brand in China by channel type (as of 2012)
Category Major brands Distribution channels
Department stores Chain stores Drug stores
High prestige Clé de Peau Beauté +
Prestige AUPRES +
SUPREME AUPRES +
Global SHISEIDO +
Middle ELIXIR SUPERIEUR +
HAKU +
TSUBAKI + +
Uno + +
Urara +
Pure&Mild + +
Za + +
AQUALABEL + +
Source : various reference materials Note: DQ is sold in modern drugstores
10.5 Marketing Strategy in China

166
AUPRES was originally developed to fi ll the enormous gap between high-end imported products and low-end Chinese products. However, with the successive entrance of foreign fi rms into the Chinese market, competition intensifi ed with products geared more toward the masses than the top class products, such as L’oréal, Clinique, and Biotherm. In response, SLC completely redesigned AUPRES in 2008 to improve its competitiveness by targeting the “80s generation” (segment of the population that was born during the 1980s). AUPRES’ new concept was that of the “blooming beauty,” or “the inner energy of beauty held by Chinese women that would blossom through AUPRES.” To further demonstrate the brand’s exclusivity toward Chinese women, the company removed the “by SHISEIDO” logo from packaging when the product went on sale. Shiseido also used the consumption hab-its of the 80s generation by aggressively running promotions, particularly through word-of-mouth marketing. Shiseido promoted the strengths of its products through the Internet by having product ambassadors with clear, light skin record their opin-ions after using these products on blogs. Born during China’s “one child” policy, most people born in the 80s have grown alongside the spread of the Internet in the country. Their values and preferences differ from previous generations, and their consumption habits are said to be similar to Japan’s younger generation. They have no particular loyalty to luxury brands and value originality. Being very familiar with the Internet, their online shopping percentage is higher than that among other age groups, relying more on word-of-mouth than traditional commercials.
In 2004, Shiseido used its knowhow of specialty stores in Japan to begin a Shiseido chain store as its second pillar to the premium product business within department stores. Shiseido is currently developing markets in rural and small- and medium-sized cities in China’s interior through direct sales by these chain stores. The chain store business comprises small retail stores and roadside shops that pri-marily sell medium-priced products. Shiseido’s agreements with the chain stores are reviewed annually, and either side may terminate the agreement, although Shiseido aims to build long-term relationships of mutual trust. Shiseido provides marketing support and training to sales employees, while the stores are required to understand Shiseido’s products to bring its sales to constitute 50 % of the stores’ revenues and install point-of-sale terminals in the stores. Starting with an initial three stores in 2004, Shiseido expanded at a tremendous pace, with more than 6,000 stores as of October 2012. In the past, these stores sold products imported from Japan as well as the Pure&Mild brand, but began selling Urara in 2006, a chain store
Table 10.7 Prices of main products by Shiseido in China (as of 2009, in RMB)
Category Cie de Peau Beaute Aupres Urara Za
Eye shadow 650 115–260 75–90 78–88
Lipstick 480–550 120–140 55–95 80–88
Foundation 700–900 170–240 110–150 68–115
Cleansing foam 500 90–135 90 39–78
Lotion 820 100–200 130–140 98–128
Emulsion 920 105–210 135–150 98–138
10 Shiseido Marketing in China

167
brand that was made exclusively for Chinese women. Urara is currently a fl agship product at the chain stores.
China’s distribution channels are becoming more diverse, with channels such as superstores, drugstores, and convenience stores. Some drugstores are pharmacies with a pharmacist on duty, while others primarily sell toiletries. In the former, Drugstores are thought to be a promising distribution channel for cosmetics. For example, French Vichy entered the Chinese market in 1998, and currently holds contracts with 200 drugstores, through which it markets its products. Shiseido began selling the new “DQ” brand at drugstores in 2010 and is working on expanding the breadth of its channels.
10.6 Competition with Western Brands
Foreign brands are widely popular in the Chinese market. Foreign cosmetic manu-facturers have a higher reputation for quality and reliability than domestic manufac-turers, and foreign manufacturers, primarily P&G, Shiseido, L’oréal, and Estée Lauder, are competing for market share. For example, Estée Lauder has introduced its MAC and Bobbi Brown brands into the market, and P&G has done likewise with its SK II brand. Johnson & Johnson, L’oréal, and Shiseido have all created R&D centers in Shanghai. The cosmetics market in China is known to have several local brands, but the quality and brand name of those brands is in no comparison to for-eign brands, leaving Shiseido to compete, for the meanwhile, with global western fi rms such as L’oréal, Estée Lauder, and P&G (Tables 10.8 , 10.9 , and 10.10 ).
P&G primarily manufactures and sells detergents, toiletries, and cosmetics, and is the world’s largest consumer products company. The company entered the Chinese market in 1988 with sales of its Rejoy shampoo, and in 1989 with sales of its Olay brand skin care products. Rejoy enjoys approximately 40 % market share in China’s shampoo market, while mass-market Olay brand cosmetics are among the top ten in the Chinese market.
Estée Lauder, headquartered in the US, manufactures and sells cosmetics, skin care products, hair care products, and perfumes. It entered the Chinese market in 1993 with its fl agship Estée Lauder and Clinque brands. It primarily imports high- end cosmetics. In February 2010, Estée Lauder’s CEO, Fabrizio Freda, remarked, “We currently sell in 40 Chinese cities, and are considering the sale of our products in 600 cities in the future. We will be making further investments in our skincare division, which is our most profi table business.”
The L’oréal Group, headquartered in Clichy, France, is the world’s largest cos-metics company. The company focuses primarily on cosmetics, hair coloring, skin-care, and perfumes; however, it is also active in the fi elds of dermatology and pharmaceuticals. The company entered the Chinese market in 1996, following P&G and Estée Lauder, and is rapidly gaining ground by acquiring local fi rms. It is dis-tinctive in its wide range of products, from its high-end Lancôme cosmetics to the mass-market Maybelline brand. In 2003, it acquired the local cosmetics brand “ Yue Sai ,” which sold its products in 80 department stores. In 2004, it expanded its
10.6 Competition with Western Brands

168
Table 10.8 Profi tability of global cosmetics manufacturers (units: USD million)
L’oreal SA Estee Lauder P & G Shiseido
Total assets
2005 28,180 3,886 61,527 5,698
2006 32,676 3,784 135,695 6,265
2007 33,920 4,126 138,014 6,785
2008 32,009 5,011 143,992 6,142
2009 32,375 5,177 134,833 6,173
2010 33,422 5,336 128,172 8,335
2011 37,332 6,274 138,354 8,902
Revenues
2005 18,085 6,336 56,741 5,935
2006 19,830 6,464 64,416 5,941
2007 23,718 7,038 72,441 6,355
2008 24,383 7,911 79,257 6,897
2009 24,287 7,324 76,694 7,025
2010 27,099 7,796 78,938 6,924
2011 28,277 8,810 82,559 8,066
Cost of sales
2005 4,879 1,426 25,920 1,326
2006 4,978 1,491 30,850 1,348
2007 5,869 1,570 33,667 1,400
2008 6,651 1,749 39,261 1,434
2009 7,175 1,882 38,690 1,748
2010 7,918 1,829 37,919 1,721
2011 8,134 1,937 40,768 2,029
SG&A expenses
2005 9,180 3,998 18,010 3,962
2006 10,163 4,066 21,278 3,926
2007 11,985 4,512 24,180 4,160
2008 13,314 5,103 24,017 4,604
2009 13,529 5,024 22,630 4,769
2010 14,932 5,177 24,998 4,661
2011 15,567 5,784 25,973 5,503
Net profi t
2005 2,454 406 7,257 128
2006 2,588 325 8,684 216
2007 3,640 449 10,340 311
2008 2,865 474 12,075 194
2009 2,495 218 13,436 197
2010 3,116 478 12,736 362
2011 3,393 701 11,797 154
Source : S&P Compustat Database (global version)
10 Shiseido Marketing in China

169
presence in China by acquiring the mass-market “Mininurse” brand, which had 280,000 sales outlets for its cosmetics in bulk retailers and other channels.
The Chinese cosmetics market is concentrated along coastal regions such as Shanghai, accounting for 90 % of cosmetic sales in China. Western cosmetic manu-facturers spend vast sums on advertising centered on large cities, promoting their brands in sales channels such as department stores, drugstores, supermarkets, hypermarkets (stores that combine supermarkets and department stores), and gen-eral stores. For example, in 2004, P&G bid the highest price to advertise during China’s Central Television’s prime time.
However, in September 2006, products in the SK II lineup (owned by P&G’s Max Factor) were found to have banned substances in them, forcing the company to accept returns and halt further sales. This incident stemmed from chromium and neodymium, the use of which is banned in China, being detected in nine SK-II
Table 10.9 Shares of global cosmetic manufacturers in global market (%)
Company Country 2004 2005 2006 2007 2008 2009 2010 2011
Procter & Gamble USA 8.9 12.9 12.1 12.0 11.8 11.7 11.6 11.4
L’oreal Group France 9.7 9.7 9.8 10.0 10.2 10.0 9.7 9.7
Unilever Group UK 7.5 7.1 6.4 6.4 6.4 6.5 7.1 7.7
Colgate-Palmolive USA 3.9 3.9 3.6 3.7 3.7 3.6 3.7 3.8
Avon Products USA 3.3 3.3 3.0 3.1 3.2 3.3 3.3 3.2
Beierdorf AG Germany 2.9 3.0 2.9 3.2 3.3 3.3 3.2 3.1
Estee Lauder Cos USA 3.9 3.8 3.4 3.2 3.1 3.0 2.9 2.9
Johnson & Johnson USA 2.0 2.1 2.9 2.9 2.9 2.9 2.9 2.8
Shiseido Co JP 2.8 2.7 2.4 2.3 2.3 2.4 2.5 2.5
Kao JP 1.6 1.6 2.3 2.0 2.0 2.2 2.1 2.1
Source : Euromonitor International ( 2011 )
Table 10.10 Shares of global cosmetic manufacturers in Chinese market (%)
Company 2004 2005 2006 2007 2008 2009 2010 2011
Procter & Gamble (Guangzhou) 16.7 18.0 19.0 18.4 17.3 16.7 16.4 15.9
L’oreal China 6.2 6.8 7.0 8.1 9.2 9.8 10.5 11.0
Shiseido Liyuan Cosmetics 2.4 2.6 3.8 4.4 4.7 5.0 5.3 5.4
Unilever China Ltd 6.2 6.2 4.7 4.3 4.5 4.4 4.4 4.5
Amway (China) 5.8 5.1 3.7 3.6 4.1 4.3 4.0 3.9
Colgate (Guangzhou) 3.8 3.5 3.8 3.6 3.5 3.4 3.4 3.4
Hangzhou Mary Kay Cosmetics 1.5 2.1 2.1 2.2 2.4 2.9 3.1 3.2
Beiersdorf AG 0.8 2.9 3.0 3.1 3.1 2.9
Johnson & Johnson China 1.9 2.0 2.1 2.1 2.9 2.6 2.5 2.4
Estee Lauder 0.7 0.9 1.1 1.4 1.6 1.8
Avon (China) 3.8 3.4 2.8 3.1 3.0 2.7 1.6 1.1
C-Bons Group 2.2 2.0 1.6 – – – – –
Source : Euromonitor International ( 2011 )
10.6 Competition with Western Brands

170
products, resulting in directions from the Chinese General Administration of Quality Supervision, Inspection and Quarantine (ASQIQ) to quarantine products imported from Japan (SK-II was originally a sub-brand of Japan’s Max Factor that was acquired by P products sold in China under this brand were thus imported from Japan). Finally, the Chinese government issued a statement that the chromium and neodymium detected in these products were originally in the products’ raw materi-als, posing no threat to the human body. Still, the damage was done on SK-II’s brand image. After the Chinese government’s directives were issued that September, there were incidents of refund-seeking consumers causing damage to certain stores, and the media calling P&G, which did not respond to requests for refunds, a “Bàwáng,” or tyrant of the worst kind, which caused further problems.
This displays the necessity of heeding unforeseen risks caused by governments. Quality inspections on imported cosmetics have recently become more stringent, and as a result, new product introductions into the Chinese market are said to be substantially behind schedule. The fault also lies with the complexity of permits and licensing systems. Counterfeit goods are also a source of trouble for manufacturers. Shiseido has contracted with multiple law fi rms and to gather information regarding counterfeit products. After gaining suffi cient numbers, it contacts the appropriate bureaucrats and government agencies, thereby seizing counterfeit manufactured products.
Despite the Chinese market’s many issues, its scale as the world’s largest cos-metics market is also expanding rapidly. Shiseido perceives the Chinese market as a pillar of its overseas strategy and is in the process of securing itself as a global cos-metics manufacturer representing Asia, while confronting the risks posed by China. Competing with western megabrands in the Chinese market can be perceived as a preliminary battle for business in other emerging nations, where much future growth in new cosmetics markets is expected.
10.7 Significance of This Case Study and Suggested Questions
This case study describes Shiseido’s business in China from the 1980s, focusing particularly on the company’s marketing strategy. Shiseido entered the Chinese market at the behest of the Beijing government and expanded its market by modify-ing its marketing strategy in response to changes in the marketplace. Shiseido’s fi rst success in China came from the AUPRES brand, exclusively developed for that market. Because it was produced in China, it would have been more benefi cial for the company to increase its number of retail outlets as much as possible to keep fac-tory utilization high. Instead, it limited its channel growth to establish its image as a high-end brand. The company clearly differentiated the AUPRES brand from SHISEIDO, a global brand popular among the wealthy, and developed products in the middle segment between high-end imported products and cheap domestic products.
10 Shiseido Marketing in China
171
However, P&G, Estée Lauder, Lancôme, and other powerful foreign brands have also entered the market, making competition more intense. SHC is increasing its product line and executing marketing strategies for each product level. Unlike the western cosmetic manufacturers, Shiseido has developed its own unique channel in the form of specialty shops and aims to reach a wide range of consumers. It is a business model developed in Japan that has been imported to China. Additionally, Shiseido has recently begun selling its products in drugstores and over the Internet, increasing its products’ reach and distribution channels.
Using this case study, the following questions can be considered to further deepen the understanding of global strategy.
• Compared with Europe and the US, what are the merits and demerits of Shiseido expanding its cosmetics business in China? From Japan’s perspective, is the gap between the Chinese and western markets, as described by the CAGE frame-work, larger than that between the cosmetics markets in China and Japan?
Open Access This chapter is distributed under the terms of the Creative Commons Attribution Noncommercial License, which permits any noncommercial use, distribution, and reproduction in any medium, provided the original author(s) and source are credited.
• Describe the marketing strategy for one of Shiseido’s products in China. How are customers segmented and how does Shiseido view its target customers? Describe the four Ps (product, price, place, and promotion) of marketing as they apply to Shiseido in China.
• How do Shiseido’s marketing strategies differ from other large players in the Chinese market (L’oréal, P&G, etc.)? As competition becomes more intense in the Chinese market, should Shiseido continue down the same path?
• Shiseido aims to be a “global player representing Asia,” and seems to be follow-ing a strategy that differentiates itself from large western players. Looking into global market trends over the next 5–10 years, do you think this strategy of dif-ferentiation is appropriate?
References
Euromonitor International. (2011). World cosmetics & toiletries marketing directory 2011. London: Euromonitor International.
Yano Research Institute. (2012). Chugoku Keshouhinshijou Ni Kan Suru Chousa Kekka. Tokyo: Yano Research Institute (in Japanese)
References

173© The Author(s) 2015K. Motohashi, Global Business Strategy, Springer Texts in Business and Economics, DOI 10.1007/978-4-431-55468-4_11
11 International R&D Management
11.1 Introduction
In order to enter into foreign markets with technical strength, it has become increas-ingly critical for Japanese companies to maximize the effectiveness of research and development. In addition to global western fi rms, companies in Korea, China, and other emerging nations are gaining strength. To maintain a superior position in rela-tion to these competitors, Japanese companies must develop products that are attrac-tive to customers in a timely fashion. For this purpose, research and development (R&D) will require the best personnel in a company and companies must deal with strategically crucial information. Furthermore, as a place to amass cutting-edge information, it is most effi cient to determine a base and concentrate the R&D efforts. Accordingly, global fi rms with many foreign sales and production offi ces opt to keep R&D activities within their home countries.
Recently, however, globalization is occurring even within the R&D departments of Japanese companies. Till now, companies that had foreign R&D facilities typi-cally operated them inside advanced western nations; however, in recent times, companies have increasingly begun establishing R&D centers in emerging nations such as China. The primary battlegrounds for global businesses are transitioning from advanced nations like Japan, Europe, or the US to China, India, and other emerging nations. Thus, companies fi nd it effective to create local development centers to accurately capture consumer needs and expeditiously introduce new products into the market. In addition, most customers in emerging nations still do not have very high income levels; therefore, it is important to provide products with suffi cient features at low cost. To develop new products for these “good enough” markets, companies must keep development costs under control by keeping R&D in markets with low wages.

174
Companies conduct various activities to meet these objectives within their foreign R&D centers. In this chapter, we discuss management of foreign R&D by fi rst understanding Japanese corporate trends regarding foreign R&D. The Japanese corporations became globally active in a signifi cant way in 1985, around the time of the Plaza Accord, when the value of the yen began to climb. However, internation-alization of R&D is a relatively recent trend, beginning after the year 2000. Next, we introduce a theory of the internationalization of R&D activities in three points: (1) Should R&D be conducted in foreign countries? (2) If so, what kind of R&D should be transferred to foreign countries? (3) Which countries are appropriate tar-gets for expansion? Finally, we discuss examples of reverse innovation, or the expansion of local innovation into global markets, the latest topic regarding R&D in emerging nations.
11.2 Foreign R&D Activities of Japanese Companies
The strengthening yen after the Plaza Accord of 1985 enabled an acceleration of expansion into foreign markets among Japanese companies. This expansion tempo-rarily diminished with the bursting of the economic bubble in the fi rst half of the 1990s and the impact of the 1997 Asian economic crisis; however, the long-term trend over the last 20-plus years has been toward corporate globalization. R&D internationalization has also gathered steam since 2000 (Fig. 11.1 ). Out of a total of 22,864 foreign facilities, 667 are designated for R&D activities, representing a little
Fig. 11.1 Number of foreign subsidiaries and R&D facilities by year of establishment ( Source : Toyo Keizai Shinhousha 2011 )
11 International R&D Management

175
more than 3 % of the total. In recent times, the number of foreign operations conducting R&D has increased (Toyo Keizai Inc., “Kaigai Shinshutsu Kigyo Souran 2011”). Three periods of peak can be observed in globalization trends among the Japanese fi rms: the latter half of the 1980s, mid-1990s, and post-2000. The fi rst two peaks were largely because of a rising yen that drove companies to manufacture overseas to avoid exchange rate risks: during the 1980s, the strong yen was seen post-Plaza Accord; during the 1990s, the exchange rate broke the 80 yen to the dol-lar barrier, reaching a high of 79.75 yen (April 1995). Overseas expansions in the 2000s were different than what occurred during the two prior peak periods, as trade and investment barriers were lowered because of the IT revolution, WTO negotia-tions, and free trade agreements, all phenomena of a fl attened world. Among these phenomena, China’s entry into the WTO in 2001 had a great impact on the sudden rise in the number of companies entering that market. The timing of the increase in foreign R&D facilities also coincided with the dawn of global economy.
Many types of activities come under the foreign R&D facility nomenclature. However, these activities can be divided into two types: (1) “technological acquisi-tion” R&D, which incorporates cutting-edge technology developed overseas into domestic operations, and (2) “local development” R&D, which localizes technol-ogy developed domestically into foreign operations. The key difference between the two types is the direction of the fl ow of technology and knowledge important to R&D: in the fi rst, the fl ow is from the foreign country to home country, whereas the latter is in the opposite direction. Kuemmerle terms the fi rst “Home Base Augmenting” or HBA, and the latter “Home Base Exploiting” or HBE (Kuemmerle 1997 ). HBA holds true when a desirable technology exists in an investment destina-tion; for example, companies that create research centers in Silicon Valley or out-skirts of Boston to acquire cutting-edge IT or biotech technology. On the other hand, HBE is focused on market scale or market characteristics rather than the tech-nological level of the investment destination. When local consumer needs differ from those in the home country, it becomes necessary to localize products; for example, the creation of R&D centers in China to localize home appliances such as washing machines or refrigerators for the Chinese market (Fig. 11.2 ).
Let us examine the R&D centers of Japanese fi rms more closely. Of the 667 foreign entities conducting R&D, 222 are in the US and an almost equal number, 205, in China; next is Europe with 100. These three regions total 527 R&D facili-ties, a lion’s share of Japan’s foreign R&D centers. The US and Europe are impor-tant markets for Japanese fi rms and, at the same time, are signifi cant regions with superior technology. Accordingly, Japanese fi rms have used these R&D centers for both “technology acquisition” and “local development.”
Within the US and Europe, R&D centers focusing on chemical and pharmaceuti-cal research comprise a relatively high share of total R&D, where aggressively introducing leading technology is of utmost importance. This explains the high share of “technology acquisition” R&D centers in this region. In addition, the US has a relatively high number of R&D centers focused on electronics and IT, and those in Europe are focused on automotive research. We can interpret this as a mani-festation of the differences in technological superiority by industry. The US has
11.2 Foreign R&D Activities of Japanese Companies

176
many fi rms and research organizations with superior technology in the IT arena, as represented by Silicon Valley, whereas Europe has many automakers and auto parts manufacturers with superior technology (Table 11.1 ).
Many Japanese corporations have R&D centers in the emerging nation of China in addition to the US and Europe. Since the 1990s, the Chinese government has pursued an aggressive policy of introducing foreign capital, making China the
Incorporation of Local Tech + Home Country Tech EnhancementHome Base Augmentation (HBA)
Utilization of Home Country Tech + Local Tech DevelopmentHome Base Exploitation (HBE)
Home Country
R&D Center
LocalR&D Center
Fig. 11.2 Types of R&D internationalization
Table 11.1 Overseas R&D facilities by region and industry
Chemical and pharma
General equipment Automotive
Electronics and IT Other Total
China 31 (15.1 %) 18 (8.8 %) 26 (12.7 %) 84 (41.0 %)
46 (22.4 %) 205 (100.0 %)
NIES 10 (25.6 %) 3 (7.7 %) 3 (7.7 %) 16 (41.0 %)
7 (17.9 %) 39 (100.0 %)
ASEAN 1 (2.1 %) 2 (4.3 %) 8 (17.0 %) 19 (40.4 %)
17 (36.2 %) 47 (100.0 %)
US 53 (23.9 %) 11 (5.0 %) 15 (6.8 %) 85 (38.3 %)
58 (26.1 %) 222 (100.0 %)
Europe 16 (16.0 %) 9 (9.0 %) 17 (17.0 %) 31 (31.0 %)
27 (27.0 %) 100 (100.0 %)
Other 9 (16.7 %) 0 (0.0 %) 2 (3.7 %) 10 (18.5 %)
33 (61.1 %) 54 (100.0 %)
Total 120 (18.0 %)
43 (6.4 %) 71 (10.6 %) 245 (36.7 %)
188 (28.2 %)
667 (100.0 %)
Source : Toyo Keizai Shinhousha ( 2011 )
11 International R&D Management

177
“factory of the world.” In addition, with the expansion of its economy and rising income levels of its citizenry, China’s appeal as the “market of the world” has increased, sustaining strong level of investments in the country. Recently, the Chinese government has announced a policy for raising the technological capability of homegrown enterprises, describing this policy with the catchphrase “indigenous innovation.”
Because China is the most important foreign market for many Japanese fi rms, “local development” R&D centers in China that can develop products based on the local market needs are deemed to be necessary there. Since China has abundance of low-cost, high-quality personnel, many companies also outsource their product development to China. More than 40 % of R&D centers in China are in the electron-ics and IT sectors. These industries spend a high percentage of their revenues on research and development, and much of their human resources on product develop-ment. Thus, they can expect to see huge cost reductions from outsourcing their product design and development. On the other hand, China has relatively few auto- related R&D facilities. Developing a new vehicle in the automotive industry requires a vast amount of resources, and with business in China often being done in joint ventures with local partners, many companies are hesitant to transfer R&D func-tions out of the fear of technology leaks (Table 11.1 ).
Activities within the newly industrialized economies (NIEs; Korea, Taiwan, Hong Kong, and Singapore) or ASEAN (excluding Singapore) countries are very important for the Japanese fi rms. The technological level of NIEs is very high com-pared with other countries in Asia, such as China or the ASEAN nations. This explains the relative abundance of R&D centers in chemical and pharmaceutical fi elds, where “technology acquisition” is important. In particular, Singapore is investing in the biotech industry, and has established itself as biocluster with R&D facilities including those of western pharmaceutical manufacturers. The share of electronics- and IT-related R&D centers is also growing, although this is primarily in Korea and Taiwan, where progress is being made on development centers’ infrastructures.
The ASEAN countries saw many investments made in their countries by the electronics and automotive industries during the initial foreign investment boom in the 1980s. Prior to China adopting more open policies during the 1990s, the ASEAN countries provided important investment destinations for Japanese fi rms, with some facilities boasting relatively long history. However, the creation of R&D facilities in these regions is a fairly recent trend, with the share of electron-ics- and automotive- related R&D facilities growing. For the electronics and IT industries, many operations begin as offshore R&D centers. It is expected that the automotive industry will establish R&D functions locally as adjuncts to its manu-facturing operations. The automotive production facilities within the ASEAN countries are concentrated in Thailand, with the Japanese manufacturers moving forward in creating development centers in the Bangkok vicinity. Most of these facilities were created after 2000.
11.2 Foreign R&D Activities of Japanese Companies

178
11.3 R&D Internationalization Theory
In this chapter, we explain three points regarding theories of R&D internationaliza-tion in the following order. First, we discuss the need to create a research facility in a foreign country. The incorporation of latest technologies available overseas and development of products adaptable to local needs are possible without the establish-ment of overseas facilities. For example, information about foreign markets can come from academic groups or research papers, and it may be more effi cient for product development to be done centrally within domestic operations. We catego-rize the merits and demerits of conducting R&D in overseas facilities.
Next, we discuss the purpose of a company to create a foreign R&D facility. The comparison between the “technology acquisition” model and a “local development” model provided above is one way to frame the argument, but there are many possi-ble activities that a R&D facility can perform. For example, offshoring design and development of electronics can be diffi cult to place in either of the aforementioned categories. Moreover, we discuss the best means for position development facilities to promote local parts supply, as automakers expand overseas. An explanation of a more detailed method of classifi cation is given below.
Finally, we discuss the means of how companies can select candidate countries for their expansion. To proceed with global expansions of R&D facilities, an impor-tant question for any business is “which are the appropriate countries to expand”. For example, a company may want to create design and development operations for electronics products in emerging nations; however, should a company co-locate these facilities with their sales operations in China or build new facilities in India? Discussions such as these occur daily in global enterprises. It may come down to the types of work done by a company’s local operations, but many facets should be considered, such as the level of technology in local universities and research centers, quality and cost of research personnel, intellectual property institutions, and economic incentives for investment. We discuss each of these points below.
11.3.1 Merits and Demerits of Foreign R&D Centers
We have not treated the “research” and “development” aspects of R&D centers independently up to this point, but now discuss them separately. The term “research” denotes activities more abstract than products and services, whereas the term “development” denotes any activity that creates plans for specifi c new products and services. These two activities are often performed separately within corporations. For example, for a general electronics equipment manufacturer with several divisions, such as computers, appliances, and telecommunications equipment, “research” is executed by the “R&D Division” or the “Central Research Center,” i.e., a corporate division not belonging to any one division. On the other hand, “development” is often done in specifi c product divisions such as the appliances division or telecommunications equipment division. Within pharmaceutical
11 International R&D Management

179
companies, research typically refers to activities performed prior to the clinical trials process, whereas everything afterwards is considered “development.” As with an electronics manufacturer, “research” and “development” are typically executed in separate divisions, with former being conducted in research laboratories and the latter in development divisions. In debating whether to place the functions of “research” and “development” in an overseas setting, a company considers the issue within each organization and division. In other words, research facilities are overseen by research divisions, whereas development facilities are overseen by respective divisions. The reporting structures for overseas facilities basically fl ow upward through each organization in the home country.
“Research” and “development” activities tend to be more centralized within head-quarters than “production” and “sales” functions, and the level of internationaliza-tion is also said to be low (Asakawa 2003 ). There is a theory of gradual development within corporate internationalization that mentions companies pass through four stages of development: (1) indirect exports (i.e., using trading companies), (2) direct exports (creating local sales subsidiaries), (3) local production, and (4) consolidated sales and production centers (Dunning 1993 ). “Research” and “development” are functions that companies ultimately transfer to their foreign facilities during the fi nal stages of development, when globalization has reached its furthest point. We have seen the globalization process followed by the Japanese fi rms in Fig. 11.1 , and noted that the creation of R&D facilities started after 2000, much later than production or sales facilities. In conducting research and development, new research topics, prod-uct ideas, and viewpoints are paramount; however, there are many hidden areas of tacit knowledge, and these activities are most effi ciently carried out by groups with certain focus. Further, information on new products and services is strategic for some companies, and if leaked, it could damage the company signifi cantly. When we consider these factors together, we see that companies must be more deliberate about the creation of R&D facilities than their production or sales facilities, when located geographically distant from headquarters. When the proportion of overseas activities of a company increases and consolidated centers are being built offshore, in fact, it is common to conduct a portion of its R&D overseas.
By conducting research overseas, companies can effi ciently incorporate local technology. Having continual contact with local universities, research organiza-tions, and the science community as a whole allows for advancement in technology acquisition (or home base augmenting). For example, many electronics and phar-maceutical companies have research centers in Silicon Valley on the West Coast of the US for the exclusive purpose of gathering information regarding the latest research and technology trends in real-time. Having this listening function located right at the scene of events enables joint research with local researchers as necessary or research facilities in home countries to capitalize on. New discoveries are made in cutting-edge disciplines on a daily basis, and so the merits in creating local centers to use this information as quickly as possible are large. Research has shown that companies with foreign research organizations designed for technology acquisition use technology from foreign scientifi c communities more effectively alongside their own research and development (Iwasa and Odagiri 2004 ).
11.3 R&D Internationalization Theory

180
On the other hand, the merits of creating “development” centers overseas are not as clear. The objective of “local development” (or home base exploiting) operations is to bring in products and technologies that are already competitive in their home countries and localize them to meet the needs of the local consumers. The key points to consider are as follows: (1) the high level of technology in the home country and (2) gathering local information for localization. The latter is a part of marketing, making it unnecessary for the development itself to occur locally. For example, Panasonic created a Life Research Center in Shanghai, and uses this center to sur-vey how Chinese consumers use appliances. The center was created primarily as a marketing function to support a particular division, with actual product develop-ment managed by the company’s headquarters.
However, many Japanese global fi rms have overseas development centers, and have them for several reasons. First, these centers can reduce development costs. For example, average salaries for new college graduates in China are about one- tenth of that of their Japanese counterparts. Companies with development centers in countries with abundant engineers, like China or India, have their centers in these countries to greatly reduce costs. In addition, local support is required to meet prod-ucts’ safety or other regulations. For example, pharmaceutical companies conduct clinical trials in each country to ensure compliance with drug regulations in that country. In such cases, local development centers are a must. As can be observed, the purposes for creating overseas development facilities and their activities vary depending on the circumstances of each company. This is discussed in further detail in the next chapter.
We discussed whether “research” and “development” functions should be per-formed overseas or not. We conclude this portion of the discussion by summarizing the relationship between a company’s home country and its foreign facilities. International R&D projects can be classifi ed into four types (Ghoshal and Bartlett 1990 ):
1. Center-for-global: developing new products and processes in the home country for global markets
2. Local-for-local: developing products and processes for local markets indepen-dently in each foreign R&D center
3. Locally for global: developing products for global markets in foreign R&D centers
4. Globally linked: developing products with multiple R&D centers in various markets networked together
The pattern to be selected depends on the type of project and corporate policy; however, pattern (1) is typically chosen by companies whose foreign R&D organi-zations play a small role. These foreign organizations are effective in fi nding the latest technologies, but they do not need to be large-scale in nature. Projects for (2) and (3) require foreign R&D centers. Type (2) is the norm for R&D centers that work as a part of integrated companies existing in each region, and are most inde-pendent from their respective parent company organization. Type (3), on the other
11 International R&D Management

181
hand, often operates as foreign R&D centers controlled by the home country, targeting global markets. Type (4) is the pattern used when a company has a global project in which multiple regions participate.
11.3.2 Activities of Foreign R&D Centers
There are many ways to classify the activities of foreign R&D centers, including Kuemmerle’s HBA and HBE. Gammeltoft created the following classifi cations on the basis of a comprehensive empirical research of R&D internationalization that occurred up until that time (Gammeltoft 2006 ):
1. Technology-driven: acquisition of local cutting-edge technologies and monitor-ing of technology trends
2. Market-driven: incorporation of local consumer needs and product localization 3. Policy-driven: responding to local regulations, participation in local standardiza-
tion movements, and incentives for R&D 4. Production-driven: technology support for local production facilities 5. Cost-driven: utilization of local low-cost labor 6. Innovation-driven: acquisition of ideas for new products from local markets and
strengthening of global product development structure through optimal division of labor
To increase the understanding of each of these classifi cations, the following fi gure (Fig. 11.3 ) describes in greater detail the simple framework of HBA and HBE
HBA
HBE
Home Country
Research
Home Country
Development
Local Research Resources (personnel, universities, companies,
etc.)
Local Research
Local Development
cost-driven
tech-driven
innovation-driven
Local Markets
market-drivenpolicy-drivenproduction-driven
Fig. 11.3 Typology of overseas R&D activities
11.3 R&D Internationalization Theory

182
in Fig. 11.2 . The main point to note is the separation of “research” and “development,” which were treated together in Fig 11.2 .
Reviewing our previous explanation of “technology acquisition” (HBA) and “local development” (HBE) models, the former is primarily a “research” function, where activities in foreign research centers strengthen research capability in the home country. The latter shows primarily product localization by development teams using home country technology as a foundation.
However, in its simplifi cation of activities performed by various local R&D enti-ties, we can see that this framework overlooks several key points. Returning to Gammeltoft’s six classifi cations, we can view “technology-driven” as being more or less the same as “technology acquisition” (or HBA). The issue is with “local devel-opment” (or HBE), as the concept in reality contains various signifi cances. Of the six classifi cations, the closest is “market-driven.” However, “policy-driven” or “production- driven” can also be generally classifi ed as “local development,” or HBE, models. As for the “policy-driven” classifi cation, product localization requires compatibility with regulation, in addition to market needs. There are many stan-dards and regulations that must be met when localizing products, such as environ-mental regulations and safety standards for exhaust gasses in the automotive industry, safety standards for cosmetics and pharmaceuticals, and electronic stan-dards for electronic goods. If a product is shipped that does not meet these stan-dards, it may not only cause accidents, but if violations were to become known, it can also often lead to great loss such as reputational damage. In view of these risks, monitoring of regulations and research and examinations that comply with such standards are important functions of foreign R&D centers.
In addition, from the perspective of optimizing local production processes, the “production-driven” classifi cation is a development function for localization. A local development function for the “production-driven” model is particularly impor-tant for automakers. Creating supply chains that incorporate local parts manufactur-ers is important for local automobile production. Of course, it is possible to make vehicles via knock-down assembly by importing all critical parts from Japan. However, local content regulations may not allow for such methods, and further-more, increasing the share of locally procured parts is essential to reducing manu-facturing costs. When using locally manufactured parts, it is necessary to conduct inspections to ensure that parts conform to an automaker’s specifi cations. In emerg-ing nations like China or India, it can be diffi cult to fi nd parts that meet Japanese automaker’s standards, making it necessary to modify production processes to achieve the same fi nished vehicle standard using parts of somewhat lower quality. Therefore, local research and development is necessary to achieve production pro-cesses that match local circumstances.
“Cost-driven” and “innovation-driven” are patterns not covered by “technology acquisition” and “local development” R&D models. R&D for “cost-driven” models is done in emerging nations, the goal being to reduce costs. R&D is an advanced intellectual production activity, and until recently, conducting R&D in emerging nations has not really been considered. However, in countries with low-wage levels, such as China and India, the level of institutions of higher learning has risen,
11 International R&D Management

183
enabling quality engineers to be produced in greater numbers each year. The fi rst to observe this phenomenon were western and Japanese software fi rms, the results of which were successions of development centers being built in India and China. This has since spread to electronics design and development in the medical device and telecommunications industries. Further, note that the “cost-driven” approach has spread to the “research” arena, and not just in “development.” Microsoft’s research group created the Microsoft Research Asia organization in Beijing, which has hun-dreds of researchers working on leading-edge projects. IBM’s research division also has research facilities in Beijing, Delhi, and Bangalore, which play an important role in IBM’s global research and development. These corporations have created globally linked research organizations of the type advocated by Ghoshal and Bartlett ( 1990 ).
Finally, “innovation-driven” R&D activities are those that incorporate ideas from foreign markets into new product development processes. Many companies have global product development centralized in divisions at headquarters, with overseas R&D centers playing a supporting role. However, local innovations are obviously necessary for localized products. “Innovation-driven” activities are conducted in foreign development centers created with the expectation of new innovations, ideas, and concepts from local markets. Product development ideas from emerging nations being used for global products will surely become more common in the future.
11.3.3 Selecting a Destination Country
The fi nal point of our discussion on R&D internationalization is the question of which countries to expand into. In this stage, the characteristics of the countries in question are listed and the relative merits of each debated. Various cultural, admin-istrative, geographical, and economic characteristics following Ghemawat’s CAGE framework, outlined in Chap. 2 , can be listed. From the perspective of geographical locations for R&D centers, the administrative and economic characteristics are par-ticularly relevant. The administrative aspects may include preferential policies for R&D of foreign fi rms, or the environment for IP protection, whereas the level and costs of R&D personnel are examples of important economic factors. When select-ing locations for overseas R&D facilities, the following items and related issues can be considered as important economic factors (Chiesa 1995 ):
• Startup costs: wage levels of research and engineering staff, facilities costs. • Startup resource quality: quality of research and engineering staff • Organization costs: administrative fees for starting a new research center, costs
for creating internal organization infrastructure and hiring researcher • R&D infrastructure: networking services with local universities as in science
parks, investment incentives for research center startup
Many market-driven and production-driven R&D centers are co-located with existing local sales and production facilities. Because a company may already have
11.3 R&D Internationalization Theory

184
a certain level of activity within a country, the locations of R&D centers may be decided by creating them alongside production facilities that have been around for some time. However, when creating a new facility, it is important to survey the above factors and compare them against expectations of such facility in selecting ideal locations from a list of candidates.
Furthermore, to understand the quality of available research and technology staff, it is benefi cial to begin by acquainting with the state of each country’s science and technology industries. For example, when comparing India and China, China’s GDP is approximately three times that of India, and total R&D spending is more than six times. In addition, an examination of R&D spending by sector reveals that most spending in India is done by government-related research organizations and that the innovation abilities of private companies are quite low. On the other hand, R&D spending by private companies in China is growing. From this, we can glean that fi nding development resources among private companies in India who can be immediate assets is diffi cult, whereas the possibility of fi nding advanced technol-ogy in government research centers is high. In contrast, China has deep pools of quality research and development talent. China has a greater number of R&D per-sonnel than Japan and is an attractive target location for R&D centers. However, China has weak intellectual property institutions. Thus, when building an R&D center in China, companies must be stricter with their technical information. Note that these comparisons merely consider macrolevel R&D environments, and because both China and India are large countries, circumstances vary greatly by region. For example, universities and research organizations conducting advanced research have centered on Beijing, whereas corporate innovation is largely led by Shanghai and the surrounding Yangtze area, and Shenzhen in the Zhujiang area. Thus, it is important to closely observe the state of R&D infrastructure in each region and city.
11.4 Reverse Innovation
We now explain reverse innovation as a concept for the locally-for-global model that utilizes innovations from emerging nations in global products. This concept arose from a case study of a portable ultrasound device developed by the Chinese subsidiary of GE Healthcare (Immelt et al. 2009 ). GE Healthcare attempted to sell a device in China, for which it had a high market share in the US. However, because the price was too high, the company decided to develop a new low-cost product in its development center in China. The development center understood that Chinese hospitals needed low-cost products even though these products may somewhat lack precision in making diagnoses; therefore, they created a low-cost product built around a standard computer. This product was a major success. Thus, in our story, this was a local-for-local project, but GE Healthcare made the decision to sell this product in the US. The product swapped what had until that time been performed by hardware with software, making it small, light, and portable. It became a strong seller in the US, creating new demand for its use in ambulances and the personal-use
11 International R&D Management

185
market. These cases in which an emerging nation’s product is sold in a company’s home country are termed “reverse innovation.”
There are not many cases of reverse innovation occurring within advanced nations similar to GE Healthcare’s case. However, it is likely that cases with prod-ucts developed in one emerging nation such as China being sold in another emerg-ing nation like India will become more common. Figure 11.4 shows the results of a survey sent to the Japanese fi rms regarding sales destinations for products designed in emerging nations (Ministry of Economy, Trade, and Industry 2010 ). The compa-nies answering that products were sold only in the emerging nations in which they were developed dropped from 55.6 to 28.2 % in 5 years. This fi gure is predicted to be 9.3 % in another 5 years. On the other hand, 14.6 % of companies responded that they sold these products worldwide, and this number is predicted to rise to 35.2 % in another 5 years. This clearly shows a trend from local-for- local to local-for-global in product design within emerging nations.
However, there are many issues in seeing this trend come to fruition. In Reverse Innovation , Govindarajan states that a totally new management approach and a change in management vision that makes emerging nations its engine of growth are necessary for companies from advanced nations to succeed in emerging nations. This is because business environments in emerging nations are completely different than those in advanced nations (Govindarajan and Trimble 2012 ). With regard to national differences in the approach to global business, we have till now discussed Ghemawat’s CAGE distance framework and Khanna’s institutional voids. In cases where distances or voids are too great, a complete overhaul in management thinking becomes necessary. In GE Healthcare’s ultrasound device project, the company set a goal of delivering a project having 50 % of the performance at 15 % of the price. This shows the fundamental differences in needs between customers (in this case, hospitals) in the US and China. Reaching this goal was impossible without modifi -cations to current products, and therefore, the research center in China decided to start its own unique product development project.
56%
21%
6%
3%
10%
6%
28%
42%
7%
5%
15%
4%
9%
29%
8%
15%
35%
4%
0% 10% 20% 30% 40% 50% 60%
5 years ago
Today
5 years from now
Only country of origin
Several neighboring countries
All neighboring countries
All emerging nations, including neighbors
Worldwide
Other
Fig. 11.4 Sales destination of products designed in emerging nations ( Source : Ministry of Economy, Trade, and Industry 2010 )
11.4 Reverse Innovation

186
The GE Healthcare project started out as a local-for-local model with local development of a product for local use. If one scours through global companies, these types of projects, if small, can certainly be found. However, for a product to be rolled out globally, in which a company invests great resources, it requires a change of thought process at the management level. The top management must decide how far they will go to include emerging markets in its future corporate growth. In GE Healthcare’s case, Immelt, the company’s chairman at the time, had a project leader reporting directly to him, facilitating great accomplishments by breaking down barriers both inside and outside the company.
However, there are great risks in making large investments in new markets that have completely different business environments from those in advanced nations. In high-risk high-return investing, lowering the risk as much as possible is the key to management. In addition, it does not mean that all aspects of a project should be left to the local subsidiary just because a company has that local project based on a new idea. However, the risk on a project of this sort will be somewhat high, thereby requiring the commitment of top management. As can be observed from the GE Healthcare’s case, a company may wish to form a highly independent Local Growth Team (LGT) that reports directly to the top management. LGT leaders should be those from the headquarters who possess abundant business experience working in emerging nations. In addition, it is important to consider how heterogeneous ele-ments will be incorporated into the corporation as a whole. While the LGT monitors the progress of projects, it can be effective to place resources and organization as bridges between the home and emerging nations to bring in local ideas for new busi-nesses and share them across the company (Washburn and Hunsaker 2011 ). Typical Japanese fi rms have made decisions about corporate strategy with more homoge-neous personnel than western fi rms. To capture the emerging markets’ growth opportunities, these fi rms will need to incorporate more heterogeneity. This will be a great challenge for Japanese companies, but as global competition heats up, man-agements must face these challenges with gravity.
11.5 Conclusion
In this chapter, we discussed the globalization of R&D by fi rst uncovering the state of Japanese companies and its trends, and subsequently introducing theoretical aspects of R&D internationalization and the research results of Chinese R&D man-agement as case studies. The theoretical aspects include the following questions: (1) Should R&D be done overseas? (2) If so, what activities should be shifted overseas? (3) Which countries are appropriate for overseas R&D? For the fi rst two questions, it is appropriate to consider “research” and “development” separately. The purpose of research is to bring in advanced technology from overseas. Development has a variety of goals, which include the following:
• Technology-driven (incorporating advanced foreign technology) • Market-driven (incorporating local consumer needs and product localization)
11 International R&D Management

187
• Policy-driven (responses to local regulations, R&D incentives, and participation in local standardization activities)
• Production-driven (technical support for local production facilities) • Cost-driven (utilization of cheap local personnel) • Innovation-driven (acquisition of local ideas for new products, strengthening of
global product development structures through optimal division of labor)
The countries and regions that are targets for overseas R&D need to be consid-ered in conjunction with the above R&D activities, alongside institutional factors such as preferential policies for foreign R&D fi rms or intellectual property frame-works of the country and economic factors such as the level of local R&D personnel and costs.
Furthermore, we introduced the concept of reverse innovation, in which innova-tions from emerging nations are rolled out to global markets. Because of the vastly different business environments between emerging nations and a global company’s home nation, global companies often cannot respond by just improving products originally made for the home nation for local markets. In these cases, it is necessary to develop products with a completely new mindset using a team focused on the unique qualities of the local subsidiary. Commitments from the top management for these projects, and resources and organizations to bridge the gap between both countries are necessary to incorporate local innovations into corporate-wide activities.
Finally, we must comment on topics not raised in this chapter with regard to R&D internationalization. First, we need to address the question of how reporting lines in overseas facilities should be structured. As shown in this chapter, it is easier to discuss “research” and “development” separately. “Research” in overseas facili-ties is often a part of home country’s corporate research groups or R&D centers, whereas “development” is often performed within the division of each product line. However, there are recent movements to strengthen the connections between “research” and “development.” For example, many divisions outsource certain proj-ects to corporate research groups, and researchers that conducted basic research in the fi rm’s research center are transplanted to development groups to manage proj-ects for specifi c products and services. In these cases, the reporting lines of research centers and operating divisions in overseas research organizations can become entangled, creating the risk of decreased effi ciency. In these instances, companies must consider on a project-by-project basis whether the technology or region axis is more important and structure reporting accordingly. For example, for projects that have a common technology platform, it is effective to work under the home coun-try’s research group; for projects that involve regional business development, it is effective to work under the regional headquarter. Of course, both sides must share information, but matrix organizations with multiple reporting lines often do not work well.
In addition, as a practical matter for overseas R&D management, the manage-ment of technical information is important. The importance of this issue differs greatly between research and development groups. Research groups often conduct
11.5 Conclusion

188
basic research in a relatively open fashion, whereas development groups often han-dle details with high degree of confi dentiality, such as nonpublic, new products information, and project cost structures. Of course, measures such as increasing of building security and having nondisclosure agreements as part of employment con-tracts are critical, but overseas personnel are mobile, and the above measures may be of limited effect. In addition, companies with overseas production may fi nd it possible to treat technically critical parts as black boxes and export them from Japan or to not send all product design documents out of the country. However, in develop-ment, communication of critical technology with headquarters is fundamentally necessary. Thus, carefully setting the level of technical information and limiting access, or depending on projects, concentrating product development in headquar-ters and having local R&D centers focus on information gathering such as commu-nicating local needs and following up on regulatory changes are also possibilities.
In conclusion, we would like to promote open innovation at the local level. The global R&D activities of Japanese fi rms are often conducted with a centralized authoritarian style that revolves around the company’s headquarters. This style functions effectively when customizing global products for local markets, but has weak information fl ow from local markets back to the headquarters, which would include access to local technology and integration of local innovations. In partner-ships with local universities, the Japanese fi rms will conduct joint research with clear objectives, whereas the western fi rms tend to take a longer view of partner-ships, sponsoring broadly themed seminars, providing scholarships, and establish-ing endowed chairs. With markets opening up globally led by the emerging nations, there is a strong need for diversity in R&D perspectives and ideas. Companies will be required to grant a certain amount of autonomy to local R&D centers and utilize more open management styles that spread the seeds of innovation around the globe.
Open Access This chapter is distributed under the terms of the Creative Commons Attribution Noncommercial License, which permits any noncommercial use, distribution, and reproduction in any medium, provided the original author(s) and source are credited.
References
Asakawa, K. (2003). Global Keiei Nyuumon . Tokyo: Nikkei Publishing Ltd. (in Japanese). Chiesa, V. (1995). Globalizing R&D around centres of excellence. Long Range Planning, 28 (6),
19–28. Dunning, J. (1993). Multinational enterprise and the global economy . Wokingham:
Addison-Wesley. Gammeltoft, P. (2006). Internationalization of R&D: Trends, drivers and managerial challenges.
International Journal Technology and Globalization, 2 (2006), 177–199. Ghoshal, S., & Bartlett, C. (1990). The multinational enterprise as an interorganizational network.
Academy of Management Review, 15 (4), 603–625. Govindarajan, V., & Trimble, C. (2012). Reverse innovation: Creating far from home, win every-
where . Cambridge, MA: Harvard Business Review Press. Immelt, J. R., Govindarajan, V., & Trimble, C. (2009, September). How GE is disrupting itself.
Harvard Business Review, 87 , 3–10.
11 International R&D Management

189
Iwasa, T., & Odagiri, H. (2004). Overseas R&D, knowledge sourcing and patenting: An empirical study of Japanese R&D investment in the US. Research Policy, 33 , 807–828.
Kuemmerle, W. (1997). Building effective R&D capabilities abroad. Harvard Business Review, 75 , 61–70.
Ministry of Economy, Trade, and Industry. (2010, June). 2010 Monozukuri Hakusho. Tokyo: Ministry of Economy, Trade, and Industry; Ministry of Health, Labor, and Welfare; Ministry of Education, Culture, Sports, and Science.
Toyo Keizai Shinhousha. (2011). Kaigai Shinshutsu Kigyou Souran 2011. Tokyo: Toyokeizai Shinhousha.
Washburn, N. T., & Hunsaker, B. T. (2011, September). Finding great ideas in emerging nations. Harvard Business Review, 89 , 115–120.
References

191© The Author(s) 2015K. Motohashi, Global Business Strategy, Springer Texts in Business and Economics, DOI 10.1007/978-4-431-55468-4_12
12 Multinationals’ R&D in China and India
12.1 Introduction
When considering the R&D centers of Japanese fi rms by country, China is second to the US, and the number of R&D centers there is increasing. The importance of China as a center for R&D is not limited to just Japanese fi rms; western fi rms are also investing there. According to a UNCTAD survey, China is the most important country for R&D among companies in the advanced nations (UNCTAD 2005 ). IBM, Microsoft, Motorola, Nokia, Sony, Toshiba, Hitachi, Fujitsu, NEC, Samsung, and other leading high-tech companies have created research centers in China, from where global R&D is conducted.
According to a UNCTAD survey, India ranks just behind China and the United States as a top R&D center for multinationals (UNCTAD 2005 ). When comparing China and India, many companies are attracted to China’s market and cheap labor, while India’s strength lies in its high-quality R&D resources. In particular, India boasts the world’s largest offshore centers for software, and many multinational fi rms have established IT-related development offi ces there.
This chapter focuses on China and India as a host country of multinational’s R&D. As is described in Chap. 4 , there is a great difference in economic institutions between China and India, which infl uences on multinational’s R&D in these coun-tries. A substantial foreign direct investment in China was found from 1990s, with setting up factories by using cheap production cost. A large amount of infrastructure investments in China allows this place become to be a factory of the world. Therefore, R&D activities in this place is related to manufacturing industries. In contrast, due to poor physical infrastructure in India, multinational sees this place as an offshore site of software. In addition, outsourcing R&D services industries are developed in India.
The following sections provide some empirical fi ndings of multinationals’ R&D activities in China and India, respectively. The typology of overseas R&D in the previous chapter is used for the analysis, and detail statistical analysis and case

192
studies are provided for further understanding the issues in R&D activities in emerg-ing economies.
12.2 China
12.2.1 Overview
After the implementation of open market policies in the 1990s, China received robust investments from foreign fi rms, making it the “factory of the world.” In the 2000s, the Chinese government gradually deregulated foreign investments in fi nance, retail, and other service industries in accordance with the WTO rules, caus-ing investments in areas other than manufacturing to fl ourish. The Chinese economy has continued to grow at a high pace, and, as of 2011, it has overtook Japan as the second largest economy in the world. The per capita incomes have increased in conjunction with this economic growth, and China is also attracting the attention of companies worldwide as a “market of the world.”
As China developed to become the factory and market of the world, global fi rms from Japan and the West have set up R&D functions in their facilities in the country. Some centers are production-driven, supporting local production, whereas others are market- or policy-driven, responding to local market needs and various regula-tions. China has a greater number of scientists and engineers than Japan, as seen in the previous section. In addition, Chinese universities annually produce more than two million engineers, and companies are attracted to the high quality and relatively low wages of these resources. This is a market that is also attractive to the cost- driven R&D centers. Further, Beijing University, Tsinghua University, and other top-fl ight Chinese universities are conducting research that is internationally fi rst rate. The Zhongguancun district in Beijing’s northwest area, where these universi-ties are located, yielded many venture fi rms primarily in IT, giving it the moniker the “Silicon Valley of China.” Moreover, many high-tech fi rms such as IBM and Microsoft have their R&D centers there, with the research centers weighted toward technology-driven activities.
R&D conducted by foreign fi rms in China spans an extraordinarily broad range, and because of the vastness of the country, it is easy to imagine that R&D differs greatly by region. The differences in the R&D activities of Japanese fi rms in China from other western fi rms are also of great interest. Using Chinese statistics for sci-ence and technology, we examine the status of R&D conducted by foreign fi rms according to region and corporate nationality.
Figure 12.1 compares the ratio of R&D expenses to revenue (R&D concentra-tion) in manufacturing fi rms above a certain size in China by ownership structure. Foreign fi rms are differentiated between wholly owned subsidiaries and joint ven-tures with Chinese fi rms. R&D concentration is highest among Chinese fi rms, fol-lowed by joint ventures and wholly owned subsidiaries. Foreign fi rms base their R&D, whether created according to the “technology acquisition” or “local develop-ment” model, on R&D resources in the home country. The R&D necessary for
12 Multinationals’ R&D in China and India

193
business in China does not necessarily mean that all of it has to be done in China, so this conclusion is expected. Accordingly, when the R&D concentration including the home country is examined, note that Chinese fi rms do not necessarily have higher R&D concentration than foreign fi rms.
Among foreign fi rms, R&D concentration in joint ventures is higher than in wholly owned subsidiaries. Recently, in particular, the R&D concentration of joint ventures is approaching that of Chinese fi rms. On the other hand, the R&D concen-tration of wholly owned subsidiaries is trending upward, but remains less than half of that of joint venture fi rms. As we noted in Chap. 7 , forming a joint venture gener-ally reduces risks associated with entering a foreign country, whereas having a wholly owned subsidiary lowers risks, (namely, relationship with the joint-venture counterpart) once it has been established within that foreign country. In addition, while there may be a stronger tendency toward a center-for-global model, in which a wholly owned subsidiary follows the direction of the home country, joint ventures tend to follow a local-for-local model that is closely aligned with the local market.
We discuss in detail by observing R&D outsourcing levels by ownership struc-ture. Chinese science and technology statistics have conducted surveys regarding R&D expenditures not only within a corporation but also its external expenditures. External R&D costs can be divided into three expenditure types: (1) domestic uni-versities and research organizations, (2) domestic corporations, and (3) foreign countries. Figure 12.2 shows the percentage of external R&D costs against total
0.0%
0.2%
0.4%
0.6%
0.8%
1.0%
1.2%
1998
1999
2000
2001
2002
2003
2004
2005
2006
2007
2008
2009
2010
JV of foreign firm Wholly owned of foreign firm Taiwan, etc. JV
Taiwan, etc. Wholly owned sub Chinese firms
Fig. 12.1 Trend of R&D/Sales by ownership type ( Source : China Statistical Yearbook (over vari-ous years))
12.2 China

194
R&D costs by ownership structure. Most foreign fi rms’ R&D payments to foreign countries can be considered as technology license payments to the home country, indicating strong ties with the head offi ce. On the other hand, payments to domestic universities, research organizations, or corporations can be thought of as metrics, indicating ties to local R&D resources. The differences between the R&D activities of wholly owned subsidiaries and joint ventures are evident in this graph. Specifi cally, wholly owned subsidiaries have strong ties with the home country, whereas joint ventures have strong ties with local resources. Overseas outsourcing by Chinese corporations is not an internal transaction, but it is simply a manifestation of activi-ties to incorporate external R&D resources; thus, the percentage is low, with largest outsourcing to domestic universities or corporations.
We can summarize the discussion so far as follows. First, foreign fi rms conduct R&D in China on the basis of home country research resources; thus, the level of R&D concentration within local entities is lower than that for domestic fi rms. In addition, the level of R&D concentration within wholly owned subsidiaries is par-ticularly low, even among foreign fi rms. These levels have been trending upward recently, but they are still less than half of that of joint ventures. In contrast, the level of joint venture R&D concentration has risen to about the same level as domestic fi rms. When comparing the activities of wholly owned subsidiaries and joint ven-tures in greater detail by examining the state of external expenditures of R&D costs, we observe that wholly owned subsidiaries have strong ties with parent companies and are not suffi ciently capturing domestic R&D resources. On the other hand, joint ventures have some interaction with the home country, but incorporate local R&D resources through partnerships with domestic universities, research centers, and corporations. Moreover, we can observe a trend of R&D being conducted internally along with the use of local resources. Wholly owned subsidiaries delineate the func-tional division by using parent company technology, but primarily managing pro-duction and sales in Chinese facilities. As a result, the level of R&D concentration within Chinese facilities is low.
0% 2% 4% 6% 8%
JV of foreign firm
Wholly owned sub of foreign firm
Taiwan, etc. JV
Taiwan, etc. wholly owned sub
Chinese firms
Domestic Univ.
Domestic Comp.
Foreign
Fig. 12.2 External R&D expenditures/total R&D by ownership type ( Source : Figures compiled from China’s science and technology statistics)
12 Multinationals’ R&D in China and India

195
12.2.2 R&D Objectives and Regional Diversity
China is watched closely as both the factory and marketplace of the world. Accordingly, manufacturing support and local product development are placed high on the list of R&D objectives. In addition, “cost-driven” R&D are often carried out because of an abundance of engineers, and in high-tech concentrations areas such as Zhongguancun in Beijing, “technology-driven” R&D centers are being set up. We now examine which of these activities are primarily performed in which regions, as well as how conditions differ by region. We conducted a comparative analysis, cre-ating metrics for scientifi c technology activities to understand the primary purpose of R&D (Motohashi 2010 ):
1. R&D cost concentration: the ratio of R&D costs to revenues 2. Development-orientation: the ratio of development cost to R&D costs 3. Level of domestic university alliances: the ratio of external research expendi-
tures paid to domestic universities and public research organizations to total research costs
4. Level of home country ties: the ratio of external research expenditures paid to foreign countries to total research costs
5. Level of new product exports: the ratio of exports to revenues from new products
By comparing the metrics for foreign fi rms with those for equivalent Chinese fi rms (i.e., Chinese fi rms within the same industry of similar size), we ascertain the purpose of R&D activities within foreign fi rms. In addition, by comparing the situ-ation by regions, we can compare the differences in R&D objectives in each regions (we compare Beijing, Shanghai, and Guangdong herein). The results of our analysis are shown in Table 12.1 , where “+” means a high metric, and “−” a low metric. “0” simply means the metric was the same as the benchmark, which for this case were the Chinese corporations.
First, foreign fi rms show a general tendency toward low levels of R&D concen-tration, with a high share of development within their R&D. This shows that com-panies conduct R&D in China on the basis of technology in their home country, with somewhat greater emphasis on development. In addition, alliance levels with
Table 12.1 Comparison of R&D-related indices
Nationwide Beijing Shanghai Guandong
Concentration of R&D − − 0 −
Development orientation + 0 0 0
Dom. Univ. alliances − + 0 −
Home country connection + + 0 +
New prod. exports + + 0 0
Type of R&D Prod.-driven Tech.-driven Market/cost-driven Prod.-driven
12.2 China

196
universities are low, whereas the levels of ties with the home country are high. Finally, note that export levels of new products are high. On the basis of these pat-terns, we can say that these R&D models are “local development” rather than “tech-nology acquisition,” and that because of the high levels of exports, there is a strong tendency toward “production-driven” R&D. As a side note, if we assume that this pattern is a “market-driven” model, new products developed in China would be sold in the Chinese market, decreasing the level of exports. If companies followed a “cost-driven” model, the increase in the number of R&D personnel would require a higher level of R&D concentration. If companies followed a “policy-driven” model, products used in this analysis would be destined for domestic markets; however, the high levels of new product exports indicate that this model also does not fi t.
As shown, R&D activities for foreign fi rms in China generally support produc-tion facilities. We can predict that this differs on the basis of the region where their facilities are located. Next, we compare the metrics of the Beijing, Shanghai, and Guangdong regions.
First, foreign fi rms in Beijing have similar level of development ratio as the benchmark, but a relatively lower ratio compared with the country as a whole. Compared with an average foreign fi rm, companies in the area focus much more on research. In addition, Beijing has a high level of domestic university alliances. This shows that foreign fi rms conducting R&D in this region place a great deal of impor-tance on partnerships with Chinese universities such as Beijing University and Tsinghua University. Overall, foreign fi rms in Beijing have a relatively high level of “technology-driven” R&D.
In Shanghai, the level of R&D concentration was similar to that of our bench-mark and high compared with the average foreign fi rm, which has a low level of R&D concentration. Ties with the home country were also at the same level as our benchmark and lower than the average foreign fi rm, which has a high level. Further, the levels of new product exports were again the same as our benchmark, and lower than the average foreign fi rm, which is high. In other words, local subsidiaries showed comparably high level of independence from the home country and tended to provide fi nished goods to local markets, making their R&D activities weighted toward a local-for-local model. Accordingly, these activities were “market-driven” with “cost-driven” characteristics because of the relatively high level of R&D concentration.
The last region, Guangdong, contains cities such as Shenzhen and Dongguan in the Pearl River Delta that are the epicenters of the “factory of the world.” Thus, we can predict that R&D activities in this area will be skewed toward a “production- driven” model. The pattern of our metrics for this region is roughly the same as that for an average foreign fi rm but with several differences. The level of research orien-tation is the same as our benchmark, but relatively low compared with the average (which is high). The level of new product exports is also the same as our benchmark, and is relatively low compared with the average (which is high). The Pearl River Delta has workers with wage levels on the rise, and it has been diffi cult to maintain the low-cost production exporting model. Local governments in Shenzhen and else-where has been aiming to lure universities, other institutions of higher learning, and research facilities, and are making efforts to develop high value-added industries. In
12 Multinationals’ R&D in China and India

197
addition, Guangzhou, the capital of the Guangdong Province, has an agglomeration of automotive industry companies. The products manufactured here supply domes-tic markets, which is one factor impacting a stronger-than-average trend toward domestic markets in a research-driven pattern.
12.2.3 Differences Due to the Nationalities of Foreign Firm
Finally, we examine the differences in R&D center management because of the nationalities of foreign fi rms. China has gradually deregulated foreign capital regu-lations, and the percentage of foreign fi rms is increasing annually. Among those, Japanese fi rms have a relatively higher share of wholly owned companies than their counterparts in the US and Europe (Motohashi 2012 ). Moreover, as we look at the state of R&D outsourcing, Japanese fi rms have an overwhelmingly high percentage of expenditures compared with foreign countries (Fig. 12.3 ). Most of these expen-ditures are thought to be license payments for home-country technology, and there-fore, they are considered internal transactions. Global R&D management within the Japanese fi rms is strongly skewed toward a center-for-local model, where manage-ment of local facilities is centralized within the home country. On the other hand, the US fi rms have a high percentage of outsourcing expenditures to domestic uni-versities and research organizations, and have better access to and incorporation of local technology resources. The European fi rms lie somewhere in between the Japanese and US fi rms. Other Asian fi rms from Korea, Singapore, and elsewhere are much like those from Japan, where overseas facilities have strong ties with their home countries.
A high percentage of the local subsidiaries of Japanese fi rms are structured as wholly owned subsidiaries, and have a strong tendency to operate under centralized management by the home country. One reason for this is the geographical proximity of Japan and China. When the foreign country is nearby, it is relatively easy to
0% 2% 4% 6% 8%
Japan
US
Europe
Korea, etc.
Domestic Univ.
Domestic Comp.
Foreign
Fig. 12.3 External R&D expenditures/total R&D by home country ( Source : Figures compiled using China’s science and technology statistics)
12.2 China

198
manage the local subsidiary from the home country, providing an incentive to oper-ate in a center-for-local model that mortgages the independence of the wholly owned subsidiary’s management. On the other hand, the offi ces of European and US fi rms are geographically far from China, and the time and language differences cre-ate signifi cant barriers to close communication. In these situations, it can be more effective to give local subsidiaries more autonomy.
More so than their European and US counterparts, the Japanese corporations have a history of internationalizing corporate activities with a headquarters-driven central authoritarian style (Bartlett and Ghoshal 1989 ; see also Chap. 2 of this vol-ume). It is quite possible that the Japanese management of China-based R&D cen-ters refl ects this same central authoritarian style that governs its entire global businesses. By implementing a center-for-local model, R&D effi ciencies are gained by realizing linear innovation where products are manufactured for the Chinese market based on Japanese technology. However, it is weak on innovation through an interactive R&D model, where Chinese advance technologies and ideas for new products and product development are incorporated. From a global perspective, as the superiority of emerging nations increases, a locally-for-global model—the utili-zation of local innovation ideas for global R&D—will become more important in the future. Accordingly, it is important for the Japanese corporations to value the independence of their foreign subsidiaries and incorporate ideas from local innova-tions in the company as a whole.
12.3 India
12.3.1 Overview
The history of foreign fi rms in India is not long. The management of the economy after gaining independence from Britain in 1947 kept the country extremely inac-cessible. Until 1991, when new economic policies deregulated trade and direct investment, there was almost no activity by foreign fi rms. In the automotive indus-try, Suzuki Motors was the exception; it was allowed to enter the Indian market in the 1980s through a joint venture with an Indian company. In the 1990s, GM, Ford, DaimlerChrysler, and Hyundai entered the market. In the IT industry, the late 1990s saw the creation of offshore centers for software development. IBM formed a sales company through a joint venture with the Tata Group in 1991, and in 1999, the company formed IBM India as a wholly owned subsidiary, creating a structure under which subsidiaries for software development and offshoring could be placed. GE has conducted business in India since its time as a British colony, although the company’s activities gained momentum in the late 1990s. In 1997, GE established an offshore development center, and since the 2000s, it has further energized its business there with an eye to the Indian market.
The Indian government began incentivizing foreign fi rms in earnest in the 2000s. As India was a British colony, it had a deep-rooted wariness with regard to foreign capital, allowing only gradual deregulation. At the outset of the 1990s, China began
12 Multinationals’ R&D in China and India

199
bringing in foreign capital, and by 2000, it was experiencing an average annual economic growth of greater than 10 %. On the other hand, India’s economic growth was stagnant at about half that, 5.5 %. Thus, galvanized by the steadily growing economy of its neighboring country through external liberalization, India undertook large-scale reforms of direct investment in 2002, apart from in certain industries. Further deregulation occurred in 2005 in service industries such as telecommunica-tions, fi nancial services, and real estate. Special economic zones were established in 2005, in which foreign fi rms in many industries were allowed to create wholly owned subsidiaries and receive tax incentives. Since 2006, the average economic growth have been accelerated, and the country is expected to become an economic power in twenty-fi rst century. As a result, the activities of foreign fi rms have not been limited to offshore centers focused on global markets; they also focus on the Indian market itself.
Figure 12.4 shows the results of a survey—conducted in 2004 by the Economist—of 500 global executives on the most attractive countries in terms of globalization objectives (Economist Intelligence Unit 2004 ). India was deemed the most attrac-tive location for “new opportunities in outsourcing,” followed by for “access to a highly skilled labor force,” indicating that software resources in India are highly rated not only for their low cost but also for their quality. Overall, 24 % of the execu-tives listed R&D activities in India as being alongside those in Europe, the United States, and other advanced countries. From the perspective of foreign fi rms, India is highly attractive as an R&D destination. On the other hand, China is attractive for its low-cost labor and new customer markets, with only 11 % of executives listing R&D activities, less than half the percentage listed for India. This likely refl ects a
Fig. 12.4 Attractiveness of FDI destination by host country ( Source : Economist Intelligence Unit 2004 )
12.3 India

200
belief in India’s R&D capabilities in software and pharmaceuticals, fi elds in which India has competitive domestic companies.
R&D activities of foreign fi rms in India gathered steam in 2000. IBM is a typical example, creating the India Research Laboratory in 1998 as part of its global research facilities. In 2001, the company established the India Software Laboratory to conduct software-related R&D. In 2000, GE established the John F. Welch Technology Center (JFWTC) in Bangalore, with close to 4,000 researchers working on a variety of R&D activities. There are no formal statistics on R&D centers for foreign fi rms in India, although in 2010, the country had 471 companies with 649 research centers (Krishna et al. 2012 ).
Table 12.2 shows the total patents by company, according to the USPTO, regis-tered between 2006 and 2010 by inventors living in India (Basant and Mani 2012 ). IBM leads the way, followed by Texas Instruments, GE, and others. Of the 15 com-panies, four are IT or telecommunications companies, fi ve are semiconductor com-panies, three are software-related companies, and two are electronics-related companies—GE and Honeywell. The remaining company is Sabic Plastics (a chem-icals company based in Saudi Arabia). Many of the patents are software related. In addition, the companies are mostly from the United States, although European fi rms such as ST Microelectronics and SAP are also ranked. Japanese fi rms were slower to enter India than their European and US counterparts, with companies only recently creating research laboratories. For example, in 2010, the pharmaceutical manufacturer Eizai created a production process research center (Eizai Knowledge Center India) in the state of Andhra Pradesh. In 2011, Hitachi opened its Hitachi India R&D Center in Bangalore. However, as seen in greater detail below, some companies have in-house R&D capability, such as Suzuki Motors, which conducts
Table 12.2 Number of patent applications by fi rms (USPTO Patents)
1 IBM IT 250
2 Texas Instruments Semiconductor 211
3 GE Medical devices 193
4 ST Microelectronics Semiconductor 135
5 Honeywell Inc. Electronics 93
6 Intel Semiconductor 92
7 Cisco Telecom equipment 91
8 Symantic Software 91
9 Broadcom Semiconductor 60
10 Hewlett-Packard IT 57
11 Microsoft Software 49
12 Sun Microsystems(*) IT 43
13 Sabic Plastics Chemicals 39
14 Freescale Semiconductors Semiconductor 35
15 SAP Software 31
Source : Basant and Mani ( 2012 ) Note (*): Sun Microsystems was bought out by Oracle in 2010
12 Multinationals’ R&D in China and India

201
full-scale development of new cars in production facilities and not through indepen-dent R&D centers.
R&D activities of these companies in India are likely to be primarily cost driven. With Indian software engineers, companies can churn out software for product development at a global level. A high percentage of such activities are conducted in India. However, akin to IBM Research India, certain companies with research groups in India position the country as a center for knowledge creation at a global level rather than for mere offshore development activities. GE’s JFWTC employs about 4,000 staff, about 500 of which engage in research (Jin 2008 ). The research capabilities of universities and public research institutions are not particularly high; therefore, companies do not absorb cutting-edge technology in India. However, the activities of utilizing outstanding personnel to pursue India-originated research out-put are technology driven. Intel created the Intel India Development Center in Bangalore as an important CPU development center. The X86 Zeon microprocessor was developed in this center and was the fi rst six-core chip produced by the company.
Economic growth in India has raised citizens’ income levels and pushed market- driven R&D for the local market. Though diffi cult to ascertain from patent data, some car manufacturers are developing passenger cars for the local market. Along with Indian income levels, the number of passenger cars sold in India is rapidly ris-ing. In 2012, 2.77 million cars were sold, fourth highest in the world behind China, the United States, and Japan. However, 80 % of these are small cars costing between $5,000 and $10,000 and requiring lower costs in line with market needs. In India, Suzuki Motors is particularly strong in the small-car market, in which it has a 40 % share, and it has long developed passenger cars for the local market through its local entity.
This type of market-driven R&D is HBE, wherein the headquarters in the home country drives the localization of technology for the local market. However, as HBE progresses, “local for local” activities arise, wherein products are developed for the local market through local initiatives. GE Healthcare developed a portable ECG in JFWTC. Using ideas unique to India, it created a product that could be manufac-tured at one-third the cost of US products, and in a case of reverse innovation, it went on to sell the portable ECG in the US market. This was a case of innovation- driven R&D, wherein local ideas are turned into products that expand the knowl-edge base of headquarters in the home country. We discuss the cases of Suzuki Motors and GE Healthcare in greater detail below, as we explain the state of R&D activities in India.
12.3.2 Market-Driven R&D in Maruti Suzuki
Suzuki Motors entered the Indian market in 1982 through a joint venture with the nationalized car manufacturer Maruti Udyog Ltd. At the time, the Indian govern-ment did not allow domestic activities of foreign fi rms, and the joint venture was only realized at the behest of the Indian government. Suzuki Motors later increased
12.3 India
202
its share in the joint venture (Maruti Suzuki), and in 2003, turned it into a wholly owned subsidiary concurrently with its listing on the Indian Stock Exchange. According to the statistics by the Society of Indian Automobile Manufacturers (SIAM), Multi Suzuki produced 1.18 million cars in 2012, of which 120,000 were exported; the remaining 1.06 million were sold domestically. That year, 2.77 mil-lion cars were sold in India, giving Suzuki the highest market share in the country at 38 %.
Cars comprise thousands, even tens of thousands of parts, and there are as many parts manufacturers. Car manufacturers (assembly manufacturers) work directly with the largest of these, Tier 1 suppliers, which in turn are supplied by many Tier 2 or Tier 3 suppliers; this represents a hierarchical structure characteristic of the industry. Producing cars in India requires the construction of a supply chain with these parts manufacturers.
For example, Denso is a Tier 1 supplier of electronic control units, fuel pumps, and injectors. It imports critical parts from Japan and primarily engages in assembly in India. Although it has some local procurement of resin and die cast parts, Tier 2 suppliers in India are not mature, and Japanese Tier 2 suppliers are mostly small- and medium-sized companies that have yet to enter the Indian market. “Cutting costs requires us to increase our local procurement, which is an important initiative for us, and the automakers are cooperative. We cannot decrease our quality, but we need to change our way of thinking by, for example, getting rid of some functional-ity to meet Indian market specifi cations” (from 2011 interview with Denso India executives).
The development of low-cost cars meeting Indian specifi cations is achieved jointly by car manufacturers such as Suzuki Motors and parts manufacturers such as Denso. For Denso to increase its procurement from local Tier 2 suppliers, they must collaborate with Suzuki Motors on the functionality standards that must be met by end products. This type of collaboration furthers localization of production pro-cesses for Suzuki Motors and enables greater cost competitiveness for its products.
In addition, Maruti Suzuki continued developing an infrastructure to develop small cars in India. Until then, when the company introduced new models to the Indian market, it created local models based on those already developed and mass produced in Japan. However, the introduction of the Swift in 2005 transformed that modus operandi, with cars of the same quality and specifi cation simultaneously produced in Japan, Hungary, India, and China. This policy further advanced in 2009, with the release of the A-Star. This car is a global model, produced in India, and it is not only sold in India but also exported to Europe. By periodically conduct-ing exchanges among the engineers, Maruti Suzuki and Suzuki Motors in Japan continue to develop the infrastructure in India. There are three stages in local design. The fi rst is designing the front and rear body, specifi cally the shape of the lights and front grill. Maruti Suzuki has already reached this level. The second stage is design-ing the entire body, and the fi nal stage is developing the entire car, including the platform. According to Maruti Suzuki staff, it “would like to be at stage two in a few years” (from a 2009 interview with Maruti Suzuki executives).
12 Multinationals’ R&D in China and India

203
12.3.3 Reverse Innovation at GE Healthcare
The John F. Welch Technical Center, or JFWTC, is GE’s research laboratory in India. It employs 4,000 researchers and engineers and is one of the company’s larg-est research centers. Of the total employees, about 300 engineers develop products for GE Healthcare. Below, as an example of innovation-driven R&D, we explain the concept of reverse innovation by examining the portable ECG developed at the JFWTC (Immelt et al. 2009 ; Govindarajan and Trimble 2012 ).
GE Healthcare held a high share of the global ECG market, although at prices between $3,000 and $10,000, the products were too expensive to be accepted in the Indian market. In addition, as patients in India were dispersed in areas not easily accessible by faster means of transportation, portability was critical. Furthermore, as certain locations did not have electric power, battery capabilities were necessary. GE Healthcare understood that existing products did not meet these market needs, and in response to these needs and to signifi cantly reduce costs, it formed a new product development team at the JFWTC. In 2007, this team introduced the MAC400, an $800 portable ECG, into the market. Existing products had a digital signal processor (DSP), keyboard, and printer, which were all high-quality compo-nents that needed to be specially ordered. In contrast, the MAC400 used standard, low-cost components to drastically reduce costs. Moreover, the product was light-weight and battery operated, thus making it popular in India. GE continued to fur-ther improve the product, and it is now sold in 60 countries, including the United States, as an entirely new product category. This example from GE Healthcare is one of reverse innovation, wherein a product created through the initiative of a for-eign R&D center spurs innovation both globally and in the home country.
GE is a rare example of reverse innovation achieved by companies from advanced countries. However, we will likely see more instances of products from emerging countries spreading to other emerging countries, such as a product developed in India being sold in China. A 2009 survey by the Ministry of Economy, Trade and Industry (METI) noted that the percentage of companies responding affi rmatively to whether locally developed products will be supplied solely to the relevant country decreased from 55.6 % 5 years ago to the current 28.2 %. In addition, this number is predicted to further decrease to 9.3 % in the next 5 years. Conversely, companies responding that they would supply locally developed products to the entire world remained at 14.6 %; however, this number is predicted to increase to 35.2 % in the next 5 years (Ministry of Economy and Trade and Industry METI 2010 ). Thus, the tendency is clear—products designed in emerging countries are developed not only for local markets but also for global markets.
However, many issues remain that before this can be achieved. Govindarajan and Timble ( 2012 ) noted that to be successful in an emerging country, companies from advanced countries must adopt a completely new approach to management. In addi-tion, management must modify its views such that emerging countries can be posi-tioned as core growth engines for the company. This is because business environments in emerging countries can completely differ from those in advanced countries. In
12.3 India

204
GE Healthcare’s ECG project, the company aimed to provide a product with 50 % of the performance of existing products but at 15 % of the price. This goal could not be achieved by merely improving existing products; therefore, the company initi-ated a project to develop a new unique product in its Indian research laboratory.
Originally, GE Healthcare’s case was a local development project for a local market. Similar projects, although on a small scale, are likely to be found among global companies. However, for a product to be sold at a global level, and for a project to attract investment of major resources, a management’s views must undergo transformation. Senior management must decide whether it will concen-trate serious efforts in emerging markets for the company’s future growth. In the case of GE Healthcare, Immelt, the company’s chairman, appointed a project leader who reported directly to him, which helped overcome various internal and external obstacles and generated signifi cant results.
However, great risks are involved in making huge investments in a new region, where the business environment differs greatly from that in advanced countries. A management concern is the extent to which risk can be reduced in a high-risk/high- return investment. Simply because a project is based in local markets and features new concepts does not imply that it should be managed entirely by the local subsid-iary. Accordingly, companies can form local growth teams (LGT) that are highly independent yet still report to senior management, as in the case of GE Healthcare. It can be effective to appoint personnel or organizations to serve as bridges between the home country and an emerging country in order to monitor an LGT’s progress as well as simultaneously take locally generated ideas for new businesses and share them with the entire company (Washburn and Hunsaker 2011 ).
12.3.4 Organizational Management of Local R&D Centers
As is described in Chap. 11 , there are four types of global R&D organizations (Ghoshal and Bartlett 1990 ).
1. Center for global: the home country takes the lead in conducting R&D for global markets.
2. Local for local: foreign research laboratories act independently in responding to local market needs.
3. Local for global: R&D for global markets is conducted in foreign research laboratories.
4. Globally linked: multiple research laboratories in various countries collaborate in a network structure to work on a single project.
Determining the ideal type depends on the specifi cs of a project and company policy. In companies that primarily use pattern (1), the role of foreign research facil-ities is minimal. This pattern may be effective for discovering and capturing cutting- edge technology, but it does not require a large-scale center. This is a centralized R&D management method wherein foreign research facilities work under the
12 Multinationals’ R&D in China and India

205
direction of the home country. Patterns (2) and (3) can be classifi ed as decentralized management styles and require R&D centers of a scale that allows for some auton-omy. For (2), R&D centers typically work as part of a larger organization in a par-ticular region, and among foreign R&D centers, these are the most independent from the mother country. On the other hand, in (3), foreign centers often act under the control of the mother country in targeting global markets. Finally, in (4), com-panies have global R&D centers, each with a particular role in pursuing corporate- wide projects. This pattern leads to classifi cations that go beyond “centralized” or “decentralized.”
There are tremendous risks in the globalization of R&D. Decrease in corporate- wide R&D effi ciency due to failed management of foreign R&D facilities can shake the overall competitiveness of a company. Accordingly, foreign R&D centers are often created on a small scale and controlled by headquarters and then gradually made larger. Thus, the positioning of the local entity generally progresses sequen-tially from patterns (1) to (4). In other words, companies do not abruptly start with a local for local or “local for global” local entity, both of which leave much to the discretion of the local entity. It is more realistic for the R&D division at headquar-ters to take the lead in creating the local entity and then gradually increase its auton-omy (Motohashi 2012 ).
Figure 12.5 graphically shows this evolutionary process for foreign research laboratories. The vertical axis shows the level of the competency creation mission
Fig. 12.5 Evolutionary model of overseas R&D activities
12.3 India
206
for the local entity, and the horizontal axis shows whether the target market is local or global. The competency creation mission shows the importance of a local entity for a multinational fi rm in its knowledge creation activities at a global level (Cantwell and Mudambi 2005 ). The progression from (1) to (4) can be shown as a shift from local R&D subsidiaries to local R&D centers and fi nally to centers of excellence (COE). In this process, a company fi rst increases its competency creation mission in accordance with specifi c local circumstances, and when the capabilities of the local entity have grown suffi ciently, the company positions the local entity as part of the global R&D organization.
As seen in Sec. 12.3.1 , a characteristic of R&D organizations in India is the emphasis on their position as offshore development centers for the global market. Ghoshal and Bartlett’s ( 1990 ) classifi cations noted above were created when the internationalization of R&D activities was being implemented among advanced countries and cost-driven offshore development was not considered as an option. These offshore development centers play their part in the R&D process locally under the direction of headquarters, making their competency creation mission low, although their target market is global (the bottom-right portion of Fig. 12.5 ). However, as already seen, R&D center activities for foreign fi rms in India are not limited to offshore development. IBM and Microsoft’s Indian research laboratories play important roles in the companies’ global research networks. In addition, the Intel India Development Center develops cutting-edge CPUs. These research facili-ties are given a high competency creation mission and are placed in the Center of Excellence quadrant. In other words, R&D centers in India can progress from being offshore sites to COEs.
Naturally, not all foreign R&D centers follow the path to becoming COEs, and it is not realistic for even multinational fi rms to have COEs throughout the world. The level of a competency creation mission is determined by the global strategy of the multinational fi rm and the economic environment of the country in question (Cantwell and Mudambi 2005 ). India is blessed with an R&D environment charac-terized by many outstanding software engineers; this facilitates the progression of its research facilities from being offshore sites to COEs. In addition, economic growth accelerated in the country from 2000 onward, making its market attractive.
As a result, progression from local R&D sites to local R&D centers can be observed, as in the case of Suzuki Motors, and GE’s JFWTC can be regarded as having evolved from a local R&D center to a COE. Increasing the competency cre-ation mission of foreign R&D centers in India is essential to winning both the local and global competitions for innovation, due to its growing importance of both sup-ply and demand sides of R&D. Both Suzuki Motors and GE Healthcare have invested in India for long time, but the levels of local R&D centers, classifi ed in Fig. 12.4 , are different. While GE’s R&D center can be illustrated as an example of reverse innovation, Multi Suzuki’s activity is still in the process of local R&D sub-sidiary to local R&D centers. Since new product development in automotive indus-try requires much more coordination of activities within and between fi rms, it takes more time to reach the stage of “center of excellence” than the case of health care products. However, more autonomy to facilitate local innovation is imperative, even
12 Multinationals’ R&D in China and India

207
for automotive industry, in order to capture the opportunity associated with growing presence of emerging economies in global business.
To achieve this, multinational fi rms must accelerate the evolution of foreign research laboratories as indicated on both axes in Fig. 12.5 . To increase the compe-tency creation mission of local entities, companies must recruit outstanding person-nel in the local entity and improve the quality of R&D activities. At the same time, companies must decentralize authority and increase the autonomy of local entities. Outputs from R&D activities are often uncertain, and the creativity of each researcher is essential (Kim et al. 2003 ). Accordingly, problems arise when head-quarters exerts overwhelming control: researcher incentive is damaged and local knowledge cannot be fully leveraged. However, delegating authority to local entities can divert their activities from the company-wide mission. As seen on a global corporate- wide level, there is a danger that resources will not be used effectively (Acemoglu et al. 2007 ). Thus, training local managers and rotating researchers between the local entities and headquarters are important countermeasures (Brickey et al. 2001 ). In addition, rather than formal mechanisms such as regulations and compensation schemes, companies will fi nd it effective to work on social controls via close communication between headquarters and local entities as well as by shar-ing the corporate culture (van Ecker et al. 2013 ).
12.4 Conclusion
As an overall trend gathered from the results of our analysis of R&D of foreign fi rms in China, we found that a “production-driven” model predominated. However, the Beijing region has a strong element of research and technology acquisition activities, whereas Shanghai, with its local markets, has predominantly “market- driven” activities. Thus, R&D objectives vary according to regional environments. In addition, we noted characteristics of R&D on the basis of the nationality of a company, with the Japanese fi rms being weighted toward “production-driven” activities and a centralized authoritarian style of management led by company headquarters.
As for India, thanks to an abundance of quality research personnel, there is sig-nifi cant offshore development by US fi rms, particularly in the fi eld of software. Moreover, companies such as IBM, Intel, and GE conduct cutting-edge R&D in India. The economic growth and increasing income levels in India have made the Indian market attractive, and local R&D activities have been on the rise, particularly in the automotive market. Thus, India has world-class potential both as a global R&D center targeting global markets and as a regional R&D hub for its local market and markets in emerging countries.
For multinational fi rms, realizing the high potential for innovation in China and India requires increasing the competency creation mission of local R&D centers. In doing so, companies must attract outstanding personnel to their local entities and provide a high level of autonomy by loosening the control from headquarters. However, in a corporate-wide innovation strategy, making the activities of local
12.4 Conclusion

208
entities effective will require the engendering of unity through social controls such as international personnel rotation and training, close communication, and perme-ation of the corporate culture.
However, economic and social environments in China and India greatly differ from those in Japan, the United States, and Europe. Although companies headquar-tered in advanced countries may attempt to instill their corporate culture in these host countries, this is easier said than done. Accordingly, companies must create a management system in local entities with a high degree of transparency, using clear and formal rules and incentive systems. In addition, for the results of local R&D activities to be used as company-wide knowledge at a global level, companies must create a knowledge management system. Moreover, local R&D centers must assume the role of partners that link Indian universities and public research institutions. Here, too, harvesting local knowledge and technology into corporate-wide compe-tency is critical. To share local intelligence throughout the company without stifl ing it, companies must adopt a fl exible company-wide approach that accepts diversity.
Open Access This chapter is distributed under the terms of the Creative Commons Attribution Noncommercial License, which permits any noncommercial use, distribution, and reproduction in any medium, provided the original author(s) and source are credited.
References
Acemoglu, D., Aghion, P., Lelarge, C., van Reenen, J., & Zilibotti, F. (2007). Technology, informa-tion and decentralization of the fi rm. Quarterly Journal of Economics, 122 , 1759–1799.
Bartlett, A. C., & Ghoshal, S. (1989). Managing across borders: The transnational solutions . Boston: Harvard Business Press.
Basant, R., & Mani, S. (2012, January). Foreign R&D centres in India: An analysis of their size, structure and implications (Working Paper No. 2012-01-06). Ahmedabad: Indian Institute of Management Ahmedabad.
Brickey, J. A., Smith, C. A., & Zimmerman, H. L. (Eds.). (2001). Managerial economics and organizational architecture (2nd ed.). Boston: McGraw-Hill.
Cantwell, J., & Mudambi, R. (2005). NME competence creating subsidiary mandates. Strategic Management Journal, 26 , 1109–1128.
Economist Intelligence Unit. (2004). Economic intelligence survey: The economist world invest-ment, prospect 2004 . London: Economist Intelligence Unit.
Ghoshal, S., & Bartlett, C. (1990). The multinational enterprise as an interorganizational network. Academy of Management Review, 15 (4), 603–625.
Govindarajan, V., & Trimble, C. (2012). Reverse innovation: Creating far from home, win every-where . Cambridge, MA: Harvard Business Review Press.
Immelt, J. R., Govindarajan, V., & Trimble, C. (2009, September). How GE is disrupting itself. Harvard Business Review, 87 , 3–10.
Jin, Z. (2008, October). R&D strategy in India (Research Report No. 325). Fujitsu Research Institute, Tokyo (in Japanese).
Kim, K., Park, J.-H., & Prescott, J. E. (2003). The global integration of business functions: A study multinational businesses in integrated global industries. Journal of International Business Studies, 34 , 327–344.
12 Multinationals’ R&D in China and India

209
Krishna, V. V., Patra, S. K., & Bhattacharya, S. (2012). Internationalisation of R&D and global nature of innovation: Emerging trends in India. Science Technology & Society, 17 (2), 165–199.
Ministry of Economy, Trade and Industry (METI). (2010). Monozukuri White Paper 2010 , jointly compiled with Ministry Education, Science and Technology and Ministry of Health and Labor, The Japanese Government (in Japanese).
Motohashi, K. (2010). R&D activities of manufacturing multinationals in China: Structure, moti-vations and regional differences. China & World Economy, 18 (6), 56–72.
Motohashi, K. (2012). Managing competency creating R&D subsidiaries: Evidence from Japanese multinationals (TCER Working Paper Series, Working Paper E-48, 2012/06).
UNCTAD. (2005, December). UNCTAD Survey on the internationalization of R&D: Current pat-terns and prospect on the internationalization of R&D . Geneva: UNCTAD.
van Ecker, B., Triest, S., & Williams, C. (2013). Management control and the decentralization of R&D. Journal of Management, 9 (4), 906–927.
Washburn, N. T., & Hunsaker, B. T. (2011, September). Finding great ideas in emerging markets. Harvard Business Review, 89 , 115–120.
References

211© The Author(s) 2015K. Motohashi, Global Business Strategy, Springer Texts in Business and Economics, DOI 10.1007/978-4-431-55468-4_13
13 Thailand’s National Science and Technology Development Agency and Japanese Firms
13.1 Introduction
As the rate of market growth in advanced nations is tapering off, emerging nations are showing great growth potential, with markets expanding alongside increasing income levels of the people of these countries. As such, emerging nations are increasingly becoming attractive as locations for R&D centers to capture their growing markets. Emerging nations themselves are incentivized to attract corporate R&D from advanced nations. These centers make possible the development of highly skilled workers, and are expected to improve the technical abilities of related fi rms.
There are various reasons fi rms conduct R&D overseas: (1) taking advantage of research resources not available in their home country, (2) carrying out development to localize products and services, and (3) conforming, from a technical aspect, to necessary local laws such as safety regulations. The aspect they share in common is their need for access to local research resources (such as personnel and technolo-gies), consequently making the selection of local partners vital.
In this chapter, we explore Thailand’s National Science and Technology Development Agency (NSTDA), and the possibilities this agency provides to Japanese corporations as an R&D partner. The history of Japanese companies in Thailand is long. Economic ties between the two countries are strong, with more than 1,500 subsidiaries of Japanese companies in Thailand, putting the country third behind China and the US.
With AFTA (ASEAN Free Trade Agreement), industries are continuing to con-solidate on a regional basis within the ASEAN countries. Thailand has an auto industry agglomeration, with most local productions being conducted by the Japanese subsidiaries. The Japanese companies are represented in a wide array of industries in Thailand, from manufacturing sectors such as electronics and food products to retail and restaurants sectors. Yet R&D activities are still limited to only a few of these fi rms. In this case study, we explore whether fi rms should

212
aggressively pursue R&D activities in Thailand and whether the NSTDA is a suitable partner in such a pursuit.
13.2 Thailand as a Business Destination
As a result of stronger yen stemming from the 1985 Plaza Accord, the Japanese companies built in succession manufacturing bases throughout Southeast Asian nations. Among these nations, Thailand enjoyed robust foreign investments, with companies in electronics and transportation sectors moving into the country. While the amount of investments temporarily shrunk in 1997 because of the Asian cur-rency crisis, investment has been growing since 2000. Some of the major Japanese fi rms operating in Thailand are motorcycle and automobile manufacturers and elec-tronics manufacturers of products such as hard disks and electronic components. In addition, companies representing a wide variety of sectors from food products and distribution to daily necessities have expanded into Thailand, making it third after China and the US in the number of Japanese subsidiaries. Likewise for Thailand, Japan is an important source of direct investment, and the two economies are closely linked.
One of the reasons for this strong investment is the impact of Thailand’s Board of Investment (BOI), which manages the country’s investment regulations and has aggressively pursued a policy of introducing foreign investments into the country. For example, in the automotive industry, which is considered a key industry in the country, BOI allowed foreign automakers to enter the market beginning in the 1970s and concurrently rolled out import substitution policies for automotive parts to nur-ture domestic industry. As a result, many foreign parts suppliers built operations in Thailand, simultaneously leading to the creation of supporting industries, including domestic suppliers. In the 1990s, Thailand created incentives for foreign fi rms to promote auto exports. Although auto production volume dropped in Thailand in 1997 because of the Asian economic crisis, the auto industry, as the country’s key industry, has steadily grown since 2000 because of policies aimed at aggressively attracting foreign capital (Ueda 2007 ). In contrast, Malaysia’s policy since the 1980s has been to protect and develop its state-owned automaker, Proton, imple-menting strict regulations for foreign automakers. As a result, domestic automotive manufacturing base never suffi ciently formed, limiting production volume at less than half of that of Thailand.
In 2007, the Thai government embarked on investment and tax incentives for “green” cars, which set out corporate and other tax exemptions for a set volume production of fuel-effi cient compact cars. Many foreign fi rms led by the Japanese took advantage of this offer. Moreover, with cooperation from the Japanese govern-ment, the Thai-Nichi Institute of Technology opened its doors in 2007 to educate automotive manufacturing workers. Accordingly, the Thai government proclaimed its “Detroit of Asia” concept, steadily fi rming up its position as an automotive man-ufacturing base within the ASEAN countries.
Some view Thailand’s unstable domestic political situation as problematic. A military coup overthrew the Thaksin regime in 2006, and Thailand continues to be
13 Thailand’s National Science and Technology Development Agency…

213
politically unstable. In April and May of 2010, the supporters of the Thaksin regime occupied central Bangkok in response to the anti-Thaksin Aphisit regime. The cur-rent government drafted concessions including an early general election, but the Thaksin supporters opposed. The situation was settled by forced removal of the protesters. In July 2011, the Puea Thai party (aligned with Thaksin) led by Thaksin’s sister, Yingluck, emerged victorious in elections, with Yingluck becoming the Prime Minister of the Thai government. Yet political instability continues, which includes the granting of an amnesty for Thaksin himself.
The Thai government’s political parties were originally formed through politi-cians’ personal connections, and overall, the government is built on an extremely precarious foundation. However, many of the actual policy proposals are left to the bureaucrats, enabling basic economic policies to remain relatively unaffected by changes in government. For example, policies to attract foreign fi rms in the auto industry have been proposed since Thaksin’s regime, and the anti-Thaksin govern-ment that followed maintained along those same lines. Thus, while the domestic political situation is unstable, some view that it has no great impact on foreign fi rms’ investment risks.
13.3 Thailand’s Science and Technology Policy and a NSTSDA Overview
Science and technology policies in Thailand are founded on the “2004–2013 National Science & Technology Strategy Plan.” Until the 1990s, the Thai govern-ment promoted policies for economic growth revolving around a manufacturing industry based on natural resources and cheap labor. However, lower economic growth brought on by the Asian economic crisis as well as higher competition from nearby ASEAN countries caused a change in policy that recognized the need for higher value-added industry through innovation to achieve lasting growth. According to the Strategy Plan, the following four points are critical to the formation of a “knowledge-based economy and society”:
• Creation of a national innovation system and industrial clusters: organic partner-ships with universities, public research institutions, and industry
• Human resource development • Improving the technology capabilities in four main areas: (1) information tech-
nology, (2) materials technology, (3) biotechnology, and (4) nanotechnology • Creation of a development-oriented environment: laws and economic institutions
that promote organic partnerships for innovation systems and the fostering of social values
The overall characteristics of the plan were twofold: (1) science and technology policy focusing on the demand side with innovation and industry, unlike the former supply side approach focusing on academic fi ndings, and (2) setting forth national innovation system principles and organic partnerships between industry, academia, and government (JST R&D Strategy Center 2008 ).
13.3 Thailand’s Science and Technology Policy and a NSTSDA Overview
214
The National Science and Technology Development Agency is a national research institution managed by Thailand’s Ministry of Science and Technology, and plays an important role in national science and technology strategy. The NSTDA was organized through the 1991 Science and Technology Development Act, and comprises four technology centers—BIOTEC, which is responsible for life-science- related research; MTCE, which is responsible for materials-related research; NECTEC, which is responsible for IT-related research; and NANOTEC, which is responsible for nanotech-related research—and a Technology Management Center, or TMC, which is responsible for technology transfers. As of 2008, the Agency had 2,400 employees and a budget of 3.6 billion baht, making it Thailand’s largest pub-lic research organization. It formed a science park in northern Bangkok, with higher educational institutions like Thammasat University and the Asian Institute of Technology nearby. The NSTDA is also charged with managing and operating this science park.
As a public research organization the NSTDA not only conducts its own research, but is also distinctive in that it aims to improve technology levels of domestic fi rms through technology transfers and technical guidance to the private sector. Thailand’s private fi rms have historically had low research and development capabilities, and thus, much of the research typically performed by corporations in advanced nations is conducted by the NSTDA. The Agency has also installed expensive testing and research facilities for joint use amongst the private fi rms. In addition to local fi rms, the Japanese companies and other foreign fi rms benefi t from these facilities.
One of the merits of NSTDA as a joint research partner is the Agency’s quality of personnel. Approximately 400 personnel with doctorate degrees belong to the organization, and many researchers from Thailand’s leading universities participate in the NSTDA activities, in effect creating a top-notch science and technology pool in the country. The NSTDA also functions as a funding agency to provide research funds to universities and other research organizations and, in doing so, has created a database of domestic researchers, serving as an information source about research workers in Thailand.
Next, there is tremendous value in using both tangible and intangible NSTDA research assets, ranging from a variety of testing equipment to databases on biologi-cal resources. MTEC has equipment for component analysis of auto parts, which it provides as a part of a testing service for Japanese and other automakers. For manu-facturers without R&D centers in Thailand, this enables them to use NSTDA testing equipment to analyze defects locally. Likewise, BIOTEC has a database of Thailand’s biological resources and is working on joint researches with fi rms like Shiseido and Novartis, using this as a foundation for research.
Finally, the NSTDA is located in the North Bangkok Science Park (NBSP), and thus receives the highest level of investment incentive privileges from the BOI. Investment incentives for foreign fi rms are categorized by region, and the incen-tives typically increase with distance from the capital. However, even though the NBSP is located in a convenient location less than an hour drive from Bangkok, being inside the science park grants the companies with high-level privileges such as 8-year corporate tax exemptions and halving of corporate taxes for 5 years thereafter.
13 Thailand’s National Science and Technology Development Agency…

215
The NTSDA not only works in close conjunction with regional economies for researches such as developments of aquaculture technology for black tiger shrimp and multipurpose trucks for agriculture, but also conducts cutting-edge researches including metagenomic analysis of micro-organisms (genome sequencing methods for preparing genomic DNA directly from microbial populations to perform genetic analysis on bacteria that are diffi cult to incubate, such as bacteria in mushrooms). The technology resulting from this research is transferred to private enterprises via the TMC. Below are some of the main technology transfer activities of the NSTDA:
Industrial Technology Assistance Program (ITAP): assistance programs designed to improve shop-fl oor processes and product development capabilities of small- and medium-sized businesses
Company Directed Research and Development Program (CDRDEP): low-interest fi nancing for R&D leading to commercialization
NSTDA Investment Center (NIC): an investment organization supporting technol-ogy ventures
Intellectual Property Services (IPS): a section of the NTSDA that manages agency IP and provides licensing services
Thai Science Park (TSP): management and operation of incubation centers for tech-nology venture fi rms
13.4 NSTDA and R&D Activities of Japanese Firms in Thailand
Thailand has many Japanese fi rms conducting R&D in products such as automobile, chemical, food products, and daily necessities. Among these, automakers are par-ticularly active. Most Japanese automakers such as Toyota, Honda, and Nissan have built R&D centers in Thailand and develop vehicles for the local market. Along with the local R&D of automakers, Denso and other large parts suppliers have also outfi t-ted development structures in Thailand.
In this chapter, we describe the state of partnerships with the NSTDA using the cases of Shiseido and Polyplastics Co., Ltd., both of which conduct joint R&D with the agency.
13.4.1 Shiseido Thailand
Shiseido has created a Southeast Asian research center within its local subsidiary, Shiseido Thailand, where research is conducted for the application of natural resources such as herbs found in Southeast Asia. An issue arose when an Indonesian NGO, critical of Shiseido’s patent applications to use Indonesian organic plants in cosmetics, publicized the case in local newspapers. While Shiseido was in no way in confl ict with the patent laws, as a result of this publicity, the situation developed
13.4 NSTDA and R&D Activities of Japanese Firms in Thailand

216
into a movement to boycott Shiseido products. As a result, Shiseido relinquished all patents relating to Indonesian plants, working to placate the issue. Around the same time, other Japanese cosmetics and pharmaceutical makers in Thailand were harmed by similar rumors from NGOs, which led to product boycotts. Events like these indicated that when an advanced nation conducts R&D activities on natural resources in resource-rich regions such as Southeast Asia, risks abound by the spreading of rumors even if the companies’ procedures are all lawful. One reason Shiseido elected to begin a partnership with the NSTDA is to be better able to respond to risks of this sort. It deemed it paramount to avoid these risks by showing that in developing raw materials for cosmetics based on Thailand’s natural resources, it would conduct joint research with a local public research organization, and jointly apply for patents, enabling the country with the natural resources to make use of the patents; moreover, Shiseido would share the appropriate profi ts that were earned through the products based on such research.
In 2005, Shiseido was moving ahead with plans to build R&D centers around the world as part of its global R&D strategy at the time. Against this backdrop, the company rented an offi ce space within BIOTEC facilities, where a group was already conducting joint research on Thailand’s herbs, and began operation as the Southeast Asia Research Center in October 2006. Its offi ces are in two locations, one within the NSTDA science park and the other inside its sales subsidiary in Bangkok (Shiseido Thailand Co., Ltd.). The main activities of the Southeast Asia Research Center are as follows: (1) basic research, (2) information gathering regard-ing cosmetics-related laws and regulations, and responding to various risks, and (3) local sales support.
Cooperation with the NSTDA (BIOTEC) mainly revolves around basic research including “Research of Thailand’s Herbs” (and applications of materials in cosmet-ics) and “Indigenous Bacteria” (particularly the P. acne bacteria that is responsible for acne). Shiseido submitted a joint patent application with the NSTDA for the former, and held a joint press conference with the NSTDA and BIOTEC in atten-dance regarding the research. This press conference was held in an effort to be more aggressive in showing the public that the company’s activities were intended to help the country, thereby preempting possible criticism by NGOs or other groups. For the latter research, Shiseido commissioned BIOTEC to perform the DNA analysis, and upon a joint review, would decide on the next steps. The company and NSTDA are also jointly deciding on research themes in areas where both sides have strong needs. The director of the center notes, “Regarding joint research with the NSTDA, the agency has many fi rst-rate PhDs among its researchers. However, submitting joint patent applications took a long time, and we still have room for improvement on IP management” (from an April 2000 interview).
On the other hand, there are several merits of this arrangement for BIOTEC, such as “being able to learn about quality standards for developing plant extracts, meth-ods for assaying cosmetics development, and other R&D methodologies of private companies” (from an April 2010 interview with the BIOTEC director). However, it took time to fi gure out the patent rights for the six types of plants that were submit-ted for patent application, as traditional usages of these plants were not to be
13 Thailand’s National Science and Technology Development Agency…

217
impaired by the issuance of such patents. In addition, as foreign fi rms obtain rights for domestic plant resources, it was also important for national research institutions to not damage the sentiments of the country’s citizenry.
13.4.2 Polyplastics Technical Solution Center
Polyplastics is a joint venture between Daicel Polymer Ltd. (55 %) and the US-based Tekona Inc. (of the Hoechst Group, 45 %), and is a manufacturer of resin material for engineering plastics (high performance plastics used in automobiles and con-sumer electronics). The company has the world’s largest factory used to manufac-ture POM (polyoxymethylene) and boasts the highest market share in Japan at 60 %, in addition to PBT (polybutylene terephthalate).
While Polyplastics manufactures and sells resin, its Technical Solution Center is responsible for technical support of resin products developed and manufactured by the company’s customers. The company initially created a center in Japan (located in Fuji) and secured a domestic top market share through its technical support. In recent years, it has expanded overseas into China (Shanghai) and Taiwan (Kaohsiung), and, in 2008, into Thailand within NSTDA’s MTEC. As ASEAN and, in particular, Thailand becomes the center for automobile manufacturing, Technical Solution Center provides technical support in manufacturing and defect analysis to “molders” who are subcontracted by the automakers.
The quality of high-performance plastic parts is dependent on the characteristics of the plastic material as well as the product design, molding equipment, and the settings of the equipment. Thus, the role of the Technical Solution Center is a four- step process of material selection, product and mold design, molding, and molded product analysis, where the two latter steps are focused in Thailand. When custom-ers have issues, the center performs a defect analysis (for example, an analysis of impurities that may have been mixed into the plastic) and cross-section analysis to determine the cause of the defect and offer advice. It sometimes goes on-site to confi rm the molding process and make suggestions for improvements.
At present, many Japanese automakers including Toyota and Honda have devel-opment centers in the Bangkok vicinity. The large parts supplier Denso also estab-lished a development center, using it to work with automakers on local development projects. As auto design and development procedures previously done in Japan are transferred to Thailand, Polyplastics deems it important to build relationships through its technical support during product development, so that its materials can be used. In the future, it will need to support processes such as material selection and product and mold design through computer-aided engineering.
The three key benefi ts of creating a center within NSTDA’s MTEC are as fol-lows: (1) information, (2) personnel, and (3) equipment. In regards to information, Polyplastics can detect development needs of the nation and customers through its NSTDA contacts and develop ways to roll out its business in foreign markets. For technical information, the company is in an environment where it can easily interact with advanced technologies sponsored by the NSTDA. Regarding personnel, the
13.4 NSTDA and R&D Activities of Japanese Firms in Thailand
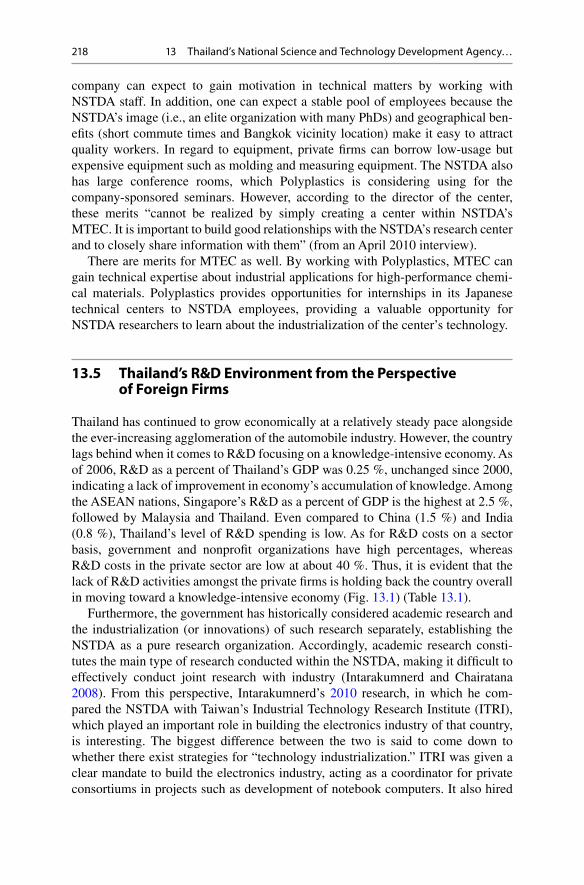
218
company can expect to gain motivation in technical matters by working with NSTDA staff. In addition, one can expect a stable pool of employees because the NSTDA’s image (i.e., an elite organization with many PhDs) and geographical ben-efi ts (short commute times and Bangkok vicinity location) make it easy to attract quality workers. In regard to equipment, private fi rms can borrow low-usage but expensive equipment such as molding and measuring equipment. The NSTDA also has large conference rooms, which Polyplastics is considering using for the company- sponsored seminars. However, according to the director of the center, these merits “cannot be realized by simply creating a center within NSTDA’s MTEC. It is important to build good relationships with the NSTDA’s research center and to closely share information with them” (from an April 2010 interview).
There are merits for MTEC as well. By working with Polyplastics, MTEC can gain technical expertise about industrial applications for high-performance chemi-cal materials. Polyplastics provides opportunities for internships in its Japanese technical centers to NSTDA employees, providing a valuable opportunity for NSTDA researchers to learn about the industrialization of the center’s technology.
13.5 Thailand’s R&D Environment from the Perspective of Foreign Firms
Thailand has continued to grow economically at a relatively steady pace alongside the ever-increasing agglomeration of the automobile industry. However, the country lags behind when it comes to R&D focusing on a knowledge-intensive economy. As of 2006, R&D as a percent of Thailand’s GDP was 0.25 %, unchanged since 2000, indicating a lack of improvement in economy’s accumulation of knowledge. Among the ASEAN nations, Singapore’s R&D as a percent of GDP is the highest at 2.5 %, followed by Malaysia and Thailand. Even compared to China (1.5 %) and India (0.8 %), Thailand’s level of R&D spending is low. As for R&D costs on a sector basis, government and nonprofi t organizations have high percentages, whereas R&D costs in the private sector are low at about 40 %. Thus, it is evident that the lack of R&D activities amongst the private fi rms is holding back the country overall in moving toward a knowledge-intensive economy (Fig. 13.1 ) (Table 13.1 ).
Furthermore, the government has historically considered academic research and the industrialization (or innovations) of such research separately, establishing the NSTDA as a pure research organization. Accordingly, academic research consti-tutes the main type of research conducted within the NSTDA, making it diffi cult to effectively conduct joint research with industry (Intarakumnerd and Chairatana 2008 ). From this perspective, Intarakumnerd’s 2010 research, in which he com-pared the NSTDA with Taiwan’s Industrial Technology Research Institute (ITRI), which played an important role in building the electronics industry of that country, is interesting. The biggest difference between the two is said to come down to whether there exist strategies for “technology industrialization.” ITRI was given a clear mandate to build the electronics industry, acting as a coordinator for private consortiums in projects such as development of notebook computers. It also hired
13 Thailand’s National Science and Technology Development Agency…

219
many personnel with experience in private sector. On the other hand, the NSTDA has many PhDs, but focuses on academic work with fewer opportunities to interact with the private sector. In Thailand, the technology level within private fi rms is still rather low, an apparent contradiction against the goal of becoming a high-level sci-ence and technology center.
However, since 2002, the NSTDA has created and implemented a new strategy that incorporates innovation and is moving in the direction of R&D with the aim of industrialization as well as joint research with private corporations. The Technology Management Center was created in 2005 to enable technology transfer of research
0.0
0.5
1.0
1.5
2.0
2.5
3.0
3.5
1996
1997
1998
1999
2000
2001
2002
2003
2004
2005
2006
2007
China
India
Indonesia
Japan
Philippines
Malaysia
Korea
Singapore
Thailand
Fig. 13.1 R&D/GDP by country (%) ( Source : UNESCO statistics)
Table 13.1 R&D share by sector (%)
Year Business Government Other non-profi t
China 2007 72.3 19.2 8.5
India 2004 19.8 75.3 4.9
Indonesia 2005 3.7 96.2 0.0
Japan 2007 77.9 7.8 14.3
Korea 2007 76.2 11.7 12.1
Malaysia 2006 84.9 5.2 9.9
Philippines 2005 58.6 18.6 22.9
Singapore 2007 66.8 12.2 21.0
Thailand 2006 40.9 17.2 41.9
Vietnam 2002 14.5 66.4 19.0
13.5 Thailand’s R&D Environment from the Perspective of Foreign Firms

220
results throughout the NSTDA as part of the above described goal. In addition, the share of government-related organizations’ investments in R&D costs is high, with NSTDA constituting a signifi cant portion, making it an attractive partner for foreign fi rms including Japanese fi rms to localize R&D activities. Competition with west-ern fi rms is expected to become more intense within emerging markets in the future, and Japanese companies must make strategic decisions regarding global R&D. They must make crucial decisions regarding the strategy they will pursue in Thailand, where they have an advantage over western fi rms, as well as methods in utilizing government research organizations such as the NSTDA.
13.6 Main Themes of This Case Study and Points for Consideration
This case study was created to help readers consider the appropriateness of Thailand, where Japanese companies have a long history of operations, as a destination for an R&D facility, and the effectiveness for companies to establish partnerships with the state-run NSTDA. In expanding R&D facilities overseas, it is necessary to survey the R&D infrastructure (such as technology level, research personnel, intellectual property systems, industry–academia partnerships, and various policies like science parks) of the country in question. However, depending on the R&D goals, it may be more appropriate to co-locate operations within already existing overseas facilities (for example, factories) rather than build new, independent R&D centers.
In addition, it is important to consider the utilization of ideas and research resources for products and services available in the target country by strengthening partnerships with innovation systems within its borders (innovation network such as universities, public research organizations, and corporations). In doing so, it is often effective to collaborate with universities or public research organizations that invest in partnerships between industry and academia. In this chapter, we have provided points to consider when implementing open innovation overseas.
The consideration points for this case study are as follows:
• What were the various reasons Shiseido and Polyplastics had for creating R&D centers within the NSTDA? Explain these reasons using the six categories given in Chap. 12 , summarized below. – Technology-centric (incorporating advanced foreign technology) – Market-centric (incorporating local consumer needs and product
localization) – Policy-centric (responses to local regulations, R&D incentives, and participa-
tion in local standardization activities) – Production-centric (technical support for local production facilities) – Cost-centric (utilization of cheap local personnel) – Innovation-centric (acquisition of local ideas for new products, strengthening
of global products development structures through optimal division of labor)
13 Thailand’s National Science and Technology Development Agency…

221
• It is critical that joint R&D be undertaken so that there are merits for both sides. What were the merits for NSTDA in the joint research performed with Shiseido and Polyplastics?
• Compare the R&D environment in Thailand with those of the ASEAN nations such as Indonesia, Malaysia, and the Philippines. What industries are best fi ts for R&D in Thailand? Why?
• When the industries in the previous question conduct R&D in Thailand, is it appropriate for them to engage in joint research with the NSTDA? List the vari-ous merits and demerits in doing so and discuss which are greater.
References
Intarakumnerd, P. (2010). Two models of research technology organization in Asia . mineo. Intarakumnerd, P., & Chairatana, P. (2008). Shifting S&T policy paradigm: An experience of a
RTO in Thailand. International Journal of Technology and Globalisation, 4 (2), 121–138. Japan Science and Technology Agency Center for Research and Development Strategy. (2008,
October). Kagaku Gijutsu Innovation Doukou Houkoku Thai Hen . Tokyo: JST CRDS. Ueda, Y. (2007). Nihon no Chokusetsu Toshi to Thai no Jidousha Buhin Maker No Keisei
(Vol. 58/4, 87–117). Kyoto: Keizaigaku Rongi, Doshisha University.
Open Access This chapter is distributed under the terms of the Creative Commons Attribution Noncommercial License, which permits any noncommercial use, distribution, and reproduction in any medium, provided the original author(s) and source are credited.
References

223© The Author(s) 2015K. Motohashi, Global Business Strategy, Springer Texts in Business and Economics, DOI 10.1007/978-4-431-55468-4_14
14 Suzuki Motor’s Expansion in India
14.1 Introduction
Suzuki Motor Corporation (Suzuki) is an automobile and motorcycle manufacturer of compact cars such as Alto and Wagon R. Domestically, the company trails Toyota in terms of the annual car production, and is about the same size as Nissan and Honda. However, it is India’s number one automaker, boasting of more than 30 % share in the passenger vehicle market. Suzuki’s business in India began with a joint venture (JV) in 1982 with the Indian government and an investment in the state- owned Maruti Udyog. The company began manufacturing the Maruti 800 (Alto) in 1983. The Maruti 800 became popularly known as the “people’s car of India,” thereby enabling Suzuki’s Indian subsidiary, Maruti Suzuki India (Maruti Suzuki), to enjoy overwhelming strength due to its brand, product line up, and dealer network.
However, the company’s climb to the top had not always been easy. India in the 1980s produced goods based on a planned economy and employees had little regard for productivity, thus it took time to instill automobile production management methods among employees. In addition, Suzuki’s relationship with the Indian gov-ernment, its partner in the JV, worsened, and it experienced large-scale employee strikes. Furthermore, with the growth of India’s auto market, competitors began to move into the market, posing a threat to Maruti Suzuki’s dominance as the number one automaker. Among foreign automakers, Korea’s Hyundai Motor Company grew in market share and the domestic automaker Tata Motors was not far behind as the third largest automaker in India. Tata Motors released the Tata Nano in July 2009, which garnered a great deal of publicity with its INR 100,000 (approximately JPY 200,000) price tag. Therefore, price war with domestic manufacturers began to emerge. Additionally, Toyota and Honda, heretofore lacking presence in the Indian market, announced sales of its compact cars made for India, necessitating Suzuki to also gear up against its top tier competitors.

224
This chapter analyzes Suzuki’s entry into the Indian market via the Maruti Suzuki subsidiary to deepen our understanding of the business environment in India and the changes therein. In addition, we consider the strategies that Maruti Suzuki should employ to maintain its dominance in the Indian auto market.
14.2 Suzuki Motors Corporation and Its Overseas Business
Suzuki Motors Corporation was incorporated in 1920 as Suzuki Loom Manufacturing Co, and later came to be called Suzuki Motors Corporation in 1954, after launching a two-wheel and a light four-wheel business in the early 1950s. In 1990, it changed its name to the current form by changing “Suzuki” in Chinese characters to the same pronunciation in Japanese katakana characters. At the end of 2011, it had 134 sub-sidiaries (70 domestic and 64 overseas) and 37 associated companies. On a consoli-dated basis, it generated revenues of JPY 2.5 trillion and had a workforce of 50,000 employees. Suzuki created a niche for itself in Japan’s compact car market early as a maker of primarily small motorcycles and light vehicles. While its automobiles fall primarily within the light category, Suzuki’s growth in the compact and mid- sized car market segments has been startling. Apart from automobiles, Suzuki also manufactures and sells motorcycles and outboard motors. Two-thirds of its revenues come from overseas business (Tables 14.1 and 14.2 ).
Suzuki has expanded its product line by primarily focusing on the light vehicles segment. In 1981, it strengthened its compact car business through agreements with General Motors (GM) that established operational and capital alliances. In 1983, it began the manufacture and sales of the Cultas; in 1984, it began exporting compact cars, supplying them to GM. In 1989, Suzuki created the CAMI in Canada as a 50–50 JV with GM, kick starting its North American manufacture of compact cars. In 1998 and again in 2000, Suzuki received capital infusions from GM, and by 2000, GM’s stake in Suzuki reached 20 %, leading to the announcement of a new strategic alliance with GM. However, in the latter half of that decade, GM lowered its stake to 3 % due to operational restructuring brought about by worsening perfor-mance, and eventually sold all remaining Suzuki shares in November 2008, dissolv-ing its capital alliance. In 2009, Suzuki entered into a capital partnership with Volkswagen (VW), which possessed a large share of the Chinese market, through a comprehensive partnership agreement. However, that partnership never material-ized into a substantial business, and the comprehensive agreement was cancelled in 2011. Suzuki entered into arbitration to seek the release of its shares owned by VW, to which VW has not agreed. The situation remains unresolved as of 2012.
Suzuki’s motto is “Don’t do what others do. Even in small markets, we will always strive to be number one in what we do.” The company is well known for its constant progressiveness, particularly in the motorcycle segment. For example, the fi rst large scooters with 400 and 650 cc engines, particularly popular in Europe, were sold by Suzuki. The company held its number one position for 34 years in a row, from 1973 to 2006, in the light vehicle segment in Japan, and also acts as an original equipment manufacturer (OEM) to Nissan and Honda.
14 Suzuki Motor’s Expansion in India

225
Suzuki worked on international expansion since its early stages, making its way into advanced nations, but fi nding it diffi cult in the North American market due to low demand for compact cars. It was in these circumstances that Suzuki received a request from the Indian government and entered the country’s market. Today, lever-aging on its extensive line-up of compact vehicles, Suzuki is aggressively pursuing its entrance into developing countries like Pakistan and former communist bloc countries like Hungary (Table 14.3 ).
Table 14.1 Suzuki overseas investments
1909 Formation of Suzuki Loom Works
1920 Incorporation as Suzuki Loom Manufacturing Co.
1963 Creation of US Suzuki Motor Corp. sales subsidiary
1967 Creation of Thai Suzuki Motor Co., Ltd. (Suzuki’s fi rst overseas motorcycle factory)
1973 Creation of Suzuki Canada Ltd.
1974 Creation of Suzuki Indonesia Manufacturing joint venture
1975 First overseas auto factory in Pakistan
1980 Creation of Suzuki Australia Pty. Ltd. sales joint venture
1981 Formation of operational alliance with GM and Isuzu
1982 Joint venture agreement with Indian government for Maruti Udyog
Production of autos at PAK Suzuki Motor Co., Ltd. in Pakistan
Signing of technological alliance with Spain’s Santana
1984 Creation of Suzuki New Zealand Ltd. (sales and production)
Creation of Suzuki France (sales)
Creation of Suzuki Motor GmbH Deutschland (sales)
1985 Creation of Suzuki of America Automotive Corp. (sales)
1986 Creation of American Suzuki Motor Corp. holding company
Agreement on joint production of autos with GM Canada
1988 Agreement with GM to strengthen capital ties
1989 Opening of Suzuki Egypt S.A.E. auto factory
1991 Formal signing of joint auto production agreement in Hungary, and creation of Magyar Suzuki Corporation
1993 Signing of joint passenger vehicle production agreement with China’s Chang’ an Automobile Group
1995 Withdrawal of capital from Spain’s Santana Motors
2000 Joint development and production between GM and Magyar Suzuki Corporation
2001 Suzuki Motor R&D Asia Co., Ltd. begins motorcycle R&D in Thailand
2002 Acquisition of majority shares of India’s Maruti, making it a subsidiary
2006 Reduction in capital ties with GM
2008 Cutting of capital ties with GM
2009 Severing of construction on auto factory in Thailand
Capital alliance with VW
2011 Cancelation of comprehensive agreement with VW
Arbitration to force VW to relinquish stake in Suzuki Source : Various resources
14.2 Suzuki Motors Corporation and Its Overseas Business
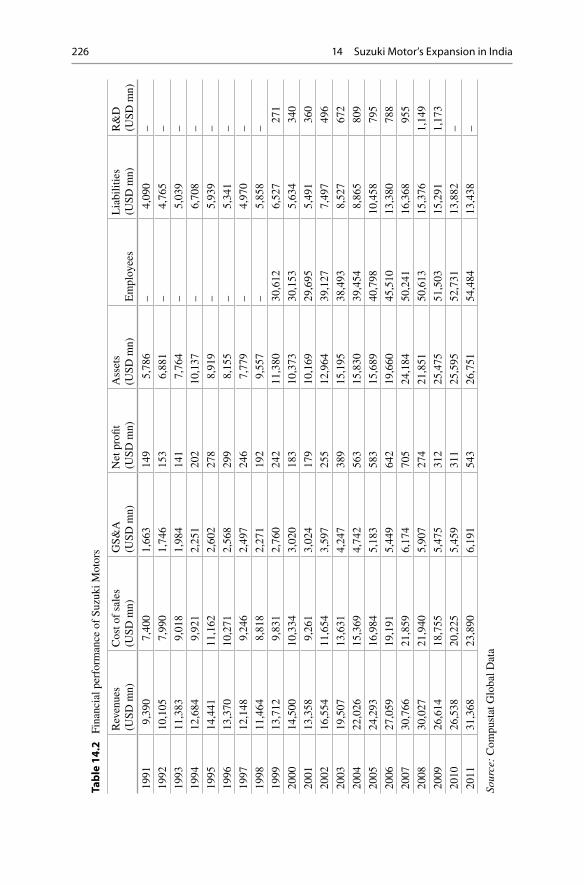
226
Tab
le 1
4.2
Fi
nanc
ial p
erfo
rman
ce o
f Su
zuki
Mot
ors
Rev
enue
s (U
SD m
n)
Cos
t of
sale
s (U
SD m
n)
GS&
A
(USD
mn)
N
et p
rofi t
(U
SD m
n)
Ass
ets
(USD
mn)
E
mpl
oyee
s L
iabi
litie
s (U
SD m
n)
R&
D
(USD
mn)
1991
9,
390
7,40
0 1,
663
149
5,78
6 –
4,09
0 –
1992
10
,105
7,
990
1,74
6 15
3 6,
881
– 4,
765
–
1993
11
,383
9,
018
1,98
4 14
1 7,
764
– 5,
039
–
1994
12
,684
9,
921
2,25
1 20
2 10
,137
–
6,70
8 –
1995
14
,441
11
,162
2,
602
278
8,91
9 –
5,93
9 –
1996
13
,370
10
,271
2,
568
299
8,15
5 –
5,34
1 –
1997
12
,148
9,
246
2,49
7 24
6 7,
779
– 4,
970
–
1998
11
,464
8,
818
2,27
1 19
2 9,
557
– 5,
858
–
1999
13
,712
9,
831
2,76
0 24
2 11
,380
30
,612
6,
527
271
2000
14
,500
10
,334
3,
020
183
10,3
73
30,1
53
5,63
4 34
0
2001
13
,358
9,
261
3,02
4 17
9 10
,169
29
,695
5,
491
360
2002
16
,554
11
,654
3,
597
255
12,9
64
39,1
27
7,49
7 49
6
2003
19
,507
13
,631
4,
247
389
15,1
95
38,4
93
8,52
7 67
2
2004
22
,026
15
,369
4,
742
563
15,8
30
39,4
54
8,86
5 80
9
2005
24
,293
16
,984
5,
183
583
15,6
89
40,7
98
10,4
58
795
2006
27
,059
19
,191
5,
449
642
19,6
60
45,5
10
13,3
80
788
2007
30
,766
21
,859
6,
174
705
24,1
84
50,2
41
16,3
68
955
2008
30
,027
21
,940
5,
907
274
21,8
51
50,6
13
15,3
76
1,14
9
2009
26
,614
18
,755
5,
475
312
25,4
75
51,5
03
15,2
91
1,17
3
2010
26
,538
20
,225
5,
459
311
25,5
95
52,7
31
13,8
82
–
2011
31
,368
23
,890
6,
191
543
26,7
51
54,4
84
13,4
38
–
Sour
ce:
Com
pust
at G
loba
l Dat
a
14 Suzuki Motor’s Expansion in India

227
In the 3-year mid-term plan for the period 2007–2010, Suzuki set a 2010 goal of selling 2.95 million vehicles worldwide and producing 3.2 million vehicles. The company also made plans to expand its supply system by establishing new produc-tion facilities in Thailand and introduce new models such as the A-Star into Indian and European markets. However, due to the economic recession caused by the fi nancial crisis and the subsequent sudden drop in demand, it was forced to revise a part of its new business plan, such as indefi nitely postpone the establishment of a new subsidiary in Russia and revise its production plans for its Thailand factory. Production volume in 2008 dropped to below 2.5 million vehicles worldwide, but due to the demand in the domestic sales for light vehicles, it recovered to approxi-mately 2.8 million by fi scal year 2011 (1.02 million domestic and 1.78 million overseas).
14.3 Suzuki’s Business in India
Amid the global economic downturn precipitated by the Lehman Brothers bank-ruptcy, Suzuki’s subsidiary in India, Maruti Suzuki, was experiencing spectacular success. Thirty percent of Suzuki’s overall profi t on a consolidated basis came from India. As the “people’s car of India,” Suzuki’s Maruti 800 established a strong brand recognition. In 2007, Osamu Suzuki, the president of the company, received the “Padma Bhushan” award from the Indian government for the company’s contribu-tion to the Indian economy.
India’s auto market began with knockdown production, or a simple assembly of imported parts, by GM and Ford during the 1930s. Hindustan Motors was formed in 1942, followed by other auto makers such as Premier Automobiles, TELCO (cur-rently Tata Motors), Ashok Leyland, and Mahindra & Mahindra, all established using domestic capital.
Table 14.3 Number of passenger vehicle sales by region (units: in thousands)
Region 2004 2005 2006 2007 2008 2009 2010
NA 85 99 113 112 85 41 33
Cent. & SA 34 44 48 67 76 58 71
East Asia 264 260 234 280 278 332 391
Oceania 10 19 21 28 27 27 31
West Asia 562 628 767 841 799 939 1,233
Mid-East 12 12 19 24 28 19 16
Africa 10 14 22 35 44 29 35
Europe 243 289 306 344 301 281 243
Total 1,219 1,365 1,531 1,732 1,641 1,727 2,053
Japan 673 707 691 673 665 622 588
Source : 2011 Suzuki Corporate Overview
14.3 Suzuki’s Business in India

228
The production technology of these early domestic automakers was low, therefore, the Indian government, in the intention to develop automakers that could produce compact cars with good fuel consumption at low cost, requested Japanese automakers to enter the market. This is how Suzuki made its entrance in the Indian market. In 1982, the Indian government and Suzuki entered into a JV agreement and began the production of automobiles through India’s state-owned manufacturer, Maruti Udyog. The automobile industry at the time thought of this as rash, and some inside offi cials opposed the agreement. However, Osamu Suzuki, the presi-dent at the time, said, “No one else is going to India, so we have an opportunity. We were the lowest-ranked among domestic manufacturers, and wanted to be at the fi rst place somewhere.” It was with this sense of passion that he made the decision to begin operations in India. At fi rst, production began with Suzuki only retaining a 26 % minority stake in Maruti Udyog. Although the Indian government had requested for Suzuki to own what was then the foreign ownership maximum of 40 %, Suzuki, keeping investment risk in mind, determined that 26 % was the most it could invest without compromising veto rights for major management issues. Suzuki also ensured that its approval of important policy matters, such as CEO changes, was included as a condition in the JV agreement, thereby allowing Suzuki to instill Japanese management styles into the JV, despite its hold as a minority participant. The 1980s was a time of both merits and demerits for JVs with state- owned enterprises. Because Maruti was state-owned, employees were unconcerned about productivity and it took time to implement a production management system. For example, employees were not very particular about work hour schedules, mak-ing it diffi cult to implement production lines with routings managed in seconds. By training these employees in Japanese factories, the company was able to elicit a desire to master automobile production management systems. Executives, who were used to their private offi ces, were baffl ed by Suzuki’s system of having all employees together in one large room. However, today this same system is well received by Indian employees as it enables better communication.
Supply could not meet automotive demand in India during the 1980s, and because Suzuki was the only foreign automaker in India, it was able to take advan-tage of this and hire the very best Indian engineers. It was also able to smoothly expand its sales network through its JV. Because customers had to buy whatever was produced, auto dealers did not have to put in much effort to sell their vehicles. However, the country needed service stations for auto repairs caused by the poor condition of Indian roads. At the time, Maruti’s dealers were local celebrities who sold motorcycles and ran other businesses, and Maruti was able to earn their trust due to it being a state-owned company.
India was beset by a severe fi scal crisis in 1990 that brought about massive deregulation to transition itself into a market economy because it determined that the economic system up until that point, with its tangle of regulations, was the source of the crisis. As part of that transition, regulations governing foreign capital were relaxed in 1991, and at the Indian government’s request in 1992, Suzuki increased its stake in the JV to 50 %. However, differences of opinion with the
14 Suzuki Motor’s Expansion in India

229
government regarding planned factory expansion locations and funding sources surfaced in the late 1990s. Additionally, Suzuki felt that the executive nominated by the Indian government to head the JV in 1997 was unsuitable for the role, causing the company to take an extreme measure and once again oppose the Indian govern-ment. Osamu Suzuki casually commented in an interview with a Nihon Keizai Shinbun reporter: “We’ll have an abacus in our left hand and come out punching with our right. We don’t need to compromise” (September 25, 1997, Nihon Keizai Shinbun , p. 24). Insisting that the Indian government was violating the contractual agreement to “select appropriate personnel as company president,” Suzuki went so far as to take action against the government in both the Delhi High Court and London’s International Court of Arbitration. The Indian government did not think that Suzuki, a mere private company, would react so strongly. Finally, in 1998, the two parties settled. The dispute caused interruption to new car models, causing delayed management decisions on new car sales by Maruti Udyog.
Labor unions in India are very powerful and many foreign manufacturers have been troubled by labor disputes. Suzuki is no exception. Increased market competi-tion made it diffi cult to maintain traditional wage structures that provided incentives depending on production volumes. The labor union reacted negatively when the company proposed inhibitory changes to wages in 2000, triggering a large-scale strike lasting 88 days during October 2000 through January 2001. During that time, the labor union involved politicians and India’s Department of Commerce in an effort to shake up Suzuki by any political means possible. However, Suzuki stayed fi rm to its stance that it would not hire workers who could not follow directions.
Suzuki took a controlling stake of Maruti Udyog in 2002, and in 2003, some of the government’s shares were sold on the stock exchange. The government sold all of its remaining shares in 2007, at which time Suzuki was able to cut all capital ties to the government. It is thought that the Indian government came to this decision by judging the outcome of its attempts to interject itself into Maruti’s management in the late 1990s, and acknowledged that management of the company was better left to Suzuki (Tables 14.4 and 14.5 ).
From the outset, Suzuki implemented a number of labor practices, such as a “bottom–up approach,” at Maruti Suzuki. For example, executives at Suzuki sit among employees at the cafeteria and eat the same food so as to facilitate commu-nication. This was diffi cult to practice in India with its strict caste system, but Maruti Suzuki was insistent. At the time, Prime Minister Indira Gandhi praised Suzuki as having “Transplanted Japan’s work culture into India.” Today, this “bottom–up approach” is the norm among Indian executives, and there is now an environment in place allowing for manufacturing the Suzuki way. To fully implement the Suzuki way of manufacturing, the company sent Indian employees to Japan to train them on-site in locations such as Hamamatsu. However, the increasing numbers of vet-eran Indian workers now make it possible to conduct training locally, resulting in fewer trainees being sent to Japan.
Maruti Suzuki’s production volume steadily increased until 2010, but declined by 100,000 units in 2011 to approximately 1.13 million units due to a large strike
14.3 Suzuki’s Business in India

230
Tab
le 1
4.4
Fi
nanc
ial p
erfo
rman
ce o
f M
arut
i Suz
uki
Rev
enue
s (U
SD m
n)
Cos
t of
sale
s (U
SD m
n)
GS&
A
(USD
mn)
N
et p
rofi t
(U
SD m
n)
Ass
ets
(USD
mn)
E
mpl
oyee
s L
iabi
litie
s (U
SD m
n)
R&
D
(USD
mn)
1991
78
4 –
– 12
36
2 3,
993
271
–
1992
74
4 –
– 13
40
0 4,
042
287
–
1993
89
0 –
– 27
67
2 4,
141
537
–
1994
1,
323
– –
79
1,14
1 4,
840
933
–
1995
1,
423
– –
128
1,00
5 4,
968
696
3
1996
–
– –
– –
– –
–
1997
–
– –
– –
– –
–
1998
1,
851
– –
124
999
5,71
9 38
1 3
1999
2,
150
– –
76
1,11
8 5,
848
450
7
2000
1,
956
– –
−59
1,
077
5,77
0 51
0 10
2001
1,
905
– –
22
990
4,62
7 43
5 10
2002
1,
476
– –
30
1,15
1 –
499
–
2003
2,
045
– –
122
1,34
8 3,
334
505
6
2004
2,
446
– –
196
1,52
3 3,
453
502
8
2005
2,
733
– –
276
1,91
6 –
666
9
2006
3,
273
2,72
4 11
1 35
2 2,
423
– 80
2 12
2007
4,
508
3,69
7 15
6 44
6 3,
176
7,09
0 1,
015
16
2008
4,
524
3,90
3 18
2 26
9 2,
765
7,15
9 88
4 15
2009
6,
247
4,91
2 –
554
– –
– 20
2010
7,
586
5,31
4 21
0 55
1 –
– –
22
2011
7,
688
6,92
5 20
7 50
0 –
– –
–
Sour
ces:
Com
pust
at G
loba
l Dat
a/M
arut
i Suz
uki A
nnua
l Rep
ort 2
011
(IN
R 1
= U
SD 0
.021
)
14 Suzuki Motor’s Expansion in India

231
the previous year. Of that number, one million units were sold domestically, and 130,000 were exported to other markets. The Indian market for both passenger and commercial vehicles, on the other hand, increased from approximately three million units in 2010 to 3.3 million in 2011, causing Suzuki’s market share to drop from almost 40 % in 2010 to about 30 % in 2011. These numbers, however, include all vehicles, and Maruti Suzuki’s share of passenger vehicles was higher, at around 38 % in 2011 (Table 14.6 ).
Table 14.5 Development of Maruti Suzuki
1971 Sanjay Gandhi (the son of former Prime Minister Indira Gandhi) applauds company based on a compact “people’s car” concept
1972
1981 Maruti created as state-owned company
1982 Maruti joint venture and license agreement with Suzuki
1983 Production and sales of Maruti 800 (Alto)
1984 Sales of Omni (Every)
1985 Sales of Gypsy (Jimny)
1990 Sales of Esteem (Cultas)
1991
1992 Suzuki increases ownership from 40 to 50 %
1993 Sales of Zen (Servo)
1994 Cumulative production of 1 mn vehicles, opening of Number 2 Factory
1997 Cumulative production of 2 mn vehicles
1998
1999 Opening of Number 3 Factory
Sales of Baleno (Crescent) and Wagon R
2000 Sales of Alto, cumulative production of 3 mn vehicles
2001 Sales of Versa (Every Landy)
2002 Maruti Udyog becomes Suzuki subsidiary
2003 Maruti Suzuki gets listed on the stock market, cumulative production of 4 mn vehicles
2004 Decision to create engine production company
2005 Cumulative production of 5 mn vehicles, sales of Swift
2006 Manesar Factory begins production
Sales of Zen and Estiro (Wagon R)
Cumulative production of 6 mn vehicles
2007 Corporate name becomes Maruti Suzuki India Limited
Sales of SX4 and Grand Vitara
2008 Sales of Swift Desire
Cumulative production of 7 mn vehicles
Sales of A-Star
2009 Sales of Ritz (Splash)
2010 Annual sales of 1 mn vehicles
2011 Cumulative production of 10 mn vehicles
Source : Various resources
14.3 Suzuki’s Business in India

232
In addition to Maruti Suzuki maintaining its top market share in India, the company planned to develop India as a compact vehicle export hub and develop-ment center for compact cars bound for global markets. The A-Star model, which hit the global markets in 2009, had a production volume set at 140,000 vehicles, of which 100,000 were exported to Europe that same year. Exports to Europe have been stagnant due to the slumping European economy, but Suzuki is preparing toward a transition development of compact vehicles to India. As part of that pro-cess, in 2013, it is planning on opening a development center with a test course in Rohtak, a city in the state of Haryana. Modifi cations such as the increased engine room to the 660 cc Japanese light vehicle Alto to place a one liter engine, and body modifi cations to the ECCO passenger car based on Japan’s commercial vehicle Every, have been carried out locally. Testing these completed vehicles was previ-ously conducted in Japan, but it can now be conducted in India with the opening of a testing center, thereby considerably shortening the development phase for prod-ucts going to both Indian and other foreign markets.
Maruti Suzuki is also proactive in its CRS activities, and has opened Maruti Driving Schools (MDS). As of March 2009, more than 50 of these schools were in place, compared to 34 in the previous year. This number grew to 163 by November 2011. Aiming to reduce traffi c accidents, Suzuki considers education on safe driv-ing as part of its responsibility as the nation’s top automaker.
14.4 Supply Chain Creation and Local Development Infrastructure
Cars are made up of several parts, each of which is manufactured by as many part makers. The auto industry has a hierarchical structure, with the automakers at the top as assemblers, working directly with the relatively large Tier 1 suppliers, who in turn are supplied by many Tier 2 and Tier 3 suppliers. Creating a supply chain with these parts suppliers is critical to producing cars in India.
Table 14.6 Number of production and sales by Maruti Suzuki
1999 2000 2001 2002 2003 2004 2005
Production volume
407,589 350,374 358,108 359,960 472,908 540,415 572,127
Domestic sales
384,892 335,461 340,182 330,175 420,947 487,402 527,038
Exports 21,450 15,300 12,233 32,240 51,175 48,899 34,781
2006 2007 2008 2009 2010 2011
Production volume
667,048 777,017 774,623 1,025,466 1,270,959 1,133,695
Domestic sales
635,629 711,818 722,144 870,790 1,132,654 1,006,316
Exports 39,295 53,024 70,023 147,575 138,305 127,379
Source : Maruti Suzuki India Limited ( 2011 )
14 Suzuki Motor’s Expansion in India

233
In the fi rst half of the 1980s, when Suzuki was just beginning passenger car production in partnership with Maruti Suzuki, there were no companies in India that could manufacture auto parts that met Suzuki’s quality standards. Thus, Maruti Suzuki began producing passenger cars by furnishing its factories with welding and painting equipment and assembling the parts and materials that were imported from Japan. At the behest of the Indian government to procure parts domestically to develop an auto parts industry in India, Maruti Suzuki began sourcing tyres and bat-teries domestically. Since buses and trucks were being produced domestically, India already possessed the technology to produce these items. Although it was not easy to apply these technologies to compact cars, the company was able to eventually localize the procurement with the cooperation of Indian manufacturers.
At the time, Tata and Mahindra & Mahindra were manufacturing trucks and buses. With all necessary parts manufactured internally, these companies never con-sidered the development of a parts supplier network. With Suzuki’s instruction, a Phased Manufacturing Program to develop a local Indian parts suppliers’ network began. For example, a technology called “zone toughening” is used on windshields that can alter the size of a crack depending on its location on the windshield. It was necessary to bring this technology from Japan to make windshields in India. Parts suppliers themselves possessed the technology, so Suzuki decided to form a three- way JV between Suzuki, Maruti Suzuki, and parts suppliers. The same applied to plastic bumpers, since India at the time only produced metal bumpers. In this man-ner, Suzuki steadily pressed forward with creating a local supply chain.
Circumstances changed dramatically with the economic liberalization policies of the 1990s as major foreign parts manufacturers began to expand into India. The Phased Manufacturing Program ended in 1992 and Maruti Suzuki began procuring parts from Indian companies, which by then could produce high quality parts. Today, Maruti Suzuki procures more than 90 % of its parts domestically, importing only a very small percentage from Japan. However, in many cases, the company procures parts from the Indian subsidiaries of Tier 1 Japanese parts suppliers, which in turn import critical parts from Japan for further assembly in India.
For example, Denso, a supplier of electronics controlling units (ECUs), fuel pumps, and injectors, primarily imports critical parts from Japan and assembles them in India. It procures some parts, such as plastic and die cast locally, but India still lacks adequate Tier 2 suppliers. Furthermore, Japanese suppliers at this level are mostly small- and medium-sized businesses, with only few expanding into India. “Increasing the amount of local procurement is essential to reducing costs, and automakers are very cooperative. We cannot lower the quality, but we do need to change our thinking, such as decreasing the functionality of Indian specifi ca-tions” (an oral interview with employee at Denso’s Indian subsidiary).
Maruti Suzuki began producing diesel cars in 2006. Demand in India for diesel- run cars is high, and depending on the model, it can be higher than demand for gas- driven cars. Suzuki did not possess diesel engine technology, so it received technical assistance from Fiat, on account of its alliance with GM, which had a capital alli-ance with Suzuki at the time. Because the ECUs for diesel engines were manufac-tured by the Italian fi rm Magneti Marelli, in 2008 Maruti Suzuki formed a JV with Magneti Marelli and began production of diesel engines in India.
14.4 Supply Chain Creation and Local Development Infrastructure

234
As Maruti Suzuki moved ahead with the localization of its production processes, it also proceeded in terms of creating infrastructure to enable the development of com-pact cars in India. Up until that time, new cars introduced into the Indian market were models already in mass production in Japan that had been modifi ed according to Indian specifi cations. However, with the introduction of the Swift model in 2005, Suzuki com-pletely changed course and began the simultaneous production of cars of the same specifi cations and quality of those produced in Japan, Hungary, India, and China.
Suzuki took a step forward with the release of the A-Star. Manufactured in India and made for the global markets, the model was sold not only in India but was also exported to Europe. Maruti Suzuki and Suzuki periodically had exchanges between the two companies’ engineers, helping the growth of development infrastructure in India. There are three stages in local design. The fi rst stage is the ability to design the front and rear of the body, specifi cally the shapes of the lights and front grill. Maruti Suzuki is already at this level. The second stage is the ability to design the entire body, and the third is the development of the entire vehicle, including the platform. According to a Maruti Suzuki local staff “The company would like to be positioned at level two in the next few years.”
14.5 India’s Automotive Industry: Huge Opportunities and Increasing Competition
Total sales volume of vehicles in India was 3.3 million in 2011, and although it compares unfavorably to China’s 18 million, it is still the sixth largest market in the world. With an estimated annual growth rate of 10 %, the Indian market will cer-tainly surpass Japan, Brazil, and Germany in the near future, becoming the third largest in the world, behind only China and the US. Particularly amid the shrinking auto markets of the US and Japan due to the Lehman Brothers-induced economic recession, growth in the auto markets in emerging nations is astonishing (Table 14.7 ).
India’s potential as an auto market can also be gleaned from the relatively low market penetration of vehicles. As of 2010, population per vehicle was 57, more than double that of China’s score of 27. Accompanied by nationwide economic growth, India’s overall wage levels are also increasing. The middle class population percentage with the means to purchase a car (i.e., those with an annual income greater than INR 200,000) has risen to 10 % of the total population and is estimated to grow in the future.
Compact cars have the highest share of India’s auto market. According to 2009 data, more than one million of the 1.4 million passenger vehicles manufactured that year fell into the compact car category (Table 14.8 ). Maruti Suzuki shows overwhelming strength within the compact car category, with approximately half of the market share, followed by Korea’s Hyundai Motor Company and India’s Tata Motors. In terms of 2011 passenger car market share, Hyundai Motor Company is somewhat ahead of Tata Motors, although Tata has an overwhelming lead in terms of total production volume when commercial vehicles
14 Suzuki Motor’s Expansion in India

235
are included. Tata Motors began selling the Nano, a low-priced vehicle, in 2009. It began factory operations for Nano production in the state of Gujarat in June 2010, and currently has the capacity to produce 250,000 vehicles annually. It plans to increase this number to 350,000 vehicles in the future, giving Nano sales the poten-tial to dramatically change the composition of the compact car market. Next in terms of market share is Mahindra & Mahindra, which primarily manufactures SUVs. Toyota, GM, Ford, and Honda hover around the list, at sales volumes between 50,000 and 100,000 vehicles each. These standings are based on domestic Indian sales, although in terms of production volume including exports, Hyundai Motor Company is far ahead of Tata Motors. Renault Nissan has also built an export pro-duction facility and plans to manufacture 240,000 vehicles annually in 2012 (Table 14.9 ).
Of the many parts procured from parts suppliers, auto production facilities spe-cial order most parts. Parts that require a high degree of quality or precision are sometimes imported from the manufacturer’s country of origin, but these manufac-turers must increase the percentage of locally procured parts to reduce production costs. Thus, automakers often procure from domestic suppliers while helping them develop. As a result, automakers have clusters of parts suppliers near their facilities. India has three large automotive clusters formed by suppliers: the Delhi areas where Maruti Suzuki and Honda Siel are located; the Mumbai areas, including Pune, where Tata Motors is located; and southern India where Hyundai Motor Company (in Chennai), Renault Nissan (Chennai), and Toyota Kirloskar (Bangalore) are located (Fig. 14.1 ).
Below are overviews of Maruti Suzuki’s main competitors in India.
Table 14.7 Market size of automotives by country (units: 10,000s of vehicles)
Country 2005 2006 2007 2008 2009 2010 2011
China 577 722 879 934 1,364 1,806 1,851
US 1,744 1,705 1,646 1,349 1,060 1,180 1,304
Japan 585 574 535 508 461 496 421
Brazil 171 193 247 283 315 352 363
Germany 361 377 348 343 405 320 351
India 144 175 199 198 227 304 329
Russia 181 225 289 322 160 211 291
France 255 250 258 257 272 271 269
UK 283 273 280 248 222 229 225
Italy 250 261 278 242 236 215 195
Iran 101 110 115 130 142 160 164
Canada 163 167 169 167 148 158 162
Korea 117 120 127 122 145 156 158
Australia 99 96 105 101 94 104 101
Source : Fourin: 2011 World Car Almanac
14.5 India’s Automotive Industry: Huge Opportunities and Increasing Competition

236
So
urce
: Fou
rin:
201
1 W
orld
Car
Alm
anac
M
ini (
appr
ox. I
NR
220
,000
): le
ngth
of
3,40
0 m
m; C
ompa
ct (
appr
ox. I
NR
350
,000
): le
ngth
of
3,40
4–4,
000
mm
; Mid
-siz
e (I
NR
500
,000
–850
,000
m):
leng
th o
f 4,
001–
4,50
0 m
m; E
xecu
tive
(IN
R 1
.1 m
n): l
engt
h of
4,5
01–4
,700
mm
; Pre
miu
m (
INR
1.2
–3 m
n): l
engt
h of
4,7
01–5
,000
mm
; Lux
ury
(IN
R 3
.2 m
n): l
engt
h of
4,
701–
5,00
0 m
m
Tab
le 1
4.8
Sa
les
volu
me
by c
ar s
egm
ent i
n In
dia
Pas
seng
er
Pas
seng
er
Min
i 13
2,70
691
,865
85,4
0171
,102
54,8
7554
,204
vehi
cles
ve
hicl
es
Com
pact
Mid
-siz
e
Exe
cutive
Pre
miu
m
Lux
ury
126
159
288
662
1,07
91,
123 568,524
1,438,102,1
421,871,1527,320,1
323,358577,208
latoT
Utilit
y
MPV
335,331
354,601667,59
826,67198,56
605,46
502,518,1243,545,1
456,115,1453,113,1
368,601,1108,830,1
latoT
Com
mer
cial
Com
pact
B
uses
vehi
cles
com
mer
cial
T
ruck
s (fre
ight
) 95
,672
112,
943
154,
806
184,
387
180,
589
219,
566 981,152
066,702116,112
179,771189,431
243,511lato
TM
id-s
ized
&B
uses
469,
844
552,
794
693,
916
842,
474
864,
288
1,05
8,87
1
172,
153
174,
555
201,
615
214,
444
238,
690
260,
422
22,2
7227
,714
36,6
8742
,536
35,1
3141
,355
5,67
46,
236
5,81
86,
906
7,77
19,
890
171,
520
187,
649
211,
001
237,
764
237,
055
255,
807
19,6
7022
,038
23,1
6527
,224
27,0
7131
,623
24,5
4627
,210
28,9
2637
,284
35,9
8237
,888
larg
e T
ruck
s (fre
ight
) 15
4,43
516
0,63
420
9,79
520
8,79
519
4,06
115
9,60
5co
mm
erci
al
Tra
ilers
394,791340,032
892,072845,162
116,891451,091
latoT
Tot
al
286,844307,734
909,184915,934
295,333694,503
788,362,2540,389,1
365,399,1378,057,1
554,044,11,
344,
297
emulov
selaslatoTC
ateg
ory
Segm
ent
2004
2005
2006
2007
2008
2009
22,8
2724
,219
10,7
6711
,173
14 Suzuki Motor’s Expansion in India

237
14.5.1 Hyundai Motor India (HMI) Limited
HMI was created in 1996 in Chennai and is a wholly owned subsidiary of Hyundai Motor Company. In second place, it holds approximately 20 % of the passenger car market, and has a fi rm position behind Suzuki. It has been noted that, since its estab-lishment in 1996, HMI was able to heighten its presence in the market with success-ful product strategies. Until 2005, most cars sold in the Indian auto market were variants of older models from advanced nations, but HMI introduced what was then
Table 14.9 Sales volume by manufacturer in India
Brand
Non-commercial vehicles Passenger cars Utility vehicles
2010 2011 2010 2011 2010 2011
Maruti Suzuki 1,065,732 997,281 908,742 844,001 156,990 153,280
Tata Motors 723,853 802,866 249,893 246,874 91,830 103,310
Hyundai 356,712 373,709 356,501 372,259 211 1,450
Mahindra & Mahindra
284,477 361,167 8,163 16,204 164,066 210,093
Toyota 74,762 136,148 11,307 73,094 63,455 63,054
GM 110,361 111,056 90,352 88,657 20,009 22,399
Ford 83,887 96,271 80,685 93,268 3,202 3,003
Ashok Leyland 80,474 84,720 – – – –
VW 32,626 78,410 32,623 78,404 3 6
Honda 62,872 47,548 62,204 47,222 668 326
Eicher Motors 35,464 45,229 – – – –
Skoda 20,135 30,741 19,729 28,569 406 2,172
Force Motors 24,088 28,336 – – 4,363 6,176
Nissan 7,161 22,893 6,719 22,585 442 308
Fiat 21,948 16,733 21,948 16,733 – –
SML Isuzu 11,287 12,783 – – – –
Piaggio Vehicles 9,553 11,188 – – – –
Asia Motor Works 6,008 9,478 – – – –
BMW 4,741 8,042 4,394 5,162 347 2,880
Hindustan Motors 11,136 5,890 8,279 3,545 2,451 2,141
M-Benz compact 4,210 5,634 3,945 5,003 265 631
Audi 2,449 4,718 1,762 3,656 687 1,062
Renault – 1,401 – 1,137 – 264
Volvo 1,670 1,360 – – – –
ICML 748 428 – – 748 428
M-Benz mid-size commercial
147 178 – – – –
JCBL 28 13 – – – –
Total 3,036,529 3,294,221 1,867,246 1,946,373 510,143 572,983
Source : Fourin: 2011 World Car Almanac
14.5 India’s Automotive Industry: Huge Opportunities and Increasing Competition

238
its latest model, the Santro, into the market, rapidly acquiring a large market share. HMI is also a source of exports for Hyundai Motor Company, the largest such exporter in India. It has built a supply chain of Korean parts suppliers to accompany its growth in production volume, and currently procures more than 90 % of its parts from local sources.
14.5.2 Tata Motors
Tata Motors, a member of the Tata Group, has maintained a market share of 60 % in trucks and buses. Internationally, the company has grown aggressively through M&As, acquiring Korea’s Daewoo in 2004 and forming Daewoo Commercial Vehicle Company Ltd., and investing in Spain’s Hispano Carrocera in 2006, before fully acquiring it in 2009. It purchased Jaguar/Land Rover (JLR) in June 2008, gaining footholds into the luxury car and SUV markets. Within the domestic vehicle market, its compact car, Indica, is a popular model, and it introduced the mini-car Nano in 2009. The company also plans on introducing a new car category that fi ts between the Indigo and Nano models. However, no increase can be seen in the market share of the Indigo in the compact category in which Maruti Suzuki and HMI are strong.
Renault Nissan Automotive India(2007)
Maruti Suzuki(1983)
Mahindra & Mahindra(1945)
Tata Motors(1945)
Hyundai Motor India(1996)
Ford India(1999)
Honda Siel Cars India(1995)
Toyota Kirloskar Motor(1997)
General Motors India(1994)
Mumbai
Delhi
Chennai
Hyderabad
Fig. 14.1 Locations of major car manufacturer in India
14 Suzuki Motor’s Expansion in India

239
14.5.3 Mahindra & Mahindra
In addition to automobiles, Mahindra & Mahindra is spread across a wide array of industries, including agricultural equipment, infrastructure development, and IT services. However, within the automotive industry, it is positioned somewhere in between the passenger and commercial vehicle markets, having a 50 % market share in the utility vehicle segment (its core model is the Scorpio). As for foreign partners, it formed a JV with Renault and introduced a low-priced mid-sized model called the Logan, although sales of this model have not been strong. The company is unique in terms of its new technological advancements and product development. For example, the company develops diesel hybrid vehicles. However, it is said that Indian market is not yet ready for hybrid vehicles.
14.5.4 Toyota Kirlroskar Motors
In 1997, Toyota entered into a JV with India’s Kirloskar Motors to form Toyota Kirlroskar Motors. For a long time, the JV operated in the Indian market with its SUV, the Innova, although the Indian market did not receive high priority from the Toyota Group at that time. However, in 2010, Toyota decided to capitalize the com-pact car market in India, an automotive hot spot, and introduced the Etios model, a car with a price tag in the INR 500,000 range. Sales of the Etios have been strong, with Toyota selling 70,000 in 2011.
14.5.5 Honda Siel
In 1995, Honda’s automotive division created a JV with India’s Usha International, calling it Honda Siel Cars India Limited. This company manufactures and sells the City and Accord, but even after more than 10 years since its formation, its annual production level remains at approximately 50,000–60,000 vehicles. With prices ranging from INR 670,000 for the City on the low end to INR 1.7 million for the Accord on the high end, Honda targeted the growing affl uent consumers with these models. The company introduced an even lower-end model called the Jazz in 2008 before introducing the compact Brio in 2011, which was priced lower than INR 500,000. The release of this vehicle coincided with the Bangkok fl oods, disrupting production in the latter half of 2011, after which Honda’s activities have been note-worthy. Honda’s local procurement rate at 70 % is lower than Suzuki’s and Hyundai’s, which are at more than 90 %, increasing this number to compete in the lower-priced models is important. In September 2012, Honda dissolved its JV announcing that it would move forward as a wholly owned subsidiary.
Suzuki’s broad lineup of models is ready to compete with these companies. The company is currently focused on compact cars (i.e., cars with lengths of less than
14.5 India’s Automotive Industry: Huge Opportunities and Increasing Competition

240
four meters and engines of less than 1.2 l) and because this category is subject to preferential tax treatment (excise tax lowered to 12 % versus the 24 %), sales vol-ume is expected to grow. This class of cars can be divided into three categories: (1) entry-level (800 cc class, such as the Maruti 800 and Alto); (2) A2 (1,000 cc class, such as the Wagon R and Hyundai’s i10); and (3) A2+ (1,200 cc class, such as the Swift and Hyundai’s i20). While the A2 is the most popular, the growth rate of the A2+ is also high. However, the A2+ category is very competitive, with Tata’s Indica, VW’s Polo, and Ford’s Figo vying for the same customers. Further, Nissan’s Micra (March), Toyota’s Etios, and Honda’s Brio also fall under this category, further intensifying competition.
Suzuki is also implementing its strategy to increase its lineup of cars for upper-class consumers. In 2009, it began selling a new model sedan, the SX4, and an SUV, the Grand Vitara (Escudo), and in February 2011 it introduced the Kizashi into the Indian market, a model previously sold in North America. The question that must now be answered by Suzuki’s management is how to allocate its limited manage-ment resources (Fig. 14.2 ).
Fig. 14.2 Price range of car by model in India (As of 2010) ( Source : various resources)
14 Suzuki Motor’s Expansion in India

241
14.6 Significance of This Case Study and Suggested Questions
This chapter discussed Maruti Suzuki, a case study of a Japanese company’s entry into the Indian market. Among India’s manufacturing industries, the automotive industry is the most watched, and many local subsidiaries of Japanese companies are in the automotive sector. Chapter 6 analyzed the Neemrana Industrial Park, which was built to attract auto parts suppliers into the Indian market. A detailed analysis has been conducted not only on Maruti Suzuki’s business, but also on the trends in the Indian auto market, competitors, and local business environments. Accordingly, the authors would like readers to examine management strategies, alli-ance strategies, marketing, and R&D as explained in this volume, and use these as materials to think about how the overall business strategies should be constructed.
Using this case study, we recommend exploring the following points to further deepen your understanding of global strategies:
• Why was Suzuki successful in India? The company decided to enter the India market in the 1980s, when it was still risky to do so. What were the primary fac-tors that led to Maruti Suzuki’s success? Why were these actions important?
• Summarize the competitive environment within India’s auto market using Porter’s fi ve Force model (explained in Chap. 2 ). Explain the strategy Maruti Suzuki should pursue based on that model.
• Explain Maruti Suzuki’s marketing strategy to date. How does the company seg-ment and target customers? Considering future market competition, what market strategy will be most appropriate for the company in the future?
Maruti Suzuki is planning on building an R&D center in India (in Rohtak, near Delhi). Is this a good decision? What in your opinion should this R&D center focus on? (refer to Chap. 11 for categorizations of overseas R&D activities)
Open Access This chapter is distributed under the terms of the Creative Commons Attribution Noncommercial License, which permits any noncommercial use, distribution, and reproduction in any medium, provided the original author(s) and source are credited.
References
Fourin (2011) World Car Almanac 2011, Fourin, Hagoya Japan Maruti Suzuki. (2011). Annual Report 2011. Japan: Suzuki Motors Ltd, Hamamatsu
References

243© The Author(s) 2015K. Motohashi, Global Business Strategy, Springer Texts in Business and Economics, DOI 10.1007/978-4-431-55468-4_15
15 Strategy Integration at the Global Level
15.1 Main Points of This Text and Remaining Topics
This chapter uses case studies of management strategy for effective global level operations to discuss how companies from advanced nations can incorporate emerg-ing countries experiencing rapid growth into their operating processes. There are two approaches to corporate strategy theory for maintaining sustainable competitive advantage against competitors over time: an approach focused on management resources held by the company (Barney 1986 , 1991 ), and on a theory of positioning that analyzes the competitive environment of a market to select the optimal position (Porter 1980 ). Extrapolating these corporate strategies to a global level requires an awareness of national barriers. While the earth may be becoming fl atter, there are still signifi cant economic and institutional gaps between advanced and emerging countries.
The world, while appearing to be fl at, still is somewhat rough due to national borders. Companies must make careful strategic decisions as to whether they will adapt to the local conditions of each market or pursue the benefi ts of scale in over-seas markets through aggregation using products made for global markets. In addi-tion, companies can use the above methods in combination with arbitrage, which leverages the gaps that exist between countries (see the explanation of the AAA framework in Chap. 2 for more details). The business environment in emerging countries is rapidly changing, so companies must not only use their own resources but must also consider partnerships with local companies to respond fl exibly (see the explanation of strategic alliances in Chap. 7 ). Furthermore, in order to be suc-cessful in the markets of emerging countries while going head to head with local competitors, companies from advanced nations with a technological advantage must formulate a technology management strategy and an appropriate marketing strategy catering to the local market. These basic concepts are discussed in Chaps. 9 and 11 .
So far, our discussions have examined the strategy to be adopted for specifi c countries, with a particular focus on China and India. This is because the differences
244
between domestic and global businesses are in terms of the operating environments that differ greatly by country, and it is appropriate for us to deal with examples that are as specifi c as possible, while keeping our target countries in mind. In particular, in Japan, with a homogeneous social structure focused on the Japanese, it can be diffi cult to be acutely aware of these differences. In Chap. 4 , we explained the politi-cal and business conditions in China and India, and included an overview of the economic progress made by each country. By using these case studies, it is hoped that the reader will understand the detailed context of the business environments in each country and be aware of the differences between these countries.
For global corporations, however, these country-by-country explications must ultimately be integrated into one overall business strategy. In doing so, companies must investigate the function of the headquarters, which so far have been rather vague. The company headquarters is the node that ties together various overseas entities within a global corporation and exploits synergies between the activities of these entities. In Chap. 2 , we used an I-R grid to explain the theory of balance between global integration at the headquarters and adaptation through local entities. It is easy to imagine that this balance will vary with the peculiarities of the countries in which these entities lie, but as a company becomes conscious of the diversity within these overseas companies, what form of organization should the company deploy overall? As our last remaining topic, we discuss strategy integration at the global level on the basis of our discussions to this point.
15.2 Knowledge Management in Global Corporations
For global companies, company-wide knowledge management is an important function of the headquarters. The term headquarters as used herein refers not to the company organization (groups indirectly connected to operations, such as HR, accounting, or legal) but rather the core of global operations that exist in a home country (in this case, Japan). For example, a company’s “mother factory” has the most advanced technology and is the core of manufacturing technology. When expanding manufacturing overseas, companies typically transfer production equip-ment and processes, as well as worker procedural manuals and other know-how from this mother factory to the new overseas factory. When launching the overseas factory, companies send many people specializing in production technology from the home country to provide instruction. Companies that offer low wages must, to a certain extent, adapt to local conditions, and in some cases perform tasks manually that would otherwise be machine operated in the home country, despite the typical fl ow of knowledge from the home country (e.g., a mother factory) to the local fac-tory. However, work procedures within factories are constantly being improved as part of total quality control (TQC), and in case a local factory discovers better ways of performing tasks, it will be spread across the company via the headquarters.
The headquarters takes a leading role in product development, since personnel, technology, intellectual property (IP), and product development know-how reside there. For example, for products in which the production process must be considered
15 Strategy Integration at the Global Level

245
in the product development phase, some level of work can be done overseas, since certain countries will have a production function. The automotive industry is a typi-cal example of this, and Japanese manufacturers have created manufacturing cen-ters with a certain amount of scale in Europe and the US. Recently, steps have been taken to create manufacturing facilities in emerging countries such as China, Thailand, and India. Wages in these countries are low, thereby allowing companies to reduce their development costs by operating there. In either case, development centers at the headquarters play a central role, and knowledge fl ows from the head-quarters to the overseas facilities. However, as can be seen in the reverse innovation examples of Chap. 11 , in certain cases, companies can develop new products at facilities in emerging countries, expand sales to other emerging countries, and even sell these products in the home country. In these cases, knowledge creation is facili-tated in the local markets, which is fed back to the home country, thereby creating a reverse knowledge fl ow.
The headquarters plays an important role as the central node in a global corpora-tion to control the company-wide fl ow of information so that the necessary knowl-edge can be put to use where it is needed. This information fl ow is not limited to the internal corporation. Production divisions have relationships with equipment manu-facturers, product development divisions work with parts and materials manufactur-ers, research divisions partner with universities and their counterparts in other companies, and information is exchanged on a daily basis with all of these external organizations. Knowledge obtained from external overseas partnerships is incorpo-rated within all relevant local entities, but some of this information should be shared across the company, which is the role of the headquarters. As we consider these external relationships, maximizing the internal information fl ow is not necessarily the best course of action. In these exchanges with external parties, companies should avoid leaking important technologies and information that are key to competitive advantage. Technology information control is important in keeping these so-called technology leaks from becoming detrimental. The strict implementation of policies to stop leaks and ensuring that all employees are aware of them is the responsibility of the headquarters. Companies may fi nd it necessary to decouple information sources internally in an effort to limit access to important information to certain employees.
Companies must also keep in mind the costs associated with knowledge transfer. For example, in the production technology case discussed above, the mother factory is aware of the different types of production equipment and production processes, and maintains the work procedure manual. But in reality, there is also a great deal of implicit knowledge, requiring companies to send specialists on-site from the mother factory to provide instruction. In addition, companies can provide appropri-ate training required by local factory workers depending on their skills and knowl-edge. These expenses cannot be ignored. Within the fi eld of business management, companies are defi ned as organizations that hold knowledge accumulation and the “knowledge-based theory of the fi rm” (Kogut and Zander 1992 ) defi nes the effi -ciency of knowledge propagation within an organization as an organizational capa-bility. In this theory, the costs of knowledge propagation is said to correlate with low
15.2 Knowledge Management in Global Corporations

246
codifi ability, high complexity, and low teachability. However, overcoming these obstacles and facilitating information fl ow within an organization is a paradox because the process can be easily imitated by competitors. Accordingly, combina-tive capabilities (Kogut and Zandar 1992 ), which create new innovation in conjunc-tion with existing knowledge, are important from the perspective of a company’s sustained competitiveness. A global company’s headquarters incorporates the new knowledge required to expand in each country from the production, development, and research functions, in addition to domestic knowledge, and plays a key role in integrating this knowledge and strengthening operations.
Most case studies in this text have been examples of companies from advanced countries expanding to emerging countries. In these cases, the business environ-ments between the two countries are vastly different, thereby lowering the ease of propagation, resulting in an increase in the information propagation costs. When creating wholly owned subsidiaries, companies hire local employees with high potential and can expect effi cient operations with the help of proper training. However, this is incredibly diffi cult for companies that enter via joint ventures with local companies because of the necessity to bring together knowledge from two organizations. Thus, for operations expanding overseas with high costs of knowl-edge transfer, a wholly owned subsidiary is generally a more effi cient option (Kogut and Zander 1993 ). On the other hand, because companies expanding overseas via a partnership with a local company face great diffi culties, if a company can develop the ability to effectively manage the partnership, they may realize tremendous com-petitive advantage. Companies must gain experience with international alliances, including those entered into with companies from emerging countries, create a knowledgebase, and then leverage that knowledge in new projects. By developing an alliance management capability, as described in Chap. 7 , companies will fi nd themselves with a greater range of options that will be important for them as they set global strategies using wholly owned subsidiaries or joint ventures.
15.3 Diversity in Overseas Entities
Creating strategy integration at the global level requires an understanding of the diversity among a company’s overseas entities, as corporate-wide knowledge man-agement implemented by the headquarters varies depending on the activities in each overseas base. For example, companies that conduct R&D overseas can use home- base augmentation (HBA), which increases the IP in the home country by incorpo-rating the latest technology from local markets, or home-base exploitation (HBE), which creates new overseas markets on the basis of technology from the home country (refer to Chap. 11 of this paper for more details). In the case of Japanese companies, those that conduct research in Silicon Valley or form partnerships with local universities and high tech ventures are examples of the former, while locally developing consumer electronics products tailored to the Chinese market corre-sponds to the latter. The former focuses on incorporating knowledge as part of head-quarters knowledge management and is discerning of knowledge as a necessary
15 Strategy Integration at the Global Level

247
capability to that end. On the other hand, the latter case takes core technology required for local development and pours it into local entities, making it important to understand a broad range of company-held technologies. In other words, the capabilities required by the headquarters vary with R&D objectives, and companies cannot respond by using homogeneous personnel or the knowledge management method.
The diversity of overseas entities is due to the differences in socioeconomic cir-cumstances in target countries. There are major differences between environments in advanced and emerging countries, but as shown in Chap. 4 ’s comparison of China and India, a great diversity within emerging countries is also evident. Using the example of R&D centers, activities may differ because of a multitude of factors such as technology levels of universities and companies in the target country, num-ber of skilled engineers and average wages, and IP systems. In addition, the com-petitive environment in local markets has a major impact on the management of local entities. If a local entity has already created a competitive position relative to competitors, the headquarters does not need to intrude on the local entity. However, if that is not the case and if strategic priority is high in the target country, the head-quarters must shore up whatever strategic advantages the home country may have.
Table 15.1 summarizes the varieties of local bases and the differences in manage-ment of the local entities. The vertical axis indicates the differences in operating environments between home and target countries, while the horizontal axis indi-cates the level of relative competitiveness of the local entity. This chart is inspired by that of Bartlett and Ghoshal ( 1989 ) that indicates the strategic importance of a target country on the vertical axis and the distances according to the CAGE frame-work (see Chap. 2 ). In addition, it conforms to this text, which focuses on global strategy for emerging countries. In the case of small differences in operating envi-ronments, companies can choose normal management strategies regardless of national borders. In other words, in case of high competitiveness among local enti-ties, companies must learn the reason behind that strength and leverage it within the headquarters, whereas if strengthening the local entity becomes necessary, then the headquarters must take the lead.
A problem arises in cases where differences in operating environment between advanced and emerging countries are large. First, in case of high local entity com-petitiveness, companies should allow local entity autonomy in its operations. However, headquarters must not provide a completely free rein but rather analyze
Table 15.1 Comparison of overseas subsidiary by type
High local entity competitiveness Low local entity competitiveness
Small differences in operating environment compared with home country
Learning from local entity Shoring up local operation by the headquarters
Large differences in operating environment compared with home country
Roll out of autonomous operations and globalization of local entity
Partnerships with local companies
15.3 Diversity in Overseas Entities

248
the strengths of the local entity and reference that example in other target countries with similar operational environments—a global roll out. On the other hand, com-panies fi nd it diffi cult to respond in case of low local entity competitiveness. Because local circumstances are different from those in the home country, the likelihood of making improvements through efforts led by the headquarters is low. In this case, it is more effective for companies to form partnerships with local companies, thereby enabling a better understanding of the business environment in the target country and an analysis of any failures.
Major Japanese manufacturers typically have multiple overseas operations. In addition to Europe and the US, they have entities in China and Southeast Asia. Many of these companies also have operations in India, South and Central America, and other areas. Corporate strategies differ according to prioritized regions, but from the perspective of risk dispersion, companies are not likely to choose an over-seas strategy that centralizes operations in one location. Thus, headquarters must account for a variety of circumstances in the management of its overseas operations. According to the classifi cations listed in Table 15.1 , the size of differences in oper-ating environments with the home country affects the skills required in the head-quarters function. Particularly where there are large differences in the operating environment, companies must think of fl exibility in regard to the local entity. The one-way management of knowledge fl ow from the headquarters to the local entity that is typical in Japan does not work well. Global strategies should not be homoge-neous across an entire company but must share an awareness of regional and national diversity at the top levels of the company.
15.4 Organizational Structure Within Global Corporations
What type of organization is best for a company that wants to operate diverse local entities effi ciently company-wide? Recall the balanced circle of authority for head-quarters and local entities according to the I-R grid explained in Chap. 2 . Companies can be classifi ed into organizations that operate homogenously across the world with headquarters taking the lead (global corporations typical in Japan), organiza-tions with groups of companies in each country (multinationals, typical in Europe), and international organizations in between (typically seen in the US). Figure 2.7 of Chap. 2 also described another type of organization—the transnational. This orga-nization combines global integration with local responsiveness.
Transnational corporations were described by the creators of the I-R grid, Bartlett and Ghoshal, as being ideal (Bartlett and Ghoshal 1989 ). This type of organization maintains local entity diversity while maintaining company-wide effi ciency in increasing global learning ability. This chapter’s discussions on the role of the head-quarters in strategy integration as has been previously described are based on dis-cussions of this learning ability. However, the book authored by Bartlett and Ghoshal was published in the 1980s, during which discussions on multinational corporations focus on the advanced regions of Japan, the US, and Europe. In today’s world, emerging countries are on the rise, and the focus of global business is transitioning
15 Strategy Integration at the Global Level

249
from advanced countries to newly developing countries such as China and India. Thus, companies must integrate strategies regarding organizational structure for global companies to account for advanced countries as well as local entities with completely different business environments. A perspective of globalization rollouts and partnerships with local companies is required, as is shown in Table 15.1 . In other words, in addition to a mindset focusing on the headquarters, as is assumed by transnational organizations, companies will require strategies in the basis of local entities as well. However, the two must not be combined irrationally. Companies must accept diversity and include variation within their strategies.
Metanational corporations have organizational structures that eliminate all con-cepts of the headquarters in global corporations (Doz et al. 2001 ). The concept truly transcends the “state.” Asakawa ( 2011 ) cites STMicroelectronics (Italy and France) and Nokia (Finland) as examples of metanationals. Neither of these companies have large markets in their home countries. Specifi cally because they are “companies born in the wrong place,” they have built up competitive strengths that do not rely on nationality, and accrue technology from throughout the world. However, this concept has its limitations. Asakawa ( 2011 ) raises seven problems, and among them, the underestimation of knowledge propagation costs is critical. As we have heretofore explained, there is much implicit knowledge among the total knowledge required to run a company and its cost of propagation is signifi cant. Technology cannot be freely transferred from overseas only because a home country does not have one. It is economically rational for global companies to have a home country concept to gather knowledge in one place.
In a related area, it is worth noting the “hollowing out” of industries that often accompanies the globalization of business activities. Despite the national barriers, it is evident that the world is becoming fl atter. In the process, business activities will become global as a matter of economic rationale. There are an increasing number of companies taking high value added activities, such as R&D, in addition to transfer-ring production overseas. However, as we have seen throughout this text, while overseas R&D activities can take on diverse forms, they increase the competitive-ness of the company on an overall basis by strengthening cost structures and over-seas markets. Thus, viewing this as an issue of hollowing out is incorrect. Most IP and know-how used in R&D, as well as intangible assets that are sources of corpo-rate value, including technology embodied in personnel, are stored as implicit knowledge, and carry with it costs when transferred across international borders. Accordingly, it makes economic sense to keep core knowledge in a company’s home country. In that sense, the overseas expansion of Japanese companies has not resulted in a hollowing out. Rather, by establishing overseas R&D centers, compa-nies can take excellent local technology and ideas for innovation, and make the home country knowledgebase much stronger. According to the results of an interna-tional survey comparing the activities of the R&D centers of Japanese, European, and US companies in China, Japanese companies have been slower than their Western competitors in forming partnerships with local universities and companies (Motohashi 2011 ). The opportunities presented by globalization are available to Japanese companies and their competitors from Europe and the US in equal
15.4 Organizational Structure Within Global Corporations

250
measure. Note that in case of movements to obstruct the globalization of Japanese companies because of a belief in a hollowing out, they will become an impediment to the international competitiveness of these Japanese companies, and there is an extreme danger of this damaging the national economy.
We return to the main topic of this chapter—optimal organizational structures for global corporations. As has been heretofore explained, while theories abound on the matter, currently nothing conclusive has been found in academic literature. Global business environments are becoming increasingly complex because of the rise of emerging countries, and perhaps the reality is that diversity makes it impossible to explain it using a single model. Nevertheless, if one direction is to be proposed, we believe that the middle path between hierarchical and network organizational struc-tures is optimal. Figure 15.1 shows both schematics of these organization types.
The hierarchical structure centers on the headquarters and can be seen in many multinational companies with multiple local entities. Companies can be classifi ed as global, international, or multinational, according to the I-R grid, and depending on the level of authority granted to local entities by the headquarters. The hierarchi-cal structure concentrates core management resources and knowledge at the head-quarters, with the local entities working on that model, and assumes a one-way fl ow of knowledge from the headquarters to the local entities. In contrast, a network structure does away with the lord–retainer relationship between the headquarters and local entities, and connects global entities in the form of a network. From the perspective of accountability to stakeholders, this type of corporate organization is impossible, but is discussed to explain the hybrid organization. However, the
H
H
Local Entity A
Local Entity B
Hierarchical Organization
Network OrganizationHybrid Organization
Fig. 15.1 Comparison of organization of global corporations
15 Strategy Integration at the Global Level

251
concept of a metanational corporation that does away with the idea of a home coun-try is similar in structure to the hybrid organization.
When viewing companies as entities that create and capture knowledge at the global level to innovate from their union, both the hierarchical and network struc-tures have their own failings. First, the hierarchical structure does not make use of activities to create and capture knowledge within local entities. As we have repeat-edly stated throughout this text, there is a strong likelihood of successes in the home country not being extendable to local markets due to the primary battlegrounds of global businesses shifting to emerging countries, where business environments are vastly different from advanced countries. In this case, local knowledge is critical, as in the case of reverse innovation. On the other hand, network structures have more links (connecting bases) than the number of nodes (number of bases), making infor-mation propagation costs prohibitively expensive. It also includes the fundamental problem of having unclear decision-making mechanisms for the overall company.
Accordingly, in regions with business environments signifi cantly different from that in the home country, companies should select structures that establish regional centers bundling a certain number of bases and manage these regional centers at the headquarters. As indicated in Fig. 15.1 , a network structure has headquarters and regional centers, and a hybrid structure has a hierarchical structure for the remain-der. However, as the number of regional centers increase, the information propaga-tion costs within the core network increase. Thus, these regional centers should be kept to the absolute minimum. The key point is that the headquarters and the regional centers are connected by the network structure. If we move this to a hierar-chical structure of the headquarters dictating to regional centers, then we face a high likelihood of worsened effi ciency compared to a headquarters-centered organiza-tion, from the perspective of information processing ability. In regional centers with business environments that differ from that in the headquarters, companies should prioritize the fl ow of knowledge from regional centers to headquarters by granting the regional centers a certain level of autonomy. Also, within the core network orga-nization, it is important for companies to work on strategy selection and execution, with an awareness of diversity within the overall corporate business strategy.
15.5 Conclusion
In summary, we have explained ways to manage diverse overseas entities from the perspective of corporate knowledge management, using the issue of the overall inte-gration of global strategies. According to the lifecycle theory in terms of globaliza-tion of corporate activities, companies can begin by exporting parts and services, then move each part of the corporate value chain, such as procurement, production, and sales, to overseas entities, and then create integrated entities that include R&D functions. Many large corporations in advanced countries, including those in Japan, have already reached this fi nal stage, and have reached a point of maturity in regard to globalization within advanced countries. In addition, the rise of emerging coun-tries such as China and India in recent years has been dramatic, and considerable
15.5 Conclusion

252
investments have poured into these countries. Among the changes in business envi-ronments within global corporations, increasing importance has been given to the bi-directional fl ow of knowledge that considers the heterogeneity of local entities and incorporates local innovation across the company, rather than the one-way fl ow of information from headquarters to local entities. As a result, we state that organi-zational structures for global corporations should move from hierarchical structures with the headquarters at the center, to a hybrid structure (i.e., a fusion of a hierarchi-cal structure and a network structure) that centers on a core network of the head-quarters and important regional centers.
We conclude this chapter by discussing the issues of diversity and fl exibility in management strategy. In this chapter, we repeatedly declared the importance of cre-ating strategies in response to business environments that differ by country, and the importance of a corporate-wide strategy that leverages this diversity. However, it is evident that corporate-wide integrity is also necessary. The issue is in how to engen-der a sense of belonging in a part of a company while respecting varied values and behavioral norms on the basis of different business environments. One possible way is for the company to have a clear vision. However, a vision is an abstract concept, and companies must have clear overall objectives, regional centers, and overseas entities, and must also clarify assessment standards and decision-making processes as much as possible. In this regard, Japanese corporations have operated with cor-porate implicit knowledge on the basis of long-term employment relationships, and these corporations must consciously work on a multi-dimensional hybrid-style organization that includes overseas entities.
In addition, company fl exibility is important in executing management strate-gies. Particularly for high-growth emerging countries, business environments are constantly changing, whereas global expansions are often long-term investments. Across all case studies included in this paper—Hitachi Construction Machinery, Shiseido, and Suzuki Motor—it took more than 10 years for a local entity to gener-ate profi t. These case studies examine China and India, prior to our now-fl attened world; thus, the 10-year fi gure must not be taken too seriously. However, overseas expansions must certainly be implemented as a long-term perspective than as a new domestic business. Long-term investment in a highly uncertain world requires highly fl exible strategies from the perspective of risk management. In that regard, companies take a fl exible approach to partnerships with local companies rather than attempting to do business on their own. In addition, having a long-term strategy is important, but companies must have the fl exibility to change strategies in response to great changes in business conditions. Success stories of the past depend on a company’s core competencies; however, in times of volatile change in business environments, it likely that these will lead to core rigidities (Leonard-Barton 1992 ). Further, it is clear that, in Japan, the management policies used in the past are not appropriate for emerging countries with vastly differing business environments. For business managers, an era that demands free and fl exible thinking has arrived.
Open Access This chapter is distributed under the terms of the Creative Commons Attribution Noncommercial License, which permits any noncommercial use, distribution, and reproduction in any medium, provided the original author(s) and source are credited.
15 Strategy Integration at the Global Level

253
References
Asakawa, K. (2011, October). Global R&D management . Tokyo: Keio University Publishing Co. Barney, J. B. (1986). Strategic factor markets. Management Science, 32 , 1231–1241. Barney, J. B. (1991). Firm, resources and sustained competitive advantage. Journal of Management,
17 , 99–120. Bartlett, A. C., & Ghoshal, S. (1989). Managing across borders: The transnational solutions .
Boston: Harvard Business Press. Doz, Y., Santos, J., & Williamson, P. (2001). From global to metanational: How company win in
the knowledge economy . Boston: Harvard Business School Press. Kogut, B., & Zander, U. (1992). Knowledge of the fi rm, combinative capabilities, and the replica-
tion of technology. Organization Science, 3 (3), 383–397. Kogut, B., & Zander, U. (1993). Knowledge of the fi rm and the evolutionary theory of the
multinational corporation. Journal of International Business Studies, 24 , 625–645. Leonard-Barton, D. (1992). Core capabilities and core rigidities: A paradox in managing new
product development. Strategic Management Journal, 13 , 111–125. Motohashi, K. (2011, August). Measuring multinational’s R&D activities in China by patent
database: Comparison of European. Japanese and US fi rms, a paper presented at Academy of Management conference, San Antonio.
Porter, M. E. (1980). Competitive strategy: Techniques for analyzing industries and competitors . New York: Free Press.
References
255© The Author(s) 2015K. Motohashi, Global Business Strategy, Springer Texts in Business and Economics, DOI 10.1007/978-4-431-55468-4
A AAA , 139 “AAA” framework , 30, 31, 33–36, 39, 73, 139,
141, 147, 243 Adaptation , 30–36, 139, 147, 149, 244 Aggregation , 30–36, 52, 139, 147, 152, 243 Aging population , 49 AIDMA , 144, 145 AISAS , 145 Alliance execution phase , 108, 111, 113 Alliance formulation phase , 111 Alliance management , 107, 113, 115, 118, 246 Alliance partner , 107, 110–118 Arbitrage , 30–34, 36, 139, 243 Art of War , 23 ASEAN Free Trade Agreement (AFTA) ,
34, 211 Asia Model , 45 Association of Southeast Asian Nations
(ASEAN) , 3, 9, 34, 43, 176, 177, 211, 213, 217, 218, 221
A-Star , 202, 227, 231, 232, 234 AUPRES , 34, 142, 150, 155, 162, 163, 165,
166, 170
B B2G2C business , 75 Bharatiya Janata Party (BJP) , 67, 96 Big data , 145, 146 Board of Investment (BOI) , 212, 214 Bottom of the pyramid (BOP) business ,
16, 138, 151–153 BRICs , 46
Build, operate, and transfer (BOT) , 88, 115 Business-to-business (B2B) , 81, 149
C CAGE framework(s) , 26, 28, 30, 33, 137–140,
171, 183, 247 Cannibalization , 150 Capital accumulation , 44, 47, 49, 55 Capital transactions , 110, 111 Caterpillar , 121, 122, 130, 131, 133, 134 Center-for-global , 180, 193 Centers of excellence (COE) , 206 Central Research Center , 178 Channels , 23, 70, 72, 98, 107, 109, 111, 112,
126, 128, 132, 137, 138, 143, 150, 152, 153, 155, 156, 158, 161, 163–165, 167, 169–171
Chasm , 141 China Plus One , 65 Chinese International Economic Trade
Arbitration Committee (CIETAC) , 126 Chinese media regulations , 73 Communist Party , 66–68, 70, 71, 75 Comparative , 36, 58–71 Competitive Advantage of Nations , 50 Complex systems , 13, 70, 88 Contract-based transactions , 110 Co-option , 118 Corporate social responsibility (CSR) ,
76, 117, 156, 164 Co-specialization , 118 Cost competitiveness , 6–11, 32, 78, 83, 94,
101, 148, 202
Index

256
Coup de’état , 75 Cream-skimming , 143 Cultural revolution , 59, 62 Culture, Administration, Geography, and
Economics (CAGE) , 13, 26–28, 30, 33, 39, 55, 57, 137–141, 171, 183, 185, 247
Customer value model , 12, 13, 15, 16, 39, 79–81, 90, 137, 150
D Deal formulation , 112 Delhi Mumbai Industrial Corridor Project
(DMIC) , 96–98, 102, 103 Deng Xiaoping , 59, 60, 62, 66, 68, 123 Denso , 202, 215, 217, 233 Design concepts , 81–83 Destructive innovation , 8, 12, 78, 86, 148 “Detroit of Asia” concept , 212 Diamond model , 50 Diffusion model of innovation , 141 Disintermediation , 143 Diversifi cation , 139, 141, 156 Division of labor , 83, 86, 181, 187, 220 DMIC Development Corporation (DMICDC) ,
97, 98 DMIC Master Plan , 97, 98 Doosan Infracore , 131, 132 Douglas North , 57 Dynamic capability theory , 25 Dynamic random-access memory (DRAM) ,
77, 78
E Economic growth theory , 41, 44, 45 Economic zones , 27, 34, 60–64, 66, 68, 199 80s generation , 166 Electronic manufacturing services (EMS) , 83 Emerging countries , 4–6, 15, 71, 72, 107–109,
115, 117–119, 137–138, 140, 143, 145, 146, 148–150, 203, 204, 207, 243, 245–248, 250–252
Encapsulation of information , 86 Endogenous economic growth , 44, 45 Engineering, procurement, and construction
(EPC) , 116 Estée Lauder , 165, 167–169, 171 European Union (EU) , 3, 89 Everett M. Rogers , 141
F Factory(ies) of the world , 29, 59, 64, 177, 191,
192, 196
“Five Force” model , 24, 241 Formal institutions , 57, 58, 74–76
G GE Healthcare , 184–186, 201, 203–204, 206 General Agreement on Tariffs and Trade
(GATT) , 3 Ghemawat, P. , 13, 26, 30 Global integration , 35–38, 40, 244, 248 “Globally integrated” form of
organization , 110 Globally linked , 180, 183, 204 Good enough market , 8, 78, 79, 81, 138,
148–150, 153, 173 “Good-enough” product markets , 6–8, 14, 16,
78, 79, 81, 90 GPS monitoring systems , 130 Grameen Bank , 151 Gross National Happiness (GNH) , 54
H Haruyoshi Fukuhara , 162 Hefei Mining , 121, 123–126 Hierarchical structure , 202, 232, 250–252 Hindustan Unilever , 152 Hitachi Construction Machinery (China) ,
16, 108, 121–135, 252 Hollowing out , 249, 250 Home Base Augmenting (HBA) , 175, 179,
181, 182, 246 Home Base Exploiting (HBE) , 175, 180–182,
201, 246 Honda Siel , 235, 239–240 Huawei Technologies , 69 Hybrid structure , 251, 252 Hyundai Heavy Industries , 131–133 Hyundai Motor India (HMI) Limited , 237–238
I IMD , 41, 49–54 IMD rankings , 50 Indian National Congress , 67 India’s Automotive Industry , 109, 234–240 Indigenous innovation , 58, 71, 177 Industrial Technology Research Institute
(ITRI) , 218 “Informal” institutions , 57, 58, 74–76 Informal rules , 58, 59, 71, 74 Infosys , 1–3, 47, 68, 70 Inland container depot (ICD) , 98 Innovator’s Dilemma , 8, 12, 78, 79, 81,
148, 149
Index

257
Institutional analysis , 58–71 Institutional economics , 57, 58, 74 Institutional voids , 71–75, 107, 185 Intangible assets , 44, 249 Integral architecture , 82, 86, 87, 91 Intel India Development Center , 201, 206 Intellectual property rights , 11, 81, 82 International competitiveness , 41, 45, 49, 50,
52, 54, 84, 250 I-R (integration responsiveness) grid , 35
J Japan Railways , 89, 91 Japan’s competitiveness ranking , 54 Jawaharlal Nehru , 59, 99 John F. Welch Technology Center (JFWTC) ,
200, 201, 203, 206
K Knowledge-based theory of the fi rm , 245 Knowledge transfer , 245, 246 Komatsu , 80, 81, 121, 122, 130–134
L License Raj , 61, 70 Local development (R&D) , 16, 173, 175, 177,
178, 180, 182, 186, 192, 196, 204, 217, 232–234, 247
Local-for-global , 185, 204, 205 Local-for-local , 180, 184–186, 193, 196, 201,
204, 205 Local Growth Team (LGT) , 186, 204 Locally-for-global , 180, 184, 198 Local R&D centers , 188, 204–208 Local responsiveness , 35, 37, 38, 40, 248 Logistics , 32, 51, 72, 93, 103, 104, 107,
134, 144 Long-term economic growth , 41–47 L’oréal , 166–169, 171
M “Made by Hitachi” brand , 121 Mahindra & Mahindra , 227, 233, 235, 239 Management strategy , 15, 16, 21–35, 39, 118,
141, 243, 252 Mandis , 73, 74 Mao Tse-tung , 59 Market
development , 139, 141 penetration , 139, 234
penetration pricing , 143 segmentation , 132, 140, 144, 145, 153, 224
Maruti 800 , 223, 227, 231, 240 Maruti Driving Schools (MDS) , 232 Maruti Suzuki , 65, 94, 100, 201–202, 223,
224, 227, 229–235, 237, 238, 241 Metanationals , 249, 251 Metro Cash and Carry , 73 Michael Porter , 33, 50 Microsoft Research Asia , 183 Ministry of Economy, Trade and Industry
(METI) , 87, 103, 185, 203 Mission , 22, 23, 205–207 Mission, objectives, strategies, and tactics
(MOST) , 22 Modular architecture , 82, 83, 86, 90 Modularization of product architecture ,
82, 83, 86 Mother factory , 244, 245 Muhammad Yunus , 151
N Nano , 95, 223, 235, 238 National Capital Region (NCR) , 94, 95 National Innovation Survey , 11 National People’s Congress , 67, 125 National Science and Technology
Development Agency (NSTDA) , 16, 211–221
Neemrana Industrial Park , 2, 3, 16, 93–104, 241
Network structures , 204, 250–252 New Energy and Industrial Technology
Development Organization (NEDO) , 102
Noida Business Park , 95 Nongovernmental organizations (NGOs) ,
138, 151, 152, 154, 215, 216 North American Free Trade Agreement
(NAFTA) , 3 North Bangkok Science Park (NBSP) , 214 “Not invented here” syndrome , 118
O Objectives , 14, 15, 21–23, 30, 58, 71, 75, 117,
118, 152, 153, 174, 180, 188, 195–197, 199, 207, 247, 252
Offi cial development assistance (ODA) , 97, 118
Off-take risk , 117 Open access policy for railroads , 89 Operational risk , 75, 115
Index

258
Operation and management (O&M) , 116, 117 Original brand manufacturers (OBMs) , 83 Original design manufacturers (ODMs) , 83 Original equipment manufacturers (OEMs) ,
83, 159, 224
P Panasonic , 12, 31, 32, 37–39, 148, 150, 180 Path dependency , 58 Pearl River Delta , 196 Pearl River Delta area , 28, 29 Per capita GDP , 4, 5, 7, 13, 28, 41–45, 48, 49,
51, 54, 55, 60 Philips , 37, 113 Plaza Accord , 8, 174, 175, 212 Polyplastics Technical Solution Center ,
217–218 Portable ECG , 201, 203 Positioning theory , 21, 24, 25, 39 Poverty penalty , 151 PPP agreement , 114–117 Premium markets , 147–150, 153 Price elasticity , 142, 143 Procter & Gamble (P&G) , 142, 152, 167,
169–171 Product architecture , 81–86, 90 Product-centric , 79–81, 90 Product development , 8, 11, 12, 23, 31–33, 36,
38, 39, 138, 139, 164, 177, 178, 180, 181, 183, 185, 187, 188, 195, 198, 201, 203, 206, 215, 217, 239, 244, 245
Product market matrix , 139, 141 Product model , 12, 13, 15, 16, 39, 81, 89,
137, 150 Product’s lifecycle , 12, 90, 143 4Ps of marketing , 138, 141, 142 Public–private partnerships (PPPs) , 16, 88, 98,
108, 114–119, 152 Public relation (PR) , 145 Public welfare , 115 Purchasing power parity (PPP) , 51, 147
R Railway transportation service , 88 Rainwater harvesting laws , 99 Rajasthan , 2, 93–97, 100, 103 Rajasthan State Industrial Development &
Investment Corporation Ltd. (RIICO) , 96, 99–102
Relationship with the government , 75, 163, 223 Resource-based management strategy
theory , 24 Reverse innovation , 174, 184–187, 201,
203–204, 206, 245, 251
Ridership clause , 117 Risk management , 59, 75, 104, 110, 252 Risk-sharing optimization , 116 Robert Solow , 44
S Sany Group , 133 Service-Centered Logic for Marketing , 79 Service-centric model , 80, 81 Service model , 12, 13, 15, 39 Shakti , 152 Shinzo Fukuhara , 156 Shiseido China Co., Ltd , 164 “SHISEIDO” global brand , 34, 155, 160,
165, 170 Shiseido Thailand , 215–217 Silicon Valley , 33, 175, 176, 179, 192, 246 SK II , 165, 167, 169, 170 Smart factory , 98, 102–104 Smart grids , 102 Society of Indian Automobile Manufacturers
(SIAM) , 202 Solar panels , 6, 12, 13, 78, 84 Southern tour speech , 60, 62, 64, 123 Special purpose company (SPC) , 88, 98,
114–116 State-Owned Assets Supervision and
Administration Commission (SASAC) , 68–69
State-owned corporations , 63, 68, 71 Strategies , 1–17, 21–42, 45, 55, 57, 59, 65, 72,
75, 83–85, 87, 90, 134, 135, 138, 139, 143, 146, 147, 149, 150, 152, 155, 156, 171, 218, 224, 237, 241, 243, 246–249, 251, 252
SWOT analysis , 23–25, 138, 141 System integrator , 87, 88, 90
T Tactics , 23 Targeting , 16, 37, 140, 145, 147, 149, 152,
153, 155, 163, 166, 181, 205, 207 Tata Group , 68, 70, 74, 134, 198, 238 Tata Motors , 58, 68, 70, 95, 223, 227, 234,
235, 237, 238 “Technological acquisition” R&D ,
175, 177–179, 182, 192, 196, 207 Technological catch-up , 78, 81–85, 153 Technology spillover effects , 44 Three Cs , 23–25 Tier 1 supplier , 202, 232 Total factor productivity (TFP) , 47 Total quality control (TQC) , 244 Tournament games , 71
Index

259
Toyota Kirloskar Motors , 235, 239 Trust , 71, 113, 115, 130, 162, 166, 228 Turnkey systems , 6, 12, 84
U UNCTAD survey , 191 United Progressive Alliance (UPA) , 67 UN population estimates , 5, 47
V Value chains , 32–35, 148, 150, 251 Volume zone , 8, 35, 78, 90, 138, 146, 147,
149–150, 153 VRIO framework , 24
W Wholly owned fi rms , 64 World Bank , 45, 65, 152 World Competitiveness Yearbook ,
49–54 World Economic Forum (WEF) , 49 The World Is Flat , 1–3, 31, 47, 68 WTO , 1, 3, 9, 22, 29, 34, 47, 58,
60, 61, 63, 64, 75, 144, 164, 175, 192
Z ZAXIS60 , 125, 127 Zhongguancun district , 192 Zhu Rongji , 68
Index


![[Title] [Instructor] Chiaki Kagawa / Nobutaka Motohashi ... · [Code] [Credits] [Program] [Semester] [Hours] [Language of instruction] 410510 B 2 Human Environment Medical Engineering](https://img.pdfslide.us/doc/110x75/5d5181f688c99378448bcd90/title-instructor-chiaki-kagawa-nobutaka-motohashi-code-credits.jpg)


![Kazuyuki Aihara arXiv:1206.4557v2 [physics.soc-ph] 3 Apr 2013](https://img.pdfslide.us/doc/110x75/620618186a76532a540832e7/kazuyuki-aihara-arxiv12064557v2-3-apr-2013.jpg)