Embed Size (px)
Citation preview


Russian Ministry of Education and Science Russian Academy of Science
Federal Agency for Science and Innovations Kazan State University
Zavoiskii Physical-Technical Institute Bruker Ltd (Moscow)
ACTUAL PROBLEMS OF MAGNETIC RESONANCE AND ITS APPLICATION
XII International Youth Scientific School
Program
Lecture Notes Proceedings
NEW ASPECTS OF MAGNETIC
RESONANCE APPLICATION
Kazan 5 – 9 October 2009
KAZAN STATE UNIVERSITY 2009

The administration of School
Professor M.S. Tagirov (KSU, Kazan) — rector Professor V.A. Zhikharev (KSTU, Kazan) — vice-rector
V.K. Voronkova (KFTI RAS, Kazan) — scientific secretary I.P. Volodina (KSU, Kazan) — secretary
The program committee
The chairman Professor V.A. Atsarkin (IREE, Moscow)
Committee members
Professor A.V. Aganov (KSU, Kazan)
Professor B.I. Kochelaev (KSU, Kazan) Professor I.V. Ovchinnikov (KFTI RAS, Kazan)
Professor K.M. Salikhov (KFTI RAS, Kazan) NEW ASPECTS OF MAGNETIC RESONANCE APPLICATION. Proceedings of the XII International Youth Scientific School “Actual problems of magnetic resonance and its application”, 5 – 9 October 2009, Kazan. Edited by professor M.S. Tagirov (Kazan State University) and professor V.A. Zhikharev (Kazan State Technological University). – Kazan: Kazan State University, 2009. – 232 p.
The reports of young scientists submitted on XII International Youth
Scientific School “Actual problems of magnetic resonance and its application” carry out by Kazan State University and Zavoiskii Physical-Technical Institute are included in the present collection.
The organizing committee of School’2009
M.S. Tagirov, V.A. Zhikharev, I.P. Volodina, Yu. Malinina O.N. Chibisova, M.P. Rodionova, A.A. Rodionov, A.V. Klochkov,
E.M. Alakshin, R.R. Gazizulin, T. Safin, I. Motygullin
ISBN 978-5-98180-722-0 © Authors Collective, 2009 © Kazan State University, 2009
P R O G R A M
Program Monday, October 5 10:00 – 10:45 Opening Ceremony
M.S. Tagirov , “M.A.Teplov and ultra-low temperature experiments”
Lectures 10:45 – 11:30 V.V. Dmitriev, “Spin superfluidity in liquid He-3” 11:30 – 12:15 Yu.M. Bunkov, “Bose-condensation of magnons” 12:15 – 13:00 G.B. Teitelbaum, “NMR Zooming into the Properties of the Iron Based High
Temperature Superconductors”
13:00 – 14:00 Lunch
Oral session14:00 – 14:15 I.A. Larionov, “Theory for spin dynamics in copper oxide superconductors as
obtained by Nuclear Quadrupole Resonance and Neutron Scattering” 14:15 – 14:30 A.A. Rodionov, “The EPR investigations of the carbonizates” 14:30 – 14:45 M.A. Suslov, “Temperature dependence of water diffusion through aquaporins
of plant cells: spin-echo NMR study” 14:45 – 15:00 E.I. Baibekov, “Calculations of phase memory times in CaWO4:Yb3+” 15:00 – 15:15 M.M. Bakirov, “EPR investigation of the spin-spin interaction in the Fe2Y2
cluster” 15:15 – 15:30 A.A. Ershova, “Super-hyperfine structure (SHFS) of EPR spectra of U3+ ion
in Van Vleck paramagnet LiTmF4”
15:30 – 16:00 Coffee break
16:00 – 16:15 R.R. Gainov, “Application of NQR-spectroscopy in studies of copper-bearing sulfides”
16:15 – 16:30 T.O. Litvinova, “Electron Spin Resonance in the Heusler Alloy YbRh2Pb” 16:30 – 16:45 I.N. Subacheva, “Photoinduced EPR in KTa0.988Nb0.012O3 crystals” 16:45 – 17:00 M.Yu. Volkov, “Implementation of a quantum algorithm CNOT by nuclear
magnetic resonance” 17:00 – 17:15 Z.A. Kanarskaya, “Time-Domain Nuclear Magnetic Resonance as the actual
technique of dairy product’ researching” 17:15 – 17:30 D.T. Sitdikov, “EPR of phytofulgurite and bitumens” 18:00 Welcome party
Tuesday, October 6 Lectures 9:15 – 10:00 V.A. Atsarkin, “Multiple quantum transitions in nanoparticles: role of dipolar
interactions” 10:00 – 10:45 V.I. Volkov, “Matrix ENDOR. Theory and Application for Ion-Exchange
Systems”
10:45 – 11:15 Coffee break
3

P R O G R A M
11:15 – 12:00 Yu.G. Rudoi, “Quantum restrictions of physical measurements in nanoobjects”
12:00 – 12:45 T.A. Vasilenko, “Potentiality of NMR spectroscopy for studying of pore structure in fossil coals”
12:45 – 14:00 Lunch
Oral session14:00 – 14:15 S.S. Khutsyshvili, “Continuous-wave and pulse EPR studies of iodine
containing polyconjugate systems” 14:15 – 14:30 O.A. Babanova, “NMR study of the reorientational motion in NaBH4 and
KBH4” 14:30 – 14:45 Z.N. Litvinova, “The 17O NMR study of CaMnO3-x (x < 0.01)” 14:45 – 15:00 O.A. Gorbunov, “Manifestation of the exchange-relaxation mechanism in
spin catalysis” 15:00 –15:15 A.R. Tulyabaev, “Application of NMR-spectroscopy for an establishment of
structure of spiro-cycloalkane derivatives of fullerene C60” 15:15 – 15:30 N.P. Isaev, “Influence of cholesterol on molecular motions in spin-labeled
lipid bilayers observed by stimulated ESE”
15:30 – 16:00 Coffee break
16:00 – 16:15 D.O Tolmachev, “Evidence of Mn2+ fine structure in CdMnSe/ZnSe quantum dots and quantum wells”
16:15 – 16:30 A.I. Dmitriev, “Microwave magnetoresistance in Ge:Mn thin films detected by ESR spectrometer”
16:30 – 16:45 A.A. Rakhymzhan, “Deactivation study of electronically excited Cl(2P1/2) atoms by SOCl2, CCl3H, C2H4, NO2 molecules with Laser Magnetic Resonance (LMR) technique”
16:45 – 17:00 A.A. Vinokurov, “EPR of Eu-doped superionic fluorite crystals”
17:30 Master classes
17:30 Discussion club “Spin dynamics” chairman V.M. Chernov contributors: A.A. Pavlov, K.G.. Khatmullina, A.V. Chernyak, A.A. Marinin, N.F. Shkodich, T.V. Tropin, A.V. Butakov
Wednesday, October 7 Lectures 9:15 – 10:00 M.V. Eremin, “Orbital ordering in Sr2VO4” 10:00 – 10:45 K. Kono, “Novel dynamics of intersubband transition of surface state
elecetons on liquid He”
10:45 – 11:15 Coffee break
11:15 – 12:00 S.B. Orlinskii, “Dynamic nuclear polarization by means of shallow donors in nanoparticles”
Oral session12:00 – 12:15 A. Alfonsov, “Spin-state polaron in lightly hole-doped LaCoO3”
4

P R O G R A M
12:15 – 12:30 Yu. Krupskaya, “High-field ESR and magnetization study of a novel trinuclear Ni(II) molecular complex”
12:30 – 12:45 T.V. Popov, ”Label-free EPR recognition of biogenic destruction of stone monuments”
12:45 – 14:00 Lunch
14:00 – 14:15 E.V. Morozov, “NMR microimaging for studying the initial stages of gelation process in colloidal silica”
14:15 – 14:30 A.F. Sadykov, “63,65Cu NMR study of the magnetic structure in the multiferroic LiCu2O2”
14:30 – 14:45 A.V. Ievlev, “Self-diffusion and relaxation of low-generation dendrimers by NMR”
14:45 – 15:00 T.A. Platova, “Phase segregation in sodium cobaltates NaxCoO2 at large sodium content”
15:00 – 15:15 E.E. Prokhorenko, “Magnetic phase formation in Fe/Fe3O4 bilayers studied by ferromagnetic resonance”
15:30 Excursion to Raifa Monastery Thursday, October 8 Lectures 9:15 – 10:00 F.S. Dzheparov, “Spin dynamics in magnetically diluted media” 10:00 – 10:45 A.V. Dooglav, “Dynamics and distribution of doped holes in the CuO2 plane
of slightly doped YBa2Cu3O6 studied by Cu(1) NQR”
10:45 – 11:15 Coffee break
11:15 – 12:00 Yu.K. Rozentsvayg, “Modern compact EPR-spectrometers Х and L-band for wide application”
Oral session
12:00 – 12:15 A.A. Levantovsky, “Development of a new interactive software for spectrum analysis”
12:15 – 12:30 A.A. Lyubarev, “Beta-NMR method and kinetics of polarization transfer in spatially disordered spin system”
12:30 – 12:45 I.G. Mershiev, “Application of adaptive wavelet filtering methods for noise suppression in NMR signal detection”
12:45 – 14:00 Lunch
14:00 – 14:15 A.V. Soukhorukov, “Spin relaxation processes of conduction electrons in silicon with different isotopic composition”
14:15 – 14:30 A.V. Fedorova, “Multiple quantum NMR of interacting equivalent spins” 14:30 – 14:45 L.F. Galiullina, “NMR investigation of atherosclerotic plaque” 14:45 – 15:00 M.S. Bukharov, “EPR study of structural features of the copper(II) complexes
with histamine and dipeptides” 15:00 – 15:15 A.N. Lobov, “The diastereomeric differences in N-(2-hydroxyethyl)cytisine
derivatives”
5

P R O G R A M
15:15 – 15:30 A.N. Istrate, “NMR assignments of the short peptides of the fragments of human and rat b-amyloid”
15:30 – 16:00 Coffee break
16:00 – 16:15 V.S. Iyudin, “Investigation of nitric oxide contents in rats heart tissue by EPR spectroscopy”
16:15 – 16:30 O.A. Krumkacheva, “Supramolecular Photochemistry in β–Cyclodextrin Hosts: A TREPR, NMR, and CIDNP Investigation
16:30 – 16:45 A.A. Bliznyuk, “Changes in paramagnetic characteristics of pitch and pitch fiber during their oxidation in low temperature oxygen plasma”
16:45 – 17:00 R.R. Gazizulin, “NMR of liquid 3Не in pores of clay minerals”
17:30 Master classes
Friday, October 9 Oral session 9:00 – 9:15 I.J. Danilov, “Development of NMR spectrometer control software” 9:15 – 9:30 S.V. Efimov, “High-resolution NMR studies of cyclosporine A” 9:30 – 9:45 A.Yu. Orlova, “Antimony NQR studies of stephanite” 9:45 – 10:00 I.A. Evlampiev, “Copper NQR studies of copper sulfide Cu1.6S (geerite)” 10:00 – 10:15 M.A. Malakhov, “Multicomponent order parameter in superconductor
YBa2Cu3O7” 10:15 – 10:30 T.F. Khafizov, “Theory for the Gaussian component of the 63Cu nuclear”
10:30 – 11:00 Coffee break
11:00 – 11:15 Yu.S. Kutin, “Calculation of ZnO nanoparticles size distribution based on EPR line shape analysis”
11:15 – 11:30 B.V. Yavkin, “EPR of lead doped hydroxyapatite nanocrystals” 11:30 – 11:45 R.B. Zaripov, “Application ESEEM to study free radicals in disordered
systems” 11:45 – 12:00 E.M. Alakshin, “Synthesis of PrF3 nanoparticles for researching cross
relaxation in contact with 3He” 12:00 – 12:15 K.B. Konov, “Determination of spin state of the paramagnetic clusters by
electron spin echo envelope modulation” 12:15 –12:30 K.R. Sharipov, “Observation of a phase separation in Paramagnetic
Eu0.6La0.4-xSrxMnO3” 12:30 – 12:45 Y.V. Mamedova, “Investigation of some aminomethyl and acetyl derivatives
of alkenylphenols by NMR spectroscopy”
12:45 – 14:00 Lunch
Lectures 14:00 – 14:45 D.A. Tayurskii, “Non-extensive thermodynamics — a new approach to the
strong correlated and nanoscopic systems” 14:45 – 15:30 I.R. Mukhamedshin, “NMR/NQR study of the Na2/3CoO2 compound” 15:30 Closing ceremony
6

L E C T U R E N O T E S
NMR Zooming into the Properties of the Iron Based High Temperature Superconductors
G.B. Teitel’baum
E.K. Zavoiskii Institute for Technical Physics of the RAS, 420029 Kazan, Russia
e-mail: [email protected]
Recent experiments have revealed the coexistence of magnetic (SDW) and superconducting phases at low temperature in iron-pnictides on the mesocopic scale. We will address possible mechanisms for phase coexistence in pnictides in order to outline the problems which may be solved using magnetic resonance technique.
To understand the coexistence (or competition) between the metallic antiferromagnetic states in iron pnictides one should start from their electronic spectra which are well known from the band structure calculations. Consensus exists that the approximate “nesting” between electron and hole Fermi surfaces can account for the presence of the spin density wave (SDW) gap for the undoped compounds. The scenario of the phase separation in pnictides (L.P. Gor’kov, G.B. Teitel’baum, in print) depends on the way of nesting suppression in the course of tuning the system to the metallic (superconducting) state. One should distinguish: i) tuning by the external doping with electrons or holes and ii) by external hydrostatic pressure.
In the first case segregation cannot be completed due to the frustration effect of Coulomb forces. The coexisting SDW and metallic sub-phases have typical sizes of several tens of nanometers.
When the nesting of Fermi surfaces is changed by pressure the optimal energy gain may be reached choosing an incommensurate wave vector for the spin density wave (IC). Mathematically the problem becomes equivalent to that of superconducting Larkin-Ovchinnikov-Fulde-Ferrel phase. The IC SDW state in pnictides would appear below the tricritical point in the T-P plane between the two temperature dependent critical values of pressure (P). Near the larger one (P2) this state is featured by the IC cosine modulation of the order parameter whereas in the vicinity of the smaller one (P1) it corresponds to the strips of commensurate SDW phase separated by the soliton-like metallic walls. In this case one has the periodical array of coexisting magnetic and metallic (superconducting) phases. Its period is finite near P2 and increases to infinity near P1. The IC SDW state may appear even in lightly doped systems if the electron mean free path is larger than the correlation length.
It is important that for both cases mentioned above one deals with inhomogeneous states with the typical scales changing from the atomic sizes up to the thousands of angstroms. To zoom into their properties one should use the local experimental methods. In our lecture we will focus on the problems which may be studied with a help of NMR, providing the opportunities to probe the internal field distribution and even to distinguish between the commensurate and incommensurate magnetic states. To illustrate this we will discuss the fingerprints of the two types of phase separation in the recent NMR and μSR experimental data on iron pnictides.
The work was supported through the RFBR Grant N 07-02-01184.
7

L E C T U R E N O T E S
Multiple quantum transitions in nanoparticles: role of dipolar interactions
V.A. Atsarkin1), N. Noginova2)
1) Kotel’nikov Institute of Radio Engineering and Electronics RAS, 125009, 11 Mokhovaya Str., Moscow, Russia
2) Center for Materials Research, Norfolk State University, 23504, 700 Park Avenue, Norfolk, VA, USA
e-mail: [email protected]
Abstract Magnetic nanoparticles attract considerable interest due to their unusual magnetic
properties and many technological applications, such as in nanoscale engineering, catalysis, mineralogy, biology, and medicine (for a review, see Refs. [1, 2]). There is a very important and interesting fundamental issue as well: nanometer-scale magnetic objects are at the interface between quantum dynamics of few interacting spins and many-particle behavior commonly described in terms of classical thermodynamics. Searching for quantal features in magnetic nanoparticles is an intriguing physical problem.
Recently, absorption at multiple resonance frequencies was observed in the electron magnetic resonance (EMR) spectra of magnetic nanoparticles [1,2], in strong similarity with forbidden multiple quantum transitions known for paramagnetic ions. Temperature and concentration dependences have been studied to reveal the origin of the signals. The results were discussed using a "quantization" approach [3], considering resonance transitions between energy levels of a giant spin corresponding to the total magnetic moment of a nanoparticle. The multiple quantum transitions were ascribed to both the effect of anisotropy and dipole-dipole interactions between nanopartcles.
In order to better understand the role of dipolar interactions in the multiple quantum transitions, EMR studies have been performed on iron oxide nanoparticles assembled in linear parallel chains inside the anodic alumina membrane. The positions of both the main resonance and “forbidden” (double-quantum, 2Q) transitions observed at the half field demonstrate a characteristic angular dependence with the line shifts proportional to 3cos2θ-1, where θ is the angle between the channel axes and the external magnetic field B. This result can be attributed to the interparticle dipole-dipole interactions within the chains. The angular dependence of the 2Q intensity is found to be proportional to sin2θcos2θ, that is consistent with the predictions of quantum-mechanical calculations with taking into account the mixing of states by non-secular inter-particle dipole-dipole interactions. Quantitative agreement is demonstrated between the both kinds of measurements (the line shifts and the 2Q intensity), evidencing for applicability of the quantum approach to the magnetization dynamics of superparamagnetic objects.
References [1] N. Noginova, T. Weaver, E.P. Giannelis, A.B. Bourlinos, V.A. Atsarkin, V.V. Demidov,
Phys. Rev. B 77, 014403 (2008).
[2] Maxim M. Noginov, N. Noginova, O. Amponsah, R. Bah, R. Rakhimov, V.A. Atsarkin, J. Magn. Magn. Mater. 320, 2228 (2008).
[3] N. Noginova, F. Chen, T. Weaver, A.B. Bourlinos, E.P. Giannelis, V.A. Atsarkin, J. Phys.: Condens. Matter 19, 246208 (2007).
8

L E C T U R E N O T E S
Matrix ENDOR. Theory and application for ion-exchange systems
V.I. Volkov Institute of Problems of Chemical Physics Russian Academy of Science, Chernogolovka, Moscow Region, 142432, Russia
e-mail: [email protected]
Electron Nuclear Double Resonance (ENDOR) has been investigated in sulfocation exchangers, containing free radicals stabilized in polymeric matrix or Cu(II) and (VO)(II) as counter ions. It was shown that the ENDOR signal is mainly due to electron-nuclear dipole-dipole interactions between the unpaired electron and nuclei of polymeric matrix or hydrogen atoms of water molecules which hydrate the charge groups. In order to quantitatively describe the ENDOR line shape and intensity, the theory of matrix ENDOR is developed. The correctness of this theory was tested by comparing the temperature dependence of spin-lattice relaxation times calculated from ENDOR line intensities with the corresponding dependence obtained from stationary saturation electron spin resonance spectra. A good agreement was observed in the temperature range from 200 to 350K. The structural parameters of surrounding of paramagnetic ions Cu(II) and (VO)(II), which include four coordinated spheres on the distance from 0.3 to 1.2 nm, were calculated. The motional parameters, correlation time and activation energy of mobile protons were also determined. It is concluded that the activation process of water self-diffusion and proton exchange take place at high temperature, whereas the proton tunneling transfer is possible at low temperature.
9

L E C T U R E N O T E S
Potentiality of NMR spectroscopy for studying of pore structure in fossil coals
T.A. Vasilenko, A.K. Kirillov, A.N. Molchanov, G.A.Troitsky, G.V. Gusakov
Institute for Physics of Mining Processes, 83114, R. Luxemburg str. 72, Donetsk, Ukraine
e-mail: [email protected]
The NMR spectroscopy is an effective tool for the measurement of porous structure of sorbents. However, the presence of two phases in the pore volume requires a more careful separation of these phases while studying media with pore size distribution within broad ranging. Measurements by a spin-echo spectrometer with a constant magnetic field gradient were made for a set of water-saturated samples: silica gels having 1.4; 6.5, 26.0; 38.0 nm mean pore size and also for coals – anthracite and D-rank coal. The pore size dependence of Ds for silica gels has been obtained. With the pore size of d = 1.4 nm the ‘motionally averaging’ mode is realized when the exponential attenuation of the spin-echo signal occurs under the partially restricted geometry. The increase of the value of the self-diffusion coefficient (which is an effective coefficient either for vapor or liquid phase of water) up to
5 22.3 10 m ssD −= ⋅ is observed for coals [1]. Depending on pore size, it is necessary to use methods developed for these purposes both for liquid, and gas phases. Obtained values of Ds for methane are in accordance with the conception of the transition from volume diffusion to the Knudsen regime with a decrease of the methane pressure in a porous space.
The largest scales of monofractals for pores of water-saturated specimens of anthracite and D-rank coal were obtained (Lint = 5.1 μm and 9.6 μm) on the base of coal matter fractal structure conceptions. They are close to pore sizes calculated by measured values T2 on the assumption of their spherical shape. The activation energy of methane desorption was obtained by comparison of an NMR pulse spectrometer with NMR autodyne method data, as well from methane desorption experiment. The duration of such desorption depends on concentration of gas in closed pores and on the solid state diffusion process.
The NMR method gives a possibility to measure a transport diffusion coefficient which is an effective coefficient Deff determining the methane transport in a pore system and includes both transport mechanisms: methane filtration in the coal pore space and the methane from close pores by solid state diffusion.
References [1] Ardelean; C. Mattea; G. Farrher, S. Wonorahardjo; R. Kimmich. – J. Chem. Physics,
119(19), P.10358–10362 (2003)
10
L E C T U R E N O T E S
Dynamic nuclear polarization by means of shallow donors in nanoparticles
S.B. Orlinskii
Kazan State University, Kazan, Russia
e-mail: [email protected]
It was demonstrated that dynamic nuclear polarization of nuclear spins could be achieved in ZnO and AgCl single crystals by saturating the EPR transition of the shallow donor present in this crystals with using high-frequency at low temperatures corresponding to high Boltzmann factor. DNP effects have also been observed in ZnO quantum dots where polarization of 67Zn and of 1H nuclear spins in the ZnO/Zn(OH)2 core-shell structure have been obtained by saturating the EPR transition of the SD present in the ZnO QD's. DNP manifests itself via a shift of the EPR lines of SD in bulk ZnO and AgCl crystals and the creation of a hole and an antihole in the EPR absorption line of the SD in QD's.
The remarkable aspect is that this DNP is caused by an Overhauser mechanism.
The enhancement of the nuclear polarization opens the possibility to study semiconductor nanostructures with NMR techniques
References
[1] Hofmann, Hofstaetter, Meyer, Orlinskii, Schmidt, Baranov, Phys. Rev. Lett. 88, 045504 (2002)
[2] Orlinskii, Schmidt, Baranov, Donega, Meijerink, Phys. Rev. Lett. 92, 047603 (2004)
[3] Blok, Orlinskii, Schmidt, Baranov, Phys. Rev. Lett. 92 047602 (2004)
[4] Orlinskii, Schmidt, Baranov, Dyakonov Phys.Rev. B 77, 115334 (2008)
[5] Orlinskii, Schmidt, Baranov, Donega, Meijerink, Phys.Rev. B 79, 165316 (2009)
11

L E C T U R E N O T E S
Spin dynamics in magnetically diluted media
F.S. Dzheparov
Institute for Theoretical and Experimental Physics, 117218, B. Cheremushkinskaya 25, Moscow, Russia
e-mail: [email protected]
Modern investigations of phase relaxation and resonance form function in magnetically diluted samples is presented. Dynamics of nuclear spins 29Si in silicon and paramagnetic sensor in dissolved magnetic fluid are considered as examples.
The aim of the lecture consists in discussion of modern problems of magnetic resonance in such statically disordered systems, as nuclear spins 29Si in crystalline silicon or dissolved magnetic fluids. Spins 29Si itself are used as probes in silicon, but special paramagnetic probes (sensors, like TEMPOL) are applied for magnetic fluids. First problem can be considered as pure fundamental one, because we expect that crystal structures and nuclear spin interactions are well known, but up to now there are no reliable experimental data for free induction decay (FID) signal or NMR form function for similar systems. Consequently, we have no adequate checking for corresponding theoretical predictions. Second problem is of fundamental interest as well, but it has important application for studies of aggregation of magnetic nanoparticles in magnetic fluids.
Anderson’s model and concentration expansion
Resonance form function g(ω) and free induction decay
( )( ) /F t S t S S S+ − + −=
are most important values for magnetic resonance studies in high temperature approximation, because they are interconnected by fluctuation-dissipation theorem (FDT)
( )( ) exp ( ),2dtg iω = ωπ∫ t F t
and one of them is directly measurable in standard experiments. Here S is total spin moment of a measurand, and time dependence is produces by all intraspecimen interactions.
Anderson [1] and Abragam [2] presented a unique model of spin dynamics in disordered solids, having exact solution. It is mathematically similar to preceding model, developed by Forster in the theory of luminescence quenching [3]. The model is based on Hamiltonian
1 ,2
z zA ij i jS
ijH b S= ∑ (
2 22
3
3 1 3cos ,2i j ij
ij
br≠
γ )− ϑ 0ii b = , (1) =
which admits exact solution for free induction decay
( ) ( ) ( )0 3 102( ) / exp 1 cos exp ,A AF t S t S S S n d r b t D t+ − + −= = − − = −⎡ ⎤⎣ ⎦∫ r
222 .
3 3A nπ= γD (2)
Here spins Sj=1/2 with positions rj are distributed randomly in a macroscopic volume V with a density of spins n=N/V, rij = ri - rj, N is number of spins, jSα is operator of j-th spin projection,
S-=(S+)+, 1
,Njj
S ++ =
= ∑ S ( ) exp( ) exp( ),A AS t iH t S iH t+ += − ( ) ( ) / (1)A Tr A Tr A Tr= ρ = for
12

L E C T U R E N O T E S
any operator A, and high temperature approximation for density matrix ρ was applied. We use traditional notations for other parameters [2].
If the spins are distributed randomly on crystal sites, then exact solution exists as well
( )( ) 102( ) exp ln 1 cos 1 ,AF t c b t⎡ ⎤= + −⎣ ⎦∑ rr
(3)
where with ri=0 and rj=r, and c is dimensionless concentration – a probability to find a spin in given crystal site. Simple derivation of Eqs. (2),(3) can be found in [4,5]. Relation (2) is direct consequence of (3) for small
0 ijb b=r
1c n= Ω and , when the sum in (3) can be substituted by integral (continuum media approximation). Hereafter
0 1b t
( )2 2 30 3 / 2b = γ 0 ,r (4)
r0 is nearest distance between spins, and Ω is volume per one spin.
Relations (2) and (3) are founded on exact solution of Heisenberg’s equation of motion with Hamiltonian HA:
( ) ( )exp zj j jll j
S t S i b S t+ +≠
= ∑ l , (5)
and on absence of correlations in positions of spins.
For pure magnetic intraspesimen interactions general theory of FID has no small parameters, suitable for regular perturbation theory that produces main difficulty in the theory of this field of physics. If spin positions are ordered (crystal lattice), then regular information is concentrated in expansion of FID in power of time
( )( )
220
1( ) ,
2 !
nn
nnF t M t
n∞
=
−= ∑ ( )( ) ( )( ) 1
2 ,n n
n d dM H S H S S S −× ×+ − + −= i (6)
and coefficients 2nM of the expansion are simply connected with moments of g(ω). We will
use standard notation ,d dH Q H Q× ⎡= ⎣ ⎤⎦ for superoperator dH × , produced by operator dH . Here
dH is a part of the Hamiltonian of dipole-dipole interactions, which is of interest in the prob-lem, and Q is arbitrary quantum mechanical operator. Only first several moments 2nM can be calculated in reality.
Classical example of producing of physically reasonable FID using first moments 2nM and memory function method was presented in [6, ch.1]. Relations (2) and (3) indicates that similar ways are impossible for disordered media, because a) function F(t) in (2) has singu-larity at t=0 (i. e. n≥1), and b) relation (3) should be used at when first terms of expansion in power of time produce insufficient information.
2 ,nM = ∞ 0 1,b t
Regular way for theory in magnetically diluted solids was introduced in [7-9] via con-centration expansion of FID and regrouping it on basis of memory functions [8, 9] and cumu-lant expansions [9].
If we apply occupation numbers formalism, then usual Hamiltonian of secular dipole-dipole interactions is of the form
1 1 ,2 3
z zSH n n b S S⎛ ⎞= −⎜ ⎟
⎝ ⎠∑ x y xy x y x yx,y
S S (7)
13

L E C T U R E N O T E S
while for Anderson’s model
12
z zAH n n b= ∑ x y xy x yx,y
S S , (8)
where labels x and y runs all sites of the crystal. Analogically, total spin of the sample
∑ αα =
x xxSnS (9)
Here nx is occupation number – nx=1(0) if the crystal site x is (is not) filled by a spin, and . If we omit all sites with nx=0 in (8), then we see, that Hamiltonian (8)
differs from (1) in method of enumeration of spins only, and, consequently Hamiltonians (7) and (8) coincides with standard secular dipole-dipole interaction and Anderson’s Hamiltonian (1) correspondingly. When all nx=1 the spins fill out all crystal lattice. In disordered spin sys-tems nx is random variable with
( ,ij i jb b= = =xy x r y r )
0c
n c< = ≤x 1, and with independent occupation of differ-ent sites, i.e.
( )2 1 ,c
n n c c= δ + − δx y xy xy 1
.j
m mj c
n c=
=∏ x (9)
Here c
iii means averaging on possible random positions of spins. Last relation in (9) implies than all xj are different, and coinciding positions can be excluded applying identity (nx)2=nx .
Free induction decay (as any typical function of occupation numbers) can be expanded in series of productions of occupation numbers [7, 8], and in first terms
( ) ( )
( ) ( )
0 0 0 00 0 0
23
0 0 0 00 0 0
1( ) 1 ( ) 1 ( ) ( ) ( ) 12
1 ( ) 1 ( ) ( ) ( ) 1 ( ).2
Sc
F t n F t n n F t F t F t
cc F t F t F t F t O c
≠ ≠ ≠ ≠
≠ ≠ ≠ ≠
= + − + − − + + =
= + − + − − + +
∑ ∑
∑ ∑
x x x y xy x yx x y
x xy x yx x y
… (10)
Here is FID for system, containing two spins only and the spins are placed at sites x and 0, is FID for three spin systems with positions x, y and 0. It is taken into account, that for single-spin system F(t)=1. Last relation in (10) is referred to as concentration expan-sion [7, 8].
0 ( )F tx
0 ( )F txy
It should be noted, that Hamiltonians HA and HS have coinciding spectra for two-spin systems if Sj=1/2, and corresponding coincide as well, that was used in [1, 2] to define general scale in Hamiltonian HA as a model of HS. Now, using concentration expansion, we see, that difference in FS(t) and FA(t), produced by Hamiltonians HA and HS correspondingly, reveals in terms of order of cm with m≥2 only.
0( )F tx
Continuum media approximation (CMA) is important limit of the theory, which con-centrates main qualitative peculiarities. Dipole interaction is proportional to , therefore m-th term of the concentration expansion is ∼|t|m in CMA, and first terms of FS(t) can be written as
3ijr−
( )2
( ) 12A
S A
D tF t D t= − + ξ +… (11)
14

L E C T U R E N O T E S
in this limit. Difference of ξ from 1 is a measure (for diluted spin systems) of difference of FS(t) from FA(t) in the same sense, as difference ( )2
4 / 3 2M M from 1 is used to estimate a difference of F(t) from Gaussian for dense spin systems [2].
Realistic FID for nuclear magnetically diluted crystals
Coefficient ξ was calculated in [10] for 2- and 3-dimensional media and for Hamiltonian
1 ,2 3
z zD
aH n n b S S⎛ ⎞= −⎜ ⎟⎝ ⎠
∑ x y xy x y x yx,yS S (12)
with 0.2≤a≤1.6 in order to take into account systems with axial g-factors. For 3-dimensional systems and standard secular interactions ξ(a=1)=1.11.
In order to obtain reasonable approximation for FID at 1AD t ∼ and reasonable form function g(ω) we can, according to [10,5] regroup the expansion (11) for 3-dimensional sys-tems into
( ) ( )( )
( )( )( )
1/22
0
1/2
( ) exp 2 exp / 3
exp 6 3 exp / 3 1 .
t
S A A
A A
F t D d t D t
D t D t
⎧ ⎫⎡ ⎤= − τ − τ −⎨ ⎬⎢ ⎥⎣ ⎦⎩ ⎭
⎡ ⎤= − + − −⎣ ⎦
∫ = (13)
It was taken into account, that within the accuracy of calculations 3(ξ(a=1) −1) = 0.33 =1/3.
Relation (13) introduces the most essential properties of magnetically diluted systems into the Anderson–Weiss–Kubo (AWK) theory [11,12] of phase relaxation, which was origi-nally developed for description of line narrowing by motion.
Application of the approach to magnetically diluted nuclear spin systems (like 29Si in silicon) requires one important modification, connected with the fact that typical nuclear concentration c=0.01÷0.1 is not sufficiently small to replace lattice sums by integrals in Eq. (10). FID for such concentrations can be represented by the Eq. (13) with substitution
( ) ( )( )10 2( ) 1 ( ) 1 cos .AD t t c F t c b t→ κ = − = − 0∑ ∑rr r r
))
(14)
As a result the function
( )(( 1/2( ) exp 6 ( ) 3 exp ( ) / 3 1SF t t t⎡ ⎤= − κ + −κ −⎣ ⎦ (15)
coincides with exact Eq.(10) up to c1, that is sufficient for small 1AD t < , and it coincides
with (13) at AD t ≥1, producing desirable approximation for FID and ( )g ω [5].
Several studies of FID of nuclei 29Si in silicon samples were fulfilled in last decade, see for example [13,14] and references therein. Obtained results are contradictory. Probably, most reliable measurements are presented in Ref. 14, where observable FID was compatible with FID for Hamiltonian (1), multiplied by ζ=2/3 (Fig. 1).
Relations (3) and (15) were unknown to authors, and they applied numerical averaging on random distribution of nuclei 29Si in theoretical consideration. Introducing of the multiplayer ζ=2/3 produces significant deviation from exact formula (10), and approximation (15), based on it. New measurements are necessary to clarify the difference. Our result FS(t) is
15

L E C T U R E N O T E S
in satisfactory agreement at DAt<2.5 with numerical simulation of Ref. [14a] , fulfilled with 8 spins. The simulation produced negative value of FID at DAt>4, that is impossible for relation (15). But cluster of 8 spins is too small for reliable modeling that is clearly seen in comparison with results for 9 spins, produced by the same authors [14b].
0 2 4 6
0,0
0,2
0,4
0,6
0,8
1,0
FID
DAt
Fig.1. Free induction decay of nuclei 29Si in silicon powder. Measured points [14] are
presented together with theoretical lines: long dashes – numerical simulation using spin cluster with 8 spins and Hamiltonian HS [14a]; down solid line - FS(t), Eq. (15); upper solid
line – FS(2t/3); short dashes – FA(2t/3).
EPR Line Shape of Paramagnetic Particles in a Magnetic Liquid The theory of the line shape of paramagnetic particles (sensors) in dilute magnetic media,
considered above, is developed for the case of local fields induced by point or similar nearly spherical particles. The first works on the ESR in magnetic liquids [15, 16] and the recent ESR and NMR experiments with similar objects [17, 18] discuss the spectra in the same manner. The line shape of the NMR probes in the local fields induced by randomly allocated “magnetic charges” formed by long thin ferromagnetic rods in magnetic varnishes was considered in the same way [19].
However, researchers frequently encounter objects of quite a different type, in which the internal fields are induced by extended structures, e.g., nanoparticle chains [20] (that attracted a theoretical interest already in 1970 [21]), or more massive aggregates [22]. The theory of spectra in such media should be conceptually close to the theory of spectra induced by spherical particles. However, a sharp difference in symmetry leads to qualitatively new effects and to great increase of computational difficulties in comparing the theory and experiment. The EPR line shape theory for these objects was started in Ref. [23], were a model was presented, which generalizes known theory of diffusion-stimulated relaxation on paramagnetic impurities [24,25,5] to the phenomena of interest. The case where the diffusion of the sensors may be neglected was considered in detail. The local fields in this model are induced by homogeneously magnetized nanoparticle chains (or needles) stretched along the
16

L E C T U R E N O T E S
external field and randomly distributed in the sample. The paramagnetic probe particles are randomly distributed in the chain-free space.
Usually, the external magnetic field H0 = (0, 0, H0) of the spectrometer is so high that it almost completely aligns the magnetic moments of the nanoparticles along the field. Let us assume that a unit volume of the elliptic sample contains c particles assembled into one-particle-thick chains of n particles. Each particle has a radius R and a magnetic moment m = me. Then, the spatial density of the chain centers is cc = c/n, the chain length is l = 2Rn = 2h, and the linear density of the magnetic moment of the nanoparticle chain is ν =m/(2R). The field induced at the paramagnetic radical located at the origin by such a chain with the center at the point r and oriented along the unit vector e is
( ) ( ) ( hrehhr
duu
err
rHh
h
l <θδπν
+⎟⎟⎠
⎞⎜⎜⎝
⎛
−−
+∂∂
ν=+ν
⎟⎟⎠
⎞⎜⎜⎝
⎛Δ
δ−
∂∂∂
= ⊥α− α
βαβ
βαα ∫ ||
2
3411
3r
ererer) , (16)
where r⊥ and r|| are the components of r orthogonal and parallel to m, respectively. Here, Δ is the Laplacian, θ(z) is the Heaviside step function, and the repeated Cartesian subscripts β imply summation. The second term in Eq. (16) reflects the impossibility of the sensor to penetrate the chain. Hereinafter, as usually in the diluted magnetic systems, we take into account only the sensor positions with respect to a chain such that r > R, since the configurations with r ≈ R are rather improbable and contribute only to a far wing of the magnetic resonance line. Nevertheless, we retain the second term in Eq. (16) for the theory to be self-consistent in the continual limit when the chain structure may be neglected at all distances.
The local magnetic fields imposed by such chains determine the FID and the resonance absorption line shape g(Δ) of the sensor
( ) )exp(/)()( tigdSSStStF Δ−Δ⋅Δ== ∫−+−+ , (17)
)()()( tUStUtS +++ = , ( )⎟
⎠⎞⎜
⎝⎛ ττ= ∫
t
lHditU0
exp)( ,
where S = 1/2 is the spin of the sensor. The averaging is performed here over the states of the paramagnetic particles and chains. The Hamiltonian of the sensor interaction with the local field depends on the coordinates of the chain centers rj(t) and, through them, on time t:
( ) ( ) ( ) ( ) zj jlzzj jlzll SHSStt ∑∑ γ−=ω−=ω−= rrH . (18)
In Eq. (18), we retained only the secular part of the interaction between the sensors and chains, which is justified if the difference between the Larmor frequencies of the sensor spin and the great majority of the nanoparticles substantially exceeds the width of the resonance. The time dependence of ωl(t) can be neglected if ωl(t) remains almost unchanged within the relaxation time of the FID signal. In the leading approximation, it is natural to assume that at a low volume concentration of the particles, i.e., at 3(4 / 3) 1R cϕ = π << the chain centers are randomly distributed in the sample volume. In this case, the Anderson model [1] is generalized for the case where the local field is induced by the chains with so large a moment that it may be described in a classical manner. Note that like in [26], the local field should be separated into the contribution from a sphere with the radius RS greatly exceeding the chain length and inter chain distance n-1/3, and the contributions from more remote sources, which appear via the demagnetizing factor and the average magnetization of the sample [27].
As a result
17

L E C T U R E N O T E S
( ) ( )( )expF t t= −Φ , ( ) ( )( ) )()()(exp1)( 3 tittiRrrdct sclSc Φ+Φ=ω−−<θ=Φ ∫ r . (19)
An important feature is that the singular term of Eq. (16) does not make any contribution to Eq. (19). Physically, this implies that we consider the detuning Δ = ω0 - ω, smaller than the local frequency Δmax induced by the nanoparticle on the sensor situated on its surface. Here, ω0 and ω are the Larmor and microwave frequencies, respectively. We further assume that the time is positive (t > 0) and negative times are taken into account using the relations Φc(t) = =Φc(−t) and Φs(t) = −Φs(−t).
Numerical-analytical study of relation (19) show that, with an accuracy of no worse than one percent,
( )( )stt ccc φ+Φ=Φ 1)()( 0 , ( )( ) ( )( )( ) 3/1330 )(
−−− Φ+Φ=Φ ttt dmc , ( ) ( )21 σ
ξβ
μ+
χ−α=φ
ssssc , (20)
where , , α=0.0869, β=1.5, χ=0.0912, ξ=4, μ=0.2697, σ=2.25; ( ) 2/3)( tDt mm =Φ ( )d t DΦ = At
( ) )(stDt As δ=Φ , ( ) dqd gsf
bsas δ+
++
+=δ
11, 1321.0
1313ln31
=⎟⎟⎠
⎞⎜⎜⎝
⎛−+
−π
=δd (21)
with a=0.4038, b=0.4370, d=2.040, f=0.2919, g=0.1917, q=0.8505. Here
tDDDtD
DD
hts A
A
mm
A
m
32
2 5425
5425
⎟⎟⎠
⎞⎜⎜⎝
⎛⋅
π=⎟⎟
⎠
⎞⎜⎜⎝
⎛⋅
π=
γν= . (22)
As a result, the experimental data may be treated in terms of the Anderson’s width DA and “monopole” width Dm and the chain length can be found from the relation
3
22
50381
⎟⎟⎠
⎞⎜⎜⎝
⎛π
=ϕm
A
DDn . (23)
We see that Φc(t) describes the decay of the FID signal, whereas Φs(t) represents the phase taper due to the time-dependent frequency shift, which is hereinafter referred to as a quasi-shift. At small times the quasi-shift specified is independent of the radius RS of the integration sphere at RS > h; that is, it is fully accumulated within the region between the chain poles. Therefore, the quasi-shift is subtracted from the Larmor frequency ω0 when the magnetic moment of the chain is oriented against the external field. The corresponding resonance line shape is
( ) ( )ttdtg cs Φ−Φ−Δπ
=Δ ∫∞
exp)(cos)(0
( ) . (24)
The main features of the FID signal given by Eq. (19) and the line shape given by Eq. (24) are the following.
The line width is Dw ~ min(DA, Dm). This immediately follows from the fact that the decay of F(t) is mainly determined by the smallest of the functions Φm(t) and Φd(t). Actually, the transition from the monopole relaxation regime to the dipole one occurs at Φm(t) = Φd(t), that is, at Dmt=(DA/Dm)2 and ( )( )3/13 2//exp)( mA DDtF −≈ at this time.
The wing of the line is given by
18

L E C T U R E N O T E S
( ) 2/5
2/3
243g
ωπ= ∞→Δ mD .
Physically, this formula corresponds to the region max(Dm,DA) << Δ < Δmax. At DA ~Dm the line is asymmetric with respect to the position of its peak. If DA
2 >> Dm2 , the line becomes
symmetric with a shape typical for the monopole approximation and a large shift, as compared to the line width. According to Eq. (22), it is natural because the variable s in this case remains small in the region of the main decrease in F(t), where Dmt≲1. The quasi-shift of the line in this limit coincides with its first moment M1. Let us recall that the macroscopic field at the sensor is usually determined by the average field in the medium minus the Lorentz
field Mϕπ3
4 , where M is the volume magnetization of the medium. This subtracted field
reflects the impossibility of the sensor penetration into the dipoles that induce the magnetic moment of the medium. In the formation of the chains, the sensor may appear outside the chain but between its poles. The field formed by the poles coincides with the Lorentz field but has the opposite direction. It is this field that induces the quasi-shift in this limit.
In the opposite limit of DA3 << Dm
3 , the variable s is large in the entire significant time range. Thus, the line becomes Lorentzian with the Anderson width DA and has a small shift DAδd, as compared to the line width. In this limit the FID coincides in main with the earlier result for point polarized dipoles [26]. Note that the shift DAδd of the line peak is finite, although M1 = 0. Its existence is due to the fluctuations in the arrangement of the dipoles around the sensor and therefore it was called the fluctuation shift in [26].
Up to this point, the discussion assumed that the nanoparticles are assembled into chains. If thicker extended objects—needles of the length ln = 2Rnl and the total number of particles
Nn—are actually formed, the above results hold with the replacement cc→ cn =c/Nn, ν→νn = Nnm/ln, l→ln. In particular, formulas (20)–(24) for the line shape and the FID signal expressed in terms of DA and Dm hold and Eq. (23) becomes
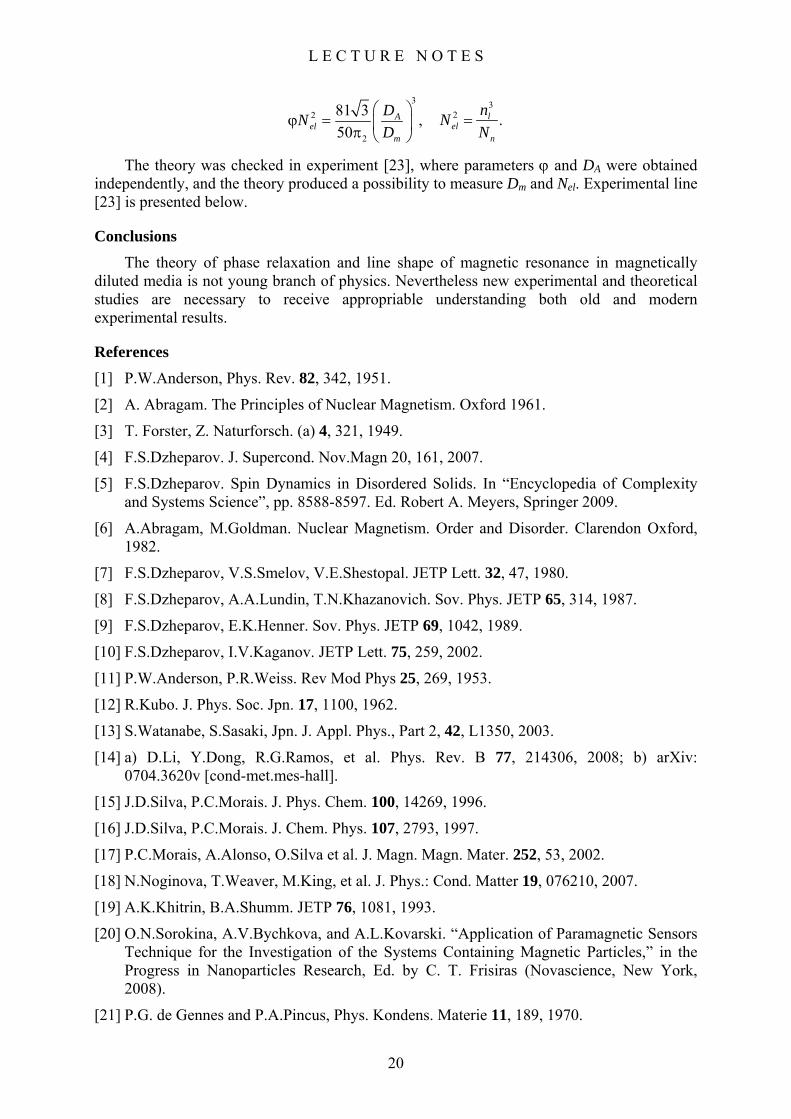
3500 3520 3540H, G
Fig.2. (Points) Experimental and (line) theoretical EPR spectra of the TEMPOL stable
nitroxide radical in a magnetic fluid. The spectrum is proportional to the derivative ( ) /g∂ Δ ∂Δ .
19
L E C T U R E N O T E S
32
2
81 3 ,50
Ael
m
DND
⎛ ⎞ϕ = ⎜ ⎟π ⎝ ⎠
3
2 .lel
n
nNN
=
The theory was checked in experiment [23], where parameters ϕ and DA were obtained independently, and the theory produced a possibility to measure Dm and Nel. Experimental line [23] is presented below.
Conclusions
The theory of phase relaxation and line shape of magnetic resonance in magnetically diluted media is not young branch of physics. Nevertheless new experimental and theoretical studies are necessary to receive appropriable understanding both old and modern experimental results.
References
[1] P.W.Anderson, Phys. Rev. 82, 342, 1951.
[2] A. Abragam. The Principles of Nuclear Magnetism. Oxford 1961.
[3] T. Forster, Z. Naturforsch. (a) 4, 321, 1949.
[4] F.S.Dzheparov. J. Supercond. Nov.Magn 20, 161, 2007.
[5] F.S.Dzheparov. Spin Dynamics in Disordered Solids. In “Encyclopedia of Complexity and Systems Science”, pp. 8588-8597. Ed. Robert A. Meyers, Springer 2009.
[6] A.Abragam, M.Goldman. Nuclear Magnetism. Order and Disorder. Clarendon Oxford, 1982.
[7] F.S.Dzheparov, V.S.Smelov, V.E.Shestopal. JETP Lett. 32, 47, 1980.
[8] F.S.Dzheparov, A.A.Lundin, T.N.Khazanovich. Sov. Phys. JETP 65, 314, 1987.
[9] F.S.Dzheparov, E.K.Henner. Sov. Phys. JETP 69, 1042, 1989.
[10] F.S.Dzheparov, I.V.Kaganov. JETP Lett. 75, 259, 2002.
[11] P.W.Anderson, P.R.Weiss. Rev Mod Phys 25, 269, 1953.
[12] R.Kubo. J. Phys. Soc. Jpn. 17, 1100, 1962.
[13] S.Watanabe, S.Sasaki, Jpn. J. Appl. Phys., Part 2, 42, L1350, 2003.
[14] a) D.Li, Y.Dong, R.G.Ramos, et al. Phys. Rev. B 77, 214306, 2008; b) arXiv: 0704.3620v [cond-met.mes-hall].
[15] J.D.Silva, P.C.Morais. J. Phys. Chem. 100, 14269, 1996.
[16] J.D.Silva, P.C.Morais. J. Chem. Phys. 107, 2793, 1997.
[17] P.C.Morais, A.Alonso, O.Silva et al. J. Magn. Magn. Mater. 252, 53, 2002.
[18] N.Noginova, T.Weaver, M.King, et al. J. Phys.: Cond. Matter 19, 076210, 2007.
[19] A.K.Khitrin, B.A.Shumm. JETP 76, 1081, 1993.
[20] O.N.Sorokina, A.V.Bychkova, and A.L.Kovarski. “Application of Paramagnetic Sensors Technique for the Investigation of the Systems Containing Magnetic Particles,” in the Progress in Nanoparticles Research, Ed. by C. T. Frisiras (Novascience, New York, 2008).
[21] P.G. de Gennes and P.A.Pincus, Phys. Kondens. Materie 11, 189, 1970.
20
L E C T U R E N O T E S
[22] J. Richardi. Assemblies of Magnetic Nanoparticles, in Nanomaterials and Nanochemistry, Ed. by C.Brechignac, P.Houdy, and M.Lahmani (Springer, Berlin, 2008), p. 515.
[23] F.S.Dzheparov, O.N.Sorokina, A.L.Kovarski. JETP Lett. 89, 563, 2009.
[24] I.P.Aleksandrov, Theory of Magnetic Relaxation (Nauka, Moscow, 1975) [in Russian].
[25] V.A.Atsarkin, Dynamic Nuclear Polarization (Nauka, Moscow, 1980) [in Russian].
[26] F.S.Dzheparov, E.K.Henner. Sov. Phys. JETP 69, 1042, 1989.
[27] A. Abragam and M. Goldman, Nuclear Magnetism. Order and Disorder (Clarendon, Oxford, 1982), Vol. 2, Chap. 5.
21

L E C T U R E N O T E S
Dynamics and distribution of doped holes in the CuO2 plane of slightly doped YBa2Cu3O6 studied by Cu(1) NQR
A.V. Dooglav
Kazan State University, 420008, Kremlevskaya str., 18, Kazan, Russia
e-mail: [email protected]
Cu(1) nuclear quadrupole resonance (NQR) in slightly doped YBCO6:Ca and YBCO6:Li compounds allows us to study the incidence of doped holes on the antiferromagnetic state. Distributions of transverse (1/T2) and longitudinal (1/T1) relaxation rates of the NQR are found at low temperature, which allows us to determine a fraction of doped holes which are localized. We conclude that the holes doped in the CuO2 plane by Ca2+→Y3+ and Li+→Cu2+(2) substitution are distributed homogeneously in the CuO2 plane above 70 K and move freely in the plane. We establish that the reduction in hole mobility from metallic to variable-range hopping induces the differentiation of Cu(1) nuclei. At lower T the holes’ motion slows down and we estimate that the holes localize finally in restricted regions (4–6 lattice constants in Ca-doped samples and 2–3 lattice constants in Li-doped ones) in the Coulomb potential of the Ca2+ and Li+ ions.
22

L E C T U R E N O T E S
Modern compact EPR-spectrometers Х and L-band for wide application
E. Friese, A. Neumann, Yu. Rozentsvayg Magnettech GmbH, Germany
e-mail: [email protected]
Use of methods of an electronic paramagnetic resonance in such areas of a science as analytical chemistry, the biology and diagnostics in medicine, always was attractive.
For EPR-spectrometers applied in these purposes, unlike devices for the experimental physics, specific conditions frequently demand: readily available routine measurements, fast change of samples, simplicity of using the device. As for such measurements which have a not big range of change of a constant magnetic field and in aggregate with considerable progress of the microwave techniques in the recent time , as a rule, allows to develop spectrometer rather inexpensive, compact and accessible for a wide range of users.
Compact EPR- spectrometers offered by our firm allow not only to make routine measurements in an automatic mode for a wide range of samples from chemical objects to biological, and also researches in vivo, but for detailed scientific researches in a manual mode.
The EPR technology and the methods are permanently developed further in collaboration with world-wide leading university working groups and companies. Magnettech organises the supply and service of its products world-wide and works together with distribution partners in different countries.
Magnettech supports customers to find new solutions for special measurement tasks. The advice comprises all, from selection of Spin traps or Spin labels up to automation of measurement expiration and automatic data analysis.
The high sensitive benchtop EPR spectrometers of the series MiniScope (X-band, 9.3 - 9.55 GHz) are easy to operate, compact, PC-controlled, high performance devices for every laboratory. Samples from liquids up to solids can be measured at room temperature, - 196 °C (liquid nitrogen) or at temperatures between - 170 and + 200 °C. By the scan range of up to 400 mT (optional 550 mT) beside free radicals paramagnetic transition metal ions can be detected too.
For samples with a high share of water and in vivo EPR spectroscopy we offer modern modular EPR spectrometers of the series RadicalScope mt 500-L (picture) with a magnet especially adapted to the L-band. You can select between the scan modes spectral, spectral-spatial, 2D imaging and 3D imaging.
23

L E C T U R E N O T E S
If necessary we can provide with wide assortment general accessories such as
• Temperature Controller TC-H02
• Autosampler
• Software
• Glassware
• Surface Coil Resonator
• Re-entrant Resonator
For those whom will interest our products, and also possibilities with which we can satisfy your inquiries, we send you to our official site www.magnettech.de
24

L E C T U R E N O T E S
Non-extensive thermodynamics - a new approach to the strong correlated and nanoscopic systems
D.A. Tayurskii
Physics Department, Kazan State University, Kremlevskaya 18, Kazan, 420008, Russia
e-mail: [email protected]
Recent progress in nanophysics and the physics of strong correlatedsystem has revealed the non-applicability of basic thermodynamics for nanoscale systems and the systems with strong interactions. First of all in such systems the conditions of so-called thermodynamic limit are violated and one can not use statistical distributions (Bose-Einstein and Fermi-Dirac) to understand the physical properties of these system.
In the present talk the examples of such violations will be given and some results obtained in the framework of non-extensive thermodynamics will be reviewed. The main accent will be given on the unusual properties of such strong correlated systems as quantum liquids at nanoscale. The possible manifestation of non-extensivity in magnetic resonance problems will be reviewed also.
25

L E C T U R E N O T E S
NMR/NQR study of the Na2/3CoO2 compound
I. R. Mukhamedshin Physics Department, Kazan State University, 420008 Kazan, Russia
e-mail: [email protected]
Peculiar atomic structures such as chains, ladders or the graphene honeycomb often exhibit remarkable singular physical properties, as does the triangular cobalt network in Na cobaltates [1] which displays high thermopower [2] and superconductivity [3]. There, the control of carrier content of the CoO2 planes by varying Na concentration between the planes yields a totally counter-intuitive sequence of magnetic properties including anomalous paramagnetism [4], charge disproportionation [5], metallic antiferromagnetism [6].
In the lecture I summarize the results of our investigations of the peculiar x=2/3 phase of the lamellar sodium oxide NaxCoO2 by the 23Na and 59Co nuclear magnetic (NMR) and quadrupolar (NQR) resonances, as well as by SQUID magnetometry and X-ray diffractometry [5, 7-10].
Our study allowed us to establish reliably the atomic order of the Na layers and their stacking between the CoO2 slabs. We evidence that the Na+ order stabilizes filled non magnetic Co3+ ions on 25% of the cobalt sites arranged in a triangular sublattice. The transferred holes are delocalized on the 75% complementary cobalt sites which unexpectedly display a planar cobalt kagomé structure. These experimental results resolve a puzzling issue by precluding localized moments pictures for the magnetic properties. They establish that the quasi ferromagnetic properties result from a narrow band connecting a frustrated arrangement of atomic orbitals, and open the route to unravel through similar studies the electronic properties of the diverse ordered phases of sodium cobaltates.
The work was partially supported by Grant RNP-6183.
References
[1] C.Fouassier et al., Solid State Chem. 6, 532 (1973).
[2] I.Terasaki et al., Phys. Rev. B 56, R12685 (1997).
[3] K.Takada et al., Nature (London) 422, 53 (2003).
[4] M.L.Foo et al., Phys. Rev. Lett. 92, 247001 (2004).
[5] I.R.Mukhamedshin et al., Phys. Rev. Lett. 94, 247602 (2005).
[6] S.P. Bayrakci et al., Phys. Rev. B 69, 100410(R) (2004).
[7] I.R.Mukhamedshin et al., Phys. Rev. Lett. 93, 167601 (2004).
[8] H.Alloul et al., EPL 82, 17002 (2008).
[9] H.Alloul et al., EPL 85, 47006 (2009).
[10] T.A.Platova et al., submitted to Phys. Rev. B, (2009).
26

P R O C E E D I N G S
Theory for spin dynamics in copper oxide superconductors as obtained by Nuclear Quadrupole Resonance and Neutron Scattering
I.A. Larionov
Kazan State University, Kremlevskaya, 18, Kazan 420008, Russia
e-mail: [email protected]
We consider a relaxation function theory for a doped two-dimensional Heisenberg antiferromagnetic system with damping of paramagnon-like excitations. The Lorentzian form for the imaginary part of the dynamic spin susceptibility gives a reasonable agreement with neutron scattering experiments and plane copper nuclear spin-lattice relaxation rate 63(1/T1) data right up to optimally doped La 2 x− Sr x CuO . 4
Plane copper oxide high-temperature superconductors (high- ) are the doped =1/2 two-dimensional Heisenberg antiferromagnetic (2DHAF) systems. In the carrier free regime, the elementary excitations are spin waves [1-3], magnons in the quasiparticle language. Observations by neutron scattering (NS) of the
cT S
Tω/ scaling for the averaged over the Brillouin zone the imaginary part of the dynamic spin susceptibility,
, in the underdoped high- compounds [2,13] above is referred to a nearby quantum phase transition [1]. Nuclear magnetic/quadrupole resonance (NMR/NQR) studies [4] revealed the extension of the universal behavior of
2( ) ( )d ( 0) (T T T fχ ω χ ω χ ω ω′′ ′′ ′′, = , , ≈ , → /∫ q q )T
)
cT
cT
( Tχ ω′′ , down to the MHz frequency range. In this paper we will discuss the relaxation function theory with damping of the paramagnon-like excitations [5-7] in connection with plane copper nuclear spin-lattice relaxation rate as obtained by NQR and imaginary part of the dynamic spin susceptibility ( )χ ω′′ ,k as obtained by NS experiments.
We employ the - Hamiltonian [8] known as the minimal model for the electronic properties of high- cuprates:
t JcT
0 0 1(4t J ij i j i j i j
i j i jH t X X J nσ σ
σ−
, , >
= + −∑ ∑ S S )n , (1)
written in terms of the Hubbard operators 0iX σ that create an electron with spin σ at site
and are spin-1/2 operators. Here, the hopping integral i
iS ijt t= between the nearest neighbors (NN) describes the motion of electrons causing a change in their spins and eV is the NN AF coupling constant. The spin and density operators are defined as follows:
0 12J = .
0.5 ( )zi i i i i iS X S X n Xσ σσ σσ σσ
σ σσ σ σ= , = , = , = −∑ ∑ (2)
with the standard normalization 00 1i i iX X X++ −−+ + = .
The static spin susceptibility as derived within the - model [9] is given by, t J
14( )( )
cJg g
χγ− +
| |= ,
+ k
k (3)
and has the same structure as in the isotropic spin-wave theory [10] at all doping levels. The NN AF spin-spin correlation function is given by 1 (1/ 4) z z
i ic S ρρ += S∑ , the index ρ runs
27

P R O C E E D I N G S
over NN, and (1 2)(cos cos )x yk kγ = / +k . The parameter g+ is related to AF correlation length
ξ via the expression 1 (2 1) ( _ / ) exp(2 / )B Sg J g k T kξ π BT+= / − ≈ Sρ , where ρ is spin stiffness. The values of the parameters of the theory: c1, g_, and Sρ are given in Table I.
The relaxation shape function is given by [11]
2 21 2
2 2 2 2 2 2 21 2 1
( )[ ( )] ( )
F τ πωωτ ω ω
Δ Δ /, =
− Δ −Δ + −Δk k k
k k k k
k , (4)
where 222 ( )τ π= / Δk k , and and 2
1Δ k22Δ k are related to the frequency moments
( )n nd Fω ωω ω∞
−∞= , ,∫k k (5)
as 2 21 ωΔ =k k , 2 4 2
2 ( ) 2ω ω ωΔ = / −k k k k , the expression for the second moment is given by
( )21 1[ ] 8 4 1z z
effi S S Jc t Tω χ ⎛ ⎞⎜ ⎟− ⎝ ⎠
= , / = − − − /k k k k kγ χ ,k
B
(6)
where , and 1hT p fγ= ∑ k kk
1[exp( ) 1]hkf E k Tμ −= − + / +k is the Fermi function of holes. For
p we have , (1 ) 2p δ= + / , where δ is the number of extra holes, due to doping, per one plane Cu , which can be identified with the Sr content 2+ x in La 2 x− Sr x CuO . The excitation spectrum of holes is given by,
4
4 effE t γ=k ,k where the hoppings, , are affected by electronic and AF spin-spin correlations , resulting in effective values [5,8], for which we set
t
1c0 2efft Jδ= / . , in order to match the insulator-metal transition. The chemical potential μ is
related to δ by hp fδ = ∑ kk. Note that (F )ω,k is real, even in both and k ω , and
normalized to unity . The detailed expression for ( )d Fω ω∞
−∞, =∫ k 1 4ωk is given in [5].
We take the Lorentzian form for the imaginary part of the dynamic spin susceptibility,
( ) 2 2 2 2[ ] [ ]L sw sw
χ ω χ ωχ ωω ω ω ω
Γ Γ, = + ,
− + Γ + + Γk k k k
k k k k
k (7)
for around the AF wave vector (k )π π, . The spin-wavelike dispersion, renormalized by interactions, is given by the relaxation function [11], given by Eq. (4),
0
2 (sw d F )ω ωω ω∞
= , ,∫k k (8)
where the integration over ω in Eq. (8) has been performed analytically and exactly [7]. The
damping of paramagnon-like excitations Γk is given by 2 2( )swω ωΓ = −k k k .
The plane copper nuclear spin-lattice relaxation rate is given by
( )63 63 201
10
2 ( ) ( )1eff
BL
k T FTξ
χ ωω | |> /
= ,/ ∑k
k k , (9)
where 0ω = 2π ×34 MHz ( ) is the measuring NQR frequency. The hyperfine
formfactor for plane 63Cu sites is given by, , where
T J,
( )263 2( ) 4abF A γ= + kk B 71 7 10abA −= . ⋅ eV
28

P R O C E E D I N G S
and eV are the Cu on-site and transferred hyperfine couplings, respectively [12]. The effective correlation length
7(1 4 ) 3 8 10B δ −= + ⋅ . ⋅
effξ is given by, 1 10eff
1ξ ξ ξ− −= + − [5,13]. Thus from now on we replace ξ by effξ and 0ξ values are presented in the Table I.
The spin diffusive contribution (from small wave vectors 1 effξ< /k ) can be calculated from general physical grounds, namely, the linear response theory, hydrodynamics, and fluctuation-dissipation theorem [5-7,11,14],
63 2
631
(0) ( 0)(1 ) BDiff
F k TTDχ
π=
/ =k
Λ
ξ 1
, (10)
where = and Λ 2 2 40[1 (4 )]ln[1 ( )]effDπ ω/ + / 2
0lim[ ( 0)]q
D q Fπ −
→= q, is the spin diffusion
constant.
Table I. The calculated in the T→ 0 limit antiferromagnetic spin-spin correlation function between the nearest neighbours c1, the parameter g_, and the spin stiffness constant Sρ .
Doping c1 g_ 2 /S Jπρ 0ξ δ =0 -0.1152 4.1448 0.38 -
δ =0.04 -0.1055 3.913 0.3 1/(2δ ) δ =0.15 -0.0617 2.947 0.13 1/δ
Fig.1. The averaged over the Brillouin zone the imaginary part of dynamic spin
susceptibility versus 2( ) ( )dL Lχ ω χ ω′′ ′′= ,∫ q q Tω/ . Symbols: NS data for La1.96Sr0.04CuO4 from Ref. [13], the lines show the calculated ( )Lχ ω′′ .
Fig.1 shows the averaged over the Brillouin zone and normalized imaginary part of dynamic spin susceptibility ( T
.
)χ ω′′ , versus Tω/ . It suggests the Tω/ scaling for underdoped high- layered cuprates with a deviations in qualitative agreement with NS data [1,13].
cT
29

P R O C E E D I N G S
Fig. 2 shows the calculated with Eqs. (7) and (9) plane copper nuclear spin-lattice relaxation rate 63(1/T1) (solid lines) without any adjustable parameters. The dashed lines show the calculated 63(1/T1) without damping of the paramagnon-like excitations [5], where
(F )ω,k is related to the imaginary part of the dynamic spin susceptibility ( )χ ω′′ ,k as [5,11],
( ) ( )Fχ ω ωχ ω′′ , = ,kk k . (11)
It is worth to mention that the temperature dependence of 63(1/T1) in both theories is governed by the temperature dependence of the correlation length and by the factor kBT in agreement with [12]. At low T, where eff constξ ≈ , the plane copper 63(1/T1)∝T, as it should. At high T, the correlation length shows weak doping dependence and behaves similarly to that of carrier free La2CuO4 and 63(1/T1) of doped samples behaves similarly to that of La2CuO4.
Conclusion We have presented a relaxation function theory for dynamic spin properties of layered
copper high- in the normal state. The cT Tω/ scaling and spin-lattice relaxation at plane copper sites may be explained within the damped spin-wave-like theory, possessing a reasonable agreement with the observations by means of neutron scattering and magnetic resonance in high- layered copper oxides. cT
Fig.2. Temperature and doping dependence of the plane copper nuclear spin-lattice
relaxation rate 63(1/T1)=2W. Experimental data for La2-xSrxCuO4 from Ref. [4]. Solid lines show the results of the calculations with Lorentzian form of the susceptibility and taking into account the damping of the paramagnon-like
excitations using Eq. (7). The dashed lines show the results of the calculations without damping of the paramagnon-like excitations, after Refs. [5, 6], i.e., using
Eq. (11).
Acknowledgements This work was supported by RFBR Grant No.09-02-00777-a.
30

P R O C E E D I N G S
References [1] M. A. Kastner et al., Rev. Mod. Phys. 70, 897 (1998).
[2] S. Chakravarty, B. I. Halperin, and D. R. Nelson, Phys. Rev. B 39, 2344 (1989).
[3] M. Takahashi, Phys. Rev. B 40, 2494 (1989).
[4] T. Imai, C. P. Slichter, K. Yoshimura, and K. Kosuge, Phys. Rev. Lett. 70, 1002 (1993).
[5] I.A. Larionov, Phys. Rev. B 69, 214525 (2004).
[6] I.A. Larionov, Phys. Rev. B 72, 094505 (2005).
[7] I.A. Larionov, Phys. Rev. B 76, 224503 (2007).
[8] P.W. Anderson, Science 235, 1196 (1987); G. Baskaran, Z. Zou, and P.W. Anderson, Solid State Commun. 63, 973 (1987).
[9] A.Yu. Zavidonov and D. Brinkmann, Phys. Rev. B 58, 12486 (1998).
[10] A. Sokol, R.R.P. Singh, and N. Elstner, Phys. Rev. Lett. 76, 4416 (1996).
[11] U. Balucani, M.H. Lee, and V. Tognetti, Phys. Rep. 373, 409 (2003).
[12] A.J. Millis, H. Monien, and D. Pines, Phys. Rev. B 42, 167 (1990); Y. Zha, V. Barzykin, and D. Pines, Phys. Rev. B 54, 7561 (1996).
[13] B. Keimer, N. Belk, R.J. Birgeneau, A. Cassanho, C.Y. Chen, M. Greven, M.A. Kastner, A. Aharony, Y. Endoh, R. W. Erwin, G. Shirane, Phys. Rev. B 46, 14034 (1992).
[14] Dieter Forster, Hydrodynamic Fluctuations, Broken Symmetry, and Correlation Functions, Frontiers in Physics, Vol. 47, (Benjamin, Reading, MA, 1975).
31
P R O C E E D I N G S
The EPR investigations of the carbonizates
G.V. Mamin, A.A. Rodionov, M.S. Tagirov Department of Physics, Kazan State University, Kazan, Russia
e-mail: [email protected]
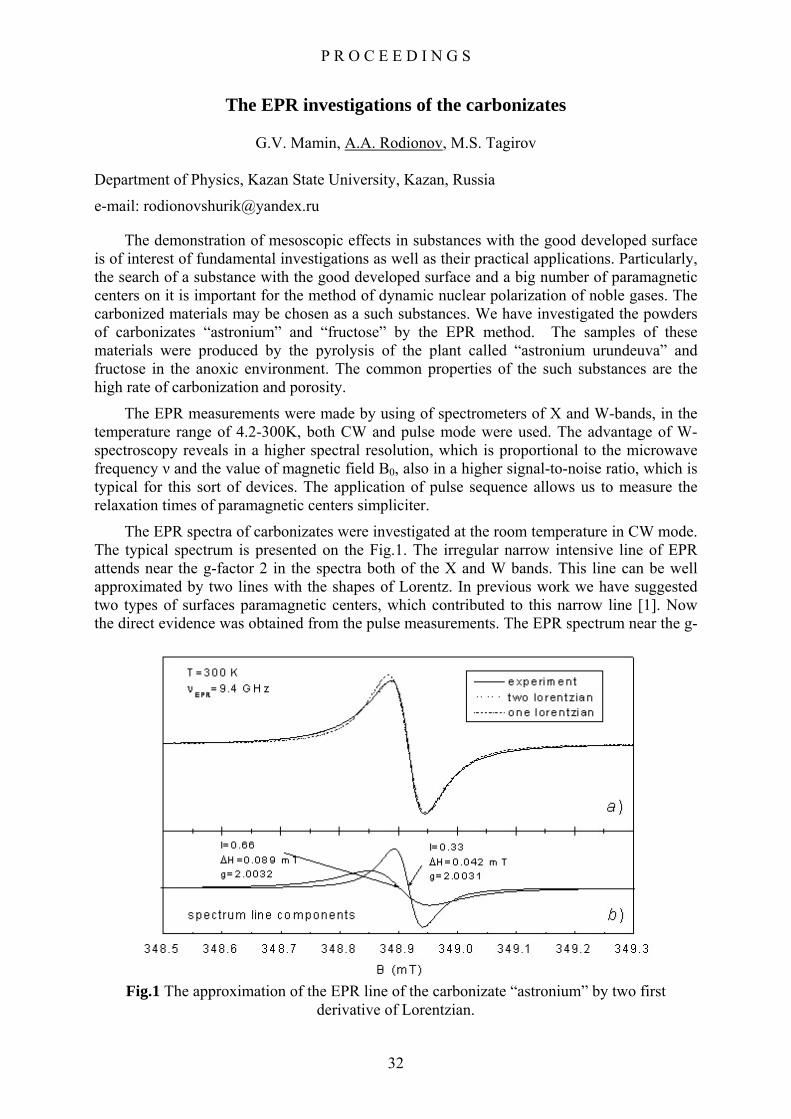
The demonstration of mesoscopic effects in substances with the good developed surface is of interest of fundamental investigations as well as their practical applications. Particularly, the search of a substance with the good developed surface and a big number of paramagnetic centers on it is important for the method of dynamic nuclear polarization of noble gases. The carbonized materials may be chosen as a such substances. We have investigated the powders of carbonizates “astronium” and “fructose” by the EPR method. The samples of these materials were produced by the pyrolysis of the plant called “astronium urundeuva” and fructose in the anoxic environment. The common properties of the such substances are the high rate of carbonization and porosity.
The EPR measurements were made by using of spectrometers of X and W-bands, in the temperature range of 4.2-300K, both CW and pulse mode were used. The advantage of W-spectroscopy reveals in a higher spectral resolution, which is proportional to the microwave frequency ν and the value of magnetic field B0, also in a higher signal-to-noise ratio, which is typical for this sort of devices. The application of pulse sequence allows us to measure the relaxation times of paramagnetic centers simpliciter.
The EPR spectra of carbonizates were investigated at the room temperature in CW mode. The typical spectrum is presented on the Fig.1. The irregular narrow intensive line of EPR attends near the g-factor 2 in the spectra both of the X and W bands. This line can be well approximated by two lines with the shapes of Lorentz. In previous work we have suggested two types of surfaces paramagnetic centers, which contributed to this narrow line [1]. Now the direct evidence was obtained from the pulse measurements. The EPR spectrum near the g-
Fig.1 The approximation of the EPR line of the carbonizate “astronium” by two first derivative of Lorentzian.
32
P R O C E E D I N G S
factor 2 consist of two lines, correspond to paramagnetic centers with the transverse relaxation time T2=0.2 and 0.6 μs.
The narrowing of the EPR line is supposed to be caused by exchange interaction between the paramagnetic centers inside the clusters [2]. However there are not direct evidences of the existence of the clusters on the surface of such carbonizates in literature. When the strange exchange interaction between the two paramagnetic centers with the spins S=½ appears, the structure of energy levels consist of triplet and singlet states [3]. The transitions with Δm = ± 1 take place between the neighbor levels of the triplet and correspond to EPR signal with the g-factor 2. At the same time the forbidden transitions with Δm = ± 2 at g=4 exist. In the clusters with more then 2 paramagnetic centers the structure of electron statement levels changes to more complicated.
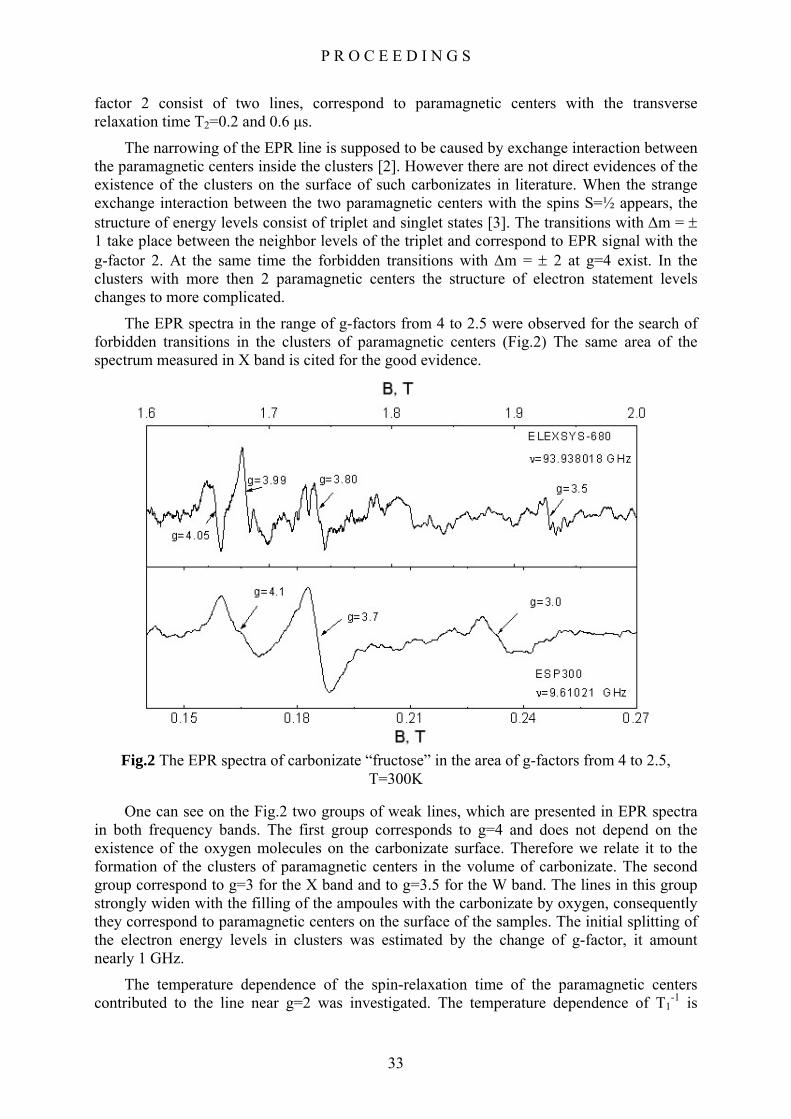
The EPR spectra in the range of g-factors from 4 to 2.5 were observed for the search of forbidden transitions in the clusters of paramagnetic centers (Fig.2) The same area of the spectrum measured in X band is cited for the good evidence.
Fig.2 The EPR spectra of carbonizate “fructose” in the area of g-factors from 4 to 2.5, T=300K
One can see on the Fig.2 two groups of weak lines, which are presented in EPR spectra in both frequency bands. The first group corresponds to g=4 and does not depend on the existence of the oxygen molecules on the carbonizate surface. Therefore we relate it to the formation of the clusters of paramagnetic centers in the volume of carbonizate. The second group correspond to g=3 for the X band and to g=3.5 for the W band. The lines in this group strongly widen with the filling of the ampoules with the carbonizate by oxygen, consequently they correspond to paramagnetic centers on the surface of the samples. The initial splitting of the electron energy levels in clusters was estimated by the change of g-factor, it amount nearly 1 GHz.
The temperature dependence of the spin-relaxation time of the paramagnetic centers contributed to the line near g=2 was investigated. The temperature dependence of T1
-1 is
33

P R O C E E D I N G S
presented on the Fig.3. It can be approximated by the straight line (T1-1= AT+B), the main
process of relaxation is the direct process in this case. But the values of relaxation times at the low temperatures obtained (T=4.2K) does not exceed the value 4 μs, it is too short for the method of dynamic nuclear polarization.
In our EPR experiments in the W-band we have observed for the first time two lines situated symmetrically from the g=2 (Fig.4). The samples of the carbonizate “astronium” only pumped without the thermal treatment during the preparation in this case. We consider these
Fig.3 The temperature dependence of the spin-lattice relaxation velocity of paramagnetic centers in carbonizate.
Fig.4 The hyperfine structure of hydrogen in EPR spectrum of carbonizate “astronium”, W-band. The signal splitting in the center is caused by overload of the resonator
34

P R O C E E D I N G S
lines to be the hyperfine structure of the paramagnetic centers. Probably it may be caused by interaction with the hydrogen atoms, such atoms belong to H2O molecules absorbed on the carbonizate surface. The subsequent experiments proved this idea. The sample of carbonizate was pumped and heated up to 200°С during the experiment preparation, the heating favoured to remove the molecules of water from the carbonizate surfaces. The intensity of the satellite lines was considerably less then in first case.
Conclusion The properties of paramagnetic centers in carbonizates “astronium” and “fructose” were
investigated by the EPR method. The existence of two types of paramagnetic centers on the carbonizate surface was established. The concentration of the paramagnetic centers is sufficient for the method of dynamic polarization, but the spin-lattice relaxation times obtained proved to be too short for the realization of this method, it will impede the sufficient saturation of EPR signal. The hyperfine structure was observed for the first time in the EPR spectra of such carbonizates. This may be the simple way to estimate the amount of water molecules on the carbonizate surfaces in following investigations of the new materials for the method of dynamic nuclear polarization.
Acknowledgments The work is partly supported by the Grant RNP – 6183 from the MSE of Russia
References [1] Tagirov, M.S. Nuclear Spin-Kinetics of He3 in Carbonizates with various Porosity / M.S.
Tagirov, A.N. Yudin, G.V. Mamin, A.A. Rodionov, D.A. Tayurskii, A.V. Klochkov, R.L. Belford, P.J. Ceroke, B.M. Odintsov // Journal of Low Temperature Physics. – 2007. – Vol.128, 5-6
[2] Clarkson, R. B. EPR and DNP of Char Suspensions: Surface Science and Oximetry / R. B. Clarkson, B. Odintsov, P. Ceroke et al // Phys. Med. Biol. – 1998. – Vol. 43.- P. 1907-1920
[3] Abragam, A. Electron paramagnetic resonance of transition ions / A.Abragam, B.Bleaney – M.: Mir, 1975-548P.
35

P R O C E E D I N G S
Temperature dependence of water diffusion through aquaporins of plant cells: spin-echo NMR study
I.F. Ionenko, M.A. Suslov
Kazan Institute of Biochemistry and Biophysics, Kazan Scientific Center of Russian Academy of Sciences, 420111, Lobachevskogo 2/31, Kazan, Russia
e-mail: [email protected]
The important role of water channels (aquaporins) in the regulation of transmembrane water transfer in plant cells is generally accepted. Aquaporins function as narrow protein pores, which facilitate essentially movement of water molecules. It has been estimated that as much as 70 - 90% of water moving from cell to cell passes via these pores [1, 2]. One of the criteria of the aquaporin presence in plant membranes is the low value of the activation energy, Ea, for water transport. It is known [3-5] that Ea values for plant membranes vary within 17-25 kJ mol-1 and differ significantly from Ea for the water flow through a membrane lipid bilayer, which is equal to 45-60 kJ mol-1. An inhibition of the water transport via aquaporins by mercurial agents, which react with sulfhydryl groups of channel proteins resulting in the closure of the channels, increases Ea to the level of that for transport through the lipid bilayer [1]. This fact was used in our work to find the temperature dependence of water transport via aquaporins of maize root cell membranes. The aim of the present work was to study temperature dependences of the diffusional water flow in maize root segments of control samples, and samples treated with the water channel blocker (mercuric chloride) with further detection of the contribution of aquaporins to the transmembrane water transfer.
Experiments were performed on roots of 7-day-old seedlings of Zea mays grown in hydroponic culture. Mercuric chloride, a potent inhibitor of most aquaporins, was used for determination of water diffusional transport under the conditions of partial water channel blocking. Water diffusion was measured in the radial direction of 10 mm long segments of the control and previously HgCl2-treated roots at the temperatures changing from 20 to 10 °C (descend) and back to 35 °C (ascend) in 5 °C steps. The temperature in the NMR diffusion-meter probe was maintained with an accuracy of larger than ±1 oC. Water diffusion was measured by the stimulated echo NMR technique [6] on the spin echo NMR diffusion-meter at a frequency of 16 MHz with pulsed magnetic field gradient. During the experiments we registered diffusional decays (DDs) of spin echo signals (Fig.1) as a function of parameters of pulse sequence: the amplitude of magnetic field gradient pulses (g), pulse duration (δ), and the interval between pulses (td), conventionally called the diffusion time. For the quantitative estimation of water diffusion transport we calculated the effective coefficient of water self-diffusion (Def) as a tangent to the initial part of the DD curve using the equation:
R = exp [-γ2 δ2 g2 (td - δ/3) Def], (1)
where R is the relative echo amplitude, which is equal to the ratio of echo amplitudes in the presence and absence of magnetic field gradient, A(g)/A(0); γ is the gyromagnetic ratio. The diffusion time, td, was chosen to be 300 ms in order to exclude the relaxational contribution to the diffusional decay of the apoplastic water, which is characterized by short spin-lattice relaxation times (T1 < 100 ms) and to reveal the region of hindered diffusion where the contribution of membrane permeability is significant.
The temperature coefficient (Q10) was determined from the temperature dependence of Def (Fig.2A). In order to evaluate Ea of water diffusion, the Arrhenius plots were obtained by plotting the logarithm of Def against the reciprocal of the absolute temperature (Fig.2B).
36

P R O C E E D I N G S
All experiments were repeated for 3 - 5 samples. Each DD is an average of 5 - 7 accumulations of the echo signal amplitude. The statistic analysis was carried out using the Microsoft Origin software. Differences between the control and variants with HgCl2 treatment were statistically significant (Р < 0.05).
Fig.1. Diffusional decays of relative echo signal amplitude, R, versus gradient pulse amplitude, g2, for control (1) and sample treated by 0.1 mM HgCl2 (2) and consecutively
treated by 0.1 mM HgCl2 and 5 mM mercaptoethanol (3).
Results
The decays of the relative echo amplitude R plotted against the amplitude of gradient pulses g2 were non-exponential for maize root segments (Fig.1). DD dynamics is inherent in the translational diffusion of water molecules restricted within compartments with permeable walls and also in the relaxational redistribution of contributions of various water fractions to the echo signal.
The 15-min treatment of roots with 0.1 mM mercuric chloride slowed down the diffusional decay and decreased, correspondingly, the intensity of water diffusion transfer by about 30 % as compared to the control. The inhibition of water diffusion was reversible by a 15 min exposure of HgCl2-treated roots in 5 mM β-mercaptoethanol that points to the absence of any essential side effects caused by the HgCl2 treatment [7].
Fig.2 shows the temperature dependence of the relative value of Def for the control and HgCl2-pretreated maize roots. For relatively narrow temperature intervals, where the measurements were carried out without cell damage (10 – 35 °C), Def values increased with the increase in temperature. The Arrhenius plots of both control and HgCl2-treated roots (Fig.2B) had linear portions between 20 and 10 oC and between 25 and 35 oC. Ea values obtained from the slopes of linear portions of the graphs differed in various temperature intervals. Q10 and Ea values of Def in the temperature range of 20 – 10 oC for the control and the HgCl2-pretreated samples are similar to those for the bulk water (1.25±0.1 and 17±2 kJ
37

P R O C E E D I N G S
mol-1) and close to the literature data obtained for water passage across cell membranes [3, 5, 7, 8]. In the temperature range of 25 to 35 °C, Q10 and Ea values of Def increased much more than those for the bulk water and varied for the control and the treated samples (1.45±0.2 and 31±3 kJ mol-1 for the control and 1.6±0.2 and 40±3 kJ mol-1 for the treated sample). The low and high temperature portions of the Arrhenius plot intersected at 20 oC. The difference in Ea at different temperature intervals may be related to a variable contribution of the water channel path as compared with other parallel pathways with different Ea. The significant change in the slope of the Arrhenius plot at 20 – 25 oC for HgCl2-pretreated roots suggests that the water channels significantly contribute to water transport only within the optimal temperature region.
Fig.2. Temperature dependences of water diffusion transfer for the control (1) and HgCl2-pretreated (2) maize roots. In (A), Def values were normalized using the Def at 20ºC as the reference. Q10 values were evaluated from plots given in (A). From Arrhenius plots
of normalized Def values (B), activation energies Ea were calculated.
In order to separate the component of water transfer via HgCl2- sensitive aquaporins, the temperature dependence of the difference of two curves in Fig.2A (Def contr/ ) – (Def
Hg/ ) was plotted. This dependence (Fig.3) had an extremum at 20 oC. The increase in the
20efD
20efD
38

P R O C E E D I N G S
Fig.3. Temperature dependence of water diffusion mediated by mercury-sensitive aquaporins
diffusional flow at the temperature of about 20 oC exceeded 1,5 times the increase in the diffusion of bulk water caused by the temperature increase. Presence of extremum in the region of the optimal temperature points to the possibility of regulation of the diffusional water transfer via HgCl2-sensitive aquaporins at the environmental temperature changes. There are a great number of data showing the possibility of regulation of aquaporin activity in response to various effects: water and salt stresses, low temperature, pressure pulses [8-10]. Possible mechanisms of regulation are discussed from the point of view of changes in conformation of water channel proteins (a cohesion/tension mechanism, [9]; energy-injection model, [10]).
Thus, the results of temperature measurements indicate that water diffusion via mercuric chloride-sensitive aquaporins is temperature-sensitive. In different temperature intervals the contribution of concurrent membrane pathways of water transport (protein channels, lipid bilayer) changes. Within the region of optimal temperatures, the water transfer via aquaporins is preferential. At the higher temperatures (above 25 oC), the contribution of the lipid bilayer to the transmembrane water transfer increases.
This research was supported by grants 08-04-01258 from Russian Foundation for Basic Research
References
[1] Henzler T., Steudle E. Reversible closing of water channels in Chara internodes provides evidence for a composite transport model of the plasma membrane. - J. Exp. Bot. 46: 199-209, 1995.
[2] Maurel C., Chrispeels M.J. Aquaporins. A molecular entry into plant water relations. - Plant Physiol. 125: 135-138, 2001.
[3] Hertel A., Steudle E. The function of water channels in Chara: the temperature dependence of water and solute flows provides evidence for composite membrane transport and for a slippage of small organic solutes across water channels. - Planta 202:
39

P R O C E E D I N G S
324-335, 1997.
Wan X., Zwiaz[4] ek J.J. Mercuric chloride effects on root water transport in aspen
[5] perature in roots of
[6] Use of the stimulated echo in NMR diffusion studies. - J. Chem. Phys. 52:
[7] nert H.J., Maurel S., Steudle E., Smith J.A.C. Plant aquaporins: their
[8] tz C.M., Bramley H. Plant aquaporins: multifunctional water and
[9] of water
[10] udle E., Hartung W. Gating of water channels (aquaporins) in cortical cells
seedlings. - Plant Physiol. 121: 939-946, 1999.
Lee S.H., Chung G.C., Steudle E. Gating of aquaporins by low temchilling-sensitive cucumber and chilling-tolerant figleaf gourd. – J. Exp. Bot. 56: 985–995, 2005.
Tanner J.E.2523-2526, 1970.
Tyerman S.D., Bohmolecular biology, biophysics and significance for plant water relations. - J. Exp. Bot. 50: 1055-1071, 1999.
Tyerman S.D., Niemiesolute channels with expanding roles. – Plant Cell Environ. 25: 173-194, 2002.
Ye Q., Wiera B., Steudle E. A cohesion/tension mechanism explains the gatingchannels (aquaporins) in Chara internodes by high concentration. – J. Exp. Bot. 55: 449–461, 2004.
Wan X., Steof young corn roots by mechanical stimuli (pressure pulses): effects of ABA and of HgCl2. - J. Exp. Bot. 55: 411–422, 2004.
40

P R O C E E D I N G S
Calculations of phase memory times in CaWO4:Yb3+
E.I. Baibekov
Kazan State University, 420008, Kremlevskaya 18, Kazan, Russian Federation
e-mail: [email protected]
Abstract
The phase relaxation processes of Yb3+ ions in the CaWO4 crystal are theoretically investigated. Variations of the phase memory times TM with magnitude and direction of external magnetic field are interpreted in terms of spectral and instantaneous diffusions. The calculated values of TM agree very well with the experimental data for both X- and W-band EPR.
Introduction
It has been proposed in [1] that rare earth solid-state qubits based on the entangled electron-nuclear states of Kramers rare earth ions may be suitable for scalable quantum information processing at liquid helium temperatures. The single qubit figure of merit QM=ΩRΤΜ/π (where ΩR is the Rabi frequency) can be as large as 104 at liquid helium temperatures for such systems due to high TM values. In particular, for the CaWO4 single crystal doped with the Yb3+ ions (0.0025 at. %) QM reaches the value of 6400 [2]. The corresponding TM~100 μs, which is longer by more than two orders of magnitude than that observed in the Single Molecular Magnet V15 where TM ~ 0.80 μs [3]. Since one should find a host with the comparatively long TM to consider the rare earth ion as a feasible qubit in the high frequency EPR, it is of a considerable interest to reveal the mechanisms of phase relaxation of Yb3+ ions in CaWO4.
The Yb3+ ions substitute for Ca2+ ions in CaWO4 at sites with the S4 point symmetry and have an anisotropic g-tensor in the ground state (g|| = 1.054, g⊥ = 3.914 [4]).
Examples of the EPR spectra of the Yb3+ ions in CaWO4 collected with the 2–pulse echo at X and W bands are shown in Fig. 1 [2]. The spectra consist of a central line corresponding to even ytterbium isotopes with nuclear spin I = 0 and several hyperfine satellites due to odd isotopes 171Yb (14.4%) and 173Yb (16.2%) with I = 1/2 and 5/2, respectively. θ denotes the angle between the crystal c-axis and the magnetic field B0.
Methods The phase relaxation processes in the paramagnetic crystals like CaWO4:Yb3+ are due to the
fluctuations of local magnetic fields at the sites of magnetic ions.
In turn, local magnetic fields at Yb3+ are induced by various interactions:
1. The short-range exchange interactions between Yb3+ ions. Due to low Yb3+ concentration they are negligible.
2. The magnetic dipole (MD) interactions between the Yb3+ ions, which result in the static
broadening of the EPR line with the half-width 2
2 2 11/ 2
49 3
dBgπω μ −Δ = C [5], where C is the
41
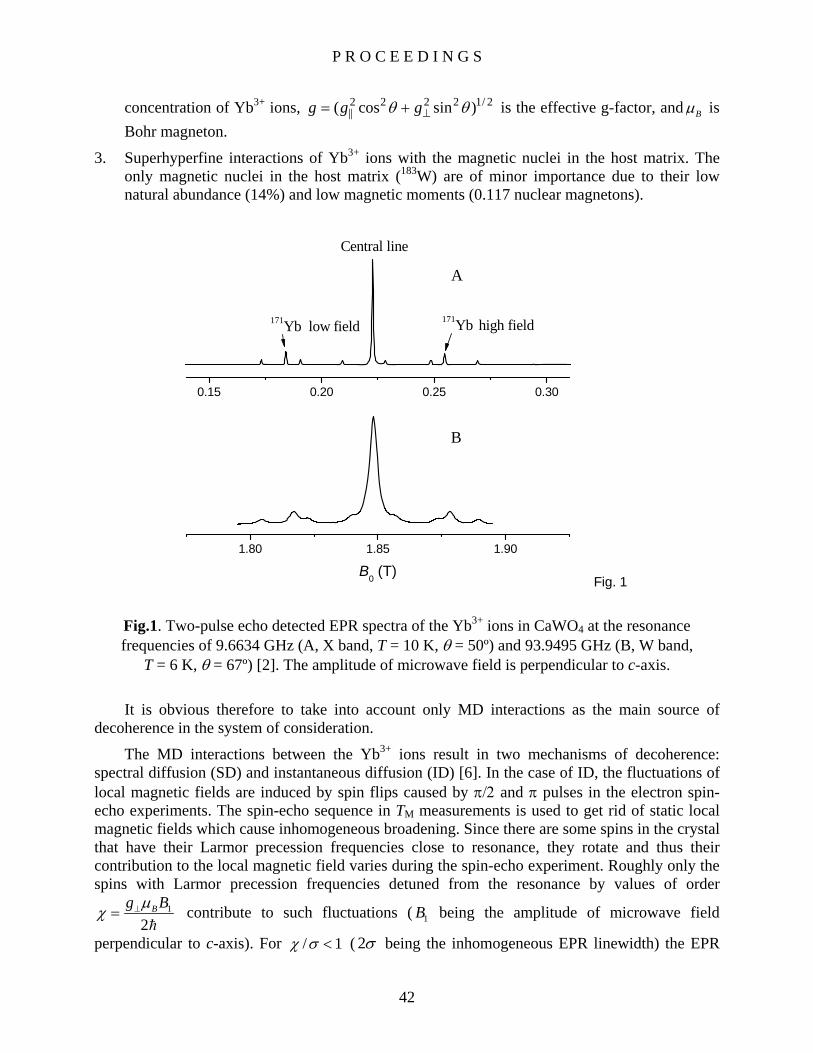
P R O C E E D I N G S
concentration of Yb3+ ions, is the effective g-factor, and2 2 2 2 1/||( cos sin )g g gθ θ⊥= + 2
Bμ is Bohr magneton.
3. Superhyperfine interactions of Yb3+ ions with the magnetic nuclei in the host matrix. The only magnetic nuclei in the host matrix (183W) are of minor importance due to their low natural abundance (14%) and low magnetic moments (0.117 nuclear magnetons).
1.80 1.85 1.90
0.15 0.20 0.25 0.30
B
B0 (T)
171Yb low field
A
171Yb high field
Central line
Fig. 1
Fig.1. Two-pulse echo detected EPR spectra of the Yb3+ ions in CaWO4 at the resonance frequencies of 9.6634 GHz (A, X band, T = 10 K, θ = 50º) and 93.9495 GHz (B, W band,
T = 6 K, θ = 67º) [2]. The amplitude of microwave field is perpendicular to c-axis.
It is obvious therefore to take into account only MD interactions as the main source of decoherence in the system of consideration.
The MD interactions between the Yb3+ ions result in two mechanisms of decoherence: spectral diffusion (SD) and instantaneous diffusion (ID) [6]. In the case of ID, the fluctuations of local magnetic fields are induced by spin flips caused by π/2 and π pulses in the electron spin-echo experiments. The spin-echo sequence in TM measurements is used to get rid of static local magnetic fields which cause inhomogeneous broadening. Since there are some spins in the crystal that have their Larmor precession frequencies close to resonance, they rotate and thus their contribution to the local magnetic field varies during the spin-echo experiment. Roughly only the spins with Larmor precession frequencies detuned from the resonance by values of order
1
2Bg Bμχ ⊥= contribute to such fluctuations ( 1B being the amplitude of microwave field
perpendicular to c-axis). For / 1χ σ < ( 2σ being the inhomogeneous EPR linewidth) the EPR
42

P R O C E E D I N G S
line is only partially excited. The corresponding relaxation rate is given by the expression 2 2
ID 1/ 2 sin2
d θωΓ = Δ [6]. Here 2θ is the spin nutation angle during the π pulse, <…> denotes
averaging over the distribution of the Larmor frequencies of paramagnetic ions.
In the case of SD, the fluctuations of local magnetic fields are induced by spin flips caused by the spin-lattice interaction (the corresponding spin-lattice relaxation rate 1 11/ dW T / 2ω= Δ ) and thus are independent of /χ σ . Their contribution into 1/TM in that case is estimated as
SD 1/ 2 / 2d WωΓ = Δ [6].
Results and discussion
At the X band, due to low values of W, IDΓ prevail over SDΓ . Since is proportional to the number of spins excited by microwave pulses, the calculated phase memory times
for odd Yb isotopes with essentially smaller concentrations (in particular, measured for the high-field and low-field hyperfine components of the 171Yb spectrum, see Table I) are several times longer than that of even isotopes at the same experimental conditions. The
IDΓ
( 1ID SD
dMT −= Γ + Γ )
dMT
values shorten with the increment of θ because the increase of the corresponding effective g-factor results in the increase of 1/ 2
dωΔ and IDΓ . The calculated values of dMT are presented in
Table I, showing good agreement with the experimental data.
Table I. The measured spin-lattice relaxation (T1) and phase memory (TM) times, the period (TR) of the Rabi oscillations, and the calculated phase memory times ( d
MT ) for different values of the angle θ between the magnetic field and the c-axis in the CaWO4 :Yb3+ (0.0025 at. %) single
crystal.
Frequency θ EPR lines T1, ms TM, μs
dMT ,
μs
TR, ns
Central (even isotopes)
13.1 19 24 43
171Yb low field 13.7 92 170 42
10o
171Yb high field 10.7 134 150 42 13o Central - 16 <21 41
Central - 10 <14 43 171Yb low field 16.9 74 100 44
20o
171Yb high field - 85 <130 46 71o Central 12.2 4.1 2,8 37
X-band
90o Central 18.5 3.1 2,5 45 67o Central 0.064 13 8,5 160
Central 0.061 14.5 7.5 42 171Yb low field 0.059 13.6 10.4 41
W-band 84o
171Yb high field 0.060 13.7 10.4 42
43

P R O C E E D I N G S
At the W-band T1 shortens in accordance with the well known frequency dependence of the spin-lattice relaxation induced by the one-phonon processes. However, the phase memory times (13-14 μs) increase noticeably as compared with TM ≈ 3 - 4 μs, measured for the close orientations of the magnetic field (θ = 71º and 90o) at the X band. The slowing down of the decoherence rate can be explained again in terms of ID and SD processes. Due to an increase of the inhomogeneous line width at the W-band, the ratio /χ σ decreases from nearly 1.3 for X band to 0.09 which makes the ID decoherence mechanism ineffective. On the other hand, the SDΓ values increase considerably due to T1 shortening. Therefore, in contrast to the X band case, the phase relaxation at W band is mostly determined by SD processes. Thus, since SD process is isotope-independent, the values of TM at W band are nearly the same for both even and odd Yb isotopes.
Summary The phase relaxation times of Yb3+ ions were calculated for both X- and W-band EPR by
taking into account ID and SD mechanisms. The calculated values of TM are found to be very close to the experimental ones. The particular dependence of TM on the Yb isotope, on θ and on the frequency band is explained as well. The relatively high coherence time makes rare-earth ions useful as qubits in quantum computing as it has been proposed recently.
References [1] S. Bertaina, S. Gambarelli, A. Tkachuck, I. N. Kurkin, B. Malkin, A. Stepanov, and B.
Barbara, Nature nanotechnology 2, 39 (2007).
[2] R.M. Rakhmatullin, I.N. Kurkin, G.V. Mamin, S.B. Orlinskii, M.R. Gafurov, E.I. Baibekov, B.Z. Malkin, S. Gambarelli, S. Bertaina, B. Barbara, Phys. Rev. B 79, 172408 (2009).
[3] R. N. Shakhmuratov, F. M. Gelardi, and M. Cannas, Phys. Rev. Lett. 79, 2963 (1997).
[4] J. Kirton and R. C. Newman, Phys. Lett. 10, 277 (1964).
[5] W.B. Mims, Phys. Rev. 168, 370 (1968).
[6] K.M. Salikhov, S.A. Dzuba, and A.M. Raitsimring, J. Magn. Res. 42, 255 (1981).
44

P R O C E E D I N G S
EPR investigation of the spin-spin interaction in the Fe2Y2 cluster
M.M. Bakirov1), A. Sukhanov1), A. Baniodeh2), V. Voronkova1), G. Novitchi2,3), C.E. Anson2), A.K. Powell2)
1) E.K. Zavoisky Physical-Technical Institute of the Kazan Scientific Center of the RAS,
Kazan, Russian Federation
2) Institut für Anorganische Chemie der Universität Karlsruhe, Engesserstr. 15, D-76131 Karlsruhe, Germany.
3) State University of Moldova, Chisinau, Moldova
e-mail: [email protected]
The interest to polynuclear clusters has increased after the discovery that their magnetization may relax very slowly at low temperatures. Such molecules have been called single-molecule magnets (SMM) since their behavior is similar to that of bulk magnets. The most known single-molecular magnet is a cluster of [Mn12O12(CH3-COO)16(H2O)4]*4H2O*2CH3COOH [1,2]. The design of SMMs has become a hot area of research due to the potential applications of such clusters in new storage and information-processing technologies.
Recently tetranuclear cluster Fe2Dy2 which shows SMM behavior was synthesized. The cluster Fe2Y2 was synthesized and investigated to study the spin-spin interaction between Fe(III) ions in the cluster Fe2Dy2.
Polycrystalline samples were investigated on a Bruker EMX plus spectrometer equipped with an ER4102ST universal X-band resonator and a 4116DM dual-mode resonator in the temperature range of 293-4K. EPR spectra of the Fe2Y2 cluster in perpendicular mode of X-band are shown on Fig.1, and EPR spectra in parallel mode of X-band are shown on Fig.2
Analysis of temperature dependence of EPR spectra of Fe2Y2 allowed referring part of
0 2 0 0 0 4 0 0 0 6 0 0 0 8 0 0 0 1 0 0 0 0
2 8 0 K1 6 0 K
1 0 0 K
9 0 K
8 0 K
H , O e
X 0 ,0 5
7 0 K
5 0 K
4 5 K
4 0 K
3 5 K
3 0 K2 5 K2 0 K1 5 K1 0 K8 K4 K
Fig.1 Temperature dependence of EPR spectrum of polycrystalline samples Fe2Y2 in perpendicular mode of X-band. Signals from single Fe(III) and Mn(III) ions are in square
brackets.
45

P R O C E E D I N G S
0 5 0 0 1 0 0 0 1 5 0 0 2 0 0 0 2 5 0 0 3 0 0 0
6 0 K5 0 K4 0 K3 0 K2 0 K1 5 K1 0 K8 K6 K
H , O e
4 ,3 K
P a ra lle l m o d e
fre q u e n cy= 9 .4 6 3 1 0 5 G H z
signals at 4.2 K in H~1500 Oe and Н~3200 Ое to single Fe and Mn ions impurities, correspond. All others signals correspond to transitions in excited multiplets.
Fig.2. Temperature dependence of EPR spectrum of polycrystalline samples Fe2Y2 in parallel mode of X-band.
Analysis of shape of experimental EPR spectrum carries out by agreement with calculated spectrum. Interaction between iron ions with S1=S2=5/2 is described by Hamiltonian:
2 3 2
1,2
2 2 2 21 1 1 1 1 2 2 2 2 2
H ( ) ( )( ) 3 ( )( ) ( )
1 1[ ( 1)] ( ) [ ( 1)] (
3 3
j
2 2 )Fe z Fe x y Fe z Fe x y
r r
D S S S E S S D S S S E S S
β β − −
=
= + − +
+ − + + − + − + + −
∑ j j 1 1 2 2 1 1 2 2 1 12 2Hg S g S g S g S r g S r S J S +
, (1)
where Sj is spin of j ion, gj is g- factor of j ion., β is magneton of Borh, DFe and EFe are ZFS parameters.
The best-fit result of the simulation is shown on Fig.3. Spectrum is calculated by taking into account isotropic exchanged interaction with J= 13 cm-1, dipole-dipole interaction, and ZFS parameters of Fe(III) ion : DFe = -0.266 cm-1, EFe= 0.044 cm-1 , g=1.98. Analysis of the EPR spectrum shows that basic part of signals is due to transitions in the spin state with total spin S=2.
Using the parameters of DFe = -0.266 cm-1 and EFe= 0.044 cm-1, we can estimate the splittings of the excited spin states with S=1 and S=2
11
32 371.15
5 10S Fe S SD D D cm−= −= − + = − (2)
and 1
2
20 410.12
21 42S Fe S SD D D cm−= −= − + = . (3)
The obtained value of DS=1 >0.3 cm-1 explains why EPR signals corresponding to transitions in the spin state S=1 are not detected in X-band. The EPR investigation of Fe2Y2 cluster shows that two iron ions antiferromagnetically coupled and ground spin state is multiplet with S=0 (Fig.4).
46

P R O C E E D I N G S
0 2000 4000 6000 8000 10000
H, Oe
sim
exp
Fig.3. Experimental EPR spectrum of Fe2Y2 in X-band at T=30 K and simulated spectrum for dimer Fe(III)- Fe(III) with S1=S2=5/2, J = 13 см-1, DFe = -0.266 см-1 , EFe= 0.044 см-1 , g=1.98. Dipole-dipole contribution calculated in the model of point dipoles for R=3.25 A.
S=0 J
2J
3J
4J
5J
S=1
S=3
S=4
S=5
S=2
References
Fig.4. Spin states and splittings of Fe2Y2 cluster.
[1] R. Sessoli, D. Gatteschi, A. Caneschi and M. A. Novak, Nature,1993,365, 141
[2] D. Gatteschi, R. Sessoli and A. Cornia. Single-molecule magnets based on iron(III) oxo clusters, Chem. Commun.(2000) 725–732
47

P R O C E E D I N G S
Super-hyperfine structure (SHFS) of EPR spectra of U3+ ion in Van Vleck paramagnet LiTmF4
L.K. Aminov, A.A. Ershova, S.L. Korableva, I.N. Kurkin, B.Z. Malkin, A.A. Rodionov
Kazan State University, 420008 Kazan,18 Kremlyovskaya str., Russian Federation e-mail: [email protected]
EPR spectra in the single crystal were measured in [1]. The pronounced SHFS of the spectra has been revealed which is evidently due to the super-hyperfine interaction between the 5
4 :LiLuF U
f electrons and nuclear magnetic moments of the nearest ligands. To obtain more details of the coupling of 5 f electrons with ligands, it was interesting to investigate EPR spectra of ion in other double fluorides, and in this report we present some results of EPR investigations of the and single crystals (for more details see [2]).
3U +
4 :LiTmF U 4 :LiYF U
The tetragonal crystal is especially interesting since it is a typical Van Vleck paramagnet [3]. The ground multiplet 3
4LiTmF
6H of the Tm3+ ion is split by a crystal field so that the ground state is a singlet of the point symmetry group . The first excited level is a doublet , separated from the ground level by 31 cm-1 and coupled to it by transverse magnetic field (
2Γ 4S
3,4Γ
, ; ||x yB B z c -axis of the crystal), while the nearest singlet level , coupled to the ground one by longitudinal field (
2Γ
zB B= ), has an energy of 282 cm-1. The isotope with a nuclear spin
169
1/ 2ITm
= has a 100% abundance, the nuclear magnetism being essentially enhanced due to hyperfine interaction. The effective gyromagnetic ratio becomes highly anisotropic tensor with || ||(1 ) 2.73I Iα γ γ= + = (1 ) 67.5 I and Iγ α γ γ⊥ ⊥+ = / 2, where I= γγ π
0.37R
=-3.540 MHz/T for the Tm nucleus [3]. Due to such large magnetic moment the super-hyperfine interactions of a doped paramagnetic ion with thulium nuclei disposed in an undistorted crystal at a distance of 3 ≈ nm may be compared to that with fluorine nuclei disposed at distances and 1R ≈ 0.222 0.227R2 ≈ nm. Indeed, the appearance of the EPR spectra of U ion in is strikingly different from that in isomorphic diamagnetic crystals (see Fig.1) and .
3+
LiYF
g 1.213g =
2.659g = 238U3:
4LiTmF
4LiLuF 4
The spectra have an axial symmetry and are described by -factors: , . These spectra are due to even isotope with natural abundance 99.28%. For
comparison, the EPR spectrum in
||
⊥
4LiLuF U + is presented in Fig.1(a), the spectrum in the diamagnetic host matrix doesn’t depend on temperature in the considered temperature interval.
The complex structure of the observed EPR spectra is due to the super-hyperfine interaction of unfilled 5 f -electron shell with nuclear magnetic moments of ligands. The nearest ligands of U 3+ ion are two fours of fluorine ions (see Fig.2), and the super-hyperfine interaction with their nuclear moments is responsible for the structure of the spectrum in Fig.1(a) [1]. The sharp difference of the spectra in 3:4
3:4+ from those in LiTmF U LiLuF U +
and 3:4iYF U + 5 is most probably explained by additional interaction of L f -electrons with strongly enhanced magnetic moments of thulium nuclei.
48

P R O C E E D I N G S
a
Below radius vectors coordinating the 3U + ion (origin) with fluorine ions of the first and second coordination spheres and thulium ions will be designated as , , and , respectively.The ground multiplet
1R 2R 3R4
9/2I of the 3U + ion in 34 :LiRF U + crystals is split by the
tetragonal crystal field so that the lowest Kramers doublet is separated from excited doublets by the significant interval exceeding 200 cm-1 [4, 5]. Therefore, when analyzing EPR spectra of these ions, it is possible to neglect mixing of different doublets by an applied magnetic field and to consider only the subspace of the ground doublet states α and β θ α= connected by the time reversal operator θ . The basis states are considered as eigenstates of an “effective spin” operator ( , zS 1/ 2S = 1
2 ,z zS S 12α α β= = − β
ˆ
S
), then an arbitrary electronic operator O referring to the ion is projected to the spin subspace as follows:
ˆ ˆ ˆ ˆ ˆ ˆ2 | | | | | | .zO O S O S Oα α α β β α+ −= ⟨ ⟩ + ⟨ ⟩ + ⟨ ⟩ (1)
0,540 0,545 0,550 0,555 0,560Magnetic field (T)
(b)
1
2
3
0,540 0,545 0,550 0,555
(a)
Fig.1. EPR signals in 238 34 :LiLuF U +
(a, 9.42v = GHz, 10T = K) and 3
4 :LiTmF U + (b, 9.35v = GHz) at temperatures 13 (curve 1) and 6 (curve 2) K in the magnetic fields parallel to the c-axis. The simulated spectrum is
represented by the curve 3.
b
U3+
F−
Tm3+
Li+
Fig.2. A half of the Bravais cell of 4LiTmF crystal centered in the 3Tm + position occupied by the impurity 3U + ion (a); a projection of the cell
on the ab -plane (b) (not to scale).
49

P R O C E E D I N G S
Let us consider the paramagnetic center ( 238 3U + ) with the total angular moment and its ligands (eight
JF − and four ions) in the magnetic field , the interaction between ligands
is neglected as usual [6, 7]. The Hamiltonian of the system includes the electron Zeeman term, the nuclear Zeeman terms, the interaction of 5
3Tm + B
f electrons with the fluorine and thulium nuclear spins:
( ) ( ) ( )( )i i iJ B
iH g μ= + − + ,γ∑BJ B N I (2)
here Jg is the Lande factor and μB is the Bohr magneton, the sum is over ligands, ( )iγ is the effective nuclear gyromagnetic factor for the i-th ligand. The vector is given in the general form in terms of one-electron operators in [6]. It includes terms due to dipole-dipole interaction, to small admixture of -, -orbitals of the nearest ligands to
( )iN
s p f -orbitals of the central ion (see [6, 8, 9]) and to exchange interactions between 3U + and ions. The Hamiltonian (2) may be presented in an effective form (1) as follows:
3Tm +
( ) ( ) ( ) ( ) ( )ˆ ( )i i i i ieff q B q p p
q i pH g S B T I Sν ν ν ν
ν ν
μ γ γ⎛ ⎞
= + − +⎜ ⎟⎝ ⎠
∑ ∑ ∑B I , (3)
where ( ) ( )2 , 2i ipz J p pz pg g J T N ,α α α= ⟨ ⟩ = ⟨ α⟩ etc. The SHFS “tensors” within each
four of equivalent ligands are connected by symmetry operations. Within the phenomenological approach three sets of components , , and for different fours of ligands ( and Tm , respectively) are independent parameters of the model.
( )iT
(1)pvT (2)
pvT (3)pvT
1, 2F F
The electronic Zeeman energy is much greater than other terms in (3), and its diagonalization at brings to two energy levels || zB 1
2 || BE g Bμ± = ± ( ), separated by the interval
|| zzg g=
|| 0Bg Bμ ω= . The corresponding eigenstates 12zM = ± in this case coincide
with α and β . The nuclear part of the Hamiltonian (3) is diagonalized independently in each electronic state; this procedure reduces to diagonalization of individual ligand Hamiltonians at fixed electronic state ( zH M )( )i
zM :
( ) ( ) ( ) ( ) ( ) ( ) ( ) ( ) ( ) ( )( ) (1 ) (1 ) = ( )i i i i i i i i iz I zz z z pp pz p I eff z
pH M BI M T I Mγ α α γ
⎡ ⎤= − + − +⎢ ⎥
⎣ ⎦∑ .iB I
For fluorine ion, ( ) 0Fα = . Therefore the problem once again is reduced to diagonalization of the Hamiltonian of the spin 1I 2= in an effective magnetic field:
The energies are as follows: ||( ) (1 ), (1 ), ( )(1 ) .eff z z xz z yz z zzM M T M T M T Bα α⊥ ⊥⎡ ⎤= + + − +⎣ ⎦B α
2 2 2 21 1||2 2( ) ( ) ( ) (1 ) (1 )z I eff z I z zz z tM B M M T B M Tε γ γ α± ⊥= ± = ± − + + + 2α
),
( 2 2 2t xz yzT T T= + and the corresponding eigenstates will be denoted as ,zM ± .
The intensity of the electron-nuclear transition between states ,zM m and ,zM m′−( )t z⊥B ,r q
due to the microwave field is described by two quantities : 1
2 2 212
2 2 212
| , | | , | | , | | , | [1 ( ) ( )],
| , | | , | | , | | , | [1 ( ) ( )],z z z z e z e z
z z z z e z e z
r M M M M A M M
q M M M M A M M
μ μ
μ μ⊥ ⊥
⊥ ⊥
= ⟨ + − +⟩ = ⟨ − − −⟩ = + −
= ⟨ − − +⟩ = ⟨ + − −⟩ = − −
n n
n n
where μ⊥ is the electronic magnetic moment projected on the , 1B | |z zA M Mμ⊥= ⟨ − ⟩( ) ( ) / ( )
and
e z eff z eff zM M B M=n B .
50

P R O C E E D I N G S
The electron-nuclear levels and resonance transitions are shown in Fig.3 for one ligand. The whole energy spectrum is obtained as a result of superposition of such diagrams related to all ligands, so the energy of electron-nuclear state (1) (2), ( ), ( ),...z z zM m M m M equals:
. Here ( ) ( ) ( ) ( )||( , ) ( ) (i i i
z z B z I effiE M m M g B m M B Mμ γ= +∑ )i
z( ) 1
2( )izm M = ± for ,zM ±
states. For nonequivalent ligands, the number of sublevels is in general case, and the spectrum consists of lines, intensities of these lines are defined as follows:
N 2N
22 N
( ) ( ) ( ) ( )( ) ( ) ( ) | | ( ) | |(| , | , ) ( ) ( )i i i ii i i m m i
z z iI M m M m r q m m′ ′+ −′⟩ ↔ − ⟩ =∏ .
When some ligands are equivalent, the degeneracy of nuclear sublevels arises, and the spectrum is simplified. For four equivalent ligands the scheme of five equidistant sublevels is obtained with energies
||( , ( )) ( ) ( )z z z B I z eff zE M I M M g B I M B M ,μ γ= +
where . The multiplet ( ) 0, 1, 2zI M = ± ± ( )zI M consists of states ( ) ( )izm M , for which
. The spectrum in this case includes 25 lines, shifts of these lines relative to the central line with the frequency
( ) (izm I M=∑ )
0ω are defined by the quantities ( , ) ( ) ( ) ( ) ( )z eff z z eff zI I I M B M I M B M′ ′Δ = − − − , 1
2( zM )= . The general picture for three fours of equivalent ligands is obtained by combination of three above-described spectra.
At first we consider the dipole-dipole contribution to SHFS. For numerical estimates we use the fluorine gyromagnetic ratio
/ 2 40Iγ π = MHz/T [6] and ligand coordinates
1 0.222R = nm, 1 67.6θ = ° , nm, 2 0.227R =
2 38.6θ = ° [10 11], where iθ are angles between the c-axis and radius-vectors iR . For thulium nuclei / 2 3.54Iγ π = − MHz/T,
3 0.370R = nm, 3 44θ = ° . Taking into account given above values of and amplification factors
||g
||α and α⊥ for thulium nuclear moment, we obtain the following effective fields on the ligand’s nuclei (components parallel to the c-axis and
perpendicular to it are indicated in MHz,
( ) ( )i i id
( ),d I effγ=B B
0.55B = T):
Fig.3. Energy levels scheme.
| M=1/2>
|-M>
hν
ε(M)
ε(-M)
r q
|+(M)>
|-(M)>
|+(-M)>
|-(-M)>
(1) ( 22 2.3 , 4.36 )d z zM MΒ = − − (2) ( 22 3.20 ,5.50 )d z, zM M= − +B (3) (5.3 0.11 ,7.96 )d z z, M M= +B .
The spectrum obtained by making use of is far from the experimental one for (3)dB
34 :LiTmF U + . Partly it may be explained by that the Tm3+ ion in the vicinity of the doped
ion occurs in the distorted crystal field, and its excited doublet 3U +3,4Γ is split. The optical
spectroscopy data and calculations showed that in the case of the doped ion (unfilled 3Nd +
34 f shell) the first excited level of the nearest Tm3+ ions has energy of ~20 cm-1 instead of 31cm-1 in a regular position [12, 13]. For this energy interval, the value of (3)
dB⊥ is close to 14MHz. However, the dipolar contribution appears insufficient even with this refinement, and other interactions must be taken into account. Rather well approximation to the experimental
51

P R O C E E D I N G S
data is obtained if one takes MHz (which is close to the dipolar value) and
MHz (which is about four times larger than the dipolar value). With these figures we have:
( )(3)||1zzT α+ = 0.1
60( )(3) 1tT α⊥+ =
(3) (5.3 0.1 ,60 )z zM M= +B , ( )12 15.24zMε± = = ± , ( )1
2 15.23zMε± = − = ± (MHz),
(3) (3)1 12 2( ) ( ) 0.94e e − = −n n , , . For four thulium ions this brings to five
equidistant lines of SHFS separated by 60 MHz and with intensities ratio 1:4:6:4:1, and some lines with much less intensity (
(3) 0.03r = (3) 0.97q =
/ 1 / 3r q 2= ). The full picture almost coinciding with experimental spectrum is obtained by convolution of this skeleton with the fluorine SHFS. The temperature transformation of the spectrum is qualitatively explained by the temperature dependence of the amplification factor α⊥ (see [14]). This factor is decreased by 20% in the temperature interval 5÷15 K in the regular crystal. The decrease of the separation between main peaks in the observed SHFS of the 3
4 :LiTmF U + spectrum is larger due to the discussed above distortion of the crystal field on thulium ions in the nearest surroundings of impurity
ions. 3U +
Thus the main features of the complex EPR spectra of 3U + ions introduced in the crystals are explained within the existing theories of SHFS of EPR spectra and of
Van Vleck paramagnetism. 4LiTmF
References [1] L. K. Aminov et al., Appl. Magn. Res. 33, 351 (2008). [2] L.K.Aminov et al., Pis’ma v ZhETF, 87, 362 (2008). [3] L. K. Aminov, B. Z. Malkin, and M. A. Teplov, in Handbook on the Physics and
Chemistry of Rare Earths, vol. 22, edited by K.A.Gschneidner, Jr. and L.Eyring (Elsevier Science B.V., 1996), p. 295.
[4] H. P. Jenssen, M. A. Noginov, and A. Cassanho, OSA Proc. Adv. Solid-State Lasers 15, 463 (1993).
[5] J. E. Miller and E. I. Sharp, J. Appl. Phys. 41, 4718 (1970). [6] A. Abragam and B. Bleaney, Electron Paramagnetic Resonance of Transition Ions
(Clarendon, Oxford, 1970). [7] U. Ranon and J. S. Hyde, Phys. Rev. 141, 259 (1966). [8] B. R. Mc Garvey, J. Chem. Phys. 20, 837 (1976). [9] R. M. Macfarlane, R. S. Meltzer, and B. Z. Malkin, Phys. Rev. B 58, 5692 (1998). [10] E. Garcia and R. P. Ryan, Acta Cryst. C 49, 2053 (1993). [11] A. Bensalah et al., J. Alloys Compounds 380, 15 (2004). [12] L. K. Aminov et al., Phys. Status Solidi (b) 152, 191 (1989). [13] L. K. Aminov et al., Optika i Spektroskopiya 68, 835 (1990). [14] I. S. Konov and M. A. Teplov, Fiz. Tverd. Tela (Leningrad) 18, 1114 (1976).
52

P R O C E E D I N G S
Application of NQR-spectroscopy in studies of copper-bearing sulfides
R.R.Gainov, A.V.Dooglav, I.N.Pen’kov, A.Yu.Orlova, I.A.Evlampiev, R.R.Khasanov
Kazan State University, 420008, Kremlevskaya str. 18, Kazan, Russian Federation [email protected]
Nuclear quadrupole resonance (NQR) is one the radiospectroscopic methods in studies of local electronic structure and internal dynamics in solid-state materials [1]. This method has found a wide application in different subjects of science and industry. For instance, NQR-spectroscopy is used in creation of modern explosive sensors [2] and drug [3], as high-sensitive thermometer of low and ultra-low temperatures [4], serve as a phase-diagnostic method in pharmaceutical [5] and geological exploration [6] studies.
One of the novel tendency in utilization of NQR is a full-scale study of chalcogenides, particular – sulfides. The report given is devoted to copper binary sulfide – CuS, referred to as a covellite or covelline. The CuS role should be specially emphasized. This compound is widely used in optoelectronic devices [6] and has been extensively studied due to possible applications in the synthesis of composite high-temperature superconductors (NTSC’s) [7], as a cathode material in rechargeable batteries [8], and in the creation of nanotechnological products [9]. Furthermore, (v) since covellite represents one of the wide-spread specimen of industrial copper-ore deposits, for more efficient extraction and working up of copper the different phase-diagnostic characteristics and magnetic properties of this material among others are essential [10]. From a scientific point of view, CuS has drawn significant interest as a superconductor [11-13]. One of the pronounced features of CuS is the occurrence of original, quasi-two-dimensional (2D) layered structure.
On the basis of our recent NQR studies of synthetic CuS [14, 15] it was found some modern features of structural phase transition (PT) in this material, such as fluctuating valence state of copper ions and unusual electronic spectra transformations, which could be interpreted as the formation of an energy gap below the PT temperature TPT<55 K. Analysis of experimental results indicates that charge-density waves in the CuS electronic structure could be responsible for the appearance of the energy gap and may be connected to the charge transfer and Cu valence instability. The recent studies of natural samples provide other intriguing and unique properties of covellite. Indeed, investigations of ore woods from the cuprous sandstones of Volga-Ural region (Russia), which contain the copper sulfides in superdispersed state (close to be as nanoparticles), point to the serious distinctions between synthetic CuS and these «inhomogeneous» samples. For instance, it was found that NQR linewidth of superdispersed CuS are significantly broader (by about 100 kHz) as compared to synthetic sample. It is supposed that the fact mentioned above can be used as an application in determination of the ore-processing conditions, paleographic reconstructions and prognosis of sedimentary deposits, especially, taking into account the considerable difficulties in resolving of superdispersed copper sulfides by traditional methods of mineralogy such as X-ray diffractometry or optical spectroscopy.
It is proposed more detail presentation in frame of conference. Some information can be found in publications mentioned below [14, 15].
G.R.R. and D.A.V. acknowledge the Ministry of Education and Science of the Russian
53

P R O C E E D I N G S
Federation for partial support (Grant 2.1.1/6183).
References [1] Semin G.K., Babushkina T.A., Yakobson G.G. Nuclear quadrupole resonance in chemistry.
New York: John Wiley & Sons, 1975. 541 с
[2] Yinon J. Counterterrorist detection techniques of explosives. Amsterdam: Elsevier B.V., 2007. 433 c.
[3] Latosinska J.N., Exp. Opinion Drug Discov. 2007. V. 2. P. 225-488.
[4] Anferov V.P., Bryuchanov O.N., Grechishkin V.S., Rudakov T.N., J. Mol. Struct. 1982. V. 83. P. 365-368.
[5] Perez S.C., Cerioni L., Wolfenson A.E., Faudone A.S., Cuffini S.L., Intern. J. Pharm. 2005. V. 298. P. 143-152.
[6] Гинзбург А.И., Кузьмин В.И., Сидоренко Г.А. Минералогические исследования в практике геологоразведочных работ. Москва: Недра, 1981. 263 c.
[7] L. A. Isac, A. Duta, A. Kriza, I. A. Enesca, and M. Nanu, J. Phys.: Conf. Ser. 61, 477 (2007).
[8] A. J. Aguiar, C. L. S. Lima, Y. P. Yadava, L. D. A. Tellez, J. M. Ferreira, and E. Montarroyos, Physica C 341, 593 (2000).
[9] J.-S. Chung and H.-J. Sohn, J. Power Sources 108, 226 (2002).
[10] W. U. Dittmer and F. C. Simmel, Appl. Phys. Lett. 85, 633 (2004).
[11] W. Meissner, Z. Phys. 58, 570 (1929).
[12] W. Buckel and R. Hilsch, Z. Phys. 128, 324 (1950).
[13] F. Di Benedetto, M. Borgheresi, A. Caneschi, G. Chastanet, C. Cipriani, D. Gatteschi, G. Pratesi, M. Romanelli, and R. Sessoli, Eur. J. Mineral. 18, 283 (2006).
[14] Gainov R.R., Dooglav A.V., Pen'kov I.N., Mukhamedshin I.R., Mozgova N.N., Evlampiev I.A., Bryzgalov I.A., Physical Review B. 2009. V. 79. P.075115.
[15] Gainov R.R., A.V. Dooglav, I.N. Pen'kov, I.R. Mukhamedshin, N.N. Mozgova, I.A. Evlampiev, A.Yu. Orlova., NATO Science for Piece and Security Series B – Physics and Biophysics, v. “Explosives Detection using Magnetic and Nuclear Resonance Techniques”, eds. J. Fraissard and O. Lapina, Springer-Verlag, Berlin, 2009, P. 271-287.
54

P R O C E E D I N G S
Electron Spin Resonance in the Heusler Alloy YbRh2Pb
V.A. Ivanshin1), T.O. Litvinova1), A.A. Suhanov2), D.A. Sokolov3), M.С. Aronson4-6)
1) Kazan State University, Kazan, 420008 Russia
2) Zavoisky Physical–Technical Institute, Kazan Scientific Center, Russian Academy of Sciences, Sibirskii trakt 10/7, Kazan 29, 420029 Russia
3) School of Physics and CSEC, University of Edinburgh, Edinburgh EH9 3JZ, United Kingdom
4) Department of Physics, University of Michigan, Ann Arbor, Michigan 48109_1120, USA
5) Condensed Matter Physics and Materials Science Department, Brookhaven National Laboratory, Upton, NY 11973
6) Ames Laboratory, U.S. Department of Energy, and Department of Physics and Astronomy, Iowa State University, Ames, IA 50011, USA
e-mail: [email protected]
The interest in studies of heavy fermion (HF) compounds based on uranium, cerium, ytterbium, and other 4f and 5f elements has significantly increased recently. The magnetic properties, unique in many cases, of such concentrated Kondo systems are determined by the competition of several interactions of different natures (crystalline electric field (CEF), indirect interspin RKKY interaction, hybridization between f orbitals and the band states, screening of the localized magnetic f moments due to the Kondo effect, etc.) [1]. Using the electron spin resonance (ESR) technique to study these compounds is usually impossible without the introduction of additional paramagnetic probes (as a rule, rear-earth ions with a concentration of less than 2%), due to very intense spin-lattice relaxation of the f ions and the resulting large broadening of the ESR lines that cannot be resolved using standard ESR spectrometers. The observation of ESR signals below the Kondo temperature TK in two undoped ytterbium-based HF metals, YbRh2Si2 and YbIr2Si2, pointed to a principally new possibility of using ESR for the direct study of HF compounds [2, 3]. The origins of these signals have not yet been understood and are intensely discussed [4–10]. Recent theoretical works [7, 8] attribute the ESR absorption in undiluted Kondo systems to the hybridization between the 4f electrons and the conduction electrons taking place in a system with the ferromagnetic fluctuations that lead to the significant narrowing of the resonant line and thus make it possible to detect it. The mechanisms of such hybridization are as of yet poorly understood. In this paper, we report on the observation of ESR in another, recently synthesized, intermetallic compound YbRh2Pb and analyze its spin dynamics as compared to two other similar HF compounds YbRh2Si2 and YbIr2Si2.
The compound YbRh2Pb belongs to the group of triple Heusler alloys with a stoichiometric ratio of X2YZ, where X and Y are transition metals and Z is an element of the III–V groups. The studied samples fabricated using the technique described in detail in [11] were small ( ) crystals. The X-ray structural analysis of the samples indicates the twinning of their crystal structure, the tetragonal symmetry of the unit cell, and inclusions of Pb (less than 1%) and smaller fractions of RhPb2. In a temperature range of 100–300 K, the paramagnetic susceptibility χ followed the Curie–Weiss law with a Weiss temperature of Θ = –1.9 ± 0.1 K and the effective moment Meff = 3.3 ± 1 μB [11]. At T < 20 K, the temperature dependence of 1/χ deviated from the linear law and antiferromagnetic ordering occurs below
2 1 0.5 mm× ×
55

P R O C E E D I N G S
TN ≈ 0.57 K. The ESR measurements were made with a Bruker ESM/plus spectrometer (frequency ~9.45 GHz) in magnetic fields up to 1.4 T.
A single ESR signal with a distorted Dyson lineshape was observed in a temperature range from 4 to 25K (Fig.1). The g factor g ~ 3.4 obtained at T = 5 K turned out to be typical for Yb3+ ions in a tetragonal crystalline field [2], but the twinning of the sample prevented the
detailed investigation of the anisotropy of the local paramagnetic center. The ESR line width ΔHpp varied from 500 to more than 2000 Oe, i.e., in approximately the same range as for the YbRh2Si2 compound [2, 12]. However, its intensity was about 30 to 40 times smaller (for samples of approximately the same weight and size under identical signal detection conditions) and was comparable to the intensity of a background (parasitic) signal of the microwave cavity (the signal marked by the arrow in Fig.1). The temperature dependence of ΔHpp (Fig.2) was described by the formula
Fig.1. Derivative of the absorption ESR signal in an YbRh2Pb single crystal at 4.2 K. The arrow indicates the parasitic signal form the microwave cavity.
exp( / )ppH A BT C TΔ = + + −Δ (1)
Fig.2. Measured temperature dependence of the ESR linewidth in YbRh2Pb at a frequency 9.45 GHz. The solid line presents formula (1) with the parameters A = 424 Oe, B = 27
Oe/K, C = 69.5 kOe, and Δ = 73.5 K.
56

P R O C E E D I N G S
where A = 424 ± 15 Oe, B = 27 ± 2 Oe/K, C = 69.5 ±2 kOe, and Δ = 73.5 K.
The parameter A is determined by spin–spin interactions and inhomogeneous ESR line broadening. The term BT is the contribution to ΔHpp from the Korringa relaxation caused by the exchange interaction of the spin of the ytterbium ion with the thermal fluctuations of the spin density of collectivized electrons. The third term in Eq. (1) is the result of thermal fluctuations of the electronic states of the Yb3+ ions, which lead to random transitions of these ions from the ground state to the first excited Stark sublevel with an activation energy Δ = 73.5 K due to magnetic dipoledipole and exchange interactions with the environment of these ions. This mechanism proposed in [2] to explain the temperature dependence of the parameters of the ESR spectrum of YbRh2Si2 is also responsible for the temperature dependence of the g-factor (Fig.3) at T > 15 K given by the expression
0 0
0 0
( ) exp( / )
exc
g T g g Tg g g
= + Δ −ΔΔ = −
, (2)
Fig.3. Temperature dependence of the g factor obtained from the ESR experimental data at a frequency 9.45 GHz. The solid line is the theoretical calculation by Eq. (2).
where g0 and gexc are the effective g-factors of the ground and the first excited sublevels of the Yb3+ ion. Functional dependence (2) is shown in Fig.3 as a solid line with Δg0 = –18.5 ± 1.5 and gexc = –15.1 ± 1.5. Thus, the temperature dependencies of the ESR parameters are typical for the properties of HF compounds: a transition from the mixed correlated state of localized 4f states of Yb and Fermi 3d electrons of Rh to a paramagnet with the magnetic moments of the 4f shells close to the magnetic moments of free Yb3+ ions [13]. The physical properties of the HF systems are determined by two different interactions: indirect exchange RKKY interaction and hybridization, i.e., the mixing of the wavefunctions of localized 4f electrons and collectivized electrons from the unfilled d, s, and p shells.
However, the electronic and magnetic properties of the Heusler alloys X2YZ are primarily determined by both X–Y hybridization and the type of the sp element Z [14]. At the same time, the extent of such hybridization (the value of the overlapping of the wavefunctions) significantly depends on the chemical composition. This is why a comparison of the ESR experiment in YbRh2Pb, YbRh2Si2 [2, 12], and YbIr2Si2 [3] makes it possible to estimate the probable f–d–p_hybridization effects. For example, the substitution of iridium Ir (with a configuration of the outer electron shells [Xe]5d76s2) for rhodium (Rh [Kr]4d85s2)
57

P R O C E E D I N G S
(i.e., transition from YbRh2Si2 to YbIr2Si2) results in a significant decrease in the contribution of the collectivized electrons to the processes of the ESR relaxation, but does not significantly affect the ESR signal intensity. This is assumingly due to the weakening of the f–d hybridization owing to the decrease in the number of electrons on the outer 5d shell of iridium. On the contrary, the replacement of silicon Si ([Ne]3s23p2) by lead Pb ([Hg]6p2) does not result in a qualitative change of the spin dynamics in YbRh2Pb as compared to YbRh2Si2, since the f–d hybridization remains almost unchanged in this case (if one neglects the small change in the size of the unit cell and Yb–Rh interatomic distances [11,15]). On the other hand, the extent of f–p hybridization in YbRh2Pb can significantly decrease as compared to 4f–3p hybridization in YbRh2Si2 due to the less efficient mixing of wavefunctions of the 4f and 6p shells, which is responsible for the strong suppression of the ESR signal intensity in the Pb-containing alloy.
The decrease in the extent of hybridization in YbRh2Pb is also confirmed by the data on the determination of the location of the first excited Stark sublevel of the Yb3+ ion in YbRh2Pb. The tetragonal symmetry of the crystal field for the Yb3+ ion (4f 12, J = 7) leads to the splitting of its multiplet into four Kramers doublets [16]. Studies of the specific heat of YbRh2Pb [11] showed that the two lowest doublets are located so close that they form a quadruplet in zero magnetic field, while the two other excited doublets are shifted from it by energies of Δ1 = 68 K and Δ2 = 300 K (see Fig.4a). Thus, the Δ1 value turned out to be very close to the energy interval Δ that was measured in our ESR experiments. In this respect, the situation with YbRh2Si2 was completely different: the Δ1 value obtained from the neutron scattering spectra (Fig.4b) was almost 1.5 times larger than the corresponding value, 115 K, obtained from the ESR measurements [2]. At the same time, it is well known that effective hybridization between the wavefunctions of localized 4f electrons and collectivized conduction electrons in the HF compounds leads to very wide (“broadened”) levels of the crystal field [17]. This broadening results in a large error in the determination of the location of the Stark sublevels of the RE ions from the ESR data as compared to neutron spectroscopy data [16]. In the usual compounds such as the YbRh2Pb alloy, this error is relatively small and the measured Δ1 value is smaller than the real one by no more than 15–20% [18].
487 K
302 K
115 K ΔZ = 7.4 K
Δ1 = 68 K
а) б)
H = 0
Δ2>>Δ1
H = 4
Fig.4. Splitting of the main multiplet of the Stark structure of the Yb3+ ion in (a) YbRh2Pb (according to data of [11]) and (b) YbRh2Si2 (calculated in [16]).
Thus, the relatively small ESR absorption intensity in YbRh2Pb can be explained by the very small extent of the f–p hybridization between the electronic states of the 4f-ion Yb3+ and the corresponding band electrons. Such a weak f–p hybridization most probably leads to a very small value of the RKKY interaction in YbRh2Pb [11], which is responsible for the appearance of the ferromagnetic fluctuations primarily responsible for the observation of the ESR in concentrated HF systems [6, 7].
58

P R O C E E D I N G S
During the last year, several more observations of the ESR in different concentrated intermetallides were reported. The physical properties of these compounds can be understood only with the inclusion of f–d–2s–p hybridization. They include not only HF systems (YbBiPt and YbCo2Zn20 [19]) or Kondo lattices (CeRuPO [6] and EuB6 [20]), but also intermediate valence compounds YbFe2Zn20 [19] and the YbRh alloy [6] that does not exhibit the Kondo effect. In this case, the ESR signal is determined by the contributions of both the localized 4f moments and the magnetic moments of the collectivized electrons; these contributions cannot be separated by the ESR technique [8]. These facts indicate that hybridized electronic states occurring in undoped strongly correlated electron systems as a result of the competition of the ferromagnetic RKKY interactions and hybridization between the 4f-orbitals and the wavefunctions of the conduction electrons of the outer d, s, and p shells constitute a fundamentally new source of ESR. For this reason, the ESR technique can be used to study the hybridization effects in strongly correlated electron systems along with X-ray spectroscopy, neutron scattering, and angular resolved photoemission spectroscopy.
References [1] H. V. Lцhneysen, A. Rosch, M. Vojta, et al., Rev. Mod.Phys. 79, 1015 (2007).
[2] V. A. Ivanshin, L. K. Aminov, I. N. Kurkin, et al., Pis’ma Zh. Eksp. Teor. Fiz. 77, 526 (2003) [JETP Lett.77, 526 (2003)].
[3] J. Sichelschmidt, J. Wykhoff, H._A. Krug von Nidda, et al., J. Phys. Condens. Matter 19, 016211 (2007).
[4] A. A. Zvyagin and A. V. Makarova, J. Phys. Condens. Matter 17, 1251 (2005).
[5] V. A. Ivanshin, J. Magn. Magn. Mater. 316, e393 (2007).
[6] C. Krellner, T. Forster, H. Jeevan, et al., Phys. Rev. Lett. 100, 066401 (2008).
[7] E. Abrahams and P. Wцlfle, Phys. Rev. B 78, 104423 (2008).
[8] P. Schlottmann, Phys. Rev. B 79, 045104 (2009).
[9] U. Schaufuβ, V. Kataev, A. A. Zvyagin, et al., Phys. Rev. Lett. 102, 076405 (2009).
[10] J. G. S. Duque, E. M. Bittar, C. Adriano, et al., Phys. Rev. B 79, 035122 (2009).
[11] D. A. Sokolov, M. S. Kim, M. C. Aronson, et al., Phys. Rev. B 77, 174401 (2007).
[12] J. Sichelschmidt, V. A. Ivanshin, J. Ferstl, et al., Phys. Rev. Lett. 91, 156401 (2003).
[13] N. B. Brandt and V. A. Kulbachinskii, Quasiparticles in Condensed Matter Physics (Fizmatlit, Moscow, 2007) [in Russian].
[14] S. V. Eremeev, S. S. Kulkov, and S. E. Kulkov, Fiz. Tverd. Tela 50, 250 (2008) [Phys. Solid State 50, 259 (2008)].
[15] O. Trovarelli, C. Geibel, S. Mederle, et al., Phys. Rev. Lett. 85, 626 (2000).
[16] A. M. Leushin and V. A. Ivanshin, Physica B 403, 1265 (2008).
[17] Y. Kobayashi, T. Ohimaru, M. A. Avila, et al., J. Phys. Soc. Jpn. 77, 124701 (2008).
[18] B. A. Young and H. J. Stapleton, Phys. Rev. 176, 502 (1968).
[19] V. A. Ivanshin, A. A. Sukhanov, D. A. Sokolov, et al., J. Alloys Compd. 480, 126 (2008).
[20] V. V. Glushkov, A. V. Semeno, N. E. Sluchanko, et al., Physica B 403, 932 (2008).
59

P R O C E E D I N G S
Photoinduced EPR in KTa0.988Nb0.012O3 crystals
A.I. Gubaev1), A.A. Rodionov2), M.Kh. Salakhov2), I.N. Subacheva2), P.P. Syrnikov3), V.A. Trepakov3,4), R.V. Yusupov2)
1) Basel University, Klingelbergstr 50-70, 4056 Basel, Switzerland
2) Kazan State University, Kremlevskaya, 18, 420008 Kazan, Russia
3) A.F. Ioffe Physical-Technical Institute, 194021 St.-Petersburg, Russia
4) Institute of Physics, ASCR, 182 21 Prague 8, Czech Republic
e-mail: [email protected]
Potassium tantalate (KTaO3, KTO) is a popular and widely studied material, a representative of the family of the ABO3 highly polarizable oxides, displacive-type ferroelectrics and related materials. Its resonance type dielectric permittivity strongly rises on cooling due to the lowest TO1 phonon mode softening (incipient ferroelectricity) and the KTO paraelectric central inversion cubic phase nearly loses stability. However, in the low temperature region of dominating quantum statistics the ferroelectric instability is inhibited and paraelectric phase is maintained due to quantum mechanical effects (quantum paraelectricity) [1]. However, polar state in KTO can be easily induced by suitable perturbation, e.g. by external uniaxial pressure [2], electric field, or doping with the off-central impurities like Li or Nb [3].
1hO
Slightly doped with niobium KTO is the subject of special interest. Because of practically equal ionic radii of Ta5+ and Nb5+ such doping brings small difference in lattice parameter, however in KTa1-xNbxO3 (KTN) at x ≥ 0.008 the transition to ferroelectric state occurs with the critical temperature depending on the doping index x [4]. This gives very interesting possibility to study properties of quantum paraelectrics in the region of quantum mechanically displacive limit [5] where TC appears to be equal or very close to 0 K and material is extremely sensitive to external perturbations. Special interest in this concern arises from a possibility of inducing the phase transitions in incipient ferroelectrics via optical polaron generation. Relatively recently in series of works [6] it was shown that the UV illumination of quantum paraelectrics STO and KTO at low temperatures is accompanied by “giant dielectric response” which have been attributed to the photo-polaron-induced phase transformation.
Polaronic problem is a subject of permanent interest in connection with the role of the polarons in the structural transitions in perovskite-like compounds. However, formation of polaronic states was established in rather limited number of objects. Thus, in LiNbO3 [7] and BaTiO3 [8], the compounds similar to KTO, the formation of the hole O- polarons and the electronic polarons associated with Nb and Ti was established by electron paramagnetic resonance (EPR) studies. Therefore, observation of the mentioned above optically-induced effects in quantum paraelectrics has once again revived the interest to the polaronic problems in ABO3 perovskites and possibility of polaron-induced phase transformations.
The present work is a logic continuation of our previous study [9] in which an intense photoinduced (PI) optical absorption was found both in KTO and KTN. In KTN the maximum of the wide PI absorption (PIA) band is at 0.69 – 0.80 eV depending on Nb concentration. The PIA spectrum of KTO is different: the absorption occurs above 1.14 eV.
60
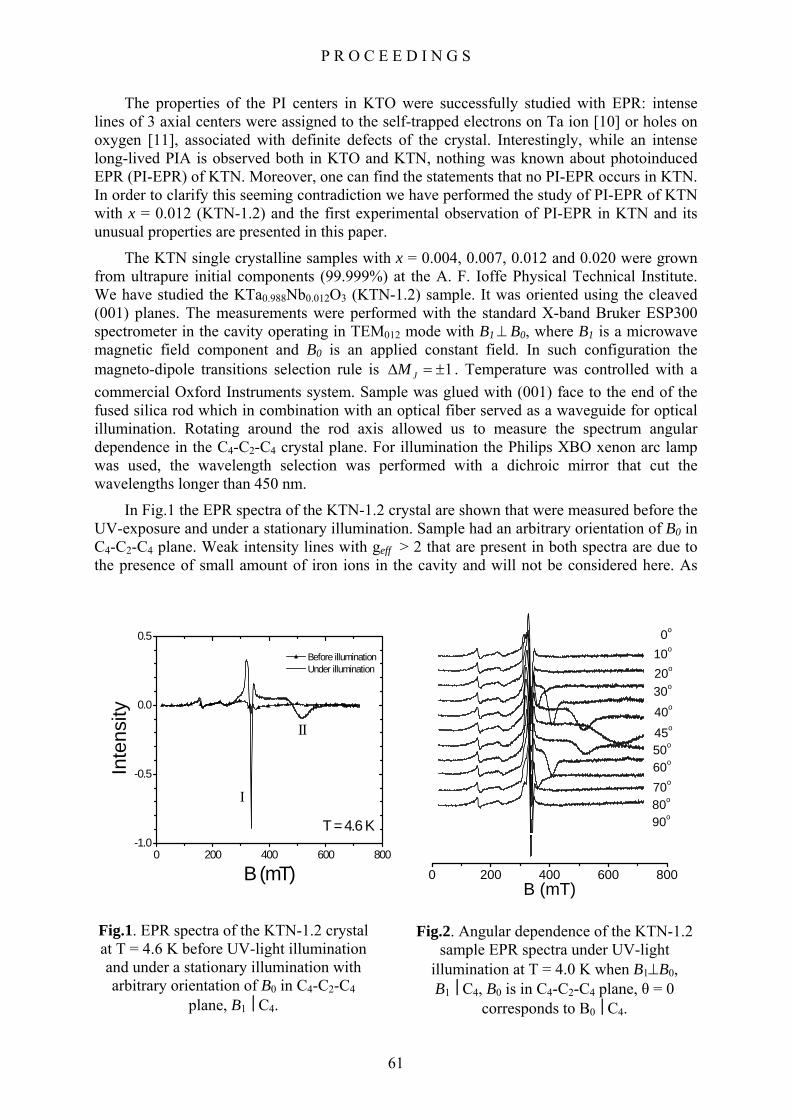
P R O C E E D I N G S
The properties of the PI centers in KTO were successfully studied with EPR: intense lines of 3 axial centers were assigned to the self-trapped electrons on Ta ion [10] or holes on oxygen [11], associated with definite defects of the crystal. Interestingly, while an intense long-lived PIA is observed both in KTO and KTN, nothing was known about photoinduced EPR (PI-EPR) of KTN. Moreover, one can find the statements that no PI-EPR occurs in KTN. In order to clarify this seeming contradiction we have performed the study of PI-EPR of KTN with x = 0.012 (KTN-1.2) and the first experimental observation of PI-EPR in KTN and its unusual properties are presented in this paper.
The KTN single crystalline samples with x = 0.004, 0.007, 0.012 and 0.020 were grown from ultrapure initial components (99.999%) at the A. F. Ioffe Physical Technical Institute. We have studied the KTa0.988Nb0.012O3 (KTN-1.2) sample. It was oriented using the cleaved (001) planes. The measurements were performed with the standard X-band Bruker ESP300 spectrometer in the cavity operating in TEM012 mode with B1⊥ B0, where B1 is a microwave magnetic field component and B0 is an applied constant field. In such configuration the magneto-dipole transitions selection rule is 1JMΔ = ± . Temperature was controlled with a commercial Oxford Instruments system. Sample was glued with (001) face to the end of the fused silica rod which in combination with an optical fiber served as a waveguide for optical illumination. Rotating around the rod axis allowed us to measure the spectrum angular dependence in the C4-C2-C4 crystal plane. For illumination the Philips XBO xenon arc lamp was used, the wavelength selection was performed with a dichroic mirror that cut the wavelengths longer than 450 nm.
In Fig.1 the EPR spectra of the KTN-1.2 crystal are shown that were measured before the UV-exposure and under a stationary illumination. Sample had an arbitrary orientation of B0 in C4-C2-C4 plane. Weak intensity lines with geff > 2 that are present in both spectra are due to the presence of small amount of iron ions in the cavity and will not be considered here. As
0 200 400 600 800
90o80o70o
60o50o45o
40o
30o20o
10o
B (mT)
0o
Fig.2. Angular dependence of the KTN-1.2
sample EPR spectra under UV-light illumination at T = 4.0 K when B1⊥B0, B1⎟⎜C4, B0 is in C4-C2-C4 plane, θ = 0
corresponds to B0⎟⎜C4.
0 200 400 600 800-1.0
-0.5
0.0
0.5
II
Before illumination Under illumination
Inte
nsity
B (mT)
T = 4.6 K
I
Fig.1. EPR spectra of the KTN-1.2 crystal at T = 4.6 K before UV-light illumination and under a stationary illumination with arbitrary orientation of B0 in C4-C2-C4
plane, B1⎟⎜C4.
61

P R O C E E D I N G S
one can clearly see, there are two types of the EPR spectra that arise under sample UV-illumination. Relatively narrow signal at 2effg ≈ (type I in Fig.1) originates most probably from the photo-excited self-trapped electrons and holes with S = ½: under illumination with a photon energies higher than the material bandgap the electron-hole pairs are created and the elementary charges localize either via the polaron formation or on the traps associated with the crystal defects. Signal around 2effg ≈ was also found in the PI-EPR spectra of the pure KTO crystals. Another type of the PI-EPR signal is represented in Fig.1 by a wide asymmetric band with a maximum of the microwave absorption at ~500 mT (type II). Such spectrum was not observed earlier either in KTO or in KTN crystals and in this paper we will consider mainly the properties of this signal.
In Fig.2 the angular dependence of the KTN-1.2 sample EPR spectrum in the C4-C2-C4 crystal plane under UV-light illumination at T = 4.0 K is presented. Type I spectrum doesn’t reveal any substantial angular dependence. This supports its preliminary assignment to the self-trapped charge carriers. On the other hand, it should be mentioned that the optimal conditions for the type I and II signal measurements are different. Data shown in Fig.1 and Fig.2 are recorded with the highest value of the B0 modulation achievable (ΔB0 ~ 24 Gs), which is nicely suitable for the wide spectrum of type II. At the same time, the narrower type I spectrum may be severely distorted with such ΔB0 value and should be studied separately.
In Fig.3 the resonance field angular dependence of the type II spectrum is shown. The
field values in Fig.3 correspond to zero crossing by the signals shown in Fig.2. Already at the first glance to the data one would notice a set of quite specific properties of the type II signal: i) this component has a strong angular dependence of the resonance field; ii) the spectra of this component are reproduced with a periodicity of 90o; in the spectra two magnetically inequivalent axial centers are revealed at θ values close to 45o with the axes along the C4 axes of the crystal; at θ = 45o (B0||C2) these centers are equivalent; iii) resonance field of the type II spectrum is minimal at θ = 0o (90o, or with B0||C4), and increases quite steeply with the departure of θ from 0o; iv) integral intensity of this signal is minimal at θ = 0o and rises fast
0 10 20 30 40 50 60 70 80 90
300
400
500
600
700
800
900
Bre
s (m
T)
θ, o
Fig.3. Angular dependence of the resonance field Bres for the KTN-1.2 PI-EPR
spectrum. Dashed curves – result of approximation with the function 0 / cosres resB B θ= where B0 = 312.4 мТ corresponds to the least value of the resonance field.
62

P R O C E E D I N G S
with its departure from 0o; v) type II spectrum width is minimal at θ = 0o and increases severely with θ increase, the lineshape of this signal is rather asymmetric. Effective g-factor values are g|| = 2.106(3) and g⊥ < 0.8. Items iii – v above are the characteristic properties of the EPR spectra that originate from the “forbidden” magnetic dipole transitions with ΔMJ ≠ ±1 (in the configuration B1 ⊥ B0). The simplest model of an object that would have such transitions is the center with J = 1. The Hamiltonian of an axial center with J = 1 is [12]
( ) ( )2 13
ˆ ˆ 1 z xz z xH D J J J g H J g H J H Jβ β⊥= − + + + + yy (1)
Within this model, if D value is small, the allowed transitions 0JM 1= ↔ ± should be observed which is not the case. With the high value of D the ground state is the 1sM = ± doublet for which the resonance field angular dependence is 0 / cosres resB B θ= . This dependence is shown in Fig.3 with the dashed line. The deviation of the observed behavior from the predicted one is obvious in most of the studied range, at : the experimental dependence is much steeper. As far as the intensity of the spectra is concerned, the probability of the transitions increases from zero with a departure of θ from 0o due to the admixing of
o20θ ≥
0JM = state to 1JM = ± by ˆxJ and/or operators in Hamiltonian (1). Thus, angular
dependencies of the resonance field and intensity of the spectrum are qualitatively explained within the simplest J = 1 model.
ˆyJ
The reason for the observed discrepancy can in principle be readily proposed. The simplest objects formed by the photo-generated charge carriers that possess the J = 1 state are either excitons or bipolarons. In both cases the energy level structure contains the triplet J = 1 state and the singlet J = 0 that are separated in energy by the exchange integral . J
The increasing with θ width of the spectrum is another feature specific for the non-Kramers centers. In general, spectrum broadening can be related to the relaxation, to interaction with neighboring spins and to the crystal field splitting due to the sample imperfections (inhomogeneous broadening). The intensity of the EPR spectrum is small, thus we study a strongly diluted spin system and can neglect the spin-spin interactions. Both, the relaxation and spin-spin interactions should not lead to a strong angle dependence of the linewidth which is observed. Thus, taking also into account a pronounced spectra asymmetry of the observed type II spectrum, we can assign the width angular dependence to interaction with random strains, which can be accounted for by adding ( )2 2ˆ ˆ
x yE J J− term to Hamiltonian
(1) with a distribution of E values.
Another interesting observation is the value of 2.106effg = . For the forbidden pure spin
transition 1+ ↔ −1 the effective g-factor value should be 4effg ≈ . One of the possible reasons for such difference may be the reduction of g-values by strong spin-orbit coupling on tantalum ion (which for Ta4+ centers in LiTaO3 was estimated as ~2200 cm-1 [13]).
Summarizing, the first observation of the PI-EPR spectra in KTN crystals is reported for the sample with Nb concentration of 1.2%. Properties of the PI spectra in KTN differ significantly from those in KTO and reveal characteristic peculiarities that allow their preliminary assignment to the non-Kramers PI objects. These objects are most probably either excitons or bipolarons. Supporting our observations, the PIA spectra of KTN crystals in the near-IR were assigned recently to Nb4+ pair polarons [9]. Angle dependence of the PI-EPR spectra can qualitatively be understood within the model of J = 1 paramagnetic center. To achieve the quantitative agreement a more sophisticated model should be employed, e.g. with
63

P R O C E E D I N G S
an account of the singlet J = 0 state in the energy level diagram. Elaborating an adequate model needs additional experimental data and is a matter of the current research.
Acknowledjments This work was supported by the RNP-6183 project of the Russian Ministry of Education
and Science, Grant KAN 301370701 of the AS CR, AV0Z10100522, Sc.Sch.-2628.2008.2.
References [1] Samara G.A., Morosin B., Phys Rev B 8, 1256 (1973); Vaks V.G., Introduction to
Microscopic Theory of Ferroelectrics, Nauka, Moskow, p. 327 (1973)(in Russian).
[2] Burke W.J., Pressley R.J., Sol. State Comm. 9, 191 (1971). [3] Hoechli U.T., Knorr K., Loidl A., Advances in Physics 39, 405 (1990).
[4] Trepakov V.A., Prosandeev S.A., Savinov M.E., Galinetto P., Samoggia E., Kapphan S.E., Jastrabrik L., Boatner L.A. J. Phys. Chem. Solids 65, 1317 (2004).
[5] Khmel’nitskii D.E., Shneerson V.L., Sov. Phys. Solid State 13, 687 (1971); Rechester A.B., Sov. Phys. JETP 33, 423 (1971); Morf R., Scneider T., Stoll E., Phys. Rev. B 16, 462 (1977).
[6] Takesada M., Yagi T., Itoh M., Koshihara S., J. Phys. Soc. Jpn. 72, 37 (2003); Katayama I., Ichikawa Y., Tanaka K., Phys. Rev. B 67, 100102 (2003); Uchida K., Tsuneyki S., Schimitsu TS., Phys. Rev. B 68, 17407 (2003); Ishikawa I., Itoh M., Kurita M., Shimoda H., Takesada M., Yagi T., Koshihara S., Ferroelectrics 298, 141 (2004); Takesada M., T Yagi T., Itoh M., Ishikawa T., Koshihara S., Ferroelectrics 298, 317 (2004).
[7] Schirmer O.F, Linde D. Appl. Phys. Lett. 33, 35 (1978).
[8] Schirmer O.F., Kool Th.W., Lenjer S., Mainwald M. Phys. Status Solidi C 2, 124 (2005).
[9] Gubaev A.I., Kapphan S.E., Jastrabik L., Trepakov V.A., Syrnikov P.P. J. Appl. Phys. 100, 023106 (2006).
[10] Laguta V.V., Zaritskii M.I., Glinchuk M.D., Bykov I. P. Phys. Rev. B 58, 156 (1998).
[11] Mainwald M., Schirmer O.F. Europhys. Lett. 64 (6), 776 (2003).
[12] Abragam A., Bleany B. Electron Paramagnetic Resonance of Transition Ions (Moscow, 1972).
[13] Sweeney K.L., Halliburton L.E., Kappers L.A. Phys. Lett. A 116, 81 (1986).
64

P R O C E E D I N G S
Implementation of a quantum algorithm CNOT by nuclear magnetic resonance
M.Yu. Volkov, K.M. Salikhov
Zavoisky Physical-Technical Institute, Russian Academy of Sciences, 420029, Sibirsky trakt 10/7, Kazan, Russia
e-mail: [email protected]
Search for physical systems, which can be the elemental base of the quantum computers, remains very important problem. The main goal of our work consists in to prove the availability of using of paramagnetic centers with ½-spin as a qubits [1]. The ½-spin is a natural candidate for the role of a qubit in quantum algorithms. At the present time we are trying to implement a quantum computing on electron spin system, using a nuclear spins as a proving ground. We implemented a quantum logic gate CNOT, using a nuclear spins as a qubits. Any quantum logic gate can be represented as the combination of the logic gate NOT and logic gate CNOT [2]. Implementation of a logic gate NOT is simple because that works only on one qubit and can be implemented by radiofrequency π-pulse. Implementation of CNOT gate affects two qubits, therefore to realize it is more difficult. In addition, it requires the presence of some kind interaction between them. The CNOT gate consists in what if the first qubit is zero, then second qubit will not be changed, but if the first qubit is one, then second qubit will be inverted. A logic gate CNOT in the basis of states of two qubits A and B 00 , 01 , 10 , 11 is given by:
CNOT= .
⎪⎪⎭
⎪⎪⎬
⎫
⎪⎪⎩
⎪⎪⎨
⎧
0100100000100001
This matrix can be uniquely represented as the unitary transformation U:
Az Az BxU 1 2S (1 2S )2S= + + − .
Ignoring phase factor such matrix arises from product of three unitary transformations:
3 2 1U U U U= ,
where , , ByU 1 2iS= − Az BzU 1 4iS 2S= − BxU 1 2iS= − , – z- component orbital moment operator of spin A, SBx – x-component orbital moment operator of spin B. Such transformations can be represented as the result of evolution of two spins under the following Hamiltonians: , ,
AzS
1 1 BH S= ω 2 AzH 2 J S S= π 1 1 BxH Sy Bz = ω , respectively. It follows that CNOT can be implemented by sequence of two radiofrequency π/2-pulses, which sequentially rotate spin B around y and x axes, and time between these pulses is . Normal functioning of CNOT-gate requires using of pseudo-pure states as input states. Usually, ensemble of spins is in thermal equilibrium but not in pure state. However such states of two-spin system can be prepared from the thermal equilibrium density matrix by a series of radiofrequency and field gradient pulses.
t 1/ 2J=
65

P R O C E E D I N G S
Fig.1. Pulse sequence for preparation of pseudo pure state 00
As the two spin system, on the basis of that a quantum computer was designed, we used the dimethyl ether of phosphoric acid. Due to this substance is liquid, the dipolar-dipolar interaction between spins is averaged to zero by rapid molecular motion.
Fig.2. The molecule of dimethyl ether of phosphoric acid
The pair of spins H1 and P31 of this molecule forms the isolated spin system, where in the presence is only J-coupling, which arises from interaction of nucleus via their electron shells. The pulse sequence for implementation of CNOT gate was borrowed from papers [3]. The first spin of H1 nucleus was used as the control qubit and the second spin of P31 nucleus was used as the controlled qubit.
Fig.3. Pulse sequence for implementation of CNOT gate
66

P R O C E E D I N G S
We performed the computer calculation of the function of all pulse sequences in order to compare them subsequently with experimental results. We also carried out the computer simulation of the NMR spectra of pseudo pure states before and after application of CNOT gate.
00 01 10 | 11 |
00 01 11 | 10 | Fig.4. Calculated spectra of pseudo pure states before (top) and after (down) using of CNOT
In the magnetic field 9.4T the precession frequencies of spins H1 and P31 were equal 161 and 400 MHz, respectively. The j-coupling constant was 700 Hz. The experiments were carried out on NMR spectrometer Bruker Avance 400. The work of pulse program consists in preparation of pseudo pure states from thermal equilibrium and then application of CNOT gate to them.
Fig.5. H1 and P31 NMR spectra obtained before and after application CNOT gate
When control qubit (first qubit) is in state 0 , NMR spectra of spin pair before and after
application CNOT gate coincide with each other. If control qubit is in state 1 , NMR spectra
become different: CNOT of state 10 has NMR spectra such as that of state 11 , and vice
versa, CNOT of state 11 has NMR spectra such as that of state 10 .
67

P R O C E E D I N G S
As can be seen, the experimental results agree with computer calculation of the function of CNOT gate. Note that the magnitude ratios of spectral line don’t coincide with calculation and now we are trying to explain the cause of this disagreement. However the direction of spectral lines (absorption or emission), which were experimentally obtained fully coincide with computer calculation of that. Therefore it can be claimed with certainty that in the present spin system was implemented quantum logic gate CNOT. We consider the possibility of application of CNOT gate, which was tested on nuclear spins to electron spin system.
References [1] Salikhov K., John H. Golbeck and Dietmar Stehlik. Appl. Magn. Reson. 31, 237-252
(2007)
[2] A. Barenco, C. H. Bennett, R. Cleve, D. P. DiVincenzo, N. Margolus, P. Shor, T. Sleator, J. A. Smolin, and H. Weinfurter, Phys. Rev. A 52, 3457 (1995)
[3] J.A. Jones, M.Moska. J.Chem. Phys. 1998. V.109. P. 1648.
68

P R O C E E D I N G S
Time-Domain Nuclear Magnetic Resonance as the actual technique of dairy product researching
L.U. Grunin1), L.M. Celisheva1) , B.G Gilyazov2), Z.A. Kanarskaya2)
1) Mari State Technical University, 424000, 3, Lenina, Ioschkar-Ola, Russia 2) Kazan State Technology University, 420015, 68, Karl Marx, Kazan, Russia
e-mail: [email protected]
Increasing value of milk as the high-grade foodstuff and raw material in food and other industries is caused by its chemical compound. Knowing the milk compound and, also, its operative control cause the high quality of the end-product.
The existing control methods which are extended at the dairy industry enterprises assume the presence of expensive equipped laboratories and high-qualified staff, what in time of technical progress is, certainly, not economically rational. Application of the compact devices, which are easily-operated and assume low-cost measurement process is nowadays very actual and reasonable.
Among lots of offered and developed techniques of instrumental control it’s possible to allocate some, that today are most applied. These are: nephelometric and turbodimetric methods, refractometric method, polarimetric method, atom-absorptive and molecule-absorptive methods, molecule-luminescent (fluorescent) spectrometry, electrochemical analysis (conductometry and potentiometry), polarographic method, chromatograpgy, ultrasound methods, rheological methods, radiospectrometrical method.
The technique of Nuclear Magnetic Resonance, as the part of radiospectrometrical methods of analysis is very actual and has wide usage potential in foodstuff researching.
NMR — is one of the basic methods of quantum radiophysics. The NMR phenomenon consists in synchronous radiation of electromagnetic energy by the ensemble of the magnetic moment of substances’ kernels, which are placed in a constant magnetic field under the force of electromagnetic field with resonance frequency.
Radiation accompanies relaxation process (returning of spin system in balanced condition), and can be registered as a weak electric signal. Thus the nuclear spin are interacted as with external magnetic fields, and with local one’s, which are created by the next kernels and molecules.
The variety of exercising interactions crate preconditions of NMR high sensivity to different structure conditions and molecular system dynamics.
In the submitted work we used NMR-analyzer Spin-Track – high quality Russian NMR spectrometer with wide range of applications, advanced software and peripherals.
NMR analyzer is intended for measurement of peak-time characteristics of pulse signals of a magnetic resonance of hydrogen kernels which are in investigated substance.
The research carried out on NMR-analyzer showed the existing dependence between an indicator of lactose concentration in dairy products and time of spin-lattice relaxation T1.
NMR analyzer software can obtain the analytical expressions which reflect the dependence of substance lactose concentration from T1 parameter. With help of this expressions, further, measuring the time of T1 parameter we can reach the authenticity data about percentage of lactose in samplies of dairy products.
69

P R O C E E D I N G S
EPR of phytofulgurite and bitumens
D.T. Sitdikov1), V.G. Izotov1), G.N. Lysuk2), G.V. Mamin1), S.B. Orlinskii1), N.I. Silkin1), M.H. Salakhov1), N.P. Yushkin2).
1) Kazan State University, 420008, Kazan, Russia.
2) Institute of geology, Russian Academy of Sciences, 167982, Syktyvkar, Russia.
e-mail: [email protected]
Introduction The carbonization (high amount of carbon) occurs under influence of heat, light, ionizing
radiation, enzymes, micro-organisms and high-voltage electric discharges. Wide spectrum of different compounds is formed. It contain a great amount of high-carbon component.
The aim of the investigation is the study of highly carbonated compounds by EPR method. The compounds studies are phytofulgurite and natural bitumens from different deposits of Tatarstan.
Natural phytofulgurite is formed when a quick pyrolysis from a powerful electric discharge, such as a lightning hit, takes place in a vegetative matrix. Phytofulgurite is identical to natural anthroksylite as they shake the same characteristics. Investigations that were described in the works [1] reveal the presence of a number of amino acids in phytofulgurite ore. Its total amount (2.36 mg/g) exceeds the amount of amino acids in natural bitumens by an order. The amino acids are introduced predominantly in their left-hand configuration (95%). One of the leading factors to trigger the mechanism of amino acids synthesis is probably utterly high temperatures (up to 30.000 K). However, X-ray (≈250 KeV) and more importantly gamma radiation (›10 MeV) have an influence.
The studies of phytofulgurite are of interest for knowledge of regularities organizations of hydrocarbons, forming prebiotic of patterns, origin and progressing of life. The data on phytofulgurite confirm and develop representation about relevance of electrical atmospheric factor in processes of abiogenous forming of bio structures. Development of new electric discharge methods of deriving hydrocarbons out of vegetative materials and domestic waste, on the basis of natural formation of phytofulgurite considerable interest is present.
Natural bitumens are solid or retinoid products composed of a mixture of hydrocarbons and their nitrous, oxygenus, sulphurous and metallics compounds.
Due to a decrease of oil reserves the analysis of natural bitumens is of great interest. More so Perm geologic reserves of bitumens on the territory of Tatarstan are many times larger than the reserves of oil. This is a base for progressing a perspective mining production of bitumens.
Experimental results
The spectra of EPR of phytofulgurite and bitumens were studied on a spectrometer Elexsys-680 in X- and W- radio-frequency ranges, at temperature ranging 50, 100, 300 K (Fig.1).
On spectra of EPR, which were detected on amplitude of an electronic spin echo (Fig.2) distortion of the left-hand flank of a spectral line with a decrease of temperature is observed. To determine the reasons of distortion the times of longitudinal and transverse relaxations
70

P R O C E E D I N G S
were measured. This revealed existence of two processes of decay of a transverse magnetization and two recovers processes of a longitudinal magnetization.
Fig.1. Spectra of EPR of phytofulgurite, measured in a CW mode of a spectrometer.
On the temperature of 50 K times of transverse relaxation differ most (T2 (I) =0.5 µs, T2 (II) =1.4 µs). The delay between impulses up to 900 ns was augmented. Thus the echo from center with short T2 (I) was fractionally killed, while the cue of an echo from center with lengthy T2 (II) practically did not changed the intensity. As it is possible to see (Fig.3), the spectrum of EPR consists of two lines: g - the factor of the right line is equal to 2.0027 are electronic centers, and g - the factor of the left-hand line is equal to 2.0047 is, in all probability, hole centers.
3,348 3,352 3,356 3,360 3,364
INTE
NS
ITY
MAGNETIC FIELD (T)
300KW-band
3,340 3,345 3,350 3,355 3,360 3,365
INTE
NS
ITY
MAGNETIC FIELD (T)
100KW-band
3,345 3,350 3,355 3,360 3,365 3,370
INTE
NSI
TY
MAGNETIC FIELD (T)
50 KW-band
Fig.2. Spectra of EPR of phytofulgurite detected on amplitude of an electronic spin echo.
3,350 3,352 3,354 3,356 3,358 3,36
τ=900 ns
MAGNETIC FIELD (T)
τ=250 ns
g=2.0027
g=2.0047
50 K
T2(I)=0.5 μs
T2(II)=1.4 μs
Fig.3. Spectra of EPR of phytofulgurite detected on amplitude of an 2 pulse electronic spin
echo with two different time delays.
ENDOR spectrum of hole centers of phytofulgurite (Fig.4a) consists of one intensive line on a Larmor frequency fit to hydrogen (protons) cores. The absence of resolved structure ENDOR spectra of protons is disposed rather far from hole centers.
71

P R O C E E D I N G S
-3,0 -1,5 0,0 1,5 3,0
ν - νL (MHz)
W-band 100 K
g=2.0047
a)
-3,0 -1,5 0,0 1,5 3,0
ν - νL (MHz)
W-band 50 Kg=2.0027
b)
Fig.4. ENDOR spectra of phytofulgurite detected on the method of application Mims.
ENDOR spectrum of electronic centers (Fig.4b) contains one line on a Larmor frequency fit to hydrogen (protons) cores, which as well not is resolved. It is possible to mark, that width of this line is less than, in case of hole centers, therefore, hyperfine interaction of protons is weaker, than for previous case.
During the research the natural bitumens of Tatarstan were investigated from following the fields: Ahalchinskoe (98), Sviagskoe (423), Mordovo-Karmalskoe (416), Sykeevskoe (2).
3,28 3,30 3,32 3,34 3,36 3,38 3,40 3,42 3,44
ΔH=6.7 ± 0.1 mT
INTE
NS
ITY
N2
MAGNETIC FIELD (T)
g=2.001 ± 0.001
g=1.998 ± 0.004
g=1.982 ± 0.004A=6.0 ± 0.1mT
300 K
ΔH=2.4 ± 0.1 mT
W-band
3,28 3,30 3,32 3,34 3,36 3,38 3,40 3,42 3,44
INTE
NSI
TY
MAGNETIC FIELD (T)
N423
g=2.012 ± 0.002
g=1.983 ± 0.004A=6.0 ± 0.1mT
g=2.001 ± 0.001
g=1.998 ± 0.004
ΔH=4.2 ± 0.1 mTΔH=2.5 ± 0.1 mT
ΔH=6.8 ± 0.1 mT
300 KW-band
Fig.5 EPR spectra of bitumens from fields 2 and 423, measured in CW mode of a
spectrometer.
EPR spectra of bitumens contain single lines with the g-factors 2.001 and 1.998. The first spectrum can be ascribed to, so-called, carbon center; it is conditioned by unpaired electron of free radicals, second - with g = 1.998 is conditioned, probably, radicals of the hole nature.
At all samples there is a spectrum interpreted in paper [2], as a spectrum vanadylum chelates composed of 8 component with characteristic value g=1.983 and constant hyperfine interaction 6.0 mT. From equaling of the g-factor of Vanadylums for bitumens of different viscosity it is possible to conclude, that the local fields around VO2+ do not vary.
In field 423 single EPR line of unknown centers with g=2.012 and width of a signal ∆Н=4.2 mT were observed.
It is evident that (Fig.6), the signal amplitude of EPR from vanadylums decrease with abatement depth of burial, thus the carbon cue (is labeled with arrow) is reflected as intensively. The abatement of a signal from Vanadium can be conditioned by destruction of
72

P R O C E E D I N G S
vanadyl porphyrins at oxidizing processes [3], the intensity of which is augmented at nearing to the surface. The acidification most probably is of bacterial nature.
Fig.6. EPR spectra of bitumens from different deposits in Tatarstan.
Conclusion
The analysis of spectra of EPR of phytofulgurite has allowed to determine availability of two types of radicals, presumptively, electronic and hole nature. This is observed for the first time in carbonated systems.
The data on EPR spectra of the bitumens corresponds to the data from literal sources. Both carbon and vanadylums signals were detected in EPR spectra. Due to oxidizing processes occurring in bitumens deposited on shallow depths, destruction of vanadyl porphyrins occurs, which leads to lower EPR signal intensity from vanadylums.
Studies of phytofulgurite are of interest for understanding the regularities of the hydrocarbons structure, prebiotic structure forming, origin and life development.
Acknowledgments The work is partly supported by the Grant RNP – 6183 from the MSE of Russia
References [1] Gilinskaya L. G. EPR spectra of V(IV) complexes and the structure of oil porphyrins //
Journal of Structural Chemistry. 2008. 2. v. 49. p. 259-268.
[2] Lusyuk A.Yu., Yurgenson G.A., Yushkin N.P. Phytofulgurites: a new type of electroatmogenic geological formations (Rus) // Lithosphere. 2006. 4. p. 125–140.
[3] Chemistry and geochemistry of the Perm bitumens from Tatarstan (Rus) / G. P.Caykova, G. V. Romano, R. H. Muslimov. M.: Nayka. 1999. p. 304.
73

P R O C E E D I N G S
Continuous-wave and pulse EPR studies of iodine containing polyconjugate systems
S.S. Khutsyshvili, T.I. Vakul'skaya, I.A. Tokareva, I.A. Dorofeev, L.G. Shagun
A.E. Favorsky Irkutsk Institute of Chemistry, 1 Favorsky st. 664033 Irkutsk, Russia
e-mail: [email protected]
The present paper overviews the results of the continuous-wave and pulse EPR studies upon the structures and properties of complex polyconjugate systems of aliphatic, aromatic and heteroaromatic series carried out at our laboratory.
Polyphenylenes, polythiophenes and polynaphthalenes of various structures are widely used all over the world due to their unique properties making them applicable as substances and materials for optics, microelectronics, laser technology, lighting equipment, photodetectors, sensors, unipolar transistors, and heatproof polymer materials [1, 2, 3].
Monoiodketones of aliphatic, aromatic and heteroaromatic series have proved to be promising monomers for the construction of acyclic and heterocyclic macromolecular systems due to the lability of С-I bond.
OI
R2
n
hvR2 R2R2 II
R1 = Me (1); R2 = (2); (3); (4)S
OI
R1 I
I II III
nmk
hv
The photochemical reactions presented (λ = 254 nm) result in formation of black polymers separated into soluble (A) and insoluble (B) fractions.
The both fractions of the polymers obtained possess paramagnetism as consistent with their deep, almost black colour. Their EPR spectra in continuous-wave mode contain uniform intensive (concentration of paramagnetic centers is around 1019 spin /g) narrow singlet signals (for the parameters of the signals see Table 1).
74

P R O C E E D I N G S
Table 1. Experimental values of g-factors, signal widths and asymmetry parameters for compounds (1-4)
Compound g-factor, signal width and asymmetry parameter 1 (A) g = 2.0056; ∆Н = 10.6 G; A/B = 0.84 1 (B) g = 2.0054; ∆Н = 9.1 G; A/B = 0.86 2 (A) g = 2.0051; ∆Н = 6.4 G; A/B = 0.96 2 (B) g = 2.0052; ∆Н = 6.6 G; A/B = 0.73 3 (A) g = 2.0037; ∆Н = 7.5 G; A/B = 0.99 4 (B) g = 2.0040; ∆Н = 5.9 G ; A/B = 0.96
The EPR spectra of the solid samples have been registered by the Bruker ELEXSYS E580 spectrometer at room temperature. The analysis of the experimental data obtained has shown that all the compounds studied (1-4) correspond to the characteristics of polymers with well developed conjugation system which conforms with the presence of the groups I-III in the polymer (1). For all the compounds (1-4), the signals of the both fractions are equally asymmetric (asymmetry parameter is A/B < 1). The upper and wider part of signal is described by Lorentzian line while the lower and more narrow one is characterized by Gaussian line which proves the anisotropy of g-factor. Essential deviation of g-factor from purely spin value is explained by the interaction between the unpaired electron and heavy iodine atom.
Two- (π/2-τ-π) and three-pulse (π/2-τ-π/2-T-π/2) echo detected EPR signals have been obtained at room temperature by the method of pulse EPR-spectroscopy for the both fractions of the compounds (1-4) with π/2=32 and 16 ns for primary and stimulated echo, respectively. The Т1-Т2 model [4] has been employed to estimate the relaxation time. For the fraction B of the compound (1), the exponential decay of echo signal amplitude in semilogarithmic coordinates shows direct relation with τ (R2=0.999; n = 14). Thus, the time of transverse (spin-spin) relaxation Т2 could be measured with high accuracy and was registered at 556 ns. For the fraction A, the pointed dependence has been obtained with correlation coefficient 0.990 and the calculated Т2 =625 ns.
It has been supposed that spectral diffusion makes no contribution into longitudinal (spin-lattice) relaxation as the concentration of paramagnetic centers in the samples studied has been less than 1020 spin/g. Preliminary estimation at three-pulse scheme has shown that dependence of echo amplitude decay on the value of Т involves the contributions of some other relaxation mechanisms and, thus, the Т1-Т2 model does not give a reliable data of the time Т1 which points, in particular, to the absence of order in the structure of oligomers and requires involving more complex methodics.
References [1] Khotina I.A., Kushakova N.S., Rud' D.A., Vitukhnovsky A.G. RUS Patent No. 2321601
(2006), PA 7. 06.06; Published 10.04.08, 2008, 10.
[2] Conjugated Polymers: The Novel Science and Technology of Highly Conductive and Non-Linear Optically Active Materials, Ed. by Bredas J.L., Silbey R. Dordrech: Kuwer Academic, 1991.
[3] Takeshi Mori., Masashi Kijima J. of Polymer Science. Part A: Polymer chemistry, 2008, 46 (12), 4258-4263.
[4] Salikhov M., Semenov A.G., Tsvetkov Yu.D. Electron Spin Echo and its Applications, Novosibirsk: NAUKA, 1976, 342 p.
75

P R O C E E D I N G S
NMR study of the reorientational motion in NaBH4 and KBH4
O.A. Babanova, A.V. Soloninin, A.P. Stepanov, A.V. Skripov Institute of Metal Physics, Urals Branch of the Russian Academy of Sciences, 620041, S. Kovalevskoi 18, Ekaterinburg, Russia
e-mail: [email protected]
Introduction Alkali borohydrides MBH4 (M = alkali metal) are considered as promising materials for
hydrogen storage [1]. However, their stability with respect to thermal decomposition remains the major drawback for a practical use. Elucidation of the complex structures and hydrogen dynamics in these materials may give a key to improving their hydrogen-storage properties by the inclusion of catalytic or destabilizing additions. The solid-state structures of MBH4 contain tetrahedral [BH4]– units, the ordering of which tends to induce structural phase transitions. The aim of the present work is to study the reorientational motion of the [BH4]– units in NaBH4 and KBH4 and the effects of phase transition on this motion using 1H and 11B NMR. NaBH4 exhibits a phase transition from the low-temperature tetragonal phase to the high-temperature cubic phase at T0 ≈ 190 K. For KBH4, a similar phase transition is observed at much lower temperature (T0 ≈ 76 K). Previous NMR studies of the reorientational motion in NaBH4 and KBH4 [2-4] were performed at a single resonance frequency. In order to characterize complex atomic motions, it is important to investigate the frequency dependences of the spin-lattice relaxation rates. In the present work, we report the results of the measurements of 1H and 11B NMR spectra and spin-lattice relaxation rates in NaBH4 and KBH4 over wide ranges of temperature (82 – 424 K) and resonance frequency (14 – 90 MHz for 1H and 14 – 28 MHz for 11B).
Results and discussion The temperature dependences of the proton spin-lattice relaxation rates R1 measured for
NaBH4 at three resonance frequencies ω/2π are shown in Fig.1. The general features of the observed behavior of R1 are typical of the relaxation mechanism due to nuclear dipole-dipole interaction modulated by thermally activated atomic motion. This motion is localized (since the proton NMR linewidth at half-maximum remains about 28 kHz over the temperature range of 110 – 424 K) and can be identified as reorientations of the BH4 tetrahedra. For the low-temperature (tetragonal) phase of NaBH4, the proton relaxation rate shows the frequency-dependent peak (Fig.1) at the temperature at which the reorientation rate τ-1 becomes nearly equal to ω. The R1 jump near 195 K (Fig.1) is related to the first-order transition from the tetragonal to the cubic phase. Our data indicate that this phase transition is accompanied by nearly an order of magnitude increase in the reorientation rate τ-1. For the high-temperature (cubic) phase, the measured relaxation rates are frequency-independent (Fig.1); this shows that for the cubic phase the values of τ-1 are much higher than ω. The experimental results have been described in terms of the standard Bloembergen – Purcell – Pound (BPP) model with the Arrhenius-type temperature dependence of τ-1. The parameters of the model are the pre-exponential factor τ0-1, the activation energy Ea of the reorientations, and the parts ΔMHB and ΔMHH of the dipolar second moment due to H – B and H – H interactions that fluctuate due to the atomic motion. These parameters are varied to find the best fit to the R1(T) data at the three resonance frequencies simultaneously. The results of the fit are shown by the solid lines in Fig.1. For the low-T phase of NaBH4, the resulting values of the motional parameters are τ0 = 3.0×10⁻¹⁴ s and Ea = 0.151 eV; for the high-T phase, they are τ0 = 1.45×10⁻¹⁴ s and Ea=
76

P R O C E E D I N G S
0.126 eV. Our results for the activation energies are in reasonable agreement with those of the previous NMR study [2] (0.153 eV and 0.116 eV for the low-T and high-T phases, respectively). It should be noted that, in contrast to Ref. [2], our analysis is based on the data at three different resonance frequencies and includes the broader ranges of the temperature and R1 values. For the low-T phase of NaBH4, we have not found any signs of a distribution of the jump rates τ-1. In fact, such a distribution would make the frequency dependence of R1 substantially weaker [5] than that predicted by the BPP model.
2 4 6 8 10 1210-2
10-1
100
101
102
103
NaBH4 1H
14 MHz23.8 MHz90 MHz
R 1 (s-1
)
103/T (K-1)
Fig.1. Proton spin-lattice relaxation rates measured at 14, 23.8 and 90 MHz as functions of the inverse temperature for NaBH4. The solid lines show the simultaneous fits of the BPP
model to the data
The temperature dependences of the 11B spin-lattice relaxation rates measured for NaBH4 at two resonance frequencies are shown in Fig.2. It can be seen that the general features of the behavior of the 11B relaxation rates are similar to those of the 1H relaxation rates. As in the case of LiBH4 [6], the dominant contribution to the 11B spin-lattice relaxation rate in NaBH4 should originate from the B – H dipole-dipole interaction modulated by reorientations of the BH4 tetrahedra. The results of the simultaneous fit (analogous to that used for the proton relaxation) to the 11B data are shown by the solid lines in Fig.2. For the low-T phase, the resulting motional parameters are τ0 = 1.5×10⁻¹⁴ s and Ea = 0.157 eV; for the high-T phase, they are τ0 = 1.1×10⁻¹⁴ s and Ea = 0.126 eV. Note that for both phases the Ea values are close to those derived from the proton relaxation data.
The temperature dependences of the proton spin-lattice relaxation rates measured for KBH4 at three resonance frequencies are shown in Fig.3. In contrast to the case of NaBH4, R1(T) for KBH4 does not show any jump in the studied temperature range. In fact, the temperature of the structural phase transition for KBH4 is quite low (T0 ≈ 76 K). Therefore, all our data for KBH4 correspond to the high-temperature (cubic) phase. The same analysis as for NaBH4 leads to the following motional parameters for KBH4: τ0 = 6.5×10⁻¹⁵ s and Ea = 0.161 eV. The 11B spin-lattice relaxation data for KBH4 (not shown) are well described by τ0 = 4.6×10⁻¹⁵ and Ea = 0.161 eV. The value of Ea reported in Ref. [2] for KBH4 is 0.153 eV. Comparison of the activation energies for the reorientational motion in the high-temperature (cubic) phases of NaBH4 and KBH4 shows that the value of Ea for NaBH4 is considerably lower than for KBH4. As suggested in [4], this difference may be related to the difference in
77

P R O C E E D I N G S
the unit cell volumes. However, at the high-temperature limit of our R1(T) measurements (424 K), the reorientation rates τ-1 for both NaBH4 and KBH4 appear to be nearly the same (~2.2×10¹² s-1).
2 4 6 8 10 1210-2
10-1
100
101
102 NaBH4
11B
14 MHz28 MHz
R 1 (s-1
)
103/T (K-1)
Fig.2. 11B spin-lattice relaxation rates measured at 14 and 28 MHz as functions of the inverse temperature for NaBH4. The solid lines show the simultaneous fits of the BPP model to the
data.
2 4 6 8 10 1210-2
10-1
100
101
102
103
KBH4 1H
14 MHz23.8 MHz90 MHz
R 1 (s-1
)
103/T (K-1)
Fig.3. Proton spin-lattice relaxation rates measured at 14, 23.8 and 90 MHz as functions of the inverse temperature for KBH4. The solid lines show the simultaneous fits of the BPP
model to the data.
78
P R O C E E D I N G S
References [1] S. Orimo, Y. Nakamori, J.R. Elisen, A. Züttel, C.M. Jensen, Chem. Rev. 107, 4111
(2007).
[2] T. Tsang, T.C. Farrar, J. Chem. Phys. 50, 3498 (1969).
[3] L. Niemela, E. Ylinen, Phys. Lett. 31A, 369 (1970).
[4] V.P. Tarasov, S.I. Bakum, V.I. Privalov, A.A. Shamov, Russ. J. Inorg. Chem. 35, 2096 (1990).
[5] J.T. Markert, E.J. Cotts, R.M. Cotts, Phys. Rev. B 37, 6446 (1988).
[6] A.V. Skripov, A.V. Soloninin, Y. Filinchuk, D. Chernyshov, J. Phys. Chem. C 112, 18701 (2008)
79

P R O C E E D I N G S
The 17O NMR study of CaMnO3-x (x < 0.01)
Z. Litvinova1), S. Verkhovskii1), K. Mikhalev1), A. Buzlukov1), A. Yakubovskii2), A. Trokiner3)
1) Institute of Metal Physics, Ural Branch of Russian Academy of Sciences, Ekaterinburg
620041, Russia
2) Russian Research Centre «Kurchatov Institute», Moscow 123182, Russia
3) Laboratoire de Physique du Solide, LPEM UPR5, CNRS, E.S.P.C.I., Paris 75231, France
e-mail: [email protected]
We study with 17O NMR a lightly electron doped CaMnO3−x (x < 0.01) polycrystalline sample in antiferromagnetic (AF) and paramagnetic (PM) state. The 17O NMR spectra in antiferromagnetic state show two lines with very different intensities corresponding to oxygen sites with different local magnetic environments. The more intense line with a small shift is due to the AF matrix. The less intense, strongly shifted line directly evidences the existence of ferromagnetic (FM) domains embedded in the AF spin lattice. The Neel temperature (TN = 122 K) and critical index (β = 0.32) have been obtained from the analysis of the 17O NMR spectra. The extremely narrow line in zero magnetic field indicates a nearly perfect alignment of the manganese spins in the FM domains. The quadrupole frequency (νQ = 930 kHz) and the asymmetry parameter (η = 0.03) have been obtained from the analysis of the main line of the 17O NMR spectra in paramagnetic state.
Manganites are the systems with the strong relation between spin, charge and lattice degrees of freedom [1]. The anomalies of physical properties which are shown by these oxides particularly the “colossal” magnetoresistance effect are the result of such strong relation.
CaMnO3-x (x < 0.01) is a lightly electron doped G-type antiferromagnetic with canted structure in the ordered state. It was shown that a homogeneous canted AF state should be unstable with respect to an electron phase separation in doped manganites [2]. Particularly at low doping the AF lattice of localized spins should coexist with microscopic areas of a modified phase referred to magnetic polarons (MP) [3].
The 17O NMR spectra in the ordered state
The 17O NMR spectra shown in Fig.1 were obtained with field sweep at constant frequency ν = 41.6 MHz (a) and with frequency sweep at constant magnetic field H = 9.4 T (b). 17O nucleus have a spin I = 5/2 and above TN the interaction of the 17О quadrupole moment e17Q with the electric field gradient (EFG) eVii of the charge environment [4] determines the spectrum pattern with five well resolved peaks of 2I transitions.
Below TN = 122 K the spectrum consists of two broad lines with very different resonance frequencies and intensities. The 17O NMR spectra measured at H = 94 kOe with frequency sweep in the PM and AF states are shown on Fig.2.
The main line is close to Larmor frequency ν0 and evidently originates from oxygens in the AF matrix of CaMnO3. It shows an asymmetric trapeziumlike shape. The line width is δН ~ 12 kOe at the liquid helium temperatures. It is proportional to the sublattice magnetization in the ordered state of the sample µ (T). Asymmetry of a NMR spectrum with shifted centre of gravity demonstrates a presence in the sample of the ferrimagnetic order caused by a turn of the sublattice magnetic moments on a corner smaller than 180°.
80

P R O C E E D I N G S
Fig.1. The 17O NMR spectra measured (a) with field sweep at constant frequency ν = 41.6 MHz and (b) with frequency sweep at constant magnetic field H = 9.4 T
The µ (T) behavior in approaching to TN is described by dependence
Fig.2. The 17O NMR spectra measured at H = 94 kOe with frequency sweep in the PM and AF states
81

P R O C E E D I N G S
β−=μμ )/1()K4()( NTTT at TN = (122 ± 0.7) K and β = (0.32 ± 0.06) (Fig.3). The critical index value close to β = 0.33 predicted in isotropic Heisenberg model for exchange interaction in magnetic system.
The less intense line is largely shifted toward high frequency. This line is in the same frequency range as the 17O NMR line due to oxygens in the FM domains of the half-doped manganites, e.g., Nd0.5Sr0.5MnO3 [5]. Moreover its intensity is about 3% of the total NMR spectrum which is in a reasonable agreement with a simple electroneutrality consideration. Each oxygen vacancy leads to a corresponding decrease in the positive charge of the Mn-ions sublattice. As a consequence for x oxygen vacancies the valence state of at least 2x Mn ions is changed from Mn4+ (t2g
3eg0) to Mn3+ (t2g
3eg1) state with a partially filled eg orbital.
Fig.3. The temperature dependence of
The zero-field 17O NMR spectrum at T = 4.2 K shows a very narrow line δνFM ~ 0.2 MHz peaked near ν = 25.7 MHz (hloc = 44 kOe). This value is consistent with the frequency position of the less intense broad line detected at H = 94 kOe (Fig.2).
The resonance frequency ν of an oxygen is defined by the magnitude of the vector sum hloc from its two Mn neighbors. Furthermore the width of the zero-field line, δνFM, is sensitive to both the magnitude and the mutual alignment of the Mn spins. The small value of the ratio δνFM/ν = 0.01 demonstrates a nearly perfect alignment of the Mn spins in the FM domains.
It should be noted that the temperature dependency hloc(T)/hloc(4K) measured up to _4/5 TN is unusually small for FM domains (Fig.3). The almost temperature independence FM⟩μ⟨ and the nearly perfectly aligned Mn spins in a wide T range allow us to consider the FM domains as saturated which is a signature of a small size MP [6].
The 17O NMR spectra in paramagnetic state The 17O NMR spectra were obtained at constant magnetic field H = 94 kOe in
paramagnetic state shown in Fig.1(b). According to the NMR spectrum the quadrupole
)K4()()K4()( locloc hThTμ μ = for AF sublattice and FM domains in CaMnO3-x
82

P R O C E E D I N G S
frequency in CaMnO3 is νQ = 930 kHz and asymmetry parameter η = 0.03. All the components are temperature independent in the paramagnetic phase.
This work was supported by the Russian Foundation for Basic Research under Grants 08-02-00029, 09-02-00310.
References [1] E. Dagotto et al. Physics Rep. 344, 1 (2001).
[2] A. Moreo and et al, Science 283, 2034 (1999).
[3] E. Nagaev, JETP Lett. 6, 484 (1967).
[4] C. Slichter, Principles of Magnetic Resonance (Springer-Verlag, Berlin, 1990), p. 640.
[5] A. Trokiner, S. Verkhovskii, A. Yakubovskii, K. Kumagai, P. Monod, K. Mikhalev, A. Buzlukov, and S.-W. Cheong, Phys. Rev. B 77, 134436 (2008).
[6] A.J. Millis, Phys. Rev. B 55, 6405 (1997).
83
P R O C E E D I N G S
Manifestation of the exchange-relaxation mechanism in spin catalysis
O.A. Gorbunov, P.A. Purtov
Institute of Chemical Kinetics and Combustion, 630090, Novosibirsk, Russia
Novosibirsk State University, 630090, Novosibirsk, Russia
e-mail: [email protected]
Spin catalysis is a process of stimulating of chemical reactions by removal of spin prohibition. Channels of chemical reactions, normally closed because of spin prohibition, may be opened due to interaction between radical pair and third particle. Usually this particle is a paramagnetic radical; it is called spin catalyst. There is an exchange interaction between spin catalyst and radical pair, resulting in singlet-triplet conversion in the pair.
There are two types of spin catalysis: dynamical and relaxation. The first one is based on stationary interaction between spin catalyst and radical pair. This process takes place, for example, in biradicals with “attached” third particle [1]. Another type is relaxation spin catalysis. This is stochastic process, when exchange interaction, which induces singlet-triplet conversion, “turns on” only when the catalyst and the radical pair are at close distance. In the article the relaxation spin catalysis is considered.
Let us consider a solution, which contains geminate radical pairs. It can be described with a density matrix ( ),q tρ ρ= , where q is a set of classical arguments (coordinates of radicals). The set of quantum arguments we will call σ . As it is known, the spin evolution of a system can be described with the basic equation of spin chemistry:
ˆ ˆˆ ˆ ˆL iL Ut
0ρ ρ ρ ρ∂− − − =
∂. (1)
Here describes classical motion of the particles in the solution, ( )ˆ ˆL=L q (ˆ ˆˆ ˆ ,L L q )σ= contains information about quantum evolution of the system, including exchange interaction, and
is operator of recombination. ( )ˆ ˆˆ ˆU U q=The probability of geminate recombination is given by the following formulae:
( ) ( ) ( )0
ˆ ,t
w t U q q t dqdtρ= ∫ ∫ .
After performing the Laplas transform
( ) ( ) ( )ˆ ,s w s U q q s dqρ⋅ = ∫ ,
where and ( ,q tρ ) ( ),q sρ are the solution of (1) and its Laplas form respectively. ( ),q sρ can be taken in the form
( ) ( ) ( )ˆ, , , ,q s G q q s q s dqρ ρ′ ′ ′= ∫) )
.
Here is the Laplas form of (ˆ , ,G q q s′ (ˆ , ,q q tϕ ′ – the Green matrix for the operator . L
The commonly used approximations are the following. It is established, that coordinate
dependences for different components of matrices and exchange interaction are the
same, i.e. and
ˆU ˆJ
( ) ( )ˆ ˆˆ ˆr uU q K qψ= ( ) ( )ˆ ˆˆ ˆ
JJ q J qψ= . Also it is assumed, that the reaction zone
is small enough, so that operators ( ) ( ) ( )ˆˆ ˆˆ , , ,u ug q s G q q s q dqψ′ ′= ′∫ and
84

P R O C E E D I N G S
( ) ( )ˆˆ ˆˆ , , ,vg q s G q q s dq′= ∫ ′ are smooth functions of q inside this zone. In this case it is possible to split the matrix product into a product of matrices inside the averaging procedure. It can be shown [2] that the probability of recombination can be written in the following form:
( ) ( ) ( )1
0ˆ ˆˆ ˆˆ ˆˆ ˆ1r rs w s K g s K g s ρ
−⎡ ⎤⋅ = +⎢ ⎥⎣ ⎦
with , ( ) ( ) ( ) ( ) ( )ˆˆ ˆˆ , ,u ug s q G q q s q q dqdqψ ψ ϕ′ ′ ′ ′= ∫∫ ( )′qϕ is stationary distribution:
( ) ( ) ( )ˆ , ,q G q q t q dϕ ϕ q′ ′ ′= ∫ . If we assume, that the relaxation in radical pairs occurs according to the Bloch equations,
then in strong magnetic fields it is possible to calculate the probability of recombination for each of the nuclear spin polarization separately. In extreme case J →∞
( )( )
( )
01 2
01 2
1 1 13 212
1 1 11 24
m
U g s g s g sT T
s w sU g s g s g s
T T
⎛ ⎞⎛ ⎞ ⎛ ⎞− + − +⎜ ⎟⎜ ⎟ ⎜ ⎟
⎝ ⎠ ⎝ ⎠⎝ ⎠⋅ =⎛ ⎞⎛ ⎞ ⎛
+ + + +⎜ ⎟⎜ ⎟ ⎜⎝ ⎠ ⎝⎝ ⎠
⎞+ ⎟
⎠
for geminate pairs, formed in triplet state. Here 1 1 1 , 1, 2i iA iB
iT T T= + = ,
1 2 1 2
1 1 1 1, , ,A A B BT T T T
are
the time of longitudinal and transverse relaxation for radicals A and B respectively. If we consider presence of a scavenger in the solution, then in first approximation we can
confine ourselves to the exponential kinetics of scavenging, which leads to replacement in the Laplas transform, is the constant of scavenging. So the result can be
written in the following form: Ss s k→ + Sk
( )( )
( )
01 2
01 2
1 1 13 212
1 1 11 24
S S S
m
S S
U g k s g k s g k sT T
s w sU g k s g k s g k s
T T
⎛ ⎞⎛ ⎞ ⎛+ − + + − + +⎜ ⎟⎜ ⎟ ⎜
⎝ ⎠ ⎝⎝ ⎠⋅ =⎛ ⎞⎛ ⎞ ⎛
+ + + + + + +⎜ ⎟⎜ ⎟ ⎜⎝ ⎠ ⎝⎝ ⎠
S
⎞⎟⎠⎞
+ ⎟⎠
Usually the relaxation times and are in the same order of magnitude, so to get the
qualitative result we may assume
1T 2T
1 2
1 1 1T T T
≈ = . One more common approximation is the
following: radicals are represented by spheres with effective radii ,A BR R . The reaction takes place in the thin layer near the sphere surface, the thickness of the layer RΔ << . If we
assume if q v( ) ( )0 0ˆ ˆˆ ˆ,U q U J q J= = ∈ , ( )24 A Bv R Rπ= + Δ
≡
is the reaction volume, and
else, and also neglect the spin evolution and relaxation during the reaction, then the stationary probability of recombination ( ) ( )ˆ ˆˆ ˆ0, 0U q J q≡
( )t →∞ is given by the following formula:
( )
( )
0
0
1 141 11 34
S S
S S
U g k g kTw
U g k g kT
⎛ ⎞⎛ ⎞− +⎜ ⎟⎜ ⎟⎝ ⎠⎝=⎛ ⎞⎛ ⎞+ + +⎜ ⎟⎜ ⎟⎝ ⎠⎝ ⎠
⎠ . (2)
85

P R O C E E D I N G S
Here ][1
Ck
kvkr
r
rS τ
ττ +
= contains the information about the reaction between catalyst and
one of the partners, and ][12
1122
22
CJ
JvT r
r
r ττ
τ += characterizes the relaxation, induced by
exchange interaction. is the reaction constant for the process of recombination of radical and spin catalyst, is exchange integral,
kJ rτ is the residence time in reaction zone.
A very important property of (2) is the fact, that the probability of recombination is expressed in terms of one function ( )g s , which characterizes the relative motion of radicals.
The concrete view of the function ( )g s can be determined for the given motion type. For
example, in case of diffusion motion ( )1
r
D
g ss
ττ
=+
[3], 2
DRD
τ = is the lifetime of the pair
in the cage with relative diffusion factor A BD D D= + , A BR R R= + ; rRD
τ Δ= .
Equation (2) was used to describe the experimental results, acquired in [4].Despite the fact, that it contains many approximations, it still can describe experiment well. At the same time some of the parameters (for example, microviscosity) can not be determined accurately. All in all it means, that (2) is useful for determination of at least qualitative characteristics of the effect.
At Fig.1 both experimental data and theoretical curve are performed. The diffusion
function ( )1
r
D
g ss
ττ
=+
was used. As we see, qualitatively experimental dependence is
simulated well.
Under conditions of a real experiment the motion of radicals in the solution can not be
Fig.1. Probability of geminate recombination depending on the concentration of spin
catalyst. Experimental data (crosses) and theoretical simulation (curve)
86

P R O C E E D I N G S
pure translational diffusion. Usually the chemical reactivity of a radical is anisotropic, so there is a steric factor. Also the conditions of an experiment may result, for example, for the jumping motion. So it is important to consider different types of motion.
Function for diffusion motion with steric factor ( )g s f is [3]
( )( ) ( )11 1 1 1
r r r
D D D
f f fg sf ss s
τ τ ττ τ ττ ττ τ
= + −+
+ + + +,
τ is the correlation time of rotational motion.
Fig. 2 shows the theoretical simulation, made with steric factor , and its comparison with experiment (right). We can see that both models show square dependence on
concentration of spin catalyst, which is typical for diffusional motion. Other types of motion, for example, two position model [5] gives the other depending on the concentration.
0.1f =
Fig.2. Experiment (crosses) and steric factor model (line) with optimized parameters.
References [1] Magin I.M., Purtov P.A., Kruppa A.I., Leshina T.V., J. Phys Chem. A, 2005, 109, 7396 –
7401
[2] Purtov P.A., Doktorov A.B., Chem. Phys., 1993, 178, 47 – 65
[3] A. Doktorov, N. Lukzen, Khim. Fiz., 1985, v. 4, p. 616-623
[4] Step E.N., Buchachenko A.L., Turro N.J., J. Amer. Chem. Soc., 1994, 116, 5462-5466
[5] Salikhov K.M., Mikhailov S.A. Theor. and Experim. Khim., 1983, 19, 550-555
87

P R O C E E D I N G S
Application of NMR-spectroscopy for an establishment of structure of spiro-cycloalkane derivatives of fullerene C60
A.R. Tulyabaev, A.R. Tuktarov, V.V. Korolyov, V.M. Yanyibin, L.M. Khalilov,
U.M. Dzhemilev
Institute of petrochemistry and catalysis of RAS, 450075, Russia, Ufa, Pr. Octyabrya, 141,
e-mail: [email protected]
Functional derivatives of [60]fullerenes find a wide applications, and cause interest not only from material scientists, but also chemists-organic. In this connection is a problem of definition of their structure and stereochemistry rather actual. The decision of these problems is carried out by physical and chemical methods such as NMR-spectroscopy and mass-spectrometry.
Stereochemical feature of molecule C60 consists that it represents truncated icosahedron symmetry Ih, all which atoms of sp2-carbone owing to what the spectrum of a 13С NMR molecules of fullerene is characterized by one signal observable in the field of nonhydrogenated aromatic systems with δС 142,5 ppm (СС14). Functionalisation of С60 results in infringement of symmetry of the last and as, to occurrence in a spectrum of 13С NMR of monoadduct from 17 up to 60 signals of carbons of fullerene sphere which, basically, to identify is possible.
According to [1], the 5,6-open cycloadducts of fullerene (homofullerenes) represent the greater practical interest, than 6,6-closed adducts (methanofullerenes) in connection with preservation in homofullerenes 60 π-electronic system, and, hence, electronic and electrochemical properties, characteristic for fullerene С60. In this connection a selective synthesis spiro homofullerenes 1-4 [2] (the scheme 1) structures are assigned by methods of mass-spectrometry MALDI TOF/TOF in a mode of registration of negative ions, one and by twodimentional methods of MNR spectroscopy (1Н, 13С, COSY, HSQC and HMBC), and also with the help of UV-spectroscopy.
NH2 N n+
Pd(acac)2 : 2PPh3 : 4Et3Al
n1'
2'
3'4'
5'
1: n=1; 2: n=2; 3: n=3; 4: n=41
Scheme 1
MnO2, 200C, 1.5 h
So, the COSY spectrum of spiro-homofullerene 1 represents symmetric eight-spin
system of the connected protons, describing a spiro-cyclopentane fragment located in a «effective» plane of symmetry of a molecule. Syn-oriented protons of methylene group above
88

P R O C E E D I N G S
a plane cyclohexane fragment of a fullerene frame of a molecule test essential shielding (δН СН2 (2’) = 1.69 ppm) as against signals of protons of methylene group (δН СН2 (5’) = 3.99 ppm), located above a cyclopentane fragment of molecule С60. Similar shielding tests diastereotopic methylene carbon atom in syn-orientation (δС СН2 (2’) = 35.88 ppm) to a cyclohexane fragment in relative to anty-methylene group (δС СН2 (5’) = 43.08 ppm). For β-carbone atoms diastereotope splitting decreases up to 0.1 ppm, whereas in proton spectra difference in shielding Δdias = δН СН2 (4’) – δН СН2 (3’) = 0.3 ppm. Presence of one plane of symmetry in structure 1 results in reduction of number of signals of fullerene spheres in a spectrum of a 13С NMR up to 26. In experiment HMBC (Fig.1) correlation peaks α-protons of a spiro cyclopentane fragment with spiro-atom C(1’) (δС = 57.49) ppm and C(1) and with (2) (δС = 143.87 ppm) carbon atoms a fullerene frame are observed..
The absence in a spectrum of a 13С NMR connections of 1 signal in the field of 70-75
ppm and in the UV-spectrum of a weak strip at 420-430 nm unequivocally specify formation open cycloadduct on 5,6-bond of [60]fullerene.
Thermal isomerization received spiro-homofullerenes 1-4 by reflux in toluene results in quantitative formation of corresponding individual spiro-methanofullerenes 5-8 (the scheme 2).
89

P R O C E E D I N G S
nn
1 - 4 5 - 8
1,5: n = 1; 2,6: n = 2; 3,7: n = 3; 4,8: n = 4
toluene
1100C, 12 h
Scheme 2
As it is shown on Schlegel diagramm for 6,6-closed isomer 5, the presence of two
«effective» planes of the symmetry which is taking place through cyclopropane and spiro-cyclopentane fragments in a molecule, results in paired equivalence of eight carbon atoms (C(1)-С(9) and C(52)-С(60), and also C(21) and C(30), C(40) and C(31)) of a fullerene skeletone, the elements of symmetry located in planes and thirteen nonequivalent groups consisting of 4 atoms of carbon (Fig.2).
12
34
56
78
9 10
11
1213
1415
16171819
2021
22
2324
25 26
2728
29
3031
3233
34
3536
37
3839
4041
42
4344 45 46
47
48
49
50
5152
53
54
5556
57 58
59
60 Fig.2. Schlegel diagramm for the [60]fullerene.
In the spectrum of 13С NMR of the cycloadduct 5 17 nonequivalent signals for fullerene frame of molecule are observed, 4 from which have the double intensity, and 13 signals – quadruplicate intensity, that completely reflects elements of symmetry in the methanofullerene 5. A signal quaternary sp3-carbone atoms of fullerene sphere is shown at δС = 83.61 ppm. The double intensity has the expressed cross-peak in experiment HMBC for the account vicinal interactions with protons δН C(2’) and C(5’) = 2.91 ppm. Last signal has also cross-peaks in spectrum НМВС with a carbon signal of spiro atom δС C(1’) = 49.05 ppm for the account geminal spin-spin coupling.
Similar results we have received for spiro-cyclohexane (2,6), spiro-cycloheptane (3,7) and spiro-cyclooctane (4,8) derivatives of fullerene.
90

P R O C E E D I N G S
With the purpose of realization of synthesis trans-1 bis-spirо-аdducts, we investigated cycloaddition the second molecule of diazocycloalkanes to corresponding monoadducts 1-4. Interaction diazocyclopentane or diazocyclohexane, generated in situ oxidation corresponding cyclic hydrazones, with spiro homofullerenes 1 or 2 to yeilds of a mixture of regioisomers of bis-adducts 9 and 10. With increase of the cycle in initial diazocycloalcane, and also in spiro-homofullerene there is a primary formation an bis-spiroadducts 11, 12 to an arrangement attached addends in trans-1 position (the scheme 3).
In a mixture of bis-adducts 9 or 10 is observed increase in number of isomeres on
position of assistants in a fullerene frame of a molecule that is reflected in increase in number of characteristic signals. So, the spectrum of 13С NMR regiosomeric mixture of bis-adducts 10 is characterized by multiplets with δС 47-52 ppm, 29-32 ppm and 37-40 ppm. In proton spectra of bis-adduct 10 also essentially increases number of the signals adequate to regioisomeres products of cycloaddition. So, the spectrum of a 1Н NMR is characterized by multipletes in area δН 1.50-1.85 and 2.00-2.27 ppm, belonging to protons of spiro-cyclohexane fragments. The mass-spectrum of the received mixture of bis-adducts 10 contains intensive peaks molecular m/z 884.863 (calc. 884.929) and fragmental m/z 802.758 ions (calc. 802.786) without cyclohexane fragment of bis-adduct 10.
References [1] Y. Nakamura, K. Inamura, R. Oomuro, R. Laurenco, T.T. Tidwell, J. Nishimura. Org.
Biomol. Chem., 2005, 3, 3032.
[2] А.Р. Туктаров, В.В. Королев, А.Р. Тулябаев, В.М. Яныбин, Л.М. Халилов, У.М. Джемилев. Изв. АН, Сер. хим. (в печати).
[3] В. И. Соколов, И. В. Станкевич, Успехи химии, 1993, 62, 455.
91
P R O C E E D I N G S
Influence of cholesterol on molecular motions in spin-labeled lipid bilayers observed by stimulated ESE
N.P. Isaev1,2), V.N. Beloslyudtseva1,2), S.A.Dzuba1,2)
1) Institute of Chemical Kinetics and Combustion, Institutskaya 3, 630090 Novosibirsk,
Russia
2) Novosibirsk State University, 630090, Pirogova-2, Novosibirsk, Russia
e-mail: [email protected]
Introduction At the present moment there is unsolved problem how we can investigate molecular
motions by relaxations of electron spin echo. In our laboratory a new method of investigation molecular dynamic by analyzing transverse relaxation rates of stimulated echo is developed.
Molecular motions in biological membranes at cryogenic temperatures occur across low energetic barriers, which inevitably present, but cannot manifest themselves at physiological temperatures. In this work an influence of cholesterol on membrane dynamics at cryogenic temperatures was investigated.
Theoretical part
To understand how fast nanosecond and slow microsecond motions can be distinguished one should look on transverse relaxation considering spectral diffusion i.e. fluctuation of Larmor frequency Δω. Signal amplitude in stimulated echo sequence will be proportional to
( ) ( ) ( )2
0
2 exp expT
T
E T i dt t i dt tτ τ
τ
τ ω+
+
⎛ ⎞ ⎛+ ∝ − Δ × − Δ⎜ ⎟ ⎜
⎝ ⎠ ⎝∫ ∫ ω
⎞⎟⎠
,
where angle bracket mean ensemble averaging.
When the correlation time of motions is less than transverse relaxation time the exponents under angle brackets are stochastically independent. Thus its contribution stimulated echo will be the same for any value of time interval T between the second and the third pulse.
In the case of slow microsecond motion relaxation rate will increase in the whole process of orientational change and its contribution is strongly depends on motions type.
We went over a few models [1] but only the model of slow unrestricted rotations can describe experimental curves behavior that predicts linear dependence of relaxation rate from T decay.
The phospholipids 1-Palmitoyl-2-Oleoyl-sn-Glycero-3-Phosphocholine (POPC) (Aldrich) were employed in this work to prepare multilamellar vesicles from pure lipid and from lipid with 50 mol% of cholesterol.
Experiment The phospholipids 1-Palmitoyl-2-Oleoyl-sn-Glycero-3-Phosphocholine (POPC)
(Aldrich) were employed in this work to prepare multilamellar vesicles in water from pure lipid and from lipid with 50 mol% of cholesterol.
92
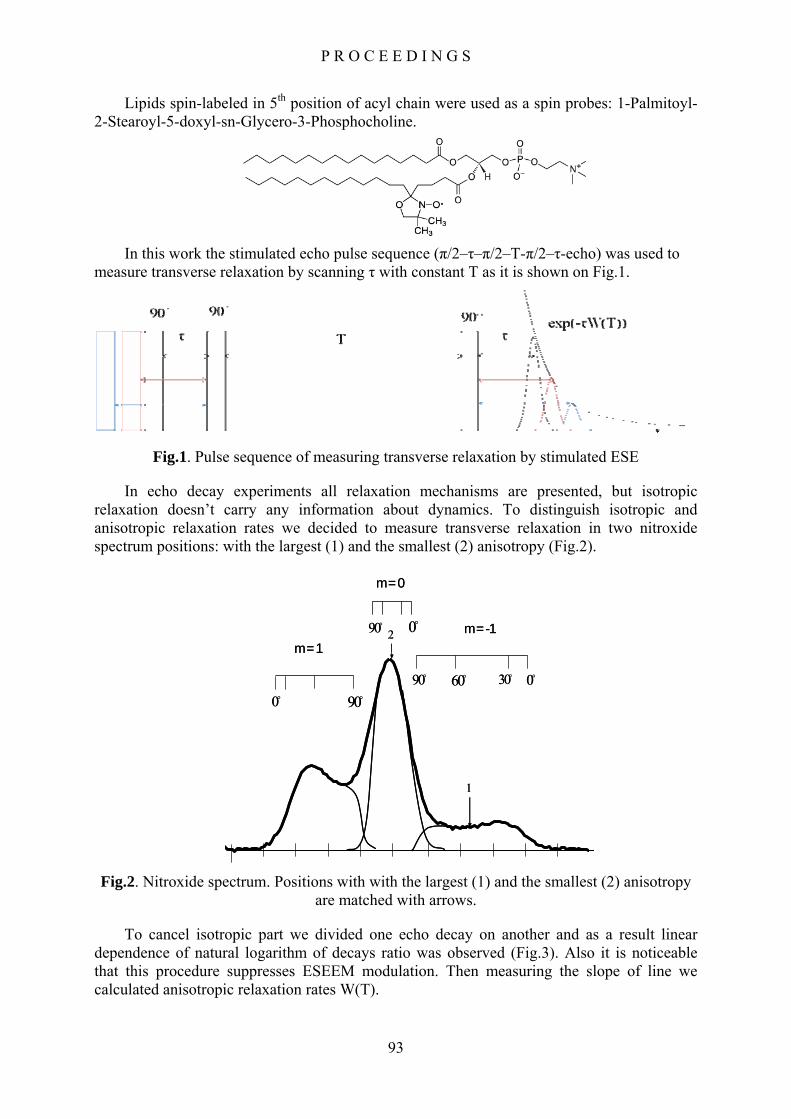
P R O C E E D I N G S
Lipids spin-labeled in 5th position of acyl chain were used as a spin probes: 1-Palmitoyl-2-Stearoyl-5-doxyl-sn-Glycero-3-Phosphocholine.
In this work the stimulated echo pulse sequence (π/2–τ–π/2–T-π/2–τ-echo) was used to
measure transverse relaxation by scanning τ with constant T as it is shown on Fig.1.
Fig.1. Pulse sequence of measuring transverse relaxation by stimulated ESE
In echo decay experiments all relaxation mechanisms are presented, but isotropic relaxation doesn’t carry any information about dynamics. To distinguish isotropic and anisotropic relaxation rates we decided to measure transverse relaxation in two nitroxide spectrum positions: with the largest (1) and the smallest (2) anisotropy (Fig.2).
m = 0
90 60 30 0
090
0 90
m = -1m = 1
4
1
2
m = 0
90 60 30 0
090
0 90
m = -1m = 1
4
1
2
Fig.2. Nitroxide spectrum. Positions with with the largest (1) and the smallest (2) anisotropy are matched with arrows.
To cancel isotropic part we divided one echo decay on another and as a result linear dependence of natural logarithm of decays ratio was observed (Fig.3). Also it is noticeable that this procedure suppresses ESEEM modulation. Then measuring the slope of line we calculated anisotropic relaxation rates W(T).
93

P R O C E E D I N G S
Fig.3. The ratio of echo decays for different T values.
Results Study of stimulated echo relaxation allows us to detect and distinguish contributions
from nanosecond stochastic librations and ultrasmall amplitude (~0.1o-1o) collective slow rotations which were observed at the microsecond time range (Fig.4).
0 2 4 6 8 10 12-2
-1
0
1
2
3
132K144K
155K
117K
105K
W(T
), μs
-1
T, μs
81K
a
0 2 4 6 8 10 12-2
-1
0
1
2
3
161K
155K128K
116K
101K
W(T
), μs
-1
T, μs
79K
b
Fig.4. Temperature dependence of anisotropic relaxation rate W(T) in a)pure POPC; b) POPC + 50 mol% cholesterol
Comparison of data presented in Fig.4a and Fig.4b shows that presence of cholesterol suppresses rotational motion and enhances fast stochastic librations. So, in phospholipids membranes cholesterol increases low-energetic barriers for orientational motions existing for lipid molecules in the membrane. Or, by other words, cholesterol increases stability of the “global” orientational structure of lipids in bilayer. Meanwhile, the local surrounding of a lipid molecule becomes looser which induces intensive librations.
References
[1] Isaev N. P., Dzuba S.A. , J. Phys. Chem. B 112, 13285-132912008.
94

P R O C E E D I N G S
Evidence of Mn2+ fine structure in CdMnSe/ZnSe quantum dots and quantum wells
D.O. Tolmachev, N.G. Romanov, P.G. Baranov, R.A. Babunts
A.F. Ioffe Physical-Technical Institute RAS, 194021 St. Petersburg, Russia
e-mail: [email protected]
Abstract Optically detected magnetic resonance of Mn2+ ions in CdSe:Mn/ZnSe quantum dots was
observed via excitonic photoluminescence. A decrease of photoluminescence intensity of excitons is observed under application of 35.2 GHz microwaves and magnetic field satisfying the Mn2+ EPR condition. In spite of isotropic g-factor of Mn2+, behavior of ODMR spectra was found to be anisotropic. It was concluded that the EPR lines corresponding to the lowest MS = - 5/2 ↔ MS = - 3/2 transition dominate the spectrum because of the high Boltzmann factor at 35.2 GHz and 2 K. The axial fine structure with positive zero-field splitting in CdSe:Mn quantum dots is concluded to be caused by their low dimensionality. ODMR in CdMnSe/ZnSe quantum wells was recorded by monitoring both exciton emission and intra-Mn luminescence. A large decrease of photoluminescence intensity of excitons corresponds to increase of photoluminescence intensity of Mn2+ ions. This suggests that a spin-dependent energy transfer from excitons to intra-Mn excitations occurs at the EPR condition.
Introduction. Semimagnetic semiconductors, also called diluted magnetic semiconductors (DMS), are
the very popular trend in modern solid state physics. Recent developments in nanostructure technology that allow preparation of low-dimensional structures, like quantum wells, superlattices and quantum dots, bring research of DMS on entire new level. II-VI compounds doped with Mn are most extensively studied semimagnetic [1].
The band structure of II-Mn-VI semiconductors is modified by the exchange interaction of the localized Mn2+ magnetic moment (i.e. the 3d5 electrons) with band (i.e., sp) electrons. The sp-d exchange interaction influences physical phenomena which involve electrons in the conduction and valence bands, e.g., the giant Zeeman splitting of both the conducting and valence bands [2-4]. Electron paramagnetic resonance (EPR) is a method of choice for the study of transition ions [5]. However, direct measurements of EPR in nanostructures are difficult because of the small total number of spins, therefore optically detected magnetic resonance (ODMR) is much better suited for the measurements in such systems [6].
Experiment The samples were CdMnSe/ZnSe quantum dots and quantum wells. Self assembled QD's
was grown by molecular-beam epitaxy on a semi-insulated GaAs substrate. The concentration of Mn in the QD's was of the order 1%. The QD's have a pancake shape with a lateral size much exceeding their thickness (nominally 2 monolayers). Quantum well structures used in this study were grown by molecular beam epitaxy (MBE) on GaAs(001) substrates as follows. A ZnSe buffer layer of 700 nm was first deposited, followed by 8 Cd0.72Mn0.28Se submonolayers with estimated thicknesses of 0.3 monolayers (MLs), separated from each other by 10 ML ZnSe barriers. The grwoth was terminated by a 50 ML ZnSe capping layer.
ODMR was investigated with the 35 GHz ODMR spectrometer operating at 1.6 – 2 K and providing the magnetic field up to 4.5 T. Photoluminescence (PL) was excited far above
95

P R O C E E D I N G S
the band gap with an argon-ion laser or 405nm 405 nm semiconductor laser and detected with a grating monochromator and a PM tube. ODMR was detected by monitoring the intensity or circular polarization of luminescence.
Results and discussion
The PL originates from the recombination of excitons localized in CdSe:Mn QD's. The intensity of the emission strongly depends on magnetic field and temperature. At liquid helium temperatures a large increase of the integrated PL intensity with magnetic field was observed following a shift of PL maximum [7,8]. The energy of excitons in QD's varies because of sp-d interaction and finally depends on the thermal average value of the Mn2+ spin in the direction of the magnetic field (e.g., along z axis) at a Mn spin temperature (<Sz>). The PL is extremely sensitive to the state of polarization of the Mn2+ ions. The increase of the PL intensity with magnetic field was explained to be evoked by a spin-dependent Auger process in individual Mn2+ ion [9,10].
Fig.1 presents the PL spectra for zero magnetic field and B= 2 T (insert) and the microwave-induced variations of the PL intensity for CdSe:Mn QD's measured as a function of magnetic field at T=2 K under 35.2 GHz microwave irradiation. As can be seen, the PL line shifts toward lower energies and strongly increases in intensity when magnetic field is applied. An ODMR signal corresponding to a decrease in the PL intensity was found.
Fig.2(a) shows ODMR spectra of the CdSe:Mn QD's measured at different orientations of the magnetic field. The obvious angle dependence of a broad and featureless signal is observed. The signal is definitely connected with individual Mn2+ ions, however, g-
factor of Mn2+ ions is known to be practically isotropic and cannot give rise to an anisotropy of the ODMR signal. EPR of Mn2+ was measured in hexagonal CdSe single crystals [11] and was analyzed in terms of a spin Hamiltonian (without cubic terms)
0 T
2 T0 PL
inte
nsity
(a
rb. u
nits)
2 K
CdSe/Mn QD's
35.2 GHz 2 K
2.2 2.4Energy (eV)
0.0 0.5 1.0 1.5 2.0Magnetic field (T)
mw
indu
ced
(arb
. uni
ts)Δ I
Fig.1. The change of PL intensity for CdSe:Mn QD's
under 35.2 GHz microwave irradiation plotted as function of the magnetic field. Inset: PL spectra at 2 K
at zero-magnetic field and B=2 T.
H = μBg B·S + AS·I +D[SZ2-1/3S(S+1)]
with the following parameters: g = 2.003, A = -62.7x10⁻⁴ cm-1, D = 15.2x10⁻⁴ cm-1. The value of D in wurtzite crystals is dependent on the trigonal (axial) distortion in these compounds. The low value of D in CdSe compared with the values found in other wurtzite crystals (e.g., D=- 240x10-4 cm-1 in ZnO) and its positive sign were explained by an amount of covalency since the crystal fields are comparable in the wurtzite crystals.
All these parameters would give the EPR spectra with an isotropic center of gravity corresponding to g≈2. The only case when anisotropy could be observed is low temperatures and high microwave frequencies. An example of such anisotropic behavior which could be
96
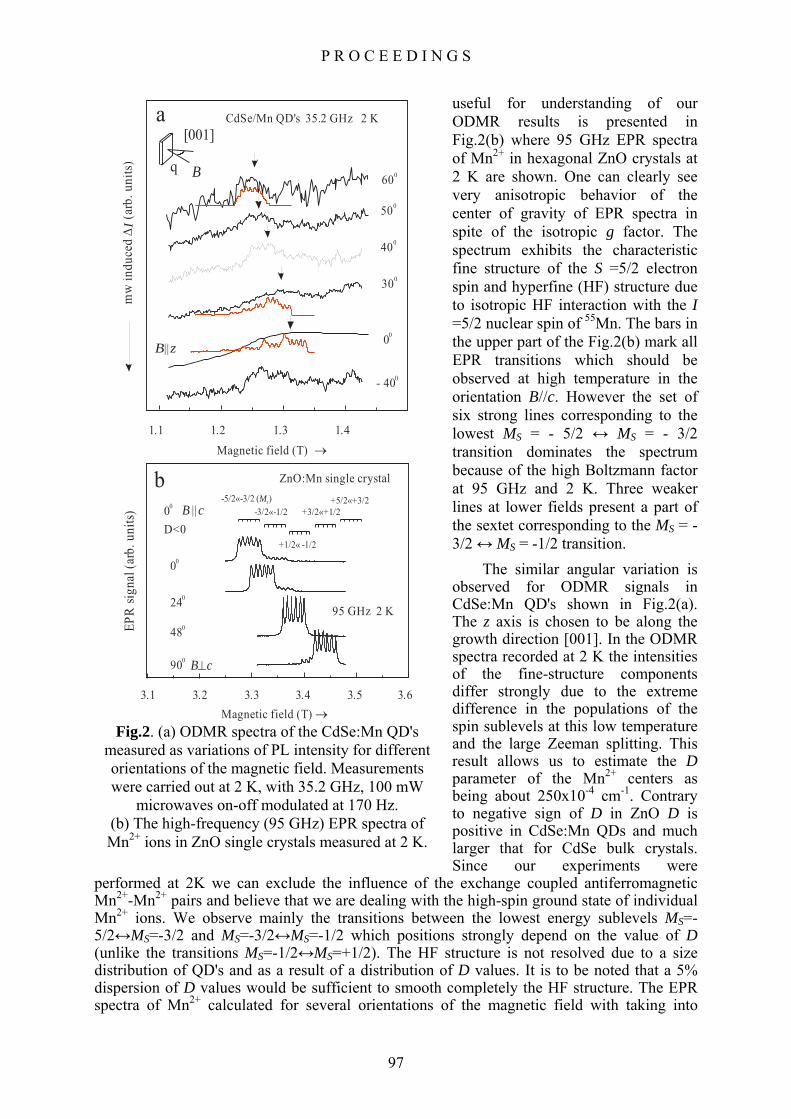
P R O C E E D I N G S
useful for understanding of our ODMR results is presented in Fig.2(b) where 95 GHz EPR spectra of Mn2+ in hexagonal ZnO crystals at 2 K are shown. One can clearly see very anisotropic behavior of the center of gravity of EPR spectra in spite of the isotropic g factor. The spectrum exhibits the characteristic fine structure of the S =5/2 electron spin and hyperfine (HF) structure due to isotropic HF interaction with the I =5/2 nuclear spin of 55Mn. The bars in the upper part of the Fig.2(b) mark all EPR transitions which should be observed at high temperature in the orientation B//c. However the set of six strong lines corresponding to the lowest MS = - 5/2 ↔ MS = - 3/2 transition dominates the spectrum because of the high Boltzmann factor at 95 GHz and 2 K. Three weaker lines at lower fields present a part of the sextet corresponding to the MS = -3/2 ↔ MS = -1/2 transition.
The similar angular variation is observed for ODMR signals in CdSe:Mn QD's shown in Fig.2(a). The z axis is chosen to be along the growth direction [001]. In the ODMR spectra recorded at 2 K the intensities of the fine-structure components differ strongly due to the extreme difference in the populations of the spin sublevels at this low temperature and the large Zeeman splitting. This result allows us to estimate the D parameter of the Mn2+ centers as being about 250x10-4 cm-1. Contrary to negative sign of D in ZnO D is positive in CdSe:Mn QDs and much larger that for CdSe bulk crystals. Since our experiments were
performed at 2K we can exclude the influence of the exchange coupled antiferromagnetic Mn2+-Mn2+ pairs and believe that we are dealing with the high-spin ground state of individual Mn2+ ions. We observe mainly the transitions between the lowest energy sublevels MS=-5/2↔MS=-3/2 and MS=-3/2↔MS=-1/2 which positions strongly depend on the value of D (unlike the transitions MS=-1/2↔MS=+1/2). The HF structure is not resolved due to a size distribution of QD's and as a result of a distribution of D values. It is to be noted that a 5% dispersion of D values would be sufficient to smooth completely the HF structure. The EPR spectra of Mn2+ calculated for several orientations of the magnetic field with taking into
500
400
300
00
B z||
1 1. 1 2. 1 3. 1 4. Magnetic field (T) →
- 400
600
95 GHz 2 K
3 6.3 5.3 4.3 3.3 2.3 1.
00
240
480
900
D<0
Magnetic field (T) →
EPR
signa
l (ar
b. u
nits)
B c⊥
+1/2« -1/2
CdSe/Mn QD's 35.2 GHz 2 Km
w in
duce
d (a
rb. u
nits)
ΔI
[001]
B
00 B c||
q
a
ZnO:Mn single crystal-5/2«-3/2 ( )MS
-3/2«-1/2+5/2«+3/2
+3/2«+1/2
b
Fig.2. (a) ODMR spectra of the CdSe:Mn QD's measured as variations of PL intensity for different orientations of the magnetic field. Measurements were carried out at 2 K, with 35.2 GHz, 100 mW
microwaves on-off modulated at 170 Hz. (b) The high-frequency (95 GHz) EPR spectra of Mn2+ ions in ZnO single crystals measured at 2 K.
97

P R O C E E D I N G S
account the Boltzmann distribution are also shown in Fig.2(a). In addition, a weak PL line in the red (ca. 600 nm) was observed in CdMnSe/ZnSe QW
structure, due to intra-Mn2+ emission corresponding to the 4T1 ↔ 6A transitions. This line also manifests ODMR, but as an increase of the intensity of the Mn2+ PL. The angular dependence of the position and the linewidth of the ODMR observed on this PL line are seen to coincide within experimental error with the ODMR detected in the QW exciton emission. The angular dependences of ODMR for these two cases are plotted in Fig.2(c). The decrease of the exciton PL intensity, and the simultaneous increase of the PL intensity associated with the internal Mn2+ transitions suggests a spin-dependent energy transfer from the excitons to the Mn ions.
The dominant property of nanostructures is their low dimensionality and characteristic features of carriers and excitons were discovered in such structures by ODMR [6]. We conclude that the observation of Mn2+ fine structure in CdSe:Mn quantum dots is caused by their low dimensionality and probably connected to the built-in strain due to lattice mismatch was reported in Refs. [12,13].Recently it was found [14] that the fine structure splitting of Mn induced by the built-in strain in low dimensional structures is an important parameter that must be taken into account in determining the interaction between spin polarized carriers and magnetic atoms.
Acknowledgment This work was supported by the Programs of RAS Spin-Dependent Effects in Solids and
Spintronics, P-03 Quantum Macrophysics, St. Petersburg Scientific Center of RAS; by Federal Agency for Science and Innovations of Russia under the contract No. 02.513.12.3031, the Programs of RAS “Spin-Dependent Effects in Solids and Spintronics”, “Support of Innovations and Elaborations”, “Basic Researches of Nanotechnologies and Nanomaterials”, by the RFBR grants 09-02-01409-а and 09-02-00730-а.
References [1] J. K. Furdyna, J. Appl. Phys. 64, R29 (1988). [2] A. V. Komarov et al. Sov. Phys. JETP 46, 318 (1977). [3] T. Wojtovich et al. Phys. Rev. B 59, R10437 (1999). [4] S. J. C. H. M. van Gisbergen et al. Phys. Rev. B 48, 11767 (1993). [5] A. Abragam and B. Bleaney, Electron Paramagnetic Resonance of Transition Ions,
Oxford University Press, Oxford, 1970. [6] P. G. Baranov and N. G. Romanov, Appl. Magn. Reson. 21, 165-193 (2001). [7] P. R. Kratzert et al. Appl. Phys. Lett. 79, 2814 (2001). [8] A.V. Chernenko et al. Proc. 11th Int. Symp. "Nanostructures: Physics and Technology",
St. Petersburg, Russia, 2003, p.360. [9] M. Nawroski et al. Phys. Rev. B 52, 045302 (1995). [10] A.V.Chernenko et al. Phys. Rev. B 72, R2241 (2005). [11] R. S. Title. Phys. Rev. 130, 17 (1963); 131, 2503 (1963). [12] M. Qazzaz, G. Yang, S. H. Xin, L. Montes, H. Luo and J. K. Furdyna, Solid State
Communications, 96, 405 (1995); [13] J. K. Furdyna, Acta Physica Polonica 88, 607 (1995). [14] C. Le Gall, L. Besombes, H. Boukari, R. Kolodka, H. Mariette, and J. Cibert to be
published in Phys. Rev. Lett, HYPERLINK "http://arxiv.org/abs/0811.2165v1" arXiv:0811.2165v1.
98

P R O C E E D I N G S
Microwave magnetoresistance in Ge:Mn thin films detected by ESR spectrometer
A.I. Dmitriev, A.S. Chernenkaya
Institute of Problems of Chemical Physics RAS, 142432, Acad. Semenov av., Chernogolovka, Russia.
e-mail: [email protected]
Synergism of magnetic and electroconducting properties (magnetoresistance (MR)) has been realized in thin films of diluted magnetic semiconductors (DMS), which make them suitable for industrial spintronic applications [1]. Generally, in thin films a nonmonotonic dependence of the MR on magnetic field was observed and attributed to a complex film structure containing various types of magnetic clusters. These findings were discussed in terms of a combination of the hopping electrical conductivity, Zeeman splitting, spin-dependent scattering on bounced magnetic polarons, and geometrical MR of nanoclusters. It was also shown that the MR ratio may vary from 1 % [2, 3] to 270 % [4] depending on the film composition, growth method, and sample history. In all works cited above the MR was a measured using conventional contacting technique. On the other hand, a contact free method based on measurements of the resistivity change in a microwave cavity and simultaneous detection of electron spin resonance (ESR) has been successfully used for thin films [5, 6]. For samples with low resistivity, ρ, the absorbed microwave power P changes as a function of magnetic field H:
,dH)H(ddHdP),H(P ρ∝ρ∝ (1)
for samples with high resistivity, ρ, (low conductivity, σ) the absorbed microwave power P changes as a function of magnetic field H:
,dH)H(ddHdP),H(P σ∝σ∝ (2)
as, for example, was demonstrated in semiconductors [7, 8].
In this work we study the nonresonant microwave absorption at 9.45 and 24.17 GHz in Mn implanted Ge thin films (Fig.1). Possible mechanisms of the observed nonresonant absorption of magnetoresistive origin are discussed. Technical details of the Ge:Mn thin films fabricate and the ESR experimental setup have been given elsewhere [5, 6, 9-12].
Our experimental results show that in low magnetic fields the derivative of the microwave absorption, dP/dH, is negative (Fig.2). The best approximation to this sharply decreasing part of the MR signal is given by where A and B are field-independent coefficients. The derivative passes a temperature-dependent minimum at H ~ 1 - 4 kOe (Fig.2). The high-field part of the MR was approximated by the function
where C is the constant. Numerical values of A and C depend on a number of factors, such as the sample geometry and size. On the other hand, exponent’s p and q reflect the physical nature of the MR. Below we analyze the temperature and angular dependences of these parameters only. A good fit to the experimental background (Fig.2) is obtained using [13],
)],BHexp(1[AdH/dP q−=
,CHdH/dP p=
,CH)]BHexp(1[AdH/dP pq +−= (3)
First, we discus the low-field part of the MR. When the sample rotates around the axis lying in its plane, the q value varies in the range 0.99 - 1.20: for Θ = 90° (dc magnetic field is
99

P R O C E E D I N G S
50 nm
Fig.1. TEM image showing a cross-section of the ion-implanted Ge:Mn thin film.
normal to the sample plane) we obtain q = 1.0. This indicates that the MR occurs due to Zeeman splitting of charge-carrier states [14], which are degenerate in zero magnetic fields. The applied magnetic field lifts the degeneracy and leads to splitting of the states. As the result, the probability of hopping, carrier mobility, and density of states will be changed. In the frame of this model one calculates the coefficient
(where kB is the Boltzmann constant, μB is the Bohr magneton, T is the temperature, and S=1/2), which is in good agreement with the value B = 4 · 10-4 G-1 obtained from the fit in Fig. 1 at T = 262 K. When the external magnetic field is tilted away from the sample normal, an additional component of the MR appears. In particular, for Θ = 0° (dc magnetic field is in the sample plane) we find q = 1.2, which indicates a rather significant deviation from the simple Zeeman model described above. This can be explained by the additional contribution of the anisotropic MR that is superimposed on the hopping Zeeman MR, which is usually isotropic. The anisotropy of the low-field part of the MR found in our experiments may cause limitation of wave functions in two-dimensional films as it was found in [15]. Another possible reason of the MR anisotropy is an inhomogeneity of the demagnetization field due to an uneven distribution of various magnetic centers in the Ge:Mn film.
Tk/)1S(gSG10)42(B BB014 +μμ≈⋅−= −−
The parameter p characterizing the quasilinear high-field part of the MR varies in the range 0.70 - 1.55, in particular, p = 0.70 when Θ = 0° and p = 1.55 when Θ = 90°. These values of p are compatible with the Lorentzian MR existing in most conductors and semiconductors as a result of orbital motion of charge carriers in the magnetic field. Deviation
100

P R O C E E D I N G S
of p from one is typical for conductive systems with reduced dimensions and a high dopant concentration [16, 17]. In particular, a relatively low value of p = 0.5 - 0.8 is expected for two-dimensional disordered semiconductors with high dopant level (as in our case) [16]. The effect is caused by heavy doping and strong disorder of the crystal lattice that leads to a spin-dependent scattering of charge carriers. The theoretical background for this case has been given in [16]. The orientation dependences of q and p exponents are likely to be related to the magnetocrystalline anisotropy of Mn5Ge3 clusters acting as scattering centers for charge carriers. Another possible reason of the anisotropy is a quasi-one-dimensional character of the disorder, for example, due to formation of conductive channels caused by Mn implantation.
Fig.2. Microwave absorption spectra, dP/dH, in Ge:Mn thin film before and after annealing, recorded in X- and K-band. The dashed line shows a background of the ESR
spectrometer. The solid red line is an approximation to the magnetoresistance background using the Eq. (3), as described in the text
Thus, the microwave absorption in Mn-implanted Ge thin films has been investigated. We show that the magnetoresistive background contains two components: a positive classic Lorentzian magnetoresistance and a negative one arising from the Zeeman splitting. The orientation dependences of both components are explained by a superposition of the isotropic part of the MR due to Zeeman splitting of the charge-carriers states and its anisotropic part caused by dimensional limitations in the thin film.
Acknowledgments We are grateful to scientific adviser Professor R. B. Morgunov. This work was supported
by the program of Presidium of Russian Academy of Science 27 «Foundations of fundamental researches of nanotechnologies and nanomaterials».
101

P R O C E E D I N G S
References [1] T. Dietl, Nat. Mater. 2, 646 (2003).
[2] S. H. Song, S. H. Lim, M. H. Jung, T. S. Santos, and J. S. Moodera, J. Korean Phys. Soc. 49, 2386 (2006).
[3] A. P. Li, J. Shen, J. R. Thompson, and H. H. Weitering, Appl. Phys. Lett. 86, 152507 (2005).
[4] H. Li, Y. Wu, Z. Guo, P. Luo, and S. Wang, J. Appl. Phys. 100, 103908 (2006).
[5] R. Morgunov, M. Farle, M. Passacantando, L. Ottaviano, and O. KazakovaPhys. Rev. B 78, 045206 (2008).
[6] O. Kazakova, R. Morgunov, J. Kulkarni, J. Holmes, and L. Ottaviano, Phys. Rev. B 77, 235317 (2008).
[7] A. I. Veinger, A. G. Zabrodskii, and T. V. Tisnek, Semiconductors 34, 746 (2000).
[8] A. I. Veinger, A. G. Zabrodskii, and T. V. Tisnek, Phys. Status Solidi B 230, 107 (2002).
[9] L. Ottaviano, M. Passacantando, S. Picozzi, A. Continenza, R. Gunnella, A. Verna, G. Bihlmayer, G. Impellizzeri, and F. Priolo, Appl. Phys. Lett. 88, 061907 (2006).
[10] M. Passacantando, L. Ottaviano, F. D'Orazio, F. Lucari, M. DeBiase, G. Impellizzeri, and F. Priolo, Phys. Rev. B 73, 195207 (2006).
[11] L. Ottaviano, P. Parisse, M. Passacantando, S. Picozzi, A. Verna, G. Impellizzeri, and F. Priolo, Surf. Sci. 600, 4723 (2006).
[12] L. Ottaviano, M. Passacantando, A. Verna, R. Gunnella, E. Principi, A. Di Cicco, G. Impellizzeri, and F. Priolo, J. Appl. Phys. 100, 063528 (2006).
[13] R. P. Khosla and J. R. Fisher, Phys. Rev. B 2, 4084 (1970).
[14] I. Kubelik and A. Triska, J. Phys. B 23, 115 (1973).
[15] V. Yu. Butko, J. F. DiTusa, and P. W. Adams, Phys. Rev. Lett. 85, 162 (2000).
[16] M. M. Parish and P. B. Littlewood, Nature (London) 426, 162 (2003).
[17] H. Roth, W. D. Straub, W. Bernard, and J. E. Mulhern, Phys. Rev. Lett. 11, 328 (1963).
102

P R O C E E D I N G S
Deactivation study of electronically excited Cl(2P1/2) atoms by SOCl2, CCl3H, C2H4, NO2 molecules with Laser Magnetic Resonance (LMR)
technique
A.A Rakhymzhan1,2), P.V. Koshlyakov1), P.S. Dementiev1,2), O.S. Aseev1,2), A.I. Chichinin1) 1) Institute of Chemical Kinetics and Combustion SB RAS, 630090, Novosibirsk,
Institutskaya, 3
2) Novosibirsk State University, 630090, Novosibirsk, Pirogova, 2
e-mail: [email protected]
Introduction The main electron configuration of the chlorine atom (1s22s22p63s23p5) gives one term
2P, which splits in two J-components: 2P1/2 и 2P3/2 due to spin-orbital interaction. The ground state of the chlorine atom is 2P3/2, the splitting is about 882 cm-1. The optical transition 2P1/2 - 2P3/2 is magnetic dipole transition, the radiative lifetime of the excited state Cl* (≡ Cl*(2P1/2)) is about 80 sec [1].
Although the collisional deactivation of Cl* has been studied for a long time, the relative reactivity of Cl* atoms in comparison with nonexcited Cl(≡ Cl(2P3/2)) atoms is almost unknown, because in the overwhelming majority of cases the total (reactive + nonreactive) relaxation rate constant of Cl* has been measured. Usually the processes where nonreactive (physical) deactivation of Cl* dominates are investigated in literature. This fact stimulated us to begin a research of such deactivation processes, where a substantial probability of chemical reaction of Cl* atoms can be expected. The present work starts this direction of study.
In the previous works, where the deactivation of Cl* atoms was studied by LMR technique, the photolysis of ICl molecules was used as a source of Cl* atoms. This way of Cl* atoms production has several disadvantages: first, the absorption cross-section of ICl molecules at λ=248 nm is not high enough, it is equal to [2]; second, the reaction Cl+ ICl → I+Cl2 is fairly fast , (8×10-12 cm3/s [3]), so the concentration of ICl should be sufficiently small; third, ICl is a poorly volatile liquid (P = 20 torr at T = 20 C), the concentration of which is difficult to control in the buffer flow. And the most important limitation: a significant amount of excited I* (≡ I*(2P1/2)) atoms is generated from 550 to 248 nm by photodissociation of ICl molecules [4]. The I* atoms react with ICl molecules and give Cl* atoms [5] (2.3×10⁻¹¹ cm3/s [6,7]), this makes analysis of LMR signal of chlorine atoms more complicated.
219105 cm−×
In the present paper another source of Cl* atoms was suggested, the dissociation of SOCl2 molecule dissociation. The absorption cross-section of SOCl2 at λ=248 nm is one order of magnitude higher, and it is equal to ; in addition, as one of the result of this work, the yield of excited Cl* atoms at this wavelength is found to be unexpectedly high, and the probability of Cl* atoms deactivation by SOCl2 molecules is insignificant, so application of these molecules as a source of Cl* atoms was proved to be successful.
218107 cm−×
Experiment The intracavity LMR apparatus used here is similar to that described elsewhere [8,9].
Excited Cl* or ground state Cl atoms were produced by pulsed laser photolysis of SOCl2 molecules. The photolysis source was a KrF-laser (ELI-94, 248 nm, 15 mJ/pulse, at 7.5 Hz).
103
P R O C E E D I N G S
Gas mixture were pumped through a photolysis cell at a rate of ~3 m/s. The cell was inserted into the cavity of a CO2-laser and was subjected to oscillating (150 kHz, 200 W, double modulation amplitude is 60 G) and constant magnetic field. The cell incorporated two NaCl windows placed on Bruster angle for CO2-laser radiation and one quartz window for UV radiation. The reaction zone (limited by the modulation field length) was 12 cm long. The unfocused excimer laser beam was directed into the cell at a small angle (about 3°) to the CO2-laser radiation beam. This geometry ensured a large overlap area of the beams. The diameter of the excimer laser beam was larger than the diameter of the CO2-laser beam. The exiting CO2-laser radiation (≈ 0.5 W) went to a Ge-Hg photoresistor, cooled by a solid N2 (53 K). The signal of the photoresistor was detected by a lock-in amplifier, digitized, and transferred to a computer.
Cl atoms were detected by fine structure absorption using the 11P(36) line of a CO2-laser (882.287 cm-1) [10] in E⊥B polarization.
Results and discussion
a) Studying of deactivation processes Cl*(2P1/2) + М (М = SOCl2, CCl3H, C2H4, NO2) The experimental method was fully described previously [8, 9]. The measurable value in
the experiment was the LMR signal of the chlorine atoms S(t), which is proportional to the absorption rate αLMR between individual Zeeman sublevels
[ ] [ ]( ),~)( ** fClfClltS dsLMR −= σα
where σ is the cross-section of optical transition between the considered sublevels, lds is the detection area length (12 cm), f = 1/16 and f∗= 1/8 are the fraction of chlorine atoms, which are located on these sublevels for and states, respectively. Solving kinetic equations of reaction and deactivation of chlorine atoms, we can represent LMR signal in the following easy for analysis form
2/32 P 2/1
2P
( ) [ ] ( ) ( )( ),æt-expexp æ0* CrtCCltS r +−Θ= (1)
where æ is the deactivation rate constant, r is the reaction rate constant, the amplitudes Cr and Cæ are equal to
( ),æ/1/1 −−−Γ= rkC qr ( ) .2æ-r/kqæ −=C
Γ = [Cl∗]0/([Cl∗]0 + [Cl]0), where [Cl∗]0 and [Cl]0 are the concentrations of chlorine atoms immediately after the UV pulse (t = 0), kq is the quenching rate constant of Cl* atoms by M molecules, the Γ value gives the yield of Cl* atoms. The method of deactivation rate constant measurement Cl∗ + M includes the following: kinetics of chlorine atoms are recorded at different values of [M], but constant value of [SOCl2] and [Ar]; these kinetics are fitted by equation (1), as a result r and æ can be determined; the slope of r dependence on [M] gives the rate constant of reaction Cl + M; the slope of the æ dependence on [M] is equal to the deactivation rate constant Cl* + M.
The experimental values of deactivation rate constant of Cl* atoms are presented in Table 1. All of these constants are new and unknown in literature.
104

P R O C E E D I N G S
Table 1. The deactivation rate constants of Cl* atoms by M molecules (Т = 300 К)
M scmabak bM /,10)( 3×≡=
SOCl2 (1.4 ± 0.4)(-11) C2H4 (5.3 ± 1.4)(-11)
CCl3H (1.1 ± 0.3)(-11) NO2 (1.0 ± 0.4 )(-11)
The experiments were carried out to study the dependence of the Cl* deactivation rate constant by NO2 molecules on pressure. The deactivation constants were measured at two values of argon pressure, 8 and 15 torr. It was found that the deactivation constant does not depend on argon pressure, therefore the process of Cl*(2P1/2) atoms deactivation by NO2
molecules is bimolecular, in contrast to the reaction Cl(2P3/2) + NO2 → ClNO2, which is a trimolecular process, notably the rate constant depends on total pressure.
2NOk
It is difficult to judge about this difference. Maybe the energy of spin-orbital excitation of the chlorine atom is enough for fast decomposition of the collisional complex ClNO2, or perhaps, the Cl*(2P1/2) atoms deactivation occurs as a result of long range dipole-quadrupole interaction by electron-vibrational energy exchange; all the more so, NO2 molecule has the vibration (757 cm-1), the energy of which is close to the energy of spin-orbital splitting in chlorine atoms.
b) Yield of Cl*(2P1/2) atoms by photolysis of SOCl2
In the experiments the quantum yield of excited Cl* atoms has been determined, and it is equal to Γ = 50 ± 4%.
In the paper [11] the energy of the excited state of SOCl2 molecule and the oscillator strength for optical transitions to these states have been calculated via quantum-mechanical computing, and the calculation results were illustrated by the figure shown below. As follows from the figure, three states: 21A’(4.63 eV), 31А”(5.37 eV) and 51A”(6.26 eV) have the highest values of the oscillator strength, and it means that generally all three transitions define the absorption spectrum of SOCl2 molecule. In the upper side of the figure the experimental absorption spectrum of SOCl2 is shown and the spectrum expansion into three components is presented. This expansion was fitted by least-squares method, the component’s shape was assumed to be Gaussian. As is obvious from the figure, the positions of components maxima correlate with the calculated positions of transitions into the three most intensive transitions. The calculated and spectroscopic maxima positions fit accurately to within 0.2 eV, the component widths are equal to 0.2 - 0.5 eV, which corresponds to decay of the excited repulsive state.
In the work [11] the yield of the excited state of Cl* atoms has been determined at 235 nm, and it is equal to Г = 0.35 ± 0.06 %, which corresponds to equal population of both spin-orbital states. The yield of Cl* atoms at 248 nm determined in this experiment was found to be 1.5 times more, which corresponds to the inversion of the 2P1/2 и 2P3/2 states population.
The higher yield of Cl* atoms at 248 nm with respect to the yield at 235 nm can be explained by the fact that the photodissociation at 235 nm generally goes via the state 31А”, and at 248 nm the state 21A’, which has the yield of Cl* atoms considerably exceeding 0.5, gives the highest contribution.
105

P R O C E E D I N G S
c) Studying of reaction Cl(2P3/2) + SOCl2
Figure. Absorption cross-section (above) and calculated oscillator strengths for transitions into excited states of SOCl2 molecule with symmetry indication (below).
Determination of the rate constant of reaction
Cl + SOCl2 → products (2)
was carried out with the same experimental method, and the measured value is equal to . No reference on this constant was found. If we assume that the main
channel of reaction (2) is the channel of chlorine atom removal Cl + SOCl2 → SOCl + Cl2 + 0.0067 eV, this reaction is thermoneutral.
scm /10)7.01.3( 314−×±
The rate constant of reaction (2) was measured in two similar experiments, where the UV laser energy was varied (6 and 15 mJ/imp), and the rate constant value remained the same. So we can claim that the decrease of LMR signal kinetic at different concentration of the SOCl2 molecule is determined by the reaction Cl + SOCl2, and not by the process Cl + SOCl, as the concentration of SOCl radicals depends on the UV energy.
Conclusion
In the present work the yield of spin-orbital excited chlorine atoms produced by photodissociation of SOCl2 molecules at 248 nm has been determined. This yield is higher
106

P R O C E E D I N G S
than the yield at 235 nm. The suggested explanation is that the strongly absorbing state 21A’ of the SOCl2 molecule gives an additional contribution to the yield of Cl* atoms at 248 nm.
The deactivation rate constants of Cl* atoms by SOCl2, CCl3H, C2H4 and NO2 molecules have been measured at 248 nm for the first time, the unknown in literature rate constant of the thermoneutral reaction Cl(2P3/2) + SOCl2 has also been determined. In the case of the NO2 molecule, the experiments with different pressures were carried out and it was found that the deactivation process of Cl* atoms by NO2 molecules does not depend on pressure, and is bimolecular as opposed to the well-known in literature trimolecular reaction Cl+NO2+M→ClNO2+M.
Acknowledgment This work was supported by Russian Foundation for Basic Research through Grand
No. 07-03-00873а.
References [1] A. I. Chichinin, J. Phys. Chem. Ref. Data, (2006) v.35, pp. 869-928.
[2] D.J. Seery and D. Britton, J. Phys. Chem. (1964) v. 68 pp.2263-2268.
[3] M.A.A. Clyne and H.W. Cruse, J. Chem. Soc. Faraday Trans. 2, 68 (1972) pp. 1377-1387
[4] T.S. Mashnin, A.V. Chernychev and L.N. Krasnoperov. Chem. Phys. Lett, (1993) v.207, p.105-109
[5] A.I. Nadkhin, E.B.Gordon, Chem.Physics, 13 (1994) 3-10.
[6] H. Hofmann and S.R. Leone, J. Chem. Phys. 69 (1978) 641-646.
[7] H.V. Lilenfeld, P.D. Whitefield and G.R.Bradburn, J. Phys. Chem. 88 (1984) 6158-6162.
[8] A.I.Chichinin, S. A. Chasovnikov, L. N. Krasnoperov Chem. Phys. Lett., (1987) 138, p. 371–376.
[9] A.I. Chichinin A.I. J.Chem.Phys. (1997)v.106,p.1057.
[10] M.Dagenais, J.W.C . Johns, A.R.W. McKellar, Can.J.Phys. (1976) v. 54. p.1438.
[11] A.Chichinin, T.Einfeld, K.-H.Gericke, J.Grunenberg, C.Maul and L.Schafer, Phys.Chem.Chem.Phys. (2005) v. 7, pp. 301-309.
107

P R O C E E D I N G S
EPR of Eu-doped superionic fluorite crystals
A.A. Vinokurov, S.M. Soukharjevskii
Saint-Petersburg State University, 198504, Ulianovskaya 1, Saint-Petersburg, Russia.
e-mail: [email protected]
In the last years, there has been large interest in studying superionic crystalls using different experimental techniques of solid-state physics, chemistry, electrochemistry, structural analysys and computer simulation. The major reason for the interest on the fluorite-structured materials during the last three decades has been the discovery that these systems exhibit superionic conductivity at high temperature. The phenomenon of ion conductivity in solids is of tremendous technical importance. Fluoride systems containing rare-earth elements are important as solid electrolytes for power and sensor applications.
Solid electrolytes are solids with a high ionic conductivity (>10-3 S/cm). CaF2 is a typical fluorite-structured crystal wich shows his superionic properties at temperatures 200 - 450 K lower than melting point. Disordering of the F- sublattice at high temperatures is the main reason for high ionic conductivity in such crystals [1]. In order to know better behaviour of the rare earth ions in non-stechiometric fluorides we began to carry our study using magnetic resonance experimental methods.
Superionic crystals CaF2 doped with divalent europium were investigated using electron paramagnetic resonance (EPR) method. CaF2 single crystals were prepared by Bridgman technique in the chemical faculty of Saint-Petersburg state university and were provided us by our colleagues from the department of solid state chemistry. EPR spectras of samples with concentration of the dopant element 0.1% and 0.01% were measured using X-band spectrometer at temperatures 293 K and 77 K.
Paramagnetic centers Eu2+ located in the crystalline field of cubic symmetry [2] were found in the obtained spectras (Fig.1). Low temperature measurement showed that the new type of paramagnetic centers appear, this paramagnetic centers were interpreted as an Eu2+ ions located in the crystalline field with symmetry lower than cubic. The assumption was made that the distorted neighborhood of the Eu2+ ion has geometry of «twisted» or Tomson cube.
Fig.1. CaF2:Eu2+ (0.1%) single crystal EPR spectra. T=77K. B0||C4.
108

P R O C E E D I N G S
The spectra of CaF2 containing 0.01% Eu2+ has the same structure (Fig.2) but the peaks on the spectra responding to the non-cubic centers have extremely low amplitude. Besides
3+ 2+
In order to confirm or disprove our assumption we began to carry our
peaks responding to Eu ions we found peaks reffered to Gd and Mn ions.
some theoretical rese
тлиб, И.В. Мурин, Е.М. Пиотровская, Е.Н. Бродская // Неорг. Материалы, т.
[2] yes // Proc. Royal Soc. A, v. 247, N 1249, pp. 141-151,
[3] tching // Solid St. Phys. v. 16, pp. 227-273, (1964).
Fig.2. CaF2:Eu2+ (0.01%) single crystal EPR spectra. T=77K. B0||C4.
arch. Calculations of parameters of the crystalline field potential using the point-charge model [3] were performed. These calculations showed that such deformation really leads to the destortion of crystalline field potential and the axial component of potential b2
0 appears to be non-zero value.
References [1] И.Ю. Го
37, 9, с. 1144-1148, (2001).
J.M. Baker, B. Bleaney, W. Ha(1958).
M.T. Hu
109
P R O C E E D I N G S
Spin-state polaron in lightly hole-doped LaCoO3
A. Alfonsov1), E. Vavilova1,2), V. Kataev1), B. Buechner1), A. Podlesnyak3), M. Russina3), A. Furrer4), Th. Straessle4), E. Pomjakushina4,5), K. Conder5), D.I. Khomskii6)
1) IFW Dresden, D-01069 Dresden, Germany
2) Zavoisky Physical Technical Institute, RAS, 420029 Kazan, Russia
3) Hahn-Meitner-Institut, D-14109 Berlin, Germany
4) Laboratory for Neutron Scattering, ETH Zuerich & PSI, CH-5232 Villigen PSI, Switzerland
5) Laboratory for Developments and Methods, PSI, CH-5232 Villigen PSI, Switzerland
6) II. Physikalisches Institut, Universitaet zu Koeln, 50937 Koeln, Germany
e-mail: [email protected], [email protected]
Introduction Hole-doped cobaltite La1-xSrxCoO3 with a pseudocubic perovskite structure attracts a
continuous attention due to its rich phase diagram and unusual magnetic properties [1]. LaCoO3 is a nonmagnetic insulator at low temperatures since Co3+(3d6) occurs in the low-spin (S = 0) state. It becomes magnetic and conducting at higher temperatures due to a thermally driven transition of Co3+ to a higher spin state. The substitution of a Sr2+ ion for La3+ provides hole doping. It yields the formation of ferromagnetic clusters that show superparamagnetic and spin glass properties in the doping range 0.05 < x < 0.2. Up to now most of the investigations were focused on compositions with relatively high Sr doping levels (x > 0.1). It was considered that introduction of each hole in the parent LaCoO3 creates in the lattice a Co4+ ion possessing a magnetic moment. Surprisingly Yamaguchi et al. [2] found that already very small doping levels (x ~ 0.002) give rise to an unexpectedly large magnetic susceptibility at low temperatures that cannot be explained by the occurrence of a small amount of individual magnetic Co4+ ions. It was conjectured that a doped hole forms a magnetic polaron with a huge local magnetic moment, though its nature has remained unclear. To obtain insights onto the microscopic origin of such a polaron we performed measurements of electron spin (ESR), nuclear magnetic (NMR) resonance and inelastic neutron scattering (INS) on a highly stoichiometric single crystal of La1-xSrxCoO3 with x = 0.002 [3].
Experimental set-ups High field ESR measurements were performed with a home-made spectrometer (see Ref.
[4]) at frequencies ν = 27 - 550 GHz and magnetic fields B = 0 - 15 T. B was set parallel to the [001] pseudo-cubic axis of the single crystal. In the same magnetic field geometry 59Co NMR was measured at a frequency of 47.65MHz with a Tecmag pulse NMR spectrometer. Magnetization was measured with a conventional SQUID magnetometer. The INS measurements were done on the high-resolution time-of-flight spectrometers NEAT (Hahn-Meitner-Institut, Berlin, Germany) and FOCUS (Paul Scherrer Institut, Villigen, Switzerland) using neutron energies 3.26 - 3.5 meV.
110

P R O C E E D I N G S
Results The static magnetization M(B, T) data (Fig.1,a) confirm the earlier result by Yamaguchi et
al. [2] of a strong magnetic response in the low T regime. The estimate of the effective moment from the M(B)-dependences at low T yields a moment of ~15 μB per doped hole. This value is much larger than expected for Co3+ or Co4+ in any spin state.
A drastic enhancement of magnetism due to a small Sr doping is also seen in the NMR measurements. In contrast to our 59Co NMR data of the undoped LaCoO3 where the spectral shape and the spin-lattice relaxation rates agree very well with previous studies [5, 6], the NMR results on La0.998Sr0.002CoO3 are remarkably different (Fig.1,b). The low T spectrum broadens and quadruple structure is not resolved anymore, implying that the hole doping induces a strongly inhomogeneous distribution of local magnetic environments at low temperatures which is seen by the majority of the 59Co nuclei. In addition, there is a very strong enhancement, about 15 times, of a nuclear spin relaxation rate 1/T1 at low T that evidences strong magnetic fluctuations (Fig.1,c). At T > 30K the rate 1/T1 and the spectral shape become however very similar to that of the undoped LaCoO3.
Fig.1. (a) - M(B)-dependences at low T for La0.998Sr0.002CoO3 (open circles) and LaCoO3 (closed circles); (b) and (c) - low-T 59Co NMR spectra and T-dependences of the nuclear relaxation rate
1/T1 for LaCoO3 (open circles) and La0.998Sr0.002CoO3 (closed circles). Lines connecting data points are guides for the eye; (d) - temperature evolution of the INS spectra of La0.998Sr0.002CoO3. Solid black squares correspond to data taken from nonmagnetic LaAlO3 at 50 K, black lines refer
to least square fits of Gaussian functions.
Low temperature INS measurements of the doped sample (Fig.1,d) reveal a peak at the energy of ~ 0.75meV which is absent in the undoped compound [7]. The occurrence of this peak at low T suggests that it is a gapped ground state magnetic excitation. Upon raising the temperature an additional peak appears at ~ 0.6 meV. This excitation is present also in the undoped material where it was attributed to thermally excited magnetic Co3+ ions [7].
The gapped nature of magnetic excitations in the doped sample is also evident in the ESR measurements. Whereas at low frequencies only a small ESR absorption line can be detected presumably due to paramagnetic impurities, a strong multi-line ESR signal appears at ν well above 100 GHz (Fig. 2). The ESR response is strongest at the lowest temperature of 4K in a drastic contrast to the parent LaCoO3 which is ESR silent at low T [8]. Depending on the
111

P R O C E E D I N G S
excitation frequency one can observe up to seven resonance lines which signifies a large spin multiplicity of the resonating centers. To quantify the excitation gap Δ0 the position of these lines has been plotted in the ν versus B coordinate frame and linearly approximated to B = 0 (Fig.2,a). Linear fits for excitations 1, 2, 3 and 6 which comprise a significant part of the total spectral weight cross the frequency axis at the gap value Δ0 ≈ 170 GHz ≈ 0.7meV which corresponds well with the position of the low T magnetic peak in the INS spectrum (Fig. 1c). From the slope of the linear fits we obtain the g-factors of corresponding ESR modes that range from 2.1 to 18.3. For the main line with the biggest intensity (peak 3 in Fig. 2b), the g-factor is equal to 3.55. Note that g-factors much larger than the spin-only value of 2 evidence a big admixture of the orbital magnetic moment to the spin moment, suggesting a strong spin orbital coupling in the system.
Fig.2. (a) - frequency vs. magnetic field dependence of the resonance lines of the low-T ESR
spectrum. Straight lines represent linear fits. Open squares correspond to a presumably impurity peak visible below ~ 200 GHz; (b) - T-dependence of the ESR spectrum at 348 GHz. Signals
from thermally activated magnetic Co3+ ions are labeled as A and B.
The low temperature set of lines (peak 1 to peak 7 in Fig. 2) decreases in intensity upon warming the sample. At T > 30K two new lines, marked A and B in Fig. 2,b, appear. Their intensities grow and at 50K only these lines are present in the ESR spectrum. The study of the frequency dependence of modes A and B yields g-factors gA = 5.96 and gB = 3.48, respectively, and the excitation gap Δ0
A,B ≈ 150 GHz (0.6 meV). Contrasting T-dependences of the intensity, different number of lines and different values of g and Δ0 suggest different nature of the low- T and high-T ESR signals. The former is obviously related to the Sr i.e. hole doping. The latter can be identified with the ESR of the thermally activated magnetic Co3+ ions since g and Δ0
A,B values are very close to the Co3+-ESR data in the pristine LaCoO3 by Noguchi et al. [8]. Moreover, the ESR gap value Δ0
A,B ≈ 0.6meV is very similar to the high T magnetic peak in the INS spectrum of the doped (Fig. 1c) and undoped compound [7], both assigned to the thermally activated magnetic Co3+ states.
Discussion
112

P R O C E E D I N G S
The above experimental data on La0.998Sr0.002CoO3 obtained from different techniques yield the unambiguous conclusion that in this small doping regime a huge low temperature magnetic response cannot be explained by the magnetism of a small amount of individual Co4+ ions created by the hole doping. To explain a large magnetic moment, a spatially inhomogeneous distribution of magnetization across the sample and a large spin multiplicity one has to conjecture that a doped hole creates an extended spin cluster (spin polaron) with a significant contribution of orbital magnetism. Remarkably, measurements of the intensity of the 0.75meV INS peak as a function of the scattering wave vector show that the created polaron is the octahedral-shape septamer of Co ions [3]. The smaller ionic radii and a larger positive charge of the Co4+ ions created due to the hole doping yields a displacement of oxygen ligands towards a Co4+ ion and thereby reduce the crystal field potential at the surrounding Co3+ ions. This leads to the stabilization of the magnetic intermediate spin state (S = 1) at these Co3+ sites. Because of the strong ligand crystal field the central Co4+ occurs in the low spin state (S = 1/2). The hole is delocalized between the central Co4+ (S = 1/2) and six neighboring Co3+ (S / 1) as has been proposed in Ref. [9]. The double exchange interaction due to the hopping of the hole in this septamer promotes a ferromagnetic coupling between the central Co ion and its six neighbors which form thus a ferromagnetic spin-state polaron.
Acknowledgments. This work is partly based on experiments performed at the Swiss spallation neutron source
SINQ, Paul Scherrer Institute, Villigen, Switzerland. We acknowledge support by the European Commission under the 6th Framework Programme through the Key Action 'Strengthening the European Research Area, Research Infrastructures' (contract: RII3- CT-2003-505925), by the European project COMEPHS, by the Swiss National Science Foundation (SCOPES IB7320-110859/1, NCCR MaNEP) and by the German-Russian cooperation project of the DFG (grant No. 436 RUS 113/936/0-1), by SFB 608 and of the RFBR (grants No. 08-02-91952-NNIO-a & No. 07-02-01184-a).
References [1] Senaris-Rodriguez M and Goodenough J 1995 J. Solid State Chem. 118 323
[2] Yamaguchi S, Okimoto Y, Taniguchi H and Tokura Y 1996 Phys. Rev. B 53 R2926
[3] Podlesnyak A, Russina M, Furrer A, Alfonsov A, Vavilova E, Kataev V, Buechner B, Straessle T, Pomjakushina E, Conder K and Khomskii D I 2008 Phys. Rev. Lett. 101 247603
[4] Golze C, Alfonsov A, Klingeler R, Buechner B, Kataev V, Mennerich C, Klauss H H, Goiran M, Broto J M, Rakoto H, Demeshko S, Leibeling G and Meyer F 2006 Phys. Rev. B 73 224403
[5] Itoh M and Natori I 1995 J. Phys. Soc. Jpn. 64 970
[6] Kobayashi Y, Fujiwara N, Murata S, Asai K and Yasuoka K 2000 Phys. Rev. B 62 410
[7] Podlesnyak A, Streule S, Mesot J, Medarde M, Pomjakushina E, Conder K, Tanaka A, Haverkort M W and Khomskii D I 2006 Phys. Rev. Lett. 97 247208
[8] Noguchi S, Kawamata S, Okuda K, Nojiri H and Motokawa M 2002 Phys. Rev. B 66 094404
[9] Louca D and Sarrao J L 2003 Phys. Rev. Lett. 91 155501
113

P R O C E E D I N G S
High-field ESR and magnetization study of a novel trinuclear Ni(II) molecular complex
Yu. Krupskaya1), A. Parameswaran1), A. Alfonsov1), R. Klingeler1), V. Kataev1),
M. Gressenbuch2), B. Kersting2), B. Büchner1) 1) Leibniz Institute for Solid State and Materials Research (IFW) Dresden, D-01171 Dresden,
Germany
2) Institute of Inorganic Chemistry, University of Leipzig, D-04103 Leipzig, Germany
e-mail: [email protected]
Abstract We have investigated the magnetic properties of a novel trinuclear macrocyclic chelate
Ni(II) complex by means of static magnetization M and high field frequency tunable electron spin resonance (HF-ESR) studies. Magnetic field B and temperature T dependencies of M reveal an antiferromagnetic intramolecular coupling J = 140 K and a magnetic ground state of the molecule with a total spin Stot
0 = 1. HF-ESR measurements at frequencies ν = 80 – 350 GHz and B up to 15 T yield a magnetic anisotropy gap of the order of 60 GHz (~ 2.9 K) and a g-factor of 2.2. The simulation of the experimental results yields the relevant parameters of the effective spin Hamiltonian which enables to calculate the energy spectrum of the spin states of the Ni3-complex.
Introduction Nickel (II) is a very promising ion for the realization of a single molecular magnet,
because of its integer spin (3d8, SNi = 1) and often observed significant single ion anisotropy. Therefore, Ni(II) is increasingly used for the synthesis of different molecular magnetic complexes [1-4]. Recently, a novel trinuclear Ni(II) complex has been synthesized, in which three Ni ions are coupled via two μ-S sulphur bridges. Here, we present a detailed magnetic study of this Ni3-complex by means of static magnetization measurements and high field frequency tunable electron spin resonance (HF-ESR).
Experimental The macrocyclic chelate trinuclear Ni(II) complex has been synthesized as a green
microcrystalline powder from a complexation reaction between Ni(OAc)2·4H2O and the free ligand H2L in the presence of triethylamine [5]. The complex was characterized by elemental analysis, IR and UV/Vis spectroscopy and X-ray crystallography. The molecular structure of the synthesized complex [Ni3(L)(OAc)2] with [O3N2Ni(μ-S)Ni(N2O2)(μ-S)NiN2O3] as the core is shown in Fig. 1a.
High field electron spin resonance (HF-ESR) and static magnetization M measurements have been performed on powder samples. Magnetic field B and temperature T dependencies of the magnetization were measured with a commercial SQUID (Superconducting Quantum Interference Device) magnetometer (Quantum Design MPMS-XL5). HF-ESR in magnetic fields up to 15 T and in a frequency range ν = 80 – 350 GHz was measured with a home made spectrometer based on a Millimeterwave Vector Network Analyzer (AB Millimetré) [3].
114

P R O C E E D I N G S
Ni S
N
O
133°
Fig.1. a) Molecular structure of the Ni3-complex. b) Magnetic field dependence of the static magnetization of the Ni3-complex, at low temperatures.
a) b)
0 1 2 3 4 50.0
0.5
1.0
1.5
2.0
B (T)
M (μ
B/3
Ni)
T = 2.0 K T = 4.2 K
Results and analysis The structural analysis of the Ni3-complex shows that three Ni ions are connected via two
μ-S sulphur bridges with the bonding angle of 133°. The structure suggests an antiferromagnetic coupling between the Ni ions. Indeed, the field dependence of the magnetization M(B) at the temperature T = 2 K, presented in Fig. 1b, reveals a saturation magnetic moment MS ≈ 2 μB/3Ni which implies that magnetic ground state of the complex is characterized by a total spin Stot
0 = 1 (assuming the usual g-factor for nickel, g = 2.2). This result provides already strong evidence for the expected antiferromagnetic coupling between three Ni(II) ions (SNi = 1) in the molecule.
A typical powder ESR spectrum at the frequency ν = 166 GHz and at T = 4 K is shown in Fig. 2b(I). It consists of a sharp stand-alone line at Hres ≈ 2.5 T (line 1) and a group of lines distributed in the magnetic field range from 3.5 to 7.5 T (lines 2 - 7). The respective ν vs. resonance field Bres dependencies (resonance branches) for all observed ESR lines together with a representative ESR spectrum are shown in Fig. 2a. The slopes of the resonance
Fig.2. a) ν vs. Bres diagram at T = 4 K. b) ESR spectra at T = 4 K and ν = 166 GHz: (I) – experiment; (II) – model.
0 2 4 6 8 10 12 140
50
100
150
200
250
300
350
Line 1 Line 2 Line 3 Line 4 Line 5 Line 6 Line 7
T = 4 K
ν = 166 GHz
g = 2.2
Freq
uenc
y (G
Hz)
Bres (T)
g = 4.0
Δ ~ 60 GHz
a)
-6-4-202468
10
0 2 4 6 8 10
654
3
ES
R a
bsor
ptio
n (a
rb. u
.)
ν = 166 GHzT = 4 K
1
1
2
2
7
7
Experiment
B (T)
(I)
(II)
b)
Model
115

P R O C E E D I N G S
branches reveal two different g-factors of the ESR lines. Lines 2 – 7 correspond to a g-factor of 2.2, however, line 1 shows an almost two times higher g-factor of 4.0. Moreover, the ν-dependence of the ESR spectrum yields a magnetic anisotropy gap Δ ≈ 60 GHz (2.9 K). The intensity of the ESR lines decreases with increasing the temperature, whereas the relative intensity of the lines does not change. This gives evidence that all detected ESR lines correspond to the ground state of the molecule Stot
0 = 1.
For the analysis of the ESR spectra we introduce an effective spin Hamiltonian in the form:
SBgSSESSSDH Byxz ⋅+−++−= μ)()3/)1(( 222 (1)
The first and the second term of this Hamiltonian describe the zero field splitting of the spin state, caused by an anisotropic ligand crystal field. Here, D is a longitudinal anisotropy and E is a transverse anisotropy. The third term describes the Zeeman interaction of the spin S with the external magnetic field B. Based on our experimental data mentioned above, we assume that the Ni3-complex at low temperatures can be described by a single spin S = Stot
0 = 1 with the g-factor of 2.2 and the magnetic anisotropy gap Δ ≈ D = 60 GHz. The simulation of the powder ESR spectrum has been done for ν = 166 GHz and T = 4 K by means of the EasySpin toolbox for Matlab [6]. Fig. 2b shows that the simulated spectrum fully reproduces the measured spectrum. This demonstrates that the model describes the experimental data at low temperatures very well. In particular, the ground state of the molecule Stot
0 = 1, the g-factor of 2.2 and D = 60 GHz (2.9 K) are confirmed. Moreover, the modeling reveals a positive sign of the longitudinal anisotropy, which implies an easy plane situation for the molecule, and a substantial transverse anisotropy E = 5 GHz (0.2 K). In addition, the analysis implies that the ESR lines 2 – 7 correspond to “allowed” resonance transitions between neighboring energy levels ΔSz = ±1 and line 1 (g = 4.0) corresponds to a so-called “forbidden” transition ΔSz = ±2, indicating the mixing of the energy states due to the anisotropic ligand crystal field.
Fig.3. a) χ(T) and χ-1(T) dependencies at B = 5 T. The black line represents the model fit using the Hamiltonian (2). b) Calculated energy levels of the spin states of the Ni3-
complex.
0 2 4 6 8 10
0
50
100
150
200
250
300
350Stot
2 = 3 (2nd excited state)
Stot1 = 2 (1st excited state)
Ener
gy (K
)
B (T)
Stot0 = 1 (Ground state)
b)
0.00
0.05
0.10
0.15
0.20
0.25
0 50 100 150 200 250 3000
50
100
150
200
250
300
M/B
= χ
(em
u/m
ole)
T (K)
χ−1 (e
mu-1
mol
e)
B = 5 T
Trimer model fit: J = 140 K (AFM) D = 2.9 K; E = 0.2 Kχ0 = - 3.9 •10-3 emu/mole
a)
In order to analyze the magnetic behaviour of the Ni3-complex at higher temperatures and to estimate the intramolecular coupling, the temperature dependence of the magnetic susceptibility χ(T) = M(T)/B has been studied. Interestingly, χ-1(T) as presented in Fig. 3a. reveals a strong nonlinear behavior which indicates a thermal activation of higher energy spin multiplets (Stot
1 = 2, Stot2 = 3). Since the topology of the Ni3-core suggests a single exchange
116

P R O C E E D I N G S
coupling J between the neighboring Ni ions, an effective spin Hamiltonian including the intramolecular coupling J is introduced in the form:
[ ] ∑∑==
⋅+−++−+⋅+⋅=3
1
3
1
2223221 )()3/)1(()('
iiB
iiyixiiiizi SBgSSESSSDSSSSJH μ (2)
Here, the first term describes the isotropic intramolecular magnetic coupling between the Ni spins (J > 0 denotes antiferromagnetic coupling). The second term describes the zero field splitting of the spin states of each Ni ion, the third one again the Zeeman interaction. The numerical solution of this Hamiltonian enables the simulation of the temperature dependence of the magnetic susceptibility χ(T), which has been done by means of the julX simulation program [7]. For the simulation, the parameters of the single ion anisotropy Di and Ei were assumed equal for all three Ni ions and taken from the analysis of the ESR spectra (Di = D = 60 GHz, Ei = E = 5 GHz). The simulated χ-1(T) fully reproduces the measurement results (cf. the black line in Fig. 3a) with an antiferromagnetic intramolecular coupling J = 140 K. According to this model, the energy levels of the spin states of the Ni3-complex have been calculated (see Fig. 3b). This energy levels scheme clearly illustrates that the magnetic coupling J of the Ni ions indicates an energy gap of 140 K between the ground state Stot
0 = 1 and the first excited state Stot
1 = 2. In addition, we find a rather large temperature independent diamagnetic component χ0 = -3.9·10-3 emu/mole of the susceptibility which is in agreement with a significant diamagnetic susceptibility of the organic ligands of the Ni3-complex.
Conclusions
We present high-field ESR and static magnetization measurements on the novel macrocyclic chelate trimer Ni(II) complex. The experimental data analysis reveals a magnetic ground state of the complex (Stot
0 = 1), single ion anisotropy parameters D = 60 GHz (2.9 K), E = 5 GHz (0.2 K), the g-factor of 2.2 and the antiferromagnetic intramolecular coupling J = 140 K. We determine all relevant parameters of the effective spin Hamiltonian and calculate the energy spectrum of the spin states of the studied Ni3-complex.
References [1] R. S. Edwards, S. Maccagnano, E.-C. Yang, S. Hill, W. Wernsdorfer, D. Hendrickson,
and G. Christou, J. Apl. Phys. 93, (2003) 7807.
[2] E. del Barco, A. D. Kent, E. C. Yang, and D. N. Hendrickson, Phys. Rev. Lett. 93, (2004) 157202.
[3] C. Golze, A. Alfonsov, R. Klingeler, B. Büchner, V. Kataev, C. Mennerich, H.- H. Klauss, M. Goiran, J.-M. Broto, H. Rakoto, S. Demeshko, G. Leibeling, F. Meyer, Phys. Rev. B 73, (2006) 224403.
[4] P. Chaudhuri, V. Kataev, B. Büchner, H.-H. Klauss, B. Kersting, and F. Meyer, Coord. Chem. Rev. 253, (2009) 2261 – 2285.
[5] M. Gressenbuch, B. Kersting, Dalton Trans. (2009) 5281 – 5283.
[6] S. Stoll, A. Schweiger, J. Magn. Reson. 178(1), (2006) 42 – 55.
[7] http://ewww.mpi-muelheim.mpg.de/bac/logins/bill/julX_en.php
117
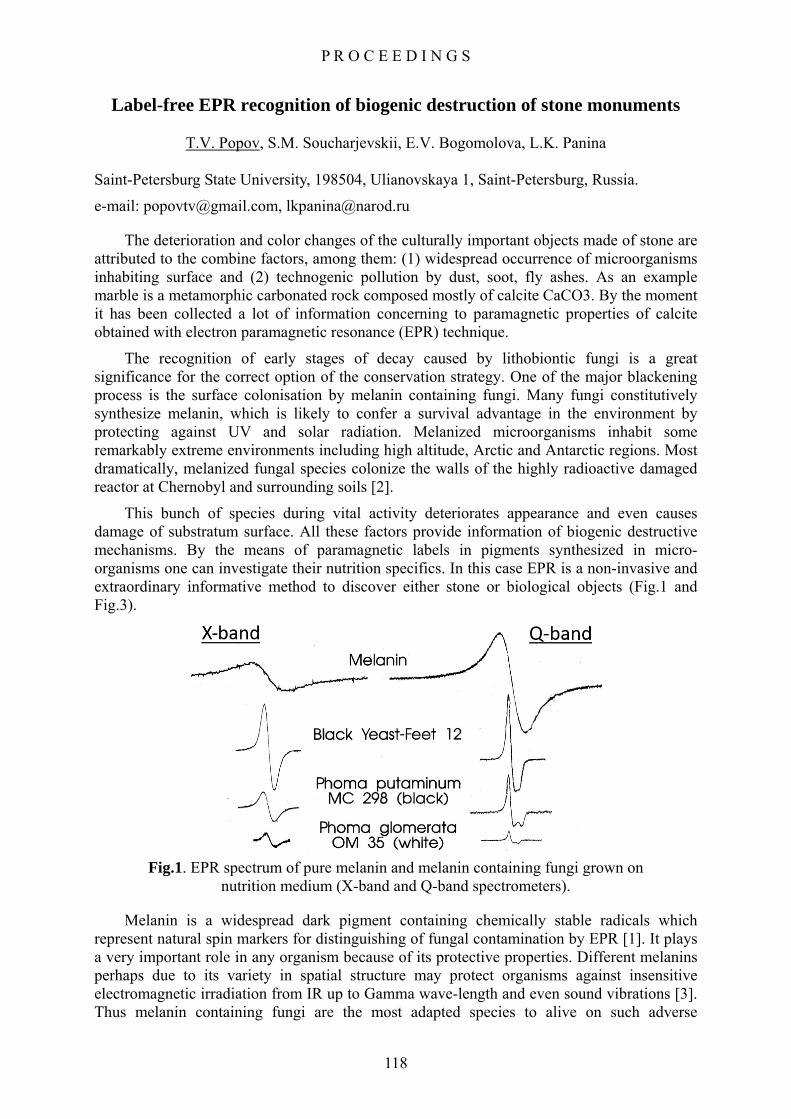
P R O C E E D I N G S
Label-free EPR recognition of biogenic destruction of stone monuments
T.V. Popov, S.M. Soucharjevskii, E.V. Bogomolova, L.K. Panina
Saint-Petersburg State University, 198504, Ulianovskaya 1, Saint-Petersburg, Russia.
e-mail: [email protected], [email protected]
The deterioration and color changes of the culturally important objects made of stone are attributed to the combine factors, among them: (1) widespread occurrence of microorganisms inhabiting surface and (2) technogenic pollution by dust, soot, fly ashes. As an example marble is a metamorphic carbonated rock composed mostly of calcite CaCO3. By the moment it has been collected a lot of information concerning to paramagnetic properties of calcite obtained with electron paramagnetic resonance (EPR) technique.
The recognition of early stages of decay caused by lithobiontic fungi is a great significance for the correct option of the conservation strategy. One of the major blackening process is the surface colonisation by melanin containing fungi. Many fungi constitutively synthesize melanin, which is likely to confer a survival advantage in the environment by protecting against UV and solar radiation. Melanized microorganisms inhabit some remarkably extreme environments including high altitude, Arctic and Antarctic regions. Most dramatically, melanized fungal species colonize the walls of the highly radioactive damaged reactor at Chernobyl and surrounding soils [2].
This bunch of species during vital activity deteriorates appearance and even causes damage of substratum surface. All these factors provide information of biogenic destructive mechanisms. By the means of paramagnetic labels in pigments synthesized in micro-organisms one can investigate their nutrition specifics. In this case EPR is a non-invasive and extraordinary informative method to discover either stone or biological objects (Fig.1 and Fig.3).
Fig.1. EPR spectrum of pure melanin and melanin containing fungi grown on
nutrition medium (X-band and Q-band spectrometers).
Melanin is a widespread dark pigment containing chemically stable radicals which represent natural spin markers for distinguishing of fungal contamination by EPR [1]. It plays a very important role in any organism because of its protective properties. Different melanins perhaps due to its variety in spatial structure may protect organisms against insensitive electromagnetic irradiation from IR up to Gamma wave-length and even sound vibrations [3]. Thus melanin containing fungi are the most adapted species to alive on such adverse
118
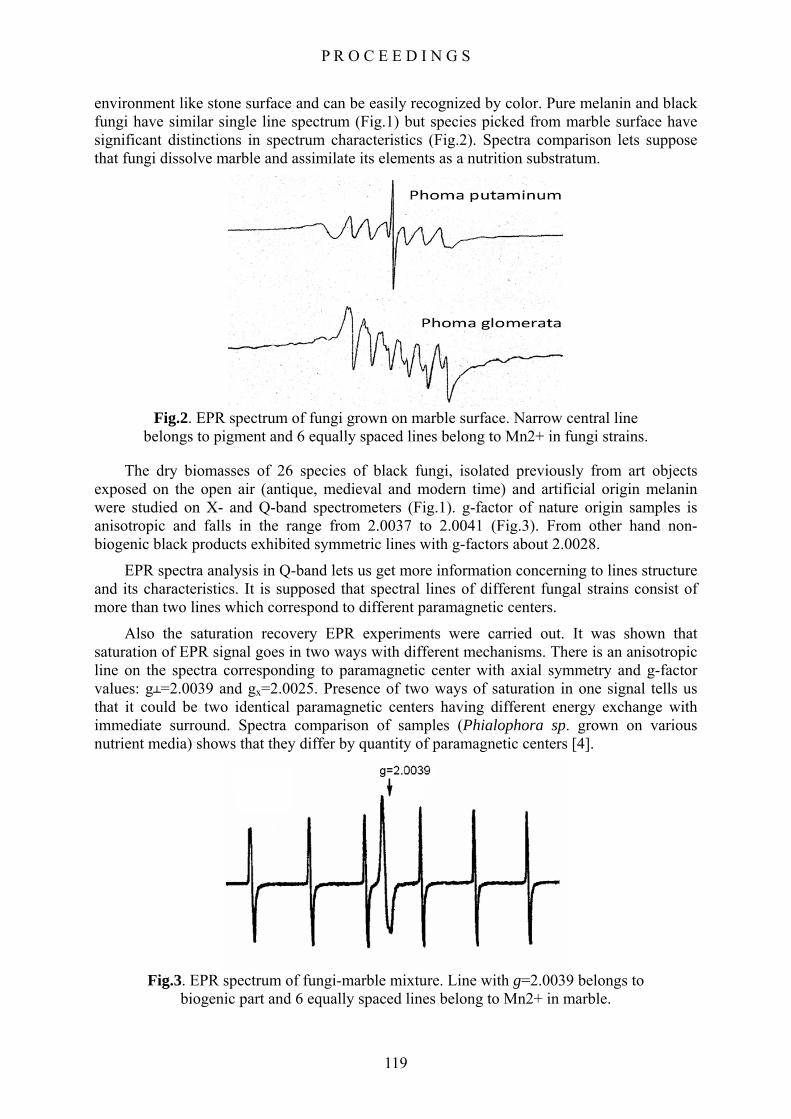
P R O C E E D I N G S
environment like stone surface and can be easily recognized by color. Pure melanin and black fungi have similar single line spectrum (Fig.1) but species picked from marble surface have significant distinctions in spectrum characteristics (Fig.2). Spectra comparison lets suppose that fungi dissolve marble and assimilate its elements as a nutrition substratum.
Fig.2. EPR spectrum of fungi grown on marble surface. Narrow central line
belongs to pigment and 6 equally spaced lines belong to Mn2+ in fungi strains.
The dry biomasses of 26 species of black fungi, isolated previously from art objects exposed on the open air (antique, medieval and modern time) and artificial origin melanin were studied on X- and Q-band spectrometers (Fig.1). g-factor of nature origin samples is anisotropic and falls in the range from 2.0037 to 2.0041 (Fig.3). From other hand non-biogenic black products exhibited symmetric lines with g-factors about 2.0028.
EPR spectra analysis in Q-band lets us get more information concerning to lines structure and its characteristics. It is supposed that spectral lines of different fungal strains consist of more than two lines which correspond to different paramagnetic centers.
Also the saturation recovery EPR experiments were carried out. It was shown that saturation of EPR signal goes in two ways with different mechanisms. There is an anisotropic line on the spectra corresponding to paramagnetic center with axial symmetry and g-factor values: g=2.0039 and gx=2.0025. Presence of two ways of saturation in one signal tells us that it could be two identical paramagnetic centers having different energy exchange with immediate surround. Spectra comparison of samples (Phialophora sp. grown on various nutrient media) shows that they differ by quantity of paramagnetic centers [4].
Fig.3. EPR spectrum of fungi-marble mixture. Line with g=2.0039 belongs to
biogenic part and 6 equally spaced lines belong to Mn2+ in marble.
119

P R O C E E D I N G S
In conclusions, EPR spectroscopy clearly demonstrate that biogenic destruction of monuments can be recognized from technogenic ones without special labeling. Due to high sensitivity of EPR technique it is a) possible to detect early stages of fungal colonization (just 1 mg per sample) and b) different fungal strains can be distinguished from species to species. All these investigations cause proper deterioration prevent works to save cultural memorials.
References [1] Soucharjevskii S., Gorbushina A., Krumbein W., Panina L. Recognition and
identification of marbles and marble infecting black fungi using ESR-techniques. — “Conservation of Monuments on the Mediterranian Basin”. V. Fassina, Venice, Italy. 1994. P. 335-341.
[2] Dadachova E, Bryan RA, Huang X, Moadel T, Schweitzer AD, et al. (2007) Ionizing Radiation Changes the Electronic Properties of Melanin and Enhances the Growth of Melanized Fungi. PLoS ONE 2(5): e457. doi:10.1371/journal.pone.0000457.
[3] Peter H. Proctor. Free Radicals and Human Disease. CRC Handbook of Free Radicals and Antioxidants, vol. 1 (1989), p. 209-221.
[4] Bogomolova E.V., Panina L.K., Proletarsky A.Yu., Soukharjevski S.M., Tsukanova V. (2005) EPR spectra of dark-colored micromycetes in changing conditions // Advances in medical mycology 5: 28-29. In Russian.
120

P R O C E E D I N G S
NMR microimaging for studying the initial stages of gelation process in colloidal silica
E.V. Morozov1,2), O.V. Shabanova2), V.F. Pavlov2), O.V. Falaleev1,2)
1) Kirensky Institute of Physics, Krasnoyarsk scientific center, SB RAS, 660036,
Akademgorodok 50; Krasnoyarsk, Russia
2) Special Designing and Technological Bureau «Nauka» KSC SB RAS, 660049, Mira 53; Krasnoyarsk, Russia
e-mail: [email protected]
Introduction The method of magnetic resonance imaging (MRI) is a novel tool for investigations
internal structure of various samples without their destruction. It turns out to be useful when studying the processes of drying and saturation, cementation, transport, adsorption, chemical waves and other [1].
The studying of different colloidal and micro heterogeneous forms of silica with advanced surface (sol, gel and powder) has large significance. Particularly the gel formation initial stages study using indirect methods is complicated [2].
Some preliminary MRI results of gel formation in the systems of colloidal silica received from synthetic wollastonite (foamed silicate) and basalt mineral wool by acid leaching are set out in the present work.
Experimental For MRI investigation two types of samples were used. Namely acid silicious sols
obtained from synthetic wollastonite (through the leaching by silica phosphoric acid, Н3РО4) and basalt mineral wool (basic component is calcium silicate). Experiments were made on the NMR installation based on AVANCE DPX 200 at field 4.7 T with probe PH MICRO 2.5 (coil’s diameter 25 mm). An initial solution was filled into glass tube (see the scales on Fig.1).
Results and discussion
Sols on basis of foamed silicate
Foamed silicate has been powdered, mixed with orthophosphoric acid and filtered after intensive shaking (with large quantity of heat release). The rate of gel formation increases noticeably when the concentration of acid increased. On the Fig.1 the images of T2-weighted longitudinal slices with different initial acid concentration are presented. The spin-echo technique was used.
MRI turns out well to visualize progressing processes in the system. They arise as fronts in the near-surface layer which spread into the depth of the system. It should be noted that the origin, development and disappearance of fronts occurs in the earliest gel formation stages long before the loss of sample fluidity. It’s possible to say, that given processes occurs at the stage of transfer from solution to sol, i.e. during the process of silicic acid primary polymerization.
As it was considered before [2, 3], the mobility loss under the sol-gel transfer occurs not long before the gelling of the system, and the processes of gel formation are insignificant
121

P R O C E E D I N G S
during the whole induction period. On the Fig.2 the time dependences of spin-lattice relaxation (T1) for samples with some orthophosphoric acid concentrations are presented. As evident from presented date, maximum T1 decrease occurs during the first four hours.
Fig.1. The central longitudinal slices of sample on base of foamed silicate with different
initial acid concentrations (from left to right, M: 0.6, 1.2, 1.8, 2.4); FOV 40mm, slice thickness 1mm.
The point of sol-gel transfer, obtained by mechanical methods from formed gel fluidity loss, does not contemporize to veritable moment of sol-gel transfer. Indeed, the gel formation time for sols on base of 1.6 M acid solution takes 70-80 h (for 2.0 M – 30 h), as well as the time decrease of spin-lattice relaxation may be observed already under 60 h (25h). At the same time the value of T1 for viscous but yet mobile sample (72h – 1.6 М, 29h – 2.0 М) differs from time T1 for already consolidated one (80h – 1.6 М, 32h – 2.0 М) a little bit (Fig.2). It is in accord with theoretical conceptions of sol-gel transfer mechanism [3]: the gelation occurs under the ~ 50% gel structure’s portion in sol medium.
88
98
108
118
128
138
148
158
168
0 1000 2000 3000 4000 5000t, min
Т 1, m
s
65
75
85
95
105
115
125
0 500 1000 1500 2000 2500 3000 3500t, мин
Т 1, m
s
Fig.2. T1 dependences on the time for samples with initial acid concentrations 1.6 М
(left) and 2.0 М (right)
It’s possible also to conclude that polymerization with formation of initial particles and their growth practically stops in 3 – 4 h after sol preparation, and bonds between gel agglomerates increase after gelation.
It was carried out the investigation of spin-spin relaxation dependence (T2) on the time. The curves are presented on the Fig.3. For explain these experimental curves the following model of processes evolution in the system was proposed. After sol initial particles formation the polymerization and subsequent aggregation took place. In the period between maximum time decrease termination Т1 and Т2 (3-4 h after preparation) and steady state (the period before sol-gel transfer beginning) particles agglomerates aggregation occurs due to formation of weak bonds between separate structures. The aggregation in sols with less acid concentrations and consequently with less concentrations of dissolved silica begins later; the forming structures are unstable and are disintegrated easily; so the system is in balance for 30 – 40 min. Thus an effect of oscillation Т2 (greater mobility corresponds to greater Т2 -
122

P R O C E E D I N G S
decomposition of the bigger aggregate for little ones) takes place. When increasing the portion of dissolved silica the aggregation begins earlier and under such conditions the forming structures are more stable – oscillation T2 is insignificant and transfer is stronger. If the concentration of dissolved silica is more than defined value, the aggregation occurs avalanche-like, the formed agglomerates are stable – there is a “step” on the relaxation dependence.
46,5
47,5
48,5
49,5
50,5
51,5
52,5
53,5
0 50 100 150 200 250 300t, min
Т2, m
s
3131,5
3232,5
3333,5
3434,5
35
0 100 200 300 400 500t, min
Т 2, m
s
26
27
28
29
30
31
32
0 100 200 300 400t, min
Т 2, m
s
22
22,5
23
23,5
24
24,5
25
25,5
0 100 200 300 400t, min
Т 2, m
s
18,5
19
19,5
20
20,5
21
21,5
22
0 25 50 75 100 125 150 175 200 225 250 275t, min
Т 2, m
s
18,519
19,520
20,521
21,522
22,5
10 35 60 85 110 135 160 185 210 235 260 285 310 335
t, min
Т 2, m
s
a b
c d
e f
Fig.3. Т2 dependences on the time for samples with different initial acid concentrations (a – 0.6 M, b – 1.2 M, c – 1.4 M, d – 1.65 M, e – 1.7 M, f – 1.8 M)
Sols on basis of basalt mineral wool
In sols of second type the fronts also arise in the near-surface layer, but they have less thickness and a clear thin structure (Fig.4, T2-weighted images, spin-echo). Average thickness of every “finger-like” front is 1 – 1.5mm. Irrespective of the tube’s diameter the front propagation character remains, at the same time the first front reaches the bottom already in 2 hours after preparation.
The appearance of the second front can be observed after the first front sufficient evolution (Fig.5). The structure of the second front differs by central intensive thick finger which has sometimes some less side branches.
123

P R O C E E D I N G S
Fig.4. The central slices of three samples during the first hour after preparation; FOV 40 mm, slice thickness 1 mm.
On the Fig.6 the noted above peculiarities of the finger-like fronts are illustrated by the transverse slices. Some unexpected interesting picture (Fig.6b) is visible when the first front (Fig.6a) is transferring to the second front (Fig.6c).
Fig.5. The central slices of some samples with the forming second aggregation front
a b c
Fig.6. The central transverse slices of one sample after about 1 (a), 4 (b), and 6 (c) hours
The dynamics of first and second front propagation is presented on the Fig.7a (l – length of finger). As seen from presented data, the initial front propagation rate does not depend on specific direction while the second front rate has two periods.
Mechanical fluidity loss of formed gel is accompanied by uniform fogging front in images (not shown). The front extends from the surface to the bottom. The given front depth propagation dependence on time presented in the Fig.7b, where l is the depth of propagation (in fact, this is the high of visible image). As evident from presented dependence, when losing water the front penetration rate decreases. It is connected with the activity of capillary forces holding the remains of liquid water in the interstices within the solid gel mass.
The described results show that the MRI opens some unusual heterogeneities in absolutely limpid systems, which reflect complicated dynamic of processes in the initial stages of gel formation. The discussions of some possible models are in progress.
124

P R O C E E D I N G S
a b
0
5
10
15
20
25
30
0 100 200 300 400t, min
l, m
m
1а 1b 2а 2b
0
1
2
3
4
5
6
7
0 1000 2000 3000 4000 5000 6000t, min
l, m
m
Fig.7. The aggregation front dynamics in sols on basis of basalt mineral wool (a) and last
front propagation (b); 1а – central finger of the first front, 1b – fingers of the outlying districts, 2а – the first period of the second front, 2b – the second period of the second front
References
[1] Koptug I.V., Sagdeev R.Z. New ways for applying of magnetic resonance imaging. Uspekhi Khimii, 71, 7, 672-699 (2002).
[2] Shabanova N.A., Sarcisov P.D. Basis of nanodespersed silica sol-gel technologies. Akademkniga, Moscow (2004).
[3] Iler, R. Chemistry of silica, Mir, Moscow, 809 (1982).
125

P R O C E E D I N G S
63,65Cu NMR study of the magnetic structure in the multiferroic LiCu2O2
A.F. Sadykov, Y.V. Piskunov, A.P. Gerashenko, V.V. Ogloblichev, A.L. Buzlukov, K.N. Mikhalev, S.V. Verkhovskii
Institute of Metal Physics, UB RAS, 620041, S. Kovalevskaya Str. 18, Ekaterinburg, Russia
e-mail: [email protected]
LiCu2O2 is the quasi one-dimensional multiferroic compound. The crystal structure, which has orthorhombic symmetry, is an alternation along the c axis of three layers: 1) –Cu+(1)–, 2) –O(1)Cu2+(2)O(2)Li– and 3) –LiO(2)Cu2+(2)O(1)– [1]. The features of the magnetic properties of quasi one-dimensional compound LiCu2O2 are determined mainly by extending along the b axis Cu2+–O-chains, in which the Cu2+cations are interacting Heisenberg chains of spins S = 1/2. At present, the question about the type of magnetic structure in LiCu2O2 is highly debated. It was found in 6,7Li NMR [2] and neutron scattering [3] experiments that the magnetic phase transition at the temperature Tc = 24 K takes place in LiCu2O2. This transition is considered as evidence for an incommensurate helical order with propagation along the chain direction. The authors of the paper [3] argue that below phase transition temperature Tc = 24 K in Cu2+–O chains incommensurate spin helix lying in the plane ab is realized. On the other hand, A. Gippius, et al. [2] suggest a complex three-dimensional spiral modulation of the copper local magnetic moments in the Cu2+–O chains.
We present the results of 63,65Cu NMR/NQR studies of magnetic order in the LiCu2O2 oxide. 63,65Cu (I = 3/2) NMR and NQR measurements were performed on the single crystal LiCu2O2 at temperatures T = 290 K and T = 10 K, i.e. above and below the magnetic state transition temperature in the oxide. NMR spectra of two isotopes of copper 63,65Cu located in non-magnetic Cu+(1) layers were recorded at an external magnetic field H0 = 94 kOe for two different orientations of the single crystal in the magnetic field H0 || c and H0 ⊥ c . We were not able to observe the signal from the magnetic copper ions Cu2+(2). This is associated with too rapid transverse relaxation of nuclear spins of copper ions Cu2+ having a non-compensated spin magnetic moment in the electron shell. At Т > Тс NMR spectrum for each isotope of copper is a set of three narrow lines (Δf1/2 < 100 kHz), and the NQR spectrum is two narrow lines. At cooling the sample to T = 10 K there is a considerable broadening and complication of the NMR/NQR spectra. The analysis of the NMR/NQR spectra presented in Fig.1 and Fig.2 has shown that they can be satisfactorily described by the assumption that each of the narrow lines observed above Tc is split in two (for H0=0 and H0 || c) or four (for H0 ⊥ c) broad lines. Such a type of spectra splitting at the transition to an ordered magnetic state is a sign of the realization in the material a complex helical structure of magnetic spin moments. In this study we have been restricted by the analysis of the NMR/NQR in the model of so-called planar helix, which is one of the special cases of three-dimensional helical magnetic structure. The choice of this model is due to both its relative simplicity (compared with three-dimensional helix) and the fact that the most theories of ferromagnetism in LiCu2O2 are constructed under the assumption plane helix is realized in this oxide [4,5].
Fig.1 shows the result of a simulation of 63,65Cu zero field NMR (ZFNMR) spectrum in the magnetically ordered phase of LiCu2O2 at temperature T = 4.2 K. The simulation was performed by using the program «Simul» in which the spatial orientation of magnetic moments was given by a set of Euler angles. As the parameters of the simulation, we varied the amplitude of the local field at the positions of Cu+ |hloc|, the angles ψ and γ. Here, the angle ψ is the angle between the b axis and line of intersection of the helix and ab planes, and γ - the angle between the с axis of the crystal and a helix plane normal. The theoretical
126

P R O C E E D I N G S
spectrum in the Fig.1 corresponds to the values |hloc| = 12.0(1) kOe, ψ = 0 and γ = 40(2)о. Figure 2a shows the result of the 63,65Cu NMR spectrum simulation in the external field H0 = 94 kOe for H0 || c and T = 10 K.
Fig.1. 63,65Cu ZFNMR spectrum in the magnetically ordered phase of the LiCu2O2 single crystal at the temperature Т =4.2 K (•). The solid line represents the theoretical spectrum
obtained by using the «Simul» program. Also 63,65Cu NQR spectra at room temperature are shown.
The theoretical spectrum in the figure 2a corresponds to the same values of the simulation parameters |hloc| = 12.0(1) kOe, ψ = 0 as in the case of NMR for H0=0 and slightly smaller value of γ = 35(2)о. This indicates the external magnetic field directed along the axis c, turns the helix plane slightly. The NMR spectrum for H0 ⊥ c, shown in Fig. 2b, is more complex. The number of lines is doubled in it as compared with the spectrum in Fig. 2a. This spectrum is rather well simulated if the twin crystal structure of LiCu2O2 is taken into account. Furthermore, an analysis of the spectrum leads to the conclusion that the external magnetic field H0 = 94 kOe, directed along the plane ab, turns the helix plane so that its normal and the c axis of the crystal become perpendicular. Unfortunately, our data do not allow to define unambiguously the angle ψ, which specifies the orientation of helix relative to the a and b axes. This requires additional researches. Comparing our results and the electric polarization data, obtained in [6], with theoretical multiferroicity models developed for LiCu2O2 [4, 5], we can state the following: 1) the predictions of the model proposed in [4] are not consistent with our experimental data 2) our data for zero magnetic field, for the fields H0 || c and H0 ⊥ c (under the assumption that for the H0 ⊥ c the ψ is equal to 90о) are in a good agreement with the model presented in [5]. Thus, in order to check whether the model [5] can explain the multiferroicity in LiCu2O2, it is necessary to define precisely the angle ψ. Such experiments are planned by us in the near future.
127

P R O C E E D I N G S
Fig.2. 63,65Cu NMR spectra in the magnetically ordered phase of LiCu2O2 single crystal at T = 10 K for the external magnetic field directions Н0 || с and Н0 ⊥ с. The solid line are the
simulated theoretical spectra.
References [1] R. Berger, A. Meetsma, S. Smaalen, M. Sunddberg, J. Less-Common Metals 175, 119
(1991).
[2] A. Gippius, et al., Phys. Rev. B, 70, 020406 (2004).
[3] T. Masuda, et al., Phys. Rev. Lett. 92, 177201 (2004).
[4] Katsura H., Nagaosa N., Balatsky A.V., Phys. Rev. Lett. 2005. V. 95. 057205.
[5] Moskvin A. S., Drechsler S.-L., Phys. Rev. B. 2008. V.78. 024102.
[6] Park S., Choi Y. J., Zhang C. L. and Cheong S-W., Phys. Rev. Lett. 2007. V. 98. 057601.
128

P R O C E E D I N G S
Self-diffusion and relaxation of low-generation dendrimers by NMR
A.V. Ievlev, D.A. Markelov
Department of Qvantum Magnetic Phenomena, Physical Faculty, 198504, St.Petersburg State University, Ulyanovskaya 1, St. Petersburg, Russia
e-mail: [email protected]
Dendrimers as a regularly branched molecules have a great interest in various fields of supramolecular chemistry, biology and pharmaceutical chemistry. Here we present the NMR-
self-diffusion measurements of dendrimers molecules DAB-CN (8), (generation 2.) in CDCl3 by temperature 22-49 0C. Schematic drawing dendrimer was shown on Fig.2.
The synthesis of the sample and several structural and dynamical parameters are described in Ref. [3]. The concentration of dendrimers was 7,9 wt. %. Thre principle feature of the structure of these macromolecules is the branching of the carbon backbone. The branching gives opportunity to capsulate any useful substances such as drugs, metallic partucules or macromolecules.
Since last two decades dendrimers have been studied by different reasurch teams. The main subject of interest is the properties of dendrimers of fourth and more generations which have different applications in chemistry, bioligy and medicine. Such macromoleculs are spherical and for desctription of their mobility one can apply the well developed theory of spherical obstacls homogeniously distributed in a solution.
In our case the average spacing between solute molecules (~ 40 A) is much less than the mean squared displacement of the particles (~ 105 A) over the timescale of diffusion experiment (~0,02s). This means, the diffusion coefficient of both the dendrimers and solvent may decrease due to obstruction effect. This decrease of the measured diffusion coefficient
No.8 No.6
No.10 No.9
1309.5
1265.6
1220.7
1214.3
1166.6
1119.0
1062.5
1056.4
1050.2
1037.5
1030.9
1024.5 9 6 1
857.2
827.6
534.7
(ppm)
1.21.62.02.42.83.23.6
Fig.1. Spectrum of dendrimer.
129

P R O C E E D I N G S
10 9 8
7 6
2
1
can limit the validity of analyzing the diffusive behavior of dendremer solutions using the Stokes-Einstein equation:
Fig.2. Schematic drawing of dendrimer DAB-CN(8).
DTkRh ⋅⋅⋅⋅
=ηπ6
(1)
where Rh- hydrodynamic radius of the dendrimers, D – diffusion coefficient, η – macro viscosity of the solvent CDCl3. The degree of obstruction is dependent on the shapes of obstructing particles. However analytical expressions for the reduction in diffusion coefficient are known only for some very simple cases [1,2]:
[ ]φ⋅−⋅= 210exp DD (2)
where ф is the volume fraction of obstructing particles, and Do is the diffusion coefficient in the absence of obstructing particles from this equation we can estimate the hydrodynamic radius Rh of dendrimers. At 26oC and η =0,54*10-3Ns/m2 we have Rh=8,16 Е, that is in a good agreement with Rh=8,20 Е, established through light scattering studies and viscometry [3] and with Rh= 8,45 Е, established from geometry of our dendrimers molecule. However by temperature 49oC and η =0,44*10-3Ns/m2 (see Bruker-report 1988), we would have Rh=2,73Е, that is unreal. On the other hand, as shown on Fig.3, the diffusion coefficient of pure solvent from 24oC to 44oC increases by factor 4. If we assume the micro viscosity of solvent changed so strength, than the Rh in our case is unchanged.
Information of dendrimers macromoleculse dinamics in solution, one may given in corpore – analising experimental data of temperature dependences its diffusivity D and NMR-relaxation time Т1 and Т2. Study temperature dependence diffusivity D, may be extract information of translational mobility the object in solution during experiment, and also define energy of activation of macromolecule dendrimer. Temperature dependance of relaxation times may be given information of internal mobility structural section, and rotational motion macromolecule.
Experimental data, were measured on sectrometers BRUKER SXP 2 – 100 and BRUKER AVANCE 400.
Procedure obtaining experimental data was following:
130

P R O C E E D I N G S
• The diffusion coefficients for dendrimers, pure solvent and solvent with dendrimers, were determined by means of Hahn-echo pulse sequence (90o-t-180o) on Bruker SXP-2-100 with static gradient probe providing a maximum gradient strength of 0,15 T/m. The diffusion decay for all temperatures was mono-exponential and results are shown in Fig.1. Amplitude signal Echo to describe next decay:
⎥⎦⎤
⎢⎣⎡−⎥
⎦
⎤⎢⎣
⎡−= 322
2 32exp2exp)0()2( τγττ Dg
TAA (3)
• Time spin-spin relaxation Т2 identify by Carr-Persel pulse sequence 90о – τ – (180о – τ)n
( ) ( )⎭⎬⎫
⎩⎨⎧
⋅⎟⎟⎠
⎞⎜⎜⎝
⎛−⋅
⎭⎬⎫
⎩⎨⎧−⋅== tmDG
TtAmtA 22
22
20 2
12expexp2 τγτ (4)
• Spin-lattice relaxation time Т1 identify by known in literature as well as «inversion – recovering» 180о – τ – 90о, amplitude of signal free induction after second pulse from interval τ depend on:
( )⎭⎬⎫
⎩⎨⎧
⎥⎦
⎤⎢⎣
⎡−∗−=
1
exp21T
AA oττ (5)
Fig.3. Temperature dependence of diffusivity.
Acknowledgements This work is supported by RFBR (grant 08-03-01139-а)
References [1] Johannesson H., Hall B. J.Chem.Phys.104,6807, 1996
[2] Jonsson B., Wennerstrom H., Nilsson P., Linse P., Coll.Polym.Sci. 264,77,1986
[3] Pavlov G., Korneeva E., Meijer E. Coll.Polym.Sci. 280, 416, 2002
131

P R O C E E D I N G S
Phase segregation in sodium cobaltates NaxCoO2 at large sodium content
T.А. Platova, А.V. Dooglav, I.R. Mukhamedshin
Kazan State University, 420008, Kremlyovskaya str., 18, Kazan, Russia
e-mail: [email protected]
Throughout last 20 years 3d transition metal oxides attracted physicists due to their unique physical properties [1]. These are the systems with strong electron correlations where the doping level of charge carriers in the planes determine the diversity of physical phenomena including superconductivity [2], competition of AF and FM ordering [3, 4], metal-insulator transition [5], the tremendous magnetoresistance [6] etc.
The sodium cobaltates NaxCoO2 are the family of complex oxides which demonstrate coexistence of the high thermoelectric power together with good electronic conductivity [7] as well as superconductivity [8]. The sodium cobaltates NaxCoO2 (space group P63/mmc) are characterized by lamellar crystal structure which consists of edge-shared CoO2 sheets sandwiching the sodium layers with various 0<x≤1 [9]. By changing sodium concentration x the physical properties of sodium cobaltates change dramatically, from the Pauli-type paramagnetic metals (x<0.5) and the superconducting state in hydrated compound at x=0.3-0.4 to Curie-Weiss metals with x≈0.7 and strong correlated system with A-type AF ordering at x ≥ 0.75 [10].
We were working in narrow range 0.67≤x≤0.75 of phase diagram. This range is very attractive due to the occurrence of the A-type magnetic ordering in x=0.75 compound and its absence at lower sodium contents x<0.75. The contradiction of the Curie-Weiss-metal regime and the magnetic ordering is also point of interest on this part of phase diagram [10, 11]. The compounds with x≈0.7 also show the maximum of thermo-power coefficient [7]. Sodium ordering in planes and correlated superstructure could play an essential role in such abundant properties. So the question about the possible structure and ordering in this material is still open.
It is well known that the reproducible preparation of samples with precise stoichiometries is not straightforward in cobaltates. This material is very sensitive to such environment conditions as temperature and humidity [11]. So, both phase homogenity and phase separation, especially at x > 0.5, are the source of many misunderstandings and discussions. There are several statements about the number of stable phases in (0.67≤x≤0.75) sodium range at present. In the work [12] it was found that there are 4 phases in this regime, confirmed by X-ray analysis, susceptibility measurements and NMR data [12]. And the other group has found only two stable single–phase compounds with x=0.71 and 0.84, proved by electrochemical method, X-ray and electron diffraction [11, 13].
We measured the powder samples using nuclear quadruple resonance (NQR) of 59Co. The NQR is a sensitive tool for studying solids as it provides detailed information on the static and dynamic properties of the structure on the scale of a few interatomic spacings. Thus, NQR may be regarded as a powerful tool for investigating the local order in solids whereas the interpretation of the data on disordered (or complex-ordered) materials from usual scattering experiments, such as X-ray or neutron scattering, is complicated by the absence of the long-range translational symmetry or large and complicated unit cell. So NQR could give the additional information about materials and could help to recognize the structures and determine the phase homogenity.
132

P R O C E E D I N G S
We have studied the series of samples with sodium content varying in 0.67≤x≤0.75 range. NQR spectra of 59Co nuclei allowed us differentiate clearly 4 stable phases (see Fig.1): H67, O71, H72 and H75. The phase’s notations are taken from Ref. [12]. The number is an
approximate sodium content (x=0.67, 0.71, 0.72 and 0.75 respectively) and the letter is a type of unit sell (H-hexagonal O-orthorhombic). Each phase corresponds to superstructure or specific ordering in Na and Co planes. Thus, the NQR spectrum is characteristic for each single phase, and it is easy to separate pure phase samples from mixture of phases. This is very important because most of samples had the inhomogeneous sodium order in plane.
Fig.1. The NQR spectra of four single phases marked by colored vertical lines (the H67- black dash-and-dot lines, O71 - solid red lines and H72 - dotted blue lines. The H75 phase is characterized by wide and broad signal.) The sample denoted as Mix is the mixture of
phases as it shows the signals from both phases O71 and H72.
The statements of phase segregation are proved by investigation of powder sample’s evolution. The powder which initially exhibited the mixture of H72 and O71 phases have almost transformed in H67 phase after keeping for 30 hours in humid atmosphere (humidity ≈ 75%) at room temperature. The evolution of NQR spectra of 59Co measured every 10 hours is shown in Fig.2. The sample evolution goes through all found phases with lower sodium content. After the first 10 hours the phase H72 disappeared and another one unstable intermediate phase appeared. At the next stage the amount of O71 phase reduced and at the same time the lines corresponding to H67 phase appeared. After the first 30 hours the sample completely evolved into H67 phase and further keeping the powder in humid air lead to slow decrease of signal intensity corresponding to H67 phase. The material lost the sodium due to interaction with water, the sodium ions from surface reacted with water molecules to form NaOH compound [11]. And the sodium ions which remained in bulk of tiny crystals reorganized and the new phases appeared. So, the phase transformation goes through all possible stable states. It is clear from our experiment that the H67 phase is the most stable one. In any case our H67 phase is exactly the same phase which authors of papers [11, 13] call x=0.71; this was proved by susceptibility measurements as well [12].
One should notice that the existence of four phases is in good agreements with theoretical calculations of the sodium patterning by density functional theory method [14]. In this work was predicted the existence of 5 possible single phases in 0.67≤x≤0.75 sodium range and the sodium ordering patterns was given for most stable ones x≈0.67, 0.71 and 0.75. We have
133

P R O C E E D I N G S
compared their results with our experimental data and found that our data are in perfect agreement with the model for H67 phase. Thus, the superstructure of H67 phase has been found [15, 16]. Concerning other phases, their structures are more complicated. For example, in Fig.3 are shown the typical NQR spectrum of O71 phase. At least there are 12 non-
Fig.2 The NQR spectra of 59Co reflect the evolution of powder sample, which initially was the mixture of O71 and H72 phases. The phase compositions versus time of keeping at humid air: 0 hour, 10, 20, 30 and 70 correspond the H72+O71, O71+unknown+H67,
O71+unknown+H67, H67 and H67 phases, respectively.
equivalents Co positions, but proposed structures in the works [13, 14] give less unequivalent
Fig.3. The NQR spectrum of 59Co belongs to O71 phase. The 12 possible non-equivalents cobalt positions have been found from data analysis.
134

P R O C E E D I N G S
sites independent of the ways of their stacking. So the question about structures in O71 and H75 samples is still open.
In summary, the four stable phases and intermediate one have been found in 0.67≤x≤0.75 sodi
-6183.
References a S. et al., Physics of Transition Metal Oxides (Berlin: Springer, 2004)
., 75, 657 (2003)
56, R12685 (1997)
04)
13(2009)
009)
ev. B, (2009)
um range by NQR. The phases have different level of stability and the H67, O71 and H75 are most stable: our sample went through all of them during its evolution. Our results are in good agreement with the previous investigations [13, 15]. At present, only the structure of H67 phase was determined and fully confirmed by theory and experiment. The structures of other phases still need understanding, which should shed more light on questions of origin of magnetic ordering and Curie-Weiss susceptibility behavior.
The work partially has been supported by the grant RNP
[1] Maekaw
[2] Belyavskii V.I., Kopaev Yu. V., Phys Usp., 49, 441 (2006)
[3] Kagan M.Yu., Kugel’ K.I., Phys Usp., 44, 553 (2001)
[4] Briceno G. et al., Science 270, 273, (1995)
[5] Mackenzie A.P., Maeno Y., Rev. Mod. Phys
[6] Maignan A. et al., J. Solid State Chem. 142, 247 (1999)
[7] Terasaki I., Sasago Y., and Uchinokura K., Phys. Rev. B
[8] Takada K. et al., Nature (London) 422, 53 (2003)
[9] Ivanova N.B. et al., Phys Usp, 179, 837 (2009)
[10] Foo M.L. et al., Phys. Rev. Lett. 92, 247001 (20
[11] Shu G.J. et al., Phys Rev B 76, 184115 (2007)
[12] Alloul H. et al., EPL 82 17002 (2008)
[13] Huang F.-T. et al., PhysRev B 79, 0144
[14] Meng Ying S. et al., J. Chem. Phys.128, 104708 (2
[15] Alloul H. et al., EPL 85, 47006 (2009)
[16] Platova T.A. et al., submitted to Phys. R
135

P R O C E E D I N G S
Development of a new interactive software for spectrum analysis
A.A. Levantovsky, A.V. Komolkin Department of Quantum Magnetic Phenomena, Physical Faculty, Saint-Petersburg State University, 198504, Ulianovskaja, 1, Saint-Petersburg, Russia
e-mail: [email protected]
This paper is elaboration of the work presented at previous meeting “Actual problems of Magnetic Resonance and its Applications”. The first version of the program was quite simple: it was able to open only one spectrum and fit if with a sum of Gauss or Lorentz functions [1, 2].
The main new features of the software called MagicPlot are:
• A composite project files, that contains several data tables and plots of spectrum (Fig.1). Therefore one can compare several spectrum and different fittings on the same figure.
• Multilevel undo function for all actions and history window.
• Fully customizable plot style and high quality image export (including vector image formats via virtual printers, e.g. PDF-printer).
• New peak fitting functions.
The spectra is fitted with a sum of different peak model functions (Fig.2). Initial parameters of lines can be visually set by dragging mouse. One can use different model functions (e.g. Gauss and Lorentz) for different spectrum lines in one spectra.
Fig.1. Main window screenshot
136

P R O C E E D I N G S
Currently supported model functions are: Gauss and Lorentz functions and its derivatives for continuous wave spectrum, Voigt function. The feature of the software is the model line function which represents distorted (broadened) line shape in continuous wave experiment when high modulation amplitude is applied during the registration of spectrum (Fig.3). This model function is evaluated by numerical method. The fitting of spectrum with this function
allows user to find out the true line position, amplitude, width and the modulation amplitude if line shape is distorted due to high modulation. Than the true intensities (2nd integrals) of lines with different width and distortion can be compared.
A free for non-commercial usage version of MagicPlot software (without some features), user guide in Russian and more screenshots can be found at http://magicplot.com.
Fig.2. Spectrum fitting example Fig.3. DPPH EPR Spectrum fitting.
Modulation amplitude is about 3 times greater than line width
References [1] Application of Non-Linear Approximation for Electron Paramagnetic Resonance Signal
Processing: EPRMultiPeak Software.
[2] A.A. Levantovsky, A.V. Komolkin Application of Non-Linear Approximation for Electron Paramagnetic Resonance Spectrum Analysis: Visual Spectrum Decomposer Software // Magn. Resonance in Solids. EJ, 10, No.1, 20-24 (2008), http://mrsej.ksu.ru/ Direct link: http://mrsej.ksu.ru/contents/2008/081001020.pdf.
137

P R O C E E D I N G S
Beta-NMR method and kinetics of polarization transfer in spatially disordered spin system
A.D. Gulko, F.S. Dzheparov, O.N. Ermakov, A.A. Lyubarev, S.V. Stepanov
Institute of Theoretical and Experimental Physics, 117218 Moscow, Russia
e-mail: [email protected]
Abstract
Experimental studies of a delocalization of nuclear polarization of impurity β-active nuclei 8Li in the spatially disordered system of 6Li nuclei in LiF single crystals are performed. The process is initiated by dipole-dipole interaction of nuclear magnetic moments with other nuclei (7Li, 19F) in the crystal. It is effective in a wide range of magnetic fields H0=150÷3000 G as a result of a unique proximity of the g-factors of 8Li and 6Li nuclei: (g(8Li)-g(6Li)) / g(6Li) = 0.0057. The kinetics of 8Li depolarization is measured in the rage of 6Li concentration 3.25, 5.30,10.06% and in the field H0= 200, 700 and 1210 G.
Introduction Application of the polarized beta-active nuclei (beta-NMR-method) allows to carry out
detailed investigation of the redistribution of nuclear polarization (spin excitation) in space and in time. This possibility is based on the correlation between direction of nuclear polarization p and direction of emission of a beta-electron (k is its momentum):
W(θ) ~ 1+Ap cosθ, cosθ= pk/(pk). (1)
Here W(θ) is the angular distribution of the beta-electron emission and A~0.1 is a nuclear constant.
Nuclear spin system 8Li-6Li consists of one polarized beta-active nucleus 8Li and stable isotope 6Li, uniformly distributed in a sample with the concentration c. This is one of the best experimental system for such a study [1,2]. If the isotopes are randomly distributed over the lattice sites, the polarization transfer is described well by the following set of kinetic equations [3]
dpi0 /dt=Σj (νji pi0 - νij pj0) , pi0(t=0) = δi0 , (2)
where pi0= ziI is the polarization (along external static magnetic field H=(0,0,H0) ) of the 8Li
or 6Li nuclei located in the lattice site i. At t=0 all nuclear polarization of the system was localized on the 8Li nucleus (its subscript is i=0). Eq. (2) represents main relaxation mechanism for 8Li nuclei at room temperature and at fields 150G<H0<3000G. It is so-called flip-flop process among the nuclei (or cross-relaxation) which is very efficient owing to occasional coincidence of the g-factors of 8Li and 6Li nuclei: (gI - gS)/gS=0.0057, here I=I0=2 and S=Ii≠0=1 are spins of 8Li and 6Li correspondingly. The process presents a realization of random walk in disordered system (RWDS).
Theory Here we consider spatially disordered system of beta-active 8Li nuclei and stable 6Li nuclei
in LiF single crystals. Important peculiarity of the system is random spatial distribution of these nuclei in the crystal lattice. Polarized beta-active 8Li nuclei with a half lifetime T1/2=0.84 s are
138

P R O C E E D I N G S
formed in LiF as a result of radiation capture of polarized neutrons by 7Li, which is the most abounded isotope of Li. Nonpolarized 6Li nuclei are present in the crystals in a small concentration (up to 10%) and also randomly distributed over lithium sublattice of the crystal. As was mentioned above this system is very peculiar owing to vicinity of the g-factors of 8Li and 6Li, which results in extreme efficiency of the cross-relaxation process among these spins (flip-flop crossovers) initiated by magnetic dipole-dipole interactions. Delocalization of 8Li polarization proceeds in the following way. Initially polarized beta-active nucleus conveys part of its polarization to the nearest 6Li nucleus, which in its turn may either convey it to other 6Li nuclei, or return it back to 8Li. Cross-relaxation between 8Li and host nuclei (7Li and 19F) at magnetic fields higher then 150 G is practically absent because of huge differences in g-factors. Polarization of the ensemble of the beta-active nuclei 8Li may be obtained by means of measuring the angular asymmetry of the emission of beta-decay electrons. Calculation of the polarization averaged over the ensemble of nuclear spins is one of the most important and difficult problems of RWDS. Equations (2), describing migration of 8Li polarization in 8Li-6Li system in LiF, are among the simplest and at the same time most fundamental in RWDS theory. Depolarization kinetics is essentially nonexponential.
First exact results related to the long time behavior of the system were obtained in [3, 4]. It was proven that the long-time asymptote of the depolarization process in this disordered system is diffusion-like. Recently these results were supplemented by a numerical simulation of p(t) at any t [4]. Hypothesis concerning existence of the diffusion-like asymptote of this process where originally formulated in the frameworks of the semiphenomenological theory [5, 6].
Most important milestones of the present theory of the polarization transfer in 8Li-6Li system are as follows. Function p(t), determined by Eqs. (1)-(2), describes depolarization kinetics of 8Li nuclei (p(t=0)=1 is the initial condition). The time scale in the discussed problem is given by the Foerster constant β0 = (512/243)π3c2 ν0, which is proportional to the polarization transfer rate between Li nuclei at average distance in the FCC lattice of LiF.
At β0t ∼ 1 rather reliable expression for p(t) may be obtained using concentration expansion [7, 8]:
p(t) = exp−[β1t/(ξ+1)]1/2 − αβ1t, β1 = β0 ν1 / ν0 (3)
More modern and complicated theory was shown in [5,9], but nowadays there are no numerical-analytical simulation of the process for new experimental results.
Experiment
Detailed description of the experimental setup “Beta-NMR-spectrometer on polarized neutrons”, on which all experimental data were obtained, as well as the procedure of beta-asymmetry measurement and fitting of the data (extraction of 8Li polarization) are given in [2]. Essence of beta-NMR method consists in cyclic creation of polarized beta-active nuclei in investigated sample and subsequent measurement of angular (0-180)o-asymmetry of their beta-radiation.
Beta-NMR-spectrometer consists of two basic blocks: polarizer of thermal neutrons and the block for measurement of the beta-nucleus polarization (i.e. asymmetry of emission of beta-decay electrons). Neutron polarizer includes (see Fig.1): 1, 3, 10 — the neutron collimators; 4 - the neutron mirror polarizers; 2 - the polarizer magnet. Other parts: 14 is the mirror analyzer in the magnet; 5 is the polarized neutron beam chopper; 6 (including 7,8,9) is the spin-flipper (it reorients polarization of the neutrons which irradiate investigated sample 13; 15 is the neutron detector. The registration unit for asymmetry of beta-electron emission
139

P R O C E E D I N G S
consists of electromagnet (11) for production of magnetic field on the sample and scintillation telescope counters for the registration of beta-decay electrons.
Fig.1. Scheme of the beta-NMR-spectrometer on polarized neutrons. Non-polarized neutron beam comes from a nuclear reactor and propagates from the left to the right
side of the figure. See other comments in the text.
The samples used for the measurements are LiF single crystal plates (about several square cm and thickness ~ 3 mm).
Asymmetry of beta-radiation is defined as
a = [N(0°) − N(180°)] / [N(0°) + N(180°)] (4)
where N(0°) and N(180°) are counts of beta-electron detectors for two different directions of polarization of neutron beam. The asymmetry is proportional to the polarization p of the ensamble of beta-active nuclei in the sample. Time dependence of the asymmetry is experimentally observable quantity.
Duration of the channel of the time analyser is 0.102 s. Irradiation by polarized neutrons lasts 2.4 s, then it stops for 7.6 s. At a given direction of the neuron polarization asymmetry is measured during 10 s (during open and closed phases of neutron chopper; 10 s is a duration of one half of a cycle for a given polarization). This pecularity explains special shape of the time dependence of the asymmetry (with a cusp of a curve). Then we proceed with the second half of a cycle when the sample is irradiated by neutrons having opposite polarization. Asymmetry was calculated for each time channel using experimental counts from each telescope counter according to Eq.(4). Then from these data the 8Li asymmetry is extracted after subtraction of contributions of background radiation in experimental hall and the asymmetry produced by the decay of 20F beta-active nuclei.
Results Experimental data on measurements of depolarization kinetics of beta-active nuclei 8Li in
8Li-6Li disordered spin system in LiF single crystals are shown in the Fig.2 and Fig.3. Fig.2 demonstrates 8Li depolarization kinetics with 3.25% concentration of 6Li for three magnetic fields (200, 700 and 1210 G) and orientation [111]||H.
Fig.3 demonstrates experimental date with 5.3% and 10% concentration of 6Li for different magnetic field.
140

P R O C E E D I N G S
Fig.2. Kinetics of depolarization of 8Li beta-active nuclei in LiF crystals with 3.25 % content
of 6Li at different magnetic fields (H is parallel to the crystallographic axis [111]).
References
Fig.3. Kinetics of depolarization of 8Li beta-active nuclei in LiF crystals with 5.3 % content of 6Li at different magnetic fields (H it is parallel to the crystallographic axis
[111]).
[1] [1] Abov Yu.G.,, Bulgakov M.I., Borovlev S.P., Gulko A.D., Garochkin V.M., Dzheparov F.S., Stepanov S.V., Trostin S.S., Shestopal V.E.: ZhETF 99, 962 (1991)
[2] Gulko A.D., Ermakov O.N., Stepanov S.V., Trostin S.S.: Inzhenernaya Fizika 2, 94 (2007)
[3] Dzheparov F.S., Lvov D.V., Nechaev K.N., Shestopal V.E.: Pis’ma ZhETF 62, 639 (1995)
[4] Dzheparov F.S., Lvov D.V., Shestopal V.E.: ZhETF 114(12), 2166 (1998)
[5] Dzheparov F.S.: Pis’ma ZhETF 82, 521, (2005)
[6] Dzheparov F.S.: Radiospectroskopiya 13, 135 (1980)
[7] Dzheparov F.S., Smelov V.S., Shestopal V.E.: Pis’ma ZhETF 32, 51 (1980)
[8] Dzheparov F.S.: ZhETF 99, 982 (1991)
[9] F.S.Dzheparov, A.D.Gulko, O.N.Ermakov.: Appl. Magn. Reson. 35, 411, 2009
141

P R O C E E D I N G S
Application of adaptive wavelet filtering methods for noise suppression in NMR signal detection
I.G. Mershiev, O.V. Ruban, G.S. Kupriyanova, S.V. Molchanov
Immanuel Kant’s State University of Russia, 23600 Nevskiy st., 14, Kaliningrad, Russia
e-mail: [email protected]
Introduction. Data processing methods are of increasing importance in modern practical applications
of nuclear magnetic and nuclear quadrupole resonances. This is due to such drawbacks of NQR method as low sensitivity, especially in low-frequency range, low signal-to-noise ratio in detectors (SNR < 1 for one scan). Besides, NQR devices usually operate in hostile environment with many other devices causing noises in NQR frequency band; there is no shielding outside the laboratory, as well.
Existing methods, such as accumulation method, spectral methods, using Fourier transform, are insufficient to eliminate coherent noises, and are inefficient for SNR < 1.
We use two-channel scheme and adaptive wavelet filtering algorithm, allowing to increase SNR and reliability of signal detection and its identification under powerful noise.
Two-channel adaptive filtering scheme. Since the noise is generally instable, and overlaps desired signal frequency, we apply
two-channel adaptive scheme (see Fig.1) for denoising, using signal from second coil as reference signal [2]. We perform wavelet decomposition of NQR signal, choosing wavelet basis adaptively, using entropy minimum criterion. Noise signal from second channel is decomposed in the same way, using first channel decomposition parameters to normalize wavelet frequency bands of both channels. This is one of the conditions permitting to use two-channel adaptive filtering system, as we assume that noise frequency band is unknown and cannot be set to solve parametric filters. Denoising is accomplished by applying Cadzow thresholding algorithm; threshold is chosen adaptively depending on noisy signal variance and wavelet coefficients amplitude of signal from second channel at corresponding decomposition level [1], [3]. Thus, non-stationary noise in the same with signal frequency range is suppressed.
Fig.1. Two-channel system of adaptive wavelet filtering
Wavelet filtering, wavelet packet method. Wavelet filtering is used as a main method of signal processing. However, here we have
a question of selection of a suitable basis for wavelet decomposition, as well as selection of
142

P R O C E E D I N G S
decomposition level. The problem of basis selection is usually solved in two basic ways – by constructing one’s own function, which should meet the challenges of a) belonging to wavelet function family and b) being useful for analysis of a given signal; or, in a second way, by selecting a suitable function from the list of available in one or another software package. In both cases, it is not completely clear how exactly one should define if the chosen function is good to filter the given signal. The second method (selection), though it seems to be more attractive, is very labour-intensive because of large number of existing bases and lack of possibility to objectively estimate their acceptability and efficiency. Keeping in mind that wavelet transform is independent from signal type, and spectrum approximation produced by it may not always be optimal for a given signal, we use more flexible transform – wavelet packet method [5]. This method can optionally change the structure of time-scale space subdividing, depending on given signal.
Wavelet transform of a signal is performed by running it through cascaded dyadic filters (Fig.2). Wavelet packet method is based on defining, which band is preferable to cascade, by using an introduced cost function. In this method, firstly a so-called full tree of wavelet coefficients is constructed, and then an optimal tree is found, meaning that some bands are not
Fig.2. Wavelet tree of an example signal. On the right the outputs of consecutive dyadic filters are shown (plotted wavelet coefficients in nodes (1,0), (2,0), and (3,0)).
143

P R O C E E D I N G S
cascaded, and some redundant branches of tree are trimmed (Fig.3). Thus, the second problem (choosing decomposition level) is also solved [4]. We attempt to optimize and automate the process of choosing the best basis, taking a few different functions (standard built-in MATLAB functions: Shannon entropy and logarithmic energy, as well as other additive functions) as an explicit criterion.
Fig.3. Full wavelet packet tree (on the left) and optimal tree (Shannon entropy as a cost
function.)
Fig.4. System output (FID, noisy and denoised signals. Daubechies wavelets of 5 order were
used, 7 decomposition levels.
144

P R O C E E D I N G S
Conclusion. In this paper, a new method of nonlinear wavelet filtering is introduced, based on two-
channel adaptive scheme and allowing to increase SNR and signal detection reliability.
References:
[1] D. L. Donoho. Denoising by soft-thresholding. – IEEE Trans. Inform. Theory, vol. 41, no. 3, pp. 613--627, May 1995.
[2] G.V. Mozzhukhin, G. S, Kupriyanova, A. V. Bodnya, S. V. Molchanov, D. A. Lukyanov. Detection of impulse NQR signal under intense noise (in Russian). – Vestnik RSU, 3, 2007.
[3] Xiao-Ping Zhang and M. Desai. Nonlinear adaptive noise suppression based on wavelet transform. – in Proc. ICASSP98, vol. 3, pp. 1589-1592, Seattle, May 12-15, 1998
[4] R. Sturani, R. Terenzi. Adaptive multiresolution for wavelet analysis. http://arxiv.org/abs/0711.0349v1
[5] V. I. Vorobiev, V. G. Gribunin. Theory and practice of wavelet transform (in Russian). – VUS, 1999.
145

P R O C E E D I N G S
Spin relaxation processes of conduction electrons in silicon with different isotopic composition
A.A. Ezhevskii1), A.V. Soukhorukov1), D.V. Guseinov1), A.V. Gusev2)
1) N.I. Lobachevsky State University of Nizhni Novgorod, 603950, Prospekt Gagarina 23,
Nizhniy Novgorod, Russia
2) Institute of Chemistry of High Pure Substances RAS 603950, Tropinina 49, Nizhny Novgorod, Russia
e-mail: [email protected]
Spin relaxation processes of conduction electrons are less sensitive to inhomogeneous broadening mechanisms in comparison with electrons localized on deep and shallow donor centers. Therefore the most effective mechanism of spin relaxation of conduction electrons in silicon may be caused by scattering of the electrons on the phonons and impurities (Elliot-Yafet mechanisms [1, 2]). However at low impurity concentration and high concentration of nuclei spins of 29Si isotope the relaxaton due to hyperfine interaction may be observed. In [3], the significant contribution of the hyperfine interaction to the relaxation times in the A3B5
semiconductors of the order of 30 ns was estimated.
In this work we experimentaly determined the contribution of the hyperfine interaction to the CESR linewidth in silicon. To do this, we tried to minmize the contributions of other relaxation mechanisms, using silicon samples with different concentration and chemical nature of impurity: from 8х1016 cm-3 to 1019 cm-3; different chemical nature of impurity and contribution of spin-orbit interaction respectively: Li, N, P, As, Sb.
0 40 80 120 160 200 240 2800,0
0,5
1,0
1,5
2,0
100 120 140 160 180 200 220
5 28Si:P 1,5x1018cm-3 Si:P 3,3x1018cm-3 Si:P 9,1x1018cm-3 28Si:P 1,1x1019cm-3 Si:N Si:Li 3,7x10¹⁸
28Si:Li ~1018
28Si:Li ~1016
29Si:Li 29Si:P
ΔH, G
auss
T, K
Si:As 8,4x10¹⁸ΔH, G
auss
T, K
Fig.1. Temperature dependence of conduction electrons linewidth.
Such a wide range of concentrations and impurities makes it possible to understand what mechanisms of relaxation are important, find the temperature and concentration interval where one can measure the contribution of hyperfine interaction with maximum accuracy. The obtained dependences (Fig.1) shows, that at low temperatures, spin relaxation is determined by the scattering of electrons on impurity. At temperatures T>90K the electron-
146

P R O C E E D I N G S
phonon interaction attends. At high concentrations of donor and electrons in conduction band the electron-electron interaction can be taken into account. In the temperature range T>240K intervalley electron-phonon interaction is observed and the short wavelength phonons participates in scattering.
The impurity contribution to the spin-orbit interaction is change with increasing of the atomic number of impurity. Thus, the smallest contribution of the spin-orbit interaction to the CESR line width makes the impurity with lowest spin-orbit interaction constant. Indeed for the samples doped with lithium and nitrogen, the most narrow CESR lines were obtained for middle and high concentrations. It indicates that the spin-orbit contribution to these impurities is really negligible.
However, lithium actively interacts with oxygen and forms Li:O complex [4] and there is no possibility to trace the relaxation at low concentrations of donors.
In silicon, due to dominant scattering of electrons by the deformation potential, in the temperature range studied, to describe the temperature dependencies (Fig. 1) one should use the expression was given by Yafet [5]:
ps E τ
λτ 1/12
⎟⎠⎞
⎜⎝⎛Δ
=
2/5
22
2
2/3*22/1 ⎟
⎠⎞
⎜⎝⎛=
kTmu
Bs ρπ
τ (1)
where B ∼ Caδg, C-deformation potential, a - of the order of the lattice constant,
or: (2) ms T∝τ/1
λ - the spin-orbit coupling parameter (∼100 см-1), ΔE – distance between the bands (4 eV), n
p T~1 τ - n determined by the acting scattering mechanism. For the degenerated electron gas in the expression (1) substituted by . The dependencies presented in Fig. 1 don’t exactly follow to the expression (1). A possible reason is the complicated temperature dependence of the g-factor which is not counted in the theory of Elliott-Yafet.
Tkb FE
The dependencies of g-factor on temperature, concentration and chemical nature of impurities, were studied and are shown in Fig. 2. For silicon samples doped with phosphorus the increasing of the donor’s concentration leads to increasing of the contribution of the spin-orbit interaction. It also leads to a shift of dependencies to lower g-factors as seen from the figure.
A sharp change of g-factors in temperature dependencies for T∼90K shows a change in the localization of electrons with increasing temperature. Thus, at sufficiently low temperature, electrons can be localized on the impurity states or moving over the states of the impurity band.
Rejection of the g-factor increases linearly with increasing temperature for all samples. Currently there is no explanation of g-factor on temperature dependences in the literature. It’s incorrectly to explain the behavior of the g-factor and spin-orbit contribution to the scattering by impurities, as the temperature increases it should decrease.
According to [6] the behavior of the linewidth and the g-factor of conduction electrons must be strongly correlated since:
147

P R O C E E D I N G S
pps g
EH
ττλτ 1)(1/1 2
2
Δ∝⎟⎠⎞
⎜⎝⎛Δ
∝∝Δ (3)
Temperature dependence of the g-factor of a conduction electron in a semiconductor should follow the well-known of the kp-representation [6] behavior:
( )⎟⎟⎠⎞
⎜⎜⎝
⎛
Δ+
Δ−=
gg
pgεεε
312 (4)
As can be seen in Fig.2 dependence of g-factor is a more complicated way. In (4) εg is the only parameter depending on the temperature. Estimates show that changes in the band gap may provide a sufficient impact on the value of g-factor.
0 40 80 120 160 200 240 280
1,9968
1,9972
1,9976
1,9980
1,9984
1,9988
1,9992
1,9996 28Si:P 1,5x1018cm-3 Si:P 3,3x1018cm-3 Si:As 8,4x10¹⁸
Si:P 9,1x1018cm-3 28Si:P 1,1x1019cm-3 Si:N Si:Li 3,7x10¹⁸
28Si:Li ~1018
28Si:Li ~1016
29Si:Li 29Si:P
g
T, K
Fig.2. Temperature dependences of conduction electrons g-factors.
The experimental data show that in the observed range of impurities concentrations isotopic effects is negligible against the background of stronger mechanisms of scattering by impurities and electrons, when the concentration of electrons and impurities is comparable to the concentration of isotopic impurities. To determine the contribution of the hyperfine interaction one should be explore in low concentrations to eliminate the impurity spin-orbit contribution.
High-resistivity n-type FZ-silicon samples with different content of the 29Si isotope were studied. All the samples had low concentrations of phosphorus, which was present in the samples as residual impurities (4-6x1013 cm-3). For 28Si isotope enriched silicon the linewidth is ΔHhf=0,29 Gauss, for silicon with natural isotopic composition ΔHhf = 0,34 Gauss, 29Si isotope enriched silicon ΔHhf=0,371 Gauss. The difference in line width is connected with hyperfine interaction. To determine the value of hyperfine interaction the dependence of the contribution of the hyperfine interaction on the content of the isotope 29Si, nuclear spin, was built on Pershin-Privman model [3] (Fig. 3).
The model should work for the case of low concentrations of magnetic nuclei and to be a cubic root. With high content of magnetic nuclei the curve should go to the saturation does not depend on the concentration, due to change in the mechanism of interaction, when the
148
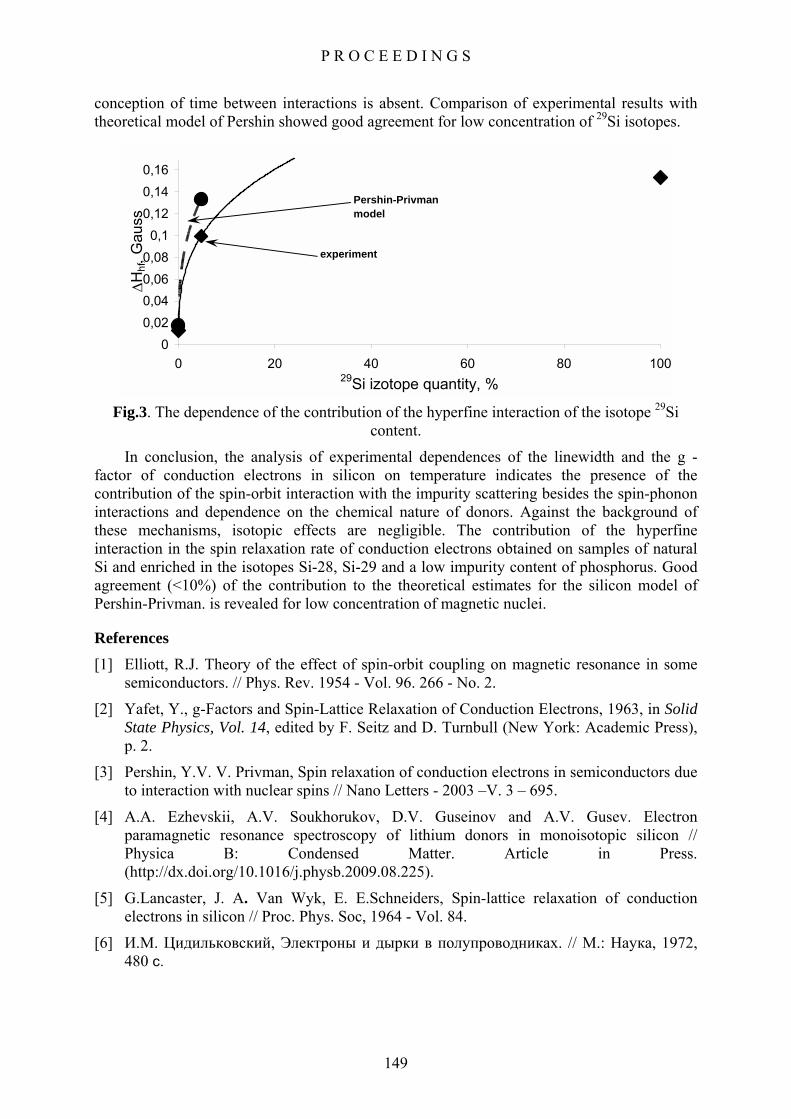
P R O C E E D I N G S
conception of time between interactions is absent. Comparison of experimental results with theoretical model of Pershin showed good agreement for low concentration of 29Si isotopes.
00,020,040,060,080,1
0,120,140,16
0 20 40 60 8029Si izotope quantity, %
ΔHhf, G
auss
100
experiment
Pershin-Privman model
Fig.3. The dependence of the contribution of the hyperfine interaction of the isotope 29Si
content.
In conclusion, the analysis of experimental dependences of the linewidth and the g - factor of conduction electrons in silicon on temperature indicates the presence of the contribution of the spin-orbit interaction with the impurity scattering besides the spin-phonon interactions and dependence on the chemical nature of donors. Against the background of these mechanisms, isotopic effects are negligible. The contribution of the hyperfine interaction in the spin relaxation rate of conduction electrons obtained on samples of natural Si and enriched in the isotopes Si-28, Si-29 and a low impurity content of phosphorus. Good agreement (<10%) of the contribution to the theoretical estimates for the silicon model of Pershin-Privman. is revealed for low concentration of magnetic nuclei.
References [1] Elliott, R.J. Theory of the effect of spin-orbit coupling on magnetic resonance in some
semiconductors. // Phys. Rev. 1954 - Vol. 96. 266 - No. 2.
[2] Yafet, Y., g-Factors and Spin-Lattice Relaxation of Conduction Electrons, 1963, in Solid State Physics, Vol. 14, edited by F. Seitz and D. Turnbull (New York: Academic Press), p. 2.
[3] Pershin, Y.V. V. Privman, Spin relaxation of conduction electrons in semiconductors due to interaction with nuclear spins // Nano Letters - 2003 –V. 3 – 695.
[4] A.A. Ezhevskii, A.V. Soukhorukov, D.V. Guseinov and A.V. Gusev. Electron paramagnetic resonance spectroscopy of lithium donors in monoisotopic silicon // Physica B: Condensed Matter. Article in Press. (http://dx.doi.org/10.1016/j.physb.2009.08.225).
[5] G.Lancaster, J. A. Van Wyk, E. E.Schneiders, Spin-lattice relaxation of conduction electrons in silicon // Proc. Phys. Soc, 1964 - Vol. 84.
[6] И.М. Цидильковский, Электроны и дырки в полупроводниках. // М.: Наука, 1972, 480 с.
149

P R O C E E D I N G S
Multiple quantum NMR of interacting equivalent spins
A.V. Fedorova, E.B. Fel’dman Institute of Problems of Chemical Physics of Russian Academy of Sciences, 142432, N. N. Semenov av. 1, Chernogolovka, Moscow Region, Russia
e-mail: [email protected]
Abstract A theory of multiple quantum (MQ) NMR dynamics is developed for systems of
interacting equivalent spins (s=1/2). The theory can be applied for the interpretation of both MQ NMR spectra of bullvalene molecules dissolved in nematic liquid crystal solution and MQ NMR of nanopores in an external magnetic field. Numerical realization of the developed approach allows us to investigate MQ NMR dynamics in systems consisting of several hundred spins. The dependence of the MQ NMR coherence intensities on their orders (the profile of MQ coherence) is investigated in many-spin systems. It is shown that the profile is exponential in such systems. We discuss the information which can be extracted from MQ NMR spectra of systems of interacting equivalent spins.
Introduction
Multiple quantum (MQ) NMR dynamics is the basis of MQ NMR spectroscopy [1] which, in turn, is a powerful tool to study nuclear spin distributions in different systems. Theoretical description of MQ NMR dynamics is a very difficult task because this problem is a many-spin and multiple-quantum one. A consistent quantum-mechanical theory has not been developed up to now except for one-dimensional systems [2]-[4]. The theory [2]-[4] leads to the conclusion that, starting with a thermodynamic equilibrium state, only zero and double quantum coherences are produced in the case of the nearest neighbour double-quantum Hamiltonian. Next-nearest couplings and other distant interactions lead to higher order coherences in MQ NMR spectra. However, the effect of these interactions is beyond the theory [2]-[4]. Numerical supercomputer calculations allow us to study MQ NMR dynamics
of a spin chain consisting of no more than fifteen spins [5] which is insufficient to investigate the dependence of the MQ coherence intensities on their orders (the profile of MQ coherences [6]). In our recent article [7] we have worked out the approach to MQ NMR dynamics of systems of interacting spins when the dipole-dipole interactions (DDI) can be characterized by only one coupling constant. The developed approach [7] allows us to investigate MQ NMR dynamics in systems consisting of several hundred spins.
Fig.1. A molecule of bullvalene.
In the present paper we discuss physical realizations of the model [7] and describe numerical calculations of intensities of MQ NMR coherences in systems with 200-600 spins.
150

P R O C E E D I N G S
The systems of interacting equivalent spins As examples of an application of the model [7] we consider two many-spin systems. The
first system is bullvalene molecules, C10H10, (Fig.1) dissolved in nematic liquid crystal solution where 12 independent H-H dipolar couplings between the 10 protons in the static molecule are averaged to a single value because of rapid changes of molecular configurations.
The second example is a nanopore compound in a strong external magnetic field; the nanopores are filled with a gas of spin-carrying molecules (atoms) [8] (Fig.2).
The DDI of spin carrying molecules (atoms) of a gas in the non-spherical nanopores in a strong external magnetic field are not averaged completely due to molecular diffusion [8, 9]. Then the residual averaged DDI are determined by only one coupling constant which is the same for all pairs of interacting spins [8, 9]. MQ NMR dynamics in nanopores is our main priority because it allows us to investigate the profile of intensities of MQ NMR coherences in an exactly solvable model.
Fig.2. Spin-carrying molecules (atoms) in a nanopore in an external magnetic
field.
MQ NMR dynamics in systems of interacting equivalent spins The standard MQ NMR experiment consists of four distinct periods of time: preparation
(τ), evolution (t1), mixing (τ), and detection (t2). MQ coherences are created by a multiple sequence consisting of eight-pulse cycles on the preparation period [1]. In the rotating reference frame [10], the averaged non-secular two-spin/two-quantum Hamiltonian, , describing MQ dynamics of equivalent spins on the preparation period can be written as
MQH
∑<
−+−−++ +−=+−=kj
kjkjMQ IIDIIIIDH ,)()(4
)(2
22 (1)
where D is the averaged dipolar coupling constant, and are the raising and lowering
operators of spin j, and N is the number of spins. Since the square of the total
spin angular momentum
+jI −
jI
∑=
±+ =N
jjj II
12I commutes with projections of I on an arbitrary direction, we
have from Eq. (1) that
[ ] 0ˆ, 2 =IH MQ (2)
The theory [7] uses the basis consisting of the common eigenstates of and its projection Iz
on the direction of the external magnetic field. Since there are no transitions changing in the MQ NMR experiments the problem splits into a set of simpler problems for different values of and it is possible to avoid the problem of the exponential growth of the Hilbert space dimension with an increase of the number of spins. Such problem is inevitable in the
2I2I
2I
151

P R O C E E D I N G S
basis of eigenstates of Iz (the multiplicative basis) [5]. We denote as Jk,S(τ) ( ,NkN ≤≤−
⎥⎦⎤
⎢⎣⎡−−=
22,1, NNIIS ) the contribution to the intensity of MQ NMR coherence of the k-th
order to the observable intensity Jk(τ). Then observable intensities of MQ NMR coherences Jk(τ) ( ) can be expressed as NkN ≤≤−
∑=S
SkNk JSnJ )()()( , ττ , (3)
where nN(S) is the multiplicity of the intensities Jk,S which is [11]
!
2!1
2
)12(!)(⎟⎠⎞
⎜⎝⎛ −⎟
⎠⎞
⎜⎝⎛ ++
+=
SNSNSNSnN ,
20 NS ≤≤ . (4)
The method of the calculation of the intensities Jk,S(τ) is presented in Ref. 7.
Numerical calculations of MQ NMR dynamics of a system of equivalent spins. The intensities of MQ NMR coherences are oscillating functions even at very long times.
As an example of such behaviour one can see the dependencies of intensities J0, J2, J20, and J22 of MQ coherences on the dimensionless time τDt = which are shown in Fig.3 for a system consisting of spins in a nanopore [7]. The minimal frequency of these oscillations is of the order D and the minimal positive eigenvalue of the Hamiltonian
obtained from numerical calculations is
201=N
MQH D23(min) =λ . The detailed analysis of the
Fig.3. Oscillating dependencies of the intensities of MQ NMR coherences on the dimensionless time t in a system of 201=N spins in a nanopore; a) and ; b)
and . 0J 2J 20J
22J
152
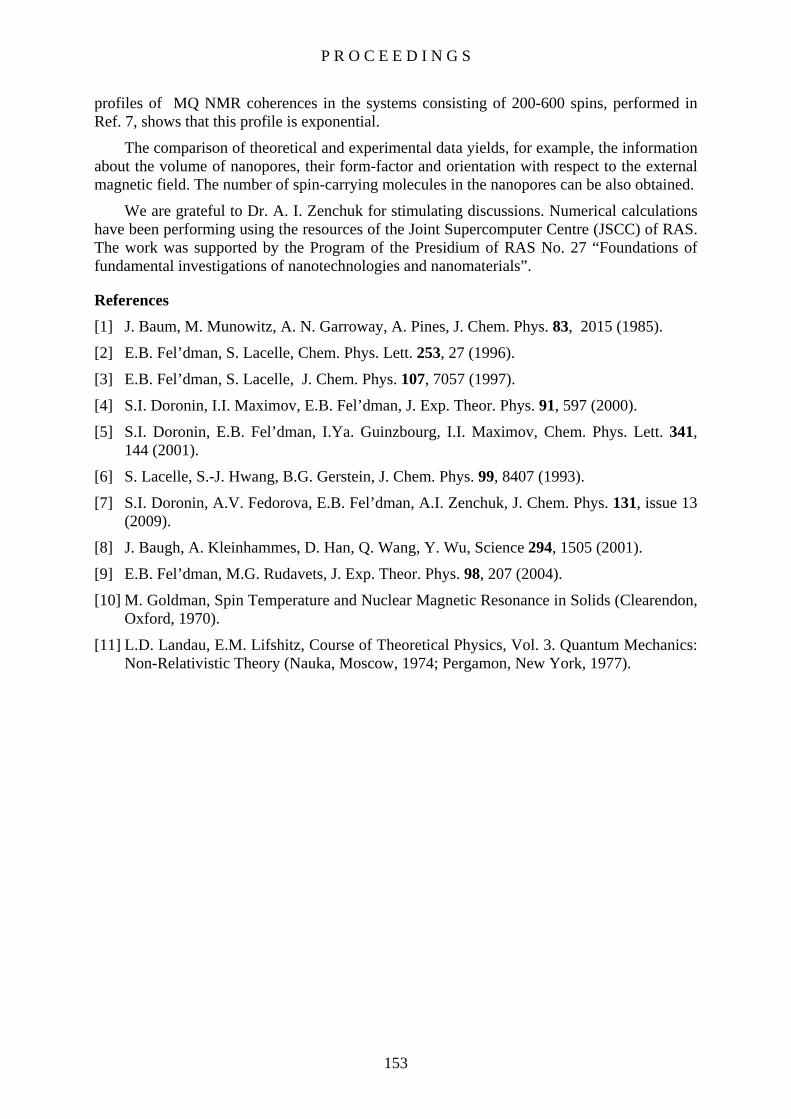
P R O C E E D I N G S
profiles of MQ NMR coherences in the systems consisting of 200-600 spins, performed in Ref. 7, shows that this profile is exponential.
The comparison of theoretical and experimental data yields, for example, the information about the volume of nanopores, their form-factor and orientation with respect to the external magnetic field. The number of spin-carrying molecules in the nanopores can be also obtained.
We are grateful to Dr. A. I. Zenchuk for stimulating discussions. Numerical calculations have been performing using the resources of the Joint Supercomputer Centre (JSCC) of RAS. The work was supported by the Program of the Presidium of RAS No. 27 “Foundations of fundamental investigations of nanotechnologies and nanomaterials”.
References [1] J. Baum, M. Munowitz, A. N. Garroway, A. Pines, J. Chem. Phys. 83, 2015 (1985).
[2] E.B. Fel’dman, S. Lacelle, Chem. Phys. Lett. 253, 27 (1996).
[3] E.B. Fel’dman, S. Lacelle, J. Chem. Phys. 107, 7057 (1997).
[4] S.I. Doronin, I.I. Maximov, E.B. Fel’dman, J. Exp. Theor. Phys. 91, 597 (2000).
[5] S.I. Doronin, E.B. Fel’dman, I.Ya. Guinzbourg, I.I. Maximov, Chem. Phys. Lett. 341, 144 (2001).
[6] S. Lacelle, S.-J. Hwang, B.G. Gerstein, J. Chem. Phys. 99, 8407 (1993).
[7] S.I. Doronin, A.V. Fedorova, E.B. Fel’dman, A.I. Zenchuk, J. Chem. Phys. 131, issue 13 (2009).
[8] J. Baugh, A. Kleinhammes, D. Han, Q. Wang, Y. Wu, Science 294, 1505 (2001).
[9] E.B. Fel’dman, M.G. Rudavets, J. Exp. Theor. Phys. 98, 207 (2004).
[10] M. Goldman, Spin Temperature and Nuclear Magnetic Resonance in Solids (Clearendon, Oxford, 1970).
[11] L.D. Landau, E.M. Lifshitz, Course of Theoretical Physics, Vol. 3. Quantum Mechanics: Non-Relativistic Theory (Nauka, Moscow, 1974; Pergamon, New York, 1977).
153
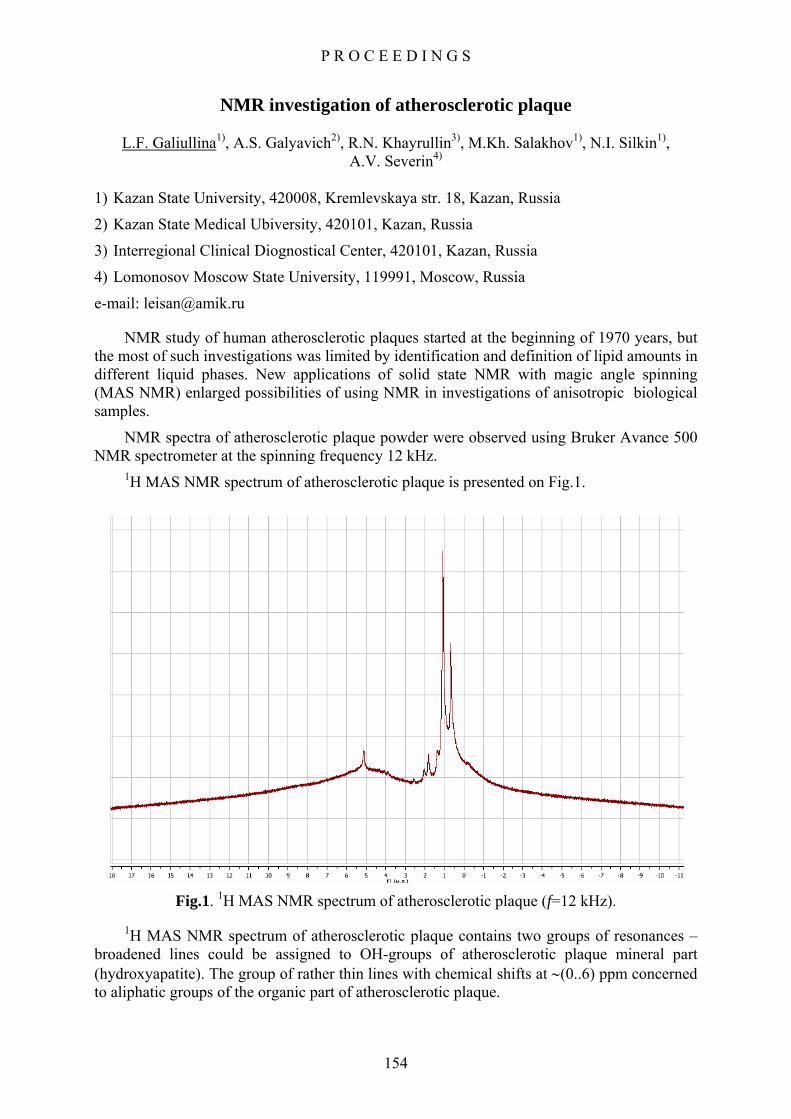
P R O C E E D I N G S
NMR investigation of atherosclerotic plaque
L.F. Galiullina1), A.S. Galyavich2), R.N. Khayrullin3), M.Kh. Salakhov1), N.I. Silkin1), A.V. Severin4)
1) Kazan State University, 420008, Kremlevskaya str. 18, Kazan, Russia
2) Kazan State Medical Ubiversity, 420101, Kazan, Russia
3) Interregional Clinical Diognostical Center, 420101, Kazan, Russia
4) Lomonosov Moscow State University, 119991, Moscow, Russia
e-mail: [email protected]
NMR study of human atherosclerotic plaques started at the beginning of 1970 years, but the most of such investigations was limited by identification and definition of lipid amounts in different liquid phases. New applications of solid state NMR with magic angle spinning (MAS NMR) enlarged possibilities of using NMR in investigations of anisotropic biological samples.
NMR spectra of atherosclerotic plaque powder were observed using Bruker Avance 500 NMR spectrometer at the spinning frequency 12 kHz.
1H MAS NMR spectrum of atherosclerotic plaque is presented on Fig.1.
Fig.1. 1H MAS NMR spectrum of atherosclerotic plaque (f=12 kHz).
1H MAS NMR spectrum of atherosclerotic plaque contains two groups of resonances – broadened lines could be assigned to OH-groups of atherosclerotic plaque mineral part (hydroxyapatite). The group of rather thin lines with chemical shifts at ∼(0..6) ppm concerned to aliphatic groups of the organic part of atherosclerotic plaque.
154
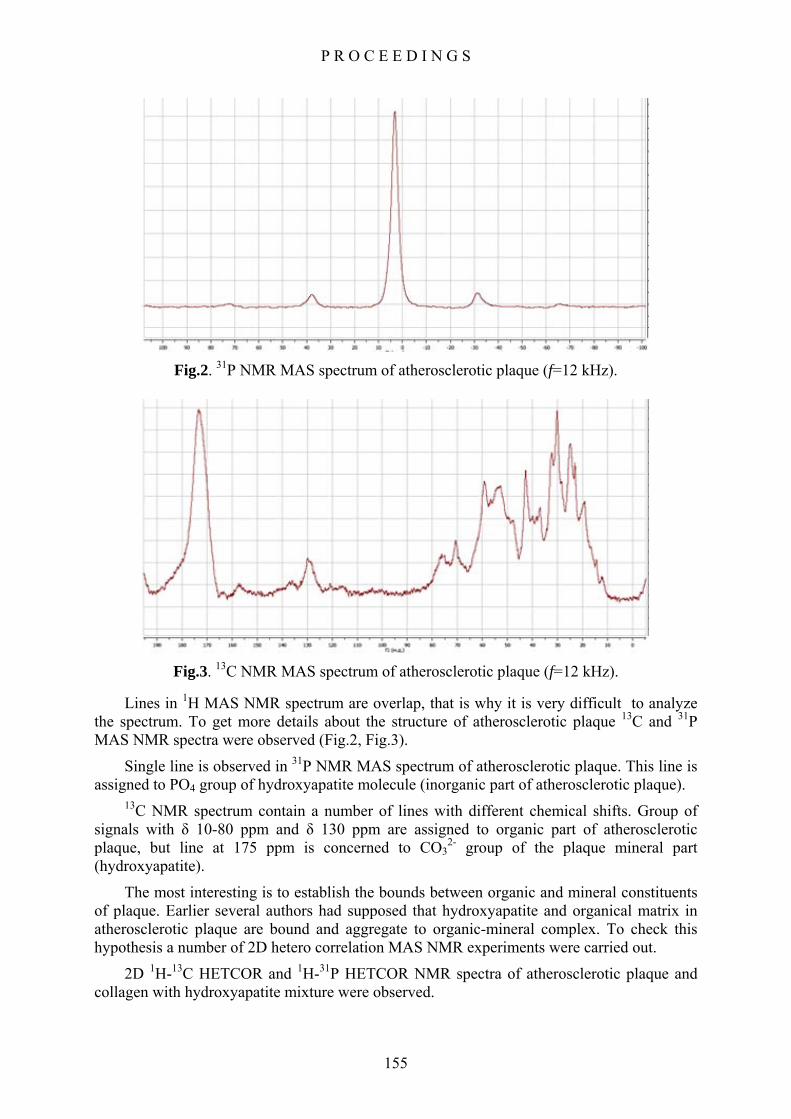
P R O C E E D I N G S
Fig.2. 31Р NMR MAS spectrum of atherosclerotic plaque (f=12 kHz).
Fig.3. 13С NMR MAS spectrum of atherosclerotic plaque (f=12 kHz).
Lines in 1H MAS NMR spectrum are overlap, that is why it is very difficult to analyze the spectrum. To get more details about the structure of atherosclerotic plaque 13C and 31P MAS NMR spectra were observed (Fig.2, Fig.3).
Single line is observed in 31Р NMR MAS spectrum of atherosclerotic plaque. This line is assigned to PO4 group of hydroxyapatite molecule (inorganic part of atherosclerotic plaque).
13C NMR spectrum contain a number of lines with different chemical shifts. Group of signals with δ 10-80 ppm and δ 130 ppm are assigned to organic part of atherosclerotic plaque, but line at 175 ppm is concerned to CO3
2- group of the plaque mineral part (hydroxyapatite).
The most interesting is to establish the bounds between organic and mineral constituents of plaque. Earlier several authors had supposed that hydroxyapatite and organical matrix in atherosclerotic plaque are bound and aggregate to organic-mineral complex. To check this hypothesis a number of 2D hetero correlation MAS NMR experiments were carried out.
2D 1Н-13С HETCOR and 1Н-31Р HETCOR NMR spectra of atherosclerotic plaque and collagen with hydroxyapatite mixture were observed.
155

P R O C E E D I N G S
2D 1H-31P HETCOR spectrum of hydroxyapatite is presented at Fig.4.
NMR spectrum of hydroxyapatite at Fig.4 contains single cross peak between 1H of OH-group signal at 3.4 ppm and 31P signal of hydroxyapatite PO4 group at 5.8 ppm.
Fig. 4. 2D 1H-31P HETCOR spectrum of hydroxyapatite (left), 2D 1H-31P HETCOR NMR
spectrum of atherosclerotic plaque (right).
2D 1H-31P HETCOR NMR spectrum of atherosclerotic plaque (Fig.5) also includes single cross peak. Chemical shift of proton signal changes significantly and is equal to 6.5 ppm. Such large changing of 1H chemical shift probably explained by strong interactions with OH-group.
Fig.5. 2D HSQC NMR spectrum of 4% collagen solution.
156

P R O C E E D I N G S
Earlier several authors set up a hypothesis that hydroxyapatite and collagen molecules in bone matrix are connected by hydrogen bonds with water molecules contained in bone [1]. Spectral characteristics of bone and atherosclerotic plaque are very similar. That is why can be assumed that bonding is carried out by the same mechanism. In fact such strong low field shift of the signals in the most cases is the evidence of hydrogen bonding. Cazalbou et al. set up the hypothesis that hydroxyapatite and organic matrix bind by water layer able to connect organic and mineral parts of plaque by hydrogen binds [2].
In addition 2D 1H-13C HSQC NMR spectra of the same compounds solutions were also observed (Fig.5, Fig.6).
It can be seen that spectra contain almost the same cross peaks excluding signals with c.s. 1Н (2,2 ppm)/13С (30,8 ppm), 1Н (1,8 ppm)/13С (26,4 ppm) и 1Н (1,8 ppm)/13С (26,6 ppm) and 1Н (1,8 ppm)/13С (26,6 ppm) which exist in the spectrum of collagen + Gap solution but not in the spectrum of pure collagen. It shows that after addition of Gap new bonds are formed. Possibly the same mechanism works in process of organic-mineral complex forming in atherosclerotic plaques.
Fig.6. 2D HSQC NMR spectrum of 2% collagen + GAp solution.
In conclusion using NMR experiments it was showed that collagen and hydroxyapatite form organic-mineral complexes in atherosclerotic plaques.
Acknowledgements This work is partly supported by the Grant RFBI 09-02-97017 and the Ministry of
Education of the Russian Foundation (project DZN-09-14)
References [1] Kaflak A., Kolodziejski W.. Magn.Reson.Chem. 2008, 46, p. 335–341
[2] 2. Cazalbou S.,Combes C., Eichert D., Rey C., Glimcher. M.J. J. Bone Miner. 2004, 22, p. 310.
157

P R O C E E D I N G S
EPR study of structural features of the copper(II) complexes with histamine and dipeptides
M.S. Bukharov, E.M. Gilyazetdinov, V.G. Shtyrlin, G.V. Mamin, Yu.I. Zyavkina,
M.M. Malyukina, R.R. Garipov
Kazan State University, 420008, Kremlevskaya 18, Kazan, Russia
e-mail: [email protected]
Introduction
The copper is an essential biometal presented in many proteins and metal enzymes. Investigations on formation of copper(II) complexes with bioligands are very important for modeling of copper enzymes and understanding of biological transfer of copper [1, 2]. Coordination geometry of the copper(II) complexes is dictated by tetragonal distortion of polyhedron and the nature and size of the ligands that explains the wide variety of observed coordination compounds for this metal ion. Structural features of many of these complexes in solution remain unresolved so far. To shed light on this question we compared behavior of homoligand copper(II) complexes with histamine on one hand and heteroligand copper(II) complexes with dipeptides and histamine on the other hand.
Complication of this task comprises wide multiplicity of species formed in the homo- and heteroligand copper(II) systems at different pH values and also existence of several isomers for most of the species. In this work a CW EPR method was applied to explore some copper(II) complexes with histamine and dipeptides formed at pH range 7-8.
Materials and methods
Copper nitrate, histamine dihydrochloride (Hm⋅2HCl) from Loba Chemie, glycylglycine (GlyGlyH), DL-seryl-DL-serine (SerSerH) from Reanal were used to prepare solutions. The pH was adjusted by adding HNO3, KOH, and Tris-buffer (0.01 M, from Sigma) with an accuracy of 0.01 pH unit. The salt background 1 M was created by addition of potassium nitrate recrystallized from water solution.
Measurements of the pH values and pH-metric titrations were carried out with a Basic Titrino 794 automatic titrator from Metrohm equipped with a thermostatted cell. The pH values also were defined with a Thermo Orion 420A+ pH meter. Protonation constants of the ligands, compositions, formation constants, and percentages of the complexes were determined by mathematical modeling of the pH metric data with the CPESSP program [3].
X-band EPR spectra were recorded on a Bruker ESP 300 spectrometer with 50 kHz field modulation. Magnetic field was checked by an ER 035M magnetometer and microwave frequencies were measured with a Hewlett-Packard 5335A counter. Simulations of the EPR spectra were performed with the modified computer program [4] that allows to determine the spin Hamiltonian parameters (go, Ao, Ao(N)), rotation correlation time (τR), and percentages of the complexes (P).
Results and discussion
Complex Cu(Hm)22+
According to the pH metric titration data the Cu(Hm)22+ complex dominates in the
copper(II) – histamine system at pH 8 (>95%). It was proposed early [5] that in this case four nitrogen atoms are equatorially coordinated to the copper(II) ion forming square-plane cis-
158

P R O C E E D I N G S
structure (4N model). However possibility of the cis- and trans-isomers coexistence was not considered so far. To elucidate coordination details of this complex the EPR spectra were obtained in the temperature range 288-350 K and simulated taking into account two isomers.
Parameters of the model calculated for all temperatures are presented in Table 1. Fig. 1a illustrates an example of the experimental and simulated spectra.
Table 1. EPR parameters of the Cu(Hm)22+ complex at different temperatures
go±0.0005 Ao, G P, % T, K τR·1011,
s trans isomer
cis isomer
trans isomer
cis isomer
trans isomer
cis isomer
lnK
288 7.1± 0.2 2.1140 2.1080 75.0± 0.2 79.8± 0.2 55± 2 45± 2 -0.20 294 5.9± 0.2 2.1140 2.1080 74.7± 0.2 79.5± 0.2 56±2 44± 2 -0.24 300 5.1± 0.1 2.1142 2.1080 74.4± 0.2 79.2± 0.2 56± 2 44± 2 -0.24 310 4.0± 0.2 2.1145 2.1080 74.0± 0.4 78.5± 0.4 57± 3 43± 3 -0.28 320 3.1± 0.2 2.1147 2.1080 73.5± 0.4 77.5± 0.4 57± 4 43± 4 -0.28 330 2.5± 0.2 2.1150 2.1080 73.2± 0.4 76.7± 0.4 58± 4 42± 4 -0.32 340 2.1± 0.1 2.1150 2.1080 72.4± 0.3 76.0± 0.3 58± 3 42± 3 -0.32 350 1.7± 0.1 2.1153 2.1080 71.5± 0.4 75.8± 0.4 59± 4 41± 4 -0.36
Ao(N) are 11.6, 11.6, 11.9, and 11.9 G for both isomers.
As can be seen from Table 1 the trans-isomer dominates at all temperatures and accumulation degree (P) of the cis-isomer reduces with increasing temperature. Therefore the cis-isomer has stronger enthalpy stabilization (RTlnK = -ΔG = -ΔH + T ΔS, ΔH = -1.91±0.17 kJ/mol, ΔS = -8.3±0.5 J/(K·mol)). In our opinion the enthalpy stabilization is resulted from trans-influence that more destabilizes trans-isomers. Indeed the amino group, as known, is stronger trans-agent then the imidazole nitrogen and arrangement of two strong groups in opposite each other is less favorable concerning the enthalpy.
3000 3100 3200 3300 3400 3500 3600
-2
-1
0
1
experimental simulated (sum)
(1) Cu(SerSerH-1)
(2) 4N Cu(Hm)(SerSerH-1)
(3) 3N Cu(Hm)(SerSerH-1)
(4) Cu(Hm)22+
H, G
dI/d
H
1
2
34
29-2
-1
0
1
00 0 200 3500300 3100 3 3300 3400
experimental simulated (sum)
(1) cis-form (2) trans-form
H, G
dI/d
H
1
2
Fig. 1. Experimental and simulated EPR spectra in the systems: a - 63Cu(II)-histamine (1:3, pH 8, 288 K);b - Cu(II)-histamine-DL-seryl-DL-serine (1:1:1, pH 7, 295 K) .
(a) (b)
Values of isotropic parameters g0 and A0 are typical for the chromophore CuN4 [6], for example, for Cu(NH3)4(H2O)2
2+ the values g0 = 2.108±0.006 and A0 = 79±5 G were found [6]. Reduction of number of equatorial coordinated nitrogen atoms and an additional axial coordination of nitrogen atom result in a significant increase of g0 and a parallel decrease of A0 value [7, 8] that is not observed in our case (Table 1). Thus the assumption [8] on existence
159
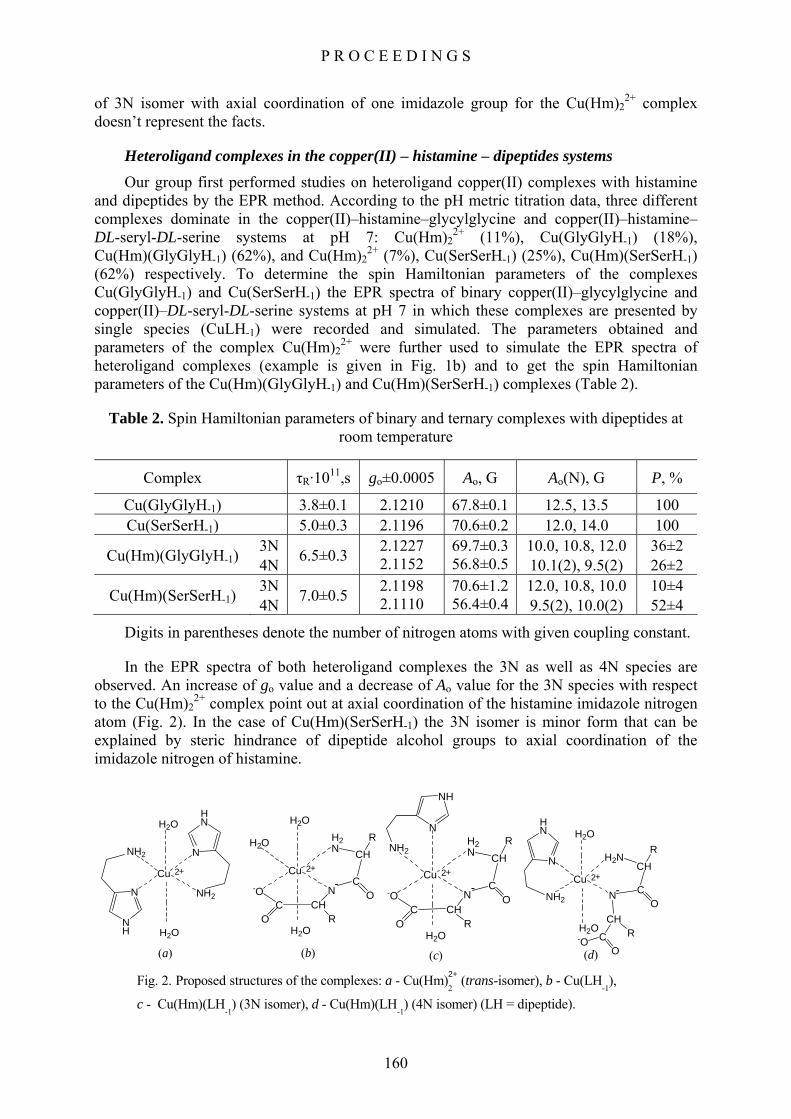
P R O C E E D I N G S
of 3N isomer with axial coordination of one imidazole group for the Cu(Hm)22+ complex
doesn’t represent the facts.
Heteroligand complexes in the copper(II) – histamine – dipeptides systems Our group first performed studies on heteroligand copper(II) complexes with histamine
and dipeptides by the EPR method. According to the pH metric titration data, three different complexes dominate in the copper(II)–histamine–glycylglycine and copper(II)–histamine–DL-seryl-DL-serine systems at pH 7: Cu(Hm)2
2+ (11%), Cu(GlyGlyH-1) (18%), Cu(Hm)(GlyGlyH-1) (62%), and Cu(Hm)2
2+ (7%), Cu(SerSerH-1) (25%), Cu(Hm)(SerSerH-1) (62%) respectively. To determine the spin Hamiltonian parameters of the complexes Cu(GlyGlyH-1) and Cu(SerSerH-1) the EPR spectra of binary copper(II)–glycylglycine and copper(II)–DL-seryl-DL-serine systems at pH 7 in which these complexes are presented by single species (CuLH-1) were recorded and simulated. The parameters obtained and parameters of the complex Cu(Hm)2
2+ were further used to simulate the EPR spectra of heteroligand complexes (example is given in Fig. 1b) and to get the spin Hamiltonian parameters of the Cu(Hm)(GlyGlyH-1) and Cu(Hm)(SerSerH-1) complexes (Table 2).
Table 2. Spin Hamiltonian parameters of binary and ternary complexes with dipeptides at room temperature
Complex τR·1011,s go±0.0005 Ao, G Ao(N), G P, %
Cu(GlyGlyH-1) 3.8±0.1 2.1210 67.8±0.1 12.5, 13.5 100 Cu(SerSerH-1) 5.0±0.3 2.1196 70.6±0.2 12.0, 14.0 100
Cu(Hm)(GlyGlyH-1) 3N 4N 6.5±0.3 2.1227
2.1152 69.7±0.3 56.8±0.5
10.0, 10.8, 12.0 10.1(2), 9.5(2)
36±2 26±2
Cu(Hm)(SerSerH-1) 3N 4N 7.0±0.5 2.1198
2.1110 70.6±1.2 56.4±0.4
12.0, 10.8, 10.0 9.5(2), 10.0(2)
10±4 52±4
Digits in parentheses denote the number of nitrogen atoms with given coupling constant.
In the EPR spectra of both heteroligand complexes the 3N as well as 4N species are observed. An increase of go value and a decrease of Ao value for the 3N species with respect to the Сu(Hm)2
2+ complex point out at axial coordination of the histamine imidazole nitrogen atom (Fig. 2). In the case of Cu(Hm)(SerSerH-1) the 3N isomer is minor form that can be explained by steric hindrance of dipeptide alcohol groups to axial coordination of the imidazole nitrogen of histamine.
Cu
H2O
NH2
+2
-O
N
H2NCH
CO
CH
CO
HN
N
-
R
R
H2O
Cu
NH2
H2O
-O
+2
N
H2N CH
CO
CHCO
NH
N
-
R
R
Cu
H2O
H2O
-O
+2
N
H2N CH
C
H2O
OCHC
O
-
R
R
(a) (d)(c)(b)
Cu
NH2
H2O
H2O
NH2
HN
N
NH
N
+2
Fig. 2. Proposed structures of the complexes: a - Cu(Hm)2+
2 (trans-isomer), b - Cu(LH
-1),
c - Cu(Hm)(LH-1) (3N isomer), d - Cu(Hm)(LH
-1) (4N isomer) (LH = dipeptide).
160

P R O C E E D I N G S
Significantly lowered Ao values for the 4N heteroligand complexes with respect to Сu(Hm)2
2+ consistent with a rhombic distortion in the first case [7]. This effect is resulted from strong trans-influence of the dipeptide ligand [9] at which the imidazole nitrogen atom of histamine as the weakest donor is disposed in trans-position to the strongest donor, the deprotonated peptide nitrogen atom (Fig. 2). In this case π-acceptor system of imidazole ring is involved in effective d-π interaction with transfer of electron density from the donor (deprotonated peptide nitrogen atom) to the acceptor through the π-system with participation of the central atom [10,11].
Conclusion On the basis of the EPR spectra simulation and analysis of spin Hamiltonian parameters
it was first established that in the Cu(Hm)22+ complex formed in copper(II)-histamine system
four nitrogen atoms are equatorial coordinated with trans- and cis-arrangement. Furthermore temperature dependences of the spectral parameters testify that the trans-isomer dominates but the cis-structure is more advantageous concerning an enthalpy.
Investigations of the heteroligand complexes in the copper(II)-histamine-dipeptide systems are evidenced that the axial coordination of imidazole fragment and the trans-influence of deprotonated peptide nitrogen atom change significantly the spin Hamiltonian parameters that can become diagnostic criterion at the modeling of biological systems with copper enzymes.
References [1] Metall Ions in Biological Systems. V.12. Properties of Copper / Ed. H. Sigel. New York
and Basel: Marcel Dekker, 1981. 400 p.
[2] Sarkar B. Chem. Rev. 1999. V. 99, N 9. P. 2535.
[3] Salnikov Yu.I., Glebov A.N., Devyatov F.V. Polynuclear Complexes in Solutions. Kazan: KSU. 1989. 288 p.
[4] Garipov R. R., Shtyrlin V. G., Safin D.A., Zyavkina Yu. I., Sokolov F. D., Konkin A. L., Aganov A. V., Zakharov A. V. Chem. Phys. 2006. V. 320, N 2-3. P. 59.
[5] Goodman B., McPhail D., Powell K. J. Chem. Soc., Dalton. Trans. 1981. N 3. P. 822 .
[6] Marov I.N., Kostromina N.A. EPR and NMR in the Chemistry of Coordination Compounds. M.: Nauka, 1979. 266 p.
[7] Rockenbauer A. J. Magn. Reson. 1979. V. 35, N 3. P. 429.
[8] Szabó-Plánka T., Rockenbauer A., Korecz L., Nagy D. Polyhedron. 2000. V. 19, N 5. P. 1123.
[9] Shtyrlin V.G., Gogolashvili E.L., Zakharov A.V. J. Chem. Soc., Dalton Trans. 1989. N 7. P. 1293.
[10] Sigel H. Angew. Chem. Int. Ed. Engl. 1975. V. 14, N 6. P. 394.
[11] Sigel H. In: IUPAC Coord. Chemistry – 20. Invit. Lect. 20th Int. Conf. Coord. Chem., Calcutta, 10-14 Dec. 1979 / Ed. D. Banerjea. Oxford, New-York: Pergamon Press, 1980. P. 27.
161

P R O C E E D I N G S
The diastereomeric differences in N-(2-hydroxyethyl)cytisine derivatives
A.N. Lobov, L.V. Spirikhin. Institute of Organic Chemistry, USC RAS, 450054, prosp. Oktyabrya, 71, Ufa, Russia.
e-mail: [email protected]
NMR spectroscopy is a powerful tool for structural features determination of natural compounds. Recently, various methods for the assignment of the relative [1] and absolute [2] configuration of chiral organic compounds based on NMR were developed. Structural modification of quinolizidine alkaloids allows obtain compounds of pharmacological interest. Cytisine and its derivatives are attractive for researchers owing to their broad spectrum of physiological activity [3, 4].
In this report a simple way for the elucidation of configuration stereogenic methine center in N-(2-hydroxyethyl)cytisine (1-4) derivatives based on observation in the 1H and 13C NMR spectra is discussed. The chemical shift’s trend observed in the signal of exo-, endo- hydrogen bearing to C11 and C13 led us to propose a new empirical and easy to use method for assigning the asymmetric center configuration of these compounds.
The chemical reduction of corresponding ketones by metal hydrides leads to the formation of two possible diastereomeric secondary alcohols (1, 3) separated by HPLC. Also acetate derivatives (2, 4) of amino alcohols were obtained by acylation with acetic anhydride. The absolute configuration of compounds under investigation was determined by X-ray analysis of one enantiomer from each of diastereomeric pairs.
We observed that in every case for the (15R)-diastereomer the C13 carbon signal exhibits persistent downfield shift relative to the C11 carbon signal, whereas δC11 > δC13 - for the (15S)-diastereomer. In all the compounds studied the difference between chemical shifts Δδea (δeq-δax) of the hydrogens bear on C11 and C13 is systematically observed in various solvents (Table 1). The difference Δδea for H11 methylene proton is smaller then that of H13 methylene proton in the (15R)-diastereomer. When the configuration of asymmetric centre is the opposite, chemical shift distributions of H11 and H13 are reversed. This substantial and regular chemical shift difference can distinguish (15R) and (15S) products (Fig.1).
Δδea <
Δδea >
N NO
OR
R1H
2
3
7
9
13
11
δС13 >
δС11 <
(15R)-diastereomer
Δδea >
N NO
OR
HR1
2
3
7
9
13
11
Δδea <δС11 >
δС13 <
(15S)-diastereomer
R: adamantyl (1, 2); phenyl (3, 4)
R1: H (1, 3); COCH3 (2, 4)
Fig.1.
162

P R O C E E D I N G S
Table 1. 1H and 13C NMR Chemical Shifts in Compounds 1-4 (in ppm)
Compound δ11ex
o δ11endo δ13exo δ13endo
Δδea (H11)
Δδea (H13) δC11 δC13
(S)-1 (CDCl3) 2.59 2.89 2.18 3.06 0.30 0.88 62.21 58.61 (R)-1 (CDCl3) 2.24 3.10 2.63 2.84 0.86 0.21 58.55 63.01 (S)-1 (C6D6) 1.96 2.29 1.61 2.68 0.33 1.07 61.99 58.87 (R)-1 (C6D6) 1.65 2.54 2.03 2.40 0.89 0.37 58.47 63.03
(S)-1 ((CD3)2CO) 2.59 2.99 2.27 3.02 0.40 0.75 62.71 60.06 (R)-1 ((CD3)2CO) 2.29 3.12 2.63 2.87 0.83 0.24 59.50 63.42
(S)-2 (CDCl3) 2.39 2.89 2.15 3.07 0.50 0.92 61.84 59.19 (R)-2 (CDCl3) 2.13 3.13 2.41 2.88 1.00 0.47 59.06 62.02 (S)-2 (C6D6) 1.86 2.52 1.68 2.83 0.66 1.15 61.67 59.74 (R)-2 (C6D6) 1.63 2.83 1.92 2.59 1.20 0.67 59.07 62.18
(S)-2 ((CD3)2CO) 2.39 3.01 2.25 3.02 0.62 0.77 62.15 60.91 (R)-2 ((CD3)2CO) 2.13 3.13 2.42 2.89 1.00 0.47 59.88 63.00
(S)-3 (CDCl3) 2.63 2.88 2.41 3.15 0.25 0.74 61.71 59.11 (R)-3 (CDCl3) 2.43 3.14 2.62 2.86 0.71 0.24 59.10 62.32 (S)-3 (C6D6) 1.83 2.18 1.68 2.57 0.35 0.89 61.30 58.37 (R)-3 (C6D6) 1.65 2.40 1.89 2.35 0.75 0.46 58.92 62.20
(S)-3 ((CD3)2CO) 2.58 3.03 2.47 3.03 0.45 0.56 62.11 60.79 (R)-3 ((CD3)2CO) 2.44 3.02 2.59 2.98 0.58 0.39 60.58 62.66
(S)-4 (CDCl3) 2.53 2.91 2.38 3.01 0.38 0.63 61.26 59.93 (R)-4 (CDCl3) 2.39 2.89 2.51 2.97 0.50 0.46 60.10 61.17 (S)-4 (C6D6) 1.84 2.36 1.77 2.67 0.52 0.90 61.12 60.01 (R)-4 (C6D6) 1.72 2.57 1.90 2.56 0.85 0.66 59.65 61.41
(S)-4 ((CD3)2CO) 2.58 3.00 2.48 3.02 0.42 0.54 61.61 60.97 (R)-4 ((CD3)2CO) 2.28 3.02 2.54 2.99 0.74 0.45 60.44 62.25
References
[1] Bifulco, G. et al. Chem. Rev. 2007, 107, 3744−3779.
[2] Seco, J.M. et al. Chem. Rev. 2004, 104, 17−117.
[3] Boido, C.C. et al. Farmaco. 2003, 58, 265-277.
[4] Shishkin, D. V. et al. Chem. Nat. Compd. 2007, 43, 190-196.
163

P R O C E E D I N G S
NMR assignments of the short peptides of the fragments of human and rat b-amyloid
A.N. Istrate1), A.B. Mantsyzov1), S.A. Kozin2), V.I. Polshakov1)
1) Center for Magnetic Tomography and Spectroscopy, M.V. Lomonosov Moscow State
University, 119991, Moscow, Russia
2) Engelhardt Institute of Molecular Biology, Russian Academy of Sciences, 119991, Vavilova st., Moscow, Russia.
e-mail: [email protected]
Abstract The key reason that leads to the development of the pathological disorders during
Alzheimer’s disease is the formation of the amyloid plaques in the cerebral tissue of the human brain. It consists of the hyper aggregated β amyloid peptide (Aβ) and dead neuron cells on its periphery. It was reported that zinc ions play the crucial role in the process of the Aβ precipitation. On the contrary to the human one, rats Aβ peptide does not exhibit pathological aggregation.
Comparison of the structures of the zinc binding fragment of both human and rat Aβ polypeptides in free states and their complexes with zinc ions, would bring an important insight to the understanding of the mechanism of the formation of the amyloid plaques. We report here the NMR assignment of the number of human and rat peptides, that corresponds the first 16 amino acids from the N-terminal tail of the full length Aβ. This fragment is proposed to be the main zinc binding site of Aβ. The data obtained is important for the solution of the NMR structure.
Introduction
Alzheimer's disease is a severe form of the neuropathological disorder that leads to the complete loss of memory and subsequent death within few years from the first detection of the disease symptoms. The risk group of the disease is the elderly people in the age over 65 [1]. The main histopatologycal symptom of the Alzheimer's disease is the formation of beta-amyloid plaques in the brain tissues. The reasons and the molecular mechanism of plaque formation and evolution of the disorder are not well understood. The prevalent theory of the evolution of the disease is so-called “amyloid hypothesis”. It postulates that the main reason of the formation of the plaques is the hyperaggregation of the beta amyloid. Normally, beta amyloid is a non pathological peptide (39 amino acids) with functions, which are not investigated in details. Beta amyloid is formed during processing of the transmembrane glycoprotein Amyloid Precursor Protein (APP) which is abundantly expressed in the nervous system [2]. The mutations in the gene of APP lead to the failure of protein processing and subsequent formation of the longer (42 amino acids) pathological form of the beta amyloid which is able to form pathological aggregates. It was also reported, that imbalance in metabolism of the transition metal ions such as copper, zinc and iron is also contribute to the formation of the pathological amyloid plaques [3]. The Zn2+ binding sites in the Aβ were thoroughly investigated and the sequence involved in this process has been mapped to the
164

P R O C E E D I N G S
region 6-28 of Aβ. The histidine residues 13 and 14 are assumed to play the most important role in the Zn complex formation [4]. It was also found that Aβ in rats has large degree of sequence similarity to the human one. However, rats do not suffer from Alzheimer's disease and rat amyloid peptide does not undergo aggregation [5].
The understanding of the structure of the zinc binding fragment of the Aβ in both human and rat forms and in both free state and in complex with zinc ion would bring an important contribution to the investigation of the mechanism of the formation of the amyloid plaques. The present paper focuses on the investigation of four amyloid peptides or its fragments: human Aβ 1-16 (first 16 amino acids from the N-terminal tail of the full length human Aβ), fragment 6-14 of human Aβ, rat Aβ 1-16 and rat Aβ 1-16 in soluble complex with zinc ions. In order to obtain information on the structure of these peptides in solution, NMR assignment of the backbone and side chain nuclei 1H, 15N and 13C have been carried out.
Methods and experiments
The samples for the NMR spectroscopy contained 5 mM of the peptide, 20mM Tris D11 and 0.1% NaN3, pH 6.5. It was prepared in either 90% H2O/10%D2O or in 100% D2O.
All spectra were acquired at 50С on Bruker AVANCE 600 MHz spectrometer equipped with triple resonance z-gradient probe and using the TopSpin software. Spectra were processed with NMRPipe program package [7] and analyzed with SPARKY (from Goddard and Kneller). Sequential assignments for the backbone 1H, 15N and 13C atoms were obtained using following 2D spectra: [1H,15N]-HSQC, DQF-COSY and NOESY in H2O and [1H,13C]-HSQC, DQF-COSY and NOESY in D2O. Heteronuclear correlation HSQC experiments were acquired with the natural abundance of the 15N and 13C isotopes. Assignments for side chains were obtained using 2D TOCSY spectra acquired in both H2O and D2O.
Results
Backbone and side chain chemical shift assignment were made for peptides in all four investigated systems: human Aβ 1-16, fragment 6-14 of human Aβ, rat Aβ 1-16 and rat Aβ 1-16 in soluble complex with zinc ions (Table 1). The representative fragments of the [1H,15N]-HSQC and [1H,13C]-HSQC spectra are presented in Fig.1.
Table 1. Results for chemical shift assignment.
Peptide 1Hbackbone, % 1Htotal, % 15Nbackbone, % 13Ctotal, % Human(6-14) 90 85 89 89 Human(1-16) 100 91 100
Rat(1-16) 100 89 81 Rat(1-16)/Zn2+ 100 83 94
165

P R O C E E D I N G S
166
A B
C D
Fig.1. The representative HSQC spectra of the investigated peptides: (A) Human Aβ(1-16) [15N,1H]-HSQC, (B) Human Aβ (6-14) [15N,1H]-HSQC, (C) [15N,1H]-HSQC for human
Aβ (6-14) and (D) [13C,1H]-HSQC Rat Aβ (1-16) in complex with zinc.

P R O C E E D I N G S
Conclusions
Almost complete chemical shift assignments of the amyloid peptides Aβ and their fragments in both human and rat forms have been obtained. Subsequent analysis of the NOESY spectra and collection of the distance and dihedral angle restraints necessary for the solution structure determination is in progress. Three dimensional structure calculations will be carried out using the simulated annealing protocol with utilization of the coulomb interactions and explicit simulation of the solvent environment, using the software packages ICMD [8] and GROMACS [9].
References [1] Berchtold N.C, Cotman C.W. (1998) Evolution in the conceptualization of dementia and
Alzheimer's disease: Greco-Roman period to the 1960s, Neurobiol Aging.19 (3), 173–89.
[2] Lalowski M., Golabek A., Lemere C. A., Selkoe D. J., Wisniewski H. M., Beavis R. C., Frangione B., Wisniewski T. (1996) The “Nonamyloidogenic” p3 Fragment (Amyloid β17-42) Is a Major Constituent of Down's Syndrome Cerebellar Preamyloid, J Biol Chem 271, 33623-33631.
[3] Bush A. I., Pettingell W. H., Jr. de Paradis M., Tanzi R. E., Wasco W. (1994) The amyloid beta-protein precursor and its mammalian homologues. Evidence for a zinc-modulated heparin-binding superfamily, J Biol Chem 269, 26618-26621.
[4] Liu S. T., Howlett G., Barrow C. J. (1999) Histidine-13 is a crucial residue in the zinc ion induced aggregation of the Aß peptide of Alzhemeir's disease, Biochemistry 38, 9373-9378.
[5] Jin Huang, Yong Yao, Jun Lin, Yong-Hao Ye Wei-Yin Sun, Wen-Xia Tang (2004) The solution structure of rat Aβ-(1–28) and its interaction with zinc ion: insights into the scarcity of amyloid deposition in aged rat brain, J Biol Inorg Chem 9, 627–635.
[6] Zirah S., Kozin S. A., Mazur A., Blond A., Cheminant M., Ségalas-Milazzo I., Debey P., Rebuffat S. (2006) Structural Changes of Region 1–16 of the Alzheimer Disease Amyloid-Peptide upon Zinc Binding and in Vitro Aging, J Biol Chem 281: 2151-2161.
[7] Delaglio F., Grzesiek S., Vuister G. W., Zhu G., Pfeifer J., Bax A. (1995) NMRPipe: a multidimensional spectral processing system based on UNIX pipes, J Biomol NMR 6, 277-93.
[8] Bardiaux B., Malliavin T. E., Nilges M., Mazur A. K. (2006) Comparison of different torsion angle approaches for NMR structure determination , J Biomol NMR 34, 153–166.
[9] Van Der Spoel D., Lindahl E., Hess B., Groenhof G., Mark A.E., Berendsen H.J. (2005) GROMACS: fast, flexible, and free, J Comput Chem 26 (16), 1701–18.
167

P R O C E E D I N G S
Investigation of nitric oxide contents in rats heart tissue by EPR spectroscopy
V.S. Iyudin1), F.G. Sitdikov2), V.V. Andrianov1), R.I. Gilmutdinova2), F.K. Karimov2),
L.N. Muranova1), V.M. Chiglintcev2), S.V. Yurtaeva1), G.G. Jafarova1), Kh.L. Gainutdinov1)
1) Kazan Physical-Technical Institute of Russian Academy of Sciences, 420029, Sibirsky tract, 10/7, Kazan, Russia
2) Tatar State Gumaniter Pedagogical University, 420015, Pushkin, 31, Kazan, Russia
e-mail: [email protected]
The nitric oxide is one of the most important mediators that take part in operation of different systems in organism. The NO has a very important role in functioning of the cardiovascular system for the vertebrates. Our objective is to study the NO-paramagnetic complexes in the different ages rats heart tissues under the pharmacological sympathectomy.
For the experiments we have used the inbreed white rats of different ages: 14, 21, 70 and 100 – days. For sympatric system neuron destruction we have used the solution of guanetidine sulfate. We have explored the content of NO in such tissue. The EPR spectra of the prepared samples have been obtained on the Bruker EPR spectrometer ER-200E-SRC under the temperature of the liquid nitrogen (77 К°). The measurements have been made on the heart tissue samples of 21 intact rats and 25 sympathectomized rats. In all the measured EPR spectra we have observed three types of iron paramagnetic complexes with NO: complex based on spin trap (DETC)2-Fe2+-NO and two iron complexes consisting of gem (Hb) with
NO: R- и Т-conformers of Hb-NO. The analysis of the heart tissue EPR
spectra for 14 and 21 day rats have shown that for the rats of this age the pharmacological sympathectomy leads to the significant decrease of the production of NO that is a part of all three mentioned paramagnetic complexes (pic 1). The strongest decrease affect is observed for the heart tissue of the 14 day old rats (approximately 10 times). For the older rats (70 and 100 days old) we have observed the different trend: formation of NO in the heart tissue is less exposed to the sympathectomy: the level of the NO-
paramagnetic complexes have risen slightly or remained nearly the same.
0
200
400
600
800
1000
1200 Pic.1. Content of (DETC)2-Fe-NO
Control Pharmacological
sympathectomy
14-days 21-days 70-days
This way we can see that the sympathectomy affects greatly on the NO production in the early ages. It’s well known that in this period (14 – 21 day) the sympatic system is primarily involved in the rat’s heart regulation, after the 6 weeks age the role of the adrenergic system in heart regulation decreases that leads to the reduction of the sympathectomy influence on the NO production for the rats of this age. Specific changes in the NO level of this ages rats heart tissue including the sympathectomy that leads to the destruction of the most part of the sympatric neurons is an evidence that the significant amount of NO in the early ages is produced or stimulated by the sympatric neurons.
The research is accomplished with the support of RFBR (grant nr 09-04-97020-r_Povolje_i).
168

P R O C E E D I N G S
Supramolecular Photochemistry in β–Cyclodextrin Hosts: A TREPR, NMR, and CIDNP Investigation
O.A. Krumkacheva1), V.R. Gorelik1), E.G. Bagryanskaya1), N. Lebedeva2),
M.D.E. Forbes2)
1) International Tomography Center,Institutskaya 3a, Novosibirsk 630090, Russia
2) Caudill Laboratories, Department of Chemistry, CB #3290 University of North Carolina, Chapel Hill, NC 27599-3290
e-mail: [email protected]
Introduction In this paper we report a combined NMR, TREPR and
TR-CIDNP study of the radical chemistry created by laser flash photolysis of deoxybenzoin (DOB) encapsulated in randomly methylated β-CDs (Chart 1) in aqueous solution at room temperature. Our goal is to understand the differences in reaction pathways that encapsulation may effect. For comparison, a free solution study of this chemistry was also carried out. Scheme 1 outlines the photochemistry and possible reaction routes for the DOB triplet state in free solution and in the interior of CDs. This is the first report of CD photochemistry and radical chemistry where both RP1 and RP2 the products formed and the radical intermediates produced are detected in real time and accounted for with a detailed mechanism.
Experimental
Materials. To prepare the complex DOB (8 mM) was added to an aqueous solution of β-CD (2 mM). The solution was mixed by ultrasound stirrer for 30 minutes and then by magnetic stirring for 6 hours. The mixed solution was filtered. The concentration of DOB in the complex was measured by UV and NMR spectroscopy and found to be 1 mM.
Results and Discussion.
NMR Analysis of Ground State DOB/CD Complexes. The chemical shifts of the protons in both CD and DOB are changed after complexation due to the modification of the local environment of the protons. The change in the chemical shift of the first and second aromatic rings upon complexation is evidence of interaction between the CD cavity and both aromatic rings.
DOBhv
DOBS*
DOBT
T
α-cleavage
H abstraction
+
T
+
S-T conversion
S
DOB
escape into bulk
"RP1"
"RP2"
O H
H
HH
OH
O
O
H
H H
H
H
HO
H
O
O H
H
+O H
H
O H
H
DOB
+
*
Scheme 1
CIDNP of DOB in Free Solution. The observed net CIDNP, shown in Fig.1. The CH2 group for the benzyl radical has the largest HFI constant
169

P R O C E E D I N G S
Fig.1. a) NMR spectrum of 10mM DOB in CD3CN; b)
CIDNP spectrum obtained during photolysis of DOB in CD3CN, time delay between laser pulse and rf-pulse is 1 μs; I: PhA-CO-CH2
B-PhC, II: (PhCH2A), III: Ph-
CO-C6H5-CH2A, *: H2O, **:
CD2HCN.
(2AH(CH2) = –16.28 Gauss), therefore the most intense CIDNP signals are observed for this CH2 group (4.34 ppm) in the DOB starting material and also for the CH2 (2.91 ppm) peak in the dibenzyl (DB). The signs of the CIDNP signals are in good agreement with Kaptein’s rules [1].
CIDNP is also observed on the metha- and para- protons of phenyl groups (A<0) (7.23 ppm) of DOB and DB. An emissive CIDNP signal of the CH2 group in the rearrangement product was observed at 4.98 ppm. This product can be formed after recombination of benzoyl radical and benzyl radical in the meta-position (Scheme 1). This result is noteworthy as it suggests that after bond cleavage there is substantial mobility of at least one member of the radical pair.
The solubility of DOB in D2O is very low. Maximal DOB concentration in water is 0.5 mM. During the photolysis of DOB in D2O free solution we observed only one low CIDNP signal with emission polarization, which is referred to CH2 group in the DOB starting material.
Fig.2. a) NMR spectra of DOB in CD in D2O. b) CIDNP spectrum obtained after photolysis of DOB with CD in
aqueous solution, time delay between laser pulse and rf-pulse is 1 μs; I: Pha-CO-CH2
b-Phc, II: (PhCH2a)2, III: Ph-
CO-C6H5-CH2a, IV: β-CD
CIDNP DOB/CD Complexes in Water. The CIDNP signals of the products from laser flash photolysis of DOB/CD complexes are shown in Fig.2. These signals also have an emissive sign: polarization is observed for the CH2 (4.33 ppm) and phenyl (7.26 ppm and 7.3 ppm) group of DOB and for the CH2 (5.1 ppm) group of the intermediate product from the rearrangement reaction. Positive CIDNP is observed on the protons of CH2 group of DB. In addition, polarized signals were observed for the protons of CD (3.2 ppm). From this observation, we can conclude that the CD takes part in the photochemical H-atom abstraction reaction. Taking into account the values of chemical shifts for per-methylated β-CD [2], CIDNP signal was attributed to H2 CD proton. This indicates that CD radical can be formed when hydrogen is abstracted from H5 position inside the cavity of β-CD. The expected magnetic parameters for these radicals should be consistent with literature parameters for sugar radicals [3]. This radical has g = 2.0031 and three different coupling constants AH = 33.3 G, AH = 9.9 G and AH = 7.1 G. (Table 1). Experimentally determined from CDEP data value of g-factor is equal to 2.003.
The phase of the CIDNP polarization for the CD protons should be positive according to Kaptein’s rules for a geminate radical pair, while a negative sign of polarization for the CD protons was observed. Because the sign of the polarization doesn’t depend on the sign of the AHFI in the intermediate radicals, we can assume
170

P R O C E E D I N G S
that the polarization is formed via the S-T_ mechanism.
Table 1. HFI constants and g-factors of radicals.
Thus CIDNP data confirm strong difference in reaction mechanism in homogeneous solution and CD, revealing the presence of hydrogen abstraction of H2 proton from CD by excited DOB molecule and the formation of close distance radical pair which possess the high value of exchange interaction leading to formation of CIDNP due to S-T_ mechanism.
Time–Resolved EPR. When DOB is photoexcited in a solvent that is a good H-atom donor such as 2-propanol the multiplet polarization (E/A) due to radical pair mechanism (RPM) on the ketyl radical and on the radical from the solvent was observed (Fig.3a). Spectral simulation identifies the signal carriers as the 2–propanoyl radical (7 line spectrum with AH = 19.48 G) and the DOB ketyl radical (center). Clearly H-atom abstraction is the major pathway observed in free solution for DOB/2-propanol.
A poorly resolved TREPR signal about 22 G wide was observed during the photolysis (at 244 nm as well as 308 nm) of DOB in cyclodextrin (Fig.3b). The form of this signal did not depend on the delay time. The time dependence of CIDEP was described by mono-exponential curve with a characteristic time τ = 3.1 µs. The experimental spectrum was compared with several calculated TREPR spectra for the benzyl-benzoyl radical pair and the CD-ketyl radical pair (Fig.4). The experimental TREPR spectrum is well simulated by using spectra of ketyl and CD radicals with linewidth 5 G. It can be concluded that CIDEP was formed in the hydrogen atom abstraction reaction between the host molecule and DOB triplet state. We surmised that line broadening is defined by the large exchange interaction in RP consisting of ketyl and CD radicals. The net emissive polarization can be formed due to two mechanisms: the triplet mechanism (TM) and an S-T– mechanism.
171

P R O C E E D I N G S
When CIDEP signal is produced by the TM, the sign CIDEP depends on the triplet state population. The CIDEP spectra of triplet excited DOB molecule, experimentally observed on frozen aqueous solution of DOB in CD at 100 K. The parameters of zero field splitting and triplet levels populations obtained from simulation are: D=5050 MHz, E=1950 MHz, Pz=0.45, Py=0.1, Px=0.5, FWHM=8 mT (Z along C=O and X perpendicular to the molecular plane). Thus the expected CIDEP due to
triplet mechanism is liquid state should be emissive. Nevertheless to form polarization via the triplet mechanism, it is necessary to assume that electron spin relaxation time of 3DOB* is longer that its lifetime. The estimated electron spin relaxation time of triplet DOB molecule and is very short , where τc - is rotational correlation time of 3DOB* in CD. Taking into account τc~3 ns, obtained T1 has the order of a 12 ns. Thus, in order to observe TM CIDEP in ketyl radicals in this fashion, the rate constant for hydrogen abstraction should therefore be more than 108 s-1. Indeed, it is known from literature that the changes of the lifetime of excited triplet molecule of benzophenone (BP) in CD water solution (350 нс) [4] does not change much from the life time in cyclohexane (300 ns). The structure of DOB and BP are similar and we can assume that the rate constant of hydrogen abstraction from cyclodextrin does not exceed the same from CD molecule. The observed CIDEP formed during photolysis of DOB in cyclohexane correspond to RPM and without substantial contribution TM polarization. This fact is the evidence that electron spin relaxation time is shorter than the lifetime of triplet DOB molecule. Moreover the CIDNP experiments confirmed the existence of both contributions: H-atom abstraction and α-cleavage during photolysis of DOB with CD in aqueous solution. Consequently the rate constant for hydrogen
)1/( 220
21 ccDT τωτ +≈
Fig.4. Comparison of CIDEP spectra
experimental (black solid line with noise, same for two cases, 300 ns time delay) and simulated for different radical pairs (gray
solid line) and with FWHM=0.5 mT (black solid line): a) benzyl and benzoyl radicals,
b) ketl and the CD radicals;
a)
b) Fig.3. Time-resolved EPR spectra after
laser flash photlysis of a) DOB in isopropanol solution. The black solid line corresponds to the experimental data and
the gray line to a simulated spectrum of the 2-propanoyl radical (outer lines, see text for
parameters) and the DOB ketyl radical (center, unresolved).b) DOB with CD in aqueous solution using 300 ns sampling
gates.
172

P R O C E E D I N G S
abstraction is not higher than the rate constant of α-cleavage (k=4.2*106 s-1) and the estimated lifetime of the DOB triplet excited state in the CD is not shorter than 100 ns. And so we can conclude that the 10% of triplet polarization transfer to the RP.
It is also possible that CDEP as well as CIDNP is formed via the radical-pair mechanism due to S-T– transitions, due to RP lifetime increase in CD cavity and the influence of exchange interaction on singlet-triplet conversion in radical pair. Note that in the case of S-T_ mechanism of CIDEP as a rule the observed spectra are asymmetrical due to the fact that S-T_ flip-flop transitions are allowed only for a definite spin levels, thus only EPR lines correspondent to T_ levels with αi projection of nuclear spins are polarized. Contrary the observed CIDEP spectrum has symmetrical shape. The reason for such observation consists of fast nuclear relaxation of radical spin levels in the case of numerous nuclei.
Conclusions The photochemistry and ensuing radical chemistry of a deoxybenzoin (DOB) guest
encapsulated in β–cyclodextrin (CD) hosts has been investigated using time-resolved electron paramagnetic resonance (TREPR) spectroscopy, steady-state NMR spectroscopy, and time resolved chemically induced nuclear polarization (TR-CIDNP). The DOB triplet state is rapidly formed after photolysis, and this excited state has two major reactive pathways available: Norrish I α-cleavage, leading to benzoyl and benzyl radicals (RP1), and H-atom abstraction from the interior of the CD capsule, leading to DOB ketyl radicals and β-glucose-type radicals from the CD interior (RP2). TREPR experiments show evidence for the presence of ketyl radicals, and TR-CIDNP results support the abstraction mechanism. The CD radicals are not observed due to broad line widths, and the DOB ketyl radical is also substantially broadened.
Acknowledgement We acknowledge support of RFBR (grant 08-04-0555), RFBR-DFG (09-03-91335) and
Russian Federal Agency for Education (NK-24P/1)
References [1] Salikhov, K. M.; Molin, Y. N.; Sagdeev, R. Z.; Buchachenko, A. L., Spin Polarization
and Magnetic Effects in Radical Reactions. Elsevier: Amsterdam, 1984.
[2] Bardelang, D.; Clement, J. L.; Finet, J. P.; Karoui, H.; Tordo, P., NMR investigations of the beta-cyclodextrin inclusion of (alpha-phenyl-N-tert-butylnitrone) analogues. J Phys Chem B 2004, 108 (23), 8054-8061.
[3] Gilbert, B. C.; King, D. M.; Thomas, C. B., Radical Reactions of Carbohydrates .2. An Electron-Spin Resonance Study of the Oxidation of D-Glucose and Related-Compounds with the Hydroxyl Radical. J Chem Soc Perk T 2 1981, (8), 1186-1199.
[4] Monti, S.; Flamigni, L.; Martelli, A.; Bortolus, P., Photochemistry of Benzophenone-Cyclodextrin Inclusion Complexes. J Phys Chem-Us 1988, 92 (15), 4447-4451.
173
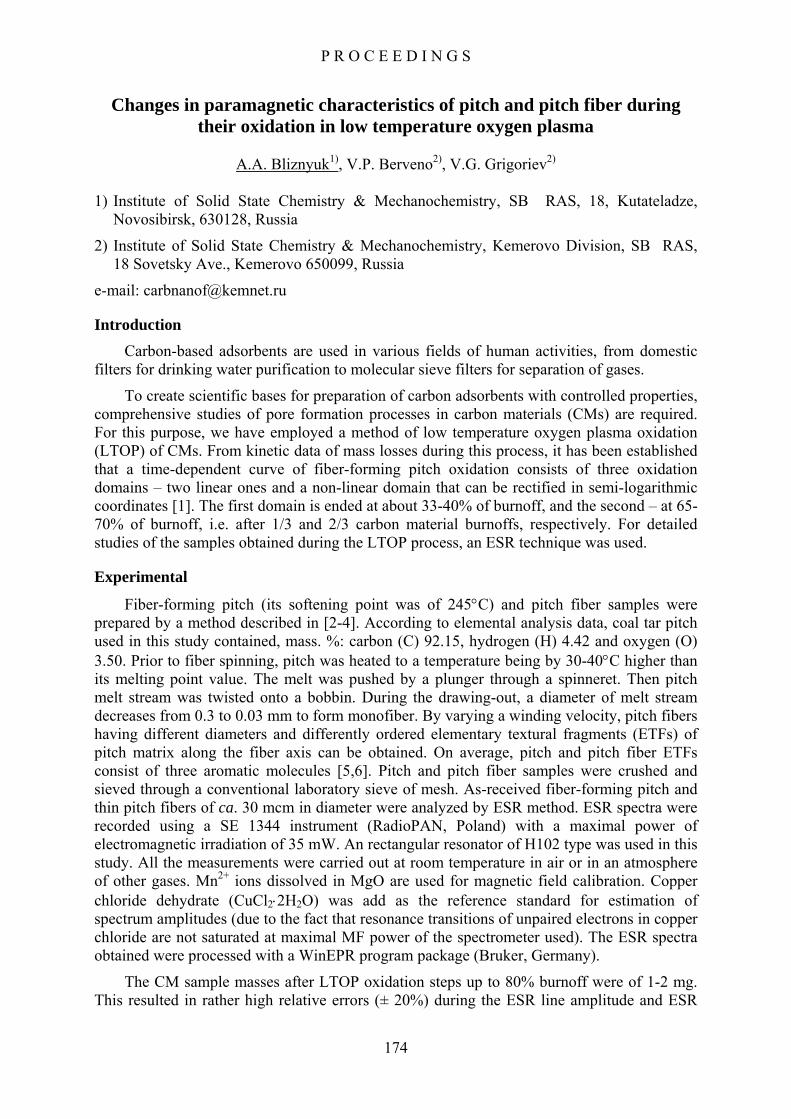
P R O C E E D I N G S
Changes in paramagnetic characteristics of pitch and pitch fiber during their oxidation in low temperature oxygen plasma
A.A. Bliznyuk1), V.P. Berveno2), V.G. Grigoriev2)
1) Institute of Solid State Chemistry & Mechanochemistry, SB RAS, 18, Kutateladze,
Novosibirsk, 630128, Russia
2) Institute of Solid State Chemistry & Mechanochemistry, Kemerovo Division, SB RAS, 18 Sovetsky Ave., Kemerovo 650099, Russia
e-mail: [email protected]
Introduction Carbon-based adsorbents are used in various fields of human activities, from domestic
filters for drinking water purification to molecular sieve filters for separation of gases.
To create scientific bases for preparation of carbon adsorbents with controlled properties, comprehensive studies of pore formation processes in carbon materials (CMs) are required. For this purpose, we have employed a method of low temperature oxygen plasma oxidation (LTOP) of CMs. From kinetic data of mass losses during this process, it has been established that a time-dependent curve of fiber-forming pitch oxidation consists of three oxidation domains – two linear ones and a non-linear domain that can be rectified in semi-logarithmic coordinates [1]. The first domain is ended at about 33-40% of burnoff, and the second – at 65-70% of burnoff, i.e. after 1/3 and 2/3 carbon material burnoffs, respectively. For detailed studies of the samples obtained during the LTOP process, an ESR technique was used.
Experimental
Fiber-forming pitch (its softening point was of 245°C) and pitch fiber samples were prepared by a method described in [2-4]. According to elemental analysis data, coal tar pitch used in this study contained, mass. %: carbon (C) 92.15, hydrogen (H) 4.42 and oxygen (O) 3.50. Prior to fiber spinning, pitch was heated to a temperature being by 30-40°C higher than its melting point value. The melt was pushed by a plunger through a spinneret. Then pitch melt stream was twisted onto a bobbin. During the drawing-out, a diameter of melt stream decreases from 0.3 to 0.03 mm to form monofiber. By varying a winding velocity, pitch fibers having different diameters and differently ordered elementary textural fragments (ETFs) of pitch matrix along the fiber axis can be obtained. On average, pitch and pitch fiber ETFs consist of three aromatic molecules [5,6]. Pitch and pitch fiber samples were crushed and sieved through a conventional laboratory sieve of mesh. As-received fiber-forming pitch and thin pitch fibers of ca. 30 mcm in diameter were analyzed by ESR method. ESR spectra were recorded using a SE 1344 instrument (RadioPAN, Poland) with a maximal power of electromagnetic irradiation of 35 mW. An rectangular resonator of H102 type was used in this study. All the measurements were carried out at room temperature in air or in an atmosphere of other gases. Mn2+ ions dissolved in MgO are used for magnetic field calibration. Copper chloride dehydrate (CuCl2⋅2H2O) was add as the reference standard for estimation of spectrum amplitudes (due to the fact that resonance transitions of unpaired electrons in copper chloride are not saturated at maximal MF power of the spectrometer used). The ESR spectra obtained were processed with a WinEPR program package (Bruker, Germany).
The CM sample masses after LTOP oxidation steps up to 80% burnoff were of 1-2 mg. This resulted in rather high relative errors (± 20%) during the ESR line amplitude and ESR
174

P R O C E E D I N G S
integrated intensity measurements. An ESR spectrum is a first derivative of an absorption line. The ESR line width, Hpp (a distance between maximal curvature points of the ESR absorption line), and ESR line amplitude, Ipp (a distance between extremums of the first derivative of the ESR absorption line), were fixed during the ESR measurements.
Results and discussion Pitch and pitch samples had not any significant macrostructural defects after oxidation. A
microphotograph of oxidized fiber is shown in Fig.1.
The absence of any changes in fiber diameter even after their 80% mass losses allows one to suppose that pore formation processes take place in these fibers.
The relative amplitudes of the first derivatives of ESR absorption lines for the samples with different masses, recorded in air, are in the range of measurement errors, while ESR line
amplitude values for pitch samples, oxidized to 39 and 85% burnoffs and also recorded in air, markedly differ from amplitude values for other samples (Fig.2). In case of insignificant changes of line shapes, this fact points to a twice decrease of the amount of paramagnetic centers. Such a result may be caused by partial or complete destruction of elementary textural fragments, comprising pitch matrix, at the expense of combusting one of three aromatic molecules, namely, a central molecule. At higher mass losses, an ESR line amplitude value was recovered. Probably, a shift of π-electrons observed in the central molecule due to interactions with lateral molecules disappears with central molecules removal after their complete combustion. Unpaired electrons are in only the ETF central molecules but
Fig.1. An image of fiber with a 80% burnoff in LTOP. (A microphotograph was obtained
with a JЕOL- JSM 6390LA scanning electron microscope).
2
3
4
5
0 20 40 60 80 100
Обгар, %
Ампл
итуд
а, о
тн.ед.
2
3
4
5
0 20 40 60 80 100обгар, %
ампл
итуд
а, отн
.ед.
Fig.2. Changes in ESR spectrum line relative amplitudes as functions of burnoff extents of fiber-forming pitch (left) and pitch finer (right) during their LTOP oxidation. (The MF
irradiation power in an ESR spectrometer resonator was of 1.7 mW).
175

P R O C E E D I N G S
they are absent in the ETF lateral molecules. This predetermines a drop of unpaired electron concentration. At further steps of the burnoff process, the second ETF molecule is removed. Due to a relatively weak bonds between ETFs in pitches and their high mobilities, pitch matrix, after achieving some critical number of defects (voids), is, probably, reconstructed to form another equilibrium spatial state, more friable than the initial state, including other three-molecule ETFs. This results in recovering of unpaired electron concentration.
It should be noted that for the sample with 95% burnoff, the ESR line amplitude value does not differ from amplitude values for other samples; this fact indicates that the ESR signal is not related to impurities present in fiber-forming pitch.
The similar studies for pitch fiber samples in air did not give the same results: no minimums of unpaired electron concentrations at 35-40 and 70-80% burnoffs were observed.
In case of ESR spectra of pitch fibers recorded in hydrogen atmosphere, a drastic decrease in line amplitude is observed for the sample with 47% burnoff (Fig.3). This is explained by substitution of sorbed gases with hydrogen. In other words, the sample with 47% burnoff contains some amount of paramagnetic centers that can be formed due to the presence
of gases sorbed by pitch matrix, and hydrogen can replace these gases from pores. ESR line amplitudes of the samples with burnoffs other than 47% increase in hydrogen atmosphere, compared to their amplitudes in air; some rises in ESR line widths for them in hydrogen atmosphere are also observed. The increase in ESR line amplitude is due to the increase in the amount of paramagnetic centers; here hydrogen can be considered as a donor of electrons, and it can substitute sorbed acceptor molecules (mostly, oxygen molecules). As a result of this, ETF molecules that did not contain unpaired electrons, become paramagnetic species and give ESR signals. These new paramagnetic molecules may have ESR characteristics different from those recorded in air medium; therefore, the line width in their ESR spectra may increase.
2
3
4
5
6
7
0 20 40 60 80 100обгар, %
Ампл
итуд
а, отн
.ед.
Fig.3. The dependence of the ESR line relative amplitude on the burnoff extent in LTOP for pitch fiber in hydrogen atmosphere. (The MF irradiation power in an ESR spectrometer
resonator was of 1.7 mW).
It is worth to notice that, in contrast to ESR spectra of pitch fibers, neither in hydrogen atmosphere nor in air we could not find any minimums in ESR line amplitude dependences
176

P R O C E E D I N G S
for similar spectra of fiber-forming pitch samples oxidized to various extents of burnoff. This fact permits one to conclude that pore structure formed during the oxidation of pitch-based samples is unstable.
Conclusions:
1. ESR line amplitude minimums have been discovered in pitch and pitch fiber samples oxidized to 40% burnoff and in pitch samples oxidized to 80% burnoff;
2. Pores formed during oxidation of pitch-based samples have sizes appropriate for sorption of light gases;
3. It has been established that pore structure formed in pitch during its oxidation is unstable; the pores formed are progressively collapsed with time as a result of elementary textural fragments restoration caused by thermal motion of molecules.
References: [1] Grigoriev V.M., Berveno V.P., Kornievich M.V., Shchukin L.I. Oxidation of aromatic
molecules in isotropic pitch-based fiber nanofragments in low temperature oxygen plasma // Polzunov Bulletin. 2008. N 3. P. 121-125 (in Russian). Joo L.A. City J. McKee J.A. US Patent 3595946, 1971.
[2] McKee J.A. Joo L.A. New carbon monofilament substrate for chemical vapor deposition.// In Proc. Ann. Tech.Conf. of RP/Composites Inst., The Society of Plastic Ind. New York 1972;27:536-551
[3] Derbyshire F. Andrews R. Jacques D. Jagtoyen M. Kimber G. Rantell T. Synthesis of isotropic carbon fibers and activated carbon fibers from pitch precursors.// Fuel 2001;80:345-356.
[4] Н. L. Riley, H. E. Blayden, J. Gibson An X-Ray study of the structure of coals, cokes and chars// «The ultra-fine structure coals and cokes» Proceeding of a conference. London: The British cоal utilization research association, 1944
[5] P. B. Hirsch Proc. Roy. Soc.,A226,143,1956 цит. по W. Francis Coal its formation and composition/ London: Edward Arnold (publishers)LTD 1961 с. 806
177

P R O C E E D I N G S
NMR of liquid 3Не in pores of clay minerals
A.V. Klochkov, M.S. Tagirov, K.R. Safiullin, A.N. Yudin, V.V. Kuzmin, R.R. Gazizulin, V.G. Izotov, L.M. Sitdikova
Kazan State University, 18 Kremlyovskaya St., Kazan 420008, Russia
e-mail: [email protected]
Abstract In the present work we have proposed a new method for study porous media by NMR of
liquid 3Не. We have demonstrated this method on the example of clay mineral sample. For the first time the integral porosity of clay sample has been measured. For our samples the value of integral porosity is in range 10-30 %. The inverse Laplace transform of 3He longitudinal magnetization recovery curve has been carried out, thus distribution of relaxation rates T1
-1 has been obtained.
Introduction
The study of clay minerals by traditional porometry methods are complicated by unique clay properties. The pore’s sizes are quite small and probably closed for traditional porometry probes. Consequently, it is necessary to develop new methods for studying such materials.
The systems “liquid 3Не – porous media” were previously studied intensively [1-5], but mainly for determination of 3Не properties in contact with porous and crystal powder samples.
It was found in [6] that the magnetic relaxation of the nuclear spins of liquid 3Не present in pores of the sample acquires substantially new features as compared with relaxation in a bulk liquid. A new mechanism of relaxation has been proposed.
The samples and methods The clay sample was cut out of clay mineral in the shape of tablet. For calibration
purposes the hole has been drilled in the center along tablet axis. The ratio of the calibration cavity volume to the clay sample volume is 13%.
The sample was placed in the glass tube which was sealed leak tight to the 3Не gas system. On the surface of the tube a NMR coil was mounted. The hand made pulse NMR spectrometer has been used (frequency range 3 – 25 MHz). The pulse NMR spectrometer is equipped by resistive electrical magnet with magnetic field strength up to 1 T. A “bulk” liquid 3Не inside of the calibration cavity was used as a reference for estimations of the integral porosity of the sample. The sample has been filled by 3Не under saturation vapor pressure at the temperature 1.5 K.
The longitudinal magnetization relaxation time T1 was measured by the saturation recovery method using spin-echo signal. The observation of the spin-echo signal was possible due to the magnetic field inhomogeneity of the magnet. The spin-spin relaxation time T2 was measured by Hahn method.
Results and discussion The system “clay sample – liquid 3Не” was studied by measuring NMR spectra of liquid
3Не as well as nuclear spin kinetics of 3Не on frequencies 12 and 20 MHz at temperature 1.5 K.
178

P R O C E E D I N G S
On the Fig.1 an example of NMR spectrum and spin echo signal are presented. The spin echo signal is not symmetrical because it was observed against the background of the signal of free induction decay (FID). It was done in order to minimize the delay between π/2- and π-pulses (td = 340 (µs) in this experiment) so that the transient process would not be observed and thus maximize the amplitude of the spin echo signal.
200 400 600
-150 -100 -50 0 500
2
4
6
Frequency, kHz
t, mks
1
2
T = 1.5 Kf = 12 MHz
Echo
1
2
td = 340 (mks)
Fig.1. The NMR spectrum of liquid 3Не in the sample on frequency 12 MHz at temperature
1.5 K. Spin echo signal (on inset) and its Fourier transform.
The NMR spectrum in the Fig.1 was obtained by the Fast Fourier transformation of the spin echo signal. Observed NMR spectrum can be described with two Lorenz lines with widths of 3 and 91 kHz. The narrow line we could associate with NMR signal of liquid 3Не in a calibration cavity. Obviously, the broad line in the spectrum could correspond to 3Не in pores of the sample. The ratio of intensities is close to 1. The same ratio can be seen clearly from the shape of spin echo (Fig.1).
Liquid 3Не nuclear spin relaxation times T1 and T2 were measured on frequency 12 MHz at temperature 1.5 K. The longitudinal magnetization recovery curve can be described by following equation:
0,5
1 1
*(1 exp( ( ) )) *(1 exp( ))echoa b
tA A BT T
= − − + − −t (1)
with parameters: T1a = 3.5 (s), T1b = 12 (s), A/B ≈ 1. We see that the behavior of the longitudinal magnetization recovery is non-exponential and consists of two processes (see example on Fig.2), as well. In (1) the power 0.5, probably, indicates the presence of distribution of relaxation rates T1
-1 in pores with different sizes. The transverse magnetization
decay also consists of two parts with the same magnitudes of contribution from liquid 3He in pores and bulk 3He.
179

P R O C E E D I N G S
The measurements on frequency 20 MHz shows the same results and absence of field dependence of the nuclear spin-relaxation parameters.
10 100 1000 10000 100000
0
10
20
30
40
50
60
70A(1 - exp(- ( t/T1a)
0.5) + B(1 - exp(- t/T1b)) A = 0.6 ± 0.1 T1a = 3.5 ± 0.9 s B = 0.4 ± 0.1 T1b = 11.9 ± 0.6 s
Aec
ho,
a.u.
τ, ms
T = 1.5 Kf = 12 MHz
Fig.2. Longitudinal magnetization recovery of liquid 3Не nuclei in a sample on frequency 12
MHz at temperature 1.5 K. Equation (1) describes experimental data (open circles) with following parameters: T1A = 3.5 s, T1B = 12s, ratio A/B is about 1.
The inverse Laplace transform of longitudinal magnetization recovery curve for detail investigation of 3He relaxation in clay pores was performed using algorithm based on a regularized inverse Laplace transform analysis with uniform penalty (UPEN) [9].
We have programmed the inverse Laplace transform using this algorithm. One of the unique things in our work is that we have applied it on 3He relaxation.
The distribution of relaxation times computed by UPEN are shown in Fig. 3, there narrow peak (in log scale) corresponds to bulk 3He and wide peak with more short T1 corresponds to 3He in clay and can be explained probably by wide distribution of pore sizes in the sample.
Our experimental data (NMR spectra, nuclear spin relaxation processes) shows that the magnitudes of contribution to NMR signal of liquid 3Не nuclei from pores and bulk 3Не are the same. So, based on the fact that the ratio of the calibration cavity volume to the clay sample volume is 13% we can find out that the sample porosity is about 13%.
Conclusion We have demonstrated the new method for study porous media by NMR of liquid 3Не in
the case of clay mineral sample. For the first time the integral porosity of clay sample has been measured. Combining all experimental results we can conclude, that the porosity of a sample is 13%.
We have also demonstrated that inverse Laplace transform of 3He relaxation curves in porous media can characterize pore size distribution.
180

P R O C E E D I N G S
0,01 0,1 1 10 100
0
10
20
30
40
50
stat
istic
al fr
eque
ncy,
a.u
.
T1, s
Fig.3. Distribution of liquid 3He T1 relaxation times for a clay sample obtained by regularized
inverse Laplace transformation with the UPEN program
Acknowledgments
The authors acknowledge A.V. Egorov for enlightening discussions.
References [1] L.J. Friedman, P.J. Millet, R.C. Richardson. Phys. Rev. Lett., 47, 1078 (1981).
[2] L.J. Friedman, T.J. Gramila, R.C. Richardson. J. Low Temp.Phys., 55, 83 (1984).
[3] M.S.Tagirov, A.N. Yudin, G.V. Mamin, A.A. Rodionov, D.A. Tayurskii, A.V. Klochkov, R.L. Belford, P.J. Ceroke, B.M. Odintsov. J Low Temp Phys 148, 815 (2007)
[4] A.V. Klochkov, V.V. Kuzmin, K.R. Safiullin, M.S. Tagirov, D.A. Tayurskii, N. Mulders. Pis’ma v ZhETF, 88, 944 (2008).
[5] A.V. Egorov, D.S. Irisov, A.V. Klochkov, A.V. Savinkov, K.R. Safiullin, M.S. Tagirov, D.A. Tayurskii, A.N. Yudin. Pis’ma v ZhETF, 86, 475 (2007).
[6] Naletov V.V., Tagirov M.S., Tayurskii D.A., Teplov M.A.: JETP 81, 311 (1995)
[7] Slichter, Charles P. Principles of magnetic resonance / C. P. Slichter. - 3rd, enl. and updated ed. p. cm. Springer-Verlag Berlin Heidelberg New York 1990 p.601
[8] H.R. Hart and J.C. Wheatley. Phys. Rev. Lett., 4, 3 (1960).
[9] G.C. Borgia, R.J.S. Brown, and P. Fantazzini. J. Magn. Reson. 147, 273 (2000).
181

P R O C E E D I N G S
Development of NMR spectrometer control software
I.J. Danilov, I.B. Luzhbin, L.A. Batalova, I.R. Mukhamedshin
Kazan State University, 420008, Kremlevskaya st., 18, Kazan, Russia
e-mail: [email protected]
Introduction Nuclear magnetic resonance is one of the widely used methods for investigating of
biological subjects, minerals and others. Automatization and control of NMR experiment by personal computer is one of important task in upgrading home-build spectrometers. Our task was to develop the flexible bundled software which allows controlling various experimental equipment.
The requirements for the software 1. It should allow user to work with different hardware setups from a single environment.
2. It should allow user to write a program of forthcoming experiment in high-level language. This means that the program must have the capability to perform needed actions to control the units of spectrometer, according to the algorithm written by experimenter. Therefore the time, spent by scientist on the direct participation in the experiment, decreases.
3. The software should have the possibility to track the experiment journal and write the user actions and hardware events list there.
4. The software should have modern graphical user interface.
5. The software needs to be cross-platform. The application should be able to work in different operating systems.
Software implementation We chose Java programming language [1,2] and visual component library Swing to
create such program, since they are distributed freely, provide cross-platform compatibility and modern graphical user interface.
The flexibility in working with different hardware setups can be achieved by using modular structure of the program – see Fig.1. The main module (core) of the program must allow connecting the secondary modules (plug-ins) before experiment in a single working package. These secondary modules can be written by other people and can interact with the separate units of spectrometer or perform some additional functions themselves (primary data analysis, data storage, data plotting etc). By straight lines the interaction of the core and modules are shown. In case of necessity for one module to call another module, the core will control this data exchange which will make software more stable.
According to this, we need to solve the following problems:
1. The interaction between modules and the core.
2. The general rules (interface) to create modules.
3. Methods in the core to load the modules (plug-ins).
4. Script language which will allow user to program forthcoming experiment.
182
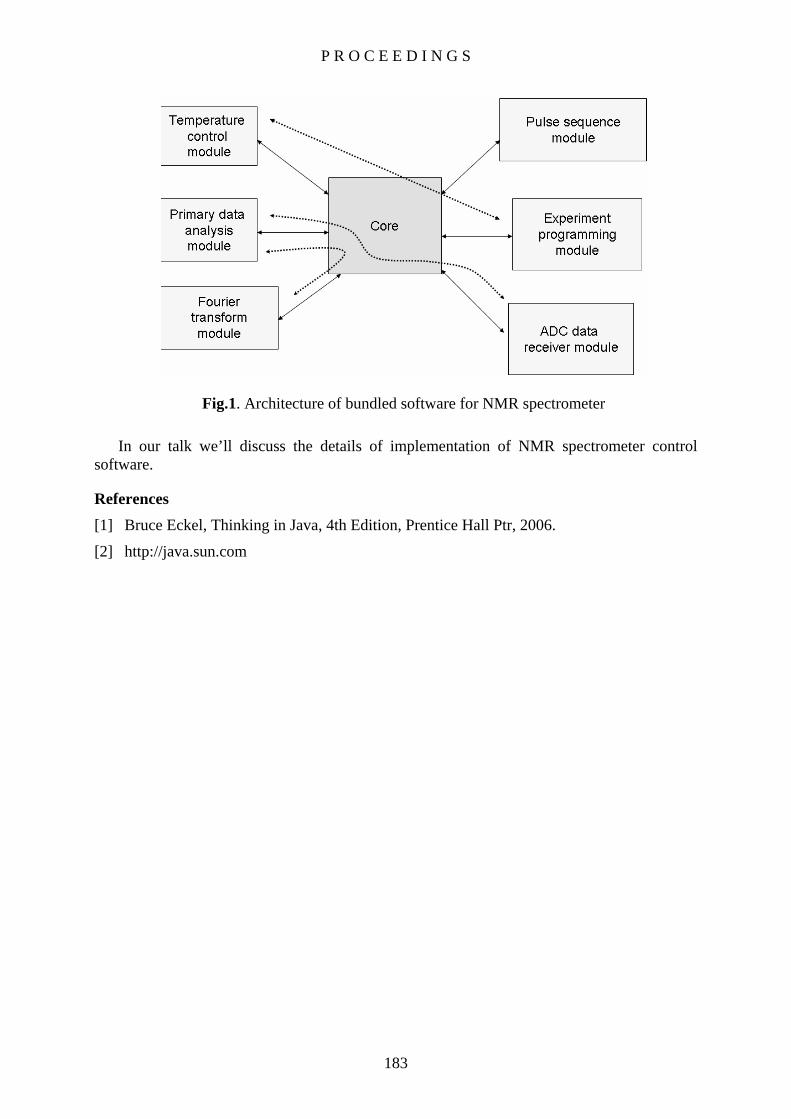
P R O C E E D I N G S
Fig.1. Architecture of bundled software for NMR spectrometer In our talk we’ll discuss the details of implementation of NMR spectrometer control
software.
References [1] Bruce Eckel, Thinking in Java, 4th Edition, Prentice Hall Ptr, 2006.
[2] http://java.sun.com
183

P R O C E E D I N G S
High-resolution NMR studies of cyclosporine A
S.V. Efimov, A.R. Yulmetov, V.V. Klochkov Kazan State University, 420008, Kremlevskaya Str., 18, Kazan, Russia
e-mail: [email protected]
Introduction Knowledge about peptide conformations is crucial for understanding their role in animal
and human physiology. Oligopeptides can serve as a starting point for studying long polypeptide chains. Moreover, short amino-acid chains may also be of great biological significance. In this work we aim to determine the spatial structure of cyclosporine A. It is widely used as an immunosuppressive agent. It reduces the body's natural immunity in patients who receive organ (for example, kidney, liver, and heart) transplants.
Cyclosporine A (CsA) is a cyclic peptide containing 11 amino acid residues in its chain. They include D- and L-isomers of alanine, N-methylated forms of leucine, valine and glycine, and two more nonstandard residues (see Fig.1). Cyclosporine is highly hydrophobic, but is readily soluble in fats and some organic solvents (examples including methanol, chloroform, benzene, dimethyl sulfoxide).
Results and Discussion In our investigation we relied on the method of 2D nuclear Overhauser effect
spectroscopy (NOESY) to determine conformation of the molecule of interest. But before we could go into this subject, we needed to make assignments of NMR signals. In order to solve this problem we recorded a set of homo- and heteronuclear correlation spectra: COSY, TOCSY (including 1D spectra with selective excitation), HSQC and HMBC. A brief description of these experiments can be found in [1].
Fig.1. Cyclosporine molecule
Proton spectum of cyclosporine in benzene is presented in Fig.2. Spectrum of the same compound in dimethyl sulfoxide (DMSO) showed a complete mess of lines (see Fig.3). For example, low-field region (6.5 to 9.0 ppm) contains about 30 resonances of different intensity. Since CsA molecule has only 4 amide protons, one can conclude that several conformers exist simultaneously in DMSO, and that their average lifetime is long in terms of the NMR time scale.
So far solution in benzene was chosen for further investigation.
184
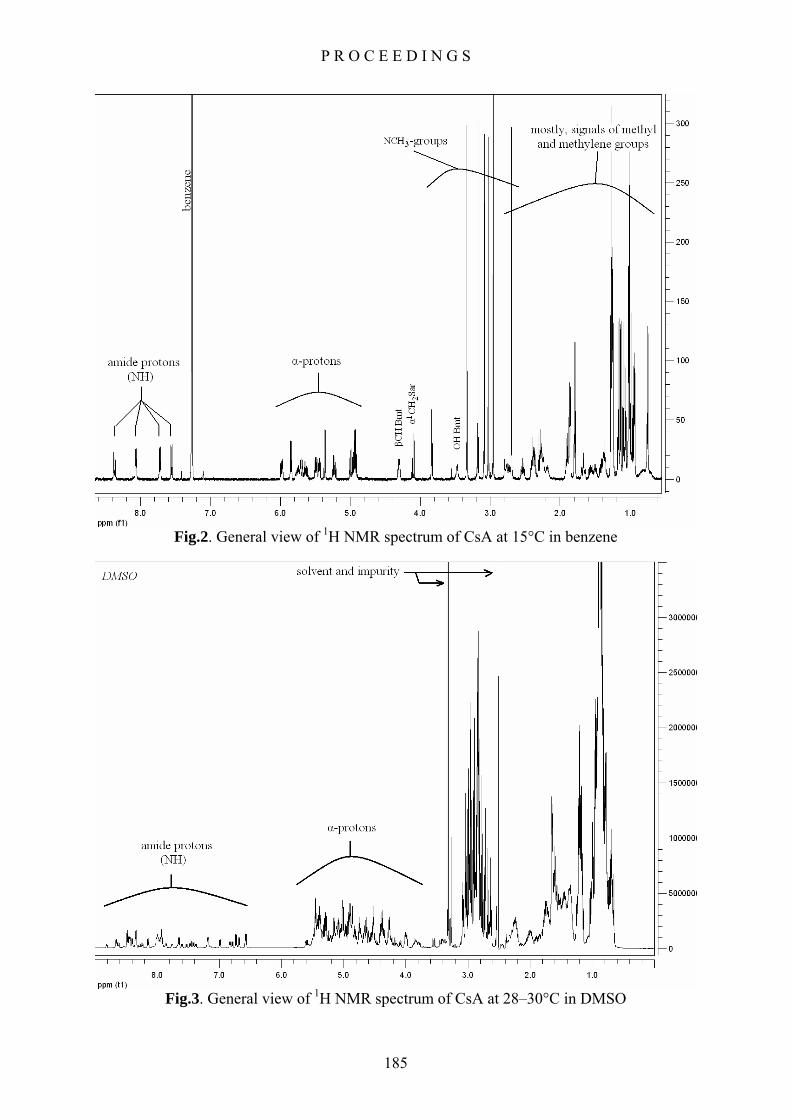
P R O C E E D I N G S
Fig.2. General view of 1H NMR spectrum of CsA at 15°C in benzene
Fig.3. General view of 1H NMR spectrum of CsA at 28–30°C in DMSO
185

P R O C E E D I N G S
Due to serious overlapping in 2D COSY and TOCSY spectra it was not always possible to build out the whole side chain of a particular residue. The most difficult was assignment of 4 similar N-methylated leucines and the long side-chain of BMT. It is this case when TOCSY with selective excitation of a narrow spectral band was very useful. We could irradiate either one of amide protons or one of α-protons. After that special pulse sequence transmitted magnetization from this nucleus to other nuclei, belonging to the same spin system (i. e. the same amino acid residue).
Assignment of carbon resonances was accomplished by means of heteronuclear HSQC and HMBC experiments. Cross-peaks (Ωi(1H), Ωj(13C)) in the HSQC spectrum show one that carbon and hydrogen atoms, resonating at corresponding frequencies, are connected via a covalent bond. HMBC experiment reveals pairs of atoms divided by several bonds. For this reason signals of protons in NH-groups and of carbons in CO-groups are also seen in (1H, 13C)-HMBC spectrum and facilitate sequential assignment of amino-acid residues. Owing to these heteronuclear techniques we were able not only to assign all backbone and some side chain 13C resonances, but also to distinguish between 4 N-methylleucines and between L-Ala and D-Ala residues.
A set of NOESY spectra with different mixing times (τm = 80 to 600 ms) were recorded. They revealed 26 cross-peaks, those were not strongly overlapped with others and hence were easy to interpret. Analysis included measurement of intensities of cross-peaks and corresponding diagonal peaks, evaluation of cross-relaxation rates σ and, finally, comparing with σ value of reference atom pair [2]. Protons of methylene group βCH2(Mle-10) were chosen as reference, with internuclear distance assumed to be 1.75 Å.
Internuclear distances from different sites of the molecule were evaluated. Generally, their were similar to corresponding crystal structure distances, obtained by X-ray investigations, with the exception of Bmt side chain. It appears to be remote from the plain of the molecule, as we didn’t find NOE cross-peaks corresponding to β, γ and farther protons of this residue. On the contrary, in the crystal structure it lies close to the molecular plane. Crystal structure 1CWA from Protein Data Bank was taken for comparison [3].
Experimental part NMR spectra were recorded on a FT spectrometer Avance-500 (Bruker). Operating
frequency is 500 MHz in proton channel and 126 MHz in carbon channel (B0 = 11.75 T). Deuterated solvents were used (C6D6 and (CD3)2SO). Experiments in benzene were done with temperature stabilized at 15° C. 33°–pulses were used for recording 1D spectra of 1H and 13C, with relaxation delay of 1–2 s.
Selective pulses for 1D TOCSY experiments had a typical length of 60 ms with power level of 3.77 μW (66.9 dB weaker than broadband pulses used).
Standard 5-mm ampoule was used. The solution of CsA in benzene had a concentration of ca. 2 % (weight), the solution in DMSO – 0.75 %.
References [1] Keeler, J. Understanding NMR Spectroscopy / J. Keeler. – Chichester : Wiley, 2005. –
XV, 464 p. – ISBN 0-470-01786-4. [2] Macura, S. An improved method for the determination of cross-relaxation rates from
NOE data / S. Macura, B.T. Farmer, L.R. Brown // Journal of Magnetic Resonance. – 1986. – Vol. 70. – P. 493-499.
[3] X-Ray Structure of a monomeric cyclophilin A-cyclosporin A crystal complex at 2.1 Å resolution / V. Mikol [et al.] // Journal of Molecular Biology. – 1993. – Vol. 234. – P. 1119-1130.
186

P R O C E E D I N G S
Antimony NQR studies of stephanite
A.Yu. Orlova, R.R.Gainov, A.V. Dooglav, I.N. Pen’kov
Kazan State University, 420008, Kremlevskaja str. 18, Kazan, Russia
e-mail: [email protected], [email protected]
Introduction Stephanite is the complex Ag, Sb sulfide known as one of the sources of economically
important metal – silver. In addition, it is necessary to know physical properties of minerals in order to understand the mineral formation in nature. Also, additional information allows one to use stephanite not only as raw materials. Some structurally related to stephanite compounds, such as stibnite and pyrargirite, are known to be ferroelectric. The field of their application is still growing (in optoelectronic, instrumental engineering) and these minerals have been intensely studied by different methods [1, 2]. Stephanite by itself is not well studied yet. In this work we applied the NQR spectroscopy to study stephanite.
Crystal chemistry
The chemical formula of stephanite is Ag5SbS4. The elementary cell of Ag5SbS4 at room T has an orthorhombic symmetry corresponding to the space group Cmc21 with 4 f.u./unit cell. The parameters of the unit cell are the following: a =7.830 ± 0.002 Å, b = 12.450 ± 0.005 Å, c = 8.538 ± 0.002 Å. The structure belongs to the chain type of compounds. We should remark that there is only one position of Sb in the crystal. The framework of the stephanite is formed by columns of Sb atoms, which extend in pairs parallel to the z axis. (Fig.1). Atoms of antimony form the SbS3 triangles with the angle S–Sb–S ≈ 100°. Every occupied with Sb pyramids neighbours with an empty pyramids in the adjacent columns. Atoms of Ag are placed in the centers of the vacant rhombic channels between the supporting SbS3 columns [3].
It is important to note that the symmetry of stephanite allows us to suppose the occurrence of ferroelectric properties in this compound.
Fig.1.Crystal structure of stephanite, it is shown a chain structure( on the left); XY projection, the triangles are the bases of SbS3 pyramids, pink circles and violet circles
are Sb atoms located at z = 0 and z = 1/2 respectively (right).
187

P R O C E E D I N G S
Methods The synthetic sample of stephanite was studied. The antimony nuclear quadrupole
resonance measurements were carried out on standard home-built pulsed NMR/NQR spectrometer. For better penetration of the high-frequency magnetic field sample was crushed in an agate mortar to a particle size about 50 μm and packed in epoxy resin. The spectrum of 123,121Sb NQR was obtained by the Fourier transform of the spin echo signals. The Sb nuclear spin-lattice relaxation rate was measured at the peak of the 123,121Sb NQR signal and calculated by plotting the Sb nuclear spin-echo intensity as a function of the time delay ∆t between the saturating and π/2 - π probing pulses. The characteristic of both 121Sb and 123Sb isotopes are shown in the Table 1.
11−T
Table 1. The characteristic of both antimony isotopes 121Sb and 123Sb
Nucleus Natural abundance, %
Spin Gyromagnetic ratio γ/2π, MHz/T
Nuclear quadrupole moment Q, 10-24 cm2
121Sb 57,25 5/2 10,188 -0,669 123Sb 42,75 7/2 5,517 -0,853
NQR spectrum It has been known that the NQR spectrum of a quarupole nucleus (I>1/2) is described by
the following Hamiltonian [4]:
)(21)1(3
)12(4222−+ +++−
−= IIIII
IIeQVH Z
ZZQ η (1)
where Vzz is the largest component of the crystal electric field gradient (EFG) tensor and η=|VXX-VYY|/VZZ is the asymmetry parameter showing the deviation of the EFG symmetry from the axial one. So, the energy levels pattern may be described through two parameters – Vzz and η. Therefore, if frequencies of adjacent transitions are known it is possible to define η precisely and uniquely. For instance, there are approximate formulas, which show the dependencies of frequencies on η [5].
Results and discussion It is known that Sb NQR spectrum consist of five lines at T=77 K [6]. It is typical for
single crystallographic position of antimony in the structure. The spectrum is shown in Fig.2.
The temperature dependences of three resonant frequencies, ν1 (±1/2↔±3/2) and ν2 (±3/2↔±5/2) for 123Sb (spin I=7/2), and ν3 (±1/2↔±3/2) for 121Sb (spin I=5/2), as well as the corresponding line-widths Δ ν1, Δ ν2, Δ ν3 were studied in the temperature range of 4,2K – 300K. The experimental values of ν1 and ν2 frequencies were used in order to calculate EFG asymmetry parameter η for Sb. The Sb NQR line shape was well fitted by Lorentzian function at all temperatures studied and its linewidth was taken as a full width at half maximum.
The temperature dependence of 123Sb nuclear quadrupole frequency ν1 is displayed in the Fig.3. In general, the quadrupole frequency ν1 decreases with increasing temperature without significant anomalies. Its behaviour corresponds to Bayer’s influence of temperature-induced vibrations the EFG value. However, we focus here on one weak effect: the change in the slope in the T dependences of ν1.
The temperature dependence of line-widths Δν is displayed in the Fig.4. As one can see, the NQR linewidths change very weakly with decreasing T in the range of 4,2 K – 145 K, but
188
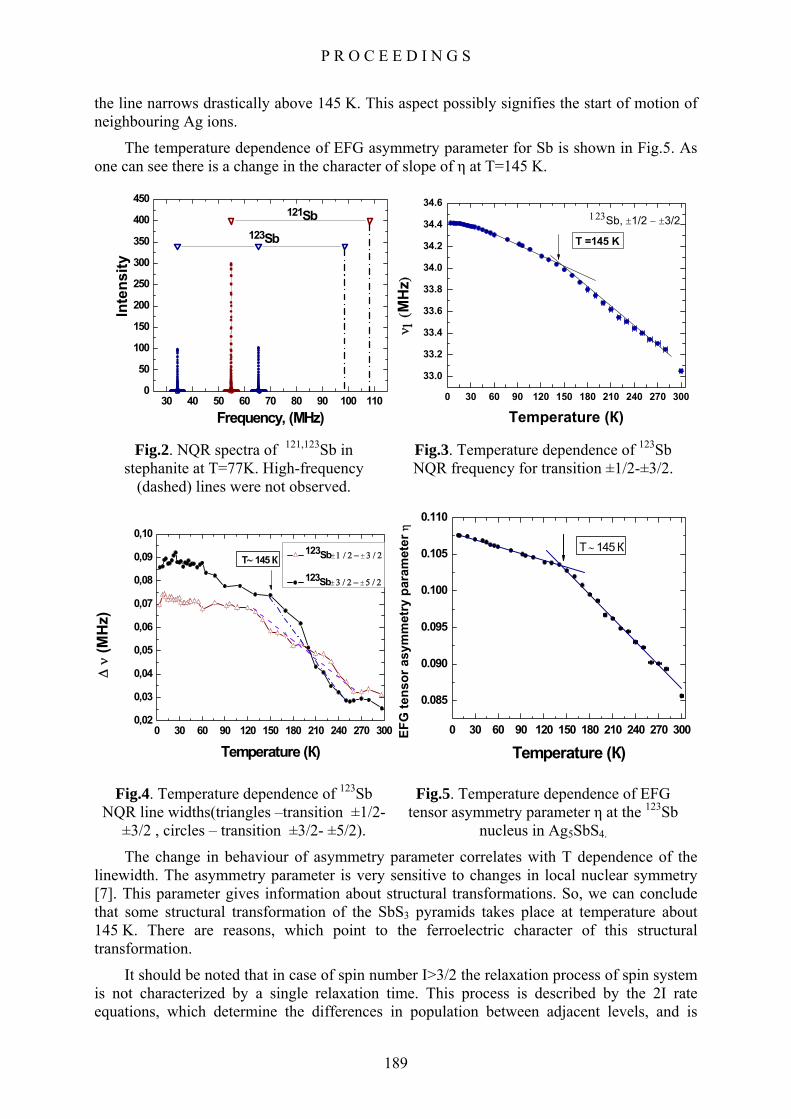
P R O C E E D I N G S
the line narrows drastically above 145 K. This aspect possibly signifies the start of motion of neighbouring Ag ions.
The temperature dependence of EFG asymmetry parameter for Sb is shown in Fig.5. As one can see there is a change in the character of slope of η at T=145 K.
30 40 50 60 70 80 90 100 1100
50
100
150
200
250
300
350
400
450
123Sb
Inte
nsity
Frequency, (MHz)
121Sb
0 30 60 90 120 150 180 210 240 270 300
33.0
33.2
33.4
33.6
33.8
34.0
34.2
34.4
34.6
ν 1 (M
Hz)
Тemperature (К)
123Sb, ±1/2 − ±3/2
T =145 K
Fig.2. NQR spectra of 121,123Sb in stephanite at T=77K. High-frequency
(dashed) lines were not observed.
Fig.3. Temperature dependence of 123Sb NQR frequency for transition ±1/2-±3/2.
0 30 60 90 120 150 180 210 240 270 3000,02
0,03
0,04
0,05
0,06
0,07
0,08
0,09
0,10
123Sb± 1 / 2 − ± 3 / 2
123Sb± 3 / 2 − ± 5 / 2
Тemperature (К)
Δ ν
(MH
z)
Т∼ 145 К
0 30 60 90 120 150 180 210 240 270 300
0.085
0.090
0.095
0.100
0.105
0.110
EFG
tens
or a
sym
met
ry p
aram
eter
η
Тemperature (К)
Т ∼ 145 К
Fig.4. Temperature dependence of 123Sb
NQR line widths(triangles –transition ±1/2- ±3/2 , circles – transition ±3/2- ±5/2).
Fig.5. Temperature dependence of EFG tensor asymmetry parameter η at the 123Sb
nucleus in Ag5SbS4.
The change in behaviour of asymmetry parameter correlates with T dependence of the linewidth. The asymmetry parameter is very sensitive to changes in local nuclear symmetry [7]. This parameter gives information about structural transformations. So, we can conclude that some structural transformation of the SbS3 pyramids takes place at temperature about 145 K. There are reasons, which point to the ferroelectric character of this structural transformation.
It should be noted that in case of spin number I>3/2 the relaxation process of spin system is not characterized by a single relaxation time. This process is described by the 2I rate equations, which determine the differences in population between adjacent levels, and is
189

P R O C E E D I N G S
defined, in general, by 2I relaxation times. A relative contribution of the different relaxation times depends on the nature of the relaxation process and on the initial conditions. [8, 9] The isotopic ratio (121Sb)/ (123Sb) can used to identify the nature of the relaxation process. In case of Ag5SbS4 we have found that the value of T1
-1(121Sb)/ T1-1(123Sb) is about 1,11 at all
temperatures, i.e. the relaxation process is primarily quadrupole in origin. We calculated the relaxation functions. We supposed that the relaxation function for I=5/2 (transition ±1/2↔±3/2) is described by a sum of two components as
11−T 1
1−T
( )[ ]WtWt eeBAtM 6.034.0 85.015.11)( −− +⋅−⋅= (2)
and for I=7/2 (transition ±1/2↔±3/2) is described by a sum of three components as
( )[ ]WtWtWt еeeBAtM 16.026.044.0 65.105.029.01)( −−− ++⋅−⋅= (3)
where A is the equilibrium value of nuclear magnetization, B is a parameter, which characterizes the deviation scope of magnetization in zero time.
The temperature dependence of 123Sb spin lattice relaxation rate is displayed in Fig.5. The best fit of our experimental data in Fig.5 is obtained using expression
11−T
TEakteaTTT /211 )( −− ⋅+= β (4)
which gives the activation energy Eact ~ 6000K. Similar behaviour of spin-lattice relaxation was observed, for example, in investigation of superionic semiconductor domeykite [10]. The relaxation of this compound was due to diffusion of Ag ions. We believe that the activation process in our case is caused by diffusion motion of Ag in the crystal and may be connected with the phase transformation at 145 K.
0 50 100 150 200 250 300
0.01
0.1
1
10
100
Temperature (К)
T -1 1
(s-1
)
Fig.5. Temperature dependence of Sb spin-lattice relaxation rate. Solid line – approximation according to (4).
References [1] R.S. Abdullin, N.M. Pen’kov, N.M. Nizamutdinov, Fiz. Tv.Tela 19 (1977) 1632.
[2] A.V. Bondar’ et al., Fiz. Tv. Tela 25 (1983) 2602.
190

P R O C E E D I N G S
[3] A.A. Petrunina, B.M. Maksimov, V.V. Iljuhin, Sov. Phys. Dokl. 188 (1969) 342.
[4] A. Abragam, The Principles of Nuclear Magnetizm. London. Oxford University Press 1962.
[5] T. Wang, Phys. Rev. 99 (1955) 566.
[6] I.N. Pen’kov, I.A. Safin, Sov. Phys. Dokl. 168 (1966) 1148.
[7] G.S. Grechishkin, Nuclear quadrupole interactions in solids Moskow. Nauka 1973.
[8] I. Watanabe, J. Phys. Soc. Jpn. 63 (1994) 1560.
[9] E. R. Andrew, Pr. Phys. Soc. 78 (1961) 1.
[10] B.B. Begaev et al., Appl. Magn. Reson. 22 (2002) 577.
191

P R O C E E D I N G S
Copper NQR studies of copper sulfide Cu1.6S (geerite)
I.A. Evlampiev, R.R. Gainov, A.V. Dooglav, I.N. Pen’kov
Kazan State University, Kremlevskaya St. 18, Kazan 420008, Russia
e-mail: [email protected],
Introduction To this moment, eight copper sulfide minerals are known: covellite CuS, chalcocite
Cu2S, djurleite Cu1.934–1.965S, digenite Cu1.79–1.765S, anilite Cu1.75S, as well as newly discovered spionkopite Cu1.4S, yarrowite Cu1.125S, and geerite Cu1.6S [4].
In the nature geerite occurs associated with sphalerite as a coating or thin (~15 µm) platelets oriented along cleavage planes. It was revealed and studied firstly by means of X-ray and microprobe by Goble in 1980 [1]. mF 34 space group and Cu1.60S “ideal” composition were ascertained. However, a geerite’s cell is rhombohedral with a=15,77 Å, α=13°56’ , and possible space groups mR3 mR3 32R, or according to more recent measurements, but the precise crystal structure wasn’t deciphered [4]. The proposed crystal structure is based on those of metastable digenite with the restrictions that copper atoms are located only in undistorted triangular and tetrahedral coordination polyhedra and that rather that one out of every five Cu-S-Cu sandwiches having one empty Cu position, two of five must be empty. Cu-S distance in tetrahedra is 2.35 Å, and that for triangles is 2.22 Å. (ivCu+)6(iiiCu2+)2(S2-)5 formula was suggested to maintain the charge balance [4].
Fig.1. The proposed structure of geerite based on (ivCu+)6(iiiCu2+)2(S2-)5;
– sulfur, – monovalent copper, – divalent copper [4].
The synthetic samples, containing geerite phase were studied by nuclear quadrupole resonance (NQR) spectroscopy in 1994 by Anashkin [2]. At liquid helium temperature eight NQR resonant lines were observed at 11.90, 15.21, 16.26, 16.81 MHz and 11.02, 14.10, 15.05, 15.55 MHz for 63Cu and 65Cu isotopes respectively. The resonant frequencies dependences on temperature were investigated in range of 70 – 300 K with the step 20 K, and the linear decrease of the frequencies was revealed.
Crystal and electron structure Since not much is known about geerite’s structure, it is noteworthy to explain how NQR
data may depend on the inner properties of compound by the example of similar copper sulfide, covellite CuS.
At room temperature covellite has a hexagonal P63/mmc cell. However, at THO = 55 K the compound undergoes the structural transition that lowers symmetry, and Cmcm is observed. Similar to geerite, in covellite copper occurs in two crystal-chemical positions, iiiCu
192

P R O C E E D I N G S
and ivCu, surrounded by triangles and tetrahedrons with sulfur atoms in the apexes correspondingly [6]. Both positions are not paramagnet that allows us to observe the NQR lines for the both positions: 14.85 MHz for triangle coordination and ~1.8 MHz for tetrahedral one (63Cu). The temperature dependence of those resonance frequencies is linear that is explained by charge fluctuations [3]. The phenomenon of interest is a changing of slope in this dependency at the temperature of structural transition. The appearance of such changing in other similar compounds could be helpful in detecting the structural transition [5].
From specific resistance measurements it is known that covellite is a metal. Copper nuclear spin-lattice relaxation data is in good agreement with it, as the temperature dependence of T1 obeys Korringa law typical for most metals [8]. The deviation from this law observed at T < 50 K could be explained by the appearance of charge density waves (CDW), exited at this temperature region [3].
Experimental part Several synthetic samples of different stoichiometry, Cu1.05S1.00, Cu1.10S1.00, and
Cu1.30S1.00, containing according to X-ray analysis both geerite and covellite phases were investigated. All samples were grinded to 30µm-particles and packed to epoxy. Then NQR spectra and relaxation rates were obtained using standard pulsed NQR technique in temperature range 4.2-300 K.
Results and discussion The Cu NQR lines exhibited by “high frequency” range 11-17 MHz are shown in Fig.2.
Besides eight geerite lines (11.97, 15.27, 16.18 and 16.96 MHz for 63Cu, 11.07, 14.13, 14.97 and 15.69 MHz for 65Cu, all in good agreement with Anashkin [2]) there are two lines corresponding to covellite phase (14.87 MHz for 63Cu, 13.76 MHz for 65Cu). There is also a signal in “low frequency” range (~1-2 MHz), but due to the closeness of the resonant frequencies and low quality of the signal it is impossible to derive the contribution from each phase. The “high frequency” corresponds to the copper in triangular coordination of sulfur atoms, whereas “low frequency” signal belongs to the copper in tetrahedral coordination [3]. The observation of NQR at “high frequency” contradicts to proposed ionic model of geerite,
10 11 12 13 14 15 16 17 18
frequency (MHz)
Cu1.00S1.00 - sample 1- covellite CuS
Cu1.05S1.00 - sample 3geerite Cu1.6S s3
geerite Cu1.6S s4
Cu1.10S1.00 - sample 2
63Cu65Cu
geerite Cu1.6S s1geerite Cu1.6S s2
Cu1.30S1.00 - sample 4
Spin
ech
o am
plitu
de (a
rb. u
nits
)
Fig.2. “High frequency” NQR spectra at T=4.2 K.
193

P R O C E E D I N G S
since it should be impossible for paramagnet copper. We believe that triangularly coordinated copper sites have a valence value, similar to that of tetrahedral ones.
The change of the slope in the temperature dependences of NQR resonant frequencies is observed for all geerite lines in 50-65 K region (Fig.3). In covellite this is a manifestation of structural transition; similarly we believe that the same transition exists in geerite in the temperature region studied.
As could be seen from Fig.4a the temperature dependences of Cu spin-lattice relaxation rates for all copper positions in geerite obey the Korringa law at T<210 K (however, at T<20 K deviations from the law, similar to that in covellite are observed; they could be attributed to the appearance of CDW as in covellite). It means, that geerite, like covellite has a metallic conductivity. Another prove of this fact is the magnetic behavior of spin-lattice relaxation, caused by free charge carriers. The magnetic behavior is determined from comparision of relaxation rate of two isotopes of copper.
0 50 100 150 200 250 300
12
15
16
17 covellite (14,85 MHz) geerite s1 (11,95 MHz) geerite s2 (15,26 MHz) geerite s3 (16,20 MHz) geerite s4 (16,96 MHz)
frequency at 4.2 K is given in parenthesis
ν Q, M
Hz
T, K
Fig 3. Temperature dependences of copper NQR resonant frequencies.
At temperatures T>210 K the growth of T1, close to exponential is observed. The most likely phenomenon contributing to this growth is the self-diffusion of copper atoms [7]. The copper self-diffusion is in good agreement with the proposed crystal structure of geerite, supposing the existence of vacant copper sites. The growth of spin echo decay T2 in the same temperature region is typical for diffusion phenomenon, as T1 value approaches T2. At T<210 K T2 is almost temperature-independent.
Conclusion
The NQR study of samples, containing geerite and covellite, revealed some features, that couldn’t be defined for such multiphase samples by other methods. They namely are: the structural transition in geerite at 50-65 K, the metallic conductivity of geerite, the self-diffusion in geerite; the proposed ionic formula is found to be incorrect, whereas the assumption about vacant copper sites is in good agreement with the experiment.
194

P R O C E E D I N G S
50 100 150 200 250 3000,0
0,5
1,0
1,5
2,0
geerite s3 (16.20 MHz)geerite s4 (16.96 MHz)
covellite (14.85 MHz)
geerite s1 (11.95 MHz)geerite s2 (15.26 MHz)
T1-1
*T-1
(s*K
)-1
T (K)
a
0 50 100 150 200 250 3001
10
100
1000
10000
T-1 1 , s
-1
T, K
geerite s1 geerite s2 geerite s3 geerite s4 covellite
b
Fig.4. Temperature dependence of a) T value, b) spin-lattice relaxation rate T1 for 63Cu. 11
1−− ⋅T
References [1] R.J. Goble. Canadian Mineralogist – 1980. – Vol. 18 – P. 519-523. [2] В.Н. Анашкин, Т.А. Калинина, В.Л. Матухин, И.Н. Пеньков, И.А. Сафин. Записки
российского минералогического общества – 1994. – 5 – С. 59-63. [3] R.R. Gainov, A.V. Dooglav, I.N. Pen’kov, I.R. Mukhamedshin, N.N. Mozgova,
I.A. Evlampiev, I.A. Bryzgalov. Phys. Review B – 2009. –Vol 79 – P. 075115. [4] R.J. Goble. Canadian Mineralogist – 1985. – Vol. 23 – P. 61-76. [5] R.R. Gainov, A.V. Dooglav, I.N. Pen’kov, I.A. Evlampiev, N.N. Mozgova. Modern
Development of Magnetic Resonance / abstracts. Kazan, September 24-29 2007. – P.160-161.
[6] H. Fjellvåg, F. Grønvold, S. Stølen, A.F. Andersen, R. Müller-Käfer, A. Simon. Z. Kristallogr. – 1988. – Vol. 184. – P. 111–121.
[7] R.S. Abdullin, V.P. Kal’chev, I.N. Pen’kov. Phys. Chem. Minerals – 1987. – Vol. 14 – P. 258-263.
[8] Чижик, В.И. Ядерная магнитная релаксация. — Л: Изд-во Ленинградского Университета, 1991. – ISBN 5-288-00663-6.
195

P R O C E E D I N G S
Multicomponent order parameter in superconductor YBa2Cu3O7
M.A. Malakhov, I.E. Lubin, M.V. Eremin
Kazan State University, Kremlevskaya, 18, Kazan 420008, Russian Federation
e-mail: [email protected]
Numerical solutions of BCS equation has been performed, taking into account the orthorhombic distortion of crystal lattice in YBa2Cu3O7. Relative values of s- and d- wave components of the superconducting energy gap have been calculated. Their relative values are in agreement with experimental data.
We start from usual BCS the equation
⎟⎟⎠
⎞⎜⎜⎝
⎛Δ−=Δ ∑ Tk
EE
kkVN B
k
k k
kk 2
tanh2
)'(1 '
' '
' , (1)
where 22)( kkkE Δ+−= με . We are assuming that Copper pairs are formed due to superexchange and phonon mediated interactions, i.e.
)(2)'cos(2)'cos(2)'( '0 μεωθ −−+−+−=− kDyyyxxx VbkkJakkJkkV . (2)
Hire and are superexchange parameters along the a and b axis, xJ yJ )( ' μεωθ −− kD is usual teta – function, - phonon mediated interaction parameter. The solution of equation (1) can be written as follows:
0V
syyxxk akak Δ+Δ−Δ=Δ coscos . (3)
The quasipartical energy was taken as in paper [1]:
[ ]1 0 0
2 3 0 0
4 5
1 (1 )cos (1 )cos2
1cos cos (1 )cos 2 (1 )cos 22
1 (cos 2 cos cos cos 2 ) cos 2 cos 22
k x x
x y x y
x y x y x y
t k k
t k k t k k
t k k k k t k k
ε δ δ
δ δ
= + + −
⎡ ⎤+ + + + − +⎣ ⎦
+ +
(4)
The entering parameters are ( in eV): 1 0.5881t = − , 2 0.1461t = , 3 0.0095t = − , , .
4 0.1298t = −
5 0.0069t =
The results of our calculation can be compared with the experimental data [2]. Calculated values of the gap at XΔ , 0x yk a k bπ= = and YΔ at 0, x yk a k b π= = are given by
13.9 meV
17.2 meVX x y s
Y x y s
Δ = −Δ −Δ + Δ ≅
Δ = Δ + Δ + Δ ≅
Their ratio ≅ΔΔ XY / 0.8 is in agreement with experimental observation by photoemission spectroscopy [2] and as well as by phase sensitive experiments [3] and Raman spectroscopy analysis [4]. Note that phone mediated part of interaction in ex. (2) dependent of oxygen mass
196

P R O C E E D I N G S
Fig.1. Fermi surface, μ =-0.11 eV
via cut (Debay) frequency Dω . Calculated isotope coefficient is in agreement with experimental data [5].
%3.0T/TΔ cc −=
Fig.2 Calculated density of states at 03.00δ = − . Vertical red line marks the position of chemical potential.
This work is partially supported by the Russian Foundation for Basic Research, Grant # 09-02-00777-a.
197

P R O C E E D I N G S
Fig.3. Temperature dependence of x (green), y (red) and sΔ ΔΔ (black). Jy = 68.5 meV, Jx = 1.1*Jy , Vo =0.8* Jy
References [1] P. Shnyder, D. Manske, C. Mudry and M. Sigrist. Phys. Rev. B 73, 224523 (2006)
[2] D. H. Lu, D. L. Feng, N. P. Armitage , et al., Phys. Rev. Lett., 86, 4370-4373 (2001)
[3] J. R. Kirtley, C. C. Tsuei, A. Ariando , et al., Nature Physics 2. 190-194 (2006)
[4] M. Bakr, A.P. Schnyder, L. Klam, et al. Phys. Rev. B 80, 064505 (2009)
[5] R. Khasanov, A. Shengelaya, K. Conder, et al., Phys. Rev. B 74, 064504 (2006)
198

P R O C E E D I N G S
Theory for the Gaussian component of the 63Cu nuclear spin-echo decay rate 1/T2G in La2-xSrxCuO4
T.F. Khafizov, I.A. Larionov
Kazan State University, Kremlevskaya, 18, Kazan 420008, Russia
e-mail: [email protected]
Abstract We report the calculations for the Gaussian component of the 63Cu nuclear spin-echo
decay rate 1/T2G employing the theory for spin susceptibility as derived within the t -J model starting from carrier free La2CuO4 and right up to optimally doped La2-xSrxCuO4. The theory reproduces the temperature and doping behaviour of the experimental data.
Introduction It has been firmly established soon after the discovery of superconductivity in layered
copper oxides that the parent, carrier free compounds, are the two dimensional S=1/2 Heisenberg antiferromagnetic (AF) insulators. The superconducting properties appear with doping δ , reaching a maximum Tc at 0.15δ ≈ charge carriers per plane copper site. The magnetic properties also undergo the dramatic changes: the AF long range order in the carrier free compound is lost upon doping, however, the AF short range order is still present and decreases with doping and temperature. In this paper we will discuss the evolution of AF order with doping and temperature and approve the expression for AF correlation length by comparison with the Gaussian component of the 63Cu nuclear spin-echo decay rate 1/T2G data. The measurements of the transverse relaxation rate 1/T2 in High Temperature Superconductors (high-Tc) provide important information concerning the static spin susceptibility χk , which is complementary to the information obtained from nuclear spin-lattice relaxation rate 1/T1 [1-3].
Basic relations The Gaussian component of the 63Cu nuclear spin-echo decay rate 1/T2G is given by [1],
2
63 2 2 22 2 4
0,691 ( ) ( ) 8G
B
T F Fχ χμ
−⎧ ⎫⎡ ⎤⎪ ⎪= −⎨ ⎬⎢ ⎥⎣ ⎦⎪ ⎪⎩ ⎭∑ ∑k k
k k
k k , (1)
where 2( ) [ 4 ]cF A Bγ= + kk is the hyperfine form-factor, with eV being the direct, on-site coupling of the 63Cu nuclei to the Cu2+ spins, and
717 25 10cA −= − . ⋅7(1 2.75 ) 3 37 10B δ −= + ⋅ . ⋅ eV
is the strength of the transferred hyperfine coupling of the Cu2+ nuclear spin to the four nearest neighbour (NN) copper spins [2]. The factor 0.691 comes from the natural abundance of 63Cu nucleus, (1 2)(cos cos )x yk kγ = / +k , and Bμ is the Bohr magneton. Note that Eq. (1) assumes that the nuclear spins over the entire spectrum are flipped by the π pulse, a condition that is not satisfied in La2-xSrxCuO4 [3]. Since Аc and В constants do not depend on T, the temperature dependence of 1/T2G is fully described by the static spin susceptibility χk .
The static spin susceptibility as derived by Zavidonov and Brinkmann [4],
199

P R O C E E D I N G S
)(
||4 1
kk γ
χ+
=+− gJgc , (2)
has the same structure as in the isotropic spin-wave theory [5] at all doping levels. The parameter is related to antiferromagnetic correlation length g+ ξ via the expression
12 1g
ξ+
=−
, (3)
0 12J = . eV is the NN AF coupling constant, the spin-spin correlation function is given by
1 (1/ 4) z zi ic S ρρ += ∑ S , and the index ρ runs over NN. The values of the parameters of the
theory: c1 and g_ are given in Table I.
According to [4], the temperature and concentration dependence of the correlation length ξ is given by
_1
1
[1 exp( / )]exp(2 / )B s
J gk T k Tξ θ π
θ= − − Bρ , (4)
where Sρ is spin stiffness, which value is given in the Table I,
2 2 2 21
1 121 12 2 2
11 1
32 (1 ) ( 1 ) 12
(1/ 1 )
hefft K f
d JK
γδ γ γ ω ωθ γ
π γ ω ω−
+ − += ×
+ +∫ v− , (5)
2 21
1 11 2 2 2
11 1
8 (1 ) ( 1 ) 1
(1/ 1 )
hefft K f
v dK
γδ γ γ ω ωγ
π γ ω ω−
+ − += ×
+ +∫ , (6)
where δ is the number of extra holes, due to doping, per one plane Cu , which can be identified with the Sr content
2+
x in La 2 x− Sr x CuO , K(x) is a complete elliptic integral, 4
1 1 / 4 (1 )tω ω= +δ , and 1 2 Bk Tω π= . The hopping integral, t , between NN describes the motion of electrons causing a change in their spins and is the Fermi function of holes. The excitation spectrum of holes is given by,
1[exp( ) 1]hE Bf E k Tμ −= − + / +
k k
4 effE t γ=k ,k where the hoppings, , are affected by electronic and AF spin-spin correlations , resulting in effective values, for which we set
t 1c0 2efft Jδ= / . [6,7], in order to match the insulator-metal transition.
The chemical potential μ is related to δ by hEp fδ = ∑ k
k, where (1 ) / 2p δ= + .
For smallδ , one finds Tδθ ~1 and the expression (4) smoothly approaches the result for the Heisenberg antiferromagnet, i.e.:
_~ exp(2 / )s BB
J gk T
k Tξ πρ . (7)
One should note that in the carrier free regime the derivation of ξ has been performed from exponential decay of the spin-spin correlation function at large separations, and at finite doping it can be derived from expansion of the static spin susceptibility around the AF wave vector Q=(π,π), yielding the same expression as that given by Eq. (3).
Before plotting 1/T2G as a function of T we should pay attention to the fact that the correlation length diverges at T=0, even in doped compounds, which is in contrast with experimental data [11,12]. This disagreement is supposed to be connected with the Kondo-Yamaji [13] decoupling procedure used for the derivation of the susceptibility, which,
200

P R O C E E D I N G S
probably, overestimates the role of AF correlations at low temperatures. Thus to avoid the divergence we replace ξ by effξ , which is given by:
, (8) 110
1 −−− += ξξξeff
where a fair agreement with neutron scattering (NS) data [11,12] is obtained with . δξ /10 =
Table I. The calculated in the T→ 0 limit antiferromagnetic spin-spin correlation function between the nearest neighbours c1, the parameter g_, and the spin stiffness constant Sρ .
Doping 1c g− 2 /s Jπρ 0δ = - 0.1152 4,4148 0,38 0,12δ = - 0,0758 3,252 0,20 0,15δ = - 0,0617 2,947 0,13
Comparison with experiment and discussion Fig.1 and Fig.2 show the calculated temperature and doping dependencies of the Gaussian component of the 63Cu nuclear spin-echo decay rate 1/T2G without any adjustable parameters. We found that 1/T2G increases monotonously with decreasing temperature in agreement with experimental data [3,9,10]. It is seen that the 1/T2G temperature dependence is similar in both carrier free and doped La2-xSrxCuO4, opposite to plane copper 1/T1, which shows a wide peak at temperatures around 150 K and at moderate doping.
Fig.1. Temperature dependence of the Gaussian component of the 63Cu nuclear spin-echo decay rate 1/T2G for carrier free La2CuO4 from Ref. [9] (circles) and Ref. [10] (triangles).
Solid line shows the results of the calculation.
Conclusion
We have calculated the temperature and doping dependence of the Gaussian component of the 63Cu nuclear spin-echo decay rate 1/T2G taking into account the temperature and doping behaviour of the AF correlation length. In the carrier free and doped cases we obtain a fair
201

P R O C E E D I N G S
agreement with the experimental data in a wide temperature and doping range.
Fig.2. Temperature dependence of the Gaussian component of the 63Cu nuclear spin-echo decay rate 1/T2G for doped La2-xSrxCuO4 from Ref. [3]. Solid lines show the results of the
calculations.
References [1] D. Thelen and D. Pines, Phys. Rev. B 49, 3528 (1994); M. Takigawa, Phys. Rev. B 49,
4158 (1994). [2] A. J. Millis, H. Monien, and D. Pines, Phys. Rev. B 42, 167 (1990); Y. Zha, V. Barzykin,
and D. Pines, Phys. Rev. B 54, 7561 (1996). [3] S. Fujiyama, M. Takigawa, Y. Ueda, T. Suzuki and N. Yamada, Phys. Rev. B 60, 9801
(1999). [4] A. Yu. Zavidonov and D. Brinkmann, Phys. Rev. B 58, 12486 (1998). [5] A. Sokol, R. R. P. Singh, and N. Elstner, Phys. Rev. Lett. 76, 4416 (1996). [6] P. W. Anderson, Science 235, 1196 (1987); G. Baskaran, Z. Zou, and P. W. Anderson,
Solid State Commun. 63, 973 (1987). [7] I. A. Larionov, Phys. Rev. B 69, 214525 (2004). [8] M. E. Fisher, Rep. Prog. Phys. 30, 615 (1967). [9] T. Imai, C. P. Slichter, K. Yoshimura, M.Kato, and K. Kosuge, Phys. Rev. Lett. 71, 1254
(1993). [10] M. Matsumura, H. Yasuoka, Y. Ueda, H. Yamagata, and Y. Itoh, J. Phys. Soc. Jpn. 63,
4331 (1994). [11] M. A. Kastner, R. J. Birgeneau, G. Shirane, and Y. Endoh, Rev. Mod. Phys. 70, 897
(1998). [12] G. Aeppli, T. E. Mason, S. M. Hayden, H. A. Mook, and J. Kulda, Science 278, 1432
(1997). [13] J. Kondo and K. Yamaji, Prog. Theor. Phys. 47, 807 (1972).
202

P R O C E E D I N G S
Calculation of ZnO nanoparticles size distribution based on EPR line shape analysis
Yu.S. Kutin1), G.V. Mamin1), S.B. Orlinskii1), N.I. Silkin1), M.A. Volodin1), J. Schmidt2),
P.G. Baranov3), Celso de Mello Donega4), Andries Meijerink4)
1) Kazan State University, 420008, Kremlyovskaya St.18, Kazan, Russian Federation.
2) Department of Physics, Huygens Laboratory, Leiden University, Leiden, The Netherlands.
3) A.F. Ioffe Physico-Technical Institute, St. Petersburg, Russia.
4) Debye Instiiute, Utrecht University, Utrecht, The Netherlands.
e-mail: [email protected]
In recent years zinc oxide has attracted a lot of attention as a promising material for UV light-emitting diodes and diode lasers due to its wide direct bandgap of 3.4 eV. However, development of optical devices based on ZnO requires ability to grow both n- and p-type materials of high quality. ZnO can easily be doped n-type, even nominally undoped ZnO crystals show n-type conductivity. On the other hand, p-type conductivity is hard to achieve. It has been suggested [1] and later experimentally proven [2] (by means of High-Frequency EPR and ENDOR spectroscopy) that this behavior is caused by the presence of hydrogen, which prefers interstitial sites over substitutional ones in ZnO and becomes a shallow donor.
Similar effects may be expected after introduction of other group-I elements in ZnO. In particular, Li and Na were predicted [3] to prefer interstitial sites and form shallow donors as well.
Extension of the wave function of the shallow donor in ZnO is rather significant. Effective Bohr radius of the shallow donor 1s-type wave function obtained from the effective mass theory [2] is about one and a half nanometers:
0*
/ 1.5/d B
e
r rm m
nmε ε= ⋅ , (1)
where 8.65ε = is the dielectric constant of ZnO, is the polaron mass in ZnO, and is the Bohr radius. When a shallow donor is introduced into a ZnO
nanoparticle of a size comparable to the effective Bohr radius, effects of quantum confinement of the shallow-donor wave function can be studied experimentally.
* 0.3 em = m
m
0.053 nmBr =
Li-doped ZnO nanoparticles have been studied in great detail by means of High-Frequency EPR spectroscopy at 95 GHz [4]. It was found that position of the EPR line corresponding to the shallow donor electron is dependent on the size of ZnO nanocrystals.
This dependence is illustrated in Fig.1. Even small changes in the size of the nanocrystals result in significant shifts of the EPR line (due to enhanced spectral resolution of High-Frequency EPR) thus making EPR spectroscopy a highly sensitive tool for studying nanoparticles. Dependence of the g-factor of the shallow donor on the size of ZnO nanoparticles is shown in Fig.2.
The g-factor of the shallow donor in ZnO nanoparticles increases towards the free electron value ( ) when decreasing the size of the nanoparticles. This effect occurs due to quantum confinement of the shallow donor electron wave function when its effective Bohr radius becomes comparable to the dimensions of the nanoparticles. Confinement causes an increase in the bandgap and, consequently, reduces admixture of valence-band states and higher-lying conduction bands [4, 5].
2eg
1.5dr n=
203

P R O C E E D I N G S
The average nanocrystal radii can be measured by X-ray powder diffraction, based on the peak broadening due to the finite crystallite sizes (Scherrer’s equation). However, sensitivity of the X-ray method decreases when increasing size of the nanoparticles.
3,43 3,44 3,45 3,46 3,47 3,48
Echo
Inte
nsity
, arb
. uni
tss
1.73nm
1.36nm
1.17nm
2,2nm
3 nm
B0, T
Fig1. Position of the EPR line corresponding to the shallow donor in ZnO nanocrystals is strongly
correlated with the size of the nanocrystals.
It has been shown that this dependence can be used to determine the average particle size in the sample from the EPR line position. Our goal was to develop a method that would allow us to derive ZnO nanoparticles size distribution in the sample from the EPR line shape.
A shape of the shallow donor EPR line of a ZnO nanoparticle sample is determined by two factors. First, nanoparticles compose a powdered sample with all possible orientations of the individual nanocrystal axes with respect to direction of the constant magnetic field being equally probable. Second, a value of the shallow donor g-factor is dependent on the size of an individual nanoparticle. Both of these factors should be taken into account when performing a computer simulation of the EPR line shape and it’s the second factor that makes it possible to
calculate a particle size distribution.
1,0 1,5 2,0 2,5 3,0 3,51,955
1,960
1,965
1,970
1,975 Experimental Exponential Fit
g-fa
ctor
r, nm
Fig.2. g-factor of the shallow donor as a function of ZnO nanoparticles size.
First, let us consider the powdered nature of the sample. Zinc oxide has a wurtzite structure with an axial symmetry. The shallow donor g-tensor values are and
. A line shape corresponding to particles of a single, fixed orientation will have the Lorentz form:
1.956g⊥ =1.957g =
( ) max
2 2max
3 132 ( )4
LHf H
H Hπ⋅Δ
= ⋅Δ +
, (2)
where is a peak-to-peak linewidth, experimentally measured [2] and equal to 0.4 mT. This expression should be multiplied by a factor that will take into account the fact that an EPR transition probability is also a function of a particle orientation:
maxHΔ
204
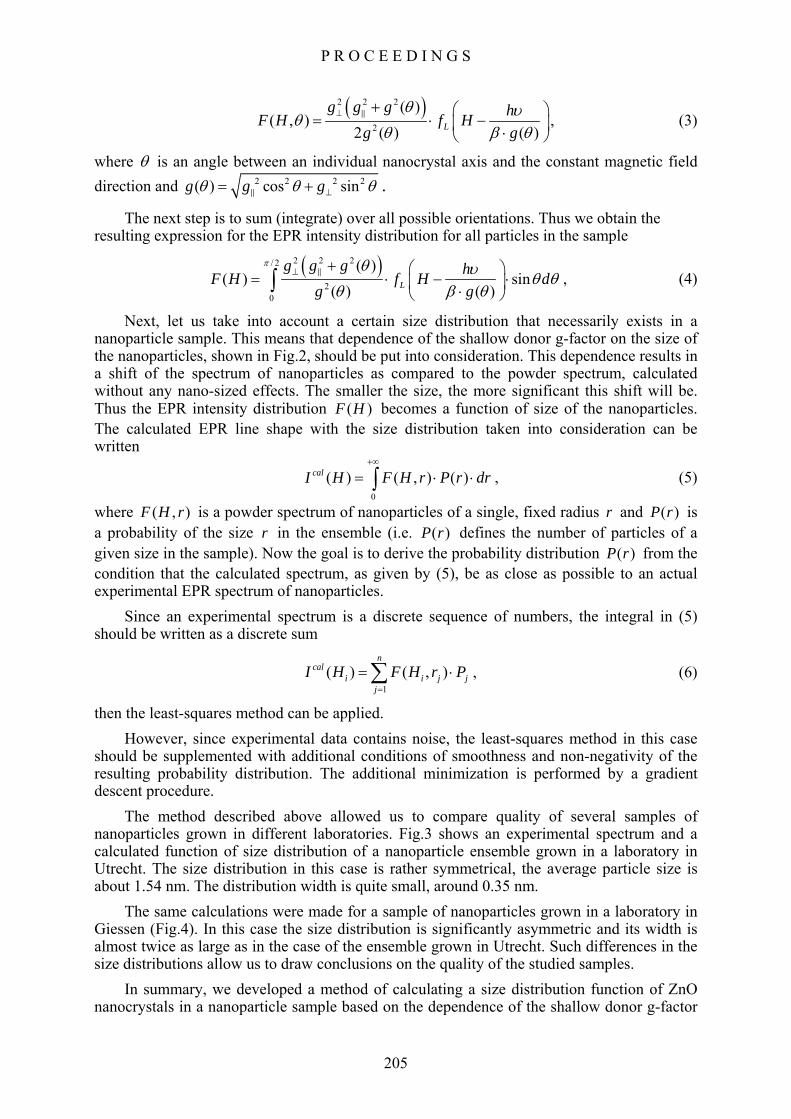
P R O C E E D I N G S
( )2 2 2
2
( )( , )
2 ( ) ( )L
g g g hF H f Hg g
θ υθθ β θ
⊥ + ⎛= ⋅ −⎜ ⋅⎝ ⎠
⎞⎟ , (3)
where θ is an angle between an individual nanocrystal axis and the constant magnetic field direction and 2 2 2 2( ) cos sing g gθ θ θ⊥= + .
The next step is to sum (integrate) over all possible orientations. Thus we obtain the resulting expression for the EPR intensity distribution for all particles in the sample
( )2 2 2/ 2
20
( )( ) sin
( ) ( )L
g g g hF H f Hg g
π θ υ dθ θθ β θ
⊥ + ⎛ ⎞= ⋅ −⎜ ⎟⋅⎝ ⎠∫ ⋅ , (4)
Next, let us take into account a certain size distribution that necessarily exists in a nanoparticle sample. This means that dependence of the shallow donor g-factor on the size of the nanoparticles, shown in Fig.2, should be put into consideration. This dependence results in a shift of the spectrum of nanoparticles as compared to the powder spectrum, calculated without any nano-sized effects. The smaller the size, the more significant this shift will be. Thus the EPR intensity distribution becomes a function of size of the nanoparticles. The calculated EPR line shape with the size distribution taken into consideration can be written
( )F H
0
( ) ( , ) ( )calI H F H r P r d+∞
r= ⋅ ⋅∫ , (5)
where is a powder spectrum of nanoparticles of a single, fixed radius and is a probability of the size in the ensemble (i.e. defines the number of particles of a given size in the sample). Now the goal is to derive the probability distribution from the condition that the calculated spectrum, as given by (5), be as close as possible to an actual experimental EPR spectrum of nanoparticles.
( , )F H r r ( )P rr ( )P r
( )P r
Since an experimental spectrum is a discrete sequence of numbers, the integral in (5) should be written as a discrete sum
1
( ) ( , )n
cali i j
jjI H F H r
=
P= ⋅∑ , (6)
then the least-squares method can be applied. However, since experimental data contains noise, the least-squares method in this case
should be supplemented with additional conditions of smoothness and non-negativity of the resulting probability distribution. The additional minimization is performed by a gradient descent procedure.
The method described above allowed us to compare quality of several samples of nanoparticles grown in different laboratories. Fig.3 shows an experimental spectrum and a calculated function of size distribution of a nanoparticle ensemble grown in a laboratory in Utrecht. The size distribution in this case is rather symmetrical, the average particle size is about 1.54 nm. The distribution width is quite small, around 0.35 nm.
The same calculations were made for a sample of nanoparticles grown in a laboratory in Giessen (Fig.4). In this case the size distribution is significantly asymmetric and its width is almost twice as large as in the case of the ensemble grown in Utrecht. Such differences in the size distributions allow us to draw conclusions on the quality of the studied samples.
In summary, we developed a method of calculating a size distribution function of ZnO nanocrystals in a nanoparticle sample based on the dependence of the shallow donor g-factor
205

P R O C E E D I N G S
3,43 3,44 3,45 3,46
EP
R in
tens
ity, a
rb. u
nits
H, T
0,8 1,2 1,6 2,00,0
0,2
0,4
0,6
0,8
1,0
r, nm
P(r)
(nor
mal
ized
) 0 1.540.35
r nmr nm=
Δ =a b
Fig.3. An EPR spectrum (a) and a calculated function of size distribution (b) of a sample of nanoparticles grown in a laboratory in Utrecht.
3,44 3,45 3,46 3,47
EPR
inte
nsity
, arb
. uni
ts
H, T
1,2 1,6 2,0 2,4 2,8 3,20,0
0,2
0,4
0,6
0,8
1,0
r, nm
P(r)
(nor
mal
ized
) 0 2.080.69
r nr n
mm
=
Δ =b a
Fig.4. An EPR spectrum (a) and a calculated function of size distribution (b) of a sample of nanoparticles grown in a laboratory in Giessen.
on the size of the nanocrystals. This dependence is caused by quantum confinement of the shallow donor wave function that occurs when its effective Bohr radius is comparable to the size of the nanocrystals. We used this method to perform a comparative analysis of several nanoparticle samples grown in different laboratories to show that it can be used to control the quality of produced nanoparticles.
Acknowledgements This work is partly supported by the Grant RNP-6183 from the MSE of Russia and the
Ministry of Education of the Russian Foundation (project DZN-09-16)
References [1] C.G. Van deWalle, Phys. Rev. Lett. 85, 1012 (2000). [2] D.M. Hofmann, A. Hofstaetter, F. Leiter, H. Zhou, F. Henecker, B. K. Meyer, S. B.
Orlinskii, J. Schmidt, and P.G. Baranov, Phys. Rev. Lett. 88, 045504 (2002). [3] C. H. Park, S. B. Zhang, and S.-H.Wei, Phys. Rev. B 66, 073202 (2002). [4] S. B. Orlinskii, J. Schmidt, P. G. Baranov, D. M. Hofmann, C. de Mello Donegá, and A.
Meijerink, Phys. Rev. Lett. 92, 047603 (2004). [5] Serguei B. Orlinskii, Jan Schmidt, Pavel G. Baranov, Volker Lorrmann, Ingo Riedel,
Daniel Rauh, Vladimir Dyakonov, Phys. Rev. B 77, 115334 (2008).
206

P R O C E E D I N G S
EPR of lead doped hydroxyapatite nanocrystals
B.V. Yavkin1), E.S. Kovaleva2), G.V. Mamin1), S.B. Orlinskii1), V.I. Putlaev2), A.A. Rodionov1), N.I. Silkin1)
1) Kazan State University, 420008 Kazan, Russia
2) Moscow State University, 119991 Moscow, Russia
e-mail: [email protected]
Introduction One of the most important ways in contemporary nonorganic materials science is the
development of calcium-phosphate-based biomaterials. Hydroxyapatite Ca10(PO4)6(OH)2 (HAp) is widely used in medicine due to its phase and chemical resemblance to nonorganic bone compound [1,2]. One of the most interesting properties of HAp is the ability to exchange ions for various outer cations and anions. It may be useful to remove harmful ions from water [3]. Recently was elucidated that HAp has properties that allow to sorb heavy metals and radioactive nuclides [4].
The main object of the investigation presented in this article is lead doped HAp nanocrystals, Ca9Pb(PO4)6(OH)2. The aim of the investigation is to obtain the spectroscopic characteristics of paramagnetic Pb3+ complexes inside hydroxyapatite nanocrystals.
Materials and methods HAp nanocrystals were grown from oversaturated solution on Faculty of Materials
Science in MSU [2]. Sizes of the nanocrystals (≈20 nm) were evaluated by X – ray diffraction method.
CW – EPR experiments were performed on Bruker ESP – 300 X – band spectrometer. Pulse EPR experiments were performed on Bruker Elexsys 680 W – band spectrometer. Experiments were carried out in various temperatures ranging from 20K to 300K. Pb3+ paramagnetic complexes were formed by X-ray source (URS – 55; U = 55kV, I = 16mA, W – anticathode) at room and liquid nitrogen temperatures. EPR spectra were obtained before and after the irradiation.
Results and discussion There are no EPR signals before irradiation. After irradiation there are two groups of
lines on X – band spectrum (see Fig.1): one at magnetic field of 0,35T, which contains the signal from even lead isotopes and other at magnetic field of 0,55T interpreted as signal from 207Pb isotope. On W – band EPR absorption spectrum was detected by intensity of 2-pulse echo. There are three groups of lines (see Fig.2). Central group are placed at magnetic field of 3,3T and two of others are placed approximately symmetrically in relation to central. Groups in low and high filed interpreted as 207Pb3+ signal comprises three types of paramagnetic centers, denoted on Fig.2 and central line contains signal from even lead isotopes.
We suggested that two spectral lines are isotropic, and considered spin system with S = ½ and I = ½ corresponding to 207Pb isotope approximately 21% natural abundance with 6s1 external electron configuration. So we used Hamiltonian from Breit – Rabi problem [5] to fit the data:
H g Aβ= +BS S I (1)
207

P R O C E E D I N G S
Fig.1. EPR spectrum of nanocrystals on 9.78 GHz. T = 77K
Energy levels of such system (depending on quantum number F = S + I and its projection mF)
Fig.2. EPR spectrum of nanocrystals on 94 GHz. T = 20K
( )1
2 2
, 1 24 2F FA A g B g BE F m m
A Aβ β⎡ ⎤⎛ ⎞= − ± + +⎢ ⎥⎜ ⎟
⎝ ⎠⎢ ⎥⎣ ⎦ (2)
Now we building the system of equations (2) and solve its relative to A and g – factor. For A = 25 GHz and g = 2 energy levels from (2) are shown in Fig.3 and Fig.4.
One can see from Fig.3 that the second EPR line of 207Pb3+ ion is reside on field approximately 1,7T, which is not reachable on our X – band spectrometer. On the contrary, in
208

P R O C E E D I N G S
W – band (Fig.4) all transfers are reachable and estimation of spectroscopic characteristics is easy. Calculated parameters are shown in Table 1.
Table 1. Pb3+ paramagnetic complex’s HFS constant and g – factor.
Center type A, CHz g
type I 25,21±0,11 1,981±0,001
type II 37,72±0,11 1,976±0,001
type III 35,81±0,11 2,001±0,001
Fig.3. Breit – Rabi diagram of Pb3+ energy levels. Resonance transfers on 9.78 GHz are denoted by arrows
Fig.4. Breit – Rabi diagram of Pb3+ energy levels. Resonance transfers on 94 GHz are denoted by arrows.
209

P R O C E E D I N G S
Conclusion We measured spectroscopic characteristics of Pb3+ paramagnetic centers in lead doped
HAp. Three types of centers were found with substantial differ hyperfine structure and g – factor.
Acknowledgments The work is partly supported by the Grant RNP – 6183 from the MSE of Russia and the
Grant RFBI 09-02-97017.
References [1] Putlaev, V. I. Sovremennie bioceramicheskie materiali / V. I. Putlaev. // Sorosovskii
obrazovatelnii gurnal. - 2004 - 1 : T. 8
[2] Biorezorbiruemie poroshkovie materiali na osnove Ca10-xNax(PO4)6-x(CO3)x(OH)2 : otchet o NIR / E. S. Kovaleva. - Moskva :, 2008.
[3] K.Matsunaga, H. Inamori, H. Murata. Phys. Rev. B 78, 094101 (2008).
[4] Chrestenko, R. V. Vzaimodeistvie nanogidroxiapatita kalcia s uranil – ionom / R. V. Chrestenko, V. N. Rudin, S. N. Kalmikov, I. V. Melixov // Vestnik Nigegorodskogo universiteta im. N. I. Lobachevskogo – 2008 – 5, s 52 – 57
[5] Breit C., Rabi J.J. Phys. Rev. V 38, 2082 (1931).
210

P R O C E E D I N G S
Application ESEEM to study free radicals in disordered systems
R.B. Zaripov1), R.M. Aminova2), K.M. Salikhov1), G.N. Konygin3), G.G. Gumarov1)
1) Zavoisky Physical -Technical Institute, 420029, 10/7 Sibirsky tract, Kazan, Russia
2) Kazan State University, 420008, 18 Kremlyovskaya St., Kazan, Russia
3) Physical-Technical Institute Ural Branch of RAS, 426000, 132 Kirov Str., Izhevsk, Russia
e-mail: [email protected]
Introduction. It is shown that pulse electron paramagnetic resonance is an effective instrument to study
paramagnetic particles, in particular free radicals. One of informative radio spectroscopy methods is a pulse protocol of the observation of the electron spin echo modulation (ESEEM) which enables one to obtain unique information about structure of a radical, its environment and nature of the paramagnetic center [1].
We studied calcium gluconate subjected to mechanochemical treatment. For the first time mechano-activated calcium gluconate was obtained in the Izhevsk Physical-Technical Institute of the Ural Branch of the Russian Academy of Sciences [2]. In reference 3 it was shown the mechanochemical treatment of calcium gluconate increases considerably it therapeutic efficacy when treating calcium deficient diseases. It is supposed that the increase in the assimilability of mechano-activated calcium gluconate is due to the formation of free radical paramagnetic centers [4]. Mechanochemical treatment results in the appearance of free radicals. In this paper we attempt to establish the structure of these radicals on the basis of electron spin echo envelope modulation (ESEEM).
In parallel, we calculated the distribution of electron spin density in several hypothetical radical structures by means of the density functional theory (DFT). By analyzing these data one can determine the preferable radical structure. We hope that further it will help to establish the mechanism of reaction responsible for the mechanochemical activation of calcium gluconate.
Theoretical aspects of ESEEM It is known [5] that anisotropic hyperfine interaction (HFI) with magnetic nuclei results
in the ESEEM effect. Usually, in EPR experiments the external magnetic field considerably exceeds the local HFI field. In this situation the spin Hamiltonian H0 can be approximated as
0 0 0
3 2[(3cos 1) 3cos sin ] ,
z n n zi i zi zi i
n n i i zi i i xi zi
H g B S g B I a I S
gg r I I S
β β
ββ θ θ θ−
= − + +
+ − +
∑ ∑
∑ (1)
where ai is the constant of the isotropic HFI of the unpaired electron with the i-th nucleus, ri is the distance to the i-th nucleus, θi is the angle between В0 and ri vectors, Sz is the operator of the projection of the electron spin onto the direction of the magnetic field В0, Iz and Ix are operators of the projection of nuclear spins. The last term in the spin Hamiltonian (1) is responsible for the appearance of the so-called forbidden lines in the EPR spectrum. Due to the terms of the SzIx type EPR transitions with the simultaneous change in the orientation of the nuclear spins become possible along with the allowed EPR transitions with the conservation of the orientation of the nuclear spins.
211

P R O C E E D I N G S
If microwave (mw) pulses forming electron spin echo (ESE) signals excite both allowed and forbidden EPR transitions, there appears coherence in the state of nuclear spins. As a result, the envelope of the ESE signal decay shows the modulation effect. We study free radicals in calcium gluconate and ESE modulation is due to the HFI with protons with spin I=1/2. Therefore we present main results of the ESEEM effect for the HFI of the unpaired electron (S=1/2) with a proton. In this case the ESEEM of the primary echo is described by [6]
( ) 1 [1 cos( )][1 cos( )]2kV α βτ ω τ ω τ= − − − , (2)
where 2 2 2 2 2 20
23 3
, ( ) ( ) , ( ) ( ) ,2 2 2 2
( )(3cos 1) , ( )3cos sin ,
n nn n n
n n n n n n
g B A B A B
gg gg ggA a Br r
α β
3 .Tr
βω ω ω ω ω
ββ ββθ θ θ
= = − + = + +
= − + = =ββ
The parameter k characterizing the modulation amplitude is proportional to the product of the
intensities of the forbidden and allowed EPR lines and is equal to 2
nBkα β
ωω ω⎛ ⎞
= ⎜⎜⎝ ⎠
⎟⎟ . Equation (2)
shows that the primary ESE manifests ESEEM at the nuclear magnetic resonance (NMR) frequencies of the radical ωα and ωβ, and also at the combination frequencies ωα+ωβ and ωα-ωβ.
Experimental data and discussion. At the Fig.1a it is shown echo-detected EPR spectrum of samples with the grinding time
of 60 minutes. The second momentum of EPR spectrum is equal to 2 114,7M = MHz2. Fig.1b shows Davies ENDOR spectrum. You can see that ENDOR spectrum consists two “shoulders” which divide spectrum on three parts with width 5.1 MHz, 2.2 MHz and 1MHz. Time domain ESEEM and modulus ESEEM spectrum are shown at Fig.1c and Fig.1d,
Fig.1 Experimental data of powder calcium gluconate with grinding time of 60 minutes: а) echo-detected EPR spectrum b) ENDOR spectrum c) ESEEM of primary echo d)
modulus ESEEM spectrum.
212

P R O C E E D I N G S
respectively. ESEEM spectrum consists two lines: the intensive line in the range of the proton Zeeman frequency 14.8 MHz and the weak line in the range of 30 MHz.
To obtain structure of free radicals one used ESEEM data as main, echo-detected EPR data and ENDOR data are used as additional criteria of parameter selection. One used several approaches.
As the first step, we used the model proposed in reference 7. According to reference 7, it is suggested to describe ESEEM as a result of the interaction with equivalent magnetic nuclei being at the same distance from the electron spin.
After simulation we consider that the approach [7] allows one to consistently describe experimental data. However assumption that all nuclei are equivalent and situate on the surface of a sphere with the given radius causes discomfort. Also several sets of the HFI parameters and numbers of nuclei give comparable results. Third, one does not obtain any information concerning structure of radical.
In the next step one calculated the geometry and structure of the number fragments of calcium gluconate by using methods of molecular mechanics, semi-empirical (PM3) and nonempirical methods of quantum chemistry. From knowledge of distance from i-th proton to radical centre and its spin density distribution we calculated HFI constants and simulated ESEEM spectra. At the Fig.2 are shown some calculated structures of free radicals.
Fig.2. Some quantum chemical calculated structures of radicals.
Then we calculated experimental data taken into account distant nuclei and without its (see Fig.3.). From that data one cannot obtain unambiguous result. Experimental data can be interpreted by the several radical structures: structure of the molecule of calcium gluconate without calcium atom (R1), structures with disrupted bound near the calcium atom (R2 and R4) (see Fig.2). It should be noted that structures of R2 and R4 are the structures almost same.
Conclusion Mechanochemical activation of calcium gluconate enhances it therapeutic efficiency.
Because biological activity mechano-activated calcium gluconate is associated with formation of free radical we suppose that the mechanoactivation is concatenated with gain of calcium
213

P R O C E E D I N G S
Fig.3. Experimental (solid line) and simulated (dotted line) modulus ESEEM spectra for radical structure of R4 а) taking into account interaction unpaired electron with own protons; б) taking into account interaction unpaired electron with own protons and additional interaction with 60 protons at the 0.5 nm far from paramagnetic center.
activity. Therefore we consider that the choice between two structures of radical R1 and R2 must be done to radical with structure R2.
Acknowledgements. We are very grateful to collective of the Izhevsk Physical-Technical Institute of the Ural
Branch of the Russian Academy of Sciences for the presented samples and useful discussion. The financial support of the grant NSh-4531.2008.2. is acknowledged.
References. [1] A.M., Zhidomirov, G.M., Salikhov, K.M.: Teor.Experim. Khim. 4, 514-519 (1968)
[2] Konygin, G.N., Strelkov, N.S., Tyulkin, E.P., Pozdeev, V.V., Maksimov, P.N., Filippov, Shishkin, S.B., Gilmutdinov, F.Z., Dorofeev, G.A., Elsukov, E.P.: // Патент РФ 2268053, 2004
[3] Konygin, G.N., Gilmutdinov, F.Z., Dorofeev, G.A., Strelkov, N.S., Tyulkin, E.P., Pozdeev, V.V., Maksimov, P.N., Filippov, A.N.: // Материалы конф. "Актуальные вопросы детской хирургии", Ижевск: Изд-во ИГМА, 2003.-С. 56-59.
[4] . Gumarov, G.G., Petukhov, V.Yu., Konygin, G.N., Rybin, D.S., Zheglov, E.P.:A57 Альманах клинической медицины т. XVII ч.2 М.: МОНИКИ -2008.-338с. ISBN 978-5-98511-033-3
[5] Lin, C.P., Bowman, M.K., Norris, J.R.: J. Chem.Phys., 85 (1), 56-72 (1986)
[6] Mims, W.B., Nassau, K., McGee, G.D.: Phys. Rev., 123, 2059-2069 (1961)
[7] Ichikawa, T., Kevan, L., Bowman, M.K., Dikanov, S.A., Tsvetkov, Yu.D.: J. Chem. Phys. 71 (3), 1167-1174 (1979)
214

P R O C E E D I N G S
Synthesis of PrF3 nanoparticles for researching cross relaxation in contact with 3He
E.M. Alakshin, A.V. Klochkov, S.L. Korableva, M.S. Tagirov
Physics Department, Kazan State University, Kazan, 420008 Russia
e-mail: [email protected]
Magnetic dipole interaction between the nuclear spins of liquid 3He and the nuclear spins of a solid substrate was discovered in 1981 between 3He and 19F nuclei in adsorbed 3He–polytetrafluoroethylene system [1]. It was shown that the dominant relaxation channel of the 19F nuclei is their dipole interaction with the 3He nuclei [1, 2]. More recently, the effect of magnetic coupling with the nuclei of liquid 3He was observed in several other systems [3–6].
The Van Vleck paramagnet–liquid 3He system is of special interest because of the possibility of using the magnetic coupling between the nuclei of the two spin systems for the dynamic nuclear polarization of liquid 3He [7]. The resonance interaction of 169Tm and 3He nuclei at the liquid 3He–thulium ethyl sulfate (TmES) Van Vleck paramagnet interface was observed in 1984 as a cross relaxation of the two nuclear spin systems [8]. However, thulium ethyl sulfate TmES (Tm(C2H5SO4)2· 9H2O) is a crystalline hydrate whose surface can be easily destroyed at evacuation, which leads to irreproducibility of the results. More recent experiments attempted to reveal the magnetic coupling of the 169Tm and 3He nuclei at the interface of the anhydrous single crystal or powder particles of the LiTmF4 Van Vleck paramagnet and liquid 3He. The detailed study of the mechanical and magnetic properties of LiTmF4 powders clearly showed that the properties of the crystal surface are of key importance for the magnetization transfer between the nuclei of the Van Vleck paramagnet and liquid 3He [9]. The surface area of powder samples is much larger than that of a single crystal; i.e., the use of powders in contact with liquid 3He seems preferable. However, it was found that the grinding of an LiTmF4 single crystal into a powder produces a surface covered with a grid of nanocavities with defect paramagnetic centers formed on the crack walls [9,10]. These centers induce inhomogeneous local magnetic fields on the 3He nuclei in a restricted geometry of nanocavities, which change the Larmor frequencies of 3He. Consequently, the difference in the Zeeman splittings of the nuclei of liquid 3He and the nuclei of surface Tm3+
ions being in contact with each other hinders the magnetization transfer between the two nuclear spin systems. Later, resonance magnetic coupling between the nuclei of liquid 3He and the 141Pr nuclei was investigated in a fine-dispersed powder of PrF3Van Vleck paramagnet with the grain size below 45µm[11]. It would be interesting to investigate PrF3 nanoparticles in contact with 3He. It is necessary to consider synthesis of PrF3 nanoparticles[12-15].
In a typical synthesis, 1.24 g praseodymium oxide (purity >99.0%) was dissolved in 80 ml of 10% nitric acid solution to form a transparent solution, then 0.95 g NaF (F:Pr=3:1,) was added into the above solution under violent stirring. The pH of the suspension was adjusted by ammonia to about 4.0–5.0. Deionized water was filled into the suspension to make the volume up to 150 ml. After stirring for about 20 min, the suspension was collected by centrifuge and washed several times using deionized water and absolute ethanol, then dried 24 h. We are going to realize a lot of different experiments, such as X-ray powder diffraction (XRD), transmission electron microscope (TEM), energy dispersive X-ray analysis (EDX), electron paramagnetic resonance (EPR) and researching cross relaxation effects in contact with 3He.
215

P R O C E E D I N G S
References [1] L. J. Friedman, P. J. Millet, and R. C. Richardson, Phys.Rev. Lett. 47, 1078 (1981).
[2] L. J. Friedman, T. J. Gramila, and R. C. Richardson, J. Low Temp. Phys. 55, 83 (1984).
[3] I. S. Solodovnikov and N. V. Zavaritskioe, Pis’ma Zh. Éksp. Teor. Fiz. 56, 165 (1992) [JETP Lett. 56, 162(1992)].
[4] I. S. Solodovnikov and N. V. Zavaritskioe, Zh. Éksp. Teor. Fiz. 106, 489 (1994) [JETP 79, 267 (1994)].
[5] R. W. Singerman, F. W. Van Keuls, and R. C. Richardson, Phys. Rev. Lett. 72, 2789 (1994).
[6] F. W. Van Keuls, R. W. Singerman, and R. C. Richardson, J. Low Temp. Phys. 96, 103 (1994).
[7] M. S. Tagirov and D. A. Tayurskioe, Pis’ma Zh. Éksp. Teor. Fiz. 61, 652 (1995) [JETP Lett. 61, 672 (1995)].
[8] A. V. Egorov, F. L. Aukhadeev, M. S. Tagirov, and M. A. Teplov, Pis’ma Zh. Éksp. Teor. Fiz. 39, 480 (1984) [JETP Lett. 39, 584 (1984)].
[9] A. V. Klochkov, V. V. Naletov, M. S. Tagirov, et al., Pis’ma Zh. Éksp. Teor. Fiz. 62, 567 (1995) [JETP Lett.62, 585 (1995)].
[10] A. V. Klochkov, S. P. Kurzin, I. R. Mukhamedshin, et al., Appl. Magn. Reson. 14, 525 (1998).
[11] A. V. Egorov, A. V. Klochkov, M. S. Tagirov, et al., Pis’ma Zh. Éksp. Teor. Fiz. 86, 480 (2007) [JETP Lett.86, 483 (2007)].
[12] L. Ma et al. / Materials Letters 61 (2007) 2765.
[13] Y.W. Zhang, X. Sun, R. Si, L.P. You, C.H. Yan, J. Am. Chem. Soc. 127 (2005) 3260.
[14] X. Wang, Y.D. Li, Angew. Chem., Int. Ed. 42 (2003) 3497.
[15] X. Wang, Y.D. Li, Chem. Eur. J. 9 (2003) 5627.
216

P R O C E E D I N G S
Determination of spin state of the paramagnetic clusters by electron spin echo envelope modulation
K.B. Konov, V.K. Voronkova, R.B. Zaripov
Zavoisky Physical -Technical Institute ( ZPhTI ), Sibirsky tract, 10/7, 420029, Kazan, Russia
email: [email protected]
Introduction In a number of cases it is important to know spin state of the paramagnetic sample. This
task can be solved by using pulse ESR spectroscopy. There is an interesting technique, called electron spin echo envelope modulation (ESEEM). Observing modulation of electron spin echo, we can determine frequency of magnetization vector nutation. After that we can determine spin state of the sample, using obtained nutation frequency. Using this technique we investigate spin state of a few paramagnetic samples. All of the experiments were realized on the FT-EPR Bruker spectrometer Elexsys E-580.
Echo-detected transient nutation In order to investigate spin state of the sample it is necessary to determine nutation
frequency. We can determine nutation frequency observing oscillation of amplitude of electron spin echo. Pulse sequence to observe oscillation of amplitude of electron spin echo is shown at Fig.1.
Fig.1. Three-pulse sequence for measurement of nutation frequencies.
As a result of this action we will observe oscillation of amplitude of electron spin echo, approximate shape of which is shown on Fig.2.
After that, using Fourier transformation, we receive nutation spectrum which is shown on Fig.3.
Fig.2. Simulated oscillations of the intensity of electron spin echo.
217

P R O C E E D I N G S
Fig.3. Nutation spectrum received after Fourier transformation of
oscillation shown on Fig.2.
From this picture we can determine nutation frequencies. After that we can find spin state of the samples, using equation
1 1
2( 1) ( 1) nut
s s
e
S S m mg B
π ν
β+ − + = , (1)
where B1 – amplitude of the microwave field, B0 – static magnetic field, νnut – nutation frequency, g – g-factor, β - Bohr magneton, - Planck's constant, ms – electron spin magnetic quantum number, S – electron spin quantum number.
Experimental part We investigated some samples, for example in this paper one show experimental data
only for [Nd2(α-Fur)6(H2O)2]n sample. At Fig.4 it is shown the structure of this sample. Neodymium’s spin is equal to ½. But also it is known that an exchange interaction in this
sample is taken place. Therefore total spin of this system must conceivably be equal to 1.
Fig.4. Structure of the [Nd2(α-Fur)6(H2O)2]n
218

P R O C E E D I N G S
According to experimental results (see Fig.5) and using equation 1 we obtained that the spin quantum number of the [Nd2(α-Fur)6(H2O)2]n is equal to 1 with good accuracy.
Fig.5. Nutation spectrum for [Nd2(α-Fur)6(H2O)2]n. B0=1600 Gs. B1=1,95 Gs.
Nutation frequency νnut =8.5 MHz. T=4 K.
Conclusion It is shown that the transient nutation technique can be applied to determine spin
quantum number of paramagnetic clusters. We are very grateful to Prodius D. and Turta K. for the given samples.
219

P R O C E E D I N G S
Observation of a phase separation in Paramagnetic Eu0.6La0.4-xSrxMnO3
K.R. Sharipov1), R.M. Eremina1), I.I. Fazlizhanov1), H.-A. Krug von Nidda2), Ya.M. Mukovskii3)
1) E.K. Zavoisky Physical-Technical Institute, 420029 Kazan, Russia
2) EP V, Center for Electronic Correlations and Magnetism, University of Augsburg, 86135 Augsburg, Germany
3) Moscow State Institute of Steel and Alloys (Technological University), 119049 Moscow, Russia
e-mail: [email protected]
Over the past few years, colossal magnetoresistive CMR materials have received special attention from academic and industrial researchers because of their exotic fundamental physicochemical properties as well as their technological potential in advanced applications. The in-depth investigations of the properties of CMR materials led to the discovery of many interesting physical phenomena such as charge and/or orbital ordering of the Mn3+ and Mn4+ ions for specific Mn3+/Mn4+ ratios and the relationship between structural distortions and enhanced magnetic properties. The transition from a paramagnetic insulating to a ferromagnetic metallic state in this material class is usually described within the framework of the double exchange mechanism proposed by Zener in which the mobile 3d eg electrons of the Mn3+ ions couple ferromagnetically to the core localized 3d t2g spins due to a strong Hund’s coupling [1].
In the hole- doped perovskite manganites, which are in written as Re1-xAexMnO3 (Re and Ae being rare-earth and alkaline-earth elements, respectively). The magnitude of the tilting of the MnO6 octahedra relevant to that of V is changed by the average ionic radius of the Re3+ and Ae2+ cations [rA=(1-x)rRe+xrAe)]. A decrease in rA leads to an increase in the tilting of MnO6 octahedra. The antiferromagnetic insulator LaMnO3 (TN=140 K) is an orbitally ordered system. The orbital order in LaMnO3 is induced by the cooperative Jahn-Teller JT effect of the Mn3+ ions electronic configuration 3d4: S=2 t2g
3 eg1, spin S=5/2), which at temperatures
T<TJT=750 K leads to a strong orthorhombic distortion of the perovskite structure. In the paramagnetic state, electron-spin resonance (ESR) reveals a single exchange-narrowed resonance line with a g value near 2.0 due to all Mn3+ ions and hence directly probes the spin of interest [2].
The consequent mismatch in the ionic size of ions occupying the Re site lead to a
distortion in the crystal structure described by a tolerance factor )(2
Re
OMn
O
rrrr
t+
+= , where rO
–is a radius of the oxygen ion, while <rA> and <rMn> are the average radii of Re and Mn ions, respectively. When t is close to 1, a cubic perovskite structure is realized; as t decreases, the lattice structure transforms first to rhombohedral (0.96<t<1) and then to orthorhombic (t<0.96) [3].
Early, in the paraphase of La1-xBaxMnO3 single crystals with 0.1≤x≤0.2 below 340K, signals of the ferromagnetic resonance are observed, which indicates the presence of magnetically ordered nanoscopic objects [4]. The region of existence of ferromagnetic clusters on the Ba density – temperature diagram has an approximate triangular shape, which is characteristic of the Griffiths phase. The investigations of the angular and frequency dependences of the position of the ferromagnetic resonance line that the nanostructures have a
220

P R O C E E D I N G S
spherical shape. The parameters of their magnetic anisotropy are found to be HA1=2500 Oe and HA2=-700 Oe. Additional lines that are observed in the EPR spectrum and whose intensity at room temperature is six orders of magnitude lower that the line at geff≈2 are of main interest. The effective g factors of signals at room temperature in low and high magnetic fields are estimated as 3.71 and 0.87 in the X band, respectively, and 2.29 and 1.56 in Q-band, respectively. The magnetic anisotropy of line position in the X and Q band does not change and is equal to about 6000 Oe.
The region of the existence of the Griffiths phase was determined in La1-xSrxMnO3 at temperatures below 270K and strontium concentration from 7.5 to 17.5%, where angular dependence of ferromagnetic signal resonance field have similar behavior as in La1-xBaxMnO3 [5].
The feature indicated above is of interest for synthesis of new materials with the Griffiths phase in a desired temperature range. The Griffiths theory was developed for diluted Ising ferromagnetic materials [6]. The ferromagnetic phase are formed in the paramagnetic phase below the so-called Griffiths temperature TG to the phase transition temperature TC in dependence on the disorder parameter p. The original paper Griffiths and subsequent work [7-11] has shown that this phase has several characteristics:
• The susceptibility deviates from the Curie-Weiss predictions as T→TC from above (at ТG ).
• This deviation takes the form of enhanced low field due to the contribution from the ferromagnetic clusters.The deviation is suppressed in large magnetic field due to polarization of spins outside the clusters.
• ТG – can be identified as TC (undiluted), i.e., the maximum ТС in the phase diagram [12].
We investigated the ceramics Eu0.6La0.4-xSrxMnO3 by EPR methods for Griffiths phase detection in concentration - temperature diagram.
The perovskite manganites Eu1-xSrxMnO3 are semiconductors although they exhibit ferromagnetic behavior around x=0.40. There is no evidence that charge ordering occurs. In an applied magnetic field of 15 kOe, however, the specimens with x=0.40 and 0.45 become the metallic conductors below their respective Curie temperatures of 75 K and 80 K. This magnetic field-induced insulator-to-metal transition leads a change in the resistivity exceeding 106 at 12 K. The transition is irreversible with respect to the magnetic field. The possibility of a field-induced phase transition having a lower symmetry than that at room temperature (orthorhombic) is in consideration [13].
The ESR measurements were performed at a Bruker ELEXSYS E500-CW spectrometer equipped with continuous-flow He cryostats (Oxford Instruments) at X band (9.4 GHz) and Q band (34 GHz) frequencies in the temperature range 4.2-300 K. In Fig.1, we show ESR spectra in Eu0.6La0.25Sr0.15MnO3 in the paramagnetic regime at 174K in Q-band. The spectra not only consist of a paramagnetic signal due to the majority of Mn3+ and Mn4+ spins [17] but also exhibit an intriguing ferromagnetic resonance signal at lower resonance fields. Fig.2 shows the temperature dependence of the EPR line position in X-band. The difference between the positions of the paramagnetic EPR signal and ferromagnetic signal in low fields is equal to 1000 Oe. The difference between the position of the ferromagnetic resonance line in low fields and paramagnetic resonance is independent of the microwave frequency at which the experiment is carried out and is equal to above 1000 Oe, as well as for La1-xSrxMnO3 and for La1-xBaxMnO3, Eu0.7Pb0.3MnO3 single crystals [4,5,14]. The effective g- factors of signals
221

P R O C E E D I N G S
are estimated from the relation hν=geffβHres as 3 in the X- band, and 2,4 in the Q-band. The s are typical for ferromagnetic resonance. These ferromagnetic resonance signals were observed in the paramagnetic regime above TC in single crystals with Sr concentrations x = 0.13, 0.15, 0.17, and 0.2. They all separate from the paramagnetic ignal below 270 K, indicating a temperature scale TG above TC which is almost independent of x.
The temperature dependences of intensity EPR and
above-listed features of the position of additional line
s
ferro
80 100 120 140 160 180 200 220 240 260 280 300 320
2000
3000
4000
5000
6000
7000
8000
9000
10000
11000
12000
13000
14000
15000
magnetic signals are presented in Fig.3 in X- and Q- band. Concomitantly, the intensity of the ferromagnetic signal (estimated via its peak-to-peak linewidth ΔHpp and its amplitude A as ΔH2
pp·A) first clearly increases and then decreases with decreasing
temperatures. The intensity values of ferromagnetic and paramagnetic signals are comparable with each other, but in La1-xBaxMnO3 and La1-xSrxMnO3 the intensity ferromagnetic signal to
0 2000 4000 6000 8000 10000
-2000
-1500
-1000
-500
0
500
1000
1500
Eu0.6La0.25Sr0.15MnO3
T=174KX- band
H (Э)
Signal
Fig.1 EPR spectra in Eu0.6La0.25Sr0.15MnO3.The spectra consist of a paramagnetic signal at geff≈2 and ferromagnetic signal a low resonance field at 174K in
X- band. The solid line is calculated according [1].
ν=34 GHz
ν=9,4 GHz
geff
~2,4
geff~3 1000 Oe
1000 Oe
Eu0.6La0.25Sr0.15MnO3
Hre
s(Oe)
T(K)Fig.2. Temperature dependence of the resonance fields in EPR spectrum of
Eu0.6La0.25Sr0.15MnO3 ceramic. The circles are ferromagnetic signal; the squares are line with geff≈2. Open symbols connect with Q-band, solid symbols – with X-band.
222

P R O C E E D I N G S
6 orders smaller as in paramagnetic signal. The behavior of paramagnetic signal intensity is near Curie-Weiss low. The curves of ferromagnetic intensity have maximum –144K and – 173K in X- and Q-band, respectively. This behavior is similar as ferromagnetic nana - particles. These samples can be used as natural material with phase separation for information record.
Having identified the new phase regime in low-doped Eu0.6La0.4-xSrxMnO3, we w
References et al., Phys.Rev.B 70, 224424 (2004)
008)
7202 (2005).
1).
8, 197203 (2002).
1485 (1999)
140 160 180 200 220 240 260 280 300
ill now discuss its interpretation in the context of quenched disorder as an enhanced GP becoming observable due to the competition of two ordering phases. The source of disorder is the random substitution of La3+ by ions with different size and valence, such as Eu3+ and Sr2+. The probability p(x) for the existence of a FM bond increases with x, because the increasing number of Mn3+-Mn4+ pairs enhances the double-exchange (DE) driven FM interaction. Because of the static Jahn-Teller (JT) distortion of the Mn3+ ions, the non-JT active Mn4+ ions and the FM bonds can be regarded as fixed
within the lattice (quenched disorder).
[1] N. Rama[2] Wanjum Jiang et al., Phys.Rev.B 77, 064424 (2[3] J. Deisenhofer, et al., Phys.Rev.B 65, 104440 (2002) [4] R.M. Eremina et al., Jetp Letters 85, 51 (2007) [5] J. Deisenhofer et al., Phys. Rev. Lett. 95, 25[6] R. B. Griffiths, Phys. Rev. Lett. 23, 17 (1969). [7] J. Burgy et al., Phys. Rev. Lett. 87, 277202 (200[8] E. Dagotto, New J. Phys. 7, 67 (2005). [9] M. B. Salamon et al., Phys. Rev. Lett. 8[10] J. M. de Teresa et al., Nature (London) 386, 256 (1997). [11] A. J. Bray, Phys. Rev. Lett. 59, 586 (1987). [12] C.He et al., Phys.Rev.B 76, 014401 (2007) [13] Shin Nakamura et al., J. Phys. Soc. Jpn. 68, [14] N.Volkov et al., Acta Phys.Pol.A 105, 69 (2004)
173K
ν=34GHz
La0.25Eu0.6Sr0.15MnO3
T(K)
144K
g~2 FM
ν=9.4GHz
La0.25Eu0.6Sr0.15MnO3In
tens
ity
194K
Fig.3. Temperature dependences of the EPR and ferromagnetic line intensity in
Eu0.6La0.25Sr0.15MnO3 ceramic. The circles are ferromagnetic signal; the
squares are line with geff≈2.
223

P R O C E E D I N G S
Investigation of some aminomethyl and acetyl derivatives of alkenylphenols by NMR spectroscopy
I.G. Mamedov1), M.R. Bayramov1), Y.V. Mamedova1), R.M. Abbasov2), A.M. Magerramov1)
1) Baku State University, Az-1148, Z.Khalilov 23, Baku, Azerbaijan.
2) Karadeniz Technical University, 61080, Department of Chemistry, Trabzon, Turkey
e-mail: [email protected]
Abstract
In the present work, formation of hydrogen bonds, inter- and intramolecular interactions in solution for the some aminomethyl and acetyl derivatives of alkenylphenols has been investigated. For studying hydrogen bonding investigations has been carried out at various concentrations in ССl4. For all compound (I-IV, VI, VII) has been calculated energy of intramolecular hydrogen bond by the 1H NMR, for the 2-allyl-6-dimethylaminomethyl-4-methylhenol (II) and for the model compound 2-hydroxy-5-methylacetophenon (VI) by the kvanto-chemical methods. Also has been investigated D2O solution 6-morpholiniummethyl-2-allylphenolchloride (VIII) by the 1H, 17O NMR spectroscopy at various concentrations.
Introduction
Molecules in solutions undergo fast thermal motions such as rotational reorientations, translational, various intramolecular motions or their combinations. Studying dynamics of various solutions by the NMR spectroscopy allows to investigate intramolecular and intermolecular interactions, formations of complexes, associate etc. Researches in these fields provide valuable experiment dates and can be used for obtaining information about molecular configurations, the rates, mechanisms of various chemical reactions, the formation of large molecular associates. Therefore the successes reached for last years at studying of molecular dynamics have the theoretical and practical significant [1-10].
Experimental part:
NMR experiments have been performed on BRUKER FT NMR spectrometer AVANCE 300 (300 for 1H, 75 for 13C and 40.69 MHz for 17O) with a BVT 3200 variable temperature unit in 5mm sample tubes using Bruker Standard software (TopSpin 3.0). Samples were investigated in ССl4 and D2O solution (some drops of acetone-d6 or an external standard for lock signal were used).
The energy of intramolecular hydrogen bond has been calculated by 1H NMR spectroscopy and the kvanto-chemical method PCM-MP2/6-311++G(p,d).
The purity and structure of compounds is confirmed by layer chromatography (Silufol UV-254), 1H, 13C and an other NMR experiments [11].
Discussion The alkenylphenols and their aminomethyl, acetyl derivatives are used at different
organic synthesis, as monomer stabilizers for polymerization, as corrosion inhibitor, as antimicrobial additive to oils and fuels, etc [12, 13]. In the content these compounds there is hydroxyl, carbonyl group, unsaturated bond, aromatic ring and nitrogen atom. Therefore the behaviour of such molecules in solution, formation and not formation molecular association represents theoretical and practical interest.
224

P R O C E E D I N G S
To investigate the hydrogen bonding and molecular dynamics we studied 2-allyl-6-dimethylaminomethyl- (I), 2-allyl-6-dimethylaminomethyl-4-methyl- (II), 2-allyl-6-morpho-linomethyl- (III), 2-allyl-4-methyl-6-morpholinomethylphenols (IV) by the NMR spectros-copy at various concentrations. In the 1H NMR spectrums for these compounds the signal hydroxyl groups accordingly is observed at 10.12, 10.04, 9.43 and 9.37 ppm. in their 5 % solution in CCl4. Concentration changes have only a weak influence on the hydroxyl chemical shift. These data confirm the formation of an intramolecular hydrogen bond in the compounds I-IV
OH
N OH
N
I II
OH
NO O
HN
O
III IV
Next, we investigated 2-propenylphenylacetate (V). The initial product 2-propenyl-phenol consists of difficultly divided mix of sis- (10%) and trans- (90%) isomers.
From the 1H NMR spectrum is revealed that the 2-propenylphenylacetate (V) also consists of mix 90% trans- (for CH3 group 3JH-H =6.41 Hz, 4JH-H =-1.82 Hz, for CH=CH fragment 3JH-H=15.61Hz) and 10% sis- (for CH3 group 3JH-H =7.37 Hz, 4JH-H =-1.36 Hz, for CH=CH fragment 3JH-H=12.63 Hz) isomers.
O O
o
V
H
H
CH3
o
H
H
CH3
With the vacuum distillations we have separate two isomers (Tbp. trans=960C, 3 mm. Hg; Tbp. sis=1050C, 3 mm. Hg).
We also investigate as model compound 2-hydroxy-5-methylacetophenon (VI) and product after Fries rearrangement 2-hydroxy-3-propenyl-acetophenone (VII). In the 1H spectrum the signal hydroxyl groups accordingly is observed at 12.10 and 12.74 ppm in its 5 % solution in CCl4.
OH
O OH
O
VI VII
On the basis 1H NMR spectrums for all compounds (I-IV, VI and VII) the intramolecular
hydrogen bond energies have been calculated [14] and accordingly is equal 6.23, 6.15, 5.54,
225

P R O C E E D I N G S
5.48, 8.21, 8.85±0.2 kcal/mol. From the results it becomes clear, the energy of intramolecular hydrogen bond strongly depends sort of replacement in the aromatic ring.
For the 2-allyl-6-dimethylaminomethyl-4-methylhenol (II) and for the model compound 2-hydroxy-5-methylacetophenon (VI) has been calculated energy of intramolecular hydrogen bond by the kvanto-chemical method (PCM-MP2/6-311++G(p,d) and accordingly is equal 6.41, 8.52 kcal/mol. Received results good agreement with 1H NMR data. Distance between N⋅⋅⋅H and O⋅⋅⋅H bond is equal 2.005 and 1.814Å.
1.814
2.005
A B
Next, we investigated D2O+H2O (97 and 3%) solution 6-morpholiniummethyl-2-allyl-phenolchloride (VIII) by the 1H, 17O NMR spectroscopy at various concentrations and the results are given in table.
-+OH
O
N ClH
VIII Table. Half-height line-width at various concentration for the compound VIII
Conc. % Δν1/2
1H, Hz Δν1/2
17O, Hz Conc. % Δν1/2
1H, Hz Δν1/2
17O, Hz
D2O+H2O 1.05 70 0.09 1.0 68
0.006 1.10 70 0.5 0.99 67
0.009 1.02 70 1.0 0.9 66
0.012 1.10 70 5.0 4.2 71
0.014 1.06 70 10.0 7.1 73
0.016 1.10 70 15.0 11 89
0.019 1.10 70
From the results it becomes clear, in the 0.006-0.019% concentration interval between the molecule water and the dissolved sample is not observed any interaction.
226

P R O C E E D I N G S
In the 0.09-1.0% concentration interval is observed interaction between the molecule wate
5].
Conclusions stigations confirm the formation of intramolecular hydrogen bonds in some
intram drogen bond by the H NMR and kvanto-chemical methods. Has been
ed that NMR spectroscopy method important for studying many
olecular Liquids, 2006, 125, 2,
[6]
R, V winter school-conference,
[11] Braun S., Kalinowski H.O., Berger S, 100 and more basic NMR experiments, VCH, 1996, 418 p
[12] Mageramov A.M., Bairamov M.R., Mekhtiyeva G.M., Agayeva M.A., Mamedova P.Sh., Kuliyeva D.M and Mamedov, Rus. J. Petrol. Chem., 2008, 48 (1), 63-66
[13] Mageramov A.M., Bairamov M.R., Mekhtiyeva G.M., Agayeva M.A., Mamedova P.Sh., Kuliyeva D.M and Mamedov I.G., Rus. J. Appl. Chem., 2007, 80 (4), 681-686
[14] Schaefer T, J. Phys. Chem., 1975, 79 (17) 1888-1890 [15] Kalabin Q.A., Kanitskaya L.V., Kyshnarev D.F. // Moscow, Ximiya, 2000, p. 382-386
r and the dissolved sample. As result of interaction, in the water matrix intermolecular hydrogen bond is weakened and half-height line-width is decreased.
As result of interaction in the 1.0-15.0% concentration interval intermolecular hydrogen bond in the water matrix is became stronger and half-height line-width is increased [1
Also were observed change the form of lines in the 1H NMR spectrum as result of inter- and intramolecular interaction in 1-15% concentration interval.
Our inveaminomethyl and acetyl derivatives (I-IV, VI, VII). Has been calculated energy of
olecular hy 1
investigated interaction between the molecule D2O and the dissolved sample (VIII).
Our results again confirmmolecular mobility in solution, have theoretical and practical significance in applications.
References: [1] Yoshida K., Kitajo A., Yamaguchi T. // Journal of M
p.158-163. [2] Kriger Y.G., Semenov A.R., Chekhov G. N. // Physics of hard matter, 2001, т.43, 1,
p. 1977-1979. [3] Pons M., Millet O. // Progress in NMR spectroscopy, 2001, в.38, 4, p. 267-324. [4] Goodnough J.A., Goodrich L., Farrar T.C. // J.Phys. Chem A,2007, v.111, 28, p.
6146-50. [5] Moscow V.V, SEJ, 1999, 2, p. 58-64
Sokolov N.D..Hydrogen bond, Moscow, 1981, 288 p. [7] Mamedov I.G., Maharramov A.M, Bairamov M.R, Rus. J..Phys. Chem, 2008, 82 (7),
p. 1382-1384[8] Mamedov I.G., Maharramov A.M, Bairamov M.R, Actual problems of magnetic
resonance and its application, Kazan, 23-28 September 2007, p. 165-167 [9] Mamedov I.G., Maharramov A.M, Bairamov M.R, IX international seminar on magnetic
resonance, Rostov-on-Don, 15-20 september 2008, p. 43 [10] Mamedov I.G., Maharramov A.M, Bairamov M.
magnetic resonance and its application, Sankt-Peterburg, 1-5 december 2008, p. 148-149
227

T A B L E O F C O N T E N T S
Table of Contents
Program……………………………………………………..…………………………… 3
Lecture notes..……………………………………………..…………………………….. 7
G.B. Teitelbaum, “NMR Zooming into the Properties of the Iron Based High Temperature Superconductors”………………………………….…………………… 7
V.A. Atsarkin, N. Noginova, “Multiple quantum transitions in nanoparticles: role of dipolar interactions”…………..………………………………………………. 8
V.I. Volkov, “Matrix ENDOR. Theory and Application for Ion-Exchange Systems”………………………………………………………..…………….………. 9
T.A. Vasilenko, A.K. Kirillov, A.N. Molchanov, G.A.Troitsky, G.V. Gusakov, “Potentiality of NMR spectroscopy for studying of pore structure in fossil coals”…... 10
S.B. Orlinskii, “Dynamic nuclear polarization by means of shallow donors in nanoparticles”…………………………………………………………………………. 11
F.S. Dzheparov, “Spin dynamics in magnetically diluted media”..……………….…. 12
A.V. Dooglav, “Dynamics and distribution of doped holes in the CuO2 plane of slightly doped YBa2Cu3O6 studied by Cu(1) QR”….……..………………………….. 22
E. Friese, A. Neumann, Yu. Rozentsvayg, “Modern compact EPR-spectrometers Х and L-band for wide application”…………………………………………………... 23
D.A. Tayurskii, “Non-extensive thermodynamics - a new approach to the strong correlated and nanoscopic systems”…………………………………….…………….. 25
I.R. Mukhamedshin, “NMR/NQR study of the Na2/3CoO2 compound”…………….. 26
Proceedings….................................................................................................................... 27
I.A. Larionov, “Theory for spin dynamics in copper oxide superconductors as obtained by Nuclear Quadrupole Resonance and Neutron Scattering”..……………… 27
G.V. Mamin, A.A. Rodionov, M.S. Tagirov, “The EPR investigations of the carbonizates”………………………………………………………..………………… 32
I.F. Ionenko, M.A. Suslov, “Temperature dependence of water diffusion through aquaporins of plant cells: spin-echo NMR study”…………………………………..… 36
E.I. Baibekov, “Calculations of phase memory times in CaWO4:Yb3+”………….…. 41
M.M. Bakirov, A. Sukhanov, A. Baniodeh, V. Voronkova, G. Novitchi, C.E. Anson, A.K. Powell, “EPR investigation of the spin-spin interaction in the Fe2Y2 cluster”…………………………………………………………………………. 45
L.K. Aminov, A.A. Ershova, S.L. Korableva, I.N. Kurkin, B.Z. Malkin, A.A. Rodionov, “Super-hyperfine structure (SHFS) of EPR spectra of U3+ ion in Van Vleck paramagnet LiTmF4”………..………………………………………….. 48
R.R.Gainov, A.V.Dooglav, I.N.Pen’kov, A.Yu.Orlova, I.A.Evlampiev, R.R.Khasanov, “Application of NQR-spectroscopy in studies of copper-bearing sulfides”……………………………………………………………………………….. 53
V.A. Ivanshin, T.O. Litvinova, A.A. Suhanov, D.A. Sokolov, M.С. Aronson, “Electron Spin Resonance in the Heusler Alloy YbRh2Pb”…………………………... 55
228

T A B L E O F C O N T E N T S
A.I. Gubaev, A.A. Rodionov, M.Kh. Salakhov, I.N. Subacheva, P.P. Syrnikov, V.A. Trepakov, R.V. Yusupov, “Photoinduced EPR in KTa0.988Nb0.012O3 crystals”……………………………………………………………. 60
M.Yu. Volkov, K.M. Salikhov, “Implementation of a quantum algorithm CNOT by nuclear magnetic resonance”.……………………………………..……….. 65
L.U. Grunin, L.M. Celisheva , B.G Gilyazov, Z.A. Kanarskaya, “Time-Domain Nuclear Magnetic Resonance as the actual technique of dairy product researching”…………………………………………………………………... 69
D.T. Sitdikov, V.G. Izotov, G.N. Lysuk, G.V. Mamin, S.B. Orlinskii, N.I. Silkin, M.H. Salakhov, N.P. Yushkin, “EPR of phytofulgurite and bitumens”... 70
S.S. Khutsyshvili, T.I. Vakul'skaya, I.A. Tokareva, I.A. Dorofeev, L.G. Shagun, “Continuous-wave and pulse EPR studies of iodine containing polyconjugate systems”……………………………………………………………….. 74
O.A. Babanova, A.V. Soloninin, A.P. Stepanov, A.V. Skripov, “NMR study of the reorientational motion in NaBH4 and KBH4”………………………………….. 76
Z. Litvinova, S. Verkhovskii, K. Mikhalev, A. Buzlukov, A. Yakubovskii, A. Trokiner, “The 17O NMR study of CaMnO3-x (x < 0.01)”………………………… 80
O.A. Gorbunov, P.A. Purtov, “Manifestation of the exchange-relaxation mechanism in spin catalysis”….………………………………………………………. 84
A.R. Tulyabaev, A.R. Tuktarov, V.V. Korolyov, V.M. Yanyibin, L.M. Khalilov, U.M. Dzhemilev, “Application of NMR-spectroscopy for an establishment of structure of spiro-cycloalkane derivatives of fullerene C60”…….….. 88
N.P. Isaev, V.N. Beloslyudtseva, S.A.Dzuba, “Influence of cholesterol on molecular motions in spin-labeled lipid bilayers observed by stimulated ESE”...……. 92
D.O. Tolmachev, N.G. Romanov, P.G. Baranov, R.A. Babunts, “Evidence of Mn2+ fine structure in CdMnSe/ZnSe quantum dots and quantum wells”…………. 95
A.I. Dmitriev, A.S. Chernenkaya, “Microwave magnetoresistance in Ge:Mn thin films detected by ESR spectrometer”……………………..……………………… 99
A.A Rakhymzhan, P.V. Koshlyakov, P.S. Dementiev, O.S. Aseev, A.I. Chichinin, “Deactivation study of electronically excited Cl(2P1/2) atoms by SOCl2, CCl3H, C2H4, NO2 molecules with Laser Magnetic Resonance (LMR) technique”..……….…………………………………………………….……………... 103
A.A. Vinokurov, S.M. Soukharjevskii, “EPR of Eu-doped superionic fluorite crystals”………………………………………………………...………………….…... 108
A. Alfonsov, E. Vavilova, V. Kataev, B. Buechner, A. Podlesnyak, M. Russina, A. Furrer, Th. Straessle, E. Pomjakushina, K. Conder, D.I. Khomskii, “Spin-state polaron in lightly hole-doped LaCoO3”…………………………………... 110
Yu. Krupskaya, A. Parameswaran, A. Alfonsov, R. Klingeler, V. Kataev, M. Gressenbuch, B. Kersting, B. Büchner, “High-field ESR and magnetization study of a novel trinuclear Ni(II) molecular complex”………………………………... 114
T.V. Popov, S.M. Soucharjevskii, E.V. Bogomolova, L.K. Panina, “Label-free EPR recognition of biogenic destruction of stone monuments”………………………. 118
229

T A B L E O F C O N T E N T S
E.V. Morozov, O.V. Shabanova, V.F. Pavlov, O.V. Falaleev, “NMR microimaging for studying the initial stages of gelation process in colloidal silica”…. 121
A.F. Sadykov, Y.V. Piskunov, A.P. Gerashenko, V.V. Ogloblichev, A.L. Buzlukov, K.N. Mikhalev, S.V. Verkhovskii, “63,65Cu NMR study of the magnetic structure in the multiferroic LiCu2O2”...…………….……………………… 126
A.V. Ievlev, D.A. Markelov, ”Self-diffusion and relaxation of low-generation dendrimers by NMR”...................................................................................................... 129
T.А. Platova, А.V. Dooglav, I.R. Mukhamedshin, “Phase segregation in sodium cobaltates NaxCoO2 at large sodium content”……….………………………………… 132
A.A. Levantovsky, A.V. Komolkin, “Development of a new interactive software for spectrum analysis”…………………………………………………………………. 136
A.D. Gulko, F.S. Dzheparov, O.N. Ermakov, A.A. Lyubarev, S.V. Stepanov, “Beta-NMR method and kinetics of polarization transfer in spatially disordered spin system”.…………………………..………………………………………………. 138
I.G. Mershiev, O.V. Ruban, G.S. Kupriyanova, S.V. Molchanov, “Application of adaptive wavelet filtering methods for noise suppression in NMR signal detection”……………………………..……………………………………………….. 142
A.A. Ezhevskii, A.V. Soukhorukov, D.V. Guseinov, A.V. Gusev, “Spin relaxation processes of conduction electrons in silicon with different isotopic composition”…………………………………..………………………………………. 146
A.V. Fedorova, E.B. Fel’dman, “Multiple quantum NMR of interacting equivalent spins”…………………………..………………………………………….. 150
L.F. Galiullina, A.S. Galyavich, R.N. Khayrullin, M.Kh. Salakhov, N.I. Silkin, A.V. Severin, “NMR investigation of atherosclerotic plaque”………….. 154
M.S. Bukharov, E.M. Gilyazetdinov, V.G. Shtyrlin, G.V. Mamin, Yu.I. Zyavkina, M.M. Malyukina, R.R. Garipov, “EPR study of structural features of the copper(II) complexes with histamine and dipeptides”………………… 158
A.N. Lobov, L.V. Spirikhin., “The diastereomeric differences in N-(2-hydroxyethyl)cytisine derivatives”……………………………………………………. 162
A.N. Istrate, A.B. Mantsyzov1), S.A. Kozin2), V.I. Polshakov, “NMR assignments of the short peptides of the fragments of human and rat b-amyloid”……. 164
V.S. Iyudin, F.G. Sitdikov, V.V. Andrianov, R.I. Gilmutdinova, F.K. Karimov, L.N. Muranova, V.M. Chiglintcev, S.V. Yurtaeva, G.G. Jafarova, Kh.L. Gainutdinov, “Investigation of nitric oxide contents in rats heart tissue by EPR spectroscopy”…………………………………………………………………. 168
O.A. Krumkacheva, V.R. Gorelik, E.G. Bagryanskaya, N. Lebedeva, M.D.E. Forbes, “Supramolecular Photochemistry in β–Cyclodextrin Hosts: A TREPR, NMR, and CIDNP Investigation”………………….……………………… 169
A.A. Bliznyuk, V.P. Berveno, V.G. Grigoriev, “Changes in paramagnetic characteristics of pitch and pitch fiber during their oxidation in low temperature oxygen plasma”……………………………..………………………………………… 174
230

T A B L E O F C O N T E N T S
A.V. Klochkov, M.S. Tagirov, K.R. Safiullin, A.N. Yudin, V.V. Kuzmin, R.R. Gazizulin, V.G. Izotov, L.M. Sitdikova, “NMR of liquid 3Не in pores of clay minerals”……………………………………………………………………….… 178
I.J. Danilov, I.B. Luzhbin, L.A. Batalova, I.R. Mukhamedshin, “Development of NMR spectrometer control software”…………..………………………………….. 182
S.V. Efimov, A.R. Yulmetov, V.V. Klochkov, “High-resolution NMR studies of cyclosporine A”…………………………..…………………………………………… 184
A.Yu. Orlova, R.R.Gainov, A.V. Dooglav, I.N. Pen’kov, “Antimony NQR studies of stephanite”.…………………………………………………………………. 187
I.A. Evlampiev, R.R. Gainov, A.V. Dooglav, I.N. Pen’kov, “Copper NQR studies of copper sulfide Cu1.6S (geerite)”……………………..……………………………… 192
M.A. Malakhov, I.E. Lubin, M.V. Eremin, “Multicomponent order parameter in superconductor YBa2Cu3O7”………………………………………………………….. 196
T.F. Khafizov, I.A. Larionov, “Theory for the Gaussian component of the 63Cu nuclear spin-echo decay rate 1/T2G in La2-xSrxCuO4”……………………….………… 199
Yu.S. Kutin, G.V. Mamin, S.B. Orlinskii, N.I. Silkin, M.A. Volodin, J. Schmidt, P.G. Baranov, Celso de Mello Donega, Andries Meijerink, “Paramagnetic Monitoring of Electrochemical Conversion of Some Free Radicals and Nickel Complexes”……………………………………………………………….. 203
B.V. Yavkin, E.S. Kovaleva, G.V. Mamin, S.B. Orlinskii, V.I. Putlaev, A.A. Rodionov1), N.I. Silkin, “EPR of lead doped hydroxyapatite nanocrystals”…… 207
R.B. Zaripov, R.M. Aminova, K.M. Salikhov, G.N. Konygin, G.G. Gumarov, “Application ESEEM to study free radicals in disordered systems”………………….. 210
E.M. Alakshin, A.V. Klochkov, S.L. Korableva, M.S. Tagirov, “Synthesis of PrF3 nanoparticles for researching cross relaxation in contact with 3He”…………….. 215
K.B. Konov, V.K. Voronkova, R.B. Zaripov, “Determination of spin state of the paramagnetic clusters by electron spin echo envelope modulation”……………… 217
K.R. Sharipov, R.M. Eremina, I.I. Fazlizhanov, H.-A. Krug von Nidda, Ya.M. Mukovskii, “Observation of a phase separation in Paramagnetic Eu0.6La0.4-xSrxMnO3”…………………………………………………………………... 220
I.G. Mamedov, M.R. Bayramov, Y.V. Mamedova, R.M. Abbasov, A.M. Magerramov, “Investigation of some aminomethyl and acetyl derivatives of alkenylphenols by NMR spectroscopy”……………………………………………. 224
231

ACTUAL PROBLEMS OF MAGNETIC RESONANCE AND ITS APPLICATION
XII International Youth Scientific School
Program Lecture Notes Proceedings
Kazan
5 – 9 October 2009
Подписано в печать 01.10.09. Бумага офсетная. Печать ризографическая.
Формат 60х84 1/8. Гарнитура «Times New Romans». Усл.печ.л. 26,97 Уч.-изд.л. 24,5. Тираж 145 экз. Заказ 124/9
Казанский государственный университет
Отпечатано с готового оригинал-макета в типографии Издательства
Казанского государственного университета
420008, г. Казань, ул. Профессора Нужина, 1/37 тел. 233-73-59, 292-65-60