Embed Size (px)
Citation preview

BIBLIOGRAPHY ON URBAN AND BUILDING CLIMATOLOGY. Period 1996-1998
Prepared byErnesto Jauregui
WMO Rapporteur on Urban/Building ClimatologyCenter Atmospheric Sciences National University Mexico
In accordance with our stated terms of reference (Res. 9/5 CCL-XII) we have prepared the present bibliography on urban and building climatology covering both mid-latitude work as well as articles dealing with the tropical urban environment. We refer to the interested reader to previous bibliographies on urban climate published by the World Meteorological Organization: WMO/TD No. 552 and WMO/TD No. 759 covering the years 1981-1991 and 1992-1995 respectively. The present report extends over the period 1996-1998.
The main source of information has been as in previous bibliographies the Journal Meteorological and Geoastrophysical Abstracts and books of proceedings of various meeting such as those organized by WMO, the American Meteorological Society (AMS), the International Geographical Union (IGU), the Association of American Geographers (AAG), etc.
Activity in urban climate studies has steadily increased when comparing the 1990’s with the previous decade (see Table 1). While production of papers on urban climate in the tropics is still a small fraction of mid-latitude activity in this field it has doubled with respect to the 1980’s. Figure 1 shows the evolution of urban climate studies during the last decade of the century.
1
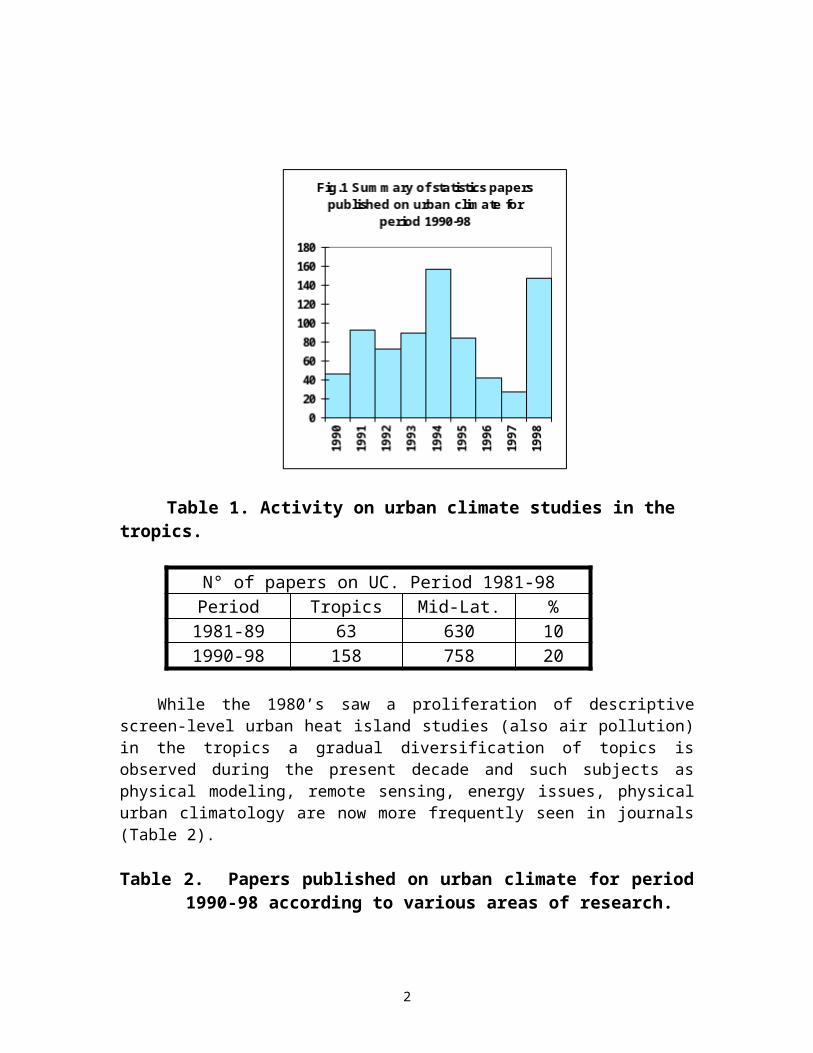
Table 1. Activity on urban climate studies in the tropics.
N° of papers on UC. Period 1981-98Period Tropics Mid-Lat. %
1981-89 63 630 101990-98 158 758 20
While the 1980’s saw a proliferation of descriptive screen-level urban heat island studies (also air pollution) in the tropics a gradual diversification of topics is observed during the present decade and such subjects as physical modeling, remote sensing, energy issues, physical urban climatology are now more frequently seen in journals (Table 2).
Table 2. Papers published on urban climate for period 1990-98 according to various areas of research.
SUBJECT/REGION GU HL ML ST T TOTALPh MUC 42 2 30 15 4 93EUC 7 30 12 19 68GUC 9 7 86 28 38 168PhUC 17 21 9 11 58QUA 11 9 94 57 26 197RSUC 12 18 5 1 36UBCL 12 2 13 11 15 53UH 4 4 4 12 24UP 12 4 18 3 24 61
TOTAL 126 24 314 144 150 758
SUBJECTS:
2

PhMUC - Physical modeling urban climateEUC Energy consumption and urban climateGUC General, descriptive urban climate e.g. description of near surface
Fields of temperature, wind, rainfall, humidity, etc.PhUC Physical urban climateQUA Quality of urban atmosphereRSUC Remote sensing and urban climateUBCL Urban bioclimatologyUH Urban hydrologyUP Urban planning
REGIONS:
GU GEOGRAPHICALLY UNSPECIFIEDHL HIGH LATITUDESML MIDDLE LATITUDESST SUBTROPICALT TROPICAL
Table 3 summarizes the statistics of papers published on urban climate for the present decade and for various regions. While there is no clear trend in the total numbers, the recent year of 1998 comes out as one of the most productive since two large meetings took place in that year: The AMS congress in Albuquerque and the IGU Conference in Evora.
Table 3. Summary of statistics of papers published on Urban Climate for period 1990-98 according to geographical regions.
GU HL ML ST T TOTAL1990 2 19 25 461991 19 2 30 42 931992 15 3 25 20 10 731993 25 3 40 15 6 891994 17 6 74 24 36 1571995 7 56 11 10 841996 6 28 2 6 421997 8 8 5 6 271998 29 10 81 17 10 147
TOTAL 126 24 314 143 151 758%Tropical 25
While low-latitude urban climate studies have doubled during the 1990’s they still represent a small fraction of mid-latitude production. Although some progress has been
3

accomplished in recent years much work needs to be done in tropical cities especially in modeling of the urban atmosphere and process-oriented studies regarding exchanges of energy, mass and momentum. In order to stimulate work in this area WMO has initiated a project on Tropical Urban Climate Studies (TRUCE) promoted in various WMO-sponsored meetings.
Table 4 shows topics presented during this decade in meetings mostly promoted by WMO (except the AMS event) including the forthcoming Sydney Conference in which not only the high number of papers but also the diversity of subjects is notable.
Table 4. Areas of research on urban climate presented in international meetings during the 1990's
Tec Tuc 1993
ICUC/ESSEN/1996
AMS 1998
ICUC/1999 Sydney
Mid latitude TropicsTropical urban climate (TRUCE) 40 25 4 19
Methods, general 8Microenvironments 5 1 14Urban climate/energy 1 5Urban green /water 8 1 11 5Urban climate descriptions, urban HI./canyon, impacts
11 21 4 5 9
Urban climate trends and global warming 3 5 1 10Physical, turbulence, roughness, wind tunnel Urban climate modelling. Heat/radiation fluxes
17 3 26 38
Energy and Urban climate 3 1Air quality, air pollution modelling,road pollution 10 48 8 5 16Urban planning/Urban climatology 17 1 4 17Remote sensing 4 10 4Urban bioclimate/comfort/health 5 11 4 11 13Urban hydrology, extreme events 7 8 2 4
Total 39 145 25 72 144
Table 5 shows the number of papers on urban climate published during the recent period 1995-1998 by geographical regions and by subjects. Clearly, descriptions of near-surface fields of temperature, wind, rainfall, etc. and air quality predominates but as stated before studies in other areas are emerging. This fact is evidence of the vitality of the subject and shows the increasing interest of urban climatologists in improving the knowledge of the urban atmosphere.
4

In the following pages abstracts of papers on urban climatology are presented in alphabetical and chronological order for period 1996-1998. Abstracts corresponding to 1995 not included in the previous bibliography are also added.
Table 5. Papers on urban cliamte published, period 1995-98.
SUBJECT/REGION GU HL ML ST T TOTALPhysical modelling urban climate 23 1 15 5 0 44Energy consumption and urban climate 1 0 2 1 2 6General descriptive urban climate e.g. description of near surface fields of temperature, wind, rainfall, humidity, etc.
6 5 61 5 10 87
Physical urban climate 10 0 6 0 2 18Quality urban atmosphere 1 1 35 8 8 53Remote sensing and urban climate 4 0 5 1 1 11Urban bioclimatology 3 1 8 3 1 16Urban hydrology 2 0 1 0 0 3Urban planning 4 2 3 1 1 11TOTAL 54 10 136 24 25 249
% 10 10
ACKNOWLEDGEMENTS
The author is grateful to Elda Luyando, Claudia Villegas, Mario Casasola, Carmen Moreno for the collection of abstracts. Guadalupe Zarraga helped in typing this document.
5

Kawamura, T.1990. Urban climate from the viewpoint of atmospheric environment. Japanese Progress in Climatology. 31-40
GUC ML
ABSTRACT: One of the most important problems of urban climate is air pollution in the urban area and its surroundings. High concentrations of atmospheric pollutants, which affect human health such as SOx, NOx, originally emitted from sources, and photochemical oxidants, are commonly observed in urban and suburban areas. Air pollution has drastically changed in Japan during the past thirty years. On the other hand rapid urbanization in large cities has resulted in a marked increase of the temperature difference between urban and rural areas in Japan throughout the same period. Numerous researches on the heat island effect, including biometeorological effects, have been carried out. This paper summarizes urban climate from the view-point of atmospheric environment, focusing especially on examples from Japan. Subject Headings: Urban atmospheric pollution; Urban heat islands; Urban climates; Japan.
Watanabe, A.1990. Observed conditions of heat and cool islands. Japanese Progress in Climatology. 62-68
GUC ML
ABSTRACT: Recently, the city becomes drier every year, and cool islands appear more clearly every year at the time of the appearance of maximum temperature. The center of Fukushima City is 1.2°C cooler than its suburbs. Cool islands appear clearly in spring and autumn which are relatively dry seasons. On the other hand, heat islands appear at the time of the appearance of minimum temperature. The center of the city is 0.8°C warmer than the suburbs. Heat islands appear clearly in the autumn and winter. Moreover, the diurnal range of temperatures is 1.7°C larger in the suburbs than in the city. Subject Headings: Urban heat islands; Urban cool islands; Fukushima, Japan.
Situma, F.D.P. 1992. The environmental problems in the city of Nairobi, Kenya. African Urban Quarterly, Nairobi, Kenya, 7(1 and 2): 167-175.
QUA T
ABSTRACT: The environmental problems of the city of Nairobi are legion and are constantly on the upward trend. These problems cannot be adequately understood
6

without the knowledge of the geography, climate and population of the City of Nairobi. We posit that whatever environmental problems there are in city of Nairobi, these are a product of the interaction between the geography and climate as well as the population. After reviewing the geography, climate and population trends of the city of Nairobi, the paper proceeds to specifically focus on the environmental concerns. We look at land use planning and the trend of urban dwellings. It is argued that the growth of slum areas in the city of Nairobi is a result of poor land use planning, coupled with an apparent lack of a comprehensive policy to regulate human settlements. The rising population has in such situations led to spontaneous and unregulated settlements that have occasioned various environmental problems. The Nairobi City Council (NCC) has completely failed to cope with demands imposed by this population . Solid waste disposal services are miserably wanting. In the slums, the people have learned to co-exist with their own excreta and other forms of human waste. There are no water facilities in such areas to enable provision of human conveniences. There are no roads to enable the NCC vehicles to collect garbage for disposal in suitable places. Even where are access roads, the garbage collecting trucks are never seen for months. The people have to live with the nuisance and inconveniences created by the putrefying garbage at their door steps. Apart from being an eyesore, the garbage not only fouls the air but provides breeding ground for disease carrying insects. Noise is an environmental problem that is generally on the increase in the city of Nairobi. Its environmental effects may not be immediate but is long term damaging effects on the human body are apparent. The main sources of the city of Nairobi noise are motor vehicles, locomotives, aircraft and industries. The quality of the air in the city of Nairobi does also present a serious environmental problem. The big volume of vehicular traffic coupled with the routing of the said traffic leads to various degrees of air pollution along and around the routes used particularly by vehicles using diesel engines emit thick diesel fumes. During peak hours one observes a “train” of fumes over these routes. Coupled with the vehicular fumes are smoke and fumes emanating from the industries in the city of Nairobi. The intensity of the fumes and smoke is such that it forms a thick blanket of smoke over the city which is easily visible as one flies over the city at a low altitude. The interspersion of residential areas with industrial concerns, particularly in the southeastern part of the city, makes this a difficult problem in terms of control and prevention. Subject Headings: Urban atmospheric pollution; Environmental pollution; Nairobi, Kenya.
Brázdil, R. 1993. The homogeneity of air temperature measurements Prague-Klementinum with respect to the intensification of the urban heat island. Prace Geograficzne, Kraów, Poland. 95: 67-74.
GUC ML
ABSTRACT: The paper deals with the homogeneity of the series of monthly and annual mean air temperatures in Prague-Klementinum in 1771-1990. The
7

nonhomogeneity caused by intensification of the urban heat island is particularly emphasised. Values of air temperature in homogenous and nonhomogenous series have been compared for Central Europe. Subject Headings: Long-period temperature records; Urban heat islands; Prague-Klementinum, Czeh Republic.
Katsoulis, B.D.1993. A study of the weather records from Athens (1860-1988) including an analysis of climate variation. Prace Geograficzne, Kraków, Poland. 95: 203-213.
GUC ML
ABSTRACT: A study of the weather record from 1860 to 1882 from Athens, on the southeastern coast of Greece supports the evidence that a warming trend tool place in the middle latitudes beginning some time in the middle of the 19th century until the year 1990 [sic]. Then, a cooling occurred up to about 1925. Since those years, a new rise continues until the 1940s, followed by small fluctuations around the mean value. In addition there is an evidence from other climatological measurements taken at Athens that the climate has indeed varied over the past century. Subject Headings: Historic weather records; Historic climatic changes; Athens, Greece.
Klysik, K.1993. The meteorological observation records from Lódz. Prace Geograficzne, Kraków, Poland. 95: 59-65.
GUC ML
ABSTRACT: A history of the meteorological observations in Lódz is described. A comparison of temperature records from stations Lódz-LER, in the central part of the city, and Lódz-Lublinek, outside of the city, with those from the reference stations Pulawy and Bydgoszcz allows us to estimate the temperature urban effect in Lódz in the period of 1903-1930. The influence of the city on hourly sunshine duration distribution has also been examined. Subject Headings: Historic meteorological data; Urban influences; Lódz, Poland.
Stulov, E. A.1993 Urban effects on summer precipitation in Moscow. Russian Meteorology and Hydrology, New York, NY. 11 (4): 34-41.
GUC ML
ABSTRACT: Urban effects on summer convective precipitation in Moscow are considered. It is found that the mean summer precipitation amount in Moscow is higher than in its environs by 7%, the maximum summer time excess being 27% (70
8

mm). The rainfall excess in Moscow is caused by a higher frequency and intensity of convective precipitation. A number of events are mentioned when the precipitation in Moscow far exceeded precipitation in its environs. Radar observations of precipitation were used to identify three types of situations with the increased convective precipitation in the Moscow area. Subject Headings: Urban influences on precipitation; Moscow, Russia.
Unger, J. 1993. The urban influence on the diurnal and annual patterns of absolute humidity in Szeged, Hungary. Acta Climatologica, Szeged, Hungaria, 27(1-4): 33-39.
GUC ML
ABSTRACT: Measurements of vapour pressure taken four times daily over a 3-year period were used to investigate diurnal and annual patterns of urban-rural absolute humidity differences in Szeged. The city was found to be more humid than its surroundings during the whole year. Variation of urban humidity surplus can be explained by reference to urban and rural energy balances and sources of moisture. Good relationships exist between urban-rural absolute humidity differences and partly nocturnal heat island intensity, partly the variation of aridity index, partly the variation of the water temperature of the River Tisza. Subject Headings: Urban influences on humidity; Szeged, Hungary.
Obrebska-Starklowa, B.; Olecki, Z.; Trepinska, J. 1994. The diagnosis of climate change in Cracow against a background of circulation and local conditions. Geographia Polonica. 51-62.
GUC ML
ABSTRACT: The multi-annual variability of thermal, solar and cloudiness conditions in Cracow was examined from the point of view of the impact of natural and anthropogenic factors on the climate change. The analysis concerned the annual air temperature range (RAT) and daily ranges of air temperature (DAT) in January and July. Special attention has been paid to the climatic trends and changes of climatic continuity. Long-term changes of RAT reflect the impact of the circulation factors, these of DAT are influenced by the urbanisation. Subject Headings: Climatic changes; Atmospheric circulation-climate relationships; Urban climatology; Cracow, Poland.
Tu, X.; Li, Z. 1994. Model study of effects of aerosols on urban nighttime boundary layer temperature. Journal of Nanjing Institute of Meteorology, Nanjing, China, 17(2): 195-199.
9

PhMUC GU
ABSTRACT: A one-dimensional unsteady model is developed for the effects of aerosols upon urban nighttime boundary layer temperature. Results show that these particles are responsible for near-surface layer temperature increase, as opposed to the condition at 150 m above ground. Subject Headings: Aerosol effects on temperature; Urban temperatures.
World Meteorological Organization. 1994. Report of the Technical Conference on Tropical Urban Climates, 28 March-2 April, 1993, Dhaka Bangladesh. World Meteorological Organization. World Climate Programme: Applications and Services. 269 (3226): 953-957.
UP T
ABSTRACT: Issues of direct relevance to the urban climate in tropical cities were discussed during the Technical Conference on Tropical Urban Climates (TeCTUC). The focus was on the impact of climate and weather-its state, variation and change-on the urban fabric, structures and operations; the impact of urban activities on climate on various scales, i.e. local, regional and global; and the application of climate information and knowledge in urban planning, building and operations, including mitigating the impact of climate related natural disasters. More than 80 participants, representing a broad spectrum of sciences, experiences and interests in disciplines such as architecture, urban planning and building, atmospheric science hydrology and urban climatology came to Dhaka for TeCTUC. They came from over 30 countries and several international organizations, including IGU, UNEP, WHO and WMO. The deliberations were facilitated by subject-oriented keynote presentations, reviews of ongoing related activites and extensive discussions. Special emphasis was on activites related to further development of plans and implementation of the Tropical Urban Climate Experiment (TRUCE). In particular, guidelines for formulation of TRUCE-related projects were recommended. The contents of the report are as follows; Session A: Urban Systems in a Large-Scale Climate Context: Some Observations on Characteristics of Rainfall in Two African Cities, Yinka R. Adebayo; A Study on the Physical Relationship and Interaction between Urban and Rural Climates in Bangladesh, Md. Amirul Hussain, Nahid Sultana, Shamsuddin Ahmed; Impact of Climate Change on Urbanization and Urban Society in Bangladesh, M. Asaduzzaman; A Study of Effects of Urbanization on Atmospheric Diffusion Meteorological Parameters, R. N. Gupta; Urban Systems in a Large Scale Climate Context, Masatoshi Yoshino; Session B: The Impact of Natural Disasters on Urban Systems: Rainfall in Dhaka City an Aspects of its Drainage Systems Development: a Historical Perspective, S. Dara Shamsuddin; Tropical Cyclones in Bangladesh, Md. Sazedur Rahman: Design of Buildings and Structures in Urban Areas Taking into Consideration the Disastrous Climate of Bangladesh, A.M. Choundhury M.A. Haque; Progress in the International Decade for Natural Disaster Reduction, IDNDR, Lars E. Olsson; The Impact of Natural
10

Disasters on Urban Infrastructure, Jamilur R. Choudhury, Climatological Information on Tropical Cyclones in the Philippines, Aida M. Jose; Session C: Urban Climate, Comfort and Human Health: Climate Zoning for Building and Urban Planning in Vietnam. Tran Viet Lien; On the Variability and Probabilistic Extremes of Some Climatic Elements over Dhaka, Samarendra Karmakar, Ayesha Khatun; Human Comfort in the Urban Areas of Bangladesh , Md. Akram Hossain, Mohammed Nooruddin Begum Jinnatun Nessa; Industrial Waste Pollution: A Case Study of Hazaribagh Area of Dhaka City, Nawshad Ahmed, Md. Rafiul Karim; Urban Bioclimatology, G. Jendritzky, A. Grätz, E. Schultz and W. Endlicher; Trace Metals Characterization of Precipitation and Aerosols: Preliminary Results, A. Nejjar, R. Azami; The Impact of Urban Development on the Thermal Environment of Singapore. C.P. Tso; Session D: The Impact of Climate on Planning and Architecture: Traditional Architecture and its Application in Urban Area Focusing on Khulna City, Bijon B. Sarma; In Search of the Impact of Urbanization on the Thermal Environment of the City of Dhaka, Bangladesh, during the PreMonsoon Hot Season from 1948 through 1987, Rafique Ahmed; Low Energy Buildings in Warm-Humid Regions: the Use of Perforated Blocks, Leonardo Bittencourt; A System of Presenting Climatic Information for Building Design Applications, Shamin Ara Hassan; Ventilation and Comfort in Interior Spaces, Meer Mobashsher Ali; Application of Hollow Roof Tiles for Passive Solar Heat Control in Tropical Climates, Abu H. Imamuddin, Abu Md. Aziz-Ul Huq, Bikash Saud Ansary, Muhammad Raihan Ali; Climate Responsive Urban Development in Tropical Cities: Training and Practice, Silvia de Schiller, John Martin Evans: Session E: Urban Design and Climate: Investigations on Urban Climate in Cuba, Luis Lecha Estela, Maria Nieves Poveda, Luis Paz Castro; Overviews of Papers on Urban Climate in Tropical/Subtropical Areas (1981-1991), Ernesto Jauregui; Seasonal Weather Events an their Related Impacts on Building and Settlement, Willy S. Goma; Reduction of Heat Transmission through Building Envelope: Strategy for Replacement of Building Elements, Kazi Nurul Alam, Md. Salim Ullah; Shadowing Patterns of Some Typical Urban Housing Layouts in Bangladesh, Fuad H. Mallick; Application of Passive Cooling Methods in the Micro Level of Dhaka City, Bangladesh, Khairul Enam; Housing for Rural Culture, K. L. Shrimali, Asif J. Mirza; Session F: TRUCE-Related Activites and Session G: Need for Research and Development: Tropical Urban Climate: A Scientific Challenge, B. Padmanabhamurty; Effect of Urbanization on some Meteorological Elements in Greater Cairo Region, R.S. Fouli; Some Aspects of Urban Climates of Dhaka City, M. Ershad Hossain, Md. Nooruddin; Global Solar Radiation on Horizontal Surface in Dhaka, Abu Md. Aziz-Ul Huq. Shamin Ara Hassan; Eco Climatic Features of Dhaka City due to Urbanization, M. A. Khaleque, Arjumand Habib, Shamsuddin Ahmed; Air Quality and Meteorological Study in a Tropical Urban Area (Macau), Renato A. C. Carvalho; Urban Thermal Environmental Studies in Kuala Lumpur, E. B. A. Chan, C.P. Tso, M.A. Hashim; Implications of Global Warming and Climate Change on Urban Planning and Building Operations in West and Central Africa, O. Ojo; The International Geographical Union (IGU) and the WMO’s Tropical Urban Climate Experiment (TRUCE) Programme, Lawrence C. Nkemdirim and Manfred Domröes. Subject Headings: Urban climatology symposia.
11

Almbauer, R.; Pucher, K; Sturm, P.J.1995. Air quality modeling for the city of Graz. Meteorology and Atmospheric Physics, Viena, Austria, 57 (1-4): 31-42.
QUA ML
ABSTRACT: Graz, a historical grown city in the southeast of Austria, sometimes faces problems with air pollution, mainly during wintertime. The old part of the city is the largest residentially used historical downtown in Central Europe. Due to its geographical position at the southeastern edge of the Alps, Graz often has weather situations with calm winds and strong inversions between October and March. The local wind system is marked by wind shears: near the surface, cold air flow in from the south while in higher altitudes warm air from the north flows over the basin of Graz. During these winter periods with mighty inversions air quality values exceed the threshold limits. The reason is that the old structure of the downtown area with narrow streets and a lot of old domestic heating systems in many of the old buildings causes relatively high pollution levels. In the winter of 1988/89, the NO2 threshold values for smog-alarm (0.8 mg/m3, 3-h mean value) were exceeded several times at three an quality monitoring stations in the city of Graz. Therefore, a research project was initiated with the aim to find out the reasons for the bad air quality. The project comprised the setting up of an emission inventory as well as meteorological measurement campaigns and numerical simulations concerning the pollution dispersion in the area of Graz. The following report will try to show the interaction of the emission inventory on one hand and the determinations of flow conditions and pollutant dispersion on the other hand in order to analyze the air quality in the city. The emission inventory contains the emissions of air pollutants in a high temporal and spatial resolution. Before determining the surface flow fields, the meteorological conditions leading to the high pollution values were analyzed. After that, the boundary conditions were defined with the help of tethered balloon measurements. With these boundary conditions, quasi-steady-state flow fields were simulated. The dispersion of pollutants was calculated in a transient form using the stored flow fields. Conversion of pollutants was determined with the help of a parameterized version of the Eschenroeder-Martinez reaction mechanism. The period of winter 1990/91 with the highest pollution concentration was simulated to validate this model. The results show that the simulated and measured values of CO, NO and NO2 correspond well with each other in the centre of the city, while the correspondence is not as good in the outskirts of the city where lower pollution levels are observed. It turned out that the suggested methodology is well suited for analyzing winter situations with high pollution levels. Subject Headings: Air quality models: Urban atmospheric pollution; Graz, Austria.
12

Blake, D.R.; Rowland, F.S.1995. Urban leakage of liquefied petroleum gas and its impact on Mexico City air quality. Science, Washington, DC, 269(5226): 953-957.
QUA T
ABSTRACT: Alkane hydrocarbons (propane, isobutane, and n-butane) from liquefied petroleum gas (LPG) are present in major quantities throughout Mexico City air because of leakage of the unburned gas from numerous urban sources. These hydrocarbons, together with olefinic minor LPG components, furnish substantial amounts of hydroxyl radical reactivity, a major precursor to formation of the ozone component of urban smog. The combined processes of unburned leakage and incomplete combustion of LPG play a significant role in causing the excessive ozone characteristic of Mexico City. Reductions in ozone levels should be possible through changes in LPG composition and lowered rates of leakage. Subject Headings: Urban atmospheric pollution; Ozone in urban air, Ozone-atmospheric pollution relationships; Mexico City, Mexico.
Fujibe, F. 1995. Temperature rising trends at Japanese cities during the last hundred years and their relationships with population, population increasing rates and daily temperature ranges. Papers in Meteorology and Geophysics, Ibaraki, Japan, 46(2): 35-55.
GUC ML
ABSTRACT: Long-term temperature trends at 60 stations in Japan were evaluated by using monthly data during 1891-1992. The polynomial trends of minimum and maximum temperature were obtained with a least-squares method which included discontinuous changes due to site changes. The minimum temperature (Tmin) is found to show a rising trend with an average rate of about 2-5°C/(100 years) at large cities and about 1°C/(100 years) at medium-sized ones. The rising rate (T min) tends to be higher after World War II than before, but some cities in Hokkaido show exceptionally high rising trends of Tmin in the early part of the analysis period. Changes in maximum temperature (Tmax) are smaller, although a weak rising trend before World War II is found for many cities. The dependence of the temperature rising rate on the city size (population of cities or towns) was examined. It is found that Tmin is positively correlated with population parameters with only slight differences in correlation coefficients according to their functional forms (the logarithm and low powers). There is also a weak correlation between the rising rate of maximum temperature (Tmax) and the population parameters. A similar analysis was made for the increasing rate of the population parameters. There is a positive correlation between Tmin and the net increasing rate of the population adjusted to the present area of the city. On the other hand, there is little correlation between Tmin with the nominal increasing rate of population without adjustment for changes in the area of the city. Analysis was also made about the relationship between Tmin
13

and the daily temperature range (R), which was regarded as a measure of the intensity of night time cooling. It is shown that T
min has a positive correlation of 0.3-0.5 with R in old times, such as that in the 1910s, but is hardly correlated with R in recent years. Subject Headings: Temperature trends; Urban temperatures; Japan.
Kaneyasu, N.1995. Seasonal variation in the chemical composition of atmospheric aerosols and gaseous species in Sapporo, Japan. Atmospheric Environment, Oxford, England. 29(13): 1559-1568.
QUA ML
ABSTRACT: Simultaneous samplings of atmospheric aerosols and gaseous precursors (SO2, HNO3, NH3) were conducted during an 18-month period in Sapporo, Japan. The monthly mean mass concentration of particles less than 10 m in diameter (suspended particulate matter: SPM) and their chemical composition were measured for aerosols collected at two sites located in northern and southwestern regions of the urban area. In the central part of the city, two-week mean concentrations of SO2, HNO3 and NH3 were measured by using tandem filter packs. Seasonal variations of the SPM mass concentrations and composition are discussed along with the results of the gas measurements. In both northern and southwestern regions of the urban area, more than 85% of the mass concentration of SPM is characterized by considering eight major components (elemental carbon, particulate organics, SO4
2-, NO3-, Cl-, NH4
+, Na+ and soil particles). The concentration of elemental carbon indicates a winter maximum and summer minimum at both sites. Excess SO4 2-, concentrations at the two sites exhibit very similar values throughout the year. An analysis of the concentration of SO2 suggests that the existence of secondarily formed sulfate in the atmosphere may contribute to this feature. Values of NO3
- and NH4+ exhibit marked seasonal variations: winter
maxima and summer minima. By comparison with the concentration of total inorganic nitrate ([NO3
-] in aerosols + [HNO3]) measured in the central part of the city, the variations of NO3- and NH4+ are attributed to change in the gas-particle phase between HNO3, NH3 and NH4NO3. The measurements of total ammonia ([NH4
+] in aerosols+[NH3]) suggest that, in urban areas, significant ammonia sources exist other than the ground surface. From the molar equivalence of Na+ and Cl-, it was found that the Cl- in SPM aerosols is mostly derived from sea salt; the contribution from NH4Cl is small, even in winter. Furthermore, the measured seasonal variation of Cl- was largely influenced by the chlorine loss from sea salt. Subject Headings: Aerosols composition; Urban atmospheric pollution; Sapporo, Japan.
Karaca, M. 1995 Effects of urbanization on climate of Istanbul and Ankara. Atmospheric Environment, Oxford England, 29 (23): 3411-3421.
14

GUC ML
ABSTRACT: The purpose of this work is to study regional climate change and investigate the effects of urbanization on climates of two largest cities in Turkey; Istanbul and Ankara. Air temperature (mean, maximum and minimum) data off Inbull and Ankara are analyzed to study regional climate change and to understand the possible effects of urbanization on the climate of these regions owing to industrialization and large flux of migration from rural parts of the country. For the trend analysis, linear regression and the sequential version of the Mann-Kendall test is used. A significant upward trend is found in the urban temperatures of southern Istanbul, which is the most highly populated and industrialized part of the city compared to its rural parts. Northern stations do not show any warming trend, instead, they have a cooling trend. Urbanization and industrialization in the southern part of Istanbul has a negative effect on regional cooling. In spite of Ankara’s urban geometry and air pollution problem, the urban station in Ankara does not show any warming trend. A significant urban heat island intensity (urban-rural) is not observed in Ankara. Subject Headings: Urban influences on temperature; Istanbul, Turkey; Ankara, Turkey.
Kidder, S.Q.; Essenwanger, O.M. 1995. The effect of clouds and wind on the difference in nocturnal cooling rates between urban and rural areas. Journal of Applied Meteorology, Boston, MA. 34 (11): 2440-2448.
GUC GU
ABSTRACT: The urban warming effect is interesting in its own right and is important for understanding global warming. The aim of this study is to determine how the urban warming effect changes with cloud conditions and wind speed. Studies of the urban warming effect have mostly concentrated on the urban -rural difference in daily maximum or minimum temperatures. The problem was approached using a new technique. Instead of comparing a city, represented by a first-order weather station, with the surrounding rural area, represented by data collected by cooperative observers; pairs of cities, each with a first-order weather station, were studied. One city was large. The other city was small enough to have a minimal warming effect and was close enough to the larger city to approximately represent the rural area. In this way, hourly temperatures, cloud cover, and wind data could be studied rather than only the differences between the daily maxima or minima. Results show that wind disrupts the normal nocturnal cooling pattern in which the smaller city, with lower thermal inertia, cools more quickly than the larger city. Clouds also disrupt this pattern, at least to the extent that one must be careful about extrapolating either magnitudes or patterns of urban-rural temperature difference observed by satellites under clear sky conditions to partly cloudy or cloudy conditions. Subject Headings: Nocturnal cooling; Urban influences on temperature.
15

Lewinska, J. 1995. Evaluation of the climate of urban areas as exemplified by the towns of Lódz and Radom. Warsaw, Poland, Institute of Geography and Spatial Organization, Polish Academy of Sciences. 23: 155-160.
GUC ML
ABSTRACT: The paper presents a proposal for climatic evaluation of the urbanized areas. In that evaluation the following features of an environment were distinguished: the topography and the heat exchange by means of convection connected with it and some elements of the management of the territory, as well as the emission of pollutants and artificial heat to the atmosphere. Moreover the next elements were taken into account: losses of radiation resulting from air pollution, occurrence of urban heat island, reduction of wind velocity due to the density of buildings and roughness of surface. The six classes of the topoclimate evaluation were distinguished in Lódz, and five ones in Radom. The detailed analysis of the climatic evaluation allows to conclude that the main importance in the evaluation refers to the type of land use, the directions of build areas parallel to axe consistent with predominating air circulation, and ensuring simultaneously ventilation corridors. Subject Headings: Urban climates; Lódz, Poland; Radom, Poland.
Moussiopoulos, N.1995. Urban Atmosphere: the Athenian Photochemical Smog Intercomparison of Simulations (APSIS) Study. Atmospheric Environment, Oxford, England, 29 (24): 3573-3728.
QUA ML
ABSTRACT: Several papers arising from APSIS build the core of the present special “Urban Atmosphere” issue of Atmospheric Environment. The issue is complemented with additional papers addressing individual topics related to wind flow and pollutant transport and transformation. In this sense, this issue may be considered as a contribution of the scientific community to a greater understanding of the air pollution problem in cities like Athens in support of reasonable attempts to optimize abatement strategies. Subject Headings: Urban atmospheric pollution; Photochemical smog; Athens, Greece.
Mura, M.Ch. 1995. Stochastic approach to study the atmospheric pollutants in the urban area of Rome. the Science of the Total Environment, Amsterdam, The Netherlands, 171(1-3): 151-154.
16

QUA ML
ABSTRACT: The aim of this article is to present some results obtained by adapting ‘structural’ and ‘temporal series’ models to data on atmospheric chemical contaminants detected by stations for continuous monitoring of the Istitute Superiore di Sanita (ISS), located in an urban area of Rome. The reported results allow us to quantify the interrelation among contaminants, periodicity, persistence, behavioral trend over 24 h with particular reference to carbon monoxide (CO) and its correlations with benzene. The results are in agreement with the information available on the traffic flow in this area. The present work, which constitutes part of methodological research on the treatment of data supplied by monitoring stations points out that by using mathematical models it is possible to produce consistent and reliable information, reproducible in space and time, on the basis of actual data on contaminants. The results obtained point towards the advantage of using the predictive model for CO. Subject Headings: Atmospheric pollution measurements; Urban atmospheric pollution; Rome Italy.
Parrish, D. 1995. Urban atmosphere: A&WMA international specialty conference on regional photochemical measurements and modeling. Atmospheric Environment, Oxford, England. 29 (21): 2885-3234
QUA GU
ABSTRACT: Papers submitted to Atmospheric Environment/Urban Atmosphere are being published in two special issues subject to the normal peer review process for the journal. This volume contains papers dealing with atmospheric chemistry, meteorological and air quality measurements and modeling, biogenic and anthropogenic modeling and measurements, model sensitivity studies, and deposition measurements and modeling, most of which describe results from the California Ozone Deposition Experiment (CODE). The second special issue of Atmospheric Environment/Urban Atmosphere related to this conference includes papers presenting results from the Southern Ontario Ozone Study (SONTOS) and from the McHenry Tunnel Study, which is a part of the Southern Oxidant Study (SOS). Other topics discussed in the second special issue include atmospheric chemistry, modeling and measurements of photochemical reaction products, photochemical modeling and modeling systems, and model sensitivity studies. Approximately 500 scientists, engineers, and air quality managers from around the world attended the week long conference. More than 350 papers were presented in 41 sessions. Over 145 papers presented results from the three major air quality studies that were the initial focus of the conference. Those three studies are the San Joaquin Valley Air Quality Study with its Atmospheric Utilities Signatures, Predictions, and Experiments (SJVAQS/AUSPEX) field measurement program and its SJVAQS/AUSPEX Regional Model Adaptation Project (SARMAP) modeling and data analysis program; the Southern Oxidants Study (SOS); and the Lake
17

Michigan Ozone Study (LMOS). Many other current air quality studies with emphasis on ozone were also invited and participation was high. Authors represented nearly 30 ozone-related measurement and/or modeling studies from 18 countries. Subject Headings: Atmospheric composition symposia; Atmospheric pollution symposia; Urban air; Urban atmospheric pollution.
Spellman, G.1995 The urban climatology of Barcelona - an ideal heat island model? Journal of Meteorology, Wiltshire, England, 20 (198): 177-130.
GUC ML
ABSTRACT: A general study of the climate impact of urban areas and their implications is not well served by examples drawn from British cities. The city of Barcelona in Spain provides an impressive example of the mechanisms of heat island generation. Urban climatological studies lend themselves to an interdisciplinary approach that needs to consider urban morphology and planning in addition to climatic and geographic features. Subject Headings: Urban climatology; Urban heat islands; Barcelona, Spain.
Tuller, Stanton E.1995. Onshore flow in an urban area: microclimatic effects. International Journal of Climatology, Chichester, UK., 15(12): 1387-1398.
UH ML
ABSTRACT: Afternoon field observations contrasting waterfront and inland environmental conditions during summer, onshore flows from a cool water surface were conducted in residential areas of Victoria, British Columbia, Canada. The waterfront, under the direct influence of the onshore flow, had lower air temperature, vapour pressure, sky and ground radiant temperatures and a higher wind speed than did inland sites. Areas under the influence of the onshore flow would have a cooler environment for people and plants, lower interior building temperatures, and less evaporation demand. Subject Headings: Sea breeze effects on urban microclimate; Urban microclimates; Victoria, Bristish Columbia, Canada.
Unger, J., Ondok J.1995. Some features of urban influence on temperature extremities. Acta Climatologica, Szeged Hungaria, 28-29: 63-76.
GUC ML
18

ABSTRACT: This paper examines the influence of different built-up areas on the spatial distribution of numbers of summer, winter and frost days, as well as of dates of the last and first frost days and the lengths of the frost-free period. The investigation is based on the data series of an urban station network set up in Szeged, Hungary. The results revealed that the distribution patterns largely depend on the density and the building materials of the built-up areas, furthermore that the influence of large water bodies is rather significant. Subject Headings: Frost statistics; Urban influences on temperature; Szeged, Hungary.
Vasilyev, O. B. 1995. Spectral optical properties of the polluted atmosphere of Mexico City (spring-summer 1992). Journal of Geophysical Research, Washington, DC, 100(D12): 26027-26044.
QUA T
ABSTRACT: A joint Mexican, Russian, and American research effort has been initiated to develop new methods to remotely sense atmospheric parameters using ground-based, aircraft, and satellite observations. As a first step in this program, ground-based spectrophotometric measurements of the direct solar radiation have been obtained for the extremely polluted Mexico City atmosphere for the period of April-June 1992. These observations were made at more than 1300 channels in the spectral range of 0.35-0.95 m. In the ultraviolet (UV) portions of the spectrum (e.g., 0.35 m), aerosol optical thicknesses were found to range between 0.6 and 1.2; in the visible portion of the spectrum (e.g., 0.5 m) they ranged from 0.5 to 0.8; and in the near infrared (NIR) spectra (e.g., 0.85 m), values of 0.3-0.5 were found. Applying a spectral optical depth (SOD) model of ()=C+A values of 1.55 <<1.85 were obtained for polluted, cloudless days, with values of 1.25 <<1.60 on days with haze. The aerosol particles in the polluted Mexico City atmosphere were found to be strongly absorbing, with a single-scattering albedo of 0.7-0.9 in the UV, 0.6-0.8 in the visible portion of the spectrum, and 0.4-0.7 in the NIR. These values are possibly consistent with a high soot concentration, contributed both by vehicular traffic and heavy industry. Analysis of the measured aerosol SOD using the optical parameters of an urban aerosol model permits the concentration of aerosol particles to be estimated in the vertical column; a maximum value of 3x109 cm-2 was found. This concentration of aerosol particles exceeds that found in most other regions of the globe by at least an order of magnitude. Near the ground the aerosol size distributions measured using an optical particle counter were found to be strongly multimodal. Subject Headings: Urban atmospheric pollution; Optical investigation of atmospheric pollution; Mexico City, Mexico.
Yu, Hui; Luo, Zhexian.1995. Possible effects of urbanization on long-range trend of temperature evolution. Journal of Nanjing Institute of Meteorology, Nanjing, China. 18 (3): 450-454
19

GUC ML
ABSTRACT: In the context of January and annual mean temperatures from Lanzhou, Shanghai and their neighborhood, study is undertaken of the influence of urbanization on the long-term evolution of temperature. Results show that such impact is negligible when considering the localized warming of climate. Subject Headings: Urban influences on temperature; Lanzhou, Chinese (People’s) Republic; Shanghai, Chinese (People’s) Republic.
Al-Wali, K.I.; Samson P.J. 1996. Preliminary sensitivity analysis of urban airshed model simulations to temporal and spatial availability of boundary layer wind measurements. Atmospheric Environment, Oxford, England, 30(12): 2027-2042.
PhMUC GU
ABSTRACT: The 1992 Atlanta Field Intensive of the Southern Oxidants Research Program on Ozone Non-Attainment (SORP-ONA) provided a unique data set of urban meteorological measurements. The data were used to investigate the sensitivity of Urban Airshed Model (UAM-IV) results to the spatial and temporal resolution of upper-air meteorological measurements. RMS differences and average absolute deviations for winds and model calculated NOy and O3 values were computed for a variety of measurement strategies which differed in the spatial and temporal resolution of the upper-air data. A Lagragian Particle Dispersion Model (LPDM) was used to study the movement of the plumes from the Atlanta urban core and an elevated power plant located northwest of Atlanta. The results show that placement of upper-air measurements at or near the center of emissions density should be the highest priority of field measurements campaigns. Subject Headings: Urban air quality models; Atmospheric pollution dispersion; Wind effects on atmospheric pollution; Atlanta, Georgia.
Avissar, R.1996. Potential effects of vegetation on the urban thermal environment. Atmospheric Environment, Oxford, England, 30 (3): 437-448.
PhMUC GU
ABSTRACT: A state-of-the-art mesoscale atmospheric model equipped with a sophisticated land-surface scheme was used to study the potential impact of vegetation on the urban thermal environment and the wind generated by urban-rural contrasts. This numerical experiment indicated that complex non-linear land-atmosphere interactions, involving mesoscale and turbulent (microscale) processes, are generated when patches of vegetation are grown (or cut) in urban areas.
20

Various simulations, supported by observational evidences collected during METROMEX, demonstrated that vegetation can substantially affect the wind, temperature, moisture, and precipitation regime of urban areas. Thus, vegetation is believed to have very important practical applications in urban planning, e.g. heating and cooling requirements of buildings, dispersion and concentration of pollutants, and urban weather. If planned carefully, vegetation could be used to mitigate some of the anthropogenic effects generated by the development of urban areas. Subject Headings: Urban climatology; Vegetation influences on climate.
Baldasano, J. M.; Calbó, J., Costa, M. 1996. Importance of atmospheric transport processes in the urban air quality: the case of Barcelona. Computational Mechanics Publications. 2: 41-68.
QUA ML
ABSTRACT: Barcelona and its immediate area of influence is one of the largest urban areas in the Mediterranean. The city is placed on the Eastern coast of the Iberian Peninsula, among two river valleys, a mountain range and the sea. The rest of the area is also rather complex, with other mountains, valleys and flat zones, and shows several land uses: urban , industrial, forest, etc. Although it is not a strongly polluted area, it is sometimes affected by ozone episodes. The main goal of this work is to show how the atmospheric transport is an important factor to be taken into account when urban air pollution is studied, and how the topography influences it. Emissions, shown by means of an emission inventory model (EMITEMA-EIM), are clearly determined by topography. The dispersion of a passive pollutant, carbon monoxide, for a summer day with weak synoptic forcing and therefore, a well developed sea breeze, has been simulated by means of a meteorological prognostic model with dispersion routine (PROMETEO). The results are used to show how atmospheric processes affect air quality. Four-dimensional (three in space and time) behaviour of air pollution dynamics is emphasized throughout the paper. Subject Headings: Urban atmospheric pollution; Atmospheric pollution transport; Orographic effects on atmospheric pollution ; Barcelona, Spain.
Baur, B.; Baur, A.1996. Satellite imagery as a tool to evaluate habitat suitability for small animals. In: Parlow, E (ed), Progress in environmental remote sensing research and applications. Rotterdam, Netherlands, A.A. Balkema, 83-86.
RSUC ML
ABSTRACT: Remote sensing was used for mapping the surface temperature of the vegetation in the surroundings of Basel (Switzerland) to examine the suitability of the habitats for the land snail Arianta arbustorum. This snail species had become extinct at 16 (55.2%) out of 29 localities in the surroundings of Basel between 1908
21

and 1991. Habitat destruction by urban development was the reason for extinction of eight local snail populations. However, A. arbustorum also became extinct at eight localities, which were covered by vegetation suitable for the species and which still supported abundant populations of other snail species (all of them recorded in 1908). Local climatic warming was assumed to have caused the extinction of A. arbustorum, because its egg development is sensitive to high temperature; embryos die if the ambient temperature exceeds a specific threshold (approximately 23°C). The surface temperature of the vegetation extracted from the satellite imagery was significantly correlated with the mean maximum temperature recorded in situ in potential oviposition sites of A. arbustorum during summer 1992. During this period the surface temperature of the vegetation was significantly higher at localities where A. arbustorum became extinct compared to localities where the species still occurred. The satellite imagery showed that built-up areas (central business district and industrial areas) affect adjacent vegetation areas by emitting thermal radiation. This suggests that local climatic warming due to extensive urban development might have caused the extinction of A. arbustorum populations. Subject Headings: Urban influences on temperature; Temperature effects on animals; Basel, Switzerland.
Bozó, L.; Baranka, G. 1996. Air quality modeling over Budapest. In: Caussade, B.; Power, H. and Brebbia, C.A. (eds.), Air pollution IV: monitoring, simulation and control. Billerica, MA. Computational Mechanics Publications. p.31-36.
QUA ML
ABSTRACT: In Budapest, air quality is monitored by means of an up-to date monitoring system consisting of 8 stations in the city which provide continuos information on the actual level of CO, SO2, NOX, O3 and TSP concentrations. A multi-source Lagrangian-type dispersion model was applied for the estimation of the relative contribution of stationary industrial and energetical SO2 sources having different stack heights. The city was covered by 4225 grid squares (500mx500m each). Sources with different stack heights were considered separately during computations. Temporal variation in ambient concentration of SO2 is also presented for the period of 1991-1995. Subject Headings: Air quality models; Budapest, Hungary.
Cernuschi, S. et al 1996. Statistical models of CO concentration in a large urban area. In: Caussade, B.: Power, H. and Brebbia. C.A. (eds), Air pollution IV: monitoring, simulation and control. Billerica, MA. Computational Mechanics Publications. p.697-706.
QUA ML
22

ABSTRACT: Indications for the intervention strategies to be included in the context of air quality remediation plans for Milan metropolitan area are obtained by evaluating 5 years of hourly CO concentration data. The work reports on the analysis of standard exceedances and concentration time trends and on the development of empirical statistical modes for describing relationships between annual concentration averages and air quality related parameters (number of standard exceedances, extreme percentiles of hourly concentration distributions). The models are applied, in combination with simple roll back equations, for the evaluation of emission reduction required for standards attainment. Similar statistical approaches for describing the dependence of the duration of exceedance episodes over fixed concentration levels with simple time series parameters (i.e. annual mean concentration) are also reported. Subject Headings: Carbon monoxide in urban air; Carbon monoxide control; Milan Italy.
Chan, L. Y.: Qin, Y.: Chan, C. Y. 1996. Vehicular emission exposures of public transport commuters and pedestrians in comercial districts, Hong Kong. In: Caussade, .Power, H. and Brebbia, C.A. (eds), Air pollution IV: monitoring, simulation and control. Billerica, MA, Computational Mechanics Publications. p.593-600.
QUA T
ABSTRACT: Vehicular emission is the dominate air pollution source in Hong Kong. Commuters are exposed to vehicular emission during their daily commuting trips. Hong Kong has a convenience public transport system comprising buses, subway, railway, tram, taxis and ferry. This system overall carries just over 10 million passenger trips per day. A survey on public transport exposure of commuters and pedestrians has been conducted in commercial districts of Hong Kong. The exposures were surveyed according to different commuting traffic modes. 1 bus route, 3 lines of Mass transit Railway , l tram route and 19 fix points set up on roadside pavement in two commercial districts were monitored in the survey. Four criteria pollutants, CO, NOx, O3 and THC were selected as target pollutants. The vehicular emission exposures of bus, tram commuters and pedestrians were relatively high while exposures of Mass Transit Railway commuter were low. Compared to other metropolitan survey results in other parts of the world and the Hong Kong Air Quality Objectives, vehicular emission exposure levels of public transport commuters and pedestrians were low in commercial districts of Hong Kong. They were within acceptable levels. Subject Headings: Atmospheric pollution by motor vehicles; Atmospheric pollution and the public; Hong Kong.
Eliasson, I. 1996. Intra-urban nocturnal temperature differences: a approach. Climate Research, Oldendorf, Luhe, Germany, 7(1): 21-30.
23

GUC ML
ABSTRACT: The possibility of predicting nocturnal intra-urban air temperature differences on the basis of meteorological data from climatic stations was analysed. Three years of recording at an urban canyon and a nearby open area in the city of Göteborg, Sweden, formed the basis of the analyses. The urban canyon-urban open area temperature differences (Tc-o) were best estimated when the data was first classified with reference to the amount of cloud cover and then fitted to a non-linear regression equation which included the wind speed at the urban open area (10 m level). The study shows that the degree of intra-urban temperature variations can be predicted using a fairly simple methodology. The methodology and the general pattern of the model could be helpful as a complementary tool in urban land use planning for cities with a structure similar to Göteborg. Subject Headings: Urban temperature forecasting; Göteborg, Sweden.
Eliasson, I. 1996. Urban nocturnal temperatures, street geometry and land use. Atmospheric Environment, Oxford, England. 30(3):379-392.
GUC ML
ABSTRACT: The climate in the city of Göteborg, Sweden, was investigated for a three year period. In this paper the nocturnal temperature distribution is analysed in relation to differences in street geometry and land use. The seasonal and monthly air temperature difference between a street canyon and a nearby open area, as well as case studies of the vertical and horizontal temperature distribution within and between different urban units and urban districts are discussed. In spite of a good relationship between the local surface temperature and the sky view-factor, both continuous measurements and case studies show small variations between urban districts of different land use are greater. The average horizontal temperature decrease of 4°C in the transition zone from the city center to a large park southwest of the center are, in fact, of the same order as the average urban-rural air temperature difference. Subject Headings: Urban temperatures; Göteborg, Sweden.
Gallo, K.P.; Tarpley, J.D. 1996. The comparison of vegetation index and surface temperature composites for urban heat-island analysis. International Journal of Remote Sensing, London, England. 17(15): 3071-3076.
GUC ML
ABSTRACT: Relationships between urban-rural differences in minimum (in situ) air temperature (Tmin), normalized difference vegetation index (NDVI), and apparent surface radiant temperature (Tsfc) were examined for 28 cities in the
24

U.S.A. from 28 June through to 8 August 1991. Composites based on NDVI and thermal-IR data, and consistency in urban-rural differences in NDVI and Tsfc were examined. The urban-rural differences in Tsfc, whether based on as consistent as the urban-rural differences in NDVI. The composite process utilized, based on NDVI or thermal-IR data, did not appear to contribute to the generally low correlation between urban-rural differences in Tmin and Tsfc observed in previous studies. Subject Headings: Urban heat islands; Urban influences on temperature; Normalized Difference Vegetation Index (NDVI); United States.
García de Pedraza, L.1996. La contaminación y el clima de Madrid. (Pollution and climate in Madrid). Revista de Meteorología, Madrid, Spain. (14) 75-89
QUA ML
ABSTRACT: Climatic conditions and pollution over Madrid are surveyed, noting that aerosols, solids, and liquids in the air serve as filters for solar radiation, and that humid, contaminated air corrodes buildings and monuments. Attention is given to dust and impurities which can act, in humid conditions, as nuclei for condensation; sensible heat and latent heat; stable conditions, anticyclone situations, and inversions; and the fact that anticyclones favor inversions and stimulate pollution. The geographic situation of Madrid is described in terms of the effect of wind from various directions, as are temperatures in each of the four seasons, which have ranged from a minimum of -12.5° DDGC during February 1890 to a maximum of 40° DDGC in July of both 1980 and 1988. Also considered are rain and snowfall; the fact that Madrid Retiro has averaged 444 mm of precipitation per year between 1854 and 1989; major sources of contamination such as that from automobiles and airplanes; atmospheric pressure and wind; and health issues and bioclimatology. Subject Headings: Urban atmospheric pollution; Urban climates; Madrid, Spain.
Géczi, R., Dormány G. 1996. Some bioclimatic indicators of Kolozsvár (Cluj-Napoca), Romania. Acta Climatologica, Szeged, Hungaria, 30: 41-48.
UBCL ML
ABSTRACT: This paper investigates some bioclimatical indicators (pulmonary, thermal comfort and thermohygrometrical indices) given by a hundred-year and shorter climatological data series which are measured at the official station and another three characteristic parts of Kolozsvar (Cluj-Napoca). Subject Headings: Urban bioclimatology; Kolzsvar, Rumania.
25

Golany, G.S. 1996. Urban design morphology and thermal performance. Atmospheric Environment, Oxford, England, 30(3): 455-465.
UP GU
ABSTRACT: Climate specialists provide us today with much data on urban climatology; but it is urban design professionals who need to apply and translate this data into a design tool. This paper summarizes an urban design view of the relationship between urban design morphology and the thermal performance of the city. Its message is that each climatic region necessitates a distinct urban form and configuration which can contribute to make a city or neighborhood cooler or warmer, as is needed. It is the urban designer’s responsibility to provide these forms based on the study of the character of the local climate. Subject Headings: Urban climates; Urban temperatures; Town planning; Climate and town planning.
Grossi, P.; Giovannoni, J-M. 1996. Intercomparison of meteorological models applied to the Athens area and the effect on photochemical pollutant predictions. Journal of Applied Meteorology, Boston, MA, 35(6): 993-1008.
QUA ML
ABSTRACT: In this study, four different meteorological models, one diagnostic and three prognostic, are used to develop meteorological inputs for a photochemical model, as applied to the peninsula of Athens, Greece. The comparison of meteorological models results pointed out significant differences in the calculated wind fields, mainly during the night period. These differences are linked to specific aspects of the models, such as model vertical resolution, hydrostatic versus nonhydrostatic formulation, and numerical diffusion. During the day hours, models produce quite similar wind fields, which agree correctly with the available observations related to the Athens center area. Using the different wind fields as input to a photochemical air quality model led to similar urban ozone levels in the Athens area. Outside of the city, the different wind fields transport the urban plume in different directions in a range of 50°. The more primary pollutants, for example CO and NO2 concentrations, varied significantly due to the different wind velocities predicted by meteorological models. The effect of the atmospheric deposition can be near zero or can go up to 25% for ozone and to 45% for NO2. The determination of the most appropriate wind field to be used for the photochemical modeling would have required a more comprehensive set of observed data. Therefore, when data are scarce, it may be recommended to use different wind field modeling techniques to assess the sensitivity and the robustness of the predicted concentrations. Subject Headings: Urban atmospheric pollution; Photochemical atmospheric pollution; Athens, Greece.
26

Hughes, W.S. 1996. Urban influences on South African temperature trends. International Journal of Climatology, Chichester, UK, 16(8): 935-940.
GUC ML
ABSTRACT: Temperature trends are examined for a variety of locations in South Africa. The long-term mean annual temperature record (1885-1993) shows warming over the past century, with much of the warming occurring in the most recent three decades. However, our analyses show that half or more of this recent warming may be related to urban growth, and not to any widespread regional temperature increase. Maximum and minimum temperatures for the period 1960-1990 reveal a statistically significant decrease in the diurnal temperature range in large urban areas, but no change in the non-urban network. This assessment of the urban effects on temperature trends in South Africa may contribute to our understanding of apparent climate changes occurring in the Southern Hemisphere during the period of historical records. Subject Headings: Temperature trends; Urban influences on temperature; South Africa.
Jaecker-Voirol, A. 1996. A 3D regional scale photochemical air quality model-application to a 3 day summertime episode over Paris. In: Caussade, B.: Power, H. and Brebbia, C. A. (eds), Air pollution IV: monitoring, simulation and control. Billerica, MA., Computational Mechanics Publications. p.175-194.
QUA ML
ABSTRACT: This paper presents A3UR, a 3D Eulerian photochemical air quality model for the simulation of air pollution in urban and semi-urban areas. The model tracks gas pollutant species emitted into the atmosphere by transportation and industrial sources, it computes the chemical reactions of these species under varying meteorological conditions (photolysis, pressure, temperature, humidity), their transport by wind and their turbulent diffusion as a function of air stability. It has a modular software structure which includes several components dedicated to specific processes: MERCURE, a meso-scale meteorological model to compute the wind field, turbulent diffusion coefficients, and other meteorological parameters. It is a 3D regional scale model accounting for different ground types and urban densities. It includes a complete set of physical parameterizations in clear sky. An emission inventory model describing the pollutant fluxes from automotive transportation, domestic and industrial activities. This model includes a mobile source inventory based on road vehicle countings together with global information on transportation fluxes extracted from statistical population data. It uses specific emission factors representative of the vehicle fleet and real driving patterns. MoCA a photochemical gas phase model describing the chemistry of ozone. NOx, and hydrocarbon
27

compounds. This model with 8.3 species and 191 reactions, is a reduced mechanism well adapted to various air quality conditions (ranging from urban to rural conditions). For interpretative reasons, the identity of primary hydrocarbons is preserved. AIRQUAL, a 3D Eulerian model describing the transport by mean wind flux and air turbulent diffusion of species in the atmosphere, associated with a Gear type chemical equation solver. The model has been applied to a 3-day summertime episode over Paris area. Simulation results are compared to ground level concentration measurements performed by the local monitoring network. Subject Headings: Photochemical air quality models; Paris, France.
Jauregui, E., Romales, E. 1996. Urban effects on convective precipitation in Mexico City. Atmospheric Environment, Oxford, England, 30(20): 3383-3389.
GUC T
ABSTRACT: This paper reports on urban-related convective precipitation anomalies in a tropical city. Wet season (May-October) rainfall for an urban site (Tacubaya) shows a significant trend for the period 1941-1985 suggesting an urban effect that has been increasing as the city grew. On the other hand, rainfall at a suburban (upwind) station apparently unaffected by urbanization, has remained unchanged. Analysis of historical records of hourly precipitation for an urban station shows that the frequency of intense (>20 mm h-1) rain showers has increased in recent decades. Using a network of automatic rainfall stations, areal distribution of 24 h isoyets show a series of maxima within the urban perimeter which may be associated to the heat island phenomenon. Isochrones of the beginning of rain are used to estimate direction and speed of movement of the rain cloud cells. The daytime heat island seems to be associated with the intensification of rain showers. Subject Headings: Urban influences on precipitation; Mexico City, Mexico
Jelavic, V.: Sucic, H. 1996. Air quality impact study of the new Gas Combined Heat and Power Plant Zagreb. In: Caussade, B.: Power, H. And Brebbia, C.A. (eds), Air pollution IV: monitoring, simulation and control. Billerica, MA, Computational Mechanics Publications. P.395-404.
QUA ML
ABSTRACT: This paper presents the existing air quality situation in the City of Zagreb and the contribution of different groups of sources (public power plants, house holds and commercial, industry and traffic) to pollution, evaluated by urban air pollution model. The impact of new GCC unit in the TE-TO Zagreb plant on air pollution was superimposed on the existing situation. The calculations show that the contribution of upgraded TE-TO to the average long term concentrations is very
28

low but the contribution to short term NO2 concentrations could reach recommended limit values if NOx concentration in flue gases of the new unit would be about 100 mg/m3 . Subject Headings: Urban atmospheric pollution; Air quality; Zagreb, Croatia.
Kaplan, H.; Dinar, N. 1996. A Lagrangian dispersion model for calculating concentration distribution within a built-up domain. Atmospheric Environment, Oxford, England, 30(24): 4197-4207.
PhMUC GU
ABSTRACT: A Lagrangian model to study the dispersion of pollutants between urban buildings described. The flow field is supplied by an objective analysis (Rockle (1990) Ph.D. thesis, Vom Fachbereich Mechanik der Technischen Hochschule Darmstadt, Germany) and is adjusted to satisfy the continuity equation. From the resulting mass consistent field the Lagrangian diffusion parameters are eliminated. A 3-D Lagrangian diffusion model in a nonhomogeneous field is applied to calculate the pollutant distribution between the buildings. Several examples are studied and compared to wind tunnel measurements. Subject Headings: Dispersion models; Atmospheric pollution dispersion; Urban atmospheric pollution.
Kassomenos, P.: Lykoudis, S.: Petrakis, M. 1996. Vertical distribution of air pollutants released from elevated stacks in the Athens area. In: Caussade, B.: Power, H. and Brebbia. C. A. (eds), Air pollution IV: monitoring, simulation and control, Billerica, MA, Computational Mechanics Publications. p. 677-686.
QUA ML
ABSTRACT: The main features that characterize the Athens Metropolitan Area (AMA) are its geographical position in the Attic Peninsula, the complicated topography and the neighboring industrial zone, located to the west and separated from the AMA by a hilly area. The possibility of air pollutants transport from this area to Athens has been the subject of a number of theoretical and experimental works in the past. In this paper using the meteorological and dispersion modeling system EZM, the vertical distribution of air pollutants, released from a number of stacks of various types and characteristics, and transported over Athens, was simulated and discussed. It was found that the vertical distribution mainly depends on the physical height of the stacks. Subject Headings: Vertical distribution of atmospheric pollution; Stack effluent dispersion; Athens, Greece.
29

Kato, H. 1996. A statistical method for separating urban effect trends from observed temperature data and its a application to Japanese temperature records. Journal of the Meteorological Society of Japan, Tokyo, Japan. 74(5): 639-653.
GUC ML
ABSTRACT: Separating the impact of urbanization (urban effect temperature trends) from observational data at urban monitoring sites is an important problem in the detection of global warming impacts. A statistical method using principal component analysis of the temperature data in an area was developed to separate the urban effect temperature trend from the observed temperature record at urban stations, including those without nearby rural reference stations. After the mathematical description of the method, an example of the analysis for model data on which some trends are superimposed (given) at any stations was shown for an explanation of the method. This example not only clarified the performance (impact, weight) of the superimposed trend in the trend for each principal component score (Z-score) but also showed how all the superimposed trends were separated from the model data by this method. This method was applied to monthly mean temperature data for the past 73 years (1920-1992) from 51 meteorological stations in Japan, and the urban effect temperature trend at each station was separated from the observed trend. As a result of the analysis, it was clarified that in Japan the maximum urban effect temperature trends at stations with a population of over 100 thousand in 1993 were 1.0-2.5° C/100 years, which were almost the same as those in the United States and China. The urban effect temperature trends in big cities are larger in the cold season than in the warm season, being maximum in winter or autumn and minimum in summer. After removing the urban effect temperature trend, the annual mean temperature trends at stations in Japan over the period analyzed ranged from 0.5°C/100 years in northern Japan to 1.1°C/100 years in western Japan with the areal mean for Japan of 0.8°C/100 years. The positive trends are most notable in winter and spring (December to May), and show areal mean values of 1.0-1.6°/100 years with the maximum in March. On the other hand, they are not marked in summer and autumn. In particular, in the northern part of Japan, negative trends appear from July to November. The area with negative trends below -1.0°C/100 years extends over most of the northeastern half of Japan in July, but does not reach the southern part of Japan, which has a slight positive trend. As a result of these regional differences in temperature trends, the north-south temperature gradient increases in summer and autumn with the maximum trend difference of 2.0°C/100 years in July and October. Subject Headings: Temperature trend determination; Urban influences on temperature; Japan.
Kuttler, W.; Barlag, A-B.; Rossmann, F. 1996. Study of the thermal structure of a town in a narrow valley. Atmospheric Environment, Oxford, England. 30(3): 365-378.
30

GUC ML
ABSTRACT: This study examines the influence of urban and topoclimatic factors on the temperature field of Stolberg, Germany, a densely built up town in a valley, on the basis of stationary and mobile measurements during cloudless and nearly calm weather conditions. Qualitative and quantitative statements are made about the extent of influence by invariable parameters (percentage of sealed area, height) and by variable conditions (wind velocity, time, temperature amplitude) on thermal conditions in the investigated area. An observed influence of cold air on the temperature field near the ground required further study of wind field influences due to topographic conditions and of an analysis of intensity and frequency of valley inversions. Regarding clear and calm weather conditions, results show a significant relationship between thermal conditions and the percentage of sealed area, as well as topographical height. As a result of roughness of the built up area, the nocturnal urban excess temperature is not reduced by cold air drainage until the second half of the night. The high production of cold air causes the nocturnal component of a mountain and valley wind regime, which explains the accelerated cold air transport from above the urban canopy layer as well as the frequency of valley inversions. While ground level inversions exist in the rural area of the valley, the urban heat island effect causes an inversion at a higher level above the developed valley area. Subject Headings: Urban influences on temperature; Topographic effects on temperature; Valley temperatures; Stolberg, Germany.
Moreno-Grau, S. et al. 1996. Total suspended particulate matter and lead from 1990 to 1994 in the atmospheric aerosol from the industrial-urban areas of Cartagena (Spain). In: Caussade, B.; Power, H. and Brebbia, C.A. (eds), Air pollution IV: monitoring, simulation and control. Billerica, MA, Computational Mechanics Publications. p. 353-362.
QUA ML
ABSTRACT: Potential hazards shown by airborne particulate matter have developed an increasing interest in the atmospheric aerosol study. The presence of metallurgical, fertilizer and naval industries at the city of Cartagena, as well an oil refinery, have caused very important air pollution problems. TSP and lead content measurements are considered the main basic parameters in the atmospheric aerosol quality control. This paper picks up the evolution of these parameters along a five year study. Subject Headings: Particulate matter in atmosphere; Lead content of air; Industrial atmospheric pollution; Cartagena, Spain.
Nava, M, et al. 1996. Ozone groundlevels as an air quality indicator for the Mexico City Metropolitan Area (MCMA) from 1986 to 1994. In: Caussade, B.; Power, H. and Brebbia, C.A. (eds),
31

Air pollution IV: monitoring, simulation and control. Billerica, MA, Computational Mechanics Publications. p.565-572.
QUA T
ABSTRACT: This paper shows a study of ozone behavior in the atmosphere of the Mexico City Metropolitan Area (MCMA) from 1986 to 1994. Seasonal variation, trends, standard exceedences and precursors behavior were analyzed. The information obtained was used to evaluate some of the strategies implemented by the pretroleum industry to control ozone is the atmosphere of the MCMA. Results of the study show that the highest levels of ozone on a certain year were recorded during winter and spring time. The historic highest average concentrations occurred in 1991, since then smaller concentrations have been observed, and the number of days with concentrations above 0.23 ppm, twice the Mexican air quality standard for ozone, has also decreased. Subject Headings: Ozone in urban air, Mexico City, Mexico.
Nichol, J.E.1996. High-resolution surface temperature patterns related to urban morphology in a tropical city: a satellite-based study. Journal of Applied Meteorology, Boston, MA., 35(1): 135-146.
RSUC T
ABSTRACT: High-resolution thermal data derived from LANDSAT’S thematic mapper are evaluated for their correspondence to building geometry and landscape features in Singapore’s high-rise housing estates. The image data area sufficiently detailed to reveal that differences in solar azimuth on images taken at different times of year create different thermal patterns due to building geometry and surface materials. Field measurements of surface and adjacent air temperatures in urban canyons at different orientations and at different elevations above ground demonstrate that for Singapore conditions satellite-derived surface temperature patterns are a good indicator of the daytime urban heat island. Subject Headings: Urban temperatures; Urban heat islands; Singapore.
Niemczynowicz, J. 1996. An international workshop: “Closing the gap between theory and practice in urban rainfall applications”. Atmospheric Research, Amsterdam. 42(1-4): 1-294.
UH GU
ABSTRACT: This workshop was a follow-up of the first international event on urban rainfall after a previous event on “Urban rainfall and meteorology” held in St. Moritz, Switzerland also in December 1990, both workshops were organized by
32

the Department of Water Resources Engineering, University of Lund together with the Department of Geography of the Swiss Federal Institute of Technology in Zurich. The need for regular workshops on urban hydrology is based on the fact that the goals of society in this specific field of science and practice area changing very quickly in the last few years and, in addition, are different between the developed and developing countries. Thus for example, environmental protection and recovery of resources are the main problems addressed at in most developing countries at the moment. On the other hand, data availability and development of reliable methods for analysis of inadequate data are the main problems in developing countries. In most of the urban hydrological applications available rainfall data are insufficient to explain extreme temporal and spatial variability in rainfall. Rainfall data constitute an input to many urban hydrological calculations such as modeling of urban runoff and pollution washoff, design and management of sanitation and drainage facilities, real-time control of urban water systems, etc. There is an important gap in basic knowledge about small-scale rainfall processes which is important for design and analysis of urban runoff. There is also a gap between existing rainfall data and practical needs of urban hydrologists. Hydrology of urban areas, dealing with relatively small catchments compared with rural areas, requires rainfall data with very high time and space resolution. Such data are hardly available from national weather services. The lack of adequate rainfall data is a main problem which delays progress in the water management of urban areas. Thus, the goal of the second St. Moritz workshop was to provide a forum for discussion of current problems with collection, processing and application of small-scale rainfall data adequate for urban hydrological problems. The workshop objectives were to improve the knowledge about small-scale processes, to assess the present state of application of rainfall data in urban hydrology and to create a scientific basis for improvement in rainfall data application in urban hydrology. Subject Headings: Precipitation conferences; Urban rainfall; Urban hydrology.
Nowacki, P.; Samson, P.J.; Sillman, S. 1996. Sensitivity of Urban Airshed Model (UAM-IV) calculated air pollutant concentrations to the vertical diffusion parameterization during convective meteorological situations. Journal of Applied Meteorology, Boston, MA, 35(10): 1790-1803.
QUA ST
ABSTRACT: It is shown that Urban Airshed Model (UAM-IV) calculated air pollutant concentrations during photochemical smog episodes in Atlanta, Georgia, depend strongly on the numerical parameterization of the daytime vertical diffusivity. Results found suggest that vertical mixing is overestimated by the UAM-IV during unstable daytime conditions, as calculated vertical diffusivity values exceed measured and comparable literature values. Although deviations between measured and UAM-IV calculated air pollutant concentrations may only in part be due to the UAM-IV diffusivity parameterization, results indicate the large error
33
potential in vertical diffusivity parameterization. Easily implemented enhancements to UAM-IV algorithms are proposed, thus improving UAM-IV modeling performance during unstable stratification. Subject Headings: Urban air quality models; Vertical diffusion of atmospheric pollution; Atlanta, Georgia.
Pirrone, N. 1996. A preliminary assessment of the urban pollution in the Great Lakes region. Science of the Total Environment, Amsterdam, The Netherlands, 189/190: 91-98.
QUA ML
ABSTRACT: Trends in emissions of trace elements to the atmosphere in the Great Lakes region are compared with those of ambient concentrations observed in the urban areas of Chicago, Detroit, Cleveland and Toronto from 1982 to 1993. Lead emissions show a steady decrease throughout the region, whereas the emissions of Ni, Cr, Cu, Mn and Cd are following upward trends, and As emissions do not show substantial changes. Our estimates by source category suggest that the emission of trace elements from iron-steel manufacturing, waste incineration and non-ferrous metal production are steadily increasing, whereas emissions from oil combustion are decreasing and that from coal combustion do not show significant changes since 1982. A trend analysis performed on the ambient concentration data from all the urban sites shows a steady decrease of Pb concentrations (3-20%/yr) in all the urban areas, whereas the level of other trace elements is following upward and downward trends depending upon the urban area and sample site locations. Subject Headings: Urban atmospheric pollution; Atmospheric pollution emission: Great Lakes Region, North America.
Poreh, M. 1996. Investigation of heat islands using small scale models. Atmospheric Environment, Oxford, England. 30(3):467-474.
PhMUC GU
ABSTRACT: The possibility and criteria for small scale physical modelling of urban heat islands are examined. It is shown that the flow and temperature fields above a particular class of urban heat islands, which are termed simple heat islands (SHI), can be modelled using area sources of buoyancy produced by either fires with thin combustion layers, hot plates or a flux of helium. Available measurements of the flow and temperature fields induced by such area sources of buoyancy are used to analyze the characteristics of SHIs. The analysis reveals several new interesting characteristics of heat islands. The possibility of modelling the flow and temperature field above different types of heat islands is also examined. Subject Headings: Urban heat islands.
34
Raga, G. B. 1996. On the nature of air pollution dynamics in Mexico City. I: Nonlinear analysis. Atmospheric Environment, Oxford, England, 30(23):3987-3993.
QUA T
ABSTRACT: We have applied a nonlinear dynamic analysis to air quality data (ozone, carbon monoxide, nitrous oxide and sulfur dioxide) obtained at 13 of the surface stations of the automated monitoring network in Mexico City, following the work of Li et al. (1994, Atmospheric Environment 28, 1707-1714). The time series used consisted of hourly data obtained during 1993. The analysis has helped to identify the nature of the dynamics of ozone production and we have determined the number of degrees of freedom of the system. Interestingly, this value varied with location within the city, ranging from two (at a station located downtown) to eight. We suggest that this difference may be linked to variations in local orography that forces a vortex-type circulation within the basin through out the year. Subject Headings: Urban atmospheric pollution; Ozone production; Mexico City, Mexico.
Ripley, E. A. 1996. Temporal and spatial temperature patterns in Saskatoon. Weather, Bracknell, England. 51(12): 398-405.
GUC ML
ABSTRACT: Temperature data from mainline stations and automobile-mounted transects reveal interesting temporal and spatial variations over the city of Saskatoon. Most of the observed 1.5 degC increase in mean annual temperature over the last century was probably due to climatic change, except for a few tenths of a degree which may be attributable to urbanisation. The latter was likely to have raised minimum temperatures only, thereby reducing the daily temperature range. Month-to-month variations in the climatic warming are consistent with a phase change in the annual cycle, i.e. with earlier arrival of the seasons, although no explanation for this is available. Analysis of the data presented in this study indicates that even a relatively small city may exhibit a pronounced heat island during clear, calm weather. The effects of the river, differential tree cover and distance from the city centre are discernible in some of the records. Average heat-island intensity, measured during 13 automobile transects, was 4.6 degC, consistent with the predicted value for a city the size of Saskatoon; highest values were near 8 degC during sunny midsummer days. These occurred under conditions of clear skies and light-to-moderate winds. In spite of its low population density (1500 km -2), lack of heavy industry, and abundance of parks and other spaces, Saskatoon appears to be noticeably warmer than the surrounding countryside. The observed differences may have impacts on human comfort, residential heating and air-conditioning costs, the growth and development of plants, and the survival of small
35

animals and birds. Continued growth of the city will probably accentuate these effects. Subject Headings: Urban temperatures; Urban heat islands; Saskatoon, Saskatchewan, Canada.
Saitoh, T.S.1996. Modeling and simulation of the Tokyo urban heat island. Atmospheric Environment, Oxford, England. 30(20): 3431-3442.
PhMUC ML
ABSTRACT: Rapid progress in industrialization and urbanization has resulted in the concentration of economic growth and social functions in the urban areas. In most urban cities, it has become more and more certain that the increase of energy consumption is causing environmental problems including the temperature rise in the urban atmosphere (urban heat island) and air pollution. The present paper reports on the results of field observation and three-dimensional computer simulation of the urban heat island in the Tokyo metropolitan area. The three dimensional governing equations for the urban atmospheric boundary layer were formulated by virtue of the vorticity-velocity vector potential method. Particular attention was focused on the representation of a buoyancy term in the equation of motion in the vertical direction, thereby describing the cross-over effect and stratified inversion layer near the ground surface. The vorticity-velocity potential method is superior from the viewpoint of numerical stability and suitable for the simulation of an urban heat island. A survey on the energy consumption was first made in the Tokyo metropolitan area. Next, these data were used for the three-dimensional simulations. In order to evaluate the validity of the present model to simulate the urban heat island, the simulation was carried out by initializing it with the same meteorological conditions as those used for the observation day. The simulation results were then compared with the field observation data for the surface temperatures. Quite a good agreement was obtained between the present simulation and the observed data, thereby assuring the present model. Further future prediction of the urban heat island was performed for an energy release rate five times as much as the present rate, which corresponds to the year 2031 if the present consumption rate is maintained until then. Subject Headings: Urban heat islands; Tokyo, Japan.
Sakakibara, Y.1996. A numerical study of the effect of urban geometry upon the surface energy budget. Atmospheric Environment, Oxford, England, 30(3): 487-496.
PhUC GU
ABSTRACTS: This numerical study investigates the effect of urban canyon geometry upon the thermal environment using a parking lot model and an urban
36

canyon model in identical meteorological conditions. The urban canyon model assumes two buildings on opposite sides of a street no windows or interior anthropogenic heat source, an infinitely long east west oriented canyon, and waterproof surfaces. The simulated surface temperatures agree well with those obtained by field measurement. The energy balance of the urban canyon is represented by that of the canyon top, which is an imaginary surface. The urban canyon, whose top surface is a plane above the canyon at the same level as the roof surface of the building, absorbs more heat in the daytime and releases more at night than the parking lot. The urban thermal environment depends on an urban geometry which particular to the urban canyon model produces reduced small sky view factors and complicated daytime shadow patterns. The results show that this urban geometry contributes to urban heat island formation. Subject Headings: Urban microclimatology; Energy budget of urban areas; Urban heat islands.
San José, R, et al. 1996. A sensitivity analysis of a high resolution emission model under different emission scenarios over Madrid area. In: Caussade, B.; Power, H. and Brebbia. C.A. (eds), Air pollution IV: monitoring, simulation and control. Billerica, MA. Computational Mechanics Publications. p. 707-716.
QUA ML
ABSTRACT: Emission models are a key module of the Air Quality Systems particularly in the case of modeling the pollutant air concentrations in urban areas. The necessity of detailed emission models is an essential requirement of having an accurate and sensitive Air Quality System to predict the air concentrations on detailed spatial and temporal distribution. Recently, the biogenic emissions have been incorporated in detailed emission models to take into account its influence on the VOC budget. Different emission scenarios are applied into an Air Quality Model (ANA) over Madrid Area. Anthropogenic and biogenic emissions are included in the 250X250 emission model. The Air Quality System takes into account a detailed resistance deposition approach for different pollutants, a LANDSAT satellite landuse classification, an Eulerian Transport Model and a complex detailed mesoscale non-hydrostatic model REMEST. The different emission scenarios are applied to June, 5-7, 1995 period after validating the emission model with observed concentrations at different urban stations. Results show that increase and decrease simulations produce decrease of increase values of ozone in function of the increase (or decrease( percentages and depending on the absolute values of ozone. The results suggest that important reductions on NOx and VOCs may lead to increments in ozone levels in urban areas. More important reductions in those emissions can lead to reductions in ozone levels. Important increase in those emissions lead to substantial reductions in ozone levels. Subject Headings: Air quality models; Ozone-atmospheric pollution relationships; Madrid, Spain.
37

Spicer, Ch.W. 1996. Variability of hazardous air pollutants in an urban area. Atmospheric Environment, Oxford, England, 30(20): 3443-3456.
QUA ML
ABSTRACT: The variability of hazardous air pollutants (HAPs) is an important factor in determining human exposure to such chemicals, and in designing HAP measurement programs. This study has investigated the factors which contribute to HAP variability in an urban area. Six measurement sites separated by up to 12 km collected data with 3 h time resolution to examine spatial variability within neighborhoods and between neighborhoods. The measurements were made in Columbus, OH. The 3 h results also were used to study temporal variability and duplicate samples collected at each site were used to determine the component of variability attributable to the measurement process. Hourly samples collected over 10 days at one site provided further insight into the temporal resolution needed to capture short-term peak concentrations. Measurements at the 6 spatial sites focused on 78 chemicals. Twenty-three of these species were found in at least 95% of the 3 h samples, and 39 chemicals were present at least 60% of the time. The relative standard deviations for most of these 39 frequently detected chemicals was 1.0 or lower. Variability was segmented into temporal, spatial, and measurement components. Temporal variation was the major contributor to HAP variability for 19 of the 39 frequently detected compounds, based on the 3 h data. Measurement imprecision contributed less than 25% for most of the volatile organic species, but 30% or more of the variability for carbonyl compounds, trace elements, and particle-bound extractable organic mass. Interestingly, the spatial component contributed less than 20% of the total variability for all the chemicals except sulfur. Based on the data with hourly resolution, peak to median ratios (hourly peak to 24 h median) averaged between 2 and 4 for most of the volatile organic compounds, but there were two species with peak to median ratios of about 10. Subject Headings: Urban atmospheric pollution; Atmospheric pollution and health; Columbus, Ohio.
Todhunter, P.E. 1996. Environmental indices for the Twin Cities Metropolitan Area (Minnesota, USA) urban heat island. Climate Research, Oldendorf, Luhe, Germany, 6(1): 59-69.
GUC ML
ABSTRACT: A homogeneous, high-density, daily maximum and minimum air temperature dataset was assembled for the Twin Cities Metropolitan Area (TCMA), Minnesota, to conduct basic urban climatological investigations on the spatial structure and temporal-scale dependence of the urban heat island, and to quantify the urban heat island effect upon several derived environmental indices. By combining data from National Weather Service cooperative stations, the University of Minnesota-St. Paul field station, and the previously unused KSTP-TV cooperative
38

weather station network, a merged dataset of 26 stations was assembled for the TCMA for the year 1989. Extensive quality control was conducted to identify suspect data values, estimate missing data, and adjust for time-of-observation bias. Eight environmental indices were examined to overview the impact of the TCMA urban heat island upon a range of physical and biological activities. These included 2 growing degree-day indices, melting degree-days, cooling and heating degree-days, freezing degree-days, number of frost change-days, and the freeze-free season length. Results illustrate the magnitude and spatial pattern of the urban heat island and derived thermal indices which might be typical of a large midlatitude midcontinental metropolitan area. The mean annual air temperature urban heat island is approximately 2.1°C, and resembles the classic spatial pattern consisting of a peripheral zone of rapid temperature increase, a large plateau of elevated air temperatures, and a small central core of peak temperatures. The impact of the urban heat island upon the magnitude and spatial pattern of the 8 environmental indices was highly index-specific. In many cases, the urban heat island effects are so profound that the response and adaptation of selected environmental systems to the historical urban warming should be evident. Urban environments would appear to offer a suitable laboratory for selected climate change impact studies. Subject Headings: Urban heat islands; Minneapolis/St. Paul, Minnesota.
Tso, C.P. 1996. A survey of urban heat island studies in two tropical cities. Atmospheric Environment, Oxford, England. 30 (3): 507-519.
GUC T
ABSTRACT: Studies on the urban heat island effects in two adjacent tropical cities, Singapore and Kuala Lumpur, are surveyed. Past efforts have concentrated on surface temperature mapping relying largely on spot measurements, which, although are inadequate, to indicate the existence of warm spots associated with urbanization. Examination of station records have indicated perceptible temperature increases in both cities, though there has been no concerted effort to facilitate comparative studies. Recent work includes implementation of more systematic data acquisition, the use of the remote technology, as well as surface energy balance modeling. Directions for future work is discussed. Subject Headings: Urban heat islands; Singapore City, Singapore; Kuala Lumpur, Malaysia.
Tsutsumi, J-I.; Bornstein, R.D.1996 Conference on the Urban Thermal Environmental Studies in Tohwa (CUTEST). Atmospheric Environment, Oxfor, England. 30 (3) 359-544.
GUC GU
39
ABSTRACT: This special issue is the proceedings of the CUTEST ‘92 Conference. The first conference in this series was held in 1988 at Kyushu University in Fukuoka, Japan. It was called the Conference on the Urban Thermal Environment (CUTE). Since then the Conference has been held yearly in western Japan, and has been attended by scientists interested in urban climatology and the urban thermal environment. The conference was attended by 128 delegates from 21 countries, including 91 from Japan. A total of 96 papers were submitted to the Conference. Seventy-six papers were presented by 68 delegates, including 20 guest speakers, in 18 sequential technical sessions. Subject Heading: Urban Climatology symposia.
Unger, J. 1996. Heat island intensity with different meteorological conditions in a medium-sized town: Szeged, Hungary. Theoretical and Applied Climatology, Vienna, Austria, 54(3-4): 147-151.
GUC ML
ABSTRACT: An analysis of the effects of the town Szeged, Hungary, on minimum temperatures between 1978 and 1980 in presented. The characteristics of the urban heat island effect were examined by revelation of the relationships between heat island intensity and macrosynoptic types, cloudiness, wind speed as well as the combination of cloud amount and wind speed. Anticyclonic weather situations, little or no cloud coverage, and calm or slight wind were favourable for a strong development of the heat island effect. In the case of extreme heat islands the domination of anticyclonic weather types was almost absolute. Subject Headings: Urban heat islands: Szeged, Hungary.
Unger, J. 1996. The main results of the nearly 30-year-old urban climatological research in Szeged, Hungary. Acta Climatologica, Szeged, Hungaria, 30: 99-112.
GUC ML
ABSTRACT: This paper describes the most important results of urban climatological investigations, which goes back to the 1960s, in a medium-sized Hungarian town, Szeged. The overview analyses the period between 1967 and 1995 and it contains every retraceable work (papers, theses and manuscripts) which dealt with the urban climate of Szeged. So many years of documentation is also valuable as it gives the most detailed and most extensive picture among the Hungarian country towns of the climate modification effects of a bigger town. Subject Headings: Urban climates; Szeged, Hungary.
40

Xie, Z. 1996. Asymmetric changes in maximum and minimum temperature in Beijing. Theoretical and Applied Climatology, Vienna, Austria. 55(1-4): 151-156.
GUC ML
ABSTRACT: Based on observational data at Beijing since 1940, trends in daily maximum, minimum and mean temperatures are studied. It is shown that the linear rate of increase in minimum temperature is 4.08°C/100 yr; whereas the maximum temperature decreases with linear rate of 0.245°C/100 yr; Consequently, the diurnal temperature range (DTR) becomes smaller. Warming in Beijing occurred mainly in the daytime in the 1940s; but in the night in the 1980s. Although the latter has been found in other studies, the former is a new discovery. The difference of temperature and the diurnal temperature range between urban and suburban areas in Beijing are also analysed. The results show that the urban heat island effect (UHIE) has been becoming larger, and during 1960-1989 the change in UHIE in summer is larger than in winter. Since the warming (sic) trend does not match the change of UHIE in last two decades, it is thought that UHIE is not the main factor contributing to climatic warming. Subject Headings: Maximum-minimum temperature trends; Diurnal temperature range; Urban heat islands; Beijing, Chinese (People’s) Republic.
Yamashita, S. 1996. Detailed structure of heat island phenomena from moving observations from electric tram-cars in metropolitan Tokyo. Atmospheric Environment, Oxford, England, 30(3): 429-435.
GUC ML
ABSTRACT: In this study, the detailed horizontal structure, i.e. cliffs and plateaux of the heat island of the Metropolitan Tokyo area is in investigated. According to Oke (1977), cliff is steep temperature gradient at the rural/urban boundary and plateau is a steady but weaker horizontal gradient of increasing temperature towards the city center. However, these features are not always evident, e.g. large city like Tokyo. To elucidate such aspects, moving observations of the horizontal distribution of air temperature from electric trains of the transportation network of Metropolitan Tokyo during late evening early morning were thus conducted. In total, 16 railroad lines were used for the moving observations. The observations. were done in two phases for sectional and horizontal distributions. Results show that three cliffs exist in the heat island of Metropolitan Tokyo, although the location of these cliffs should be taken into consideration for urban planning or urban redevelopment. Subject Headings: Urban heat islands; Mobile temperature surveys; Tokyo, Japan.
41

Yoshikado, H. 1996. High levels of winter air pollution under the influence of the urban heat island along the shore of Tokyo Bay. Journal of Applied Meteorology, Boston, MA, 35(10): 1804-1813.
QUA ML
ABSTRACT: A wintertime small-scale sea breeze associated with high levels of air pollution is described, in which the urban heat island plays an important role. Over a major portion of the Kanto plain, the winter surface air temperature varies diurnally, ranging from 0° to 12°C on average. The water temperature in the innermost part of Tokyo Bay, surrounded by the plain, is maintained at 8°-10°C. The land-sea temperature contrast that generates sea breezes, however, is intensified by two processes: (i) the heat island associated with the Tokyo metropolitan area on the northwestern shore of the bay increases the land air temperature, and (ii) the nocturnal outflow of cool land air, the result, of radioactive cooling, covers the bay, causing the sea air temperature to be lower than the water temperature during the morning hours. As a result, the sea breeze frequently penetrates into the heavily urbanized area, extending about 20 km from the bayshore. Since the sea breeze is coupled with the heat island, it does not penetrate farther inland. A convergence zone persists over the urbanized area, which in turn results in very high concentrations of pollutants. An analysis of a typical episode is also discussed to more realistically describe the behavior of air pollution than for the averaged case. Subject Headings: Urban atmospheric pollution; Urban influences on atmospheric dispersion; Sea breeze effects on atmospheric pollution; Tokyo, Japan.
Asaeda, T. and Vu, C.T1997. Effects of different pavements on the urban thermal environment. Proceed. of the AAG 93 rd Annual Meeting, Fort Worth, Texas, USA. 1997.
EUC GU
ABSTRACT. The effects of various pavements covered by different materials on the urban thermal environment during hot summer days is studied by outdoor experiments and numerical analysis. It was found that the surface temperature, heat storage and the subsequent heat released to the atmosphere were significantly greater for asphalt and concrete pavements compared with the for others. At noon, asphalt pavement emitted an additional 130 W m-2 in infrared radiation and 200 W m-2 in sensible heat transport compared to a vegetated surface. The heat storage of the asphalt pavement is released to the atmosphere at night and causes the nocturnal urban heat island.The utilization of normal porous block pavement does not improve the urban thermal environment since the large pore inside the pavement material helps it to drain the previous contained water rapidly and makes its surface dry. On the other
42

hand, the ceramic porous pavement, which has small pores inside, can absorb a large amount of water after a rainfall or from the underlying soil. The water contained in the pavement is later evaporated and helps to keep the pavement surface temperature much lower than that of the normal porous pavement.A numerical model coupling the heat and vapor transfer in the air and the heating/evaporation processes at the ground surface was developed to study the impact of pavement samples on the micro scale thermal environment. Results of the computation reveal that the evaporation at the ceramic pavement surface is the most important reason for making its surface temperature lower than that of other pavements. At 2 p.m., air temperature at 3.5 m above the asphalt pavement is about 2 K higher than that above the ceramic pavement. At 8 p.m., this difference is more than 1K.Keyword: climatology-urban, urban heat island, heat storage.
Baik, J-J. 1997. A dynamical model for urban heat islands. Boundary-Layer Meteorology, Dordrecht, The Netherlands. 83(3): 463-477.
PhMUC GU
ABSTRACT: Effects of nonlinearity on the airflow past an urban heat island and precipitation change downwind, are investigated analytically in the context of the weakly nonlinear response of a stably stratified uniform flow to specified heating. The heating structure is assumed to be bell-shaped in the horizontal and exponentially decreasing with height. The forcing to the first-order equation exhibits cooling in the concentrated low-level heating region. The linear solution component shows upward motion downstream as suggested by many previous studies. The weakly nonlinear solution component shows downward or upward motion downstream depending on the heating depth. It is proposed that when the heating depth is large, but still within a valid range of the perturbation expansion, the linear and weakly nonlinear effects constructively work together to produce enhanced upward motion on the downstream side, not far from the heating centre. This explains to a greater extent the precipitation enhancement downstream of the heat island than is possible from the linear effect alone. It is also proposed that when the heating depth is small, the linear and weakly non linear effects destructively work together to reduce upward motion on the down stream side, not far from the heating centre. This explains to a greater extent the lack of precipitation enhancement downstream than is possible from the linear effect alone. Subject Headings: Urban heat islands; Urban influences on airflow; Urban influences on precipitation.
Cerveny, R.S.1997. Inadvertent modification of hurricanes by urban pollution. Proceed. of the AAG 93 rd Annual Meeting, Fort Worth, Texas, USA. 1997.
43

GUC GU
ABSTRACT. A significant human influence is observable in tropical cyclone intensity. Urban pollution from the eastern and southern United States produces an identifiable weekly cycle in the strength and frequency of near-coastal Atlantic and Gulf of Mexico tropical cyclones. Fifty years of data show significant changes in both maximum wind speed and minimum central pressure occurring in weekend versus midweek observations of near-coastal tropical cyclones.This variability corresponds to an observed weekend maximum in urban pollution, termed the “Sunday effect” in past research. A dichotomy of response is visible; weekends are characterized by weaker and more frequent tropical storm observations but also by more intense and frequent major hurricane observations than the rest of the week. The rapid weekend intensifications of Hurricanes Irene, Elena and Andrew are suggested as examples of the latter response.Keyword: climatology, hurricane, urban pollution.
Deacon, A.R. 1997. Analysis and interpretation of measurements of suspended particulate matter at urban background sites in the United Kingdom. the Science of the Total Environment, Amsterdam, The Netherlands. 203(1): 17-36.
QUA ML
ABSTRACT: Monitoring of atmospheric particulate matter as PM10 commenced in the UK in 1992, and by 1995 16 national network stations sited at urban background locations were reporting data. The concentrations conform closely to log normal distributions and statistical properties of the data are reported. The data have been analysed for relationships to other pollutants, and close correlations with carbon monoxide (CO) and nitrogen oxides (Nox) are observed for much of the time at all sites for which adequate data area available. These analyses indicate the importance of vehicle-emitted PM10 as a contributor to atmospheric concentrations and confirm the ratio of PM10 to carbon monoxide emissions from road traffic indicated by the national and London inventories. Analyses of data from Leeds have shown an occasional impact of power station emissions on urban PM10. In comparison to the primary sources of PM10, secondary sulphates and nitrates show less small scale spatial variability, but a mapping of data from the European Monitoring and Evaluation Programme (EMEP) indicates a gradient across the UK with the highest concentrations in the south and east of the country. Secondary particulate matter does not appear to be a major contributor to urban concentrations in winter episodes, although three are indications that it can be important during summer photochemical episodes. The correlations of PM10 and meteorological parameters for the Edinburgh site are also reported. Overall, the data indicate that three source categories contribute substantially to PM10 at UK urban sites: vehicle exhaust emissions, secondary sulphates and nitrates, and
44

resuspended surface dusts and soils. Subject Headings: Particulate air pollutants; Urban atmospheric pollution; United Kingdom of Great Britain and Northern Ireland.
Grimmond, S. and King,T.S.1997. An intercomparison of methods to determine roughness and displacement lengths in urban areas. Proceed. of the AAG 93 rd Annual Meeting, Fort Worth, Texas, USA. 1997.
PhMUC GU
ABSTRACT. For description modeling and forecasting of the behavior of the average wind and turbulence at all scales, correct knowledge of the surface roughness parameters, zero-plane displacement length, d, and roughness length z0, are required. Despite their importance and the extensive number of experimental, field, analytical and numerical studies, assignment of values for z0 and d for urban sites remains problematic.Methods to determine these roughness parameters can be generalized into those that require observations of wind and those that are based on the morphology and spatial arrangement of surface roughness elements (commonly referred to as land use analysis). In this study wind-based and land use methods are inter-compared. Results indicate general agreement between those values derived from land use analysis and those from the analysis of turbulence spectra. However, results for specific methods differ by a factor of two.The inclusion of vegetation in the land-use methods, specifically trees, which in some North American cities may constitute 20-40% of the plan area on a citywide basis, significantly increases the values calculated. As an example of the implications of the differences between methods, the effects of varying z0 and d on surface and aerodynamic resistances are presented.Keyword: climatology-urban, roughness and displacement length,
micrometeorology
Horvath, H 1997. A study of the aerosol of Santiago de Chille III: light absorption measurements. Atmospheric Environment, Oxford, England, 31(22): 3737-3744.
QUA ST
ABSTRACT: The light absorption coefficient of the aerosol of Santiago de Chile has been measured by means of the integrating plate method. Values ranging between 0.01 and 0.2 km–1 have been found. Variations of the absorption coefficient by a facto of 8 within a few hours have frequently been found and have their causes in the specific meteorology of the Santiago air basin. In the summer a minimum occurs between 1 and 4 a.m. and a maximum between 8 and 10 a.m., whereas in the winter
45

a maximum is found during the night and minimum values are in the afternoon with a smaller amplitude. Similar variations of the light absorption coefficient have been found also inside uninhabited rooms, since the aerosol was transported there almost without any losses. The daily pattern is similar but delayed and has a lower mean value and amplitude. When converting the light absorption to mass of black carbon, concentrations of elemental carbon of 1.3-25 g m-3 were obtained. This is similar to other large cities, where a considerable part of the mobile sources are equipped with diesel motors. The light absorption contributes to about 15% of the light extinction of the aerosol, and considering an equal scattering of the soot particles, the contribution of soot to light attenuation in the atmosphere is about 30%. The single scattering albedo of the aerosol is 0.85, thus the heating effect of the absorption dominates. The light absorption coefficient is wavelength dependent with an average relationship of a =k (/o)-, the exponent being =0.92. The exponent of the wavelength dependence of the extinction coefficient of the aerosol was 1.22. Subject Headings: Light absorption by aerosols; Santiago, Chile.
Jáuregui, E. 1997. Heat island development in Mexico City. Atmospheric Environment, Oxford, England. 31(22): 3821-3831.
GUC T
ABSTRACT: The present paper describes the climatology of the near surface urban heat island of Mexico City, using hourly data from two recently installed automatic stations at a rural and urban site. The results show that the nocturnal heat island was more frequent (75% of the time for the period examined) than daytime cases (25%). The maximum nocturnal heat island intensity, 7.8°C was observed in a dry month (February) characterized by calm clear nights. Although less frequent, the daytime heat islands did occur and may have been caused by differences in evaporative cooling from wet surface during the wet season. Midday heat islands had a frequency of 13% and an intensity of 3-5°C during the wet season. The afternoon/evening heat islands had an intensity of 4-5°C. They occurred during both dry and wet season with a frequency of 12% of the time in a year. The average urban/rural thermal contrasts are positive throughout the year varying from 5°C at day break in the middle of the dry season to 1-3°C around noon during the wet months. Subject Headings: Urban heat islands; Mexico City, Mexico.
Jáuregui, E.; Tejeda, A. 1997. Urban-rural humidity contrasts in Mexico City. International Journal of Climatology, Chichester, UK. 17(2): 187-196.
GUC T
46

ABSTRACT: Data from one pair of urban-suburban (Tacubaya and Airport) and one pair of urban-rural (School of Mines and Plan Texcoco) temperature and humidity measuring stations were used to illustrate specific humidity (q) contrasts in Mexico City. Results show a marked seasonal variation of q from around 7.9g kg -1
during the dry months to 10 g kg-1 in the wet season (May-October) on both urban and suburban sites. The mean monthly contrast for this pair of stations, albeit small show that the city air is somewhat drier during the first half of the year. Comparison of urban and rural q on an hourly basis shows that although urban air is more humid at night the reverse is true during the afternoon. Areal distribution of q shows two centres of maximum humidity over the city at night and a corresponding minimum during the afternoon. On average the urban-rural contrasts q were found to be somewhat smaller than the estimated uncertainty. The above results are in agreement with mid-latitude experience. Subject Headings: Urban influences on humidity: Mexico City, Mexico.
Lu, J. 1997. A laboratory study of the urban heat island in a calm stably stratified environment. Part II: Velocity field. Journal of Applied Meteorology, Boston, MA. 36(10): 1392-1402.
PhUC GU
ABSTRACT: A fully turbulent, low-aspect-ratio buoyant plume with no initial momentum under calm and stably stratified conditions is produced in a convection tank. The plume is generated by a circular heat island at the bottom of the tank. Two analytical models, bulk convection model and a hydrostatic model, are developed to formulate similarity relations for the low-aspect-ratio plume. The convective velocity scale wD suggested by the analytical models, is used as the similarity parameter for both the mean velocity and standard deviations of velocity fluctuations. The normalized standard deviations of horizontal and vertical velocities agree with each other for two heating rates, as well as with field observations in the center of Sapporo, Japan. The suggested scaling and empirical relations based on our experimental results may be applied to the velocity fields of other low-aspect-ratio plumes in calm and stably stratified environments. Further investigations are recommended to confirm the results of the current study. Subject Headings: Urban heat islands; Airflow in urban areas; Dispersion in urban areas.
Lu, J.1997. A laboratory study of the urban heat island in a calm and stably stratified environment. Part I. Temperature field. Journal of Applied Meteorology, Boston, MA. 36(10): 1377-1391.
PhUC GU
47

ABSTRACT: An extensive and systematic water-tank study was performed to simulate the urban heat island under a calm and stably stratified environment. The objective was to examine the mean-temperature field, mixing height, and heat-island intensity as functions of surface heating rates, heat-island sizes, and ambient temperature gradients. The scaling parameters for the temperature field associated with the heat-island plume are the diameter D, surface heating rate HO, and Brunt-Väisälä frequency N of the ambient stratification. The induced plume was turbulent, and the Froude number was found to be the most important similarity parameter. The differences between low-aspect-ratio plumes are discussed, and simple theoretical models are proposed for low-aspect-ratio plumes are discussed, and simple theoretical models are proposed for low-aspect-ratio plumes. The experimental results generally confirm the theoretical predictions and agree reasonably well with field observations, in spite of several limitations of the laboratory simulation. The mean-temperature distributions are found to have a universal shape that is a function of location only. The results are described in two papers. In this paper, the temperature fields are described. Part II describes the velocity fields and develops analytical models that apply to low-aspect-ratio plumes. Subject Headings: Urban heat islands; Urban temperature fields.
Mbuligwe, S.E.; Kassenga, G.R. 1997. Automobile air pollution in Dar es Salaam City, Tanzania. the Science of the Total Environment, Amsterdam, The Netherlands. 199(3): 227-235.
QUA T
ABSTRACT: Automobile air pollution is a growing problem in Dar es Salaam, Tanzania and as such it needs immediate attention before it goes out of control. The problem is most pronounced in the city centre especially during rush hours. This paper starts by citing some environmental effects of air pollution. It then analyses the problem of automobile air pollution in Dar es Salaam. It also goes on to show that vehicles in Dar es Salaam whose number is increasing at the rate of 6.3% annually contribute to the problem. Furthermore, the paper reveals that one of the main reasons for the air pollution problem in the city centre is large traffic volume which is concentrated on just 4.4% of the total road length in the city. Another reason identified in this paper is the increase in number and density of high rise buildings which end up hindering pollutant dilution by natural ventilation.. A shortage of parking places also contributes to the problem. This paper further reveals that automobile exhaust gas coefficients for nitrogen oxides and carbon monoxide are 10 times those of the USA. This is mainly attributed to low-energy efficiency of engines of most of the cars plying city roads due to old age. Concentrations of nitrogen oxides and carbon monoxide in the exhaust gas are also found to be high. Finally, this paper forwards legal and administrative as well as technical measures to arrest the problem. Enacting and enforcing of special laws pertaining to control and prevention of air pollution are also emphasised along with
48

other measures. Subject Headings: Urban atmospheric pollution; Atmospheric pollution by motor vehicles; Dar es Salaam, Tanzania.
Mills, G. 1997. An urban canopy-layer climate model. Theoretical and Applied Climatology, Vienna, Austria. 57(3/-4): 229-244.
PhMUC GU
ABSTRACT: This paper outlines a computer simulation model designed to assess the thermal characteristics of the urban canopy layer (UCL). In contrast to other UCL models, the layer simulated here includes both closed volumes (buildings) and open volumes (canyons). The purpose of the model is to allow the comparison of the climate impacts of different building group configurations. Traditional boundary-layer theory is applied to the surface urban boundary-layer (UBL) which lies above the UCL and the derived relations are used to parameterize exchanges of momentum and heat across the UL/UCL interface. The exterior energy budgets of the roof, walls and floor of the canopy are solved using an equilibrium surface temperature method. The open canopy and interior building air temperatures are found which are in agreement with the surface exchanges. Using measured data for Los Angeles in June, the output of the model is examined. The results show some agreement with measurement studies and suggest that the density of structures can have a substantial impact on UCL/UBL interaction. Subject Headings: Urban climate models; Urban climates.
Moussiopoulos, N. et al.1997. Assessing the impact of the new Athens Airport to urban air quality with contemporary air pollution models. Atmospheric Environment, Oxford, England. 31(10): 1497-1511.
QUA ML
ABSTRACT: The new airport of Athens will be constructed in the Spata area to the east of the Athens basin. In an attempt to study how the airport operation influences air quality in Athens, the wind flow and pollutant transport in the Athens basin and the Spata area are studied by applying a set of contemporary models, all constituents of the EUMAC Zooming Model (EZM): (1) the monhydrostatic prognostic mesoscale model MEMO for simulating air flow and the dispersion of inert pollutants, and (2) two photochemical dispersion models, the three-dimensional model MARS and the three-layer model MUSE for describing the dispersion of reactive pollutants. Simulations were performed for meteorological conditions favouring the occurrence of air pollution episodes. Emphasis is put on the influence of the airport emissions on air quality assuming that the airport is operating either at its old location (Hellenikon) or at Spata. Comparison of
49

simulation results of one selected scenario achieved with all three models reveals similar diurnal variations of nitrogen oxides in the Athens basin and the Spata area. The model results show that under conditions favoring air mass penetration from Athens to the Spata area the resulting pollutant transport causes an increase in air pollution levels without, however, leading to the exceedance of air quality standards. In the opposite case, the pollutant transport cannot have a noticeable adverse influence on the Athens air quality because of both the relatively high urban air pollution levels and the fact that the penetration depth is small. Subject Headings: Urban atmospheric pollution; Air quality; Atmospheric pollution by aircraft; Athens, Greece; Spata Region, Greece.
Obasi, G.O. P. 1997. Weather and water in cities. World Meteorological Organization Bulletin, Geneva, Switzerland. 46(1): 3-5.
UH GU
ABSTRACT: The customary annual message from the Secretary-General which opens this January issue is on a subject which concerns all of us on a rapidly increasing basis: “Weather and water in cities” is the theme for World Meteorological Day 1997. Subject Headings: Urban climatology; Urban hydrology.
Oke, T. and Runnalls, K.1997. Weather and daylength controls on the UCL heat island. Proceed. of the AAG 93 rd
Annual Meeting, Fort Worth, Texas, USA. 1997.
PhUC GU
ABSTRACT. This paper seeks to demonstrate some generalizable features of the magnitude and temporal dynamics of the heat island of the urban canopy layer (UCL). Sundborg’s classic study in Uppsala established statistical linkage between UCL heat island magnitude and weather variables (wind speed and cloud cover). Subsequently other variables have been added to try to improve the degree of explanation, but wind and cloud remain the most important. Using data from Uppsala, Vancouver and other cities a simple relationship for the nocturnal heat island magnitude is suggested which incorporates the effects to wind (turbulence and advection) and cloud cover (radiation).A related question is whether the heat island varies through the day in a consistent manner. It is shown that if weather controls remain reasonably constant, and daylength is normalized, the heat island of many cities in temperature climates follows a simple daily cycle. In the mean the maximum occurs in the middle of the period between sunset and sunrise (night) and the minimum about three quarters of the period between sunrise and sunset (daytime). This from appears to be preserved seasonally with minor variations. Together with existing empirical relationships for
50

the maximum UCL heat island magnitude these generalizations may provide a first order algorithm for heat island magnitude which incorporates weather and time of day.Keyword: climatology-urban, urban heat island.
Olcese, L.E.; Toselli, B.M. 1997. Effects of meteorology and land use on ambient measurements of primary pollutants in Córdoba City, Argentina. Meteorology and Atmospheric Physics, Vienna, Austria. 62(3-4): 241-248.
QUA ST
ABSTRACT: The atmospheric concentrations of several primary species: NO, NO2, NOx, CO SO2, reactive hydrocarbons (ROG) and other 15 atmospheric and meteorological variables have been measured at several locations in Córdoba city, Argentina since June 1995. The measurements are carried out using two mobile stations to cover several important areas of Córdoba. The objective of this work is to estimate the effects of meteorology and urban structure on the air quality levels for this city using simple statistics. We analyze the correlation between primary pollutants (CO and NOx) and site locations of the air quality monitoring stations (AQMS) during the whole 1995 field campaign. In this study we lake the measured data for primary pollutants and group them by location and time of the year. The results of this work may be useful to forecast air pollution episodes. Also we can get indirect information about emissions and maybe identify source characteristics. Once the influences of topography, meteorology, and (FALTA PARRAFO)
Orvis, K.H.1997. Insolation landscape of Great Smoky Mountains National Park. Proceed. of the AAG 93 rd Annual Meeting, Fort Worth, Texas, USA. 1997.
PhMUC GU
ABSTRACT. Canopy-level hemispheric plus reflected radiation were calculated on hourly, weekly and seasonal bases under varying atmospheric conditions for the terrain of Great Smoky Mountains National Park (GRSM). Air Force Geophysics Laboratory algorithms for atmospheric transmittance and scattering were used to model direct and indirect insolation components by extrapolating symmetrically from 37 vectors through a horizontally-homogeneous atmosphere. Two components of interest were modeled, photosynthetically active radiation and full-spectrum (shortwave plus thermal radiation. The first proved useful for taxonomic distribution analyses of plants. The second proved useful for surface energy budget analysis. Results were analyzed, combined and mapped using GIS for landscape-climatological analysis. This is preliminary to an attempt to model spatially-explicit
51

cloud cover effects on the radiative portion of landscape climatology, using Nexrad data.Keyword: insolation-modeling, climatology-landscape, Great Smoky Mountains.
Shahgedanova, M.1997. Some aspects of the three-dimensional heat island in Moscow. International Journal of Climatology, Chichester, UK. 17(13): 1451-1465.
GUC ML
ABSTRACT: The thermal climate in Moscow was studied for 1990. Air temperatures near the surface were analyzed for a number of locations representing different land-use type. The urban-rural temperature differences ranged mainly between 1° and 3°C, with an absolute maximum of 9.8°C. In summer, the heat island intensity exceeded 3°C on 29 per cent of all early morning observations, confirming the widely held view that anticyclonic conditions generate strong heat islands. Temperature variations within the city were small, with a notable exception of the urban park; in winter, the lee periphery of the city was often warmer than the urban centre. Vertical temperature profiles in the lowest 500 m were studied using data obtained at the Ostankino TV tower at seven levels. Although the daytime profiles throughout the year and the nocturnal profiles in winter confirmed observations elsewhere, the nocturnal summer profiles were unlike those registered in other urban areas with an unexpectedly high frequency of strong ground-based inversions. In July and August, ground-based inversions were registered on 57 per cent of all nocturnal observations. This phenomenon can be explained by the ‘open’ street geometry that is typical of Moscow and a reduced (in comparison with winter) input of artificial heat. Subject Headings: Urban heat islands; Urban temperatures; Moscow, Russia.
Sharma, C. K. 1997. Urban air quality of Kathmandu valley “Kingdom of Nepal”. Atmospheric Environment, Oxford, England. 31(7): 2877-2883.
QUA ST
ABSTRACT: The oval shaped tectonic basin of Kathmandu valley, occupying about 656 sq.km is situated in the middle sector of Himalayan range. There are three districts in the valley, i.e. Kathmandu, Lalitpur and Bhaktapur. Out of the three, the most populated is Kathmandu city (the capital of Kingdom of Nepal) which has a population of 668,00 in an area of approximately 50 km2. The energy consumption of the city population is about 1/3 of the total import to Nepal of gasoline diesel, kerosene, furnace oil and cooking gas. This has resulted heavy pollution of air in the city leading to bronchitis, an throat and chest diseases. Vehicles have increased several fold in recent months and there are 100,000 in number on the road and they
52

have 900 km of road, out of which only 25% is metalled. Most of the two and three wheelers are polluting the air by emission of gases as well as dust particulate. SO2
has been found to go as high as 202 g cm-3 and NO2 to 126 g cm-3 particularly in winter months when a thick layer of fog covers the valley up to 10 am in the morning. All the gases are mixed within the limited air below the fog and the ground. This creates the problem. Furthermore, municipal waste of 500 m3 a day and also liquid dumped directly into the Bagmati river at the rate of 500,000l d-1
makes the city ugly and filthy. Unless pollution of air, water and land are controlled in time, Nepal will lose much of its foreign exchange earnings from the tourist industry. It is found that tourist arrivals have considerably reduced in recent years and most of hotels occupancy is 50-60% in peak time. Nepal is trying to introduce a legal framework for pollution control but it will take time to become effective. Subject Headings: Urban atmospheric pollution; Kathmandu, Nepal.
Simmonds, I.; Keay, K. 1997. Weekly cycle of meteorological variations in Melbourne and the role of pollution and anthropogenic heat release. Atmospheric Environment, Oxford, England. 31(11): 1589-1603.
GUC ST
ABSTRACT: An aspect of anthropogenic impacts on climate have been assessed by examining the day-of-the-week variation (DOWV) of important meteorological elements. The data used were those of daily maximum and minimum temperature and rainfall for Melbourne for the period 1856-1990. This long series has been broken up into five 27-yr subperiods to expose how any such variation has changed over the record. We find there to be no DOWN in the summer, “half” of the year for any of the subperidos. The only statistically significant variations to have physical meaning occur in the winter of the most recent subperiod (1964-1990). In that time maximum temperature exhibits a significant (10% confidence level) DOWN and weekdays by 0.24°C and 0.20 mm d-1, respectively. We have considered the possible impacts of day-of-the-week variation of atmospheric pollution loading and of the local generation of heat. We hypothesise that the magnitude of the contrast between weekday-weekend anthropogenic heat emissions is sufficient to explain the temperature differences and these in turn are consistent with the weekday excess of rainfall. This perspective is concordant with the results of many recent studies which stress the importance of anthropogenic heating. Subject Headings: Man’s influence on climate; Urban climates; Urban heat islands; Atmospheric pollution effects on climate; Melbourne, Victoria Australia.
Tayanç, M. 1997. Annual and seasonal air temperature trend patterns of climate change and urbanization effects in relation to air pollutants in Turkey. Journal of Geophysical Research, Washington, DC. 102(D2): 1909-1919.
53

GUC ML
ABSTRACT: With a view to estimating climate change and its urban-induced bias in selected Turkish cities, we have used data from the period 1951 to 1990 recorded by 54 climate stations, four of which are corrected for their inhomogeneities. Two sets are produced. S1, including the large urban stations, and S2 consisting of rural, small urban and medium urban stations. Normalized Kendall trend test coefficients with a spatial prediction scheme, kriging, are used to construct spatial patterns of both sets together and separately. Results reveal a statistically significant cooling in mean temperatures mostly in northern regions and warming in minimum temperatures specific to large urban areas. Seasonal analysis shows that most of this cooling has been occurring in the summer and urban warming in the spring. The causes of cooling is investigated in relation to some air pollutants, SO2 and particulate matter (PM). Linear regressions performed on the time series resulted in a significant urban bias of 0.24°C per 40 years on mean temperatures and 0.56°C/40 years on minimum temperatures. In association with the above results, a decrease in the temperatures. In association with the above results, a decrease in the temperature range of 0.48°C over the period owing to urban bias was found. A 0.24°C urban bias magnitude of mean temperature trends is much greater than the results found on other three regions of the Earth [Jones et al., 1990]. An overall average cooling in mean temperatures, -0.07°C per decade, detected here is the same as Nasrallah and Balling’s [1993] average result for the two grid points located over Turkey. Subject Headings: Temperature trends; Urban influences on temperature; Atmospheric pollution effects on temperature; Turkey.
Tayanç, M. 1997. Urbanization effects on regional climate change in the case of four large cities of Turkey. Climatic Change, Dordrecht, The Netherlands. 35(4): 501-524.
QUA ML
ABSTRACT: The growing interest in urbanization problems is stimulating detailed studies of their effects on local climate change in the developed world. The absence of such studies in developing countries is restricting many decisions to be made and applied by policymakers. In one developing country. Turkey, results of the study of four urban stations and their neighboring rural sites for the 1951-1990 time period reveal that there is a shift towards the warmer side in the frequency distributions of daily minimum and 21.00 hr temperature difference series. This shift is an indication of urban heat island. The maximum urban heat island intensity trend that is obtained from the temperature differences database agrees well with Oke’s (1973) formula for European cities. Seasonal analysis of individual 21.00 hr temperature series suggests that the regional warming is strongest in spring and weakest in autumn and winter. Urban warming is detected to be more or less equally distributed over the year with a slight increase in the autumn months. The
54

Mann-Kendall trend test is applied to the temperature difference series, and the urban heat island effect is found to be significant in all urban sites. On the other hand, almost no significant urban effect on precipitation can be detected. Subject Headings: Urban influences on temperature; Urban heat islands; Turkey.
Thielen, J. 1997. Influence of topography and urban heat island effects on the outbreak of convective storms under unstable meteorological conditions: a numerical study. Meteorological Applications, Reading Berkshire, UK. 4(2): 139-149.
PhUC ML
ABSTRACT: Analysis of observational data of convective storms in Northern England suggests that the particular combination of effects such as sea breezes, elevated terrain and the presence of large cities has an influence on the initiation and development of convective storms. To study the importance of these effects for the development of convection, a cloud physics model has been initialised with the topography and surface characteristics of Northern England. The model enabled inclusion of three principal influences: sea breezes, topography and urban heat islands. The results suggested that the presence of the Pennines, a north-south orientated ridge, could influence the initiation of convection due to its long Sun-facing slopes, and to a lesser degree forced lifting along the slopes. Inclusion of urban heat island effects focused convection downwind of the principal urban areas. Subject Headings: Convective storm development; Topographic effects on convective storms; Urban influences on convective storms; England.
Valkonen, Esko et al. 1997. Dispersion model computations of urban air pollution in Espoo, Finland. Helsinki, Finland, Finnish Meteorological Institute. 57 p. (Finnish Meteorological Institute. Publications on Air Quality, No. 25).
QUA ML
ABSTRACT: This report presents the numerical results of air quality studies of the city of Espoo in southern Finland. This city is one of the four cities in the Helsinki metropolitan area, having a total population of 850 000. A thorough emission inventory was made of both mobile and stationary sources in the Helsinki metropolitan area. The atmospheric dispersion was evaluated using an urban dispersion modelling system, including a Gaussian multiple-source plume model and a meteorological pre-processing model. The hourly time series of CO, NO2 SO2
concentrations were predicted, using the emissions and meteorological data for the year 1990. The predicted results show a clear decrease in the yearly mean concentrations from southeast to northwest. This is due in part to the denser traffic in the southern parts of Espoo, and in part to pollution from the neighbouring cities
55

of Helsinki and Vantaa, located east of Espoo. The statistical concentration parameters found for Espoo were lower than the old national air quality guidelines (1984) however, some occurrences of above-threshold values were found for NO2 in terms of the new guidelines (1996). The contribution of traffic to the total concentrations varies spatially from 30 to 90% for NO2, from 1 to 65% for SO2
while for CO it is nearly 100%. The concentration database will be further utilised to analyse the influence of urban air pollution on the health of children attending selected day nurseries in Espoo. The results of this study can also be applied in traffic and city planning. In future work the results will also be compared with data from the urban measurement network of the Helsinki Metropolitan Area Council. Subject Headings: Urban atmospheric pollution; Espoo, Finland.
Voogt, J. and Oke, T.1997. High resolution, multi-temporal remote sensing of an urban heat island. Proceed. of the AAG 93 rd Annual Meeting, Fort Worth, Texas, USA. 1997.
RSUC GU
ABSTRACT. Studies of the urban heat island using thermal remote sensors have largely been restricted to spatial analysis of temperature patterns available at the times of satellite over-passes rather than at times critical to the formation of the heat island. In this study, a series of four remote sensing flights using a helicopter-mounted thermal scanner was conducted during the formative period (mid-afternoon, sunset, midnight, and pre-dawn) of the urban heat island. High resolution thermal imagery was obtained along an urban-rural transect which included a range of typical urban land-use areas. Simultaneous observation of canyon-level air temperature was made using automobile traverses. Results of the spatial and temporal development of air and surface temperature patterns are discussed with particular reference to the definition of the observed surface.Keyword: climatology-urban, urban heat island, remote sensing.
Vu, C.T., Asaeda, T. and Ashie, Y.1997. A numerical model for the urban microclimate. Proceed. of the AAG 93 rd Annual Meeting, Fort Worth, Texas, USA. 1997.
PhMUC GU
ABSTRACT. A numerical model has been developed for the study of the urban microclimate. The wind, air temperature and moisture content fields in the urban canopy are studied by the solutions of three-dimensional filtered Navier-Stokes equations, continuity equation, and heat and moisture transfer equations in the air with Large Eddy Simulation (LES) technique. Due to the complexity of the solid boundary condition in the urban area with ground surface, roof and walls of buildings, the solid surface boundary conditions are computed separately for
56

different surfaces. Temperature of roof, walls of buildings and impermeable pavement are computed by the solutions of one dimensional heat conduction equation. Temperature and available moisture content at the ground surface of the porous pavement are computed by the solutions of equations coupling heat and moisture transfer in the soil. The heat and momentum exchange between the air and the solid surface, and the moisture exchange between the air and the ground surface is evaluated with the Monin-Obokhov similarity law.The validation of the numerical model against wind tunnel experimental data on air temperature, wind velocity and turbulent energy around a building block indicated that the model could accurately simulate the turbulent and air temperature fields near structures.The model has been used for the analysis of the effects of heat storage under various pavement surfaces on the urban microclimate. The ground surface is assumed covered by different pavement materials: impermeable asphalt pavement, normal permeable pavement block and water-retaining ceramic porous block. The computational results indicate that the heating processes at the asphalt or normal porous block pavement surfaces are the most important factor for the creation of the so called urban heat island and contribute much to the deterioration of the urban thermal environment. Because of the extensive evaporation at the water-retaining ceramic porous pavement, its surface temperature is much lower than that of the above mentioned two pavement surfaces, and the urban thermal environment can be improved if the surface is covered by this kind of material.Keyword: climatology-urban, large eddy simulation, urban heat island.
Wu, X; Ding, Y. 1997. Reexamination of scheme for long-term trend of urban heat island. Journal of Nanjing Institute of Meteorology, Nanjing, China. 20(1): 131-135.
GUC GU
ABSTRACT: A method is proposed for the long-range trend of a city as a thermal island by means of the variation in components of surface thermal balance with study examples, indicating that it is of usefulness to cities that meet the conditions. Subject Headings: Urban heat islands.
Young, A. T.; Betterton, E. A. 1997. Photochemical box model for Mexico City. Atmosfera, Mexico DF, Mexico. 10(4): 161-178.
QUA T
ABSTRACT: A multi-level, photochemical box model has been developed for the Mexico City metropolitan area (MCMA). A combination of in situ measurements and emission inventory estimates was used to obtain estimates of hydrocarbon
57

speciation and emissions as well as Nox emissions. Preliminary results indicate that certain emissions estimates of Nox may be too high by a factor of two. This could cause the calculated, ozone isopleths to indicate that atmospheric O3 production in the MCMA could be hydrocarbon-limited. Hydrocarbon and/or Nox control strategies should not be implemented before a reliable emissions inventory is available. Subject Headings: Urban atmospheric pollution; Photochemistry of atmospheric pollution; Ozone production; Mexico City, Mexico.
Akira, U.; Ichinose, T.; Hanaki, K.1998. Urban heat environment simulation for three dimensional replacement of urban activity. Proceed. AMS 13 th Conference on Biometeorology and Aerobiology, Albuquerque, New Mexico. 1998.
PhMUC ML
ABSTRACT. It is known that not only sea/land breezes but also wind systems peculiar to a heat island affected by an urban area are particularly dominant in summer on the Kanto Plain. Numerical simulations of sea/land breezes on the Kanto Plain have been carried out, and investigated the heat island with a numerical simulations.The purpose of this research is analyzing on the effects of building drag and the height of anthropogenic heat release based on the scenario of relocation and replacement of urban activity in Tokyo Metropolitan Area. On scenario making, the current gross urban activity expressed in indicators like urban scale or anthropogenic heat was assumed constant. Its method was numerical simulation with a mesoscale climate model.The results of this study are summarized as follows;1) The impact of anthropogenic heat is dominant in the nighttime and the impact of
land use is dominant in the daytime.2) 2) As for the 3-dimensional replacement of urban activity, concentration
decreased the surface air temperature. The reason was the exhaust height of anthropogenic heat become higher and the influence around near surface layers become smaller.
3) 3) The 3-dimensional replacement of urban activity, especially concentration is apparently effective for the thermal environment in the daytime.
4) 4) Decreasing building width shows temperature increasing and wind decreasing, an that means small but tall pencil buildings is one of the factors of heat island compared from wide building.
Alcoforado, M.J.1998. Estudos de clima urbano em Portugal. (Research of urban climatology in Portugal). Clima y ambiente urbano en ciudades ibéricas e iberoamericanas, Madrid, Spain, Parteluz, 41-66.
58

GUC ML
ABSTRACT. The main results of urban climatology studies in Portugal are presented in this paper (Lisbon, Oporto, Coimbra, Évora and Bragança). The Urban heat island is very often dealt with. Its intensity varies between 1ºC and 4ºC (average values). Nevertheless in Lisbon, Coimbra and Évora low daily temperatures have also been recorded in the central districts. Spatial and temporal representativity of terrain measurements are also discussed, as well as the consequences of urban heat islands. Subject Headings: Urban climatology; Portugal; urban heat islands.
Alcoforado, M.J.; Henriques, M.V. and Taborda, J.P.1998. Evora thermal patterns. Proceed. IGU Commission of Climatology. Evora 1998.
GUC ML
ABSTRACT. In Évora, climate is classified as “Mediterranean”, which means winter is the rainy season and the dry season occurs in the warmer half year (and last for 4 or 5 months). Mean annual temperature is 15.7ºC, total rainfall amounts to 625 mm and the more frequent winds blow from the NW.The “inner city” (inside the 14th century walls) spreads over a small hill 310 meters high, surrounded by a flat area at about 250m. Building density is much higher inside the walls than outside them, in the residential districts, even on the newly built-up area. This work was the first part of the ongoing research on urban Climatology in Évora. “Traditional” techniques were used, in order to detect the influence of the city on the air temperature of the canopy boundary layer.As none of the 3 meteorological stations are located in an urban environment, field measurements were undertaken in January and July 1993, as well as in May 1994 (temperature, relative humidity and wind direction were measured). Measurement sites were selected according to their position within the city and the urban morphology of the city district. Anticyclonic situations were deliberately selected in order to more easily detect the influence of the built-up areas on air temperature. Measurements took place at dawn, mid-afternoon and three hours after sunset. As no adequate “reference station” was available, this work is based on the comparisons of the mean temperature values of the “inner” and “outer” districts. The greatest individual differences were also computed (higher urban temperature versus lower temperature of the surrounding area).As could have been expected, the thermal characteristics of the inner city are quite peculiar. And the slight topographic contrasts of the neighboring areas give rise to important thermal contrasts.At dawn, as well as in the evening temperatures are higher in the inner city. Mean global differences are 2ºC, while maximum differences go up to 11ºC. The higher air temperatures of the canopy layer occur in a “ring” of the inner city where urban morphology is more dense. The geometric centre of Évora (around the area where
59

the Diana Temple is located) and where there are more open spaces remains cooler than the latter, but warmer than the outskirts.These different values are probably due to lower earth radiation (lower sky-view factors); to lower wind speed; and to the possible transfer from heat stored inside the buildings during the day.
Alcoforado, M.J.; Lopes, A. and Andrade, H.1998. Studies on urban climatology in the area of Lisbon. Proceed. IGU Commission of Climatology. Evora 1998.
GUC ML
ABSTRACT. There are 610,880 inhabitants in Lisbon (1995 figures), and population density reaches 7,272 hab/km2. Lisbon’s climate belongs to the Mediterranean climate type, with dry summers and precipitation occurring during the winter half year. Research on urban climatology began in the eighties.As to minimum temperature in Lisbon, measurements of the most “urban” meteorological station (although located in a green area) reveal the existence of an urban heat island, in summer as well as in winter. Mean night-time heat island intensity is 3ºC. Field measurements and an infra-red image have shown that the highest air and surface temperatures occur in the Central Business District (CBD), which is located near the Tagus estuary. The cold air drainage causes relatively low temperatures in the not completely urbanized valleys of Lisbon and its neighborhoods. In the summer, the wind regime dictates the daytime thermal patterns. For 75% of the days, the wind blows from the north. In these cases, the warmest districts, are the ones in the south of the city, sheltered from the cool north or northwest wind. However, on 35% of these days, the north wind is temporarily replaced by easterly, southerly or south-westerly breezes, blowing from the estuary (mostly late in the morning) or from the ocean (SW breeze, late afternoon). This clockwise rotation of the breeze direction greatly influences temperature distribution; the districts near the estuary being the coolest during summer afternoons. Tethered balloons indicated that the height of the urban heat island was between 400 and 500 m in the summer.Bioclimatic characteristics of three green areas were studied. It was found that although the parks correspond to cool and humid islands inside the city and that the comfort indices show higher values, there does not seem to be great influence of the parks on the nearby areas. There is a very strong temperature gradient at the borders of the green areas, and the surrounding districts remain rather warm. Inside the green spaces, thermo-hygrometric conditions change a lot according to the garden “morphology”.New attempts have been made concerning surface temperature and using a GIA: The independent variable was surface temperature obtained from an infra-red image (flight at 3000 m), for a grid 250x250m. The different layers of information (independent variables) correspond to the factors, which can explain temperature
60

variability in Lisbon. The most important ones are the distance to the main roads, the percentage of built-up area, the percentage of water surface and building height. By the means of a multiple regression (r2=0.70), a surface temperature map was constructed; as it concerns an anticyclonic night-time situation, there is a strong correlation between this par and the map obtained for air temperature, with higher temperatures in the C.B.D.
Almendros, M.A.1998. La isla de calor en Madrid: notas sobre barrios centrales. (The urban heat island in Madrid –Spain-: notes of the center districts). Clima y ambiente urbano en ciudades ibéricas e iberoamericanas, Madrid, Spain, Parteluz, 241-256.
GUC ML
ABSTRACT. The thermal contrasts wich are registered in the different areas of the center of Madrid, the morphology of soil (building density, green spaces, etc.) are being studied; and the differences as for the width and the position of the streets. Subjects Headings: Urban heat island; Urban morphology; Madrid, Spain.
Alvarez, R.E.1998. La isla de calor en Valladolid.(The urban heat island in Valladolid, Spain). Clima y ambiente urbano en ciudades ibéricas e iberoamericanas, Madrid, Spain, Parteluz, 231-239.
GUC ML
ABSTRACT. Se trata del primer estudio realizado sobre el efecto de isla de calor en una ciudad de la Meseta Norte en España. La toma de datos se ha realizado con un aparato Thies de baja inercia, durante un periodo de doce meses (junio 93-mayo 94). Los recorridos fueron nocturnos, alcanzándose un total de 75 transectos, en 25 días de experimento. El tratamiento de los datos mediante un análisis de componente principales pone de relieve la importancia de las siguientes variables en la intensidad del fenómeno: oscilación térmica, nubosidad total, insolación y viento. Subject Headings: Urban heat island; Principal Components Analysis; Valladolid, Spain.
Alvarez, M.; Mingarro, F.; Soriano, J.1998. Influencia del clima y de la contaminación atmosféica en la degradación de los materiales de fachada de un edificio histórico del siglo XVII de Alcalá de Henares (Madrid). Clima y ambiente urbano en ciudades ibéricas e iberoamericanas, Madrid, Spain, Parteluz, 371-379.
QUA ML
61

ABSTRACT. In this work, results obtain from the analysis on the climatic and atmospheric pollution date of Alcalá de Hernandes , from a determined period of time, are presented, in order to establish the convenient connections to the alteration forms and pathologies which have been observed in the Convento de la Madre de Dios, located in the historical center of the mentioned city, as well as to the processes and mechanics originating then.Keyword: historical building petrous materials, brick, environment, climate, atmospheric pollution degradation.
Andrade, H. 1998. A model of spatial interpolation of nocturnal winter temperatures in Lisbon. Proceed. IGU Commission of Climatology. Evora 1998.
PhMUC ML
ABSTRACT. An attempt was made to find a multiple regression model which best explain the thermal field during anticyclonic winter nights, in Lisbon, using various geographic factors as variables. Accomplished such a model which is able to explain 82% of the total variance. The calculation of the explicative variables was done manually, in the area surrounding the locations of temperature measurement. Besides being time-consuming, this process only allows interpolation referring to points, and is therefore spatially incomplete.A stepwise regression was used to select the nine variables which best explain the nocturnal thermal field: latitude, longitude, altitude, topographic index, distance from the principal functional axes, height of buildings, width of streets, percentage of built-up areas and green spaces. The relationship between these factors and temperature is not always of a linear character; so the potential or logarithmic transformations of some of the variables had to be undertaken. The equation obtained had a R2 of 0.73 (R=0.85); the F value of 8.49 make it possible to consider the model significant for a error margin of 0.95. Although the results are as yet far from satisfactory, they may possibly be improved through the amelioration and updating of the GIS cartographic base. Finally, a map will be produced of the temperature distribution during anticyclonic winter nights, estimated trough the best model obtained.
Andrade, H.1998. Summer thermal discomfort in Lisbon. Proceed. IGU Commission of Climatology. Evora 1998.
UBCL ML
ABSTRACT. To study the summer thermal discomfort in Lisbon, daily data that spanned eight years (1984-1991) between June to September from the
62

Lisboa/Portela station were used. The indices of thermal comfort were calculated using air temperature, humidity and wind speed. Measurements were taken at 0h00, 06h00, 12h00, 15h00 and 18h00.During the first phase, the frequency of thermal discomfort occurrence was compared using different indices: Thom’s Discomfort Index (DI), the Apparent Temperature; the Net Effective Temperature, according to Missenard’s formula, the Hill index (H) adapted to the Iberian Peninsula. It was noticed that even when the indices were calculated using the same atmospheric variables, the frequencies obtained through the various formulae could be quite different. For a more detailed analysis of the summer thermal discomfort, only the simplified formula of the apparent temperature for shade conditions was used:
TA = -2.7 + 1.04Ta +2P-065vTA=Apparent temperature (ºC)Ta=air temperature (ºC)P=vapour pressure (kPa)v=wind speed (m/s)The days were classified according to the thresholds of TA of 24.5, 29.9, 36.3 ºC. During the diurnal period two groups were formed: hot days (H), with a minimum of two observations of TA between 29.9 and 36.3, and very hot days (VH), with one or more observations over 36.3. During the nocturnal period only one category was considered – hot nights (N), with one or more observations of TA over 24.5ºC; for most of the hot nights, only the 0h00 observation was over that value. A subgroup (N+) occurred, in which the discomfort conditions lasted until 6h00. The analysis of the frequency of these categories was made for the whole period and for different decades. This allowed us to distinguish different periods within the four months studied. A marked internal irregularity was also observed, with uncomfortable days (especially ver hot ones) occurring during heat waves, which affected unequally the various years.The prevailing winds blow from the north in the summer (“Nortada”), and during these occasions no discomfort occurs. The synoptic situations and the weather types of the days with thermal discomfort were analyzed. It was verified that in most cases, high temperatures coincided with low wind speeds, the relative humidity being generally low. 77% of the hot days and 85% of the very hot days had breeze conditions. An analysis of the relations of these conditions with the different types of breeze analyzed was undertaken: marked predominance of easterly breezes, replaced in the afternoon by a light “Nortada”, and a poor representation of the SE and SW breezes. From a synoptic point of view, most of the occurrences have a weak barometric gradient, there having frequently been E or NE fluxes.
Andrade, H.; Lopes, A.1998. A utilizaçao de um SIG para a estimaçao das temperaturas em Lisboa. (Use of GIS for the temperatures estimation in Lisboa). Clima y ambiente urbano en ciudades ibéricas e iberoamericanas, Madrid, Spain, Parteluz, 85-91.
PhMUC ML
63

ABSTRACT. This research presents a Geographic Information System (GIS) to study the urban climate of Lisbon. The different layers of information correspond to the factors which can explain climatic variability in the city. Comme exemple d’application, on a utilisé la base de données pour l’estimation des températures de surface, à partir d’un modèle de régression multiple. Dans ce modèle on a introduit différents variables indépendantes (hauteur des bâtiments, occupation du sol, altitude, etc.), et comme variable dépendante la température de surface qui a était obtenue à partir d’une termographie de Lisbonne. Le modèle explique 70% de la variance, ce qui peut être considéré un bon resultat. L’objectif est de produire des documents pour l’aménagement urbain, a partir de cette méthodologie. Subject headings: GIS; urban heat island; temperature estimation; Lisboa.
Arnfield, J.; Herbert, J.M. and Johnson, GT.1998. A numerical simulation investigation of urban canyon energy budget variations. Proceed. AMS 13 th Conference on Biometeorology and Aerobiology, Albuquerque, New Mexico. 1998.
PhMUC GU
ABSTRACT. Fundamental to modern urban climatological research is Oke’s distinction between the “urban boundary layer” (UBL) and the “urban canopy layer” (UCL). The UBL is the internal boundary layer that grows downwind of the leading edge of a city, with its lower limit at or near building roof height. In contrast, the UCL consists of the air layer lying between the street surface and building roof height, in which climates and energy budgets are governed by micro-scale processes mediated by site characteristics. These characteristics, consisting of the specifics of surface three-dimensional geometry, substrate materials and wetness, wind exposure, shading and the like, are subject to myriad variations within real cities. As a means of distilling what is common to many urban landscapes from what is unique to the particular architectural, cultural, and geographical milieu, much urban climate work has focused on the “urban canyon” (UC). The UC consists of the space between adjacent buildings, comprising the solid surfaces on the faces of those buildings and the street, the enclosed air volume, the open “top” at roof level and the “ends” of the canyon at street intersections, through which mass and energy fluxes may occur horizontally.Numerical simulation offers an economical way of exploring the role of a multiplicity of environmental and canyon characteristics on the urban surface energy budget. While the model described here has yet to be formally validated by comparison with appropriate empirical data, the results presented suggest that this technique may offer a useful way of exposing complex causal factors in UC microclimate.
64

Arnfield, J.A.; Herbert, J.M. and Johnson G.T.1998. A numerical simulation investigation of urban canyon energy budget variations. Proceed. of the AAG 94 th Annual Meeting, Boston, USA. 1998.
PhMUC GU
ABSTRACT. The variability of urban canyon energy budgets is investigated using a numerical simulation model of urban canyon energy exchange and climate. The model consists of three coupled model subcomponents: (i) a surface energy budget model, (ii) a windfield model based on the k-_ turbulence model, and (iii) a scalar dispersion model for heat. The model is two-dimensional, for dry surfaces and is most appropriate for conditions under which forced convection dominates over buoyancy effects. Energy budgets are evaluated for a cross-canyon ‘slice’ at the midpoint of its length and energy budget characteristics are illustrated and discussed both for the individual canyon facets and for the total canyon system, expressed relative to the equivalent flux densities through the canyon top. Net radiation, sensible heat flux and the conductive heat exchange with the substrate are compared with different ambient weather conditions and with different canyon aspect ratios, materials and orientation.Keyword: climatology-urban, simulation modeling, urban canyon microclimate.
Arthur, T.; Carlson, T. and Ripley D.A.J.1998. The impact of land use/land cover changes due to urbanization on surface microclimate and hydrology: a satellite perspective. Proceed. AMS 13 th Conference on Biometeorology and Aerobiology, Albuquerque, New Mexico. 1998.
RSUC ML
ABSTRACT. Today, for many westernized countries, the term urbanization primarily indicates the growth of outlying suburbs rather than the development of a city’s central core. As the expanding boundaries of older cities begin to overlap, modern metropolises are becoming vast urban fields with multiple centers. Accompanying the growth of these urban areas is a change in regional land cover, e.i. vegetation, soil, concrete, water, etc. Land cover largely dictates the energy exchanges that occur between the earth and atmosphere and thus is a primary determinant of a region’s microclimate. Some physical parameters indicative of the microclimate are surface temperature, fractional vegetation cover, stormwater runoff, soil moisture and evapotranspiration. Since regional land cover changes brought about by human activity tend to occur incrementally, it can be difficult for communities to realize the extent of their development and therefore, the possible changes in these physical parameters. In this regard, satellite data holds great potential for practical application to regional planning and urban ecology. Through a combination of satellite remote sensing and climate modeling, it is possible to monitor and visualize land cover change and provide evidence of the environmental effects of a region’s development patterns in a timely manner.
65

The idea has been emerging over the past decade that land surface parameters associated with individual satellite pixels can be visualized as vectors tracing out path in multi-parameter space. A variant of this view, developed by Gillies and Carlson, has its origin in studies describing the characteristic shape of the satellite’s pixels when viewed in scatterplots of surface radiant temperature versus vegetation index. These scatterplots tend to show an envelope of points resembling a triangle. Sound physical reasons exist for this shape. Chiefly, the triangle is formed because surface radiant temperatures exhibit very little spatial variation over dense vegetation but large spatial variation over bare soil surfaces. Indeed, Gillies et al demonstrate that for various scales of measurement, the triangular shape is typical for scatterplots made form satellite images of large heterogeneous regions under strongly sunlit conditions. Dependent on variations on soil moisture, bare ground and partially vegetated surfaces display a large range in temperature, which then decreases to the less variable temperature of dense vegetation. The greatest challenge in this type of research is to translate the satellite imagery and its derivative parameters into products that are useable in the field or regional planning. As late as 1996, despite many attempts to model the effects of urban development on the microclimate, it was stated that complete models for urban planning were unavailable and there was “still a striking gap between climate and design”. This paper represents but a step to accomplish two objectives (1) to diagnose useful climate and land surface parameters such as surface temperature, vegetation fraction, evapotranspiration, and surface moisture availability via satellite data and (2) to predict changes in these variables given different development scenarios.
Assis, E.S.1998. Impacts of the urban climate on thermal comfort and energy consumption: a case study for a typical office building in Belo Horizonte City, Brazil. Proceed. AMS 13 th
Conference on Biometeorology and Aerobiology, Albuquerque, New Mexico. 1998.
EUC T
ABSTRACT. One of the harmful problems resulting from the urban climate change is the observed increase of the energy consumption for artificial air conditioning of buildings. However there are only a few works evaluating the impacts of the urban climatic change on the buildings performance in terms of both indoors thermal comfort conditions and energy consumption. According to Akbari and Rosenfeld the electric energy demand has increased of about 2 to 4% per degree of temperature raise in the cities of the California State, USA. Santamouris has shown that the energy consumption for refrigeration in an office building may be twice times bigger downtown Athens, Greece, than in its outskirts, during the summer.In the present work, a case study of a typical (fictitious) office building in the city of Belo Horizonte, Brazil, was developed using the available data about the city climatic change. This work is an effort to quantify, at least as a trend, the impacts of the climatic change on indoors thermal comfort and energy consumption for air
66

conditioning. It hopes to contribute for the discussion on the urban land-use control polices having in sight the preservation of some environmental qualities, through the mitigation of the urban heat island adverse effects.
Barradas, V.L.1998. Measurements of latent heat flux in a small urban park in Mexico City. Proceed. AMS 13 th Conference on Biometeorology and Aerobiology, Albuquerque, New Mexico. 1998.
GUC T
ABSTRACT. Urban parks are called cool islands since air temperature is lower than their surroundings. This effect is produced by the capacity of plants to take a great amount of energy (2.454 MJ kg-1) to transpire making with this mechanism not only a cooler area but more humid. Typical rates of heat loss by evaporation range 2.5 to 29.5 MJ m-2 d-1 in arid environments with good irrigation whereas in temperate climates range 0.7 (winter) to 7.4 MJ m-2 d-1 (summer). The release of water vapor corresponding to heat loss ranges from 0.28 to 12 I m -2 per day. Therefore, the determination of latent and sensible heat flux in urban parks could be important because of their direct effect on air temperature and humidity.Energy Balance equation/Bowen ratio or Eddy Correlation methods are used to determine heat fluxes in different urban areas. Nevertheless, for small urban vegetated areas these micrometeorological methods are not adequated because they require areas with an appropriate fetch distance that often is not fulfilled. For example, in Mexico City there are only three urban parks that could fulfill this requirement. In this research the method of sap flow measurements was used to determine the latent heat flux from the amount of transpiring water in individual trees in a small urban park in Mexico City.
Barradas, V. L.1998. Measurements of latent heat flux in an urban tree hedgerow in Mexico City. Proceed. IGU Commission of Climatology. Evora 1998.
PhUC T
ABSTRACT. It is very well known that vegetation plays a key role in the microclimate of urban environments. This is mainly due to the capacity of plants to absorb energy by transpiration, creating a cooler and more humid area than their surroundings. Furthermore, a zone of larger influence may be extended beyond the vegetated areas. Thus, the determination of sensible and latent heat fluxes in these areas could be important because of their direct effect on air temperature and humidity.Generally, Energy Balance equation/Bowen ratio or Eddy Correlation methods are used to determine heat fluxes of different interesting areas. Nevertheless, for small
67

areas, such as urban parks or urban tree hedgerows these micrometeorological methods are not adequate because they require areas with an appropriate fetch distance that often is not fulfilled. In this research the method of sap flow measurement is proposed to find out the latent heat flux from the quantity of transpiring water from individual trees.A series of measurements of net radiation (QN), soil storage (QS) and stem flow (TRP) was carried out in a tree hedgerow in the south of Mexico City. Also, intensity and wind direction were measured. Four trees with a leaf area index of 4 m2m-2 and 6 m high were selected for sap flow measurements. All measurements were made in October (end of rain season) and December (dry season) in 1997. Latent (QE) and sensible (QH) heat fluxes were calculated from TRP and Energy Balance equations, respectively. Measurements were made from 8:00 to 17:00 local time for safety reasons.Transpiration was higher in October (x=506 g m-2 s-1) than in December (x=324 g m-2
s-1). Maximum averaged transpiration rates registered 0.024 and 0.015 g m-2 s-1 in October and December, respectively. It is interesting to notice the effect of stomatal control on TRP in the afternoon in December when drought is increasing. Net radiation was mainly dissipated by sensible and latent heat fluxes by a 30 and 60% in the rainy season and 58 and 25% in the dry season, respectively. Latent and sensible heat fluxes were as high as 150 and 350 Wm -2 in December and 300 and 200 Wm-2 in October, respectively. On the other hand, there was highly limited by advection.It is evident from results reported here that small urban vegetated areas can be very important since a great number of trees are growing in the streets of Mexico City. It is also evident that the proposed method could be very helpful when it is necessary to measure the components of energy balance in small vegetated areas.
Barthelmie, R.J.; Pryor, S.C. and Hoff, R.M.1998. Remote sensing and numerical modeling of aerosol concentrations. Proceed. of the AAG 94 th Annual Meeting, Boston, USA. 1998.
RSUC GU
ABSTRACT. Horizontal variability of aerosol concentrations has implications for assessing population exposure to hazardous compounds, quantifying deposition, network design and reconciling spatially averaged modeling results with point observations obtained from measurement campaigns or routine networks. In this paper ISOPART (a lagrangian gas to particle model) is applied in a eulerian framework to simulate the spatial patterns of aerosol concentrations in the Fraser Valley, British Columbia, and the results are compared with the observed concentrations from ground based samplers and an airborne liar.These comparisons indicate generally good agreement (both in terms of spatial variability and magnitude), with both the observations and simulations indicating highest near-surface secondary aerosol concentrations in the central valley. Elevated pollutant enriched layers are important to the study of near-surface pollutant
68

concentrations because they may be fumigated to lower levels during daytime growth of the boundary layer and thus enhance near-surface concentrations and stimulate further aerosol production. Also trapping of pollutants in residual layers has been postulated as a causal factor in the high degree of autocorrelation in secondary pollutant concentrations.In this paper ISOPART is used to quantify the importance of vertical exchange processes versus chemical production, horizontal advection, and deposition in determining the near-surface secondary aerosol concentration during intensively monitored case studies. The results indicate that, for the case studies presented, vertical exchange significantly contributed to the observed near-surface concentrations.Keyword: climatology-urban, numerical modeling, aerosols.
Barthelmie, R.J.; Pryor, S.C. and Hoff, R.M.1998. Remote sensing and numerical modeling of aerosol concentrations. Proceed. of the AAG 94 th Annual Meeting, Boston, USA. 1998.
RSUC GU
ABSTRACT. Horizontal variability of aerosol concentrations has implications for assessing population exposure to hazardous compounds, quantifying deposition, network design and reconciling spatially averaged modeling results with point observations obtained from measurement campaigns or routine networks. In this paper ISOPART (a lagrangian gas to particle model) is applied in a eulerian framework to simulate the spatial patterns of aerosol concentrations in the Fraser Valley, British Columbia, and the results are compared with the observed concentrations from ground based samplers and an airborne liar.These comparisons indicate generally good agreement (both in terms of spatial variability and magnitude), with both the observations and simulations indicating highest near-surface secondary aerosol concentrations in the central valley. Elevated pollutant enriched layers are important to the study of near-surface pollutant concentrations because they may be fumigated to lower levels during daytime growth of the boundary layer and thus enhance near-surface concentrations and stimulate further aerosol production. Also trapping of pollutants in residual layers has been postulated as a causal factor in the high degree of autocorrelation in secondary pollutant concentrations.In this paper ISOPART is used to quantify the importance of vertical exchange processes versus chemical production, horizontal advection, and deposition in determining the near-surface secondary aerosol concentration during intensively monitored case studies. The results indicate that, for the case studies presented, vertical exchange significantly contributed to the observed near-surface concentrations.Keyword: climatology-urban, numerical modeling, aerosols.
69

Barthelmie, R.J.; Pryor, S.C. and Hoff, R.M.1998. Remote sensing and numerical modeling of aerosol concentrations. Proceed. of the AAG 94 th Annual Meeting, Boston, USA. 1998.
RSUC GU
ABSTRACT. Horizontal variability of aerosol concentrations has implications for assessing population exposure to hazardous compounds, quantifying deposition, network design and reconciling spatially averaged modeling results with point observations obtained from measurement campaigns or routine networks. In this paper ISOPART (a lagrangian gas to particle model) is applied in a eulerian framework to simulate the spatial patterns of aerosol concentrations in the Fraser Valley, British Columbia, and the results are compared with the observed concentrations from ground based samplers and an airborne liar.These comparisons indicate generally good agreement (both in terms of spatial variability and magnitude), with both the observations and simulations indicating highest near-surface secondary aerosol concentrations in the central valley. Elevated pollutant enriched layers are important to the study of near-surface pollutant concentrations because they may be fumigated to lower levels during daytime growth of the boundary layer and thus enhance near-surface concentrations and stimulate further aerosol production. Also trapping of pollutants in residual layers has been postulated as a causal factor in the high degree of autocorrelation in secondary pollutant concentrations.In this paper ISOPART is used to quantify the importance of vertical exchange processes versus chemical production, horizontal advection, and deposition in determining the near-surface secondary aerosol concentration during intensively monitored case studies. The results indicate that, for the case studies presented, vertical exchange significantly contributed to the observed near-surface concentrations.Keyword: climatology-urban, numerical modeling, aerosols.
Bauer, B. 1998. Impact of Urban Microclimates on Human-biometeorological Conditions. Proceed. of the AAG 94 th Annual Meeting, Boston, USA. 1998.
UBCL ML
ABSTRACT. The urban space consists of a variety of microclimates, which are characterized by the arrangement of buildings, open areas and vegetation structures. This paper seeks to describe the variability of human-biometeorological conditions in different urban structures. The areas of investigation chosen are located in the city of Leipzig, Germany. This paper shows examples situated in a large prefabricated housing state, blocks of old apartment buildings and a park with adjacent apartment buildings.
70
Mobile experimental measurements are carried out in the various urban structures to record meteorological parameters relevant for the heat balance of human beings, including: air temperature, vapour pressure, wind velocity and mean radiation temperature. The radiation flux densities for the determination of the mean radiation temperature are taken with a turnable pyranometer (CM21) and pyrgeometer (CG1).In addition, ground-based infrared thermography (AGEMA; Thermovision 470PRO) is used to record the horizontal and vertical surface radiation temperatures. The results clarify the influence of horizontal surface structures and vertical building fronts on the short-and long-wave radiant flux densities and their impact on the mean radiation temperature. Further, the positive microclimatic effects of vegetation structures in urban areas are shown. The results demonstrate that there are potentials for improvement within built-up areas which can be used to reduce the frequency of thermophysiological stress situations.Keyword: climatology-urban, urban microclimates, biometeorology-human.
Benincasa, F.; Canu, A.; Pellizzaro, G. and Zara P.1998. Monitoring of acid precipitation using a new rainfall-pH--meter. Proceed. AMS 13 th Conference on Biometeorology and Aerobiology, Albuquerque, New Mexico. 1998.
QUA ML
ABSTRACT. Direct measuring of air and rain constituents is a fundamental tool in evaluating the air quality and cannot be substituted by other tools such as mathematical modeling of transport phenomena, because of the multiplicity of factors which influence the scavenging process.Atmospheric deposition is variable in time and space, and its quantification can be evaluated by sampling and analyzing the physical and chemical characteristics of the wet and dry depositions. Therefore, a useful monitoring network requires a large number of samplers to estimate accurately the spatial wet and dry deposition fields.In Italian and in some European networks atmospheric deposition samples are usually collected weekly. This sampling method however, though required in data processing, loses its significance when studying the way a rainfall scavenges the atmosphere below the clouds.A sequential collection of samples in a single event can give a higher accuracy in determining the wash-out of components and pollutants.This paper presents the preliminary results of one year of investigation, regarding the pH of rainfall in north Sardinia, using a new rainfall-pH-meter developed by the Istituto per il Monitoraggio degli Agroecosistemi.The results reported in the present investigation cannot give an exhaustive analysis of the atmospheric influence on the rain characteristic but it emphasise the importance of monitoring every single event. In fact a weekly sampling, generally used in all the networks of monitoring and necessary to obtain a reliable homogeneous map of the phenomenon, takes into account only the whole quantity of
71

acidity and is significant for a long term effect. On the contrary the analysis of each of single events could provide a useful tool to elucidate the relative contribution of wash-out characteristic, and should enable to point out the presence of possible short term hazard.
Best, J.J.1998. Representing urban areas in numerical weather prediction models. Proceed. AMS 13 th Conference on Biometeorology and Aerobiology, Albuquerque, New Mexico. 1998.
PhMUC GU
ABSTRACT. A large fraction of the World’s population live in urban areas and this fraction continues to increase. As more and more people live in these cities, the urban areas grow and have a larger impact on the atmosphere. Therefore we need to be able to represent these urban areas accurately in numerical weather prediction so that we can model the impact on the atmosphere and provide weather forecasts for the environment in which the majority of people live.There are many differences between rural and urban surfaces. These not only include the obvious changes of the roughness elements which have a large impact on drag, but also to all of the elements in the surface energy balance. The increased aerosols from higher pollution levels in the cities have impacts on both the net solar and net longwave radiation, as does the trapping of radiation due to the geometry of the buildings. The turbulent transfer of heat and moisture is more efficient in urban areas due to the larger roughness elements which increase the turbulence. However, the flux of moisture is limited to areas of vegetation within the cities, apart from periods directly after precipitation when a thin layer of surface water is available on the roads and tops of buildings. Due to the thermal properties of the elements of an urban area, large amounts of energy can be stored during the day from solar heating and then released again during the night. This means that the available energy for the turbulent fluxes can be greatly reduced compared to a rural area during the day, but the release of energy during the night can maintain the turbulent fluxes, which will be small terms in the rural nocturnal energy balance. There is also an additional term to the surface energy balance of urban areas from anthropogenic heat sources. The relative size of this term in the urban surface energy balance varies from city to city, which makes in difficult to model.In this paper, two surface exchange schemes are investigated to see if they can reproduce the urban heat island and also the neutral nocturnal boundary layer temperature profile. A single column model is used to test the surface exchange schemes. The single column model is based upon the U.K. Met. Office Unified Model, which is used operationally for numerical weather forecasting within the U.K.. The single column model approximates the advection of upstream profiles, obtained from the U.K. Met. Office Mesoscale model, using an advection length scale of 17 Km., which corresponds to the resolution of the column model used for these studies can be found in Clark.
72

This paper has shown that the standard surface exchange scheme that is used in many numerical models for representing cities, does not represent the effects of urban areas with sufficient accuracy to be able to model the impact on the atmosphere currently. This means that the numerical weather forecasts issued for people living within the cities will be in error. An alternative surface exchange scheme has been presented and shown to represent some of the urban effects more accurately than the standard scheme. The use of this alternative scheme should provide more realistic numerical weather forecasts for the city dwellers.
Bogren. J.1998. Monitoring temperature variations along roads. Optimising road weather information systems by use of models. Proceed. AMS 13 th Conference on Biometeorology and Aerobiology, Albuquerque, New Mexico. 1998.
PhMUC HL
ABSTRACT. The possibility of maintaining a high and effective level of winter road maintenance has increased dramatically through the use of road weather information systems (RWIS9. Records of climatological parameters such as air temperature, air humidity precipitation, and wind together with pavement temperature, make it possible to detect risk of icy conditions in an early stage and to take action against them. However, to gain optimum benefits from this type of automatic system, several background factors must be considered during the planning and establishment of a system in a new area. Accuracy and reliability within the RWIS are to a great extent determined by the capabilities and accuracy of the specific sensors, but without knowledge of the local and microclimatological situation information provided by the sensors will be misleading and difficult to interpret. The topoclimatological conditions are also very important when the RWIS is used along with tools such as forecast models, stretchwise information and winter indexes.The road surface temperature (RST) is determined by several factors. To an extent determined by the prevailing weather, the local topography causes a more or less pronounced effect on the temperature pattern, along with factors such as altitude and surface construction. In the analysis of the climatology of a certain area or region and its need for field stations, it is important to consider local and regional temperature differences. Locally induced temperature variations are best detected and studied by direct measurements, that is, thermal mapping. Temperature variations on the regional scale are determined by analysis of synoptic weather data and topographical maps.These analyses form the basis for determining the most appropriate locations of field stations in a RWIS.Data on road surface and air temperature is very useful for road maintenance and can assist in slipperiness surveys of winter roads. The use of road weather information systems has therefore rapidly increased. The idea behind a road weather surveillance system is that stations measuring temperatures, humidity and
73

wind should be located in such areas that an early warning of road icing can be achieved. This requires that the stations have various types of locations as different weather situations result in different temperature patterns. The background idea behind the Local Climatological Model (LCM) developed at the Department of Physical Geography, Göteborg University is that stretchwise temperature information can be calculated increasing the available information and leading to a more efficient surveillance of winter roads. If the decision about salting action is based upon more diversified information, compared to that received only form the locations of the field stations, the right decision is made more easily.
Brown, M.; Burian, S.; McPheron, T.; Streit, G.; Costigan, K.; Greene, B.1998. Pollutant transfer through air and water pathways in an urban environment. Proceed. AMS 13 th Conference on Biometeorology and Aerobiology, Albuquerque, New Mexico. 1998.
PhMUC ST
ABSTRACT. We are attempting to simulate the transport and fate of pollutants through air and water pathways in an urban environment. This cross-disciplinary study involves linking together models of mesoscale meteorology, air pollution chemistry and deposition, urban runoff and stormwater transport, water quality, and wetland chemistry and biology. We are focusing on the transport and fate of nitrogen species because 1) they track through both air and water pathways, 2) the physics, chemistry, and biology of the complete cycle is not well understood, and 3) they have important health, local ecosystem, and global climate implications.We will apply our linked modeling system to the Los Angeles basin, following the fate of nitrates from their beginning as nitrate-precursors produced by auto emissions and industrial processes, tracking their dispersion and chemistry as they are transported by regional winds and eventually wet or dry deposit on the ground, tracing their path as they are entrained into surface water runoff during rain events and carried into the stormwater system, and then evaluating their impact on receiving water bodies such as wetlands where biologically-mediated chemical reactions take place. In this paper, we wish to give an overview of the project and at the conference show preliminary results.We have described a linked set of models that will be used for studying the transport and fate of pollutants through air and water pathways in an urban environment. Our first step involves manually inputting output from one model to another. Eventually, we will need to consider building models or sub-modules that account for interface physics and, if appropriate, feedback mechanisms.Our ultimate goal for this project is to link together other models of urban infrastructure and natural systems in order to understand the complex interactions of the urban and natural environments. Such a modeling system could be used for urban planning, sustainability studies, and vulnerability assessment.
74

Brown, M. J. and Williams, M.D.1998. An urban canopy parameterization for mesoscale meteorological models. Proceed. AMS 13 th Conference on Biometeorology and Aerobiology, Albuquerque, New Mexico. 1998.
PhMUC ST
ABSTRACT. Buildings and urban landuse significantly impact the micro-and mesoscale flow field. Since mesoscale numerical models do not have the spatial resolution to directly simulate the fluid dynamics and thermodynamics in and around urban structures, urban canopy parameterizations are sometimes used to approximate the drag, heating, radiation attenuation and enhanced turbulent kinetic energy (tke) produced by the sub-grid scale urban elements. In this paper, we review Yamada’s forest canopy parameterization and present a simple modification to account for the urban canopy. In this scheme, w have subdivided the urban landuse into residential, residential with nature trees, industrial/commercial, and downtown/city center. We have incorporated the urban canopy parameterizations into the HOTMAC mesoscale code and present results for idealized cases.Urban canopy parameterizations have been developed for use in mesoscale models by performing a simple modification of Yamada’s forest canopy parameterization scheme. The modified scheme appears to give qualitatively reasonable answers, thus allowing mesoscale modelers to better account for the influence of urban areas. More validation needs to be done with hard-to-find area-averaged urban meteorology measurements. The uncertainties in the input parameters needs to better quantified as well.
Brunet, M.1998. El debate de la influencia urbana sobre las tendencias térmicas globales. Clima y ambiente urbano en ciudades ibéricas e iberoamericanas,Madrid, Spain, Parteluz, 549-64.
GUC GU
ABSTRACT. The aim of this paper is to provide a general review about the scientific discussion on the magnitude of the urban warming bias remaining in the estimates of the linear surface air temperature trends over an hemispheric and global scale. There are also included some methodological proposals in order to minimize the mentioned bias.
Bruse, M.1998. Simulating the effects of urban environmental design on microclimate with a three-dimensional numerical model. Proceed. IGU Commission of Climatology. Evora 1998.
75

PhMUC GU
ABSTRACT. Unlike global climate, local micro- and mesoclimate is very sensible to changes of the environmental structure: It is strongly influenced by the hydraulic and thermodynamic properties of the ground surface, arrangement of buildings and vegetation. Especially inside urban areas the wide range of different artificial and natural materials, the high heat capacity as well as wind sheltering and shading effects of buildings and vegetation produces a complex system of interactions known as urban climate.The presented poster shows a case study of changes in urban environmental design and their effects on local climate. Figures will show the three dimensional distribution of wind, temperature, humidity and turbulence before and after the environmental change.The atmosphere and the vegetation are numerically linked by terms of drag force, transpiration, evaporation and convective heat exchange at the leaves. To calculate these fluxes, a plant physiological model was incorporated which calculates the leaves resistance to heat and vapour transfer into the air. Different kinds of vegetation from low grass up to huge trees are stored in an additional database and can easily be simulated with this scheme.Longwave and shortwave radiation fluxes are calculated for each grid point with respect to local time, shading and sheltering due to buildings or vegetation and longwave fluxes from the environment.
Byun, D.; Young, J.; Gipson, G.; Schere, K.; Godowitch, J.; Pliem, J.; Binkowsky, F.; Roselle, Sh.; Benjey, B.; Ching, J.; Novak, J. and LeDuc Sh.
1998. An urban air quality simulation with the community multi-scale air quality (CMAQ) modeling system. Proceed. AMS 13 th Conference on Biometeorology and Aerobiology, Albuquerque, New Mexico. 1998.
QUA ML
ABSTRACT. In an effort to provide a state-of-the-science air quality modeling capability, U.S. EPA has developed a new comprehensive and flexible Models-3 Community Multi-scale Air Quality (CMAQ) modeling system. CMAQ has been designed to study air quality problems such as tropospheric ozone, fine particles, toxins, acid deposition, nutrients, and visibility degradation. CMAQ is capable of handling multi-scale air quality problems from regional to urban scales.The CMAQ modeling system is a useful tool for both the scientific and regulatory communities. Together with the Models-3 system framework, CMAQ integrates emissions processing, meteorological modeling, chemistry-transport models (CTMs), and analyses of inputs and outputs. CMAQ is not a monolithic model, but rather a modeling system that allows users to build customized CTMs for solving air quality problems. Because CMAQ can address multiple pollutant issues and different spatial scales in one system, it has a potential to be a “one-atmosphere” modeling system when linked with a multi-scale meteorological model.
76

Here, we demonstrate CMAQ simulations for a high ozone episode in the northeastern U.S. during 12-15 July 1995 and discuss meteorological issues important for modeling of urban air quality.We have presented an example application of CMAQ for the high ozone episode during 12-15 July, 1995. Accurate descriptions of surface exchange and flow conditions were important for the adequate simulations of urban air quality. Flows around coastal areas should be resolved better by meteorological models to predict air quality for coastal cities. Detailed performance evaluations will be performed to establish a base line for future air quality studies.
Camilloni, I.A. and Barros, V.1998. An analysis of the relationship between yearly mean urban-rural temperature differences and rural temperature trends. Proceed. AMS 13 th Conference on Biometeorology and Aerobiology, Albuquerque, New Mexico. 1998.
GUC ML
ABSTRACT. During the last years many authors suggested that a proportion of the long-term warming trends of the last hundred years in many global, hemispheric and even regional mean temperature records could be partially due to their contamination by urban growth effects. The urban heat island effect has been documented for many cities and one method for quantifying its intensity is to compare the urban temperature record with a neighboring rural station. It has been suggested that on the annual basis, the urban bias effect is a non-linear function of population. In this paper, we present a review of the results we found in order to demonstrate that population growth is not the only aspect that must be taken into account in correcting temperature series by urbanization effects and that the spurious influence of urban growth on temperature trends during warming periods would be offset by the diminishing of the urban heat island intensity.To what extent the results presented here could be extended to global estimates seems difficult to assess since the magnitude of the second urban bias was estimated using data from only three middle latitude countries. Therefore, it will be necessary to extend this study to other regions of the world. Nevertheless, it can be concluded that at least for some regions, the second bias in urban trends could be of the same magnitude as the urban growth bias enhancing it during cooling periods and compensating it during warming ones. If these results could be extended to hemispheric or global scales, it could be expected the contamination of temperature trends by urbanization growth during warming periods will be offset by the diminishing of the urban heat island intensity.Finally, knowing that urban trends depend on urban population growth and on temperature trends, the time rate of change method for estimating urban bias seems to be inadequate.
77

Canet, J.; Pérez Cueva, A.1998. Análisis del confort climático en Valencia. (Analysis of the climatic comfort in Valencia, Spain). Clima y ambiente urbano en ciudades ibéricas e iberoamericanas, Madrid, Spain, Parteluz, 343-356.
UBCL ML
ABSTRACT: The Terjung method is applied to the analysis of the comfort in Valencia. The most representative types of days are marked as well as their frequencies in the period 1960-90. The comfort index and the wind effect index of days and nights (13h-07h GMT) are also analyzed separately. The comfort values of Valencia-Els Vivers and Aeroport of Manises are compared to study the heat island effect in the comfort. Subjects Headings: Comfort; Terjung index; Urban heat island; Valencia, Spain.
Cañada, R.; Almendros, M.A.1998. Relación entre la intensidad de la isla de calor de Madrid y las variables del sondeo. (Relation between intensity of the urban heat island of Madrid –Spain- and atmospheric variables sounding). Clima y ambiente urbano en ciudades ibéricas e iberoamericanas, Madrid, Spain, Parteluz, 257-269.
PhMUC ML
ABSTRACT. The aim of this paper is to establish the correlation between the intensity of the Madrid heat island and the most characteristics atmospheric variables of the air mass in height (vertical temperature gradient included). Another purpose is to set up a model that reports which are the air radiosondes variables that better explain the variability of the intensity of the urban heat island. Subjects Headings: Urban heat island; Radiosounding; Vertical Temperature Gradient; Madrid, Spain.
Cionco, R.M.1998 Simulating wind fields for different resolutions of terrain and morphological land features. Proceed. AMS 13 th Conference on Biometeorology and Aerobiology, Albuquerque, New Mexico. 1998.
UP ML
ABSTRACT. With the availability of digitized, high resolution, morphology data bases, the presence and effects of land features upon flow fields can be quantified and established in support of several field applications and studies. Applications such as (a) more representative localized meteorological information, (b) addressing local air quality problems, (c) evaluating resultant effects of planting more trees, and (d) identifying downwind effects of new housing upon existing neighborhoods
78

can benefit form localized high resolution analyses of wind fields interacting with vegetative canopies, clusters of buildings, bare surfaces, impervious surfaces, and water areas.The meteorological domain for this study is the boundary layer, but more specifically the microscale of the surface layer. The computational resolution for this domain can be quite variable – usually ranging from 400 m to 1 m. The selection of the computational grid has much to do with urban location, age, cultural and financial history and other factors. Just as the growth pattern of urbanized areas is influenced by many factors so is the choice of the proper resolution of analyses performed on any specific area of study. This paper does not resolve that issue. It only notes and exhibits differences that are obtained through a simulation method.Although the simulation results are not included in the paper, the solutions do depict the interaction of air flow over the terrain and morphology for different resolution imposed. The effects of terrain only are light to moderate depending upon the wind’s angle of attack upon the terrain’s orientation. The additive effects of the morphological features further modify and deform the flow fields. Several other cases run for other conditions respond to the minimal terrain and the additive effect of the land features in a similar manner.
Cionco, R.M.1998. High resolution urban morphology data for urban wind flow modeling. Atmospheric Environment, Oxford, England. 32(1): 7-17.
PhUC ML
ABSTRACT: The application of urban forestry methods and technologies to a number of practical problems can be further enhanced by the use and incorporation of localized, high resolution wind and temperature fields into their analysis methods. The numerical simulation of these micrometeorological fields will represent the interactions and influences of urban structures, vegetation elements, and variable terrain as an integral part of the dynamics of an urban domain. Detailed information of the natural and man-made components that make up the urban area is needed to more realistically model meteorological fields in urban domains. Simulating high resolution wind and temperatures over and through an urban domain utilizing detailed morphology data can also define and quantify local areas where urban forestry applications can contribute to better solutions. Applications such as the benefits of planting trees for shade purposes can be considered, planned, and evaluated for their impact on conserving energy and cooling costs as well as the possible reconfiguration or removal of trees and other barriers for improved airflow ventilation and similar processes. To generate these fields, a wind model must be provided, as a minimum, the location, type, height, structural silhouette, and surface roughness of these components, in order to account for the presence and effects of these land morphology features upon the ambient airflow. The morphology of Sacramento, CA has been characterized and quantified in considerable detail primarily for wind flow modeling, simulation, and
79

analyses, but can also be used for improved meteorological analyses, urban forestry, urban planning, and other urban related activities. Morphology methods previously developed by Ellefsen are applied to the Sacramento scenario with a high resolution grid of 100 m x 100 m. The Urban Morphology Scheme defines Urban Terrain Zones (UTZ) according to how buildings and other urban elements are structured and placed with respect to each other. The urban elements within the 100 m x 100 m cells (one hectare) are further described and digitized as building height, building footprint (in percent), reflectivity of its roof, pitched roof or flat, building’s long axis orientation, footprint of impervious surface and its reflectivity, footprint of canopy elements, footprint of woodlots, footprint of grass area, and footprint of water surface. A variety of maps, satellite images, low level aerial photographs, an street level photographs are the raw data used to quantify these urban properties. The final digitized morphology database resides in a spreadsheet ready for use on ordinary personal computers. Subject Headings: Urban micrometeorology; Airflow in urban areas; Sacramento, California.
Cionco, R.M.; Steele, G. and Moran, G.1998. Remote sensing of wind profiles within and above an urban domain. Proceed. AMS 13 th Conference on Biometeorology and Aerobiology, Albuquerque, New Mexico. 1998.
RSUC ST
ABSTRACT. Few examples of vertical wind profiles collected within the urban layer are found in the literature. Physical modeling in wind tunnels invariably focuses on diffusion and air quality problems and seldom provide a comprehensive set of wind profiles in and about clusters of buildings. Collecting in-situ measurements of meteorology vertically within the urban layer is a difficult task. A mobile, self-contained wind system that remotely senses the vertical structure of the wind at a given site is a more practical solution than towers or a side-scanning radar to collecting data in the central business district (CBD).After preliminary measurements proved that it is feasible to collect vertical profiles of wind speed and direction within and above an urban domain with a Laser Doppler Velocimeter (LDV) system, several new data sets have been obtained in the El Paso CBD. Rather than a street canyon site, a parking lot area located in downtown El Paso, TX was selected as the long term measurements site. The taller buildings adjacent to the LDV site ranged from 30 to 63 m. The 63m hotel (Westin) structure just west of the LDV was aligned with the wind direction most often observed.Preliminary measurements and analyses showed that it is feasible to use the LDV to measure wind profiles within and above the urban layer and also to quantify the vertical structure of flow within clusters of roughness elements, the building. Previously, the LDV data also displays the vertical structure of the urban layer winds to differ notably from the ambient flow above the rural area.In all cases, a significant loss of momentum is exhibited in the urban layer and to a lesser, but notable degree, in the roughness layer immediately above the building
80

tops. Behavior of wind speed from case to case clearly showed a major reduction in the building layer, while attaining near uniform values well above the CBD. Directional effects of the wind in the urban layer usually reflected the upwind positioning of the buildings as well as gaps between the buildings. Above the roughness layer, both speed and direction were almost unchanging with height while only April examples exhibit a greater degree of variation.
Cleugh, H.A. and Grimmond, C.S.B.1998. Modelling regional scale surface energy exchanges and convective boundary layer (CBL) growth in a heterogeneous, urban-rural landscape. Proceed. AMS 13 th Conference on Biometeorology and Aerobiology, Albuquerque, New Mexico. 1998.
PhMUC ML
ABSTRACT. This paper explores the use of CBL methods to infer regionally averaged fluxes in a landscape with three distinct land covers: irrigated and non-irrigated rural, and urban. The CBL can be described in terms of a simple “slab model”, which comprises the scalar budget conservation equations and an expression for the growth of the CBL. The slab model can be used to predict the time rate of change of CBL growth and scalar concentrations, or rearranged to estimate the surface scalar flux from measurements of CBL growth and scalar concentrations. In this paper we assess several CBL growth models: McNaughton and Spriggs’ encroachment model.The budget equation for a scalar concentration, s, can also be integrated and rearranged to yield an expression for inferring the integral scalar flux (Fs) from measurements of s at two time periods.The slab model equations describe how a scalar concentration in a well-mixed column of air changes as that column of air is advected by the mean CBL wind across a landscape of scalar sources (or sinks). Because CBL measurements are nearly always Eulerian, the two models – the differential and integral forms of the slab model (DCBL and ICBL, respectively) must be applied with care.Difficulties in determining the effects of advection and multi-day trajectories have often limited the widespread use of the ICBL approach. Nonetheless, more and more studies are using the ICBL method to infer regional scale heat, water vapour and CO2 fluxes. Reasonable performance is usually found, especially for heat fluxes.This study provides an ideal opportunity to address issues concerning CBL budget methods because three quite different land-covers make up the CBL source area, one of which is urban. Our specific objectives are to: a) evaluate the ability of the slab model, forced with measured local-scale heat and water vapour fluxes, to predict mixed layer depths, temperature, and humidity; b) use measured time series of potential temperature to infer land-air exchanges of heat with the ICBL method; and c) compare these estimated ICBL fluxes with local-scale fluxes measured over surfaces representative of the ICBL source are.
81

Costigan, K.R.1998. Simulation of a winter precipitation event for Los Angeles water quality studies. Proceed. AMS 13 th Conference on Biometeorology and Aerobiology, Albuquerque, New Mexico. 1998.
PhMUC ST
ABSTRACT. Coastal habitats are among the critical ecosystems at risk due to urbanization along the coasts of the world. Nutrient loading of coastal waters from urban effluents is a serious problem. Excessive amounts of nutrients (including nitrates) can lead to massive algal blooms that block sunlight in the waters. In addition, the oxygen required for fish is depleted by the decay of dead plant material. Report that atmospheric deposition is a significant fraction of the total nitrogen entering the coastal and estuarine ecosystems along the east coast of the United States. Thus, to understand the water quality and the ecological health of coastal waters near major cities, the effects of the precipitation and runoff in urban areas need to be addressed.The emphasis of this paper is on simulating the weather and precipitation associated with a winter storm event in the Los Angeles area. The precipitation event of 4-5 December 1987, which follows an air pollution event on 3 December (when measured nitrate concentrations were high), will be simulated. The complex interactions of the meso-scale forcings in this urban area with the synoptic-scale weather will be presented. In particular, the roles of the land-ocean interface an the complex topography surrounding the city in determining the precipitation quantities and distribution will be discussed.
Diem, J.E. and Comrie, A.C.1998. Development of a biogenic emissions inventory for a southwestern, semi-arid city. Proceed. AMS 13 th Conference on Biometeorology and Aerobiology, Albuquerque, New Mexico. 1998.
QUA ST
ABSTRACT. Biogenic volatile organic compounds (BVOCs) are important contributors to regional/local photochemical oxidant formation (i.e. ozone). Ozone formation involves the oxidation of biogenic hydrocarbons and other volatile organic compounds in the presence of nitrogen oxide (NOx) and sunlight. Besides being potentially abundant, BVOCs are also more reactive than anthropogenic hydrocarbons, thus they may have a greater ozone-forming potential. These hydrocarbons need to be quantified accurately; accurate estimates of biogenic emissions allow for more accurate predictions of changes in ozone concentrations resulting from proposed changes in anthropogenic emissions. From an ozone control perspective, the development of a complete and accurate biogenic emissions inventory is crucial, for high BVOC levels are a difficult obstacle to overcome.
82

This paper describes the development of a biogenic emissions inventory for the Tucson, AZ region. The Tucson metropolitan area is a rapidly growing area with a population exceeding 700,000 people. Situated within the Sonoran Desert, the region (approximately 11,000 square kilometers) contains nine distinct vegetation zones that cover the range from 2,000 feet (610 meters) to over 8,000 feet (2440 meters) a.s.l. The zones (listed from lowest to highest elevation) are as follows; desert saltbrush, creosotebush, paloverde-saguaro, Chihuahuan Desert zone, deciduous riparian forest, grassy phase grassland, woody phase grassland, evergreen woodland, and evergreen conifer forest.Specific objectives of the study are as follows; (1) develop a vegetation-based land cover map of the region, (2) sample each class to determine species composition and biomass estimates, and (3) apply lead biomass constants and hydrocarbon emission rates to the land cover information to create standardized hydrocarbon emission maps. The ultimate goal is to determine the impact that BVOC emissions have on ozone formation within the Tucson region.Accurate estimates of ozone precursor emissions are essential components of the ozone modeling process. Coupled with meteorological information (i.e. temperature, wind speed, and wind direction), hourly BVOC emissions can be calculated. Consequently, the relative role of BVOCs in ozone formation within the Tucson region can be estimated.
Diem J.E. and Comrie, A.C.1998. Estimating biogenic emissions for urban airshed modeling in Tucson, Arizona. Proceed. of the AAG 94 th Annual Meeting, Boston, USA. 1998.
QUA ML
ABSTRACT. Determining the background or “natural” emission of pollutants is important for air pollution studies that attempt to quantify the impact of anthropogenic activities on pollutant levels. With respect to a secondary pollutant such as ozone, the biogenic emission of non-methane hydrocarbons represents the background emission of ozone precursors. Accurate estimates of these emissions allow for a proper evaluation of anthropogenic emissions of ozone precursors and a thorough examination of climatological effects on urban air pollution.Emission estimates are a major input component of the Urban Airshed Model (UAM). The UAM, a three-dimensional photochemical grid model, simulates physical and chemical processes in a specified airshed with the output being predicted ozone concentrations. This study describes the development of a summertime biogenic emissions inventory for the Tucson modeling domain. Most biogenic emissions inventories have been developed for humid, forested areas where the urban vegetation is similar to that of the peripheral areas, which are typically more vegetated. Relatively accurate non-methane hydrocarbon emission rates are available for many trees and shrubs of the eastern United States; however, rough and/or no emissions estimates are available for southwestern vegetation.
83

Unlike eastern areas, Tucson's urban vegetation is considerably different from that of the surrounding areas. The region's urbanized/residential areas tend to be populated by an assortment of exotic and relatively mesic species. The natural vegetation of the Tucson region is primarily xeric (i.e. creosote bush and bursage) while more mesic species (i.e. oak, juniper, and pine) exist at higher elevations (greater than 4,000 feet above mean sea level). Due to the vegetative heterogeneity of the entire region and especially within urban/residential areas, vegetative land cover classification is difficult. This study analyzes land cover with remotely sensed data; consequently, a classification of vegetative cover is attempted. Certain techniques are used to generalize the vegetative cover of the urbanized/residential areas while still retaining some species composition information for different areas. Using the completed land cover classification and the appropriate emission rates, a map of standardized biogenic emissions is created for the Tucson region.Keyword: climatology-urban, ozone, vegetation.
Doesken, N.J. and Harrington, J.W.1998. Urban climate data continuity-the case of Denver, Colorado. Proceed. AMS 13 th
Conference on Biometeorology and Aerobiology, Albuquerque, NM. 1998.
GUC ML
ABSTRACT. Originally, Denver had only one weather station. The made climate monitoring relatively easy. The fact that it moved from one rooftop to another in downtown Denver in its early history does not appear to have been a major concern. Gradually over the years, as the metropolitan area expanded, and broader needs and applications for climatic data developed, several National Weather Service cooperative stations were established. A fundamental change occurred in 1950 when the traditional downtown rooftop weather station was replaced by the new airport weather station at Stapleton Field, east of the downtown area, as the primary “official” weather station for Denver. Similar changes occurred throughout the nation from the 1930s into the early 1950s as aviation became the primary paying customer for continuous weather reports. Most recently, an even more dramatic change occurred when the new Denver International Airport (DIA) was opened in 1995 twenty kilometers northeast of the previous airport and about 33 kilometers from the original downtown weather station.Along with this growing list of stations in variably urbanized and differing topographic settings, there have also been changes in instrumentation, instrument exposure and observing practices at many of these observing sites. For example, for measuring temperature, manually-read self-registering maximum and minimum thermometers in traditional “Cotton Region” shelters have been replaced at airport weather stations by evolving electronic sensors in a variety of different radiation shields culminating in the National Weather Service’s current Automated Surface Observing System (ASOS). While these changes have been transparent to most data users, climatologists and data collection experts are well aware that such changes often introduce detectable discontinuities into the long-term climate record. In fact,
84

for temperature data, minor location changes, equipment changes, or even just a change in the scheduled time of observation can result in temperature changes for seasonal or annual averages that are of the same magnitude as observed year-to-year variability.This is a very cursory look at the Denver temperature history. Interpretation is made difficult by discontinuities caused by station moves and rooftop locations that have plagued Denver’s long-term temperature measuring history. Fortunately, overlapping data collection from multiple stations has helped define these discontinuities. Temperature measurement is surprisingly well correlated across the Denver area despite significant topographic, elevation and exposure differences. Warming is apparent during the first half of Denver’s climate record, but there is no sign of continued warming during recent decades. A variety of local effects related to elevation, topography, instrument exposure and local vegetation, and occasional station changes make it very difficult to precisely determine a representative and unambiguous temperature history for the city. This is demonstrated by the diversity and seasonality in temperature differences across the area with respect to the new Denver airport.
Dorling, S.R. and Gardner, M.W.1998. Neural network based air quality modelling in London, UK –What are the data requirements for accurate simulation? Proceed. AMS 13 th Conference on Biometeorology and Aerobiology, Albuquerque, New Mexico. 1998.
QUA ML
ABSTRACT. Artificial neural networks (ANN) are slowly emerging as an additional tool in the air quality modeller’s armoury. The non-linear nature of the relationship between pollutant emissions, meteorological conditions and ambient pollutant concentrations is well suited to an ANN modelling approach as it is this ver non-linearity which ANNs can capture, without requiring subjective decisions on the nature of the non-linearity.It is important to directly compare results of an ANN air quality modelling approach with those from more traditional physical, chemical and statistical techniques. One of the characteristics which has long been associated with ANNs is their ‘black box’ nature and the difficulty of interpreting their behavior, however accurately they appear to simulated a process. If true, this would of course be a severe restriction on their utility to any scientist. However, we demonstrate in this paper that by carefully designing a set of experiments (in terms of network structure and choice of data inputs), this limitation can be overcome and the scientific interpretation made clearer.Significant implications follow from this study with respect to data requirements in air quality modelling. Many of the more advanced models require fairly detailed emission inventory input data as well as meteorological information more detailed than that used in this study (for example mixing depth). We believe that the non-linear modelling capability offered by ANNs enable the relatively simple
85

meteorological inputs which we used to act, to some extent, as adequate surrogates for these additional parameters. Significantly, the approach reported here may enable useful modelling to be undertaken in areas where source emissions and extensive meteorological information are not available for whatever reason.Finally the success of our approach raises the question of using this technique in a forecast mode as part of an air quality prediction scheme. We will be investigating the potential to use gridded weather forecast data of the kind of variable used as the input data to the ANN reported in this paper. The overall accuracy of such a scheme will, of course, be affected by using gridded data (rather than station meteorological data) and by the accuracy of the forecast. It is likely that an ANN approach will also be useful for establishing the best relationship between gridpoint model output and local weather conditions. Again, careful comparisons need to be made between ANN predictions and those of the techniques currently adopted to provide this forecast service.
Elguindi, N.; Detwiler, J. and Kalkstein, L.1998. Early season heat waves and mortality in southern U.S. cities. Proceed. AMS 13 th
Conference on Biometeorology and Aerobiology, Albuquerque, New Mexico. 1998.
UBCL ST
ABSTRACT. Both medical specialists and climatologists have investigated the impact of weather variability on human health. One of the more vexing topics is the effect of extreme heat on urban populations. Previous studies have uncovered a strong link between extreme heat and human mortality in many parts of the U.S., especially along the Northeast corridor and the Midwest. However, the relationship appears to break down in the South. Many explanations for this difference have been put forth: southerners are better acclimatized to extreme heat; irregular heat waves are more dangerous than constant heat; low-income housing in the south is more suited to high temperatures.Our previous studies have defined the summer season as June, July, and August. One trend that shows up repeatedly in northern cities is that heat waves appear to become less harmful as the summer progresses. A reasonable interpretation of this trend is that the more susceptible segment of the population is removed by early heat waves in June, leaving a less vulnerable population in August. This study hypothesizes that southerners may indeed be vulnerable to extreme heat because early warm season heat waves in April and May have been overlooked.The objective of this study is to determine the impact of early warm season heat waves on human mortality in the southern U.S., as these may have been previously de-emphasized. Twelve southern cities representing both dry and moist climates are selected for investigation. Because individual weather elements often fail to capture weather-environment relationships, an apparent temperature threshold scheme is employed to investigate the weather-mortality link. The apparent temperature (or heat index) takes into account both actual temperature and relative humidity in determining the human-perceived temperature. This procedure involves identifying
86

a city-specific temperature beyond which mortality significantly increases. Once a threshold temperature is found. The mean mortality for days above the thresho9ld is computed to determine the existence of a mortality link.A concern in dealing with springtime health data is the seasonal variation in mortality. Generally, death rates are at their peak in the winter, because people are confined indoors and are more exposed to infectious diseases. This situation becomes less important as temperatures begin to warm in the spring, and stabilizes in the summer when temperatures are more or less constant, and people are less confined. Another possible explanation is that the elderly people who spend their winters in warmer climates are leaving during this time, thus decreasing the size of the susceptible population. The stability of the summertime mortality curve allows for the merging of the entire June-July-August data set. However, the downward trend in mortality rates throughout spring prevents a similar merging of the April-May data set. This difficulty is addressed later in the procedure section.Initial total –mortality results for two southern cities (Dallas-Ft. Worth and Washington, DC) show evidence of a possible weather-mortality link in spring.
Eliasson, I.1998. The use of local climate knowledge in urban planning. Proceed. AMS 13 th
Conference on Biometeorology and Aerobiology, Albuquerque, New Mexico. 1998.
UP HL
ABSTRACT. Semi-structured interviews have been conducted with urban planners and decision makers at three different urban districts in southern Sweden. The aim was to investigate if, how and when local climate knowledge is used in the urban planning process. The study, which was initiated and financially supported by the Swedish Council for Building Research, are intended for both researchers and practitioner in order to increase the communication between them. Another purpose with the study was to fund the best method to translate scientific knowledge into applicable models for urban planning.The study method was developed in cooperation with researchers at the Department of Urban Planning and Design at the Chalmers University of Technology (CTH) in Göteborg, Sweden and at the Norwegian Institute for Urban and Regional Research (NIBR) in Oslo, Norway. The questions used were intended to reveal the following: the level of knowledge at the urban districts the motives and barriers for use of climate knowledge the methods of finding and using climate information the weight of climate in the planning process variations among different planning levelsThe results showed that the level of climate knowledge is rather high at all three districts, but also that the use of the climate knowledge is unsystematic. The definition of “climate” in the study was wide, but almost all of the people questioned were aware of the importance of the sun and the wind. Some people had more knowledge than others and used, for example, information about cold air drainage
87

in their work. The methods for finding and using climate information varied a lot from “rules of thumb” to softwares for solar calculations and local climate pas/energy indices. Most of the planners had found the climate information through “self studies”, internal seminars or courses at the University. The urban planners expressed a great demand for seminars, easily accessible literature but also a need for methods as for example models based on Geographical Information Systems.
Eliasson, I. and Upmanis, H.1998. The nocturnal wind climate of an urban green area –field observations from Göteborg, Sweden and Kbenhavn, Denmark. Proceed. AMS 13 th Conference on Biometeorology and Aerobiology, Albuquerque, New Mexico. 1998.
GUC HL
ABSTRACT. Investigations of the nocturnal wind climate in urban parks during clear and calm weather have been carried out during a period of two years. The main purpose with the study was to seek field evidence for the hypothesis that the temperature difference between large parks and their surrounding built-up areas induce a thermal wind system, the park breeze.The field surveys were made by using hand-carried instruments in an around the parks. The measurement points, arranged in profiles, were chosen with respect to the topography and vegetation and the measurements were carried out in intervals during the night. The wind speed was measured with an anemometer and the wind direction with a wool-thread and a compass, both at a height of 2 metres. In addition to these measurements, data from permanent meteorological stations have been used in the analysis.The results strongly indicate that a park breeze develops in both parks during certain conditions. The windpattern, interpreted as park breeze, was characterized by calm in the middle of the park and a distinct and steady outflow of air at the park borders. The park breeze system started one to two hours after sunset and was best developed during the first part of the night. The results also indicate that the system continues during a period of at least 3-5 hours, but additional field data are needed before a more exact determination of the start and breakdown of the system can be made. The general pattern of the park breeze does not differ between the summer and winter examples. Neither were the general wind patterns different in the flat Fælledparken compared to the topographical Slottsskogen
Ellefsen, R.1998. High resolution inventorying of urban morphology to support wind flow modeling: progress and prospect. Proceed. AMS 13 th Conference on Biometeorology and Aerobiology, Albuquerque, New Mexico. 1998.
PhMUC ML
88
ABSTRACT. Detailed, high-resolution inventories of the morphological attributes of surface conditions of six separate urban areas have been prepared to support wind modeling studies being conducted by the U.S. Army’s Atmospheric Science Laboratory (reported on by Ronald Cionco). Inventoried areas:St. Louis, MO 1992 886 sq. KmUppsala, Sweden 1993 225 sq. KmSacramento, CA 1995 875 sq. KmEl Paso TX, and Juárez, Chihuahua, Mexico 1995 1120 sq. KmEdgewood, MD 1997 190 sq. kmThe primary step to identifying and recording the physical attributes is the determination of the observation unit’s (one hectare) place in an Urban Terrain Zone (UTZ) classification system (as developed by the author for the U.S. Army and currently being widely applied). Its classes, based on morphology, rather than function, take into consideration: building density; building construction type; building age; type location within a city; and evolution (e.g., railroad or truck oriented industrial areas).Urban surfaces, being scaled to human usage, are often quite varied within a typical, single urban hectare thus posing the challenge of choosing a spatial resolution that adequately represents the complexities of urban landscapes – allowing for the accounting of such features as heat-absorbing parking lots – while being manageable within data-heavy meteorological models. One answer is to determine a dominant feature within the hectare. This approach could be aided by trying finer spatial resolutions, such as halving and halving again the linear scale, thus quadrupling the number of cells each time. Variety within a cell is reduced at the 50m level but the scale is not yet large enough to preclude a mix of features within. Even at the 25m level some, but not all, cells are “pure”, and the further quadrupling of data may not be cost beneficial.
Endlicher, W.; Mikkank, R.; Polimeni, M.; and Zahnen, B.1998. Weather types, urban heat island, and local wind systems in Mendoza/Argentina. Proceed. IGU Commission of Climatology. Evora 1998.
GUC ST
ABSTRACT. The investigation of the urban climate of the city of Mendoza (33ºC), was part of a larger project including different topics of urban ecology. Mendoza is located at the eastern foothills of the Andes. The city and its suburbs have a population of about 600 000 inhabitants.Measurements of temperature, humidity, radiation and wind were carried out during two years starting January 1996. A special network of 7 weather stations was designed and measuring drives through selected parts of the city were organized. A tethered balloon system supplied some additional data of the urban boundary layer. Special interest was given to the features of the urban climate during the most frequent weather types.
89

The subtropical regional climate of the oasis of Mendoza is modified by very regular local winds. The downslope and mountain breezes at night are very frequent phenomena during anticyclonic and north-eastern weather types. During the daytime, the upslope breezes from the north-east predominate between 10 a.m. and 6 p.m.The urban heat island is well developed even in winter months reaching values up to 6 k. South-eastern weather types with maritime Atlantic air masses and rain reduce the intensities of the local winds and the urban heat island to only 2 K. Extreme values and wind velocities are possible during Zonda (Föhn)-events in the winter months. In these cases, the higher western parts of the city are covered with warm and dry Zonda-air masses a long time before the lower eastern suburbs, which remain much longer under and often polluted inversion layer.The local wind systems are very important for intensity and distribution of air pollution in the city and have to be taken into account in the future development of the city.
Fernández, F. and Rasilla D.1998. Relationships between synoptic-scale atmospheric circulation and ozone concentrations in Madrid (Spain). Proceed. IGU Commission of Climatology. Evora 1998.
QUA ML
ABSTRACT. An eigenvector synoptic classification procedure was applied to both sea level and 500 hPa NMC gridden pressure fields over the Iberian Peninsula and Eastern Atlantic Basin to analyze links between concentrations of atmospheric pollutants and atmospheric circulation. Such classification has allowed to identify several synoptic types with strong relationships with surface concentrations of several pollutants, because each one possesses distinctive characteristics in terms of temperature, wind and vertical stability.The results show that the air quality is strongly modulated by the atmospheric circulation, represented by the synoptic types, especially those, which favour anticyclonic conditions or warm advections in the medium troposphere. And also, this analysis shows the importance of persistence in the development of elevated pollutants concentrations.
Frost, D.B.; Kaviani, M. and Forest, Ch.M.1998. Temperature and heart attack deaths in Canadian cities. Proceed. AMS 13 th
Conference on Biometeorology and Aerobiology, Albuquerque, New Mexico. 1998.
UBCL ML
ABSTRACT. Heart attack and other forms of cardiovascular death vary systematically in number with air temperature over various time scales between the
90

daily and the seasonal. Daily myocardial infarct death rates and air temperature data have been investigated in a range of environments in Australia, New Zealand and Canada.Previous Canadian studies concentrated on the Montreal urban area on account of its great annual range of temperature and heavy winter snowfall. The current work also considers the major conurbations of Toronto, Vancouver and Winnipeg.Previous work has also established that there is no systematic relationship between the heart attack deaths of those below 65 years of age and temperature. Accordingly, this study is limited to those over 65 years. However, gender has been shown to be important and this study examines male and female relationships separately.This study has examined rates of heart attack death in those over age 65 in four urban environments with differing thermal environments at two time scales. In all cities and at both time scale, death rates are related to temperature with the highest death rates occurring at close to the warmest and coldest temperatures regardless of absolute temperature values.We conclude that the populations studied are adjusted to their normal temperature range. If global climate changes by the amounts envisioned in most scenarios, over time scales measured in decades, our findings imply that there will not be a significant increase in mortality from myocardial infarction.
Fujino, T.; Asaeda, T. and Ca, V.T.1998. Analyses of the urban thermal environment in a basin and the effect of its topography. Proceed. AMS 13 th Conference on Biometeorology and Aerobiology, Albuquerque, New Mexico. 1998.
GUC ML
ABSTRACT. Analyses of urban heat island has been studied in many parts of the world. However, there have been few investigations of the meso-scale interactions of city climate with other medium-scale influences such as slope winds, valley circulations and land/lake breezes. In Japanese cities, most of them are located on the coastal zones or near mountain range, which are subjective to the local wind intrusion. Inland or the bottom of the basin area, on the other hand, suffer from the intensified heating stress during diurnal time in summer (ex. Ref. [8]). Analysis of the urban thermal environment is needed to perform by including these outer-scale influences. This paper presents the effect of the surroundings on the urban climate.Urban heat island phenomena is clearly formed by its characteristics of heat release, however, it also strongly depends on the geography condition. As demonstrated above, the basin climate is mainly formed by the local circulation in the surroundings. The urban effects are added against this condition. To analyses urban thermal environment on such complex conditions correctly, it needs to compute the surroundings successfully.
91

Gallo, K.P. and Owen, T.W.1998. Influence of land use/land cover on U.S. historical climate network temperature trends. Proceed. AMS 13 th Conference on Biometeorology and Aerobiology, Albuquerque, New Mexico. 1998.
GUC ML
ABSTRACT. The influence of land use/land cover /LULC) on several meteorological variables has been well documented. Gallo et al suggested that the LULC associated with climate observation stations needed to be periodically monitored, and speculated that the transition of the LULC from predominantly rural to a more urban setting can have an impact on the trends in temperature (specifically a decrease in the diurnal temperature range) similar to that which would be expected under an enhanced greenhouse warming scenario. Compared several land use/land cover designations of stations included in the U.S. Historical Climatology Network (HCN). This study focuses on those LULC classes defined by satellite derived data.The general (urban, suburban or rural) land use/land cover (LULC) associated with surface observation stations can influence the trends observed in temperature. The designation of a station as rural, urban, or suburban (potentially in transition from rural to urban) can influence the results of analyses often used for detection of changes in the regional and global climate. The station LULC designated in this analysis were assumed to be constant throughout the interval of study. While this assumption is likely valid for rural stations (i.e. a station rural in the 1990’s was likely rural in the 1950’s), it may not be valid for some of the suburban or urban stations. Thus, the general categories of LULC at a station, as well as the changes in these designations over time, may be important considerations. Periodic assessment of these general designations of LULC should be encouraged on a global basis. The satellite-based methodology, while potentially applicable on a global basis, will likely have to be refined to account for regional or country variability.
Ganho, N.1998. Clima urbano e contrastes de precipitaçao em Coimbra (Portugal). (Urban climate and precipitation contrasts in Coimbra). Clima y ambiente urbano en ibéricas e iberoamericanas, Madrid, Spain, Parteluz, 93-111.
GUC ML
ABSTRACT. In this paper we analyse the rain differences among two meteorological stations located, one in the urban interior, the other in the surrounding urban area of Coimbra (Portugal), related to factors such as spatial thermal contrasts in the urban area of the town. Subject Headings: Urban climate; Urban precipitation; Coimbra; Portugal.
92

García Marchante, J.S.; Fernández, Mª C.1998. El crecimiento urbano y las modificaciones térmicas en la ciudad de Cuenca. (The urban growth and the temperature modification in the city of Cuenca, Spain). Clima y ambiente urbano en ciudades ibéricas e iberoamericanas, Madrid, Spain, Parteluz, 271-280.
GUC ML
ABSTRACT. Due to its topography, Cuenca presents two differents urban areas: the medieval center, with narrow, winding and slopping streets, builded on a hill shaped by the river Júcar and its tributary Huecar, in the rajoining of these of the XIX. Century wich has sufferd a pronounced increase during the last fifteen years. Los itinerarios urbanos (N-S: ciudad histórica-ensanche; NW-SE: exclusivamente por el ensanche) seguidos en noches de anticiclón y viento en calma reflejan inversiones de temperatura e indicios de isla de calor en el tramo en que coinciden los dos transectos. Se ha observado, además, un incremento de la temperatura media anual durante la última década. Subjects Headings: Urban growth; Temperature Modification; Cuenca, Spain.
Genchi, Y.; Otani, T., Amano, H.; Kosugi, N.; Osa, Y. And Komiyama, H.1998. Evidence for urban heat island phenomena in underground temperature profiles in Tokyo. Proceed. AMS 13 th Conference on Biometeorology and Aerobiology, Albuquerque, New Mexico. 1998.
GUC ML
ABSTRACT. Due to the heat island phenomena, the air temperature in the urban area is higher than in the rural, and some countermeasures like tree-planting, hydrated pavement, and air-conditioning equipment with underground radiators, have been proposed. But the scales of countermeasures and the areas where the countermeasures would work effectively have not been determined. One of reasons is the uncertainty of air temperature levels in urban areas, because air temperatures between buildings are difficult to assess in meso-scale climate models.In this study, we aim to evaluate the quantitative temperature rise in a high energy consumption field in Tokyo. We focus on the underground temperature fields and discuss the effect of air temperature rise on the underground temperature profile.The effect of air temperature rise on underground temperature fields was discussed. Underground temperature profiles from ground level to 4m below the surface and air temperatures were measured for one year at four locations in Tokyo, Japan.The annual averaged air temperature in the urban area was 2.1ºC higher than that in the rural area. The annual averaged underground temperature at 4m below in the urban area was also 2.2ºC higher than that in the rural area. Daily averaged surface temperatures and air temperatures above showed a linear correlation,
93

indicating that surface temperatures effectively record the overlying air temperatures.The temperature field in Kyoka was simulated for one year using a one-dimensional thermal diffusion model. Fitted thermal diffusion coefficients were in god agreement with the range in the literature.We simulated yearly changes of the underground temperature profile with a rising surface temperature over a period of several years. The results showed that it took at least 5 years for the underground temperature at 4m below in Kyoka to rise to 19.1ºC from the past underground temperature in Tokyo.From these results, we conclude that the underground temperature fields record the past air temperature changes through changes in the surface temperature. Through analysis with air temperature fields, underground temperature fields could be important as both indexes and evidence for urban heat island phenomena.
Goldreich, Y. and Amitai-Frenkel, S.1998. Detection of ground and roof level urban heat island. Proceed. AMS 13 th
Conference on Biometeorology and Aerobiology, Albuquerque, New Mexico. 1998.
RSUC ML
ABSTRACT. Urban spatial ground heat island may be detected from airborne or satellite infrared images. Such an image was utilized to study the structure of the city center nocturnal heat island of Johannesburg. This was done by applying the Distance Correlation Matrix (DISTCORMAT) technique. However, the thermal input contains values that represent the ground (roads, pavements, vegetation, etc.) and roof levels alike. Partitioning between these two levels is not straightforward, and some suggestions to differentiate between them have been applied.Lately, an image processing technique was presented which remove the rooftop of buildings. It is estimated that the partitioning accuracy for the Johannesburg thermal image is between 81% and 92%. The objective of the present paper is to study a portion of the mid-day heat island of Munich (Germany), and to apply the DISTCORMAT technique on roofs and ground level separately.It has been demonstrated that studying the structure and locating the urban heat island center with the aid of a remote sensing (airborne and satellite) thermal images is not simple due to the various levels which are mixed on the images. The next step in our study will include the application of some different image processing on both the Johannesburg nocturnal image and the whole city center of Munich.
Grant, R.H.; Heisler, G.M.; Gao, W. and King, W.1998. Multiple waveband solar irradiance in an open tree canopy: measurement and modeling. Proceed. AMS 13 th Conference on Biometeorology and Aerobiology, Albuquerque, New Mexico. 1998.
94

PhMUC GU
ABSTRACT. Human health effects of solar irradiance are waveband specific. Radiation in the longer wavelengths influences the thermal comfort of people, while the shorter ultraviolet wavebands are associated with increased risk for various skin cancers. Health risk from the shorter wavelengths is evident by the creation of the UV Index that provides the public with an estimate of the risk for erythema (sunburn) each day. Health risk from the longer wavelengths is evident in the use of a wide range of heat stress indices.The irradiance of these various wavebands is strongly dependent on the atmospheric and surface scattering characteristics. In open canopies, where the spacing between trees is equal to or greater than the individual tree crown, the irradiance is also strongly dependent on the relative positions of the individual trees and the point of interest in or under the canopy. Open canopies typically have highly variable views of the sky and its diffuse radiation, dependent on the location of interest. In addition, the pathlength of radiation through the vegetation canopy is also highly variable and dependent on the location of interest.This paper describes the development and evaluation of a generalized 3-D radiation model for the prediction of the irradiance in the vicinity of a relatively isolated tree in an open suburban canopy.Measurements of the UVA and UVB irradiance in open canopies in the vicinity of single trees have shown that the sky view from a location strongly influences the irradiance at the location. The UV irradiance in the shade of the tree was 30% and 65% of the irradiance above the canopy while the SW and PAR irradiance was only 10 t0 20% of the irradiance above the canopy. Other studies have shown that the relative irradiance directly under a tree crown reduces the relative UVA, UVB, and PAR irradiance to 0.10 or less.This has implications for public health. The UV Index, designed to give guidelines for time-to-burn (erythema) for people with light skin types, assumes sunlit, open environmental conditions. However, the public does not typically work in wide-open areas, but in areas at least partially surrounded by buildings and vegetation.Adjustments in the time-to-burn to account for the complex environment in which people work and play can be made by dividing the time-to-burn by the relative irradiance. For example, if the UV Index indicated a time-to-burn of 10 minutes of noon sun for people with sensitive skin types, an individual in the shade at the same time of day may have a time-to-burn of 10/0.4 or 25 minutes. This however is not what is generally perceived by the public. Based on the present advice provided to the public, they would assume that being in the shade provides nearly complete protection from erythema for any length of time in the shade. The result is increased likelihood of sunburn and increased risk for skin cancer. While tree shade does not protect from UVA and UVB radiation to the degree perceived by the public, being under the tree crown does provide significant UVA and UVB protection.
95

Grant, R.H. and Wong, K.1998. Local ozone maxima in profiles over a suburban neighborhood. Proceed. AMS 13 th
Conference on Biometeorology and Aerobiology, Albuquerque, New Mexico. 1998.
QUA ML
ABSTRACT. Ozone (O3) is still a major environmental and health concern despite the pollution control efforts by the U.S. Environmental Protection Agency. While many people may be chronically exposed to moderate levels of [O3]s in suburban areas, little is known about the temporal and spatial characteristics of [O3] in these urban to rural transitional regions.Air overlying a region has layers of diverse history and consequently diverse chemical composition and chemistry. This results in complex [O3] profiles in both rural and urban areas that do not show a monotonic decrease in concentration with decreased height but have low level (<100m) and mid-level (100-500m) local ozone maxima in the profile. Ozone and O3 precursors such as HC and NOX from urban centers are transported into rural and suburban areas and can significantly enhance O3 local production. Thus [O3] profiles over suburban areas are likely to be complex due to advection of ozone, NO, heat, and moisture from urban and rural areas as well as to the complex turbulent transport typical of sparse canopies of vegetation intermixed with strong heat sources as found in suburban areas. This paper reports on a study of the vertical and temporal variation in ozone over a suburban neighborhood.The local ozone maxima and common presence of advective contributions to [O3], [NOX] and [HC] show interactions of horizontal and vertical mass transport with photochemistry.We hypothesize that the presence of an IBL caused an increase in ozone production over destruction within the IBL by reducing exchange of ozone across the entrainment layer. The reduced exchange was evident in the mixing ratio gradients.Results indicate that the ‘blind’ use of eddy correlation measurements for O3 flux estimation without supporting measurement of mean [O3] profiles to indicate the representativeness of the flux measurement is dangerous.
Grimmond, C.S.B. and Oke, T.R.1998. Measured and modelled values of roughness length in urban areas: recommendations and cautionary comments. Proceed. AMS 13 th Conference on Biometeorology and Aerobiology, Albuquerque, New Mexico. 1998.
PhMUC GU
ABSTRACT. Accurate knowledge of the aerodynamic characteristics of cities is vital to describe, model, and forecast the behavior of urban winds and turbulence at all scales. Here we consider two parameters: z0 (roughness length) and zd (zero-plane displacement length). Two classes of methods are commonly used to determine these:
96

micro-meteorologic (or anemometric) – use field observations of wind or turbulence to solve for z0 and zd included in theoretical relations derived from the logarithmic wind profile
morphometric (or geometric) – use algorithms relating z0 and zd to measures of surface morphology.
Problems arise when either set of methods are used in cities. This paper provides a summary of a systematic review and evaluation of measured and modelled data in the published literature. Our objective is to highlight problems and recommend appropriate measurement techniques and the best morphometric methods.Modern technology makes it possible to measure almost continuously with fast-response sonic anemometers. But careful attention must be paid to the choice of site and in order to properly interpret and generalize the results it is necessary to fully document the instrumentation, tower, and site characteristics. Development of urban GIS allows the application of morphometric methods more readily, and the methods of Ba, Bo, Ra and Ma promise to yield sound results. However, in any application (measurement or modelling based) where roughness parameters are used, careful attention must be paid to minimize sources of error and to ensure that the value obtained is reasonable.
Grimmond, C.S.B. and Oke, T.R.1998. Urban evapotranspiration rates. Proceed. AMS 13 th Conference on Biometeorology and Aerobiology, Albuquerque, New Mexico. 1998.
GUC GU
ABSTRACT. The widely held belief is that urban evapotranspiration (ET) rates are considerably less than those from neighboring rural areas because of contrasts in the hydrologic properties of building materials and vegetation-covered soils. However, for many urban areas trees and other vegetated surfaces cover a significant area. In fact in many urban environments there are more trees than in the surrounding rural landscape. Work in Vancouver, B.C. has shown that ET is an important component of that city’s energy and water budget (constituting ~40% of annual and ~80% of summer water losses). Yet few data exist for other locations. Consequently, knowledge of the spatial variability of urban ET rates within and between urban areas remains limited, despite the fact that such data are needed in many hydrological, meteorological, ecological and horticultural applications.Here we report direct observations of ET for a range of North American cities (Mexico City, Miami, Tucson, Sacramento, Los Angeles, Vancouver and Chicago). The results extend significantly or knowledge of ET in cities, demonstrate clearly the micrometeorological/hydrological significance of the flux in urban areas, and illustrate important differences with land use (notably between downtown, light industrial, and residential areas).Evapotranspiration in urban areas is an important flux. In residential neighborhoods it constitutes an energy sink of 22-37% of the daytime net all-wave radiation. In downtown and light industrial sites it is much less important. In many
97

instances ET exceeds precipitation and is sustained by external water use from the piped urban supply. In residential areas is remarkably conservative, sustained either by regular rainfall or irrigation. Even in Tucson with a landscape designed to conserve water, irrigated surfaces are extensive enough to sustain rates similar to those in Mi95. The notable exception is Vancouver during a period with an irrigation ban. However, QE is water limited in summer-time and maximum values are 50% of equilibrium rates during the middle of the day (for the conditions reported here).These results suggest that in continuous water balance modelling, particularly simulations of low flow conditions and associated water quality, attention must be directed to evapotranspiration and it must be modeled accounting for external water use, notably irrigation. These results also have important implications for urban climate flux parameterisations. Surface controls on are strong, although some dependence on D is evident. If simple surface-based schemes can appropriately capture the essence of , it may then be much easier to parameterise QH which appears to be much more strongly influenced by meteorological controls.
Guijarro, J.A.1998. Influencia de la urbanización en las series termométricas de Baleares. (The influence of urbanization in the thermometric series of Baleares, Spain). Clima y ambiente urbano en ciudades ibéricas e iberoamericanas, Madrid, Spain, Parteluz, 305-314.
GUC ML
ABSTRACT. The influence of urbanization on the monthly means of maximum and minimum temperature in the Balearics has been evaluated through multiple regression analysis, and the effect of urban growth on Palma de Mallorca monthly series through comparison with those from its airport. Subjects Headings: Urbanization influence; Thermometric series; Urban Growth; Palma de Mallorca, Baleares, Spain.
Heisler, G.M. and Wang, Y.1998. Semi-empirical modeling of spatial differences in below-canopy urban air temperature using gis analysis of satellite images, on-site photography, and meteorological measurements. Proceed. AMS 13 th Conference on Biometeorology and Aerobiology, Albuquerque, New Mexico. 1998.
PhMUC ST
ABSTRACT. Many site and weather system factors influence microclimate regimes in urban areas on a wide range of horizontal and vertical dimensional scales. This study explored the possibility of using regression analysis to derive equations with which to predict differences in hourly air temperatures (T) between below-canopy
98

urban spaces, with consideration of influences over different horizontal scales. This concept is similar to that used in a study of the effects of urban trees on windspeed.In July 1996 we recorded hourly averages of mean windspeed and wind direction, air temperature, and relative humidity at three sites in Atlanta, Georgia. Urban morphology around the sites differed. Using one site as the reference, we related T as the dependent variable to differences in descriptors of city morphology and to synoptic weather conditions. The morphology descriptors included tree, grass, and impervious cover for a range of distances from each of the three sties. Landsat data revealed differences in land cover that varied with direction from the sites. Hemispherical photographs provided descriptors of nearby tree and building morphology and solar blockage. Observations of below-canopy conditions in urban areas, even over short periods, broaden our understanding of urban climate.Urban ecosystem structure influences climate across a large range of scales. Observations reported here indicate how air temperature varies at a scale between the mid-micro and mid-local, i.e., over a range of about 10m to 3 km. The empirical methods tested show promise as a means to develop models of the effects of urban morphology on below-canopy microclimate at these scales, in this case, explaining about two-thirds of the variance in temperature difference between sites. Required input variables include land cover surrounding the points of interest, morphology surrounding the point from on-site photography, and synoptic observations from a nearby weather station. One planned application for models of this type is in predictions of the effects of urban structure on climate for a Long Term Ecological Research study in Baltimore, Maryland.
Helbig, A. 1998. Ozone concentration in urban and rural areas. Proceed. of the AAG 94 th Annual Meeting, Boston, USA. 1998.
QUA ML
ABSTRACT. This study investigates the temporal and spatial variation of ozone concentration in the atmospheric surface layer over Germany on the basis of hourly data in the years 1995 and 1996. There are typical differences between ozone concentration at rural and urban stations. The dependence of concentrationdifferences at different stations on the their distance shows the influence of the mesoscale meteorological situation. These facts are to be considered in the definition of the summer smog criteria used in Germany.Keyword: climatology-urban, air pollution, ozone.
Hildebrandt, E.W.; Sarkovich, M.1998. Assessing the cost-effectiveness of SMUD’s Shade Tree Program. Atmospheric Environment, Oxford, England. 32(1): 85-94.
99

EUC ML
ABSTRACT: This paper examines key issues involved in evaluating benefits (avoided cost of energy and capacity) of tree planting programs from the perspective of electric utilities, as well as from a wider perspective of public and private entities that may benefit from such programs. The nation’s largest shade tree program, sponsored by the Sacramento Municipal Utility District (SMUD) in collaboration with the Sacramento Tree Foundation (STF), is used as a case study. Results of a recent analysis of the energy benefits of SMUD’s Shade Tree Program are presented, along with program modifications being implemented to improve program cost-effectiveness. A sensitivity analysis of the relative importance of major uncertainties surrounding the benefits of the Shade Tree Program is presented, and priorities for future research are discussed. Subject Headings: Tree effects on temperature; Vegetation influences on urban climates; Urban temperature control; Sacramento, California.
Hoffman, M. E. and Aizenberg A. 1998. Morphology and the influence of traffic on the street climate. Proceed. IGU Commission of Climatology. Evora 1998.
PhUC ML
ABSTRACT. The CTTC (Cluster Thermal Time Constant) Method developed by HOFFMAN successively with SHARLIN, SWAID and Mosseri for the street climate evaluation according to morphology and orientation is used here. Corrections proposed from measurements done in situ include the influence of traffic heat release and the influence of permanent shaded areas, here in the form of a courtyard opening out the street and defined by three built-up sides.The temperature increase found was 1 to 3 K (about 2K with 1,000 to 1,500 vehicles per hour) higher in a street with traffic than in a street with similar morphology with low traffic density.The presence of a courtyard opening and an easterly sidewalk in a north-south axis street produced an air temperature reduction of about 2K at noon.The CTTC Analytical Model used simulates the daily course of street air temperature in terms of heat balance (condition, convection, solar radiation absorption and long wave infrared radiation exchanged with outside sky) in the soil and walls along the street.A study of the influence of colonnades in the street under a Mediterranean climate (3210 dg N) in summer conditions (no rain) both in a the coastal and in an arid inner land city indicates that according to street orientation, colonnades may increase the partial shaded area (PSA) ratio during hot and cool hours and, because of the thermal sink effect the PSA defines, the air temperature pattern will be smooth.
100

Holmer, B.1998. Estimations of the advective and latent heat fluxes and their influence on the urban heat island. Proceed. AMS 13 th Conference on Biometeorology and Aerobiology, Albuquerque, New Mexico. 1998.
GUC HL
ABSTRACT. The urban heat island (UHI) induces a weak inflow of air from the rural surroundings. In Göteborg, 0.7 million inhabitants on the Swedish west coast, this urban heat island circulation (UHIC) is fairly well investigated. The influence of the air advected in this way into the city centre has been analysed in studies on UHIC dynamics and urban humidity.The estimation of the advection is rather crude. The error in wind-speed and height to the inversion base can be estimated to may be 20%. However, in spite of this it is evident that advection of cool and dry air by the UHIC is important in the urban energy balance in Göteborg. Much of the observed variation of may be explained by varying development of the UHIC and the urban-rural vapour pressure difference.
Ichinose, T. and Urano, A.1998. Regional warming related with land use change during recent 150 years in Japan. Proceed. AMS 13 th Conference on Biometeorology and Aerobiology, Albuquerque, New Mexico. 1998.
GUC ML
ABSTRACT. The former attempts to divide the influence on the observed near surface air temperature into a part by global warming and a part by regional warming related with urbanization mainly depended on statistical analysis. But this method is invalid in the region where no observed data are given. In this study, numerical simulations of regional climate in a summer day about 150 years ago were performed with a meso-scale model. LUIS (Land Use Information System) is a digital land use data set covering all Japan with 2km grid. The land use on each grid point circa 1850, circa 1900, circa 1955 and circa 1985 are compiled in LUIS and it is published by UNEP/GRID-Tsukuba. By the numerical simulations referring to LUIS, the authors attempted to pick up the influence on the near surface air temperature by regional warming related with land use change during recent 150 years. This method is applicable to any region where no observed data of temperature are given.Around 5 cities analyzed, urbanization in plains has proceeded during 4 periods. The area showing the regional warming related with land use change has expanded. Especially, this feature was significant around Tokyo, Osaka, and Fukuoka, where urbanization was significant. In the southern part of Kanto Plain, the area with warming of more than 2 Celsius degrees was shown at 9 PM in July 27. In 4 cities except Sapporo, the differences between circa 1850 and circa 1985 were large from the middle of daytime to the middle of nighttime. The maximum differences
101

emerged at 9 PM and the minimum emerged at 6 AM. The former was 1.8 Celsius degrees in Tokyo (Otemachi) and 2.2 Celsius degrees in Osaka.
Idso, C.; Idso, Sh.; Idso, K.; Brooks, T. and Balling R.1998. Spatial and temporal characteristics of the urban CO2 dome over Phoenix, Arizona. Proceed. AMS 13 th Conference on Biometeorology and Aerobiology, Albuquerque, New Mexico. 1998.
QUA ST
ABSTRACT. In a recent study, devised a simple measurement program to detect and quantify the spatial and temporal variability of near-surface atmospheric carbon dioxide (CO2) concentrations throughout the Phoenix metropolitan area. Recognizing the potential for large cities to be a significant source of CO2 emissions as a result of their localized combustion of fossil fuels and production of cement –two factors considered by the intergovernmental Panel on Climate Change to be responsible for approximately three-fourths of all anthropogenic carbon dioxide emission- the authors set out to measure near-surface atmospheric carbon dioxide concentrations at a height of 2 meters at approximate 1.6-kilometer (1.0 mile) intervals along four different transect routes through the extended Phoenix metropolitan area in January of 1998.The results of the winter analysis revealed the presence of an “urban CO2 dome” of considerable magnitude over Phoenix proper, where urban CO2 concentrations were found to be as much as 50% greater than the surrounding rural mean o 370 parts per million by volume (ppmv). In the present study, we repeat the winter analysis during the hottest period of the year in an effort to determine whether or not the wintertime relationship between urban and rural near-surface atmospheric CO2 concentrations remains in effect in the summer.The several results demonstrate the existence of a phenomenon that, until the study of Idso, was basically unrecognized: large population centers can have substantially elevated CO2 concentrations relative to the surrounding rural environs. In the case of Phoenix, the “urban CO2 dome” appear to vary but little over the year and may reach peak concentrations at the city center fully 50% higher than the surrounding rural mean, with localized spikes over 70% greater. These findings suggest that cities may well serve as analogues of the world as a whole within the context of impending global change; for in addition to the analogy between global warming and the urban heat island, there now appears to be a similar relationship between anticipated increases in the global background level of atmospheric carbon dioxide and the urban CO2 dome.This relationship could prove useful in investigating potential impacts of the increased global temperatures and CO2 concentrations that are being predicted for the future, especially with respect to earth’s plant life. Before such studies are conducted, however, much more needs to be learned about the urban CO2 dome itself. Our initial research has identified a previously unappreciated phenomenon; but it has raised as many questions as it has answered. Much more work will be
102
needed to answer these and the many other questions that will certainly arise as the urban CO2 dome is studied in more detail in the future.
Jauregui, E.1998. Long-term effect of Mexico City’s heat island on potential energy demand for space heating. Proceed. AMS 13 th Conference on Biometeorology and Aerobiology, Albuquerque, New Mexico. 1998.
EUC T
ABSTRACT. It is well established that the urban heat island (UHI) has a number of socioeconomic impacts. In tropical climates in general it exacerbates the heat load on humans during the warm season which may last for most of the year. However, in large high altitude cities in the tropics the UHI will help reduce the need for heating during the cool season while air conditioning needs are minimal.In this paper the HDD concept (based temperature 18.3ºC) is used to evaluate first the impact of climate on energy demand for space heating in Mexico City, and second to determine long-term changes in this impact that may have occurred due to increasing influence of the heat island phenomenon during recent decades. The city experienced a marked increase in population (from 8.7 mill in 1970 to 17.0 mill in 1990), while it more than doubled its urban area (from about 500 km2 to 1200 km2).During the cool season (Nov-Apr) when anticyclonic weather prevails, the UHI attains its maximum intensity. Located in an elevated valley (2250 masl) in the tropics (lat. 19.5º N) the climate of Mexico City is characterized by cool to cold nights, during this period and temperatures may drop to around near freezing (depending on the observation site relative to the UHI position). Therefore it is not surprising that potential energy demands for space heating as estimated by heating degree-days (HDD) in the capital of Mexico (about 1063 HDD in 1955) are higher than those for Los Angeles (692 HDD) but considerably less than those estimated for some U.S. cities on the Eastern Seabord, where HDD’s are of the order of 2600, eg New York. Not withstanding this situation, only occasionally energy for space heating is used in the city except perhaps during cold nights when electric heaters (blankets) are shortly used. On the other hand since insolation is abundant, temperatures rise at a steep rate during this season reaching comfortable levels in the afternoon. Results show that as the city grew, potential energy demand for space heating in downtown Mexico city has markedly decreased from 1063 HDD in 1955 while this reduction has been more drastic (to one fourth) in the suburbs during the same period. In contrast, rural station (km 47) away from the UHI influence shows no appreciable trend. At the same time urban/rural thermal contrasts have increased from around 6º to 10ºC. It is hypothesized that the observed changes in HDD may be linked to changes in the intensity and extension of the UHI of the city.
103

Jauregui, E.1998. Climate variability and trend in the Mexico basin during the XX th century. Proceed. of the OMMAC, VIII Congress, Veracruz, Ver., México 1998.
EUC ST
ABSTRACT. Routine observations of climatological variables began in the Mexico Basin (where the capital of the country occupies a substantial portion) during the late XIX century. In this paper time series of temperature and precipitation covering a large portion of the present century are examined in order to assess perceived changes and try to link them to possible changes in the circulation at the hemispheric scale. In addition aspects of anthropogenic climate forcing (e.g. the heat island effect) are also discussed. Since long-term climate fluctuations are generally associated with changes in the number of extreme events and extreme anomalies often occur in clusters, in adjacent years, in this paper analysis of long-term series of extreme minimum temperatures for two stations covering most of the XX century is attempted.
Jáuregui, E.1998. Climate variability and trend in the Mexico Basin during the XX th Century. Proceed. IGU Commission of Climatology. Evora 1998.
GUC T
ABSTRACT. Routine observations of climatological variables began in the Mexico Basin (where the capital of the country occupies a substantial portion) during the late XIX century. In this paper time series of temperature and precipitation covering a large portion of the present century are examined in order to assess perceived changes and try to link them to possible changes in the circulation at the hemispheric scale. In addition aspects of anthropogenic climate forcing are also discussed.The capital of Mexico is located in an elevated (2250 masl) basin in the central part of the country. Although in the tropics (lat. 19.5ºN) the climate is tempered by altitude (mean annual temp. 16ºC). During the dry/cool season (Nov-Apr) cool to cold air masses from North America sweep over the valley bringing temperature down to near freezing values. During the rest of the year afternoon showers from the trade wind current prevail.The longest climatic data sets were available from the Mexico City observatory located to the west of the city, and the Pachuca station at the extreme north of the basin.In particular the last decade of this period (1920’s-to the 1960’s) was characterized by cooler temperatures and lower rainfall due to a southward shift a major circulation features. After the 1960’s minimum temperatures increased in Mexico City due to the growing hear island effect as the city augmented its population.
104
Long-term temperature and rainfall series are presented in order to illustrate possible climatic changes that occurred in the Mexico basin. A trend toward cool climate seems to have happened during the 1960’s. Clearly, despite the overall trend toward cooler climate there were intermittent episodes of warmth. While there are many mechanisms natural and anthropogenic or both that may cause climate change, during the second part of the XXth century there is evidence of anthropogenic forcing on temperature (heat island) and on precipitation (rain island) in the Mexico basin.
Jauregui, E.1998. Long-term effects of urbanization on the thermal climate of two megacities and the impact on space energy demand. Proceed. Int. Symp. on Human Biometerology, Fuji-Yoshida, Yamanashi, Japan,1998.
UBCL ST
ABSTRACT. The objective of this study is two folds. First to compare the long-term changes in the thermal climate of two of the most populous cities in the world: Mexico City located within the tropics and in an inland elevated basin; the other one (Tokyo) located in the humid subtropical zone with distinct four seasons controlled by the Asian summer and winter monsoons. Second to compare the impacts of the thermal changes due to urbanization in terms o the energy demand for space heating.Statistics of both cities show that the thermal climate in Tokyo has increased at a somewhat faster rate (2.7ºC/100 yr.) than that in Mexico City (2.0ºC/100 yr.) for period 1900-1996. In spite of the contrast in geographical setting (coastal vs inland) and latitude some similarities arise when comparing the urban climate of both cities: Long-term heat island development has evolved in both megacities following three basic stages in the rate of change of the annual mean of daily minimum temperature: a) Before 1945 heat island increase was weak in Tokyo and negative in Mexico City (MC). b) During 1946-1974 heat island increased at moderate rates in both cities corresponding to an accelerated rate of urban sprawl after the Second World War. c) In recent decades (1975-1995) heat islands in both urban centers have grown at even faster rates in correspondence to further urbanization.In recent times suburban/rural sites in MC show what seems to be a pollutant-induced decline in T Max., supporting the view that cities play a central role in regional climate change. In applying the HDD concept to evaluate space energy demand (SED) it was found that Tokyo energy requirements for space heating double those for MC. On the other hand while energy is required for space cooling in summer in Tokyo, in Mexico City this requirement is almost limited to a few days. Energy demand for space heating has declined 55% in MC and 62% in Tokyo since the beginning of the century due to heat island growth. The above results should be taken with caution since they apply only to the central areas of both cities. The results of this comparison suggest that whilst there are some differences the overall response of the urban system in a tropical environment is essentially similar
105

to that of a mid-latitude city. While the urban fabric (and geographical setting) of both cities may differ (e.g. Density of buildings), the physical processes driving the climate are evidently the same differing only in magnitude as illustrated by the observed contrasts in energy demands for space heating and cooling.
Jáuregui, E. and Luyando E.1998. Long-term association between pan evaporation and the urban heat island in Mexico City. Atmosfera, Mexico DF, Mexico. 11(1): 45-60.
GUC T
ABSTRACT: Using a network of 16 urban/suburban and rural pan evaporation (pe) stations in Mexico City and its environs, an attempt is made to assess the comparative evaporative characteristics of different areas in a large city located in an elevated inland valley in the tropics. Significant parallel increases in pan evaporation and heat island intensity have been observed in the central and western portions of Mexico City for the period 1967-88. It is suggested that pan evaporation increase is linked to the observed increase in the intensity of the heat island related to the accelerated urbanization of the capital City. In contrast over the eastern suburbs the establishment of a large (9500 Ha) adjacent revegetation project has apparently influenced pan evaporation to decline in spite of the increasing presence of the heat island. Association of pan evaporation to other climatic elements such as insolation, precipitation and wind velocity is also explored. Subject Headings: Evaporation from urban areas; Urban heat islands; Mexico City, Mexico.
Jauregui, E. and Tejeda, A.1997. A scenario of the human bioclimate in a large tropical city with CO2 doubling. Proceed. of the AAG 93 rd Annual Meeting, Fort Worth, Texas, USA. 1997.
UBCL ST
ABSTRACT. A scenario of hygrothermal conditions for Mexico city based on regional scenarios for a doubling of CO2 derived from combination of two CGMs is presented. The effective temperature ET concept is used to estimate human comfort conditions in Mexico city. Mean hourly temperature and relative humidity values for 20 urban/suburban stations in Mexico city were used to estimate current distribution of effective temperature. In order to estimate water vapor pressure (e) values for 2 x CO2 an empirical relation based on mean values of temperature and humidity (period 1951-80) was implemented. The linear correlation coefficient between observed and estimated values of e is 0.8917 at 0.001 significance level. This made possible the estimation of mean monthly values of relative humidity (RH) for 2 x CO2. In addition the expected values of wet bulb air temperature (tw) for 2 x CO2 conditions were obtained by using a iterative procedure on the psychrometric
106

equation: esw-(RH) es= 6.53 x 10⁻⁴ p(t-tw); esw-saturation vapour pressure at tw (ºC); eS-saturation vapour pressure at t(ºC); p-local station pressure (hPa).Finally new effective temperatures were calculated from Thom’s expression ET = 0.4 (t+tw) + 4.8. Overlapping ET monthly distribution with those corresponding to 2 x CO2 isanomalies of ET were drawn for those months showing extreme conditions (Jan, Apr, Jul). Extreme ET conditions for 2 x CO2 were calculated by taking into consideration daytime heat island effect during the warm season. Results are displayed on maps of the city with ET isolines for 2 x CO2 and on (monthly) bar graphs showing percentage of population effected by comfort/discomfort conditions throughout the year.Keyword: bioclimate urban, urban heat island, global warming scenario.
Jauregui, E. and Luyando, E.1998. Possible effects of aerosol pollution on the thermal climate of Mexico City’s environs. Proceed. of the AAG 94 th Annual Meeting, Boston, USA. 1998.
QUA ST
ABSTRACT. Solar radiation attenuation in Mexico City is estimated by comparing global radiation intensity observed at a station in the downtown area, relative to that observed in cleaner rural air at a site 6 km northeast of the city limits. In addition to detecting an attenuation of global radiation of the order of 22% on clear days, comparison of urban/rural global radiation by day-of-week showed that solar attenuation follows a weekly variation very similar at both sites but with significantly lower values observed at the rural station. It was evident from these results that the smog layer affects the solar radiation climate in the rural areas beyond the immediate city limits. The declining mean annual maximum temperatures observed near the limits of the Mexico Basin suggest that the smog layer is affecting the radiation and thermal climate of a region downwindof the capital city. An attempt is made to show that while in the industrial and downtown areas the daytime effect dominates over the cooling effect of aerosols in other suburban and rural sites downwind and away from the influence of the urban warm air mass, the reflecting properties of the smog layer seem to prevail resulting in an observed decreasing trend in the maximum temperatures.Keyword: climatology-urban, aerosols, air temperature.
Jendritzky, G. and Grätz, A.1998. Mapping human bioclimates in various scales with particular reference to urban environment. Proceed. AMS 13 th Conference on Biometeorology and Aerobiology, Albuquerque, New Mexico. 1998.
UBCL GU
107

ABSTRACT. Within the atmospheric environment, besides air pollution, the conditions of heat exchange are most significant for health, well-being, and efficiency of the human being. In the past there were many approaches to describe this thermal environment by simple thermal indices like DI, TSI, ET, wind chill, etc. But in the meantime the application of complete heat budget models of the human being are state-of-the-art for thermophysiologically significant assessments. Epidemiological studies using mortality data clearly show that death rates increase with increasing distance from the comfort zone, both due to cold stress and heat load. It is assumed that the thermal conditions are significant for morbidity, well-being, and efficiency of the human being also below the level of the extreme event of death. There are many applications for bioclimatological knowledge in the wide field of precautionary planning, e.g. urban development and regional planning, tourism incl. Health resorts, residential areas and climate impact research. As in climatology, a traditional aim in human bioclimatology is to present bioclimate in maps in order to meet the needs of the users. The following will focus on the thermal conditions.With increasing awareness of the population in various countries of environmental issues, an increase in the importance of the atmospheric environment for human health can be observed. The role of human biometeorology is no longer disputed.There are many applications for bioclimatological knowledge in the wide field of precautionary planning, e.g. urban development and regional planning, tourism incl. Health resorts, residential areas. The impacts of climate changes are assumed to be a subject of increasing importance. Thus the climate/climate change and human health issue is just as relevant for authorities, urban planners, health professionals, and other decision-makers in the area of environment protection as it is for individuals. It is no longer merely a fascinating subject for multi-disciplinary research. A bunch of appropriate tools for a thermophysiologically significant assessment of the space is available for all relevant scales and for a multitude of questions.
Jong-Jin, B.; Hye-Yeong, Ch. and Kyong-Hee, K.1998. A theoretical and numerical study of heat-island induced convection. Proceed. AMS 13 th Conference on Biometeorology and Aerobiology, Albuquerque, New Mexico. 1998.
PhMUC GU
ABSTRACT. In this study, we examine some aspects of convection and precipitation enhancement observed downwind of urban heat island using a weakly nonlinear theory and a nonlinear numerical model.In the theoretical part, we consider a two-dimensional, steady-state, hydrostatic, nonrotating, inviscid, Boussinesq airflow system. The basic-state horizontal wind is uniform and urban heat island is represented by specified diabatic heating. Four governing equations are nondimensionalized by introducing proper scalings and combined into two equations in the perturbation streamfunction and buoyancy.
108

Then, the perturbation method and the Fourier transform technique are used to obtain the zeroth-order (linear) solution and the first-order (weakly nonlinear) solution. In this procedure, the perturbation streamfunction and buoyancy are expanded in small values of the nonlinearity factor of thermally-induced finite-amplitude waves. This nonlinearity factor is proportional to the amplitude and horizontal length scale of diabatic forcing and inversely proportional to the buoyancy frequency and squared basic-state wind speed. The zeroth-order solution is analytically found in physical space. The first-order solutions is analytically found in wavenumber space, which is then inverted to solution in physical space using the FFT algorithm.In the numerical modeling part, a two-dimensional version of the ARPS (Advanced Regional Prediction System) is employed to examine whether urban heat island can induce convection and enhance precipitation downwind. The ARPS is a nonhydrostatic, fully compressible model with advanced physical parameterizations developed at the CAPS (Center for Analysis and Prediction of Storms) of the University of Oklahoma. For the precipitation physics, we choose the explicit liquid phase cloud microphysical parameterization. Urban heat island represented by specified diabatic heating. The physical domain size is 150km in the horizontal and 12km in the vertical and the horizontal and vertical grid sizes are 1km and 250m, respectively. The model is integrated up to 6 hours. Extensive numerical experiments are performed with a wide range of heating amplitudes (that is, heat island intensity) and moist stabilities (by varying relative humidity sounding). It is shown that under favorable conditions urban heat island can initiate convection and precipitation takes place downwind of heat island. At the symposium, based upon the results of dry and moist model simulations, we will present the favorable conditions for convection initiation due to urban heat island and some characteristics of precipitation system downwind of heat island.
Kanda, M. and Moriwaki, R.1998. Environmental effects of Meiji-shrine forest as a sink of energy and pollutants. Proceed. AMS 13 th Conference on Biometeorology and Aerobiology, Albuquerque, New Mexico. 1998.
PhUC ML
ABSTRACT. Vegetation in urban area has been expected to play an important role as a large sink of energy and pollutants due to its plan-physiological activity. In this study, filed observations and numerical simulations are performed to quantify the following fluxes between an urban forest and the atmosphere; 1) energy and radiation, 2) NOx and O3,3) CO2 and 4) terpenes.Meiji-shrine forest is one of the biggest green areas in Tokyo Metropolitan, which was artificially created 80 years ago. It is located just on the most urbanized area with high emissions of energy and pollutants. It is large (diameter is about 2km), almost flat and covered with high and dense vegetation canopies (20m tall and LAI is 6), all of these conditions allow us to apply boundary layer theories.
109

The horizontal distribution of temperature at 1.5m height demonstrates that Meiji-shrine forest is a Cool Island, the minimum temperature of which is about 4 (ºC) lower than the surrounding urban areas. The flux measurements mentioned below were performed at the cool spot shown by an arrow.The shows an example of observed divergent flows from Meiji-shrine forest. Wind velocities were measured by sonic anemometers at 30m heights on the top of adjacent buildings. Those divergent flows can be seen only under very calm and clear weather.
Karlsson, M.1998. Temperature variations close to the road surface during different weather situations. Proceed. AMS 13 th Conference on Biometeorology and Aerobiology, Albuquerque, New Mexico. 1998.
GUC HL
ABSTRACT. Earlier studies have shown that the temperature gradient in the air layers close to the road surface can vary a lot during certain weather situations. When estimating the state of the road surface, it is important to be aware of these temperature differences and the effects of them. Therefore it was decided to study the spatial temperature differences in the air layer above the road and how it was related to weather, recent weather, surface status and time of day.The aim of this study was:i) to study the spatial temperature differences between the road surface and the
surrounding air during different weather situations.ii) To investigate for how long a temperature difference persists after a weather
change.iii) To determine how the temperature difference influence the accuracy of
prognosis on road slipperiness.The statistical analyses on the temperature gradients showed that large temperature differences were most common during clear and half clear weather with weak winds. The results also showed that the temperature differences were not influenced to a large degree by the humidity and thermal capacity of the surrounding areas but rather by the weather situations typical for certain wind directions. The study will continue to analyze the data from this measuring season. The next step will be to analyze how changing weather, such as warm and cold fronts passing the area, and the weather of recent days influences the temperature difference in the near surface layer.
Katzschner, L.1998. The urban environment under the special aspect of the human-biometeorological conditions. Proceed. IGU Commission of Climatology. Evora 1998.
UBCL GU
110

ABSTRACT. The quality of the environmental conditions is decreasing with time. In this respect urban planning has to protect or improve these qualities. Within the environmental discussion the human-biometeorological conditions are an important factor for the well being, behavior and healthiness of man. Thermal comfort as well as air pollution have to be considered as two of the fundamental bases within all planning aspects. Therefore criteria have to be developed in order to evaluate the urban climate conditions. As all planning procedures are taken in an areal way all climatic data presentation must respect this. One important manual is the urban climatic map which shows a spatial distribution of qualities.Thus the quality of the urban climate is defined as: Existing air paths as criteria for an air mass exchange; dimension of local circulation pattern, which can improve the thermal as well as the air pollution conditions; dimension of the heat island effect and its variation. Part of these criteria can be described quantitatively (Heat balance of man, air pollution indices).In the example of the city of Salvador a methodology is shown where the urban climate is presented in a big city with complicated structures. This analysis was carried out on the basis of past climate studies. In comparison to that the urban climate study of a moderate climate in Mid-Europe (Frankfurt/Germany) is introduced, to show how the same methodology can be used in different climate conditions, but with respect to the local aims. From an urban climate map planning proposals were derived and implemented in the city. The methodology works on a typical planning proposals were derived an implemented in the city. The methodology works on a typical planning scale of 1:10.000 in order to show the urban climate on the same levels as the usual planning process of new building sites and vegetation mapping is started.In conclusion, one can see that it is possible to develop urban climate criteria’s for a city with the focus on planning implementation. The urban climate is shown as a tool for urban planning and architecture with special respect to the environmental conditions of man.
Katzschner, L.1998. Designation of urban climate qualities and their implementation in the planning process. Proceed. IGU Commission of Climatology. Evora 1998.
UP GU
ABSTRACT. The human-biometeorological conditions are considered more and more important with the respect to urban planning processes. Therefore, criteria have to be developed in order to evaluate is a guideline to conduct urban climate qualities. Following this definition the aspects of clean air and bioclimatic conditions have to be considered. Clean air programmes define limits for air pollution, depending on national laws. To judge urban climate conditions different values based on the heat balance of man are in use (PMV, PET). But as these values are rather complicated to calculate within a running planning process. Here a simpler
111

method is introduced to evaluate the urban climate conditions, which is qualitatively descriptive and which respects the spatial differentiation in climate.The quality or urban climate can be defined as functions of:- The existing and ventilation zones as criteria for an exchange of air masses,- The dimension of cold air production and downhill movement of these air
masses,- Local circulation systems,- The heat island pattern and the urban climatic variation in a range of 150m. as
criteria for heat of cold stress.This leads to a discussion of climate qualities depending on the urban structure and surfaces and covers air pollution and the bioclimatic questions. Especially the variations of climates were respected by introducing a Weg-Faktor.
Kim, J.J. and Baik J.J.1998. A numerical study of thermal effects on flow and pollutant dispersion in urban street canyons. Proceed. AMS 13 th Conference on Biometeorology and Aerobiology, Albuquerque, New Mexico. 1998.
PhMUC ST
ABSTRACT. The urban canopy is composed of basic elements such as isolated or in-group buildings and street canyons. The main factors of determining the flow field in street canyons can be assorted into the geometric and meteorological factors. The shape and orientation of building and the aspect ratio are main geometric factors. The results reported illustrate that meteorological factors such as incident wind speed and direction to street canyons and solar irradiation play important roles in determining the flow and pollutant dispersion in street canyons.In this study, we will systematically examine thermal effects on the flow and pollutant dispersion in urban street canyons with a wide range of aspect ratios. For this purpose, a two-dimensional numerical model with k- turbulent closure scheme is developed and the heat transfer between the air and the building wall or street-canyon bottom is represented by the wall function.In this study, we systematically examined the thermal effects on the flow and dispersion when the building wall or street-canyon bottom is uniformly heated. However, in the real situation, the building wall or street-canyon bottom is not uniformly heated by the solar irradiation because the sky view factor changes depending upon the aspect ratio and solar meridian altitude. For more realistic simulations, it is desirable to include such a physical factor in numerical models. We plan to implement the sky view factor into the numerical model.
Kinouchi, T. and Kanda, M.1998. Cooling effect of watering on paved road and retention in porous pavement. Proceed. AMS 13 th Conference on Biometeorology and Aerobiology, Albuquerque, New Mexico. 1998.
112

GUC ML
ABSTRACT. In recent years, cities have been increasingly experiencing the so-called heat island phenomenon due to the composition of various reasons such as artificial ground cover and anthropogenic heat.Pavement made of asphalt or concrete absorbs more heat from the sun. It causes the surface temperature to rise occasionally above 70ºC during the summer, and gives adverse effect on the urban climate and the thermal environment.There are several measures to prevent high surface temperature of the pavement. Measures that can reduce surface temperature include 1) high surface albedo, 2) high conductivity of the pavement, which can transfer heat into deep ground, 3) permeable and absorptive pavement, which may enhance latent heat transfer, 4) shading pavements by trees and plants.In Japan, the cooling effect of pavements has been clarified in several papers. Reported that the permeable pavement reduces surface temperature only by 2ºC, whereas the absorptive pavement can suppress the surface temperature by around 8ºC in summer. Observed that the soil-covered pavement is effective to cool its surface.In this paper, we will show the effect of two countermeasures, i.e. watering on the road and retention in porous pavements. Each measure is tested through field experiments to describe the characteristics of energy balance and the surface temperature of pavements.In this paper, the effect of both watering on paved roads and retention in porous pavements on the microclimate was quantified.Watering on he paved road was quite effective to lower the surface temperature, which reduces sensible heat and radiation stress to human bodies.Besides, by introducing water retention in porous pavements, the surface temperature of the pavement was reduced by 18ºC at maximum. The effect attributes to the latent heat transport from the surface rather than heat storage by the pavement.Large area in urban cities tends to be covered by various kinds of pavement. The effect of measures tested in this paper on climate must be quantified not only for the micro-scale but also for the meso-scale.
Lin, G-Y.1997. The ultraviolet radiation index in Los Angeles. Proceed. of the AAG 93 rd Annual Meeting, Fort Worth, Texas, USA. 1997.
RSUC ML
ABSTRACT. Since June 1994, the National Weather Service has issued daily noon-hour ultraviolet radiation index (UVI) to warm the public against potential sunburn risks for 58 cities in the United States. The UVI is derived from the total column ozone data, measured by satellite instruments, and other atmospheric parameters.
113

In this study, the forecast UVI values in Los Angeles are verified by the observed UVI values using the Yankee’s UVB-1 pyranometer at Northridge. The forecast UVI values are within one index unit of the observed UVI values for 93% of the days. The accuracy of UVI forecast in Los Angeles is much better than that of the UVI forecast for other cities in the nation. This is evidenced by the 3 verification indices of POD, FAR, and CSI. The forecast UVI values consistently underestimate the observed values in summer months. In winter, the forecast values may overestimate the observed values, particularly during rainy days. The observed UVI values are taken at Northridge located in the inland valley. In summer, the lower frequency and amount of cloud cover and higher elevation account for the consistently higher observed UVI values than the forecast values which are derived from the atmospheric parameters at the Los Angeles International airport (LAX) located next to the Pacific ocean. In winter, rain and cloud associated with a front at Northridge dissipate southward to LAX, resulting in an overestimation of UVI values.Keyword: Ultraviolet Radiation Index, Sunburn, Los Angeles.
Lopes. A.1998. Modelling night temperatures in the south of the Lisbon Peninsula with a GIS. Proceed. IGU Commission of Climatology. Evora 1998.
PhMUC ML
ABSTRACT. A methodology based on a GIS is presented in this study in order to recognize some thermal patterns in anticyclonic nights in the south of the Lisbon peninsula, and to evaluate which topoclimatic variables are responsible for the thermal variation. An attempt has been made to distinguish information about the areas with a certain probability of occurrence of could air lakes in radiative nights.The maps are intended to contribute to the urban planning of this region. Thus, data in the 1:25 000 topographic map (sheet 430 – Oeiras, IGE) was used.The south of the Lisbon peninsula is characterized by a complex terrain, where the valleys lie north the south and the highest tops are not more than 220 meters high. In the northern part of the region, some slopes measure over 100 meters from the bottom of the valleys to the top. The southern part is in contact with the Atlantic Ocean and the estuary of the river Tagus. Some important urban areas (Cascais, Oeiras, Queluz, Amadora, etc.) are dormitory suburbs for thousands of people that commute to Lisbon daily.Although the frequency of cold episodes is not well known in this region, the occurrence of lower night temperatures at the bottom of the valleys should not be dismissed. These areas have been densely developed and populated, especially in the last 20/30 years and the buildings are not usually prepared for the cold. This leads to an increase of discomfort and consumption of energy. It was estimated that 35% of these suburbs are in the areas where normally cold air lakes can reach 50 m in height on the slopes during clear and calm anticyclonic nights.
114

López M.F.1998. Nota sobre el viento en el casco urbano de Zaragoza: un factor de planificación urbana. (Note of the wind in Zaragoza, Spain: one factor of urban planning). Clima y ambiente urbano en ciudades ibéricas e iberoamericanas, Madrid, Spain, Parteluz, 371-379.
UP ML
ABSTRACT. This article shows the importance of a meteorological factor such as the wind in the study of the urban climate in the city of Zaragoza and, at the same time, the need to take it into account as a factor or urbanistic planning. Some measurements are proposed for an area of the city called Parque Goya. Subjects Headings: Wind; Urban climate; Urban planning; Zaragoza, Spain.
Lowry, W.P.1998. Urbanization and the regional metabolic rate. Proceed. AMS 13 th Conference on Biometeorology and Aerobiology, Albuquerque, New Mexico. 1998.
UBCL GU
ABSTRACT. In the case of organisms, metabolic heat is generated by the burning of fuel at a rate dependent upon the type and morphology of the animal and the conditions of its immediate thermal environment. The concept is readily extended to the case of an urbanized area and its environs. In particular published data for population (P), area (A), and regional rates of anthropogenic heat release (Q) – in unit of {power} – are employed to explore, theoretically and empirically, the relationships among (A), the population density (P/A), and the per capita rate of release (Q/P). These explorations yield three relationships: (i) the population of any region (with modifications for islands) is proportional to the radius of its area when that area is assumed to be circular, which is to say the square of a population is linearly related to its area; (ii) for a particular class of populated area – such as a city, an industrialized region, or a nation – the product (Q/P)(P/A)0.5 is quasi-constant; and thus (iii) within each of those classes the area-specific regional metabolic rate (Q/A) is proportional to the square root of population density (P/A)0.5. The last two relationships are hypothesized to be a reflection of the fact that individuals in densely populated places increasingly share energy, as in multi-story, shared-wall buildings and mass transportation.
Luvall, J.C. and Quattrochi, D.A.1998. Thermal characteristics of urban landscapes. Proceed. AMS 13 th Conference on Biometeorology and Aerobiology, Albuquerque, New Mexico. 1998.
UP ST
115

ABSTRACT. Although satellite data are very useful for analysis of the urban heat island effect at a coarse scale, they do not lend themselves to developing a better understanding of which surfaces across the city contribute or drive the development of the urban heat island effect. Analysis of thermal energy responses for specific or discrete surfaces typical of the urban landscape (e.g. asphalt, building rooftops, vegetation) requires measurements at a very fine spatial scale i.e. < 15m) to adequately resolve these surfaces and their attendant thermal energy regimes. Additionally, very fine scale spatial resolution thermal infrared data, such as that obtained from aircraft, are very useful for demonstrating to planning officials, policy makers, and the general populace the benefits of the urban forest. These benefits include mitigating the urban heat island effect, making cities more aesthetically pleasing and more habitable environments, and aid in overall cooling of the community.High spatial resolution thermal data are required to quantify how artificial surfaces within the city contribute to an increase in urban heating and the benefit of cool surfaces (e.g. surface coatings that reflect much of the incoming solar radiation as opposed to absorbing it thereby lowering urban temperatures). The TRN (thermal response number) is a technique using aircraft remotely sensed surface temperatures to quantify the thermal response of various urban surface types ranging from completely vegetated surfaces to asphalt and concrete parking lots for Huntsville, AL.
Lyons, T.J.; Kenworthy, J.R.; Moy, C. and Dos Santos, F.1998. A global urban air pollution model. Proceed. AMS 13 th Conference on Biometeorology and Aerobiology, Albuquerque, New Mexico. 1998.
PhMUC GU
ABSTRACT. Motor vehicular transport is a primary cause of the observed decline in urban air quality and the significance of motor vehicle use is increasing in many urban areas through rising traffic volumes, despite vehicle emission controls and/or stabilizing or declining industrial emissions. This is particularly significant for developing countries, where the rapid rates of both urbanization and growth in vehicle fleet are expected to be the highest in the world.Any linkage of motor vehicular use with the urban form would provide a direct means of estimating the impact of urbanization on air quality. Such a model has the potential to provide a simple, practical management tool and is developed by relating total vehicle travel to urbanized area. Incorporated into a box model, this provides the basis for a universally applicable urban air quality model.Analysis of a range of global cities illustrates a strong relationship between VKT (vehicle kilometers of travel) and urbanized area. As VKT is a surrogate for vehicular emissions, this provides an estimate of urban vehicular emissions and hence a method of estimating airborne emissions from any representative urban area. These emission rates are incorporated with simple meteorological forcing,
116

based on readily available climatological data, to provide a simple generalized urban air pollution model for any city.
Maitelli, G.T.1998. Urban energy balance estimates for a tropical continental city using the Bowen ratio approach. Proceed. IGU Commission of Climatology. Evora 1998.
PhUC T
ABSTRACT. The purpose of this study is to report results from energy balance observations made during the end of the dry season (August-September, 1993), in an urban central site of Cuiaba (15º10’S, 54º50’W), a tropical continental city, situated in the western central region of Brazil and ranging in elevation from about 160-200m above the mean sea level. The size and population of the city is increasing: in 1970 the population was 108,860 while in 1991 it was about 402.000.This study includes measurements from an 18m high instrumentation tower located on the roof top of a 10m high building downtown. The terrain is generally flat in the vicinity of the site. Single family housing and commercial buildings (1-2 storeys) are the predominant land use in all directions except for the northeast where, at 500m from the site, the area is characterized by higher building (5-10 storeys). In a 1,5km radius centred on the sited, 35% of the area was covered with commercial and institutional buildings (mainly shops and schools), 30% with houses, 15% with green space (mainly back garden) and the remaining 20% with paved surface.
Maitelli, G.T. 1997. The climate of a riverside city in the Amazon Basin: urban-rural differences in temperature and humidity. In: Gash, J.H.C., et al (eds), Amazonian deforestation and climate. Chichester, UK, John Wiley & Sons, Inc. p.193-206.
GUC T
ABSTRACT: The analyses carried out on aspects of temperature and relative humidity in the city of Manaus show that they are affected by urbanization and produce a noticeable heat island effect. The urban heat island intensity based on 14 months of data and given by the monthly difference in temperature statistics, was 1.37K, 0.48K and 1.85K for the mean, maxima, minima respectively when compared to the pasture, and 0.93K, 2.25K and 0.33K respectively when compared to the forest. Using 20 months of data and a method of calculation that is more tolerant of missing data, the UHII was found to be 1.37 and 0.96 for the pasture and forest respectively. In terms of relative humidity the city was 5-9%rh less humid than the pasture at night, yet about 3%rh more humid than the forest. During the day the city was similar to the pasture, but 3%rh to 6%rh less humid than the forested area. These results are clear evidence that the magnitude of the urban heat island intensity greatly depends on the land-use of the surrounding rural areas and, to a
117
lesser extent, the method of calculation. Future studies of urban-rural differences in temperature and humidity must concentrate on a more detailed analysis of differences in land-use in the rural areas in addition to the urban-rural contrast. More detailed observations of surface characteristic, mesoscale meteorological conditions and energy balance components are needed from tropical cities to understand the processes controlling the urban heat island effect and the effect on the internal and surrounding microclimate. Subject Headings: Urban heat islands; Urban influences on temperature; Urban influences on humidity; Urban microclimatology; Manaus, Brazil.
Martí, A.; Miragaya, A.1998. Geometría urbana, temperaturas e “isla de calor” en Santiago de Compostela. (Urban geometry, temperatures and urban heat island in Santiago de Compostela, Spain), Clima y ambiente urbano en ciudades ibéricas e iberoamericanas, Madrid, Spain, Parteluz, 207-218.
GUC ML
ABSTRACT. This work analyze the repercussions of urban geometry and the materials in the city temperatures and his contribution in the urban heat island. The correlation coefficient between the sky view factor (SVF) and the soil and air temperatures in Santiago de Compostela is calculated. Subject Headings: Urban geometry, Sky view factor, Urban heat island, Santiago de Compostela, Spain.
Martín Vide, J.; Gómez, L.; Moreno García, M.C.1998. Distribución de la precipitación según el día de la semana en varias ciudades españolas. (Distribution of rainfall according to the day-of-the-week in several Spanish cities). Clima y ambiente urbano en ciudades ibéricas e iberoamericanas, Madrid, Spain, Parteluz, 197-205.
GUC ML
ABSTRACT. An analysis is made of the frequency of rainfall, as well as the frequency of rainfall 10,0 mm/day and the totals, according to the days-of- the-week, for Madrid, Barcelona, Valencia, Málaga and La Coruña (period 1951-90). In all the cases the numbers of the rainy days and the totals are not conditioned by the day-of-the-week. Subject Headings: Day-of-the-week; Rainy day; Urban effect; Spanish cities.
Matzarakis, A. and Mayer H.1998. Investigations of urban climate’s thermal component in Freiburg, Germany. Proceed. AMS 13 th Conference on Biometeorology and Aerobiology, Albuquerque, New Mexico. 1998.
118
UBCL ML
ABSTRACT. Freiburg is a city – with about 200.00 inhabitants located in the southwest of Germany where thermal level is the highest within the country. Therefore, urban climate plays a dominant role in urban planning in Freiburg. Due to its location in the river Rhine’s valley, urban climate in Freiburg is influenced by a regional wind system (“Hoellentaeler”) caused by the near black forest. It is responsible for fresh air breezing to Freiburg during the night and a decrease in the thermal loads on people living in the city.The objective of this paper is to present results of experimental investigations on the thermal component of different urban microclimates in Freiburg with emphasis on a human-biometeorological assessment.Results from research projects in the field of urban climatology with relevance to urban planning reveal clear differences in the human-biometeorologically significant assessment of urban microclimates’ thermal component. It becomes obvious that air temperature Ta which is more familiar to urban planners than PET does not represent the right indicator for the thermal environment in cities when its effects on human beings are to be considered. The reason mentioned above is that the human energy balance as basis for PET considers more meteorological parameters than only Ta.Consequently, PET is a more suitable thermophysiological index for the assessment of the heat archipelago conditions within cities with regard to effects on human beings. Compared to Ta the results of PET show a greater variability between the different urban microclimates, because the local horizon conditions influence Tmrt to a greater extent than Ta, which depends on the energy balance of the urban surfaces and the urban air volume in a complex manner.More detailed studies, however, are necessary on human beings’ thermal perception in different climatic regions. Results presented are based on indoor investigations by Fanger. Their validity in outdoor conditions, especially in subtropical and tropical regions needs to examined.
Mayer, H.1998. Human-biometeorological assessment of urban microclimates according to the German VDI-guideline 3787 Part II. Proceed. AMS 13 th Conference on Biometeorology and Aerobiology, Albuquerque, New Mexico. 1998.
UBCL ML
ABSTRACT. Information about single meteorological parameters such as air temperature Ta is not sufficient for many purposes in urban climatology, if properties of urban microclimates are to be characterized or climatic effects of planned changes in land use or urban spaces are to be assessed. Climate as well as air quality must be taken into account in urban planning in a manner which is
119

relevant to both the health and well–being of people living and working in different urban areas.Therefore, urban microclimates have to be assessed in a physiologically significant manner. This falls within the field of urban human-biometeorology, which deals with the effects of weather conditions, climate and air quality on the human organism. The physiologically relevant assessment of urban microclimates requires the use of methods including threshold values, standards and guide number developed in human-biometeorology
McClean, A.A. and Oke, T.R.1998. Development and tests of a simple model to predict road surface temperature in urban as well as rural terrain. Proceed. AMS 13 th Conference on Biometeorology and Aerobiology, Albuquerque, New Mexico. 1998.
PhMUC ML
ABSTRACT. Considerable research has been undertaken to study the energy balances of natural surfaces, but comparatively little has been undertaken to quantify the case of construction materials such as roadway pavement. This is largely because it was not until the early 1980s that maintenance authorities became interested in the prediction of pavement temperature and surface state.The early road models were based on traditional concepts relevant to other types of surface. Some were developed by proprietary business ventures, so their scientific basis was not transparent. Interest was directed to rural highways with little work to address questions relevant to urban roads.The present work is based on a recent model which is modified to make it more general. Its predictions are tested using field measurements of highway surface temperatures at rural, suburban and urban sites. The focus is on the urban and rural locations.Modifications to an existing nocturnal cooling model have made it more versatile in approximating the surface temperature of roads in a wide range geographic locations. The model simulates the effects of horizon obstruction well. At sites ranging from open rural to complex urban areas, errors are less than 0.5ºC on calm and clear nights, and less than 1.0ºC for stormy conditions. Performance is better at night than in daytime. Better methods are required to adequately simulate the convective transports, and short-wave receipt at the surface, if the model is to operate for a full 24-hour period.
Mikami, T.; Hamada, T.; Kirihara, H. and Ushiyama, M.1998. Cool island phenomena in a large green park in Tokyo. Proceed. AMS 13 th
Conference on Biometeorology and Aerobiology, Albuquerque, New Mexico. 1998.
GUC ML
120

ABSTRACT. There exist a various type of green parks which form the low temperature area (“cool island”) inside large cities. In recent years, the effect of green parks mitigating the surrounding urban heat island has been noticed.This paper aims at clarifying the spatial and temporal structure of cool island phenomena inside and around a large green park in Tokyo base on field meteorological observations.Meteorological observations have been done in and around the Meiji-shrine/Yoyogi-park, which is a large green park (1,240,000m2) with the mixture of forest and grass, for several times since 1992.We measured surface air temperatures inside and outside the park using automated data loggers. Vertical temperature profiles were observed by lifting a kite balloon up to 250m from the ground. We also observed ground surface temperatures using infrared thermographies from top of the nearby buildings.We defined the cool island intensity (CII) as the temperature difference between the green space (f:forest and g:grass) and its surrounding built-up areas. Is a model graph which shows the diurnal variation of CII(f) and CII(g) based on the observations under typical summer pressure patterns (July 20-29, 1992).In the forest area, CII increases after sunrise, and reaches the highest value around noon. Then CII decreases rapidly in the afternoon, and becomes weak during the night. On the other hand, CII in the grass area shows somewhat different diurnal variations compared to the CII in the forest area. This shows that cool island phenomena in a green park is most prominent in the forest area during the middle of daytime.Vertical temperature variations in a large green park were observed inside Yoyogi-park by lifting up a kite balloon at the interval of very 3-hour. From 21h to 6h, ground inversion appeared continuously at lower layers from 30m to 60m height which corresponds almost three times of the average tree heights. After sunrise, the temperature inversion disappeared as ground surface began to be heated by solar radiation.We calculated potential temperatures in moist air based on the data. The vertical profile of potential temperature during the night shows that there exists and isothermal part between the ground inversion layer and another inversion layer which might be formed by the subsidence flow in a large green park.
Mills, G.1998. Building design and urban canopy layer temperatures. Proceed. IGU Commission of Climatology. Evora 1998.
UP ML
ABSTRACT. There is a clear distinction between the work of geographers and that of urban designers with regard to research into urban climates. While both fields tend to focus on the urban canopy layer (UCL), they differ in approach, methods and objectives. Generally, geographers examine the processes which result in a distinctive outdoor climate and have concentrated on the roles of construction
121

materials and geometry (represented as the building height (H) to street width (W) ratio, H/W in governing the night-time urban heat island. Research has examined these roles using both measurement and modelling approaches applied to representative urban configurations (usually urban canyons). Designers are chiefly interested in designs that result in a comfortable indoor climate and the focus is on building placement, orientation and construction materials suitable for given landscape and climate. Research on urban areas concentrates on harsh climates and usually considers problems with daytime heating (rather than night time cooling). The role of the sun is treated as paramount in these studies and the extent to which a building intercepts direct solar radiation is taken as measure of heat gain.These differences in focus and methodology are two reasons for the lack of interaction between these fields. My interest is in establishing a link between these fields by developing a model that is comprehensive in scope and explores the relationship between building group design and the climates of both the closed (interior) and open (exterior) UCL.An energy budget model has been developed which models outdoor and indoor air temperatures for simple building groups composed of block structures laid out in a regular grid pattern. Each building has a height, depth and length and is separated from its neighbors by street width. All facets and the canyon floor have a specified albedo, heat capacity and thermal conductivity and depth. All buildings are identical in terms of their properties and relations to one another so that a representative section of the UCL can be examined. This section consists of a single structure and the surrounding open space. The model solves the energy budget of the open and closed volumes by simultaneously solving the energy balance of all enclosing surfaces: the building facets (walls and roof) and the open canopy surfaces (canyon floor, building walls and canyon top). The model accounts for both radiative and sensible heat exchanges and employs traditional boundary layer theory to parameterize the exchange between the UCL and overlying air.In this paper the author will examine the role of both latitude and building separation in controlling the thermal behavior of the closed and open UCL. The energy budget model will be run using meteorological statistics for a variety of locations representing different latitudes and climates.
Mills, G.1998. Density and internal building temperatures. Proceed. of the AAG 94 th Annual Meeting, Boston, USA. 1998.
PhMUC GU
ABSTRACT. A numerical model is employed to examine the effect of building density on the behavior of internal building air temperatures. The assumptions and results of the model are first examined by comparing its simulations against measurements made with a scaled physical model. Once validated, the role of density, measured as the ratio of street width to building height (H/W), in controlling daytime heating and nighttime cooling within buildings is explored.
122

Geographical differences in the influence of building density are examined by employing meteorological data for locations representing different climates as model inputs.Keyword: climatology-urban, modeling.
Miragaya, A.; Martí, A.1998. Distribución espacio-temporal de las temperaturas en A Coruña en condiciones atmosféricas de estabilidad. (Spatial and temporal distribution of temperatures in A Coruña –Spain- in stable atmospheric conditions). Clima y ambiente urbano en ciudades ibéricas e iberoamericanas, Madrid, Spain, Parteluz, 219-229.
GUC ML
ABSTRACT: This work has been realized in the city of A Coruña (Spain), analyzing the intensity and distribution of the nocturnal heat island and the diurnal thermal field in stability atmospheric situations in winter and summer. Subjects Headings: Diurnal thermal field; Nocturnal heat island; Atmospheric stability; A Coruña, Spain.
Moira, A. and Schultz, E.1998. Airborne dust pollution in Mendoza, Argentina. Proceed. IGU Commission of Climatology. Evora 1998.
QUA ST
ABSTRACT. This binational project started in January 1995, and finished in January 1998.One of the aims of this integrated German-Argentine subproject “Mendoclima” (Urban climate and Air pollution), was the investigation of air pollution especially by airborne dust and NO2, in the oasis-city of Mendoza, in Western Argentina, during a long-term measuring series (2 years). Particle sampling was performed by the Sigma II passive sampling device, developed at the German Weather.These devices were installed: two in the cultivated park (Sigma 1 and 2), on the west side of Mendoza city, one near the limits of the city, eastward, (Sigma 6), another one in the Northside of the city, (Sigma 4), three in the heart of the urban agglomeration (Sigma 7, 5, 3) and the last in the South, (Sigma 8).The analysis of airborne particles shows a high mineral dust load at all eight Sigma II Stations even in a rainy winter week.The black carbon particles from tire wear and soot are especially high, along arterial roads. There are also other different sources of air pollution such as: an oil refinery (in the South), a cement factory (in the North) and several factories with sulphate emissions.A seasonal variation of the dust load is very characteristic with strong peaks during inversion episodes in the winter season.
123

The dry environment of Mendoza city and its periodic hot and strong “Zonda” (föhn) wind, originates a lot of dust in the air and a consequently important loading of dust particles.On the other hand, green spaces with cultivated trees (Park San Martín), remarkably decrease the amount of airborne dust pollution. This was also noticed, especially in the urban gardens.Conditions of local climate and air pollution have to be taken into account more seriously in the urban planning and environmental protection of Greater Mendoza.Adequate strategies and suggestions are under development in close co-operation with the local planning authorities.
Molnar, K.; Szalai, S. and Szentimrey, T. 1998. Analysis of urban influence (temperature and precipitation) for the case of Budapest. Proceed. of the AAG 94 th Annual Meeting, Boston, USA. 1998.
GUC ML
ABSTRACT. City inhabitants are subject to multiple stresses caused by the urban environment. Climate-related stress affects urban inhabitants more so than those people living in small villages.The first measurements of the daily and yearly heat island caused heat surplus were completed in the 1960s in Budapest and in the 1980s in Szeged (a town in South Hungary). In Budapest the difference in the mean annual temperature between the inner city and the confines of the city is 1.2 C. However, further comparative examination of the differences on the urban heat island around the town confines has been missing. The heat intake of the urban building material mass is much larger than that of the town confines covered with green areas, so the heat island around the city is two to four times greater than that of the parksand forests. On bare asphalt and stone surfaces the runoff of precipitation is much larger than on the plant-covered surfaces.In our examination we are trying to highlight the common sign of town stations in the case of Budapest, with a mathematically correct procedure, which can serve to characterize the urban effect compared to stations outside, but near the towns. We apply an optimal weighting worked out for the homogenizing problem range. The essence of the method is that it gives a linear combination of several stations which makes the noise/sign rate minimal.The climatically important vegetated surfaces of Budapest do not help the air motion and the ventilation over the town. One of the reasons for this is that in Budapest the vegetated surfaces are not in a homogeneous, contiguous system (except for the Buda Hills), which would theoretically be the best case. Instead, they are split up, small, often only grass-covered surfaces, which are not connected to the vegetated areas around the town (which would theoretically be most desirable). In Budapest, unfortunately, urbanization continues, at the expense of the already small green-covered areas. This has undesirable effects upon the human bioclimate of the city.
124
Keyword: climatology-urban, urban heat island, human bioclimate.
Montávez, J.P.; Rodríguez, A.; Sánchez, E.; Jiménez, J.I.1998. Un estudio de la intensidad y forma de la isla de calor de Granada. (Study of the intensity and form of the urban heat island of Granada, Spain). Clima y ambiente urbano en ciudades ibéricas e iberoamericanas, Madrid, Spain, Parteluz, 315-325.
GUC ML
ABSTRACT. In this work we present a study of the urban heat island of Granada (Spain). First we do a study of the intensity of the urban heat island, obtaining that the phenomena reaches its maximum at the latest hours of night, and the amplitude of difference temperature wave depends on the meteorological conditions. Second the dependence on the nocturnal temperature field with meteorological conditions, time of the night, and city’s geometry. Subjects Headings: Urban heat island; Intensity; Form; Granada, Spain.
Montávez, J. P.; Rodríguez, A.; Sánchez, E. and Jiménez, J. I.1998. An analysis of urban and rural temperature records for some cities of Andalucia. Proceed. IGU Commission of Climatology. Evora 1998.
GUC ML
ABSTRACT. We performed a study of the urban-rural temperature differences in several cities of Andalucia, specially in Granada city. First we studied the evolution of the recorded temperatures at some meteorological stations in Andalucia over the last 40-90 years. In these records, the minimum temperatures increased while the maximum temperatures decreased; this has been proved by using a slope test (introduced in this work). We also compared both rural and urban temperature records, obtaining the UHI fluctuations on a smaller time scale. The results show that the UHI phenomena are usually stronger in winter, and the maximum difference has a relative maximum around 4 hours after sunset, and an absolute maximum which occurs in the early morning when temperatures are at their daily minimum, however that depends on each city, while minimum differences occur around three hours after midday. We also observed that during stable situations (cloudless and weak or null winds) the fluctuations of urban-rural temperature differences are larger than in unstable situations (all other cases), reaching negative differences during the day and the highest intensities during night time. However, in unstable weather conditions the city is always warmer than its outskirts, but the differences are smaller.Finally we examined the geographical distribution of temperature in the urban area and obtained the dependence of the UHI form on meteorological conditions, urban geometry and time of night. Urban geometry plays an important role in the UHI form. We compared all transepts, by means of a spatial correlation index
125

(introduced in this work) and we found that the formation of the UHI phenomena depends mainly on weather conditions and hour of night, and the temperature distribution is practically identical for transepts made at the same number of hours after dusk. The temperature field in the inner city changes in the course of the night, due to advective mixing, the temperatures become homogenized, showing larger gradients at the city limits. Finally we related both the UHI form and intensity with the observed trends in the urban time series.
Monteiro, A.1998. O clima urbano portuense. Contributo para a gestao sustentável de um espaço urbanizado. (The urban climate of city of Oporto. Contribution for sustentable management of urban space). Clima y ambiente urbano en ciudades ibéricas e iberoamericanas, Madrid, Spain, Parteluz, 67-84.
GUC MLABSTRACT. The city of Oporto, in spite of being a singular area when considering the combination of geographic factors which characterize it, provokes significant alterations in the regional climate, due to its functional vitality. Neither the E-W topographic differentiation, nor the proximity of two important mosaics of water (the ocean and the Douro River), nor, much less, the repercussions in terms of the diversity of area occupation, inherent to its more than eight centuries of history, are sufficient to dissimulate the impacts of the urban metabolism, at least, at the level of its energetic balance. Subject Headings: Global warming; Regional and Local Climate Change; Urban heat Islands.
Moreno García, M.C.1998. Las investigaciones sobre el clima urbano de las ciudades españolas. (The research of the urban climate of the spanish cities). Clima y ambiente urbano en ciudades ibéricas e iberoamericanas, Madrid, Spain, Parteluz, 177-196.
GUC ML
ABSTRACT. Las investigaciones sobre el clima urbano de las ciudades españolas son muy recientes, pues las primeras se inician en la década de los años ochenta y se refieren a las dos grandes capitales del país: Madrid y Barcelona, que son las que cuentan con un mayor número de publicaciones.Otras ciudades estudiadas que también cuentan con diversos trabajos son Valencia, Tarragona y Zaragoza. El tema preferente de investigación ha sido el de la isla de calor y sus variaciones espacio-temporales. Los principales métodos de investigación que se han empleado son el análisis comparativo de datos de observatorios urbanos y rurales, así como el análisis de datos procedentes de las medidas tomadas a lo largo de diferentes transectos que atraviesan las ciudades. También se incluye una primera aproximación para la estimación de la intensidad de las islas de calor de las
126

ciudades españolas en función de su población. Subject headings: Urban Climatology; Spain; Urban heat islands.
Moreno, J.M.; Moreno-Grau, S.; Angosto, J.M.; Bayo, J.; Jiménez-Torres, E. and Moreno-Clavel, J.
1998. The influence of meteorological parameters on the behavior of the most important pollutants in the city of Cartagena (Spain) during the period 1995-1997. Proceed. AMS 13 th Conference on Biometeorology and Aerobiology, Albuquerque, New Mexico. 1998.
QUA ML
ABSTRACT. From a scientific point of view, photochemical processes are a very interesting case for study because of the complexity of factors involved. The special features of the city of Cartagena, with a complex topography and climate, in addition to heavy emissions from industry, are at the basis of the need for studies that contribute to our understanding of the pollution in the city area and provide ways to reduce contaminant levels and their consequences.The city Cartagena, due to high industrial activity and climatic and topographic characteristics, shows one of the highest values for air quality pollutants reports in Spain, although normally below the legislated standards. Besides, the abundance of sunny days, with high radiation patterns, produces the best conditions for photochemical oxidants formation, which results in elevated annual average values for ozone at some sampling stations.The statistical study of data described above allowed us to reach the following conclusions:1. A high degree of spatial and time variability exists among the different sampling
stations, as shown by the variance analysis, ANOVA, conducted per years and sampling points. This result confirms that the network of sampling stations is correctly designed, as a homogeneous distribution of the readings would indicate either an excess or a poor placement of the sampling stations.
2. The study of the hourly evolution of ANOVA per year and sampling point shows the presence of hourly behavior patterns repeated with slight variations on each season of the year. The ozone evolution is a direct consequence of the hourly evolution of solar radiation and temperature, as well as the presence of ozone precursors in the air.
3. The correlation analysis shows a negative correlation between nitrogen oxides and ozone, and the influence of meteorological parameters on secondary pollutant production. A positive correlation between solar radiation and ozone, as well as a tendency toward higher ozone concentrations with higher wind speeds, demonstrate an association with long distance transport of photochemical pollution precursors.
127

Morris, C.J.G.1997. Stratification of Melbourne’s urban heat island by synoptic conditions. Proceed. of the AAG 93 rd Annual Meeting, Fort Worth, Texas, USA. 1997.
GUC ST
ABSTRACT. The work presented here examines the influences upon the spatial and temporal distribution and magnitude of the urban heat island at the time of the minimum temperature (UHImin) for Australia’s second largest city, Melbourne (37.81S, 144.97E) which has a population of 3.2 million.The spatial characteristics of the UHImin are determined from a network of stations of daily minimum temperature data from 1985-94. The network consists of 15 stations, 12 are located within the urban and suburban areas and 3 stations are situated 35 km from the central business district (CBD) in the surrounding rural areas. The 10 year climatology indicates a UHImin of 2.56 C for summer and 1.65 C for winter. The summer UHImin is concentrated around the CBD, whilst in the winter the UHImin shows two peaks, one around the CBD and another large UHImin around one of the heavily industrialized suburbs.A second data set from 1971-96 comprises three climate stations located at airports approximately 20 km from the one CBD station. The climate data from these four stations are examined with respect to the prevailing synoptic conditions. Cloud type and amounts as well as wind velocity levels are stratified according to their frequency distributions. These stratifications are then used to examine the effect of each element upon the magnitude of the UHImin. The analysis shows a stronger seasonal influence of the cloud amount on the magnitude of the UHImin than on the wind velocity. These results are further discussed in terms of several time series of UHImin events, as well as optimum/adverse conditions for UHI genesis.Keyword: climatology-urban, urban heat island, climatology-synoptic.
Mote, T.L.1997. Estimates of Greenland ice sheet ablation using microwave radiometric data. Proceed. of the AAG 93 rd Annual Meeting, Fort Worth, Texas, USA. 1997.
PhMUC GU
ABSTRACT. A better understanding of the current mass balance of the Greenland ice sheet is critical to making predictions of how any climate change may affect the ice sheets and global sea level. This paper examines one component of the mass balance-the ablation rate-through the use of SMMR and SSM/I microwave radiometric data.Existing methods for estimating ablation rates involve costly and time-consuming stake or meteorological measurements. Due to the paucity of these measurements, ablation rates are often extrapolated great distances. The passive microwave sensors may be used to estimate the frequency with which melt occurs due to the increase in emissivity as liquid water forms in previously dry snow. With some assumptions of
128

the daily temperature distribution, the microwave melt frequencies are used to estimate the number of positive degree-days (PDDs). The estimated PDDs are used in an ablation model that includes different degree-day factors for snow and ice and accounts for the formation of superimposed ice. Model estimates using the microwave-derived melt frequencies are compared to measured ablation rates for three transects on the Greenland ice sheet. The microwave-derived estimates have the advantage of improved spatial coverage but have the disadvantage of assuming a fixed temperature distribution.
Nicholson, J.P.; Weston, K.J. and Fowler, D.1998. Modelling horizontal and vertical concentration profiles of ozone and nitrogen oxides within and downwind of urban areas. Proceed. AMS 13 th Conference on Biometeorology and Aerobiology, Albuquerque, New Mexico. 1998.
QUA ML
ABSTRACT. The background tropospheric ozone (O3) concentration is depleted in the vicinity of urban areas due to the reaction of ozone with nitric oxide. A model has been developed to simulate the three-dimensional structure in ozone and nitrogen oxide concentrations in the boundary layer in the vicinity of urban areas. This is based on the Lagrangian column model of ApSimon et. al.Work has been done using traffic density data and emission factors to obtain estimates for diurnal and annual NOx emission cycles. Temporally variable deposition velocities have also been incorporated. Data thus produced will be discussed in the accompanying presentation. There are a series of monitoring stations lying on a straight line, south from the city of Edinburgh to remote rural areas. These will be used to compare the results produced by the model for diurnal and seasonal means and recreate specific episodes.
Nunez, M.; Eliasson, I. and Lindgren, J.1998. Spatial variability longwave radiation in Goteborg, Sweden. Proceed. AMS 13 th
Conference on Biometeorology and Aerobiology, Albuquerque, New Mexico. 1998.
GUC HL
ABSTRACT. This study examines the spatial variability of incoming longwave radiation in Goteborg and surrounding areas during calm cloudless nights. Goteborg (57.7ºN, 12.0ºE), Sweden’s second largest city with 480,000 inhabitants, is characterised by car manufacture and communication industries. The field programme involved measuring longwave radiation at both regional and local scale. At the regional scale, variability of incoming longwave radiation may be due to the vertical air temperature structure of urban areas and perhaps modified by aerosol content. At the local scale, the variability of longwave radiation is dominated by the percentage of sky obstruction, such as buildings or forest canopies.
129

There was a weak pattern in regional longwave irradiance such that the longwave irradiance decreased (a temperature effect), and the sky emissivity increased with distance away from the city centre and into rural areas.The emissivity increase in rural areas is likely a result of an elevated temperature inversion in rural areas. The contribution of warmer temperatures aloft will strengthen the downward longwave radiation without greatly affecting air temperatures.A well defined relationship between sky view factor and longwave irradiance was obtained for urban and park structures. However brightness temperatures for parks appear to be considerable lower.
Oded, Potchter.1998. The effects of tall trees on climatic parameters at the pedestrian level on Mediterranean climatic zones a case study of Tel-Aviv. Proceed. IGU Commission of Climatology, Evora 1998, 1-2
GUC ML
ABSTRACT. The Urban Heat Island (UHI), characterized by the amplification of temperature values, lower relative humidity values and moderation in wind speed, can create unpleasant microclimatic conditions at the pedestrian level. Vegetation in particular tall trees can create a cooling effect, lower temperature and increase relative humidity. The aim of this study is to investigate the effect of tall trees with a wide foliage canopy, on the climatic parameters, at the pedestrian level in street canyons, Tel-Aviv. The research was conducted in two pairs of the street canyons, similar in size, building material and height but different in the amount of trees planted along them. Each pair consisted of a street canyon with tall dense trees planted along it (“Green Canyon”) and street canyon relatively lacking in tall trees (“Bare Canyon”).One pair was located parallel to and, the other perpendicular to, the coastline. Data collected in two ways: 1: Temperature and relative humidity, by a thermohygrograph in a fixed water screen, and a wind speed and direction, by an aneamograph during 4 days in June 1997.2: Traverse walking in each canyon, by which temperature and relative humidity were measured using a mobile data logger with thermocouples at dawn and midday, in August 1997. The results show that during the warm hours the temperature values in the Green Canyon were up to 4°C lower that those measured in the Bare Canyon and relative humidity values were up to 10% higher in the Green Canyon. Heat streets calculations show lower values and shorter duration of heat stress in the Green Canyons in comparison to the Bare Canyons. Wind speed in the canyons placed perpendicular to the coast line, was generally higher than in the canyons located parallel to the coastline and blocked by rows of building from the sea breeze, which is a characteristic of Israel’s shore line. Wind speed in Bare Canyons was generally higher that in Green Canyons due to the windbreak and friction effects of the trees in the latter. The existence of tall dense trees in an urban environment could result in two opposite climatic effects. The
130

moderation of temperature values on the one hand and the amplification of relative humidity values resulting in intensification of heat stress values and duration on the other hand. This research shows that in the case of street canyons located at the centre of Tel-Aviv, heat stress in Green Canyons was lower and of shorter duration in comparison to bare canyons, despite the increase of relative humidity valves.
Oke, T.R.1998. An algorithmic scheme to estimate hourly heat island magnitude. Proceed. AMS 13 th Conference on Biometeorology and Aerobiology, Albuquerque, New Mexico. 1998.
PhUC GU
ABSTRACT. The objective of the present work is to find a simple way to estimate the magnitude of the urban heat island (UHI) in the urban canopy layer (UCL) of any city for all time periods any weather conditions. Inputs should be no more demanding than the observations from a standard meteorological station and simple surface descriptors. The approach is based entirely on empirical relations, but their choice is strongly influenced by notions of physical causality. In the interest of brevity this preprint outlines the philosophy of approach, and the form of the algorithms, for this scheme. The data underlying the relations, and examples of the success of the scheme when applied to real world cities, will be presented orally.Existing methods to estimate the UHI mainly seem to occupy either end of a spectrum: statistical algorithms based on multiple regression of measured UHI and weather variables, and numerical boundary layer models. The former lack a physical basis and are restricted to the city in which they were developed, and the latter suffer from excessive input requirements, complexity and often their output does not refer to the UCL. The scheme here takes a middle course with an eye to the data availability and expertise of operational users and applied climatologists. It builds upon generalizable relations, several of which are already known in urban climatology. UHI work has a vast empirical base to draw upon. Unfortunately much of it stresses the unique or very specific aspects of a particular city. The scheme here seeks to filter out this “noise” and draw out the truly general, so that more universal characteristics dominate.It is common knowledge that the largest UHI in a city (Tmax) occurs on nights with cloudless skies and no wind. The popular quest for the largest thermal effect has produced a good number of estimates of this maximum UHI. Tmax has three crucially valuable characteristics: a) The cloud and wind conditions are unequivocal boundary conditions, b) The physical processes operating are greatly simplified (only longwave radiative exchange and no turbulent or advective transport) and c) Tmax is strongly correlated with both population and the sky view factor (s) of the street canyons in the city core.These characteristics are exploited here. The predictive power of the Tmax
correlation with s (a surrogate for several features affecting the cooling potential of cities) sets the absolute upper possibility for the UHI. Increasing cloud and wind speed cause less than “ideal” cooling conditions so T declines until it is obliterated
131

when urban and rural radiative exchange is similar and/or turbulent mixing and advection homogenize the thermal structure of, and between, the two environments. Initial indications are that a scheme to retrodict and forecast UHI for any city in any weather or time period using simple weather observations and geographic information has merit. The scheme is constructed from empirical algorithms which have generality and fit physical understanding. Further development and testing of the scheme is in progress.
Oke, T. and Grimmond, S.1998. How Rough is a City? Proceed. of the AAG 94 th Annual Meeting, Boston, USA. 1998.
PhUC GU
ABSTRACT. Cities are aerodynamically rougher than almost any other surface type. This has major implications for airflow, turbulence and diffusion and hence for the climate and air quality of urban areas. We present a comprehensive review and assessment of the available field estimates of urban surface roughness. This reveals that only a handful of studies have been properly conducted with respect to criteria involving instrumentation, height of measurement, distance of fetch, site character and method of analysis. Failure to include consideration of a zero-plane displacement excludes many studies. Even the best conducted studies yield estimates with a disturbingly large range. Those estimates meeting the criteria are compared with values suggested in the roughness classification of Wieringa (1993).We conclude that the state of knowledge about the roughness of cities is unsatisfactory, but simple morphometric algorithms and rules-of-thumb provide acceptable first order estimates.Keyword: climatology-urban, surface roughness, wind flow.
Oke, T.R.; Grimmond, C.S.B. and Spronken-Smith, R.A.1998. On the confounding role of rural wetness in assessing urban effects on climate. Proceed. AMS 13 th Conference on Biometeorology and Aerobiology, Albuquerque, New Mexico. 1998.
GUC ST
ABSTRACT. Assessment of urban effects on climate is notoriously fraught with methodological difficulties. The use of surrogate measures such as urban-rural difference and urban/rural ratio is open to criticism, especially if the rural site is open to advection of urban influences and/or subject to local landscape effects not possessed by the city. Despite this the literature is replete with studies of urban effects assessed using urban-rural station pairs where little more than the fact that the “rural” site is non-urban, or is distant from the city, or at a similar elevation, is offered as being satisfactory. This may be due to “necessity” if the study depends on
132

pre-existing stations from a standard network. Unfortunately network design is often set by objectives that are not compatible with being a surrogate for the pre-existing landscape on which a particular city is built.The present observational study illustrates that even if the rural site is near but not affected by the city, at a similar elevation, unobstructed by trees or buildings, and not affected by adjacent water bodies or relief, it can still be open to unwanted influences capable of confounding the integrity of any study to assess urban effects. The focus is upon the role of wetness possessed by otherwise “ideal rural” sites in producing surface energy balance (SEB) and water balance differences, which in turn create atmospheric thermal and moisture differences. Such microclimatic changes impact the magnitude of any apparent “urban effect” that might emerge if these stations are used in an urban-rural pairing.The approach taken is to observe the SEB and climatic variables in an near three cities, each of which have very different rural environs. The exact nature of the rural site is shown to be able to produce urban-rural effects which conform with, or are the reverse of, conventional expectation.Urban-rural differences of energy and water transfers and climatic variables, often interpreted to be gauges of urban effects on climate, are in a sense “apparent”. For example, although the SEBs of suburban sites are quite similar, those of rural areas is extremely variable, especially in terms of relative wetness. This confounds the use of urban-rural differences or ratios as a means of estimating urban effects on temperature and humidity. This must be appreciated by those using urban-rural station pairs to assess “urban effects” including their possible contamination of long-term climatic records.
O’Neill, S.; Villasenor, R.; Lamb, B.K.; Stock, D.; Allwine, E.; Shorter, J.H. and McManus, J.B.
1998. Turbulence model of an urban landscape for use in an urban footprint model. Proceed. AMS 13 th Conference on Biometeorology and Aerobiology, Albuquerque, New Mexico. 1998.
PhMUC ML
ABSTRACT. Cities and their associated industrial areas are dynamic entities that consume and metabolize atmospheric trace gases in daily and seasonal cycles. The metabolites of urbanization directly affect public health and the environment on local, regional, and global scales. The Urban Metabolism and Trace Gas Respiration project funded by the National Aeronautical and Space Administration (NASA) is studying urban and industrialized areas as entities that consume, metabolize and respire a wide range of trace gases. As part of this project, an urban footprint model is being developed to predict upwind pollutant source area from downwind concentration measurements.MM5 successfully captured the prevailing northwest winds exhibited during the November 10-13, 1997 field study thereby providing a realistic approach wind profile for the TEMPEST model. As an initial test of the TEMPEST model
133

performance, a 2-d idealized urban profile was simulated. TEMPEST successfully captured the urban canyon flows and building recirculation cavities. Further work is required to scale up to a 3-d case as well as incorporating actual urban structures from Manchester.Future plans include applying the Burk-Thompson PBL scheme to obtain TKE from MM5. Future field campaigns will deploy an Acoustic Sounder upwind of Manchester to give a local approach flow wind profile which can be incorporated into MM5 through four-dimensional data assimilation (FDDA) observational nudging.
Owen, T.W. and Gallo, K.P.1998. An intra-annual analysis of land cover in the Atlanta metropolitan region. Proceed. AMS 13 th Conference on Biometeorology and Aerobiology, Albuquerque, New Mexico. 1998.
RSUC ML
ABSTRACT. Changes in urban land use/land cover (LULC) have been shown to bias ambient air temperature measurements, most notably observed minimum temperature increases at meteorological stations undergoing a transition from urban to rural LULC. The diurnal temperature range (DTR=maximum–minimum temperature) has also been found to be significantly different between urban and rural regions, with lower DTR observed at meteorological stations located in regions with predominantly urban LULC. Such urban-induced temperature changes are attributed, in large measure, to changes in surface properties: the simultaneous removal of vegetation and introduction of reduced-evaporating, non-transpirative urban surfaces (e.g. concrete, metal, etc.). The magnitude of urban-induced temperature changes at a given location, in comparison to rural surrounding, can be largely attributed to two major LULC characterizations: a) the regional make-up of natural vegetation of nearby, non-urban locations and b) the local density of urban development.In distinguishing between urban and naturally vegetated rural locations, values of the Normalized Difference Vegetation Index (NDVI) have proven effective. However, such analyses assume well-vegetated conditions generally free of plant stress. Obviously, such conditions are temporally sensitive to phenological variations, as shown by Fisher with changing NDVI values over the course of a growing season.In the absence of high resolution (e.g. Landsat TM; MSS at <100m) satellite imagery, urban land cover can be assessed using other sources. Two sources of surrogate urban land cover data are so-called “city lights” data. Or digitized Census Bureau measures.In addressing the influence of LULC characterizations over the course of a growing season this paper uses a combination of satellite and in-situ temperature data from February-December 1997 for the Atlanta metropolitan region. Changes in the urban-rural contrast in NDVI, radiant surface temperature (Ts) and in-situ
134

observations due to phenological variations are evaluated. Surrogates of urban land cover are also evaluated for their utility in discerning seasonally-variant urban-rural land cover contrast.
Owen, T.W. and Gallo, K. P.1998. A comparative analysis of urban-rural land surface characteristic differences and in situ temperature observations. Proceed. of the AAG 94 th Annual Meeting, Boston, USA. 1998.
RSUC GU
ABSTRACT. The impact of urbanization on the long-term temperature record of many weather stations in the United States is well documented, even for stations located in or near population centers with less than 10,000 people. The magnitude of the urban bias varies temporally by season and spatially due to a number of factors, including the density and extent of anthropogenic land cover and the state of natural vegetation surrounding an urban area.In this study, the relationship between urban-rural differences in satellite-derived land surface parameters (e.g., Normalized Difference Vegetation Index (NDVI) and surface radiant temperature (Tsfc)) and in situ observations of maximum, minimum and average temperatures are examined. The analysis includes 28 cities in varying climatic regions in the United States, with assessments made for all parameters at monthly, bi-weekly and seasonal intervals over the course of five years (1989-1993).Generally, increased differences in NDVI between urban and rural locations correspond to increased differences in maximum, minimum and average temperatures. The greatest difference is observed in the minimum temperature during the summer. However, there are some peculiar departures from these findings at individual stations due to the state of surrounding natural vegetation. Some of these stations will be discussed, as will overall urban and rural sampling strategies.Keyword: climatology-urban, remote sensing, satellite.
Pérez González, C.; Pérez Jiménez, M.1998. La isla de calor de Mataró. (The urban heat island of Mataró, Spain). Clima y ambiente urbano en ciudades ibéricas e iberoamericanas, Madrid, Spain, Parteluz, 293-304.
GUC ML
ABSTRACT. From all climatic modifications make it from the city, the most important thing is called urban heat island, that consist the cities are hoter than around, specially at night; also, this phenomenon happened in Mataró, Spain. For this study, we have achieve two thermic transects, wich temperature reflects some
135

kind maritime influence and they give several intensities by urban heat island. Subjects Headings: Urban heat island; Thermic transect; Intensity; Mataró, Spain.
Quattrochi, D.A.; Luvall, J.C.; Estes M.G.; Lo, C.P.; Kidder S.Q.; Hafner J.;Taha, H.; Bornstein, R.D.; Gillies, R.R. and Gallo, K.P.
1998. Project Atlanta (Atlanta land use analysis: temperature and air quality) –A study of how the urban landscape effects meteorology and air quality through time. Proceed. AMS 13 th Conference on Biometeorology and Aerobiology, Albuquerque, New Mexico. 1998.
PhMUC ML
ABSTRACT. Project ATLANTA (ATlanta Land-use ANalysis: Temperature and Air-quality) is a NASA Earth Observing System (OES) Interdisciplinary Science investigation that seeks to observe, measure, model, and analyze how the rapid growth of the Atlanta, Georgia metropolitan area since the early 1970’s has impacted the region’s climate and air quality. The primary objectives for this research effort are: 1) To investigate and model the relationship between Atlanta urban growth, land cover change, and the development of the urban heat island phenomenon through time at nested spatial scales from local to regional; 2) To investigate and model the relationship between Atlanta urban growth and land cover change on air quality through time at nested spatial scales from local to regional; and 3) To model the overall effects of urban development on surface energy budget characteristics across the Atlanta urban landscape through time at nested spatial scales from local to regional. Our key goal is to derive a better scientific understanding of how land cover changes associated with urbanization in the Atlanta area, principally in transforming forest lands to urban land covers through time, has, and will, effect local and regional climate, surface energy flux, and air quality characteristics. Allied with this goal is the prospect that the results from this research can be applied by urban planners, environmental managers and other decision-makers, for determining how urbanization has impacted the climate and overall environment of the Atlanta area. It is our intent through this investigation to help facilitate measures that can be applied to mitigate climatological or air quality degradation, or to design alternate measures to sustain or improve the overall urban environment in the future.
Rappenglück, B.; Oyola, P.; Olaeta, I.; Fabian, P.1998. Photochemical processes in the Metropolitan Area of Santiago de Chile. Proceed. of the OMMAC, VIII Congress, Veracruz, Ver., México 1998.
QUA ML
ABSTRACT. Photochemical smog episodes are widespread phenomena in urban regions worldwide where increased levels of nonmethane hydrocarbons (NMHC) and nitrogen oxides may be found due to various anthropogenic sources.
136
Meteorological influences such as sunny and warm weather conditions along with stagnant wind patterns favour the formation of secondary pollutants i.e. ozone and PAN through effective photochemical consumption of NMHC and NOX in these areas. These conditions may be encountered very often in the Metropolitan Area of Santiago de Chile during summer. Its specific orographic situation close to the mountain ranges of the Andes to the east and the Cordillera de la Costa to the west causes a persisting valley-mountain-breeze system that favours the enhancement of primary compounds.Here we will highlight some important results of PHOTOCHEMICAL CAMPAIGN that took place in Santiago de Chile during November and December 1996.The PHOTOCHEMIAL CAMPAIGN of November and December 1996 in Santiago de Chile yielded several important results: The hydrocarbon split in Santiago mainly reflects the emission of traffic. The urban plume in Santiago is strongly controlled by the mountain-valley breeze system that leads to a transport of polluted air masses from the center to the NE suburban regions during daytime. Within the urban plume regularly high ozone and very high PAN mixing ratios can be found. The observation show that the behavior of PAN is strongly linked to anthropogenic compounds, namely aromatic compounds (m-xylene for instance). Biogenic precursors may only contribute to afternoon ozone-levels since PAN thermally decomposes before biogenic precursors are significantly emitted.
Reisnser. J.M.; Smith, W.S.; Bossert, J.E. and Winterkamp, J.L.1998. Tracer modeling in an urban environment. Proceed. AMS 13 th Conference on Biometeorology and Aerobiology, Albuquerque, New Mexico. 1998.
PhMUC GU
ABSTRACT. The accurate simulation of the transport of a tracer released into an urban area requires sufficiently high model resolution (1-10m grid cells) to resolve buildings and urban street canyons. Within our group a modeling effort has been underway to develop a model –termed HIGRAD –capable of simulating flow at the high spatial resolution required within the urban environment. HIGRAD uses state-of-the-art numerical techniques to accurately simulate the regions of strong shear found near edges of buildings. HIGRAD also employs a newly developed radiation package which in addition to standard shortwave and longwave heating/cooling effects can account for the shadowing effects of building complexes on the urban flow field. Idealized simulations have been conducted which clearly illustrate the role radiation plays in transport and dispersion in an urban setting. For instance, idealize two-dimensional simulations reveal fewer boundary-layer eddies within cooler shaded regions and rather persistent eddies on the tops of buildings. We have also modeled the flow of an inert tracer in a realistic, complex urban environment.HIGRAD was used to perform 2-D idealized simulations, and more realistic 3-D simulations of an inert tracer release in an urban setting. These simulations were used to study the effect of radiative heating, as well as buildings and urban complexes, on the overall atmospheric flow. The 3-D tracer release experiments
137

shown reveal the interesting effects of radiative heating on the transport of the tracer in the modeled urban setting. In our experiment, radiative heating creates thermal plumes that sweep the tracer up into all levels of the boundary layer. These plumes cause a region of divergent flow in the center of the modeled urban setting. Without radiative heating, the tracer tends to flow downstream of the release point in a fairly homogenous plume.The 2-D idealized experiments shown illustrate the respective roles of wind shear and buoyancy driven by radiative heating on the overall turbulent structure of the boundary layer. These experiments also suggest that buildings may act as anchors for the formation of turbulent eddies in the boundary layer. These experiments also clearly show fewer boundary-layer eddies within cooler shaded regions and rather persistent eddies on the tops of buildings.Currently, work is underway to validate the HIGRAD model at various resolutions and scales against available wind tunnel data for single buildings. This work focuses on documenting the performance of HIGRAD in simulating well known features of the building induced flow such as the horseshoe vortex, cavity zone, stagnation points separation and reattachment points, recirculation patterns, and overall turbulence features. Future work will include a budget study of the interesting heating effect produced at the tops of buildings, and more detailed simulations of multi-building urban settings.
Richards, K and Oke, T.R.1998. Dew in urban environments. Proceed. AMS 13 th Conference on Biometeorology and Aerobiology, Albuquerque, New Mexico. 1998.
PhMUC GU
ABSTRACT. There is growing interest in urban dew and its significance in questions of urban climate and air pollution deposition. Despite its relevance the basic research needed to describe and explain patterns of urban dew has largely been neglected. Studies tend to focus on agricultural crops, where it is now possible to satisfactorily measure, and sometimes predict, dew. In contrast, urban dew is seldom measured, often dismissed, and even with the best available numerical models cannot be simulated.The focus of the present study is the measurement and modeling of dew in urban environments.The presence of dew is linked to many topics, in the natural and applied sciences. It has a role in determining urban humidity, evaporation rates, and near-surface temperature. Presence of dew has implications for the moisture supply of urban plants, air pollution deposition, and subsequent chemical damage to plants and materials. Although it normally occurs in small amounts compared with rain, there is potential for dew to be collected for human use, where other sources of fresh water are limited.Measurement of dew is associated with certain difficulties in whatever environment it occurs: dew is a small-scale phenomenon, involving only small fluxes of energy
138

and of mass, it is seasonal, but sporadic and dominantly nocturnal, and not all nocturnal surface moisture is strictly dew, leading to difficulties of identification and measurement. Since dew is not regularly measured, except at agricultural sites, and then only when economic incentives exist, dew data are not routinely available for cities.Physical or numerical simulation is an attractive alternative to measuring small fluxes in a complex environment, such as a city. However, dew is difficult to create artificially, few have attempted to do so, and hardware modeling in the out-of-doors, under conditions where dew forms naturally, has hardly been investigated. Further, there are no existing numerical models to predict urban dew. Few urban models simulated fluxes of water vapor, and the best that is currently available to estimate urban evaporation lacks the resolution needed to adequately simulate dew. Further, when dew is present but not accounted for, numerical simulations tend to underestimate evaporation rates and overpredict rates of warming.Despite its broad relevance, urban dew has largely been ignored. This is due, in part, to basic difficulties associated with measuring dew in cities. The present study uses simple observations, an out-of-doors scale model, and numerical simulation to describe patterns of dew in urban environments. Results suggest that, whilst small, dewfall is not a negligible term in the urban water balance.
Rosen, J.N. and Sailor, D.J.1998. Initialization issues for mesoscale modeling of urban heat islands. Proceed. AMS 13 th Conference on Biometeorology and Aerobiology, Albuquerque, New Mexico. 1998.
PhMUC ML
ABSTRACT. Mesoscale atmospheric models have been identified as good tools for use in urban heat island studies. In particular these numerical models are well suited to sensitivity studies where the lower boundary condition is modified to demonstrate the effect of different surface characteristics and thus quantify the heat island. The lower boundary condition, defined by specific surface characteristics such as albedo, surface roughness, moisture availability and thermal inertia. Heat island mitigation studies also typically take the form of sensitivity study where interest is in the effectiveness of modifying one or more of the surface parameters to reduce urban temperatures.In a typical study a certain day, perhaps an ozone episode, is modeled and one or more parallel simulation with modified surface parameters is compared. Since the lower boundary condition is the only difference between simulations, the model results can be directly compared to determine the implications of the modification. In designing such a study one needs to consider a number of issues. Model results should not be compared immediately after start-up because it has been shown that the predictive skill of mesoscale models initialized with coarse scale data increases during the first few hours of simulation. On the other hand, as the model simulations progress they generally show less skill in predicting observations. These
139

factors combine to suggest that there is an intermediate period of time during which model results may be directly compared.There are two factors that influence the initial length of time during which the model shows relatively poor predictive skill (hereafter referred to as spin-up time). The first is seen by all modelers and is related to imperfections in the initialization data. The second is unique to a sensitivity study and is caused by the modification of the boundary conditions. Limited area, mesoscale models are typically initialized with relatively coarse global analyses data that are of an insufficient resolution to contain mesoscale features. Even if the initialization data are perfect on a large scale, errors are introduced when the data is interpolated to the model domain. A number of studies have analyzed the effect of initialization data on forecast error. Both Anthes and Errico and Baumhefner showed that initial errors in limited area mesoscale models can propagate out of the domain and horizontal diffusion can attenuate small errors. Warner analyzed a number of different initialization scenarios and showed the error in amplitude and position of meteorological features near the middle of the domain decrease for the first twelve hours of model simulation. They also found a decreasing average error in the model output. Domain averaged errors were also found to be generally. This decrease in error is attributed to mesoscale forcing which can improve model accuracy so long as the land-surface parameterization is accurate. These results suggest allowing mesoscale models a certain amount of spin-up time has benefit in improving predictions.
Roth, M. and Ueda, H.1998. A wind tunnel study of turbulent flow over a rough surface. Proceed. AMS 13 th
Conference on Biometeorology and Aerobiology, Albuquerque, New Mexico. 1998.
PhMUC GU
ABSTRACT. Fluid modelling studies are useful to overcome some of the difficulties encountered in full-scale field research. They are attractive because essential boundary variables and the nature of the surface can be controlled and measurements can be performed with the necessary spatial resolution. The latter point is a major advantage over field studies which are often limited to single point measurements which restricts the applicability of results. The objective of the present laboratory study is to investigate the spatial characteristics of the mean and turbulent flow fields close to and within the canopy of a rough surface using regularly arrayed, rigid roughness elements of varying density.
Roth, M1998. Vertical structure of turbulence over cities. Proceed. AMS 13 th Conference on Biometeorology and Aerobiology, Albuquerque, New Mexico. 1998.
PhUC GU
140

ABSTRACT. In the constant flux layer over flat and homogeneous surfaces with low roughness, the vertical profiles of turbulence statistics such as the drag coefficient and the turbulence intensity can be described within the framework of the logarithmic wind profile and its diabatic extensions. There is considerable interest to assess the applicability of these functions and other traditional micrometeorological theories over cities, where the structure of the atmosphere is modified by the high roughness of the surface. Such information is needed as input into urban dispersion/air quality models or models of the urban climate.The results presented in the following are gleaned from a comprehensive and critical review of urban turbulence work spanning more than five decades. A set of criteria was used to evaluate more than fifty field studies in terms of instrumentation (e.g. adequate sensor response, sampling frequency and averaging time), surface characteristics (e.g. homogeneous fetch) and sufficient description of site and experimental conditions (e.g. aerodynamic surface properties, stability). Applying these criteria resulted in the rejection of most available data and the bulk of current knowledge is based on less than ten high-quality studies (Appendix).A few select results are presented below. The main focus is on the vertical structure of turbulence properties within the roughness sublayer, namely observations of drag coefficients, CD, turbulence intensities, I, normalized standard deviations, A, and length scales of velocity spectra fm. The full review further includes effects of stability on velocity and scalar statistics, examples of (co)spectra and observations of urban boundary layer turbulence.Urban statistics measured at approximately zs/zH > 25 generally agree well with theoretical predictions and reference data from flat and homogeneous surfaces. Closer to the canopy (within the roughness sublayer) intra-urban variability becomes larger and individual results are observed to digress from the reference. This is most obvious for the peak frequencies of the velocity components close to the top of the roughness and within the canopy. Some of the observed variability can probably be explained by differences in surface morphologies (e.g. spacing between houses) which is not accounted for in the simple zs/zH ratio.It is suggested that future studies take note of the stringent selection criteria required to obtain high-quality data. More careful description of site characteristics and stability conditions during the observations would have resulted in the inclusion of more studies. There is further a need for more observational research at heights close to the urban canopy and within to be able to better understand momentum, heat and scalar transfer in the roughness sublayer.
Runnalls, K.E. and Oke, T.R.1998. The urban heat island of Vancouver, BC. Proceed. AMS 13 th Conference on Biometeorology and Aerobiology, Albuquerque, New Mexico. 1998.
GUC ML
ABSTRACT. Situated on the Pacific west coast of Canada and surrounded by complex topography, Vancouver, British Columbia, (49ºN, 123ºW) presents a
141

challenging environment in which to study urban heat island dynamics. This paper presents a climatology of Vancouver’s urban heat island (UHI) in terms of its temporal variability and significant controls on its magnitude.Hourly averaged air temperatures from downtown Vancouver and a rural site 25km to the south-east for the period 1991-1994 were analyzed. The urban site is within the central business district of Vancouver with a sky-view factor of approximately 0.41. The rural site is located in agricultural crop land on silt-loam soil. Simultaneous urban-rural temperature differences give an estimate of hourly urban canopy layer heat island magnitude. Ancillary weather observations are made by the Canadian Atmospheric Environment Service at Vancouver International Airport, located approximately mid-way between the urban and rural sites.In summary, it appears that onshore flow affects UHI magnitude, and the size of this effect depends on the relative land-sea temperature difference. That is, onshore flow can boost or dampen UHI magnitude depending on whether the flow has a warming or cooling effect on one or both of the sites. In Vancouver, the largest land-sea temperature differences are typically in the summer daytime (ocean cooler) and winter night time (ocean warmer). Thus, advective cooling of urban temperatures in the summer, and warming in the winter by sea air offsets the seasonally-varying rural surface cooling which favours large UHI in the summer, and small UHI in the winter.In the mean, Vancouver’s UHI exhibits simple, generalizable characteristics which can be explained in terms of known relations with urban-rural cooling differences and weather variables such as wind and cloud. However, even while holding weather variables constant, short-term variations in nocturnal maximum UHI can be as large as seasonal variations, implying that surface cooling potential does not set an upper limit to UHI magnitude. Onshore flow which preferentially advects warmer or cooler air to the downtown region appears to be a likely explanation for ‘unseasonable’ UHI magnitudes. The spatial extent of the influence of the onshore flow on air temperatures and the penetration of sea-affected air into the urban canyon is still under investigation.
Salmond; J.A. and McKendry, I.G. 1998. The vertical distribution of ozone within the nocturnal urban boundary layer in an area of complex terrain. Proceed. of the AAG 94 th Annual Meeting, Boston, USA. 1998.
QUA HL
ABSTRACT. Mesoscale circulatory systems such as mountain flows and sea breezes play an important role in determining the three dimensional patterns of pollutant dispersion within airsheds. During periods of stagnant anticyclonic conditions the ventilation provided by these thermo-topographic wind systems during the day contributes to the maintenance of good air quality in urban areas surrounded by complex terrain. However, due to the diurnal reversal of the wind flow patterns a hypothesis is proposed that pollutants may become embedded within these
142

circulatory systems and reintroduced to urban areas at night resulting in an escalation of pollutant concentrations in the source area.To investigate this hypothesis, a field program was instigated using a combination of tethered balloon apparatus (equipped with an ECC ozonesonde) and sodar data to document the concentration of ozone and meteorological characteristics of the nocturnal urban boundary layer in Vancouver during August 1997. This paper focuses on a case study which illustrates the complex structure of vertical pollutant concentrations.Periods of marked ozone advection aloft can be identified embedded within the land breeze circulation throughout the night. These are thought to be associated with different source locations. Elevated concentrations of ozone were also recorded in the residual layer. At the surface significant deposition occurred throughout the night. The results illustrate that thermo-topographic circulations play a significant role in the return of pollutants aloft to the source area at night. With the onset of enhanced vertical mixing at dawn this has the potential to affect urban air quality at the surface. Thus the results have implications for air quality modeling in urban areas.Keyword: climatology-urban, nocturnal boundary layer, ozone.
Schmid, H. P.1998. Is there a Blending Height over Urban Areas? Proceed. of the AAG 94 th Annual Meeting, Boston, USA. 1998.
PhUC GU
ABSTRACT. Over inhomogeneous surfaces, such as urban areas, the structure of turbulent transfer close to the ground is influenced by individual elements of the urban morphology. As a result, local profiles (of wind speed or scalars) are not in equilibrium with local fluxes and are variable over short distances. Thus gradient methods and flux-profile relationships to model turbulent transfer are invalid. Fluxes measured by eddy-correlation systems will have a sensor location bias. The concept of a blending height assumes that local contribution to the flux and local perturbations of profiles are blended progressively with increasing height by turbulent mixing, so that a blending height scale exists, above which horizontal variability in profiles and fluxes essentially vanishes. The existence of such a blending height scale is essential for some forms of flux aggregation modeling. The value of the blending height depends on the scale of variability present at the surface. This work examines the process of blending with height over urban areas and discusses the requirements for the existence of a blending height.Keyword: climatology-urban, blending height, flux aggregation.
143

Shorter, J.H.; McManus, J.B.; Kolb, C.D.; Allwine, E.J.; O’Neil, S.M.; Lamb, B.K.; Scheuer, E.; Crill, P.M.; Talbot, R.W.; Ferreira, J.Jr. and McRae, G.J.
1998. Recent measurements of urban metabolism and trace gas respiration. Proceed. AMS 13 th Conference on Biometeorology and Aerobiology, Albuquerque, New Mexico. 1998.
QUA ML
ABSTRACT. Cities and urban areas constantly undergo processes analogous to metabolism and respiration. Cities metabolize materials and energy, including food, fuel, electrical power, water, industrial materials, and atmospheric oxygen. They then export or excrete both products (e.g. industrial goods) and wastes, such as sewage, garbage, industrial wastes, gaseous pollutants and airborne particulates. Urban respiration, a component of urban metabolism, is the taking in of oxygen and the expulsion of gaseous pollutants and airborne particulates and aerosols. It represents the direct impact of urban metabolism on the atmosphere. The emitted urban air pollutants have a significant impact on both regional viability and global change issues. They can influence the health, agricultural and ecosystem productivity, and visibility of a region and are important in global change issues of climate, ozone depletion, and the oxidative capacity of the atmosphere.In this paper we will present preliminary results of the first measurement campaigns in an urban area. The data will ultimately be incorporated into both an urban air chemistry/dynamics model and an urban footprint model to determine upwind pollutant source size and strength from downwind concentration measurements.
Simpson, J.R.; Scott, K.I. and McPherson, E.G.1998. Effects of tree cover on parking lot microclimate and vehicle emissions. Proceed. AMS 13 th Conference on Biometeorology and Aerobiology, Albuquerque, New Mexico. 1998.
GUC ML
ABSTRACT. Like many urban areas of the U.S., Sacramento, California has summertime episodes where ozone concentrations violate the federal air quality standard. Ozone is formed through atmospheric photochemical reactions involving precursors such as oxides of nitrogen (NOx) and hydrocarbons in the form of “reactive organic gases” (ROGs). To reduce the ozone problem, air quality agencies seek to reduce NOx and ROG emissions from stationary (industrial), area (dispersed sources such as small businesses, consumer products) and mobile (vehicles) sources within the metropolitan area.In Sacramento, where motor vehicles are major sources of NOx and ROGs, current county-wide emissions of NOx and ROGs from all sources are 86 and 120 tons per day (tpd, 1.102 tons = 1 metric ton), respectively. On-road motor vehicle NOx and ROG emissions are, on an annual average basis, approximately 59 tpd each. While
144

the bulk of vehicle ROG emissions are in the form of tailpipe exhaust, approximately 9.7 tpd (16%) are in the form of evaporative emissions when vehicles are not operating.“Diurnal” emissions occur during daytime heating of fuel delivery systems. “Resting loss” emissions occur during periods of constant or decreasing air temperature. “Hot soak” emissions occur during the hour following engine shut-down. “Star” emissions occur during the first few minutes of engine operation and are dependent on both ambient temperature and the duration that an engine is off prior to a start. Diurnal, resting loss, hot soak and start emissions are sensitive to local air temperature, which are influenced by local meteorological and microclimate conditions.Paired observations show that parking lot temperature regimes are warmer than those over irrigated turf, and that a sparse tree canopy exerts a cooling effect on both parking lot climate and vehicle temperature.Based on the observations, temperature inputs composited from typical meteorological networks may cause vehicle emission inventory models to under-predict ROG diurnal, resting loss, hot soak and starts emissions.The above MVE17G modeling scenarios were based on conservative air temperature reductions and did not account for irradiance effects on vehicle temperature. By analogy with the “equivalent black body temperature” concept used in biophysical energy budget studies, an “effective” air temperature could be developed to account for the effect of irradiance on vehicle temperature. An effective air temperature input to the MVE17G model, incorporating both air temperature and irradiance reduction due to tree canopy cover, would presumably predict greater emission reductions resulting from shade.To determine how microclimate, vehicle temperature and emissions scale with tree canopy cover, observations need to be performed for a range of conditions (e.g. parking lot size, paving surface, tree canopy cover and density). A corollary to this issue is a need to develop a parking lot taxonomy which accounts for lot size, patterns of use, occupancy by vehicle type and landscape characteristics.
Skiba, Y.N.1998. Climate variations in Guadalajara City during the last century. Proceed. of the OMMAC, VIII Congress, Veracruz, Ver., México 1998.
GUC ST
ABSTRACT. Analysis of environmental problem in the Mexican Republic reveals the presence of a strict relation between the environmental contamination, topography, scales and dynamics of the economic development. In the absence of integral planning, demographic and industrial growth has also resulted in an unbalanced development from the point of view of environment protection. Various factors influence the levels of pollution, its dispersion or accumulation, and it is therefore very important to have a full understanding of the climatological, meteorological and topographic factors that influence these processes. Guadalajara
145

City Metropolitan Area (GCMA), Jalisco is no exception in this respect. Its high demographic and transport density, together with its industrial activities have been reflected recently in both climatological characteristics and pollution levels. As a consequence, on the average, air quality indices in GCMA have varied from unsatisfactory to bad in 7 out of each 10 days of the last year. A study of the relationship between ecological and climatological variations and the development and growth of GCMA is the principal goal of this work.
Sobreira de Santana, A.M. and Lombardo, M.A.1998. Urban design and climatology in Fortaleza. Proceed. IGU Commission of Climatology. Evora 1998.
UP GU
ABSTRACT. The metropolization phenomena has provoked deep changes in the design of cities as well as changes in the energy balance, leading to an altered atmosphere of the urban area: the urban climate.It is possible to change the thermal variables in the urban space through an appropriate urban design, so as to improve the thermal comfort of the citiesThis work aimed to perceive the relationship between land use, urban form and differences of air temperature, related to loss of environmental quality and damage of the urban landscape. It also develops an evaluation approach of the thermal performance of microclimatic spaces and their connections to the morphology of urban design, to help the designers in the creation of spaces suitable for a better human thermal comfort, having as a study case the city of Fortaleza, located at 3º46’ South latitude, on the coast of Ceara state in the Northeast of Brazil.The analysis was divided as follows: the analysis of Urban Morphology and Urban Performance-Middlescale, and Analysis Microclimatic Inner Spaces, having as mainstream the urban form characteristics: size and density of the urban structure; texture, porosity; orientation and location of the streets, lots and buildings; thermodynamical properties of the materials that form the urban fabric; presence of water and vegetation; shape and dimension of open public spaces free from buildings.From the analysis of the land use, features of the urban form and human activities in the city of Fortaleza, it was possible to identify homogeneous areas that show mesoclimatic variations according to the amounts of solar radiation and air circulation altered by the urban environment.During the day the highest air temperatures were registered in spots located in zones with greater density of buildings, people and vehicles, reduced shading and sparse vegetation. However areas with skyscrapers presented cooler air temperatures in the morning readings (9:00 am) due to the fact that having more built mass, they need more time to warm up and, consequently, increase their temperature.Such analysis brought us to the conclusion that in cities with a stressful hot-humid climate like Fortaleza, where the direct solar radiation is very intense and diffused
146

because of the amount of water vapour present into the air (high relative humidity), it is important to create shades, ventilation and correctly choose the materials that will make part of the urban fabric, so as to improve the human thermal comfort conditions.
Soler, X.1998. Avance sobre la isla de claor en Girona. (Advance of the urban heat island in Girona, Spain). Clima y ambiente urbano en ciudades ibéricas e iberoamericanas, Madrid, Spain, Parteluz, 281-291.
GUC ML
ABSTRACT. This preliminary investigation is about the urban climate. We try show existence of nocturnal urban heat island in Girona (Spain) and his intensity and the spatial-temporal distribution. The period of this study is from april-1997 to october-1997. Subjects Headings: Urban heat island; Girona, Spain.
Soriano, C., Baldasano, J.M. and Coutinho, M. 1998. Seasonal variation of the atmospheric circulatory patterns in the Barcelona area: numerical simulation of typical wintertime and summertime situations. Proceed. AMS 13 th Conference on Biometeorology and Aerobiology, Albuquerque, New Mexico. 1998.
QUA ML
ABSTRACT. This contribution analyzes the circulatory patterns of air pollutants in Barcelona (Spain), an area with strong coastal and orographic influence, during two typical summertime and wintertime situations from the meteorological point of view.Summertime and wintertime modeling scenarios were extracted from the study of series of synoptic maps for the region. Since the intention was to simulate the mesoscale flows in the area, the synoptic situation in both cases was chosen to be weak, so that no important large-scale forcings were introduced. The lack of large-scale forcings allowed the development of mesoscale circulations. Climatological studies include both situations as typical meteorological situations for the region.The simulations were performed with the latest version of the non-hydrostatic meteorological model, MEMO.Typical summertime and wintertime situations have been modeled with the mesoscale model MEMO. In both cases the model has been able to reproduce the typical mesoscale circulations that develop in the Barcelona area due to its coastal location (sea-breeze) and its complex surrounding orography (slope and valley winds).Results have shown that the main differences between the mesoscale circulations developed in summertime and wintertime are found in the intensity and duration of the sea-breeze inland flow during the afternoon. The stronger temperature gradient
147

between sea and land during summertime provoke a ver intense onshore flow that starts early in the afternoon and spans for 8 hours or more. On the contrary, during wintertime, wind speeds are much more uniform along the day and sea breeze blows later in the afternoon and only for a few hours (3 to 4 hours). Coupling between sea-breeze and mountain winds is evident in the summertime situation, while it is almost not present in winter. Drainage from the river valleys is reproduced in the two cases and, together with the land breeze typical of the nocturnal period, transports air pollutants that are produced over the terrain towards the sea were they are incorporated to large scale circulations.
Soux, A.; Oke, T.R. and Voogt, J.A.1998. Modelling and remote sensing of the urban surface. Proceed. AMS 13 th Conference on Biometeorology and Aerobiology, Albuquerque, New Mexico. 1998.
RSUC GU
ABSTRACT. The increasing use of remote sensors for the examination of processes occurring at the urban surface has necessitated closer scrutiny of the information gleaned. This paper explores the unique nature of the urban surfaces and presents the theoretical basis for a numerical model to evaluate sensor view factors of the three dimensional urban surface and remotely sensed temperatures.Measurement of surface radiative emissions is an important aspect to the study of urban climates. Accurate knowledge of emissions can lead to a greater ability to parameterize and evaluate urban energy balances and temperatures. As measurements of radiance are taken from remote sensing platforms located at varying distances from the surface, evaluating the surface being sensed becomes a requirement. What a remote sensor “sees” (commonly referred to as its view factor) is directly tied to its output signal thereby affecting the information acquired from the sensor.For satellite based remote sensors the simplest case exists when the instrument is located directly overhead (i.e. elevation angel = 90º). This leads to a “birds-eye” or nadir view of the surface. For the urban case this refers to roof-tops, tree-tops, roadways and any unobstructed open areas. These features do not represent the total urban surface (active area Aa) that is in contact, and therefore interacting, with the atmosphere and leads to exposed horizontal surfaces being preferentially sampled over other surfaces. For more densely built-up sites the complete surface area is much greater than the plan area (Ap). (For example, cubic buildings separated by a distance equal to their characteristic length (i.e. at a plan density of 0.25) have an active area to plan area ratio (Aa/Ap) of 2. A low density suburban area with scattered trees may have a ratio of 1.5 while in downtown cores values may be 3). Any vertical surface, such as building walls and areas beneath tree canopies, therefore are not “seen” by the sensor and an inaccurate evaluation of true radiative emissions from the complete surface is obtained.For any other elevation angles that are less than 90º relative to the city, the amount of vertical surface viewed increases. For a given viewing angle this effect will depend
148

upon Aa/Ap of the target. If surface radiance temperature or reflected solar radiation are being measured, the position of the sun relative to the city and sensor will also impact the measured values.Understanding the temporal and spatial variability of sensor detected radiance is important for identifying potential biases in measurements. This allows the investigator to utilize and properly evaluate information acquired from off-nadir sensor coverage of the surface.Remote sensing of urban surfaces can be a potentially powerful source of data regarding temperatures and surface radiative emissions. However, uncritical acceptance of this data can lead to erroneous conclusions regarding surface characteristics. A modelling and measurement study will be presented that examines, and provides a tool for analysis of this phenomenon over a wide variety of urban surfaces.
Spronken-Smith, R.A.1998. Comparison of summer and wintertime energy fluxes over a suburban neighbourhood, Christchurch, New Zealand. Proceed. AMS 13 th Conference on Biometeorology and Aerobiology, Albuquerque, New Mexico. 1998.
GUC ML
ABSTRACT. Knowledge of the surface energy balance is fundamental to understanding the boundary layer meteorology and climatology of urban areas. The energy balance of an urban area can be expressed as:
Q* + QF = QH + QE + QS + QA [W m-2]Where the flux densities are: Q* net all-wave radiation, QF anthropogenic heat, QH
turbulent sensible heat, QE turbulent latent heat (or evaporation), QS sensible heat storage, and QA heat advection (representing the net gain or loss due to transport associated with the spatial heterogeneity of sources and sinks).While several studies have examined surface energy exchanges of urban areas in the Northern Hemisphere there is a paucity of such observations for Southern Hemisphere cities. Most of the Northern Hemisphere research is on summertime energetics with few reports of wintertime observations. This study reports some of the first direct measurements of energy fluxes over the city of Christchurch, New Zealand, during both summer and winter.The surface energy balance of Christchurch has been the focus of pervious study. The model the energy balance of Christchurch in an attempt to simulate winter urban heat islands. More recently, is made a direct measurement of the turbulent heat fluxes over a suburban neighbourhood (5 km south of the present study area) in late August, 1995. On a daily basis 50% of Q* was channelled into WH with 44% into QE and only 6% into QS.Fetch problems at this site complicate interpretation of flux data. During the predominant east-northeasterlies and unstable conditions summer, the fetch includes a commercial warehouse as well as residential areas. Thus the data must be interpreted with caution. In summer, on a daily basis QH is the dominant heat sink
149

followed by QS and QE. However, during daytime QS can be considerable and may approach the magnitude of QH. Evaporation is surprisingly low for the landuse and time of year. In winter, the small daily surplus of Q* is partitioned mainly into QS, with some QE and a small QH that may be directed either towards or away from the surface depending largely on the synoptic conditions. Under strong inversion conditions which occur frequently in Christchurch during winter, the turbulent heat fluxes are very small and QH may be directed towards the surface for many hours each day.The results highlight the importance of seasonal and synoptic controls in energy partitioning at this location although difficulties with fetch complicate the analysis. In winter strong inversions have a significant impact on surface energetics, while in both winter and summer foehn events alter energy partitioning. Future research needs to be conducted at a site with better fetch to clearly elucidate the suburban fluxes.
Spronken-Smith, R.A.; Oke, T.R. and Lowry, W.P.1998. Advection and the surface energy balance across an irrigated urban park. Proceed. AMS 13 th Conference on Biometeorology and Aerobiology, Albuquerque, New Mexico. 1998.
PhUC ML
ABSTRACT. The ameliorating thermal effect of parks can be substantial in hot, dry climates so they can be a powerful tool in climate-sensitive urban design. To intelligently manage the thermal microclimates of urban parks it is first necessary to understand their surface energy balance (SEB). Hence, the primary objective in this paper is to elucidate the surface energetics of an irrigated urban park in a hot dry climate. Two secondary objectives are to examine the role of advection in the SEB and its spatial variation, and to relate the SEB to any thermal differences between the park and its built-up surrounding.SEB partitioning showed a daily cycle at each park site that was consistent from day-to-day throughout the period. Given this, the following discussion uses three-day averages of the SEB at each site. YDs 237, 239 and 240 form the ensemble average because the data record is continuous.At the surface the wet park is cooler than the nearby dry paved area throughout the day and night. The contrast is strongest in the late afternoon (T0 > 16ºC) and provides a potentially significant source of warm air advection to the park. The air temperature difference between the two is much smaller. The strength of the humidity driving force (ea) is almost zero near sunrise because dew is presented on both surfaces, but it grows rapidly in the morning to a peak of –150 Pa near 1500 Local Apparent Time (LAT)The surface energy balance of Orville Wright Park, a well-irrigated grassed area set in a residential suburb of a city in a hot climate, is dominated by evaporation. Evaporation rates show an approximately exponential decline across the park due to edge effects. Moreover, this spatial pattern is superimposed on a base of
150

absolutely high evaporation rates forced by the oasis influences due to the park being located in relatively drier urban environs. This is demonstrated by the fact that the park rates exceed even those of an irrigated rural site (a sod farm) outside the city. Comparison of surface temperatures between the park and nearby urban materials suggests that the park behaves like a “giant leaf” and contributes a thermostatting effect on the thermal climate.
Sugawara, H.1998. Estimation of the sensible heat flux on the urban complex surface. Proceed. AMS 13 th Conference on Biometeorology and Aerobiology, Albuquerque, New Mexico. 1998.
PhUC ML
ABSTRACT. The urban area is a mosaic of the many types of land-use. For this reason, it is hard to determine the “typical” urban air temperature, surface temperature, and the sensible heat flux by the eddy correlation measurement. This complexity of the land-use is one of the urban area characteristics, that is also a major problem in the boundary layer meteorology, as in the problem of the sub-grid scale heterogeneity.To find the typical value for this complexity, we selected a target area of about 80 Km2 for this study. We ignored the precise land-use, and treated the urban surface as a homogeneous rough surface. We evaluated the area-averaged heat budget as typical of the area. In this study, the surface heat budget model was used with the remotely sensed surface temperature to estimate the sensible heat flux. The validity of this method has demonstrated for the flat homogeneous surface. The remote sensing technique is very useful because it can easily measure the area-averaged surface temperature. Some works used the satellite remote sensing data for the surface heat budget estimation, along with the numerical models or physical models.Our goals in this study are: 1), to estimate the sensible heat flux averaged over an urban area of about 80 Km2, 2), to validate the remote sensing technique and the model; 3), to estimate the bulk heat transfer coefficient on the urban complex surface. In the validation, a simple mixed layer model evaluated the boundary layer heat budget.The surface heat budget on the about 8 Km2 urban area was analyzed with the simple heat budget model and the airborne remote sensing data. The model was based on a homogeneous flat surface and includes the build heat transfer parameterization. The bulk coefficient was determined as the heat budget closed. The other parameters were individually estimated from the observed data.The bulk heat transfer coefficient and the diurnal variation of the area-averaged sensible heat flux were estimated. The sensible heat flux estimated from the surface heat budget agrees well with the boundary layer heat budget. It was confirmed that the heat flux, averaged on the urban complex surface, can be estimated bye the model and remotely sensed data. This method was applied to a rural surface, and the bulk heat transfer coefficient was estimated to be less than that of the urban surface.
151

Svensson, M.K.1998. Integration of climate knowledge and modelling in a geographical information system – A project with focus on urban green areas and city planning. Proceed. AMS 13 th
Conference on Biometeorology and Aerobiology, Albuquerque, New Mexico. 1998.
UP HL
ABSTRACT. The project started in 1997 at the Earth Sciences Centre, Physical Geography, Göteborg University. It is financed by the Swedish Environmental Protection Agency and the Göteborg University.Earlier studies in Sweden has found the need for easy accessible and user-friendly information on the local climate in the urban and regional planning process. Local climatological maps has been developed for this purpose but these maps have limitations as the traditional map is static while the climate is a dynamic process. A dynamic map, which shows the variations of the urban climate in space and time, would help to increase both the knowledge of the climate processes and the usefulness for climate planning.The main objective of this project is to develop a dynamic climatic map in order to simulate the urban climate and develop a practical useful tool for climate planning in cities. The dynamic climate map will be based on a geographical information system.One expected outcome of this work is, for example, a climate map showing the variations in temperature, wind, etc depending on e.g. landuse and environment. Additional parameters such as Sky View Factor etc can be incorporated in the material and by modifying the calculation rules, for the feature map. Other results such as energy index maps or human comfort maps etc can be created. The work is, as mentioned before, in a scale of 1:50 000. The scale can in a later phase be increased and simulations can, for example, be made for the temperature in a block of houses etc.The project is using data and material from Göteborg. The purpose is however, that the method will be applicable on other areas as well.For the moment the work is concentrated on creating a feature map showing the temperature over the area. This method and possible results from the modelling will be discussed at the conference.
Thanh V.; Asaeda, T.; Ashie, Y. And Fujino, T.1998. A numerical model for the urban climate. Proceed. AMS 13 th Conference on Biometeorology and Aerobiology, Albuquerque, New Mexico. 1998.
PhMUC ML
ABSTRACT. In general, the atmospheric boundary layer in the urban area can be divided into several sub-layers. Among them, the portion of the boundary layer in
152

the urban area between the roof tops and the ground is known as the urban canopy layer. In this layer, the drag force exerted by urban structures on the wind field can considerably reduce the wind velocity. The reduction of the sky view-factor inside street canyons can increase the possibility of the interception of a large portion of the longwave radiation emitted from wall and ground surfaces. The intercepted longwave radiation, together with multiple reflection of radiation and anthropogenic heat released by human activities, can cause a complicated wind field and heating processes. A model for the wind field and heating processes in this region must account for all of these processes.Noting that a numerical model for the urban climate is necessary for the study of the urban heat island, this study attempts to establish a numerical model for the simulation of the heating processes at the urban surface and its influence on the urban thermal climate through simultaneous integration of the heat condition equation at the urban surface, the ensemble-spatial averaged Reynolds equations for the wind field and equations of the transfer of heat and water vapor in the atmosphere. A turbulence closure model of the k- type is developed for the computation of the wind field, air temperature and mixing ratio of the water vapor in the atmospheric boundary layer.A numerical model was developed for the simulation of momentum, heat and water vapor transfer in the atmospheric boundary layer above an urban area. Preliminary verification of the model using observational data on air temperature and humidity shows that the model is capable of computing air temperature and water vapor concentration in the urban are.
Tereshchenko, I.E. and Filonov, A.E.1998. The “heat” island effect in the city of Guadalajara, Mexico. Proceed. AMS 13 th
Conference on Biometeorology and Aerobiology, Albuquerque, New Mexico. 1998.
GUC T
ABSTRACT. During the last few years, the “heat” island phenomenon has been the subject of many studies carried out in the larger cities of Mexico, especially the capital city, one of the largest conurbation’s in the world. However, there is only one study that deeply analyze this phenomenon in Guadalajara. The Metropolitan Zone of Guadalajara (MZG) consist of four districts: Guadalajara, Zapopan, Tlaquepaque, and Tonala. It is the greatest regional center in western Mexico, covering an area of approximately 1461.6 km2, and its altitude is over 1500m above sea level, has nearly 4 millions persons. In this work, we will present the results of the study on the variability of the thermal regimen of the city for periods ranging from three days to several years.To study the thermal peculiarities of the MZG, or the characteristics of the “heat” island, three time scales were used. The first was characterized by synoptic variability (for groups of temperature data with a daily discrete distribution); the second by seasonal variability (based on monthly information); and the third scale was based on an inter-annual variability (mean annual data).
153

The results obtained from this investigation are undoubtedly very interesting, from either a meteorological or urban point of view. The minimum air temperature in the MZG has a notable tendency to rise, increasing 0.049ºC very year, which is close in magnitude to data for other tropical cities. To verify a whole series of characteristic related to the air temperature of the MZG and urban factors, it would be necessary to include observations from a number of meteorological stations, located both in an outside city limits.
Tereshchenko, I.E. and Filonov, A.E.1998. Temperature inversions in the boundary layer of the atmosphere above the metropolitan area of Guadalajara, Mexico. Proceed. AMS 13 th Conference on Biometeorology and Aerobiology, Albuquerque, New Mexico. 1998.
GUC T
ABSTRACT. The study of temperature inversions is essential due to the fact that these processes cause unfavourable meteorological conditions that are especially dangerous for a large city.The most damaging thermal inversions are those which are formed above the surface or a few hundred meters above the surface in the part of the lower troposphere known as the Planetary Boundary Layer (BL).The Metropolitan Zone of Guadalajara (MZG) consists of four districts: Guadalajara, Zapopan, Tlaquepaque, and Tonala. It is the greatest regional center in western Mexico, covering an area of approximately 1461.6 km2, and its altitude is over 1500m above sea level, has nearly 4 millions persons.All the inversions in the BL are classified into two types; surface inversions (the base of the inversion coincides with the ground surface) and elevated inversions (there is a distance between the base of the inversion and the ground surface). The thermal inversions that are formed in the BL are of greater interest, since the pollutants that come from ground sources are dept close to the surface, because of the weak turbulent transport, and cause high pollution levels.In the last few years, only one article has been published that analyses the thermal inversions in the MAG during 1980.In this article we will use data generated by a daily vertical section of radiosonde at 6 a.m. (0.00 GMT) in Guadalajara, station number 76612, located 1551 metres above sea level in Colomos Park, Northeast of the city.A series of data from the standard radiosonde, produced from 1 January 1991 to 30 April 1996 was used for the calculations. The sample of 1061 soundings do not correspond to the number of days in the given lapse of time, since unfortunately, for various reasons, some days of the radiosonde were not probed. This data is the basis for the study of the thermal inversions that have been registered in the atmosphere of the MZG.The results obtained in this work show that 86.5% of the early morning thermal inversions above the MZG are generated by different mechanisms and that there is a clear seasonal course in the formation of these inversions. There are thermal
154
inversions during 10% of the dry season, mainly subsidence, while during the rainy season, mainly advection. The radiation inversions show regular behavior throughout the year. From the spectral analysis, we noted that the inversions are formed during period of synoptic scale.
Tiraoui, L., Antoine M-J.1998. The analysis of formal features of urban spaces to intervene on thermal conditions of urban environment. An attempt to give spatial signification of thermal exchange in urban space. Proceed. AMS 13 th Conference on Biometeorology and Aerobiology, Albuquerque, New Mexico. 1998.
PhUC GU
ABSTRACT. Studying the climatic phenomena depends on their analysis at three scales: the meso-scale, the urban canopy layer and the local microclimate related to urban spaces. The observation of this latter scale presents two main interests. The first one is linked to the influence of the urban spaces on urban climate and environment, and the second one is related to town-dwellers’ living conditions.The main purpose of our research is to answer the following questions: what are the physical and formal features that influence the thermal environment of urban spaces, and to which extent? How do urban forms affect the thermal conditions of cities?Urban forms can influence thermal environment by:- the physical properties of the materials (albedo, inertia, conductivity, etc.)- the relative disposition of buildings (ratio (H/W), angles, distances,...)- the orientation and shape of buildingsHow do these parameters influence the thermal environment of urban spaces? Can we define some physical and spatial descriptors which would allow us to understand the role played by these parameters in modulating the thermal condition of spaces?Understanding the thermal environment of cities should allow architects and urban designers to control exterior conditions in a better way.In this paper, we will attempt to discuss the influence of formal features of urban spaces on radiative exchanges and surface temperatures. The global influence of surface temperatures is linked to their close participation in the heat island phenomena. Do urban spaces amplify the thermal exchanges in the city? Are their spatial features the principal factors of the sunshine trapping? At the local scale, urban spaces are not only transitional places, they are places of life and activities. The users’ well-being depends on the respect of the physiological pedestrian comfort, which is linked to the following parameters: air temperature, air humidity, wind speed, solar irradiance, and mean radiant temperature.The effect of surface temperatures on thermal comfort can be observed by means of the mean radiant temperature. This latter is defined as that uniform temperature of an imaginary black enclosure which would result in the same heat loss by radiation from the person as the actual environment. It can be expressed using the view factor
155

between the person and the surrounding surfaces, the temperatures of those surfaces, and the solar energy reaching the person.
Tsutsumi, J.G.1998. Effects of urban vegetation on micro climate and thermal comfort. Proceed. AMS 13 th Conference on Biometeorology and Aerobiology, Albuquerque, New Mexico. 1998.
UBCL ML
ABSTRACT. Vegetation has various effects on urban thermal environment. It is expected to mitigate urban heat island or to improve the thermal sensation. However, it is not easy to indicate its effect quantitatively or to include it in a simulation model. In this paper, a part of these effects, especially microclimate and thermal sensation around the vegetation, were investigated through field measurements and experiments.The field measurement was done in the courtyards of some elementary schools in Naha to know the difference of thermal condition by the surrounding vegetation and buildings. Thermal sensation was surveyed by the direct hearing from the residents in Naha. Some voting experiments of thermal sensation by selected subjects were also done in our campus.The voting experiments on outdoor thermal sensation and comfort sensation were done in the campus of our university on fine days. The purpose of this experiments is to investigate the change of thermal sensation which is thought to be transient.Two experiment sites were set, one is a sunny place and the other is shaded by tree. Total number of the subjects was 15. They were all college students including 5 girls. They were grouped into 3 and each group had 5 subjects. One group was exposured at the shaded point for 20 minutes, and then they got 20 minutes exposure at the sunny point. They answered their thermal sensation and comfort sensation at 0, 2. 5, 10 and 20 minutes past at both the points. Thermal environmental factors were also measured at these times.The fluctuations of thermal condition data and sensation votes are shown. There is a steps in the sensation votes when the subject moved from the shaded place to the sunny place, though the air temperature did not change greatly. When they moved in reverse order, the step is steeper. Thermal sensation is thought to be transient feeling.
Tsutsumi. J.1998. Modelling of buildings for the simulation of the urban thermal environment. Proceed. IGU Commission of Climatology. Evora 1998.
UP GU
ABSTRACT. The urban thermal environment is one the most serious problems not only from the physical and climatical aspects but also from the social and
156

economical phases. It affects the thermal sensation of residents and causes energy consumption as it leads to the use of air conditioning, which is directly related to the global environmental problems. It is necessary to predict the urban thermal environment to design a better environment in urban areas and to prevent the aggravation of the global environmental problems.Buildings change the ground surface into complex terrain, which is the urban area itself, and are one of the most characteristic factors in the formation of the urban thermal environment. Buildings affect the wind speed profile near the ground surface, catch the solar radiation in the cavity spaces, store large heat mass all day long and originate shade on the ground and on other buildings. However, it is difficult to predict the thermal environment in a built-up area, because the actual buildings often have sophisticated shapes and stand on complicated layouts. This is a study about the modelling of buildings based on a survey of the actual buildings in an urban area, which makes the shape and the arrangement of buildings very simple in order to calculate the solar radiation and the wind practically.A total model of buildings and their layout is called an urban block model. The urban block model is set in each cell of a 50m square grid based on the actual building data. The building data used here are building heights and areas which were surveyed in Naha city, Japan. The principles of the urban block model are: 1) all the buildings in a cell have a constant shape, 2) the plan of the model building is a square and the walls face the right direction, N, E, S and W, 3) the intervals between the buildings in a cell are constant in all the directions, 4) the total volume and the number of the buildings is conserved as the actual condition in a cell.There are two ways to count the number of buildings; one is to count even a part of a building existing in the cell as one building, which is called simple count, and the other is to count a building divided by the grid lines as the number of the divided parts, which is called divided count. The simple count is used to get the arithmetic average height of the buildings, which becomes the model building height in a cell. The total volume of the buildings in a cell is divided bye the model building height to get the total area of the buildings.The solar radiation on the ground and building surfaces is rather easily calculated in the urban block model because of the simple relation between the surfaces and the solar position and the sky factors. It is also for the numerical simulation of the wind in and over the cavity spaces in built-up areas. The solar radiation and the wind are the dominant factors in the formation of the urban thermal environment. The urban block model is suitable to predict thermal environment and thermal sensation in built-up areas.
Unger, J.1998. Some effects of the urban heat island in a medium-sized city Proceed. of the AAG 94 th Annual Meeting, Boston, USA. 1998.
EUC ML
157

ABSTRACT. The development of an urban heat island has several effects on its environment. This study investigates some influences of higher urban temperature on vegetative and human life, as well as on heating demand in Szeged, Hungary in a 3-year period when urban climatological measurements were carried out in the city.The mean annual numbers of special (winter, frost and summer) days which have limitations for daily maximum or minimum temperature, mean duration of frost-free period, mean dates of the latest and the earliest frosts reveal that there are significant alterations caused by the urban heat island and they are mostly advantageous for inhabitants and vegetation. The presence of the heat island reduces the number of heating days (HD) and heating degree-days (HDD) thus it reduces the quantity of energy consumption in the city.Monthly means of the numbers of urban and rural HD and HDD values show that in the central urban area the heating season is more than 3 weeks shorter than in rural surroundings, with a maximum difference in October. The energy demand in the centre is approximately 10% and 20% lower than in rural areas in the winter months and in the whole heating season, respectively and the differences are most significant in the transitional months.Keyword: climatology-urban, urban heat island, heating degree-day.
Unger, J. 1998. Wind and heat island intensity. Proceed. IGU Commission of Climatology. Evora 1998.
GUC ML
ABSTRACT. The study investigates the urban climate of Szeged, Hungary where urban climatological measurements were carried out in a 3-yerar period. With the help of the observed values of two stations which represent the city centre and its rural counterpart relationships of the heat island intensity with the wind speed and the wind direction have been discussed in the case of this medium-sized city. The study area has a continental climate with a long warm season (climatic region D.1 by Trewartha’s classification).In several cities the urban heat island and its relationships with other factors has been studied. In the first part of the study the difference between the daily minimum temperatures of the urban and rural stations has been used as the measures of the urban heat island intensity (Tu-r). Wind speed values were taken from the observations of the rural station at 1 a.m. in the summer half-year and from the arithmetic means of observations at 1 and 7 a.m. in the winter half-year, because the lowest value of the diurnal temperature appears at around the times mentioned above.The results show that if there are calm weather conditions, a very strong heat island develops (the mean Tu-r exceeds 3C). At a wind speed of 3 m/s the average intensity decreases and it is less than half of that in calm condition (1,44C). Because of the small number of occasions of wind speed higher than 5 m/s, the heat island intensities of these wind speeds were placed in the same class. In such cases the
158
mean Tu-r is only 0,6C, which is hardly, more than half of that one at a wind speed of 4 m/s (1,09C). The mean heat island intensity of less than 1C is negligible and it refers to the destruction of the heat island. This is in keeping with the result which claims that every city has a critical wind speed above which the temperature difference between the rural and urban environment is obliterated. The threshold’s value depends on the population of the city (P) and it is given by the following empirical formula:
S=3.41 lgP – 11.6 (m/s)In summary the following conclusions are reached from the analysis presented: The heat island intensity in Szeged(i) is larger at calm or light wind conditions and smaller in the case of strong
wind,(ii) is larger at upwind to the city (W-direction) and smaller at downwind (E-
direction).
Upmanis, H.1998. Daytime summer temperature differences between a green area and its built-up surroundings in a high latitude city. Proceed. AMS 13 th Conference on Biometeorology and Aerobiology, Albuquerque, New Mexico. 1998.
GUC HL
ABSTRACT. Earlier studies have shown that an urban park at nighttime establishes its own cold climate in situ. Daytime studies, on the other hand, are less numerous and show conflicting results. Since temperatures are usually higher during daytime, when people also are most active, the influence of green areas during the warmest hour of the day is of large interest.Thus, the air of this work was to study:1. Air temperature pattern in a park and its surroundings at the warmest hour
during daytime.2. Influence of local factors, such as sky view factor (SVF), distance from the park
border and height above sea level, on the air temperature pattern.3. Influence of meteorological factors, such as global radiation, cloudiness, wind
speed and wind direction, on the air temperature pattern.The results showed that the difference in temperature between park and built-up area are of importance also in daytime. The results also imply that the colder park climate influences its surroundings, and that the magnitude of Tu-p is largely depending on the direct influence of wind speed and global radiation. However, the small magnitude of EOF 1 (27%) suggests that there are uncertainties in the analysis, and there is need for further investigations of the complicated air temperature pattern during daytime.At the conference these results about the influence of air humidity and thermal admittance.
159

Valimont-Schreiber, K.1998 A climatic assessment of interannual and intraannual variations in dengue incidence in San Juan, Puerto Rico. Proceed. AMS 13 th Conference on Biometeorology and Aerobiology, Albuquerque, New Mexico. 1998.
UBCL T
ABSTRACT. A number of dynamic models have been produced to explain and predict the daily mechanics of dengue arbovirus transmission to humans by the mosquitoes Aedes aegypti and Aedes albopictus. Such models consider the intricate relationships between numerous interacting variables such as mosquito biting frequency, breeding vessel water depth, and the dynamics of both human and mosquito populations. As such, prediction of outbreaks of the disease by these models requires a large number and variety of data inputs, many of which are difficult and costly to acquire.Existing climate/dengue relationships may provide an alternative means of predicting dengue incidence. Weather and climate are fundamental to the spread of dengue because viral replication and mosquito survival and biting rates are influenced by environmental temperature. Additionally, sufficient environmental moisture must be present for proper development of mosquito eggs. The present study is a preliminary investigation of the role of climatic influences on the incidence of dengue in San Juan, Puerto Rico. The mean intraannual variation in dengue incidence is assessed in relation to mean antecedent thermal and moisture conditions. Additionally, relationships between mean biweekly dengue incidence (1988-1993) and climate indicators are analyzed with the ultimate goal of producing a cost-effective predictive tool based on easily obtained climatic indicators for use in public health care planning.The mean intraannual trend in dengue onset cases in San Juan, Puerto Rico is represented by a rise in dengue incidence during fall, peaking at the end of the season. A subsequent drop occurs during spring, producing low average incidence in summer. Year-to-year variations in dengue incidence are superimposed upon the mean annual trend, sometimes manifesting themselves as episodes.Model results show that surprisingly strong relationships exist between dengue incidence and climate, especially for the mean intraannual trend. The relative strength of this model may be due to the substantial averaging of the independent variable which minimizes perturbations caused by mosquito population dynamics and other non weather-related factors. Energy factors figure relatively strongly over moisture descriptors in these models, especially for the intraannual model. Year-to-year irregularities in moisture characteristics may have the most impact on dengue incidence; thus, the importance of moisture becomes apparent only the interannual model.This preliminary study has shown that correspondences between dengue incidence and climate do exist for San Juan, Puerto Rico, and some basis exists for continued work towards development of a predictive tool for use in health care planning. Future work will incorporate data standardization, alternative averaging techniques, and analysis of episode occurrences.
160

Veal, A. T. and McGregor G. R.1998. Modelling Air pollution levels in the west midlands (UK) using the UK-ADMS and indic Airviro air quality modelling packages. Proceed. IGU Commission of Climatology. Evora 1998.
QUA ML
ABSTRACT. Hourly surface synoptic meteorological data from the UK Met. Office station at Birmingham Airport were supplied for 1996. The emissions information used came from the West Midlands Atmospheric Emissions Inventory (LRC, 1996). It includes estimated emissions of a range of pollutants from around 900 point sources, 4200 road links and from 1200 1 x 1km grid squares (background emissions). The emissions inventory has been validated for NOX (accurate), CO (less accurate) and PM10 (rather poor).The models were run for each hour of both episodes for three above pollutants; carbon monoxide (CO), total oxides of nitrogen (NOX) and PM10 particles for seven points coincident with the seven West Midlands automatic air quality monitoring stations in operation at the time.Comparisons were then made between measured and modelled concentrations.Results and DiscussionSpecific hour calculations are prone to considerable variation from hour to hour. Minor fluctuations in wind direction can also induce a model to “see” or “miss” an effect from a source at a particular location. Results also revealed that calm or light wind conditions are outside the optimum range for dispersion calculations and therefore test the models to their limit. These constraints, together with inaccuracies in the emissions inventory were reflected in the models performances. Both models generally followed the pattern of the measured values, but often inaccurately. Neither model outperformed the other consistently. Occasionally both models predicted higher levels than recorded, suggesting that such errors were due more to faulty emissions and meteorological data rather than inaccurate calculations particularly with the PM10 results. Modelled mean concentrations of NOX and CO for each station tended to be between one and two times the measured values with significant positive correlation coefficients (to the 0.01 level) seen in around 90% of the Airviro and 50% of the ADMS Urban results. Modelled PM10 concentrations tended to be either similar to the measured values or up to 10 times higher with some stations. None of the ADMS Urban and 40% of the Airviro PM10 correlation coefficients were significant though even these were only just above the threshold. Summer and winter results had similar differences in mean concentrations and levels of significance.Both models are capable of successfully modelling air pollutant dispersion. Differences between measured and modelled results are thought to be due to inaccuracies in the emissions inventory and choice of meteorological data rather than errors in the model calculations themselves.
161

Voogt, J.1998. Complete surface temperatures of select buildings. Proceed. of the AAG 94 th Annual Meeting, Boston, USA. 1998.
PhUC GU
ABSTRACT. The concept of the complete urban surface temperature is examined at the scale of individual buildings.Radiometric surface temperatures of the primary wall and roof surfaces of select buildings are monitored by fixed instruments. These observations are upplemented by detailed sampling of the surface temperature on both the building facets and the surrounding horizontal surfaces to assess the microscale variability of the temperature for the range of surface types present in each environment. The resultant data are examined to assess the variability of radiometric surface temperature as may be viewed by a remote sensor, versus that of the complete surface temperature.Keyword: climatology-urban, surface temperature, remote sensing.
Voogt, J.A. and Grimmond C.S.B.1998. Modelling urban surface energy balances using surface radiative temperatures. Proceed. AMS 13 th Conference on Biometeorology and Aerobiology, Albuquerque, New Mexico. 1998.
PhMUC ML
ABSTRACT. Much interest has been generated in the use of remotely sensed variables to estimate surface heat fluxes. In urban areas, such efforts are complicated by the complex three-dimensional structure of the urban surface. In this study, thermal infrared data are used to model sensible heat flux for a light industrial (LI) area within the city of Vancouver, B.C. The LI area is characterized by one- and two-storey warehouses and workshops with flat roofs and a notable absence of vegetation. Results are compares with directly measured surface energy balance fluxes from tower flux measurements.The early emphasis in this study is to: (1) account for the surface temperatures of all surfaces that constitute the “complete” urban surface and to assess their effect upon calculated sensible heat fluxes; (2) evaluate methods for estimating z0h, the scalar roughness length for heat, for typical urban surfaces.
Yamada, T.1998. Numerical simulations of the cloud street observed over Metropolitan Loop Road 8 in Tokyo, Japan. Proceed. AMS 13 th Conference on Biometeorology and Aerobiology, Albuquerque, New Mexico. 1998.
162

PhMUC ML
ABSTRACT. Kai et al collected lidar and radiosonde measurements to examine the cause for formation of cumulus clouds (so-called “Kampachi clouds”) frequently observed over Metropolitan Loop Road 8 in Tokyo. From the analysis of the surface wind and temperature measurements, they found that Kampachi clouds are located over the surface wind convergence zone, which also coincides with the boundary of the heat island of Tokyo.In this study, we used a three-dimensional mesoscale model, HOTMAC (Higher Order Turbulence Model for Atmospheric Circulation), to simulate Kampachi clouds to understand their cause of formation and investigate the influence of urbanization on the clouds.A three-dimensional mesoscale model, HOTMAC, was used to simulate Kampachi clouds which form frequently in the summer over Metropolitan Loop Road 8 in Tokyo. Based on the simulations, the most important cause of the cloud formation appears to be the moist air convergence of sea breezes from Tokyo Bay and Sagami Bay.Sensitivity studies were conducted. First, land-use parameters (roughness, soil moisture, anthropogenic heat, and albedo) were removed and uniform distributions were assumed. The results were qualitatively similar to those with the land-use parameters (hereafter referred to as the control run), but locations for wind convergence and maximum surface temperature were approximately 15km north of those for the control run. Clouds were also transported faster to the north than for the control run. In other words, urbanization significantly affected the magnitude and location of the clouds.Second, the inner grid was removed to examine the effect of horizontal grid spacing on the cloud formation. Initial values and boundary conditions remained unchanged from the control run. Sea breezes from Tokyo Bay and Sagami Bay were underestimated considerably because of a coarse horizontal grid spacing (4 km), consequently, no cloud street formed over Loop Road 8.There were several discrepancies between the modeled and observed Kampachi clouds. That Kampachi clouds formed at rather low altitude (approx. 1000m above the ground), but the modeled clouds formed at much higher levels (approx. 1500m above the ground). The observed Kampachi clouds formed in narrow streets, but the modeled clouds were in an elongated ellipsoid shape. Both issues (cloud height and cloud shape) may be related to the grid spacing used in the simulations: horizontal grid spacing for the inner grid was 1km. The vertical grid spacing varied with height. It was 4m near the ground and approximately 180m at 1000m above the ground.
Yamashita, S.1998. Urban climates, air pollution and human life in Japan. Proceed. Int. Symp. on Human Biometerology, Fuji-Yoshida, Yamanashi, Japan,1998.
UBCL HL
163
ABSTRACT. This paper describes the present situations of urban climates and air pollution in Japan from the bio-climatic point of view, and aims to discuss their relationships with human life. In Japan we have lots of urban climatological studies. Until 1970’s urban climate studies in Japan have mainly centered on the study of actual states and mechanism of urban climates. From the middle of 1980’s researches of control and design of urban climates have dramatically increased. At present main issues of urban environment is to develop the right environment and to create amenity city for the next generations.At first actual states of urbanization in Japan will be explained from climatic and regional point of view. Secondly urban climates and sensible climates will be described. Thirdly air pollution will be treated from the bioclimatological point of view. Finally human life will be discussed in relation to the above-mentioned conditions. In Japan over 70% of total population are now living in urban areas. Artificial cooling and heating systems have been rapidly introduced into each family during the last decades. These have resulted in increasing release of heat into environment and consequently temperature increase.Urban climate elements treated in this paper are annual average, maximum and minimum air temperature. The number of climatically-specified days and discomfort index are also shown as sensible climates. The elements used for air pollution are visibility, sulfur dioxide, suspended particles and soon.In Japan climate is largely classified into three zones, that is Pacific seaside, Japan seaside and south-western islands. In each zones there had been reasonable and unique living styles and conditions, however recent rapid and similar urbanization causes to equalize human life almost all over Japan. Each local region has its own physical, historical and social environment. It is requisite to consider these environment, that is “Fuu-Sui-Do” (wind-water-soil). It is a amenity city.
Yaron, Yaakov.1998. The influence of small urban park on climatical parameters a case study of Gan-Meir, Tel Aviv. Proceed. IGU Commission of Climatology, Evora 1998, 3-4
GUC ML
ABSTRACT. Dense areas of vegetation influence climatic parameters of surrounding areas, as they reduce radiation, lower temperatures, raise humidity and reduce wind speed. This influence is reduced relative to the distance from the vegetation, defined by Oke as the “Clotheslines-Effect” This effect is important in urban areas where an “Urban Heat Island” develops, which raises temperatures, reduces humidity and increases heat stress during summer time. The aim of this research is to examine the influence of small urban park on climatic parameters, in the built-up area around the park. The research took place in Gan-Meir, a small urban park, in the centre of the city of Tel –Aviv. The site was chosen according to the following criteria. Previous research examining the urban climate of Tel-Aviv showed that in Tel-Aviv an urban heat island also develops during the afternoon in
164

the summertime. Thermal mapping based on the satellite imagery, facilitated by the Interdisciplinary Center for Technological Analysis and Forecasting at Tel-Aviv in one of the hottest areas in the city. Thus measurements in Gan-Meir should represent the maximal influence of a garden on the city climate. The research focuses on two aspects. The Climatic Change in the garden itself caused by vegetation, and the spatial influence of the park on the surrounding urban area. The results of the measurements reinforce the previous assumptions: In the centre of the garden a “Cool Island” developed during the daytime, the cool island, located on the southern side of park, is the result of the combined influence of tree density and quality, and the influence of shade caused by the buildings south of the park. At night the “Cool Island” is located west of the park centre, due to a slight easterly breeze. The spatial park influence is significant only up to a distance of a few meters. The temperature difference measured from the park centre to the built-up area were up to 3°C, and relative humidity differences were up to 20%.
Yazgan, M.E.; Baris, E.; Sahin, K. and Dayioglu, M.A.1998. The importance of open and green areas on urban climate and air quality in Ankara, Turkey. Proceed. IGU Commission of Climatology. Evora 1998.
GUC ML
ABSTRACT. This paper concentrates on the importance of open and green areas with regard to the urban climate and air quality in Ankara city. The meteorological data from the central station with the data from adjacent stations. The air quality of the city is also examined seasonally by considering the existing measurements of the main air pollutants.Open and green areas are indispensable design elements of contemporary cities with their both functional and also visual effects. Today, in many cities of the world where the problem of air pollution exists the importance of the functional effects of open and green areas on the improvement of the urban climate and air quality is understood.Ankara is a city which has a very serious air pollution problem from temperature inversion as a result of very propitious weather conditions and city morphology. Therefore the climate and air quality are the essential parameters to evaluate in urban development plans. On the other hand, to be able to solve the existing air pollution problem, the improvement of the open and green area system is required.The results of this paper and accordingly produced maps will build up some of the essential data to be used for urban development and renovation plans which consider the improvement of the urban climate and air quality.
SUBJECT/REGION GU HL ML ST T TOTALPhMUC 23 1 15 5 0 44
EUC 1 0 2 1 2 6
165

GUC 6 5 61 5 10 87PhUC 10 0 6 0 2 18QUA 1 1 35 8 8 53RSUC 4 0 5 1 1 11UBCL 3 1 8 3 1 16
UH 2 0 1 0 0 3UP 4 2 3 1 1 11
TOTAL 54 10 136 24 25 249
Subjects:
PhMUC - Physical modeling urban climateEUC Energy consumption and urban climateGUC General, descriptive urban climate e.g. description of near surface
Fields of temperature, wind, rainfall, humidity, etc.PhUC Physical urban climateQUA Quality of urban atmosphereRSUC Remote sensing and urban climateUBCL Urban bioclimatologyUH Urban hydrologyUP Urban planning
REGIONS:
GU GEOGRAPHICALLY UNSPECIFIEDHL HIGH LATITUDESML MIDDLE LATITUDESST SUBTROPICALT TROPICAL
166


![Takeshi Amemiya-Advanced Econometrics[1]](https://img.pdfslide.us/doc/110x75/543b86b9afaf9fe7568b4999/takeshi-amemiya-advanced-econometrics1.jpg)