Embed Size (px)
Citation preview
Katrina, Sandy, and Deepwater Horizon: Lessons Thrice-Learned
Session 3: Lessons Learned from Setting up Population Monitoring Registries
Jonathan Sury, MPH CPH3/12/19
Approach
• Post-disaster Cohorts (3x)• What we did• What we learned• What we would do differently
• Perspective from a small academic research shop who has worked with multiple collaborators and other academic institutions
• Personal perspective of a regular staff (ie not a Principal Investigator)
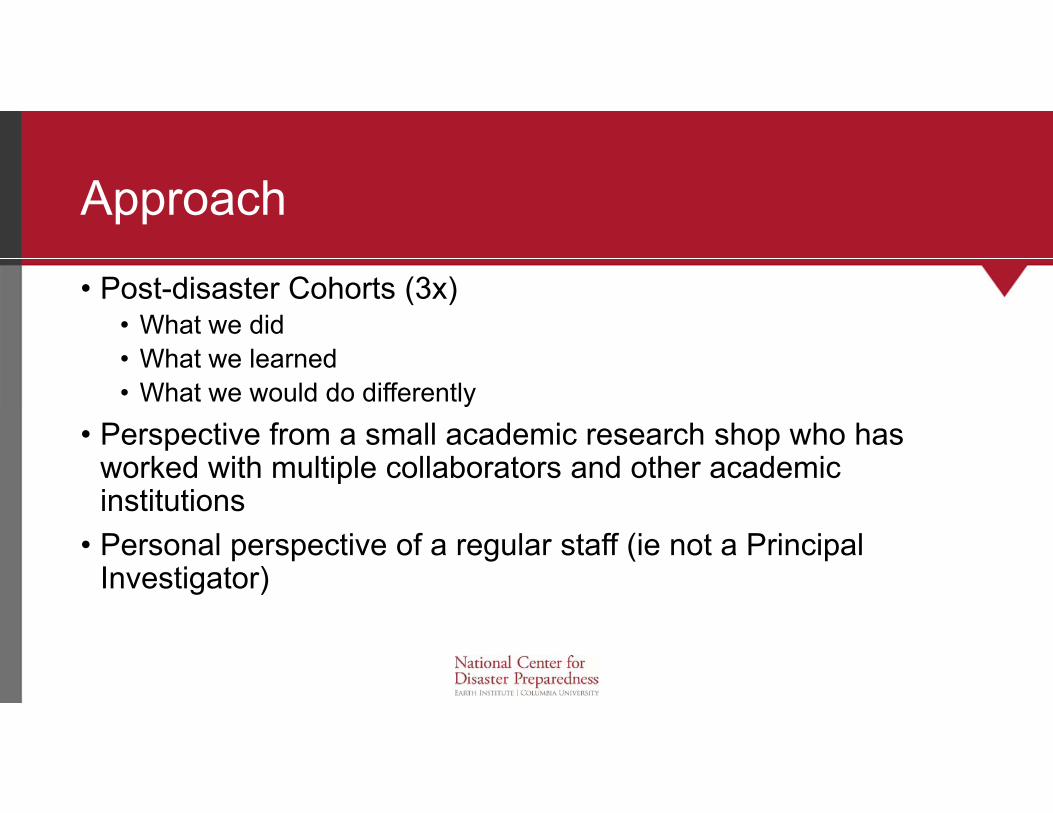
Cohorts Overview1. Gulf Coast Child & Family Health Study (G-CAFH)
• Observational Cohort Post-Katrina – 5 waves completed*• Event: August 2005• Baseline: February 2006 (LA) & August 2006 (MS)
2. Sandy Child & Family Health Study (S-CAFH)• Observational Cohort Post-Superstorm Sandy - 2 waves completed• Event: October 2012• Baseline: August 2014 - May 2015
3. Gulf Coast Population Impact (GCPI) / Resilient Children Youth & Communities Project (RCYC)• Cross-sectional Survey → Cohort Study – 3 waves completed• Event: April 2010• Baseline: April – October 2012
General Study Objectives: All three cohorts• Create representative (either population or highly exposed)
population-based cohorts to follow over time• Examine how direct or indirect exposure may affect the physical
and mental health of a household, particularly those with children (based on the socio-ecological model of recovery)
• Explore the event itself from the perspective of the individual or household
G-CAFHPost-Katrina Cohort Study
G-CAFH: Sampling Methodology• Multi-stage cluster sampling (by size, type, state)
• Louisiana: random selection of congregate settings by type and number of residential units (FEMA trailer parks, FEMA trailers in commercial parks, hotels)
• Mississippi: random selection of congregate settings (FEMA trailer parks, FEMA trailers in commercial parks), FEMA-designated census blocks (moderately to extensively damaged)
• 1,079 households in Louisiana and Mississippi recruited within one year of Hurricane Katrina
• Sample representative of 60,000 to 100,000 displaced and/or heavily-impacted Katrina survivors
• Face-to-face interviews
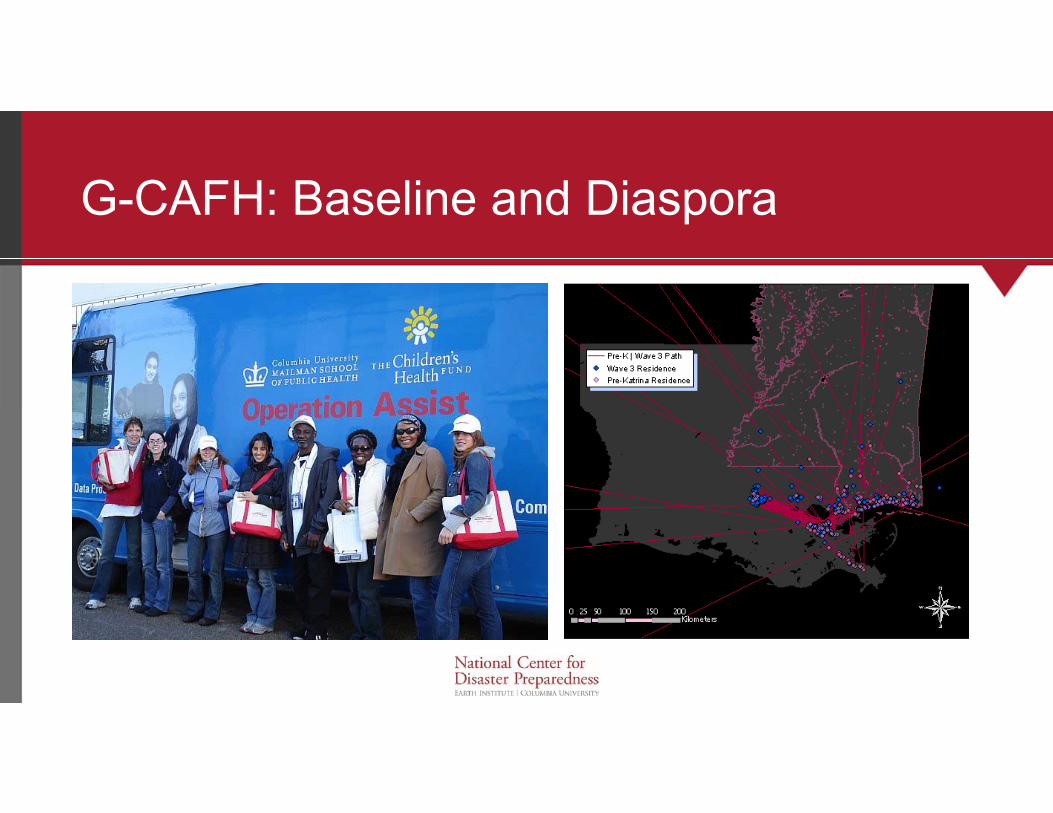
G-CAFH: Baseline and Diaspora
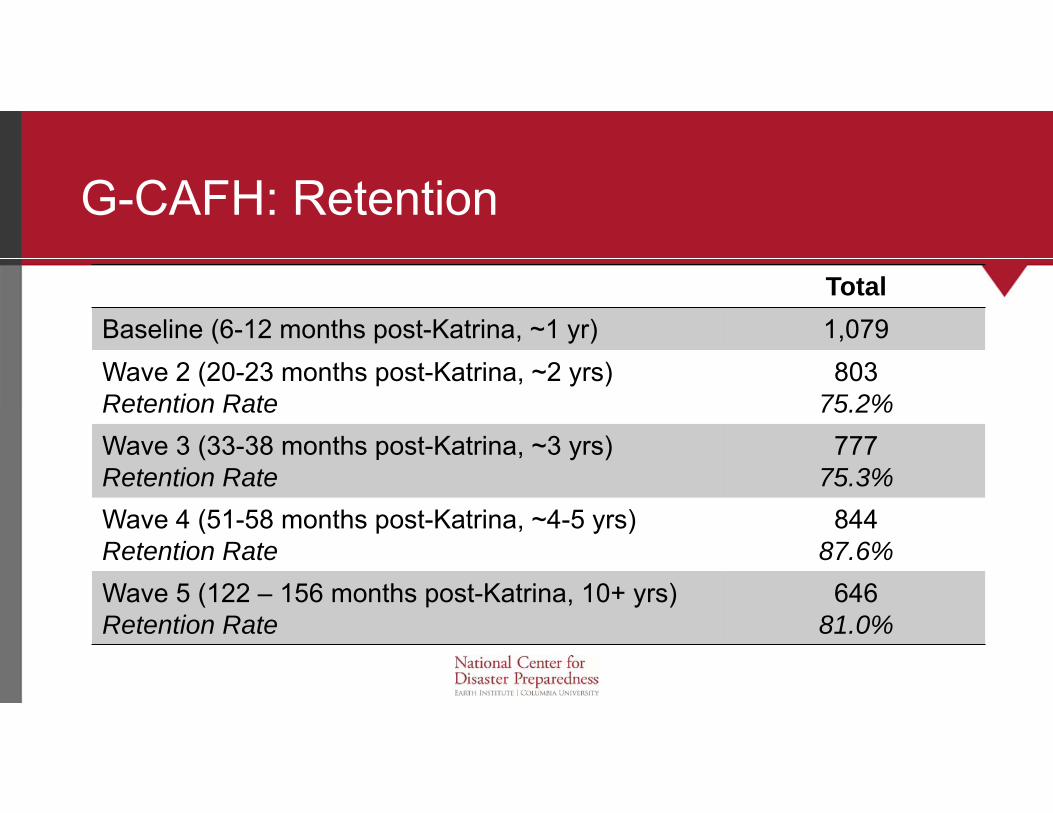
G-CAFH: Retention
TotalBaseline (6-12 months post-Katrina, ~1 yr) 1,079Wave 2 (20-23 months post-Katrina, ~2 yrs)Retention Rate
80375.2%
Wave 3 (33-38 months post-Katrina, ~3 yrs)Retention Rate
77775.3%
Wave 4 (51-58 months post-Katrina, ~4-5 yrs)Retention Rate
84487.6%
Wave 5 (122 – 156 months post-Katrina, 10+ yrs)Retention Rate
64681.0%
S-CAFHPost-Superstorm Sandy Cohort Study
S-CAFH: Objectives• A random multi-stage cluster sample of 1,000 residents living in
or near the coastal areas of New Jersey most directly exposed to the storm.
• Assess the health and well-being of affected population and socio-economic impact on households on the nine most affected counties in the state based on FEMA MOTF Impact Analysis
• This cohort is statistically representative of the 1 million New Jersey residents who were living in those geographic areas of the state most exposed to the storm, the Disaster Footprint
• Household survey with phone interview follow-up
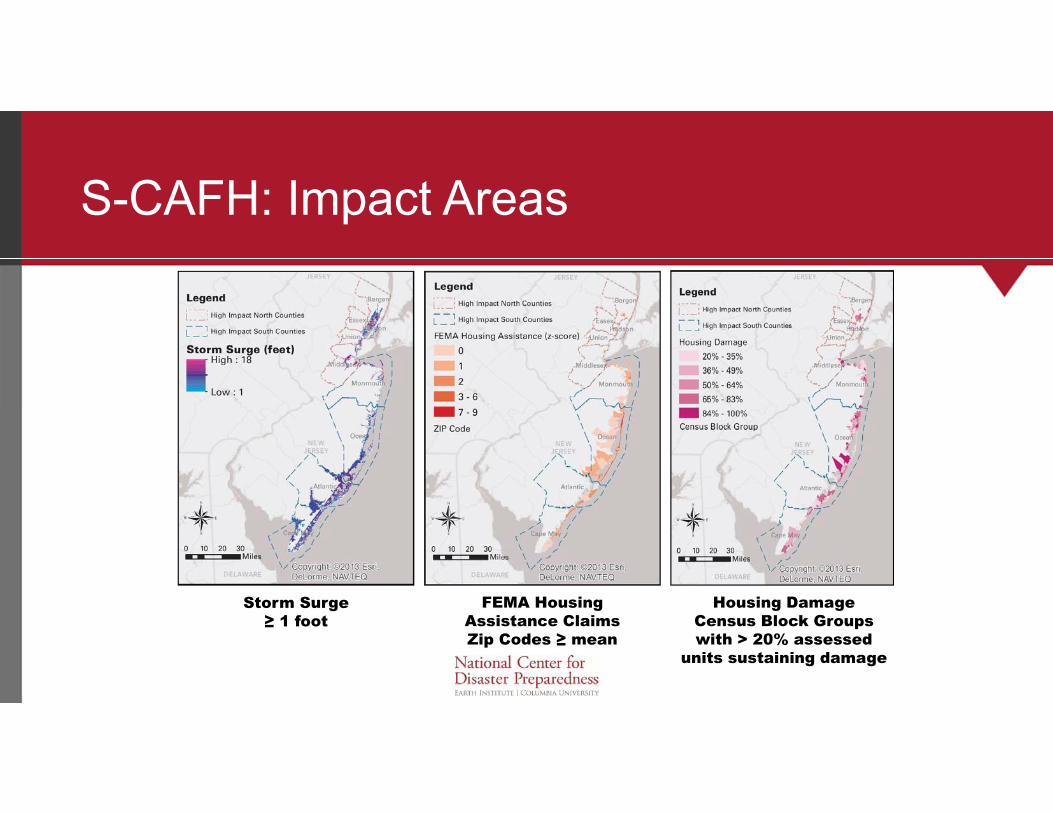
S-CAFH: Impact Areas
Storm Surge≥ 1 foot
FEMA Housing Assistance ClaimsZip Codes ≥ mean
Housing DamageCensus Block Groups with > 20% assessed
units sustaining damage
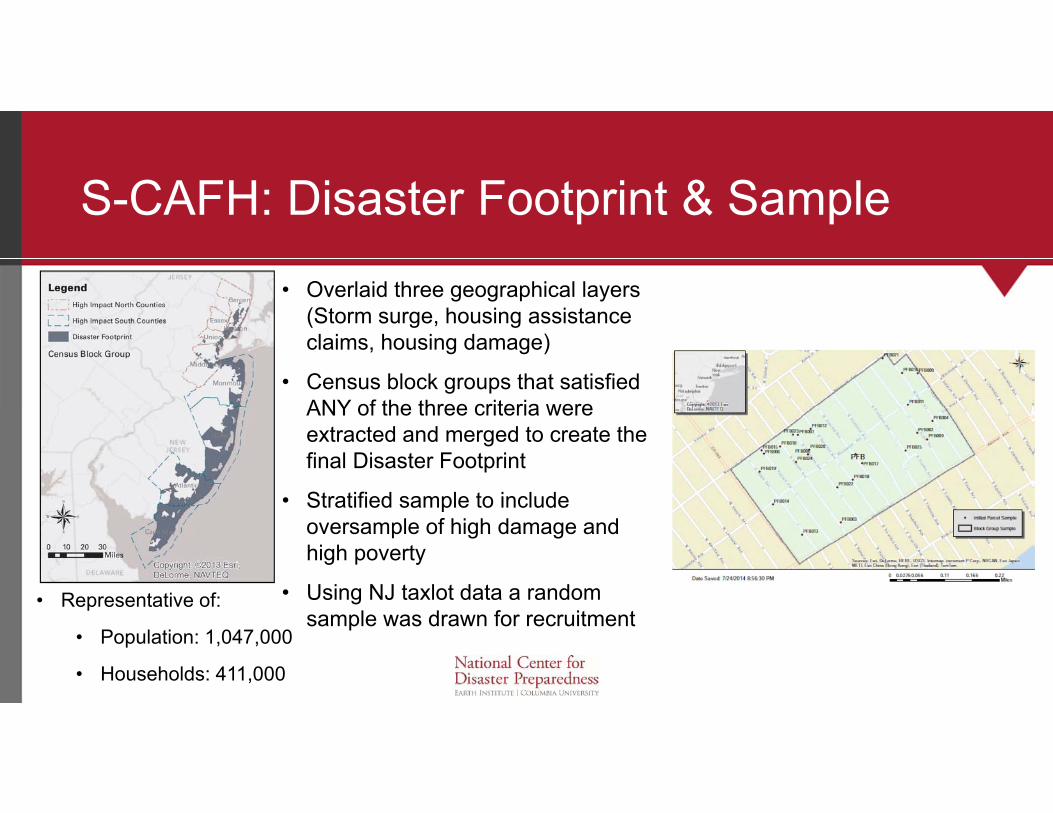
S-CAFH: Disaster Footprint & Sample
• Overlaid three geographical layers (Storm surge, housing assistance claims, housing damage)
• Census block groups that satisfied ANY of the three criteria were extracted and merged to create the final Disaster Footprint
• Stratified sample to include oversample of high damage and high poverty
• Using NJ taxlot data a random sample was drawn for recruitment
• Representative of:
• Population: 1,047,000
• Households: 411,000
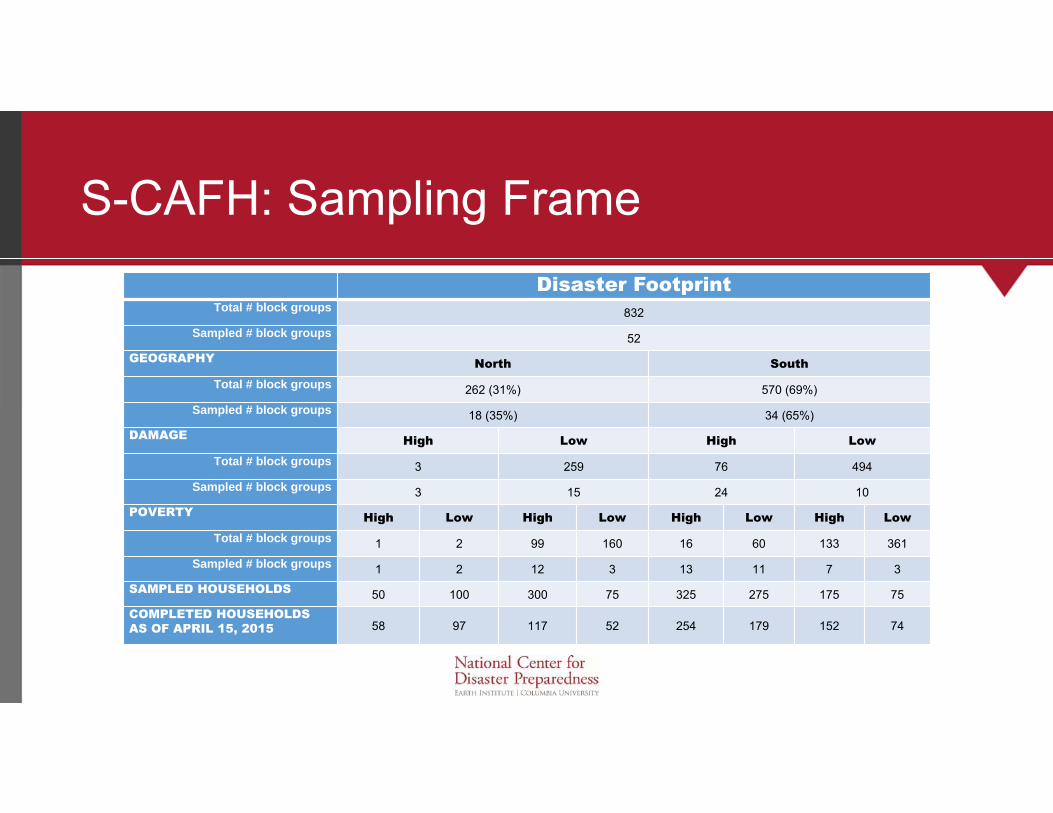
S-CAFH: Sampling FrameDisaster Footprint
Total # block groups 832
Sampled # block groups 52GEOGRAPHY North South
Total # block groups 262 (31%) 570 (69%)Sampled # block groups 18 (35%) 34 (65%)
DAMAGE High Low High LowTotal # block groups 3 259 76 494
Sampled # block groups 3 15 24 10POVERTY High Low High Low High Low High Low
Total # block groups 1 2 99 160 16 60 133 361Sampled # block groups 1 2 12 3 13 11 7 3
SAMPLED HOUSEHOLDS 50 100 300 75 325 275 175 75COMPLETED HOUSEHOLDS AS OF APRIL 15, 2015 58 97 117 52 254 179 152 74
GCPI/RCYCPost-Deepwater Horizon Oil Spill Cohort
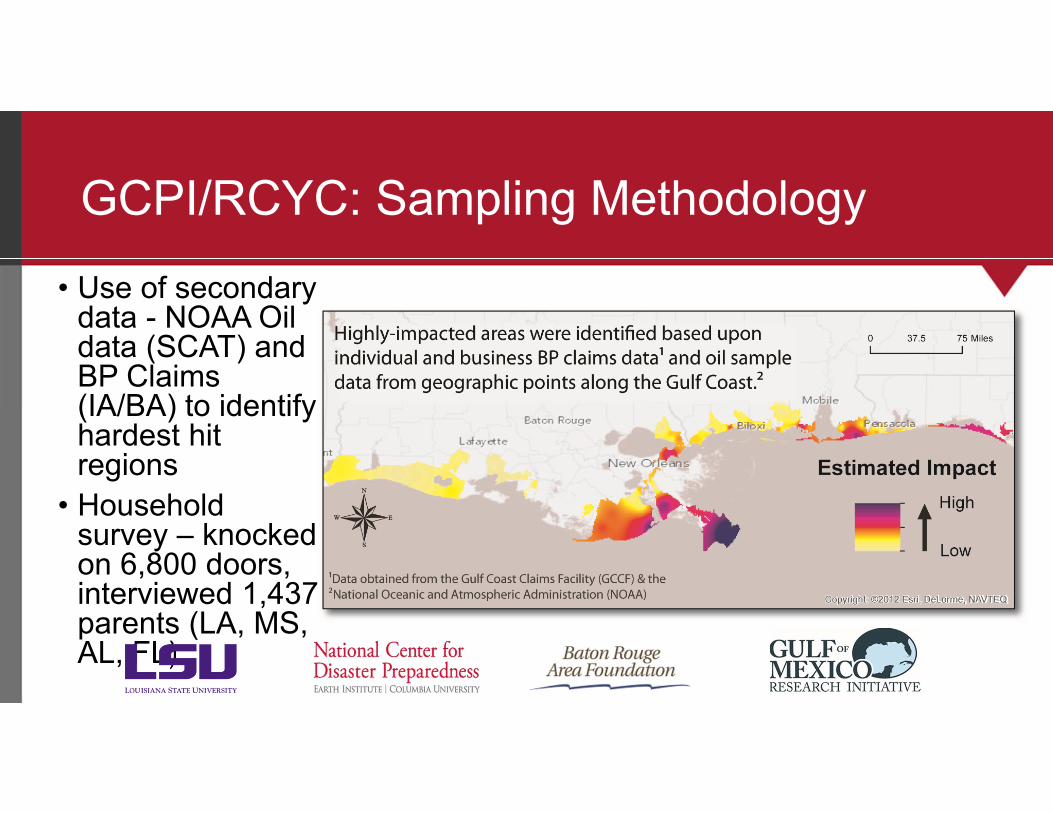
GCPI/RCYC: Sampling Methodology
• Use of secondary data - NOAA Oil data (SCAT) and BP Claims (IA/BA) to identify hardest hit regions
• Household survey – knocked on 6,800 doors, interviewed 1,437 parents (LA, MS, AL, FL)
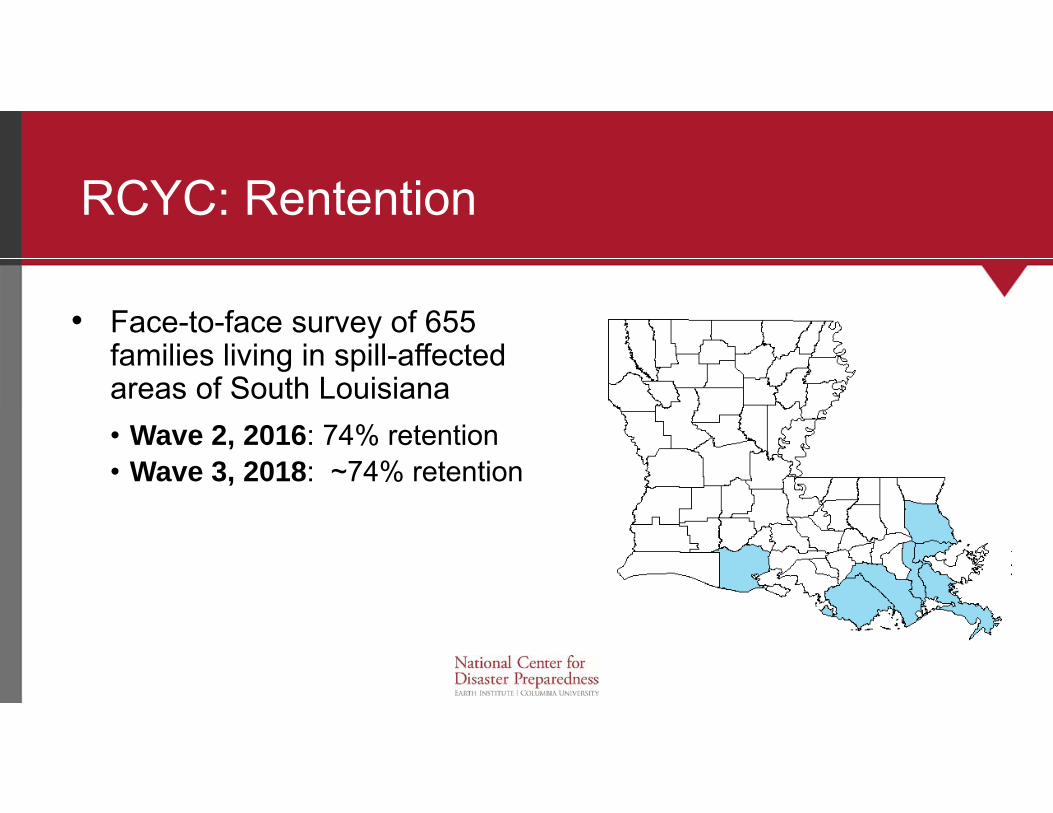
RCYC: Rentention
• Face-to-face survey of 655families living in spill-affected areas of South Louisiana• Wave 2, 2016: 74% retention• Wave 3, 2018: ~74% retention
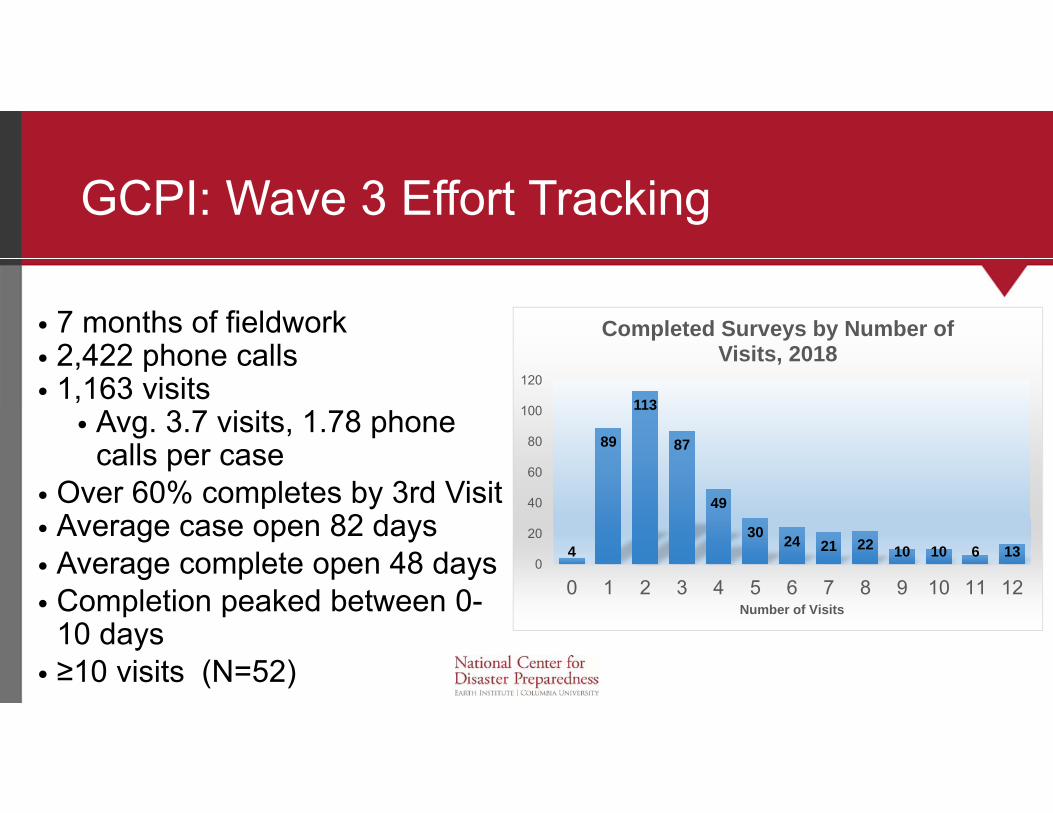
GCPI: Wave 3 Effort Tracking
4
89
113
87
49
30 24 21 22 10 10 6 130
20
40
60
80
100
120
0 1 2 3 4 5 6 7 8 9 10 11 12Number of Visits
Completed Surveys by Number of Visits, 2018
• 7 months of fieldwork• 2,422 phone calls• 1,163 visits
• Avg. 3.7 visits, 1.78 phone calls per case
• Over 60% completes by 3rd Visit• Average case open 82 days• Average complete open 48 days• Completion peaked between 0-
10 days• ≥10 visits (N=52)
ConsiderationsRecommendations and key questions based on learnings from three cohort studies
Considerations: Data Storage & Management• Mobile technology landscape continues to evolve• Spatial data to aid sampling are not always readily available post-incident, may
require significant processing and technical skill• Governmental agencies will have better access than others• Consider building partnerships and developing data use agreements pre-event• Spatial mismatch may introduce some sampling error (ie zip code + county + other)• Explore proxy data (eg cell phone data to locate a mobile population)
• Real-time + inter-wave data cleaning and management• DOCUMENTATION - Implement organizational best practices for file system
management and documentation from previous and ongoing projects to create a best practice culture
• Pre-identify and learn platforms to build a database as quickly as possible - not just platforms but also various technologies and staff skillsets
• Consider need for offline data access for field teams
Considerations: Population Access & Sampling Methods• For exposed populations…
• Most geographic data have administrative boundaries which may not be granular enough for to focus on a target population
• Limitations in the speed of data availability• Literal access: gated communities and public housing
• Develop strategies to identify key local stakeholders, community gatekeepers, and partners to bolster credibility and trustworthiness
• Consider the ephemerality of your data – will drive urgency• Compile possible recruitment sources from existing registries or
lists and develop data use/sharing agreements in advance of an event
Considerations: Administrative & Operational• Incentive Management
• Assess institutional capability and guidelines on incentive management (especially IRB)
• Consider pre-drafted IRB templates and protocols for rapid deployment
• Field team management• Determine protocols for hiring students (paid or un-paid) and
contractors• Draft Job Actions Sheets to assist in rapid Just-in-time training
• Face-to-face surveys are expensive – pursue long-term funding if possible
Considerations: Customer Service/CRM
• Incentives and incentive amounts DO make a positive impact on response rates
• Build into project budgets and ensure internal protocols for administrative management and tracking
• Reported addresses and USPS data do not always match• Return service requested can be valuable but not reliable particularly in
rural areas• Ties back to data management and on-going staffing
Considerations: Customer Service
• Respondents should be valued for their time, energy, and experiences
• Communicate research findings back to them in plain language and with clear graphics that are both culturally appropriate
• Provide a single point of contact via phone AND via e-mail• Schedule regular correspondence to provide updated contact
information• Consider staff time to collect and update records internally
• Train field staff to be courteous, understanding, and when to walk away• Implement robust quality control and assurance protocols –
protects the integrity of the data and institutional time
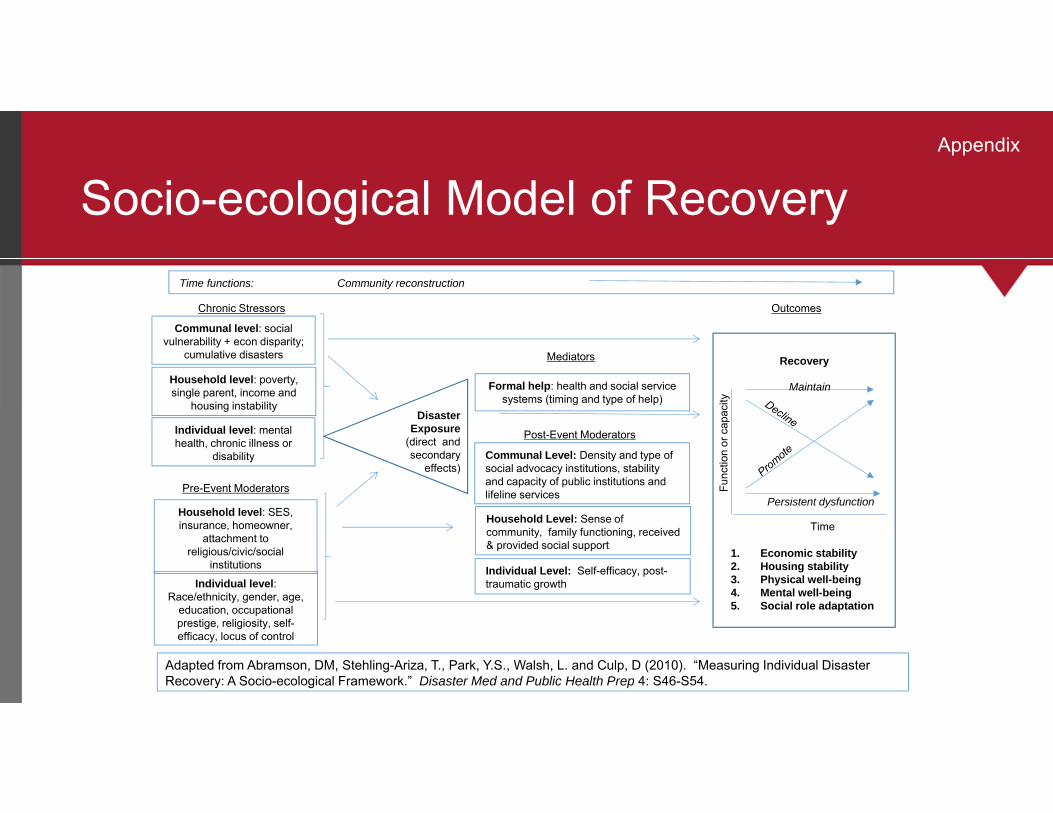
Socio-ecological Model of Recovery
Chronic Stressors
Mediators
Outcomes
Household level: poverty, single parent, income and
housing instability
Individual level: mental health, chronic illness or
disability
Pre-Event Moderators
Disaster Exposure
(direct and secondary
effects)
Formal help: health and social service systems (timing and type of help)
Household level: SES, insurance, homeowner,
attachment to religious/civic/social
institutions
Individual level: Race/ethnicity, gender, age,
education, occupational prestige, religiosity, self-efficacy, locus of control
Communal level: social vulnerability + econ disparity;
cumulative disasters
Household Level: Sense of community, family functioning, received & provided social support
Post-Event Moderators
Time functions: Community reconstruction
Individual Level: Self-efficacy, post-traumatic growth
Time
Func
tion
or c
apac
ity
Maintain
Persistent dysfunction
Recovery
1. Economic stability2. Housing stability3. Physical well-being4. Mental well-being5. Social role adaptation
Communal Level: Density and type of social advocacy institutions, stability and capacity of public institutions and lifeline services
Adapted from Abramson, DM, Stehling-Ariza, T., Park, Y.S., Walsh, L. and Culp, D (2010). “Measuring Individual Disaster Recovery: A Socio-ecological Framework.” Disaster Med and Public Health Prep 4: S46-S54.
Appendix
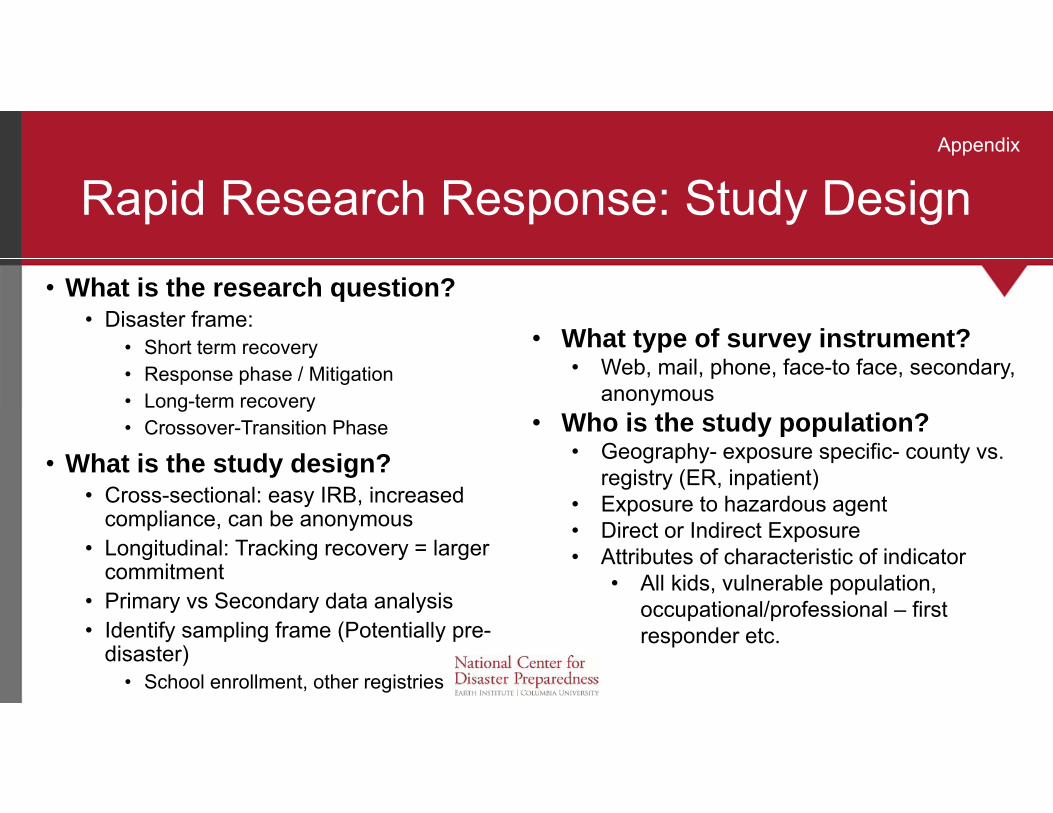
Rapid Research Response: Study Design
• What is the research question?• Disaster frame:
• Short term recovery• Response phase / Mitigation• Long-term recovery• Crossover-Transition Phase
• What is the study design?• Cross-sectional: easy IRB, increased
compliance, can be anonymous • Longitudinal: Tracking recovery = larger
commitment • Primary vs Secondary data analysis• Identify sampling frame (Potentially pre-
disaster)• School enrollment, other registries
25
• What type of survey instrument? • Web, mail, phone, face-to face, secondary,
anonymous• Who is the study population?
• Geography- exposure specific- county vs. registry (ER, inpatient)
• Exposure to hazardous agent• Direct or Indirect Exposure• Attributes of characteristic of indicator
• All kids, vulnerable population, occupational/professional – first responder etc.
Appendix
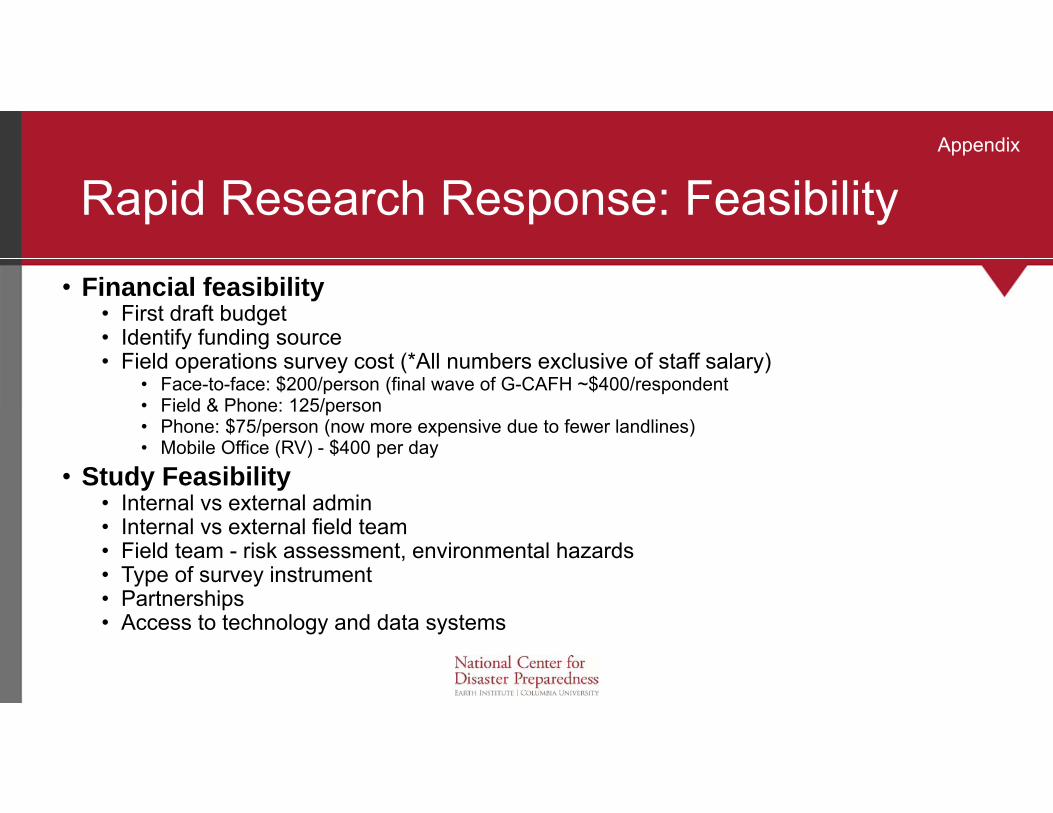
Rapid Research Response: Feasibility
• Financial feasibility• First draft budget• Identify funding source• Field operations survey cost (*All numbers exclusive of staff salary)
• Face-to-face: $200/person (final wave of G-CAFH ~$400/respondent• Field & Phone: 125/person• Phone: $75/person (now more expensive due to fewer landlines)• Mobile Office (RV) - $400 per day
• Study Feasibility• Internal vs external admin • Internal vs external field team• Field team - risk assessment, environmental hazards• Type of survey instrument• Partnerships• Access to technology and data systems 26
Appendix
Acknowledgements
• Irwin Redlener, MD• David Abramson, PhD MPH• Jaishree Beedasy, PhD• Tim Slack, PhD• Kathryn Keating, LMSW• NCDP, NYU, LSU, Rutgers Research Teams• Countless Interviewers• Respondents