Embed Size (px)
Citation preview
Karl V. Lins, Henri Servaes, Ane Tamayo
Social capital, trust, and firm performance: the value of corporate social responsibility during the financial crisis Article (Accepted version) (Refereed)
Original citation: Lins, Karl V., Servaes, Henri and Tamayo, Ane (2017) Social capital, trust, and firm performance: the value of corporate social responsibility during the financial crisis. The Journal of Finance . ISSN 0022-1082 DOI: 10.1111/jofi.12505 © 2017 The American Finance Association This version available at: http://eprints.lse.ac.uk/68059/ Available in LSE Research Online: June 2017 LSE has developed LSE Research Online so that users may access research output of the School. Copyright © and Moral Rights for the papers on this site are retained by the individual authors and/or other copyright owners. Users may download and/or print one copy of any article(s) in LSE Research Online to facilitate their private study or for non-commercial research. You may not engage in further distribution of the material or use it for any profit-making activities or any commercial gain. You may freely distribute the URL (http://eprints.lse.ac.uk) of the LSE Research Online website. This document is the author’s final accepted version of the journal article. There may be differences between this version and the published version. You are advised to consult the publisher’s version if you wish to cite from it.
Forthcoming, Journal of Finance
Social Capital, Trust, and Firm Performance:
The Value of Corporate Social Responsibility during the Financial Crisis*
Karl V. Lins
University of Utah
Henri Servaes
London Business School, CEPR, and ECGI
Ane Tamayo
London School of Economics
October 3, 2016
During the 2008-2009 financial crisis, firms with high social capital, measured as corporate social
responsibility (CSR) intensity, had stock returns that were four to seven percentage points higher than
firms with low social capital. High-CSR firms also experienced higher profitability, growth, and sales per
employee relative to low-CSR firms, and they raised more debt. This evidence suggests that the trust
between the firm and both its stakeholders and investors, built through investments in social capital, pays
off when the overall level of trust in corporations and markets suffers a negative shock.
_____________ * We would like to thank Taylor Begley, Colin Clubb, Joao Cocco, Mike Cooper, James Dow, Alex Edmans, Christopher
Hennessy, Ioannis Ioannou, Ralph Koijen, Jean-Marie Meier, Yuval Millo, Michael Roberts (the editor), Kelly Shue, Rui
Silva, Hannes Wagner, Yao Zeng, an anonymous Associate Editor, an anonymous referee, and seminar participants at City
University, Erasmus University, ESSEC, HEC Paris, INSEAD, King’s College, London Business School, London School of
Economics, Tilburg University, University of Bristol, University of Edinburgh, University of Leicester, University of
Melbourne, University of New South Wales, University of Southampton, University of Sydney, WHU Otto Beisheim, the
French Finance Association, London Business School Summer Finance Symposium, the International Accounting Research
Symposium at the Fundación Ramón Areces, the International Corporate Governance Conference at Hong Kong Baptist
University, and the University of Cambridge Financial Accounting Symposium for helpful comments and discussions, and
the ECGI for the 2016 Standard Life Investments Finance Working Paper Prize. Dimas Fazio provided excellent research
assistance.
1
“The present financial crisis springs from a catastrophic collapse in confidence … Financial markets hinge on
trust, and that trust has eroded.” (Joseph Stiglitz, 2008)
“The fundamental problem isn’t lack of capital. It’s lack of trust. And without trust, Wall Street might as well
fold up its fancy tents.” (Former U.S. Labor Secretary Robert Reich, 2008)
“The global financial and economic crisis has done a lot of harm to the public trust in the institutions, the
principles and the concept itself of the market economy.” (OECD Secretary General Angel Gurria, 2009).
“Something important was destroyed in the last few months of 2008. It is an asset crucial to production, even if
it is not made of bricks and mortar… This asset is trust.” (Paolo Sapienza and Luigi Zingales, 2012)
The financial crisis highlighted the importance of trust for well-functioning markets and financial stability, but
discussions on the role of trust and, more generally, social capital in economic life are not new. Already in 1972,
Arrow argued that “virtually every economic transaction has within itself an element of trust”, and suggested
that much of the economic backwardness in the world might be due to the lack of mutual confidence.
Following this theme, Putnam (1993) shows that higher social capital societies, in which trust is greater, display
higher economic development (see also, Fukuyama (1995), La Porta, et al. (1997), and Knack and Keefer
(1997)). Focusing on capital markets, Guiso, Sapienza, and Zingales (2004, 2008) document that trust derived
from greater social capital allows for more stock market participation. These studies, and related work,
demonstrate the importance of social capital and trust from a macroeconomic perspective. However, the extent
to which social capital and trust impact firm performance is a relatively unexplored area in the literature. The
objective of this paper is to address this question.
Empirical identification of the effect of trust and, more generally, social capital on firm performance is
challenging, however. First, social capital is a broadly defined concept, often encompassing trust and
cooperative norms (e.g., Scrivens and Smith (2013)), and, hence, measuring it is not straightforward. Second,
without exogenous variation in firm-level social capital it is difficult to attribute changes in performance to
changes in social capital.
To address the first challenge, we focus on a firm’s Corporate Social Responsibility (CSR) activities as a
measure of its social capital, following recent work in economics (Sacconi and Degli Antoni (2011)) suggesting
2
that a firm’s CSR activities are a good proxy for its social capital, and also the widespread view among
practitioners and corporations that a firm’s CSR activities generate social capital and trust.1
To address the second challenge, we employ the 2008-2009 financial crisis, a period when public trust in
corporations, capital markets, and institutions unexpectedly declined.2 If a firm’s social capital helps build
stakeholder trust and cooperation (Putnam (1993)), it should pay off when being trustworthy is more valued,
such as in an unexpectedly low-trust period. From a shareholder perspective, if high-social-capital firms are
perceived as being more trustworthy, investors may place a valuation premium on such firms when overall trust
in companies is low (see Guiso, Sapienza, and Zingales (2008)), such as in the 2008-2009 financial crisis. From
a stakeholder perspective, the reciprocity concept often discussed in studies of social capital (i.e., the idea that “I
will be good to you because I believe you will be good to me at some point in the future”) suggests that
stakeholders (e.g., employees, customers, suppliers, and the community at large) are more likely to help high-
social-capital firms weather a shock, given that such firms displayed greater attention to, and cooperation with,
stakeholders in the past.
To test whether firm-level social capital pays off during a crisis of trust, we examine the performance of
a sample of 1,673 non-financial firms with CSR data available on the MSCI ESG Stats database (formerly
known as KLD) over the August 2008-March 2009 financial crisis period. In regressions that control for a wide
variety of factors and firm characteristics (including governance and transparency), we find that firms that
entered the crisis period with high CSR ratings have significantly higher (between four and seven percentage
points) crisis-period stock returns than those that entered it with low CSR ratings. The economic importance of
social capital in explaining stock returns is at least half as large as the effect of cash holdings and leverage,
financial variables that have been shown to affect crisis period returns (Duchin, Ozbas, and Sensoy (2010) and
1 Following the financial crisis, many corporations have emphasized the importance of a firm’s social capital, driven by its
CSR investments, in rebuilding stakeholder trust. However, the practitioner view that CSR helps build trust predates the
financial crisis (Fitzgerald (2003)). 2 The notion that the crisis led to a decline in public trust in corporations has been corroborated by surveys, such as the
Edelman Trust Barometer 2009, which shows that 62% of respondents, from a twenty-country survey, had lower trust in
corporations in the aftermath of the financial crisis (for the respondents from the U.S., this figure is 77%).
3
Almeida, et al. (2012)). This result stresses the importance of expanding the focus beyond financial capital when
attempting to understand the drivers of firm-level performance during a crisis of trust.
To alleviate concerns that the stock market outperformance we observe is due to something else rather
than a shock to trust, we conduct three further tests. First, we investigate the association between CSR and stock
returns during the Enron/Worldcom crisis of the early 2000s, a period in which widespread revelation of fraud
served to undermine investor confidence in the U.S. stock market. We find that high-CSR firms also earned
excess returns relative to low-CSR firms during this period. Second, we investigate whether our results are
driven by the decline in the supply of credit that firms endured during the financial crisis, rather than by a
decline in market-wide trust. To do so, we test whether CSR is related to stock returns in the period July 2007
through July 2008, when there was a shock to the credit supply but no shock to the importance of trust. We find
no significant relation between CSR and stock returns during this earlier period of the crisis. Third, we study
whether the relation between CSR and crisis-period returns is stronger in high-trust regions, as identified in the
2006 General Social Survey. We find that this is indeed the case.
It is, of course, possible that high-CSR firms also outperform low-CSR firms during non-crisis periods
(see also Edmans (2011)). To assess this possibility, we examine whether the superior performance of high-CSR
firms extends to periods of economic growth or economic recovery using firm fixed effects models that test the
relation between CSR and firm performance before, during, and after the crisis. These models show that CSR
has a positive impact on returns only during the crisis period, and that this effect is not due to time-invariant
unobservable firm characteristics.
We next seek to identify the mechanisms behind the outperformance of high-CSR firms by examining
the profitability and productivity of firms as well as their capital raising during the crisis. We find that high-CSR
firms have higher profitability and gross margins, and experience higher sales growth than other firms during the
crisis. They also have higher sales per employee and are able to raise more debt. These results are consistent
with a stakeholder and investor commitment to help out firms deemed to be more trustworthy during the crisis.
Collectively, the results showing that investors assign a premium to high-CSR firms during a crisis of
trust and that real effects take place at the firm level during this time provide evidence that greater social capital
4
maps into higher returns at the microeconomic level. From a firm’s perspective, our results indicate that the
benefits which accrue to firms that build their social capital through CSR activities outweigh the costs of these
activities when trust declines unexpectedly. As such, the building of social capital can be thought of as an
insurance policy which pays off when investors and the economy at large face a severe crisis of confidence and
when the reward for being identifiably trustworthy markedly increases. Our results indicate an enhanced
insurance benefit to CSR that goes beyond the notion that CSR acts as insurance against idiosyncratic firm-
specific legal risk (see, e.g., Godfrey, Merrill, and Hansen (2009), Minor (2015), and Hong and Liskovich
(2016)).
While our research focus is on the impact of social capital on firm performance during a shock to trust,
our study allows us to sidestep typical endogeneity concerns that make it difficult to identify whether CSR
activities impact firm value, despite much research on this issue.3 In our natural experiment, the exogenous
financial shock disrupts the equilibrium, while levels of corporate social responsibility remain fixed, at least in
the short term. This allows us to directly observe how investors adjust their valuations of firms with differing
attitudes toward corporate social responsibility. Thus, this paper also makes a contribution to the literature
investigating whether CSR is value-enhancing for shareholders. We recognize, however, that we do not have
exogenous variation in the levels of CSR, thereby limiting the inferences we can draw about the impact of CSR
on performance during normal times.
The remainder of the paper is structured as follows. Section I discusses in more detail the theoretical
motivation behind our proxies and tests. Section II discusses our data and summary statistics. In Section III, we
analyze whether CSR ratings impact stock returns during the crisis and conduct robustness tests. In Section IV,
we investigate several mechanisms that may explain the excess performance of high-CSR firms. Section V
concludes the paper.
3 While much of the literature described thus far suggests that shareholders can derive value from CSR investments, another
strand of the literature argues that CSR investments could stem from agency conflicts between managers and shareholders
(see, e.g., Cheng, Hong and Shue (2016) for evidence that supports the agency view and Ferrell, Liang, and Renneboog
(2016) and Albuquerque, Durnev, and Koskinen (2015) for evidence that does not). Margolis, Elfenbein, and Walsh (2009)
and Kitzmueller and Shimshack (2012) provide surveys of the CSR literature.
5
I. Trust, Social Capital, and Corporate Social Responsibility
A. Trust and Social Capital
Over the last twenty years, the terms “social capital” and “trust” have become increasingly popular in
the economics and finance literature (Putnam (1993, 2000), Knack and Keefer (1997), La Porta et al. (1997),
Guiso, Sapienza, and Zingales (2004, 2008)).4 Often used indistinctly, both concepts are somewhat abstract,
although social capital is arguably the hardest one to define due to its multidimensional nature.
Trust is often understood as “the expectation that another person (or institution) will perform actions that
are beneficial, or at least not detrimental, to us regardless of our capacity to monitor those actions…so that we
will consider cooperating with him (the institution).” (Sapienza and Zingales (2012), based on Gambetta (1988)).
This definition highlights the probabilistic nature of trust (e.g., Gambetta (1988)), the concept of cooperation
(e.g., Fukuyama (1995) and La Porta et al. (1997)), and the inability to monitor others’ actions ex-ante (e.g.,
Dasgupta (1988)).5
Social capital is a broader concept. For example, Putnam (1993, 2000) views social capital as “the
propensity of people in a society to cooperate to produce socially efficient outcomes” (La Porta, et al. (1997))
and highlights “the norms of reciprocity and trustworthiness” that arise from connections among individuals. A
recent OECD paper (Scrivens and Smith (2013)) provides a decomposition of social capital into four
dimensions, with the intent of facilitating the development of empirical measures: (i) personal relationships; (ii)
social network support; (iii) civic engagement; and (iv) trust and cooperative norms.6 The notion of social
capital we explore, like much of the work in economics and finance (e.g., Putnam (1993, 2000), Fukuyama
(1995), Knack and Keefer (1997), La Porta et al. (1997), Guiso, Sapienza, and Zingales (2004, 2008)), is mostly
related to the last two interpretations of the OECD.
4 For recent theoretical work on the origins of trust, see Carlin, Dorobantu, and Viswanathan (2009).
5 The concept of trust is also related to the concept of integrity put forward in recent work by Erhard, Jensen, and Saffron
(2009) and Erhard and Jensen (2015), who argue that trust follows from a proactive stance to establish integrity – the
process of honoring one’s word on commitments made to a variety of constituents consistently. 6 The first two interpretations of social capital are often used in sociology and present social capital as a resource for
individuals built through networks (e.g., Coleman (1988), Lin (2001)); the last two interpretations are often used in politics
and economics and emphasize social capital as a resource for facilitating cooperation at the group, community or societal
level.
6
The civic engagement aspect of social capital refers to the activities through which agents contribute
positively to the community and social life (e.g., volunteering, political participation, donations) (Guiso,
Sapienza, and Zingales (2011), Scrivens and Smith (2013)). Civic engagement can engender positive outcomes
by, for example, fostering trust and norms of cooperation, such as reciprocity.7
Trust and cooperative norms comprise factors (social norms – including reciprocity – and shared values)
that shape the way that agents behave towards each other and as members of their society. Under this definition,
social capital is viewed as an enabler of collective action and cooperation, leading to positive outcomes (e.g.,
economic growth, government performance, environmental stewardship). The channels through which positive
outcomes are derived include: (i) reductions in transaction costs (by reducing the need for formal contracts in the
presence of information asymmetry (Knack and Keefer (1997)); and (ii) potentially more efficient allocation of
resources.
All these concepts are, of course, interconnected: for example, civic engagement can generate trust and
cooperation, which, in turn, can foster further civic engagement; likewise, cooperation can build trust and vice
versa. Furthermore, social capital can accrue at different levels, such as societal, institutional and individual
levels. Hence, some individuals or institutions, including firms, can invest more in developing social capital
than others (see Coleman (1990), Leana and van Buren (1999), and Glaeser, Laibson, and Sacerdote (2002)).
B. Social Capital and Corporate Social Responsibility
To measure social capital at the firm level, we focus on a firm’s Corporate Social Responsibility (CSR)
activities. We motivate this metric from both an academic and practitioner viewpoint. Academic work linking
social capital, trust and CSR is scarce, but a recent book edited by Sacconi and Degli Antoni (2011) notes that
definitions of CSR tend to map directly into aspects of social capital such as civic engagement, cooperative
norms, shared beliefs, and trust. One definition commonly used by academics and practitioners, proposed by the
World Business Council for Sustainable Development (2004), is that “CSR is the commitment of a business to
7 Putnam (1993, p. 172) defines the concept of generalized reciprocity as “a continuing relationship of exchange that is at a
given time unrequited or imbalanced, but that involves mutual expectations that a benefit granted out should be repaid in the
future.” For earlier references to reciprocity, see Gouldner (1960).
7
contribute to sustainable economic development, working with employees, their families, the local community
and society at large to improve the quality of life.” This definition incorporates these aspects of social capital.
Sacconi and Degli Antoni (2011) present a series of studies which show that firms can build social capital and
trust through CSR investments.
Additionally, the belief that CSR activities can help build social capital and trust is widespread among
corporate managers. For example, in two recent CEO surveys conducted by PricewaterhouseCoopers (2013,
2014), CEOs indicate their plans to increase their firms’ engagement in CSR activities to restore stakeholder
trust after the crisis.
Several recent studies support our claim that stakeholders are more likely to trust and cooperate with
high-CSR firms. Eccles, Ioannou, and Serafeim (2014) show that high-CSR firms implement processes that
consistently engage with stakeholders over the long term.8 Bénabou and Tirole (2010) argue that stronger
stakeholder engagement via CSR can lessen the likelihood of short-term opportunistic behavior by managers, a
view supported by the empirical evidence in Gao, Lisic, and Zhang (2014), who show that executives of high-
CSR firms are less likely to engage in insider trading than executives of low-CSR firms. In a similar vein, Kim,
Park, and Wier (2012) find that socially responsible firms are less likely to manage earnings.
While we acknowledge the limitations of CSR as an all-encompassing metric of firm-level social capital
(see Scrivens and Smith (2013) and Sapienza, Toldra-Simats, and Zingales (2013) for a discussion of social
capital metrics), we note that (i) CSR is measureable, albeit inexactly; (ii) CSR can have a non-negative payoff
(see, e.g, Edmans (2011), Servaes and Tamayo (2013), and Flammer (2015)); (iii) firm-level CSR can change
through investment or depreciation. These three elements combined alleviate Solow’s (1995) concerns of social
capital notions.9
8 The idea of CSR as a competitive advantage is proposed and discussed in detail in Porter and Kramer (2006, 2011).
9 Solow (1995) argues that “if ‘social capital’ is to be more than a buzzword… There needs to be an identifiable process of
‘investment’ that adds to the stock, and possibly a process of ‘depreciation’ that subtracts from it. The stock of social
capital should somehow be measurable, even inexactly. Observable changes in it should correspond to investment and
depreciation.”
8
C. Social Capital and Firm Valuation
In this paper, we argue that if a firm’s social capital helps build stakeholder trust and cooperation, it
should pay off in particular when being trustworthy is more valued, such as in an unexpectedly low-trust period.
From a shareholder perspective, Guiso, Sapienza, and Zingales (2008, p. 2557) posit that “the decision
to invest in stocks requires not only an assessment of the risk-return trade-off given the existing data, but also an
act of faith (trust) that the data in our possession are reliable and that the overall system is fair.” During an
unexpected decline in general trust, outside shareholders are likely to be more concerned that the financial
information they previously relied upon to guide investment decisions may not be credible. As such, they will
seek metrics such as social capital ratings that speak to a firm’s values and integrity, placing a valuation
premium on firms that are deemed to be more trustworthy.
From the perspective of other stakeholders (e.g., employees, customers, suppliers, and the community at
large), much of their interaction with the firm occurs through implicit or incomplete contracts, which might not
be honored by either party during a crisis. Social capital could facilitate these interactions by fostering trust and
cooperation (Putnam (1993)) and by reducing the need for formal contracts (Knack and Keefer (1997)). For
example, stakeholders may perceive that the probability of breaching (implicit) contracts is lower for high-
social-capital firms due to shared values and cooperative norms. Likewise, stakeholders are more likely to “do
whatever it takes” to help high-social-capital firms weather a crisis, given that such firms displayed greater
attention to, and cooperation with, stakeholders in the past.10
This observation is consistent with the notion of
reciprocity often discussed in studies of social capital and with prior work showing that stakeholders seem to
cooperate more when they perceive firms to be trustworthy (e.g., for employees, see Guiso, Sapienza, and
Zingales (2015); for customers, see Servaes and Tamayo (2013)). The benefits of social capital derived from
stakeholder cooperation may be present during any crisis, but as stressed by Sapienza and Zingales (2012)
cooperation breaks down without trust; as such, firm level social capital becomes even more relevant when the
10
Examples include business contacts continuing solid buying or selling relationships, employees working harder (or more
cheaply) and more creatively to ensure success, or outside regulators/agencies being more sympathetic to these firms’ needs
for direct relief or for flexibility regarding regulations.
9
level of trust in corporations, institutions, and capital markets plummets, as occurred during the 2008-2009
financial crisis.
II. Sample and Summary Statistics
A. Sample Construction
To construct our sample, we gather information on firms’ CSR ratings from the MSCI ESG Stats
Database, which contains environmental, social, and governance ratings of large, publicly traded companies.11
This database contains yearly ratings on roughly the 3,000 largest U.S. companies and has been used in a large
number of studies examining the effect of CSR on firm performance (e.g., Hong and Kostovetsky (2012), Deng,
Kang, and Low (2013), Servaes and Tamayo (2013), Krüger (2015), and Borisov, Goldman, and Gupta
(2016)).12
ESG Stats classifies environmental, social, and governance performance in 13 different categories:
community, diversity, employment, environment, human rights, product, alcohol, gaming, firearms, military,
nuclear, tobacco, and corporate governance. As in Servaes and Tamayo (2013), we focus on the first five of
these categories. We do not examine the product category because it contains a number of elements that we
consider to be outside the scope of CSR, such as product quality and innovation (our findings are unchanged if
we include the product category in the construction of our measure of CSR). Similarly, we do not consider in
our tests the ESG Stats categories that penalize firms’ participation in the six industries that are considered
controversial, as there is nothing incremental that firms can do to change a ranking score, except change
industries (in addition, we control for industry in all our tests). Finally, we do not examine the ESG Stats
corporate governance category in our main tests because governance is generally not part of a firm’s CSR remit.
However, it is possible that the governance category in aggregate, or some of the individual governance category
11
The MSCI ESG Stats Database was previously known as the KLD Stats database constructed by Boston-based KLD
Research and Analytics, Inc. (KLD). 12
The database is constructed as follows. MSCI first defines a number of ESG categories and within each category it
specifies a number of criteria which capture good/poor ESG performance. Once these criteria are set, MSCI scans public
databases covering environmental issues, labor issues, and the like to ascertain the ESG performance of the firm (e.g., has
the firm committed Environmental Protection Agency violations or had an industrial dispute?). Throughout this process,
MSCI assigns analysts to each firm to study the different elements of CSR, and relies on sources beyond a firm’s reports
and publicity of its green activities. See also Krüger (2015) for a more detailed description of the process followed by
MSCI to construct the CSR ratings.
10
components are seen by investors as measures correlated with the trustworthiness of a firm; hence, we examine
this category in robustness tests.
For each of the five categories we consider, ESG Stats compiles data on both strengths and concerns.
We are interested in capturing both elements; accordingly, we construct a net CSR measure that adds strengths
and subtracts concerns. For each category, however, the maximum number of strengths and concerns varies
across time (e.g., the total maximum of strengths for community is seven in 2005, but only four in 2010). To
obtain numerically consistent measures over time, we scale the strengths (or concerns) for each category by
dividing the number of strengths (or concerns) for each firm-year by the maximum number of strengths (or
concerns) that were possible for that category for that year. From this exercise, we obtain strength and concern
indices that range from 0 to 1 for each category-year. Our measure of net CSR involvement in each category-
year is then obtained by subtracting the concerns index from the strengths index; thus, the net CSR index per
category ranges from -1 to +1. Finally, to obtain our primary explanatory variable, a firm’s total net CSR index
(CSR hereafter), we combine the net CSR indices for the categories of community, diversity, employment,
environment, and human rights. This is a net measure across our set of stakeholder-oriented categories, and
ranges from -5 to +5. There is substantial variation in this measure across firms and industries. For example, in
2006 in the Apparel Retail Industry, GAP gets a score of 0.40, while Limited Brands scores -0.53; in Chemicals,
Air Products and Chemicals’ score is 0.16, while Celanese scores -1.36.13
We obtain stock return data from CRSP and accounting data from Compustat. We remove financial
firms from our sample due to the extensive amount of government support given to such firms during the crisis.
We also remove micro-cap stocks (those with a market capitalization below $250 million as of year-end 2007)
because these stocks tend to have low liquidity and high bid-ask spreads, and are subject to more price pressure
effects of trading (see, e.g., Fama and French (2008)), all of which would likely be more severe during the
financial crisis.
13
Limited Brands has employee, human rights, and diversity concerns, only partially outweighed by diversity strengths;
GAP, on the other hand, has strengths in diversity, human rights, and community, with some employee concerns.
Celanese’s score is due to environmental, employee, and diversity concerns; Air Products & Chemicals also has
environmental and employee concerns, but its strengths in the same areas outweigh these concerns.
11
As in Lins, Volpin, and Wagner (2013) we define the financial crisis as the period from August 2008 to
March 2009. August of 2008 preceded the September 2008 Lehman Brothers bankruptcy, while March of 2009
is the month in which the S&P 500 hit its lowest point of the crisis. This period also corresponds to the period of
decline in trust as suggested by Sapienza and Zingales (2012). The decline in trust later in 2008 is also
corroborated by the Trust Barometer developed by Edelman, the world’s largest independent public relations
firm, which conducts global surveys of trust in business, government, NGOs and the media. They report that
trust in business in the U.S. declined from 58% in early 2008 to 38% in early 2009.14
The main stock return measures for each firm are Raw Crisis Period Return, which is the firm’s raw
buy-and-hold return from August 2008 through March 2009, and Abnormal Crisis Period Return, which is the
raw return minus the expected return, based on the market model estimated over the 60-month period ending in
July 2008. To avoid problems with outliers, we winsorize these returns at the 1st and 99
th percentiles. We relate
these return measures to our CSR measure for the year 2006 to guard against the possibility that by year-end
2007 firms may have already changed their CSR policies to the extent they anticipated a potential crisis ahead.15
After combining non-financial firms with sufficient data coverage on the CRSP and Compustat
databases and firms on the ESG Stats database, we obtain a sample of 1,673 non-financial firms for which all
explanatory variables are available for the crisis period.
B. Descriptive statistics
Table I provides descriptive statistics for our main variables. The first row of Panel A of Table I shows
that our primary variable of interest, CSR, is slightly negative with a mean value of -0.165 and a median value of
-0.200. Thus, the average and median firm has more CSR concerns than strengths, consistent with Deng, Kang,
and Low (2013), Servaes and Tamayo (2013), and Borisov, Goldman, and Gupta (2016). The next row shows
14
The Global Competitiveness Index developed by the World Economic Forum also contains a component measuring trust
in financial markets and is released in September of each year (it is partially based on survey evidence). This trust measure
shows a decline from 5.65 in September 2008 to 5.06 in September 2009. The Financial Trust Index
(financialtrustindex.org) developed by Sapienza and Zingales is another measure of public trust, but because this index
started after the onset of the crisis we cannot employ it to corroborate the extent to which trust changed as a result of the
crisis. 15
We have repeated all our analyses using CSR measured at year-end 2005 in case 2006 CSR data partially reflect the
anticipation of a future crisis. All our findings persist. These results are reported in the Internet Appendix.
12
that the Raw Crisis Period Return is substantially negative, with a mean of -39.1%, a median of -40.3%, and a
25th percentile value of -59.5%, indicating that investors and stakeholders were likely quite concerned about the
survival prospects of many of the firms they held in their portfolios, worked for, or interacted with in business
transactions. The median abnormal return is close to zero at 1.3%, while the mean is 11.6%. Table I also
provides definitions and descriptive statistics for firm characteristics that we use as control variables in our
models, and Panel B presents a correlation matrix of all variables employed in our main analyses.
III. Crisis Period Returns
A. Baseline results
We estimate various regression models of stock returns during the crisis period as a function of firms’
pre-crisis CSR ratings and a number of control variables. Panel A of Table II contains our baseline regression
models. The dependent variable in columns (i) and (iii) is the Raw Crisis Period Return, while in columns (ii)
and (iv) it is the Abnormal Crisis Period Return. Our variable of interest is the firm’s CSR score measured at
year-end 2006. In all models, we include industry dummies (defined at the two-digit SIC level) because some
industries may be more prone to CSR investments than others and they may have been differentially affected by
the financial crisis. We also control for the firm’s factor loadings based on the Fama-French 3-factor model plus
the momentum factor.16
Models (i) and (ii) show that firms with higher CSR ratings performed significantly better during the
crisis. The effect of CSR on returns is large economically; a one standard deviation increase in CSR (0.381) is
associated with a 2.25 percentage point increase in raw returns and a 4.15 percentage point increase in abnormal
returns during the crisis.
One concern with the specifications reported in models (i) and (ii) is that the strong performance of
high-CSR firms during the crisis may be due to omitted variables that happen to be correlated with CSR, and not
due to CSR itself. To address this possibility, in models (iii) and (iv) we control for a firm’s financial health in
16
We estimate the factor loadings over the 60 months prior to the onset of the crisis, using factor returns obtained from
Kenneth French’s website. Firms are excluded from the analysis if fewer than 12 months of data are available to estimate
factor loadings.
13
the year before the crisis and for other firm characteristics that have been found to affect stock returns. We
employ several proxies to measure a firm’s financial health and, thus, its ability to withstand a severe downturn
in the economy: Cash holdings (computed as cash and marketable securities divided by assets), Short-term debt
(computed as debt in current liabilities divided by assets), Long-term debt (computed as long-term debt divided
by assets), and Profitability (computed as operating income divided by assets). During a crisis, profitable, cash
rich firms with low debt can continue investing, while other firms may be forced to cut investment, especially if
they have short-term debt maturing during the crisis (see Duchin, Ozbas, and Sensoy (2010), Almeida, et al.
(2012), and Harford, Klasa, and Maxwell (2014) for empirical evidence consistent with these expectations).
Because additional firm characteristics may also be important for stock returns (see, e.g., Daniel and
Titman (1997)), we also control for Size (measured as the log of a firm’s equity market capitalization), Book-to-
market (computed as book value of equity divided by market value of equity), and Momentum (computed as the
raw return over the period August 2007 to July 2008). We also add a dummy for firms with a Negative Book-to-
market ratio, as such firms are likely distressed and their returns may behave more like those of high book-to-
market firms than low book-to-market firms (see Fama and French (1992)). Finally, we control for a firm’s
Idiosyncratic risk (computed as the residual variance from the market model estimated over the five-year period
ending in July 2008, using monthly data) under the premise that stock price volatility may also affect returns
(Goyal and Santa-Clara (2003)). We measure financial health and firm characteristics at the end of December of
2007, or as close as possible to it for firms that do not have a December fiscal year-end, except for momentum
and idiosyncratic volatility, which are computed over one and five years, respectively, before the start of the
crisis period.
The results presented in models (iii) and (iv) of Panel A of Table II confirm that high-CSR firms had
higher stock returns during the crisis. The magnitude of the high-CSR outperformance is somewhat attenuated
once we include additional control variables, but the effect is still important economically. For example, in
model (iii), a one standard deviation increase in CSR (0.381) is associated with a 1.83 percentage point increase
in raw crisis-period returns.
14
Turning to the control variables, as expected, firms that entered the crisis in better financial health
(higher cash holdings and profitability and lower debt) have higher crisis-period stock returns, while firms with
higher idiosyncratic risk had lower returns. In terms of economic significance, the effects of leverage, cash
holdings and idiosyncratic risk are the largest. Based on model (iii), a one standard deviation increase in long-
term debt (0.19), cash holdings (0.20), and idiosyncratic risk (0.01) is associated with a change in raw crisis
period returns of -2.16, 3.48, and -3.16 percentage points, respectively. Thus, the economic impact of CSR
ratings on returns during the crisis is more than four fifths of the impact of leverage and more than half of the
impact of cash holdings and volatility, indicating that social capital is indeed important in explaining crisis
period returns.
In Panel B of Table II, we re-estimate our previous models, but instead of including our linear measure
of CSR as an explanatory variable, we divide firms into CSR quartiles and include dummies for quartiles 2
through 4 (the intercept captures the effect of quartile 1). This approach allows us to assess whether the effect of
a firm’s social capital on returns is more pronounced at very high or low levels of social capital. The results
again illustrate that firms with better CSR ratings had the largest crisis-period returns. The difference in raw
returns between firms in the best and worst CSR quartiles, as captured by the coefficient on CSR4, is 5.52
percentage points when we omit firm characteristics and 4.53 percentage points when we include them. For
abnormal returns, the difference is even greater at 9.85 percentage points and 7.27 percentage points,
respectively. The impact of CSR on returns is monotonic, but not entirely linear. Based on model (iv), which
features the full set of control variables, abnormal returns improve about 4.8 percentage points when moving
from the lowest to the 2nd
lowest quartile of CSR. Only modest improvements in returns accrue when moving to
the 3rd
quartile, while a move from the 3rd
to the 4th
quartile has a more significant improvement in returns of
1.65 percentage points. These results indicate that investors were most concerned when a firm had a low level of
social capital and most reassured when firm social capital was high.
We also ensure that our findings persist after we control for measures of corporate governance. Recent
evidence shows that better-governed firms performed relatively well in the financial crisis (Lins, Volpin, and
Wagner (2013) and Nguyen, Nguyen, and Yin (2015)). If governance is correlated with our CSR measure, then
15
it is possible that CSR is simply proxying for governance and that we are suffering from an omitted variable bias.
To address this concern, we gather data on a variety of governance measures as of year-end 2006. We first use
our prior method to construct a governance measure from the ESG Stats database: for each firm, the number of
governance concerns is divided by its possible maximum and subtracted from the number of strengths divided by
its possible maximum, yielding a governance index that ranges from -1 to +1. We also measure governance
using the firm’s E-index (the entrenchment index featuring the six governance provisions17
identified in
Bebchuk, Cohen, and Ferrell (2009)), Board independence (the fraction of the board consisting of outside
directors), Board size, a dummy if the CEO is not the Chairman, and Board ownership (the fraction of
outstanding shares owned by the board members), obtained from the MSCI Governance Metrics and Directors
databases.
In Panel C of Table II, we repeat the analyses from Panel A, but we now add governance controls. All
models include the full set of other control variables employed in Panels A and B. Models (i) and (ii) show that
the ESG Stats governance index is not significantly related to raw or abnormal crisis-period returns and that the
impact of CSR on crisis period returns is virtually identical to that reported previously, providing evidence that
the CSR effect is not picking up a governance component. Models (iii) and (iv) include all other governance
measures and, again, the effect of CSR on crisis-period returns persists. The E-index is significant for both raw
and abnormal return models, which provides evidence that firms with more entrenched managers performed
worse during the crisis. The other governance provisions are insignificant.
To get a sense of the costs associated with firms’ CSR activities, we follow Di Giuli and Kostovetsky
(2014) and estimate a regression model (reported in the Internet Appendix) of the log of Selling, General, and
Administrative (SG&A) expenses measured in 2006 as a function of CSR and a number of control variables (log
assets, equity book-to-market, cash holdings to assets, total interest bearing debt to assets, dividend payments to
assets, income before extraordinary items to assets). Increasing CSR from its 1st to its 4
th quartile is associated
with SG&A expenses that are $44.9 million higher for the median firm in our sample and $203.5 million for the
17
The E-index consists of the following six governance provisions that indicate entrenchment: a staggered board, limits to
amend the charter, limits to amend bylaws, supermajority voting requirements, golden parachutes for executives, and the
ability to adopt a poison pill (see Bebchuk, Cohen, and Ferrell (2009)).
16
mean firm. These cost estimates are substantial and may at least partly explain why not all firms choose to
engage in CSR activities.
Overall, the findings reported in Table II show that more socially responsible firms suffered less during
the crisis, and that this effect is not due to differences in financial strength or corporate governance.18
These
results are consistent with the view that a firm’s investments in social capital provided investors with a greater
sense of trust in the firm as the crisis was unfolding, leading to relative stock price outperformance.
B. Excess returns and CSR during the Enron/Worldcom fraud scandals
The above findings show that a positive relation between CSR and excess returns obtains in the 2008-
2009 crisis period when the overall level of trust in corporations suffered a severe shock. As this crisis was
arguably the most severe crisis of confidence in generations, there are few other economy-wide shocks to trust
that could have the same effect. Perhaps one ‘shock’ that comes close to a crisis of trust is the one caused by the
ripple effects associated with the frauds and subsequent bankruptcies of Enron, Worldcom, and several other
large firms. Enron filed for bankruptcy in December of 2001, after admitting to accounting violations in October
2001. Of course, fraud committed by one company alone does not necessarily dent trust in all firms. However,
soon after Enron’s accounting violations were revealed, other cases came into the spotlight. In the last quarter of
2001 and the first half of 2002 alone, Adelphia, Bristol-Myers Squibb, Global Crossing, Homestore.com,
ImClone Systems, Kmart, Qwest, Tyco, and Worldcom were all in the news because of accounting irregularities
and/or outright fraud. Global Crossing, Adelphia, and Worldcom filed bankruptcy in January, June, and July of
2002, respectively.
These bankruptcies and scandals are likely to have caused a general decline in trust in corporations.
Several newspaper articles published at the time support this belief. For example, on July 14, 2002, Associated
18
We also examine whether CSR is proxying for reporting transparency or (the lack of) accounting concerns, using the
following ESG Stats measures: CSR transparency strength, CSR transparency concern, accounting concern (see Dhaliwal,
et al. (2011)). We find no evidence that this is the case. We also include an indicator variable set equal to one if the firm is
included in the 100 Best Companies to Work For list as published by Fortune Magazine in February 2008. Edmans (2011)
finds that firms included in this list earn excess returns over the subsequent five-year period. This dummy is not significant
in explaining crisis-period returns and its inclusion does not have any impact on the coefficient of our measure of CSR.
17
Press Newswires published an article entitled: “How much will the loss of trust in U.S. businesses hurt the
economy?” and on July 17, The Wall Street Journal reported on a warning from Alan Greenspan, the Federal
Reserve Chairman at the time, that breakdowns in corporate governance could undermine the trust necessary for
efficient markets. On December 31, 2002, the Financial Times, when discussing the accuracy of forecasts that
were made for 2002, stated that: “…even fewer divined that a loss of trust in company statements would be the
trigger for another growl of the bear market.”
To determine whether our findings also hold around the Enron crisis, we follow the same procedure as
the one employed for the 2008-2009 financial crisis. Specifically, we cumulate returns over the period October
2001, when the Enron accounting violations were first revealed, to March 2003, the month prior to the beginning
of the stock market rally that persisted until the start of the recent crisis. We relate these returns to our measure
of CSR computed as of year-end 2000, and the same control variables as employed previously. Small firms
(market values below $250 million in 2007 dollars) are again excluded, but this time we include financial firms
as they were not uniquely supported by the government during this period. Factor loadings are computed over
the five-year period ending in September 2001. Unfortunately, ESG Stats coverage for this period is much
smaller, yielding a sample of only 412 companies.
Table III contains the results. We report two specifications each for raw and abnormal returns. Models
(i) and (ii) use our primary measure of CSR (the difference between scaled CSR strengths and weaknesses) as the
key explanatory variable, while models (iii) and (iv) contain a coarser CSR measure, namely a dummy variable,
set equal to one if our measure of CSR is positive and zero otherwise. The latter specification may be better
suited in this case, given the small sample size and the non-linearities in the CSR–return relation reported in
Panel B of Table II.
As illustrated in both columns (i) and (ii), the coefficient on our linear measure of CSR, while positive,
is not significantly different from zero. The indicator variable for high-CSR firms, which is employed as an
explanatory variable in models (iii) and (iv), is significant, and indicates that firms with positive CSR scores had
7.3 percentage points higher raw returns (9.5 percentage points higher abnormal returns) than firms with
18
negative CSR scores. This finding suggests that during the crisis of confidence surrounding the accounting
scandals revealed in 2001/2002, high-CSR firms again earned excess returns relative to low-CSR companies.
We ensure that our findings are robust to different starting and ending points of this crisis. Abnormal
returns are positively related to the high-CSR dummy (at the 10% significance level or better) for any starting
month between October 2001 (the month of the Enron bankruptcy) and May 2002 (after many other firms had
revealed accounting irregularities), and for any ending month between December 2002 and March 2003 (when
the stock market recovery started).
These results support our prior findings that social capital created through CSR activities matters more
when investor confidence in corporations has been damaged.
C. Comparing returns inside and outside of the crisis period
The previous evidence indicates that CSR affected stock returns during two periods when overall trust in
corporations, institutions, and financial markets declined. In this section, we investigate whether this positive
relation is indeed unique to periods of low trust or is common for most periods, perhaps due to some
unobservable (omitted) risk factor which is correlated with CSR.
To address this question, we estimate a difference-in-differences model with continuous treatment and
include firm and time fixed effects. Specifically, we construct a panel of monthly returns for all the firms in our
sample starting in 2007, prior to the onset of the crisis, and ending in 2013, several years into the economic
recovery. For this panel, we estimate the following model:19
Returni,t = bo + b1CSRi,2006 * Crisist + b2CSRi,2006 * Post-crisist + b3’Xi,t-1 + Time Dummies
+ Firm Fixed Effects + ei,t (1)
where Returni,t is the monthly raw or market-model adjusted return, CSRi,2006 is our proxy for CSR, measured at
year-end 2006, Crisist is a dummy variable set equal to 1 in the period August 2008 – March 2009, Post-crisist is
a dummy variable set equal to 1 in the period April 2009 – December 2013, and Xi,t-1 is a vector of control
variables. The control variables are the firm financial characteristics and factor loadings employed in Table II,
19
We are grateful to an anonymous referee for suggesting this test.
19
but updated annually (accounting variables) or monthly (market-based variables). We measure CSR twenty
months before the onset of the crisis to eliminate any concern that firms adjusted their CSR policies in
anticipation of the crisis. To ensure that the accounting data are publicly available, we leave a three-month gap
after the fiscal year-end to update the data. Factor loadings are re-estimated each month based on the previous
60 months’ data. Time dummies are specified at the monthly level and firm fixed effects control for time
invariant omitted risk factors. The firm’s CSR measure itself is absorbed by the firm fixed effect. All standard
errors are clustered at the firm level.20
As in Table II, firms with market values below $250 million as of year-
end 2007 are excluded from the analysis. The coefficient on the interaction between 2006 CSR and the crisis
(b1) captures the differential impact of CSR on monthly stock returns during the eight-month period from August
2008 to March 2009, after controlling for the firm’s factor loadings and financial characteristics and removing
both the firm’s average return (firm fixed effects) over the entire estimation period and any time-series pattern in
overall returns (time fixed effects).
The results for both raw and market-model adjusted returns are presented in Panel A of Table IV. Both
specifications indicate that high-CSR firms exhibit superior performance during the crisis period; after the crisis,
the relation between CSR and returns becomes insignificant. In terms of economic significance, the coefficient
of 0.0201 on the Crisis*CSR interaction indicates that a one standard deviation increase in 2006 CSR (0.381) is
associated with 77 basis points extra return during the crisis on a monthly basis.21, 22
These results indicate that
the excess returns earned by high-CSR firms are limited to the crisis period, consistent with our suggestion that
social capital created through CSR pays off when trust in the economy unexpectedly declines.
20
Significance levels are virtually identical if we double cluster standard errors by firm and time period. 21
We have also estimated this model without the monthly time dummies, but with the inclusion of dummies for the crisis
period and the post-crisis period. These dummies capture the change in returns during and after the crisis for firms with a
CSR score of zero. The coefficient on the crisis dummy indicates an average monthly decline during the crisis of 7.56
percentage points relative to the pre-crisis period. In the post-crisis period, the raw returns are 1.60 percentage points higher
per month than in the pre-crisis period (see Internet Appendix). 22
Gormley and Matsa (2014) recommend the inclusion of further fixed effects to control for unobserved firm heterogeneity.
In particular, they suggest including dummies for quintiles of firm characteristics and interacting these quintile dummies
with time dummies. We estimate such a specification, in which we include dummies for quintiles of size, book-to-market,
and momentum and interact each of these quintile dummies with monthly time dummies. This specification, which includes
1,260 time/characteristic quintile interactions, continues to yield significant crisis period returns for high-CSR firms. The
coefficient on the CSR/crisis period interaction is 0.0185 (p-value=0.00) for raw returns and 0.0154 (p-value=0.00) for
abnormal returns (see Internet Appendix).
20
The lack of a reversal in abnormal returns for high-CSR firms after the crisis may appear surprising.
Such a reversal rests on the assumption that overall trust in firms and markets has fully recovered. Trust has
remained relatively low since the crisis, however. For example, according to the Financial Trust Index, 11% of
respondents trusted the stock market and 12% trusted large corporations in December 2009. These figures
increased to 13% and 16%, respectively, by December 2012, but they are still suggestive of a low level of trust
subsequent to the crisis.23
This would be consistent with the lack of return reversals. We also note that high-
trust firms should not earn further positive abnormal returns either if prices already adjusted to the overall
decline in trust during the crisis. That is, any benefits of being trustworthy when overall trust is low should now
be reflected in the share price. Operating performance, on the other hand, may well be affected during both the
crisis and post-crisis periods. In subsequent sections, we provide evidence that this is indeed the case.
In the specifications reported in Panel A of Table IV, we hold CSR constant as of year-end 2006 to
determine whether CSR measured before the onset of the crisis has an effect on returns during and after the
crisis. In an alternative specification, we also allow CSR to vary over time as new information on CSR becomes
available. That is, we match 2007 returns with year-end 2006 CSR, 2008 returns with year-end 2007 CSR, etc.
These specifications allow us to gauge whether updated CSR affects subsequent returns outside the crisis period.
These models yield similar results to the ones reported in Panel A of Table IV: crisis period returns increase with
CSR, but there is no effect of CSR on returns subsequent to or prior to the crisis.
Finally, we also construct a hedge portfolio that goes long in firms in the highest quartile of CSR firms
and short in firms in the lowest quartile, updating the portfolio composition on an annual basis as new CSR
information becomes available. This portfolio earns excess returns (adjusted for four factor loadings) of 74 basis
points per month during the crisis period, while the excess returns are insignificant in the four years prior to and
after the crisis (reported in the Internet Appendix).
23
Similarly, the trust component of the Global Competitiveness Index produced by the World Economic Forum was still
lower in September 2013 (5.54) than in September 2008 (5.65). The Edelman Trust Barometer, on the other hand, does
show that trust has recovered. It was 58% in the survey released in early 2014, which is the same as the figure released in
early 2008.
21
D. Excess returns and CSR during a shock to the supply of credit
We next investigate whether our results could be due to a shock to the supply of credit, rather than a
shock to market-wide trust. Starting in July of 2007, the weakening solvency of the banking sector led to a
substantial increase in LIBOR rates, which had a strong negative impact on the ability of firms to borrow (see,
e.g., Duchin, Ozbas, and Sensoy (2010) and Ivashina and Scharfstein (2010)). This shock to the supply of credit
persisted until at least March 2009, which is the end of the crisis period in our prior tests. If high-CSR firms
earned excess returns during the crisis because investors believed that these firms were better able to weather the
credit crunch, our test could be picking up this effect instead of the ability to weather a shock to trust. To
investigate this possibility, we test whether CSR is related to returns in the period of July 2007 through July
2008, when the shock to credit supply already happened but the shock to trust had not yet occurred (the Edelman
Trust Barometer shows no decline from early 2007 to early 2008; see also Sapienza and Zingales (2012)).
For this exercise, we augment the specification of model (1) with an additional interaction term between
CSR measured at year-end 2006 and a dummy (shock to credit) equal to one during the July 2007 – July 2008
period. The results of this estimation, which are reported in Panel B of Table IV, indicate that there is no
significant relation between CSR and either raw or abnormal returns in this earlier period. The coefficients on
the CSR/Crisis interactions remain virtually unchanged from those in Panel A, and the CSR/Crisis interactions
are always significantly larger than the CSR/credit shock interactions. Thus, a shock to credit supply is unlikely
to explain the positive association between social capital and stock returns during the crisis documented in Table
II and in Panel A of Table IV.
E. Regional trust and the relation between CSR and returns
Our interpretation of the excess crisis period returns for high-CSR firms is that such firms build social
capital through their CSR activities, which pays off when there is a shock to overall trust. In this section, we
provide evidence for this interpretation by linking the crisis period returns earned by high-CSR firms to regional
variation in trust across the U.S.
22
We obtain data on regional variation in trust from the 2006 General Social Survey (GSS) conducted by
the National Opinion Research Center (NORC) at the University of Chicago (see also Kelly (2015)). This
survey asks a random sample of Americans a large number of questions related to various aspects of society,
including: “Can people be trusted?” In 2006, the survey covered 3,929 responses to this question; after
removing 192 respondents who state “Depends,” 34% of the respondents reply that people can be trusted while
the remainder reply that people cannot be trusted. There is substantial variation in trust across the nine regions
in which respondents are classified: for example, only 26% of the respondents in the West South Central region
reply that they can trust people compared to 43% in New England and the Mountain region.
We exploit this cross sectional variation to explore whether regional differences in trust affect the
returns earned by high-CSR firms by matching the regional trust averages with the regions in which the firms are
headquartered. Our primary hypothesis follows the work of Putnam (2000) who argues that an agent’s social
capital is more valuable in a society where overall social capital is higher. Framing this argument in our context,
in regions where people have a lower propensity to trust, CSR activities are less likely to be viewed by investors
and other stakeholders as trust-enhancing activities; instead they may be perceived as window dressing and less
genuine activities. As such, they are less likely to pay off. If more stakeholders are based in the region where
the firm is headquartered, we can use this regional variation in trust to directly test whether trust matters more
where it should – in more trusting regions. Employees, customers and other stakeholders in more trusting
regions are more likely to reward trustworthy firms, for example, by working harder and maintaining strong
buying relationships, leading to higher crisis-period returns. Additionally, if investors hold local companies (see,
e.g., Coval and Moskowitz (1999)) and prices are influenced by local investors (see, e.g., Hong, Kubik, and
Stein (2008)), more trustworthy firms may also be able to raise more capital and achieve higher valuations
during the crisis.
In Panel C of Table IV, we repeat our prior analyses, but now allow the effect of CSR on returns to vary
depending on whether the firm is headquartered in a high- or low-trust region. The results indicate that crisis-
period returns are more affected by CSR in high-trust regions compared to low-trust regions. For raw returns,
increasing CSR by one standard deviation is associated with monthly excess returns of 1.05% in high-trust
23
regions, but only 59 basis points in low-trust regions. The difference between the two is significant at the 6%
level. For abnormal returns, there is also a substantial difference between the two sets of regions although it is of
a smaller magnitude.
Two caveats are in order. First, an individual’s ability to trust people may be different from her ability
to trust firms; hence, our findings should be interpreted with this caution in mind. Second, our test assumes that
the survey response reflects an individual’s propensity to trust people (and other agents), and, as such, her
willingness to respond to a firm’s CSR efforts. This propensity, if it is an inherent personal characteristic,
should not vary (much) through time, which is indeed the case: it has declined very gradually from 38% in 2000
to 34% in 2014,24
but did not shift dramatically around the crisis – we also find a similar stability in trust when
splitting the sample into high- and low-trust regions. The fact that prior work shows that regional variation in
trust impacts economic and financial development also suggests that the level of regional trust is indeed a
persistent feature (e.g., Knack and Keefer (1997) and Guiso, Sapienza, and Zingales (2004)). The stability of
this metric over time is thus consistent with the above result that a firm’s CSR efforts pay off less in low trust
areas. As such, it is at odds with the alternative view that a firm’s CSR efforts are particularly valuable in areas
where the propensity to trust is low and that individuals in these regions can be persuaded to become more
trusting.
Overall, this evidence indicates that the impact of CSR on returns during the crisis period is related to
the general level of trust in the area where the company is located, and supports the view that the link between
returns and CSR during the crisis operates through the trust channel.
F. Elements of CSR and returns
Next, we examine whether it is a firm’s social capital in aggregate (CSR) or a specific component of
CSR that is important for crisis period returns. At the outset of this paper, we argue that a firm can build social
capital through a variety of activities and that such activities can enhance the trust of all of a firm’s stakeholders.
24
This gradual decline in trust is consistent with Putnam’s (2000) observation that trust has been declining in the U.S. over
the last several decades.
24
For example, customers may reward firms for treating their employees better, while employees may work harder
because the company cares more about its community or the environment. It is possible, however, that some
aspects of CSR are considered more important in building trust than others, which could affect the strength of
their relation with returns. To test this conjecture we disaggregate CSR into two components: those that speak
mainly to internal stakeholders (Employees and Diversity) and those that speak mainly to external stakeholders
(Community, Human Rights, and Environment).
Our results are reported in Panel D of Table IV using the same firm fixed effects specification as before.
Both components of CSR are significant in explaining crisis period raw and abnormal stock returns, which
indicates that a focus on both internal and external stakeholders is seen by investors as being valuable during the
2008-2009 financial crisis.25
In terms of economic significance, both elements of CSR are of similar importance.
An increase in Internal stakeholder CSR of one standard deviation (0.310) is associated with a 0.43 percentage
point higher monthly abnormal return during the crisis, while an increase in External stakeholder CSR of one
standard deviation (0.189) is associated with a 0.35 percentage point higher abnormal return.
G. Further robustness tests
In this section, we report the results of various additional tests conducted to determine whether our main
findings are robust. We first focus on measuring CSR performance at different points in time. In our baseline
models reported in prior tables, we measure CSR performance at the end of 2006, more than one year before the
onset of the shock to trust and several months before LIBOR rates started rising. It is possible that some
corporate managers were anticipating a potential slowdown given the heady returns for asset prices in general in
2006, and that they started adjusting their CSR activities in 2006 in anticipation of a potential crisis. It is also
possible that only those firms that were able to cope better with the crisis were the ones to adjust their CSR
activities upwards. While we control for observables that could potentially affect crisis-period returns, if CSR at
25
Note that the scores for the Internal and External CSR categories are not highly correlated (=0.12) and, thus, our results
to do not mechanically follow from the aggregate CSR score.
25
the end of 2006 is correlated with some unobservable measure of the ability to withstand a shock to trust, then
the results we report may not be due to social capital and CSR, but to some other factor.
To address this concern, we investigate whether firm CSR scores measured in 2005 are positively related
to crisis-period stock returns since 2005 clearly precedes any fears of a financial crisis. In the first two columns
of Table V, we re-estimate model (1) above using CSR measured in 2005 as the variable of interest. The effect
is of comparable magnitude to the effect using 2006 CSR. We next conduct the same test using 2007 CSR data
and, as reported in columns (iii) and (iv), our findings persist.
It is also possible that high-CSR firms performed well during the crisis because prior CSR activities
were actually negative NPV projects, and firms were forced to cut these activities during the crisis. If CSR is
just one element of excess investment, then the level of CSR could also proxy for the extent of overinvestment in
the firm as whole. Thus, it could be that firms that engaged more in non-value maximizing behavior pre-crisis
performed better during the crisis simply because they had more excesses that could be trimmed. A
straightforward way of checking this is to see whether our results still hold when CSR is measured at year-end
2008 when these excesses would arguably have already been cut. This is what we do in models (v) and (vi) of
Table V. Our findings persist: high CSR levels measured in the depth of the crisis are still associated with
higher crisis period returns.
Overall, our results are not sensitive to the time period in which CSR investments are measured. The
main reason for this lack of sensitivity is that CSR levels are relatively persistent over time. For example, the
correlation in our CSR measure between 2005 and 2006 is 0.90, the correlation between 2006 and 2007 is 0.89,
and the correlation between 2005 and 2007 is 0.82.
As a second robustness test, we assess whether the decision to remove micro-cap firms (those with an
equity market capitalization below $250 million) from our sample affects our results. We excluded these firms
because they typically display very low stock market liquidity, and this factor could outweigh other factors
during the crisis. In models (vii) and (viii) of Table V we re-estimate our full model including these firms. Our
results hold even when they are added back to our sample.
26
Third, we verify that our findings are not due to the inclusion of March 2009 as part of the crisis period.
Stock markets started recovering globally during the middle of that month and we want to make sure that our
results are not just due to this recovery. We find that the coefficient on CSR remains positive and significant in
specifications that exclude March 2009 from the crisis return window (reported in the Internet Appendix).
IV. The effect of CSR investments on operating performance and capital raising
In this section, we study the operating performance and capital raising activities of companies during the
crisis and surrounding periods to explore in more detail the possible sources of the excess returns earned by
high-CSR firms during the crisis. As for returns, we estimate a difference-in-differences model with continuous
treatment levels. In particular, using quarterly data, we estimate the following regression model over the period
2007-2013 for different metrics of performance and capital raising:
Performance (or Capital) Metrici,t = bo + b1CSRi,2006 * Crisist + b2CSRi,2006 * Post-crisist + b3’Xi,t-1
+ Time Dummies + Firm Fixed Effects + ei,t (2)
where CSRi,2006 is our measure of year-end 2006 CSR for firm i, Crisist is a dummy variable set equal to one for
the 4th
quarter of 2008 and the first quarter of 2009,26
Post-crisist is a dummy set equal to one for the 2nd
quarter
of 2009 until the fourth quarter of 2013, and Xi,t-1 is a vector of control variables. All models include quarter and
firm fixed effects. Thus, if a particular firm performed well throughout the estimation period because of some
unobservable characteristics, this effect would be captured by its fixed effect. Similarly, if the performance of
all firms varies through time, something that happened during the crisis, then it will be captured by the time
dummies. To avoid problems with extreme observations, we winsorize all performance and capital raising
variables at the 1st and 99
th percentiles. Standard errors in all models are clustered at the firm level.
Our findings are reported in Table VI. Our first performance measure is Operating return on assets,
computed as operating income divided by assets. The interaction between CSR and the crisis period dummy is
positive and highly significant, indicating that high-CSR firms exhibit higher profitability relative to other
26
For firms whose fiscal quarters do not overlap with the normal division of a calendar year in quarters, we consider all
quarters ending in October 2008 to March 2009 as crisis quarters. We do not include the quarter ending September 2008 as
a crisis quarter because most of the performance for that quarter precedes the Lehman bankruptcy.
27
companies at the end of 2008 and the beginning of 2009. In terms of economic significance, an increase in CSR
of one standard deviation (0.381) is associated with an increase in profitability of 30 basis points during the
crisis period, which is substantial compared to average quarterly profitability of 3.1% over the estimation period
and 2.2% during the crisis. Also note that the increase in profitability for high-CSR firms persists in the post-
crisis period as well, albeit at an attenuated level. As argued previously, given that trust in corporations has
remained low since the end of the crisis, observing some excess operating performance for high-CSR firms
during this time is not surprising.
Next, we analyze changes in Gross margin, defined as (sales – cost of goods sold) / sales, to see whether
high-CSR firms were able to sell their products at a higher mark-up during the crisis. Of course, higher mark-
ups could be due to higher prices or lower costs; the gross margin just illustrates the net effect. As shown in
model (ii) of Table VI, gross margins of high-CSR firms are higher relative to those of low-CSR firms during the
crisis. Over the crisis quarters, a one standard deviation increase in CSR is associated with gross margins that
are 60 basis points higher. This effect appears small relative to average gross margins of 40.1% during the
estimation period and 38.3% during the crisis, but the results on profitability reported in model (i) suggest that
much of this increase flows through to the bottom line. Also note that gross margins have remained relatively
higher for high-CSR firms since the end of the crisis and, though the difference in margins is lower than during
the crisis, the change between the crisis and post-crisis periods is not statistically significant. These findings are
also consistent with the work of Albuquerque, Durnev, and Koskinen (2015) suggesting that high-CSR firms
have higher profit margins.
One concern is that the higher mark-ups documented in model (ii) may be associated with lower sales
growth. This is what we study in model (iii); we compute sales growth as the percentage growth in sales over
the previous quarter. Interestingly, high-CSR firms experience higher sales growth during the crisis compared to
other firms; a one standard deviation increase in CSR is associated with 2.55 percentage points greater sales
growth. This is a considerable effect, given mean quarterly sales growth of 3.24% over the sample period, and a
mean decline in sales of 6.91% during the two crisis quarters. The findings of models (ii) and (iii) combined
indicate that during the crisis high-CSR firms experienced lower declines in sales than other firms, despite
28
charging higher mark-ups. This suggests that the customers of these firms were more willing to ‘stick’ with the
company during this period. Note from model (iii) that the higher level of sales growth for high-CSR firms also
persists after the crisis, although the magnitude of the effect is substantially lower than during the crisis.
To examine the customer channel in greater depth, we study changes in accounts receivable as a fraction
of sales around the crisis. The results reported in column (iv) show no significant effect. Thus, there is no
evidence that the stronger sales growth of high-CSR firms is due to increased credit sales. Customers of high-
CSR firms are not paying their invoices any faster during the crisis either.
In sum, the operating performance results described up to this point suggest that one of the channels
through which high-CSR firms earn excess returns during the crisis period is the willingness of customers to
continue supporting these firms, as reflected in higher sales growth and an acceptance of higher mark-ups.
We now turn to the employee channel and study whether high-CSR firms achieved higher sales per
employee in the crisis period. As illustrated in column (v) of Table VI, there is a positive association between
CSR and employee productivity during the crisis. The coefficient of 38.434 suggests that an increase in CSR of
one standard deviation is associated with quarterly sales per employee that are $14,643 higher during the crisis.
The mean (median) firm over the estimation period has sales per employee of $131,484 ($75,282), with a
standard deviation of $323,585, indicating that the impact of CSR on employee productivity is considerable.
This result suggests an additional channel through which CSR affects performance. Note that this effect also
persists after the crisis, but at half the rate.27
One shortcoming of our analysis of sales per employee is that the number of employees is only available
on Compustat at an annual level. Thus, we divide quarterly sales by the number of employees at year-end to
compute sales per employee. For example, sales per employee for the first quarter of 2009 are computed using
the number of employees reported for year-end 2009. We also verify that our findings remain unchanged when
27
We have also estimated these models without the time dummies, but with dummies for the crisis and post-crisis periods.
The coefficients on these dummies allow us to determine the effect of the crisis on performance for firms with a zero CSR
score. In general, we find a strong decline in performance during the crisis and a substantial recovery in the post-crisis
period. For example, during the crisis quarters, firms with a CSR score of zero experienced a decline in operating return to
assets of 0.91 percentage points, a decline in gross margin of 1.4 percentage points, and a decline in sales growth of 9.8
percentage points. In the post-crisis period, profitability improved by 0.76 percentage points, gross margins increased by
0.70 percentage points, and sales growth by 9.3 percentage points relative to the crisis period.
29
we lag the number of employees by one year. Finally, to verify that higher sales per employee are not due to
employee layoffs, we compute growth in the number of employees on an annual basis and estimate models of
employee growth as a function of CSR, year dummies and firm fixed effects, and the interaction between CSR
and a dummy for 2008/2009 and another interaction between CSR and a dummy for 2010 through 2013. This
regression is similar to the ones estimated for the performance measures, except that it is estimated using annual
instead of quarterly data. As illustrated in column (vi) of Table VI, there is no evidence of higher employee
layoffs for high-CSR firms in 2008 or 2009. In fact, if we remove firms that double their employees or lose half
their employees in a year, we find some evidence that high-CSR firms experience more employee growth in
2008 and 2009 relative to low-CSR firms, as illustrated in column (vii).
Next, we focus on the investor channel and study capital raising during and surrounding the crisis. We
divide both long-term debt and equity issues by total assets and relate these debt or equity issue measures to CSR
activities as in equation (2) above. We report results of these specifications in columns (viii) and (ix) of Table
VI. As illustrated in column (viii), high-CSR firms raised more debt during the crisis, albeit the economic effect
is modest. Increasing CSR by one standard deviation increases debt issuances relative to assets by 0.19
percentage points while average debt issuance is 2.61% over the sample period and 2.26% during the crisis.
Also note that the effect of CSR on debt capital raising becomes insignificant in the post-crisis period. Equity
issuances, which are studied in column (ix), are not related to CSR around the crisis period.
In our final set of tests, we relate the measures of operating performance presented in Table VI to the
stock price performance documented previously. To do so, we re-estimate our regression model of returns in
Table II, but add the actual performance metrics achieved during the crisis period as explanatory variables. The
goal of this exercise is not to predict returns but rather assess to what extent the cross-sectional variation in crisis
period returns can be explained by concurrent operating performance. Actual performance is computed as
average performance over the quarters ending from October 2008 to March 2009. We include profitability,
gross margin, sales growth and sales per employee as performance measures. These models (tabulated in the
Internet Appendix) indicate that profitability, gross margin and sales growth all affect crisis-period (abnormal)
returns, with the economic effect of profitability being the largest. Increasing profitability by one standard
30
deviation is associated with incremental crisis period returns of 5.88 percentage points; the economic effect of
gross margin is somewhat smaller while the effect of sales growth is around half of that. In these models, the
coefficient of CSR is reduced by about half for raw returns and one quarter for abnormal returns. For raw
returns, the coefficient of CSR is no longer significant, but it is significant the 5% level for abnormal returns.
This suggests that part of the excess returns earned by high-CSR firms during the crisis are due to their superior
operating performance (related to stakeholder trust). The unexplained variation in returns could be due to the
direct effect of social capital on shareholder trust (see Guiso, Sapienza, and Zingales (2004, 2008)) although we
recognize that other performance measures may also matter for stock returns, which would attenuate this effect.
Overall, the evidence reported in this section broadly suggests that some of the increased returns to high-
CSR firms accrue through the customer and employee channels. There is modest evidence in support of
increased debt capital raising. It is noteworthy that even after controlling for these real effects, CSR continues to
have a persistent, albeit reduced, impact on crisis-period returns.
V. Conclusion
This paper provides evidence that firm-specific social capital, built up through CSR activities, pays off
in a time period when the importance of trust unexpectedly increases – the 2008-2009 financial crisis. In
particular, we find that firms with high CSR ratings outperform firms with low CSR ratings during the crisis by
at least four percentage points, after controlling for a variety of firm characteristics and risk factors. We also
find that the excess returns are higher for firms headquartered in regions where individuals are more trusting.
There is no difference in stock return performance between high- and low-CSR firms during the recovery period
after the crisis. Collectively, these results suggest that increased social capital created through CSR efforts
matters predominantly in periods when trust in corporations at large has eroded and that during normal times any
benefits of social capital are already imbedded in a firm’s share price. The lack of a reversal in returns in the
post-crisis period suggests that being trustworthy has remained important, which is in line with survey data that
report continuing low levels of trust in corporations and the stock market.
31
We also examine the mechanisms through which higher CSR levels might generate excess returns
during the crisis and find that high-CSR firms benefit through higher profitability, margins, sales growth, and
employee productivity relative to low-CSR firms. Some of these effects also persist in the post-crisis period, but
at lower levels of economic and statistical significance, again consistent with the survey evidence suggesting
trust remains relatively low.
Overall, our results suggest that the building of firm-specific social capital can be thought of as an
insurance policy which pays off when investors and the overall economy face a severe crisis of confidence. Our
work also indicates that social capital, in addition to financial capital, can be an important determinant of firm
performance and highlights the circumstances under which CSR can be beneficial for firm value.
Two caveats are in order. First, as with most empirical work, unobserved time-varying firm
heterogeneity could explain our findings, but the fact that our results survive the inclusion of a large battery of
control variables and firm and time fixed effects and hold during another period when trust suffered a shock
mitigates this concern. Second, in constructing our proxy for social capital at the firm level, we rely on the prior
literature suggesting a link between CSR and the formation of social capital. However, there may be other
channels through which firms can build social capital and increase trust. Examining these channels and studying
the relative efficacy of the CSR channel compared to other channels would be a fruitful avenue for further work.
32
References
Albuquerque, Rui, Art Durnev, and Yrjo Koskinen, 2015, Corporate social responsibility and firm risk: Theory
and empirical evidence, Working paper, Boston University, University of Iowa, and University of Calgary.
Almeida, Heitor, Murillo Campello, Bruno Laranjeira, and Scott Weisbenner, 2012, Corporate debt maturity and
the real effects of the 2007 credit crisis, Critical Finance Review 1, 3-58.
Arrow, Kenneth J, 1972, Gifts and Exchanges, 1972, Philosophy and Public Affairs 1, 343-362.
Bebchuk, Lucian, Alma Cohen, and Allen Ferrell, 2009, What matters in corporate governance?, Review of
Financial Studies 22, 783-827.
Bénabou, Roland, and Jean Tirole, 2010, Individual and corporate social responsibility, Economica 77, 1-19.
Borisov, Alexander, Eitan Goldman, and Nandini Gupta, 2016, The corporate value of (corrupt) lobbying,
Review of Financial Studies 29, 1039-1071.
Carlin, Bruce I., Florin Dorobantu, and S.Viswanathan, 2009, Public trust, the law, and financial investment,
Journal of Financial Economics 92, 321-341.
Cheng, Ing-Haw, Harrison Hong, and Kelly Shue, 2016, Do managers do good with other peoples’ money?
Working paper, Dartmouth College, Princeton University, and University of Chicago.
Coleman, James S., 1988, Social Capital in the Creation of Human Capital, American Journal of Sociology 94
(Supplement), S95-S120.
Coleman, James S., 1990, Foundations of Social Theory, (Harvard University Press, Cambridge, MA).
Coval, Joshua D., and Tobias J. Moskowitz, 1999, Home bias at home: Local equity preference in domestic
portfolios, Journal of Finance 54, 2045-2073.
Daniel, Kent, and Sheridan Titman, 1997, Evidence on the characteristics of cross-sectional variation in stock
returns, Journal of Finance 52, 1-33.
Dasgupta, Partha, 1988, Trust as a Commodity, in Diego Gambetta, ed.: Trust: Making and Breaking
Cooperative Relations (University of Oxford, Oxford, UK).
Deng, Xin, Jun-Koo Kang, and Buen Sin Low, 2013, Corporate social responsibility and stakeholder value
maximization: Evidence from mergers, Journal of Financial Economics 110, 87-109.
Dhaliwal, Dan S., Oliver Zhen Li, Albert Tsang, and Yon George Yang, 2011, Voluntary nonfinancial disclosure
and the cost of equity capital: The initiation of corporate social responsibility reporting, The Accounting Review
86, 59-100.
33
Di Giuli, Alberta, and Leonard Kostovetsky, 2014, Are red or blue companies more likely to go green? Politics
and corporate social responsibility, Journal of Financial Economics 111, 158-180.
Duchin, Ran, Oguzhan Ozbas, and Berk A. Sensoy, 2010, Costly external finance, corporate investment, and the
subprime mortgage credit crisis, Journal of Financial Economics 97, 418-435.
Eccles, Robert G., Ioannis Ioannou, and George Serafeim, 2014, The impact of a corporate sustainability on
organizational processes and performance, Management Science 60, 2835-2857.
Edmans, Alex, 2011, Does the stock market fully value intangibles? Employee satisfaction and equity prices,
Journal of Financial Economics 101, 621-640.
Erhard, Werner, and Michael C. Jensen, 2015, Putting integrity into finance: A purely positive approach,
Working paper, Harvard Business School.
Erhard, Werner, Michael C. Jensen, and Steve Zaffron, 2009, Integrity: A positive model that incorporates the
normative phenomena of morality, ethics, and legality, Working paper, Harvard Business School.
Fama, Eugene F., and Kenneth R. French, 2008, Dissecting anomalies, Journal of Finance 63, 1653-1678.
Ferrell, Allen, Hao Liang, and Luc Renneboog, 2016, Socially responsible firms, forthcoming, Journal of
Financial Economics.
Fitzgerald, Niall, 2003, CSR: Rebuilding Trust in Business. A Perspective on Corporate Social Responsibility in
the 21st Century (Unilever and London Business School, London, UK).
Flammer, Caroline, 2015, Does corporate social responsibility lead to superior financial performance? A
regression discontinuity approach, Management Science 61, 2549-2568.
Fukuyama, Francis, 1995, Trust, (Free Press, New York, NY).
Gambetta, Diego, 1988, Can we trust trust? in Diego Gambetta, ed.: Trust: Making and Breaking Cooperative
Relations (University of Oxford, Oxford, UK).
Gao, Feng, Ling Lei Lisic, and Ivy Zhang, 2014, Commitment to social good and insider trading, Journal of
Accounting and Economics 57, 149-175.
Glaeser, Edward L., David Laibson, and Bruce Sacerdote, 2002, An economic approach to social capital,
Economic Journal 112, F437-F458.
Godfrey, Paul C., Craig B. Merrill, and Jared M. Hansen, 2009, The relationship between corporate social
responsibility and shareholder value: An empirical test of the risk management hypothesis, Strategic
Management Journal 30, 425-445.
34
Gormley, Todd A., and David A. Matsa, 2013, Common errors: How to (and not to) control for unobserved
heterogeneity, Review of Financial Studies 27, 617-661.
Gouldner, Alvin W., 1960, The norm or reciprocity: A preliminary statement, American Sociological Review 25,
161-178.
Goyal, Amit, and Pedro Santa-Clara, 2003, Idiosyncratic risk matters!, Journal of Finance 58, 975-1008.
Guiso, Luigo, Paola Sapienza, and Luigi Zingales, 2004, The role of social capital in financial development,
American Economic Review 94, 526-556.
Guiso, Luigo, Paola Sapienza, and Luigi Zingales, 2008, Trusting the stock market, Journal of Finance 63,
2557-2600.
Guiso, Luigo, Paola Sapienza, and Luigi Zingales, 2011, Civic capital as the missing link, in Jess Benhabib,
Alberto Bisin, and Matthew O. Jackson, eds.: Social Economics Handbook (North Holland, Amsterdam).
Guiso, Luigo, Paola Sapienza, and Luigi Zingales, 2015, The value of corporate culture, Journal of Financial
Economics 117, 60-76.
Gurria, Angel, 2009, Keynote Remarks by OECD Secretary-General, BIAC Business Roundtable.
Harford, Jarrad, Sandy Klasa, and William Maxwell, 2014, Refinancing risk and cash holdings, Journal of
Finance 69, 975-1012.
Hong, Harrison G., and Leonard Kostovetsky, 2012, Red and blue investing: Values and finance, Journal of
Financial Economics 103, 1-19.
Hong, Harrison G., Jeffrey D. Kubik, and Jeremy C. Stein, 2008, The only game in town: Stock-price
consequences of local bias, Journal of Financial Economics 90, 20-37.
Hong, Harrison G., and Inessa Liskovich, 2016, Crime, punishment and the value of corporate social
responsibility, Working paper, Princeton University.
Ivashina, Victoria, and David Scharfstein, 2010, Bank lending during the financial crisis of 2008, Journal of
Financial Economics 97, 319-338.
Kelly, Peter, 2015, Dividends and trust, Working paper, University of Notre Dame.
Kim, Yongtae, Myung Seok Park, and Benson Wier, 2012, Is earnings quality associated with corporate social
responsibility?, The Accounting Review 87, 761-796.
Kitzmueller, Markus, and Jay Shimshack, 2012, Economic perspectives on corporate social responsibility,
Journal of Economic Literature 50, 51-84.
35
Knack, Stephen, and Philip Keefer, 1997, Does social capital have an economic payoff? A cross-country
investigation, Quarterly Journal of Economics 112, 1251-1288.
Krüger, Philipp, 2015, Corporate goodness and shareholder wealth, Journal of Financial Economics 115, 304-
329.
La Porta, Rafael, Florencio Lopez-de-Silanes, Andrei Shleifer, and Robert W. Vishny, 1997, Trust in large
organizations, American Economic Review Papers and Proceedings 87, 333-338.
Leana, Carrie R. and Harry J. Van Buren, III, 1999, Organizational social capital and employment practices,
Academy of Management Review 24, 538-555.
Lin, Nan, 2001, Social Capital: A theory of social structure and action, (Cambridge University Press,
Cambridge).
Lins, Karl V., Paolo Volpin, and Hannes Wagner, 2013, Does family control matter? International evidence from
the 2088-2009 financial crisis, Review of Financial Studies 26, 2583-2619.
Margolis, Joshua D., Hillary Anger Elfenbein, and James P. Walsh, 2009, Does it pay to be good … and does it
matter? A meta-analysis of the relationship between corporate social and financial performance, Working paper,
Harvard University, Washington University in St Louis, and University of Michigan.
Nguyen, Tu, H.G. (Lily) Nguyen, and Xiangkang Yin, 2015, Corporate governance and corporate financing and
investment during the 2007-2008 financial crisis, Financial Management 44, 115-146.
Minor, Dylan B., 2015, The value of corporate citizenship: Protection, Working paper, Harvard Business School.
OECD, 2007, Human capital: How what you know shapes your life.
Porter, Michael E., and Mark R. Kramer, 2006, Strategy and society: The link between competitive advantage
and corporate social responsibility, Harvard Business Review, December, 78-93.
Porter, Michael E., and Mark R. Kramer, 2011, Creating shared value, Harvard Business Review, January, 1-17.
PricewaterhouseCoopers, 2013, 16th CEO Survey, http://www.pwc.com/gx/en/ceo-survey/2013/.
PricewaterhouseCoopers, 2014, 17th CEO Survey, http://www.pwc.com/gx/en/ceo-survey/2014/.
Putnam, Robert D., 1993, Making Democracy Work: Civic Traditions in Modern Italy, (Princeton University
Press, Princeton, NJ).
Putnam, Robert D., 2000, Bowling Alone: The Collapse and Revival of American Community, (Simon and
Schuster, New York, NY).
36
Sacconi Lorenzo, and Giacomo Degli Antoni, 2011, Social Capital, Corporate Responsibility, Economic
Behaviour and Performance, (Palgrave MacMillan, New York, NY).
Sapienza, Paola, Anna Toldra-Simats, and Luigi Zingales, 2013, Understanding trust, Economic Journal 123,
1313-1332.
Sapienza, Paola, and Luigi Zingales, 2012, A trust crisis, International Review of Finance 12:2, 123-131.
Scrivens, Katherine, and Conal Smith, 2013, Four interpretations of social capital: An agenda for measurement,
OECD Statistics Working paper.
Servaes, Henri, and Ane Tamayo, 2013, The impact of corporate social responsibility on the value of the firm:
the role of customer awareness, Management Science 59, 1045-1061.
Solow, Robert M., 1995, Trust: The social virtues and the creation of prosperity (Book review), The New
Republic, 213, 36-40.
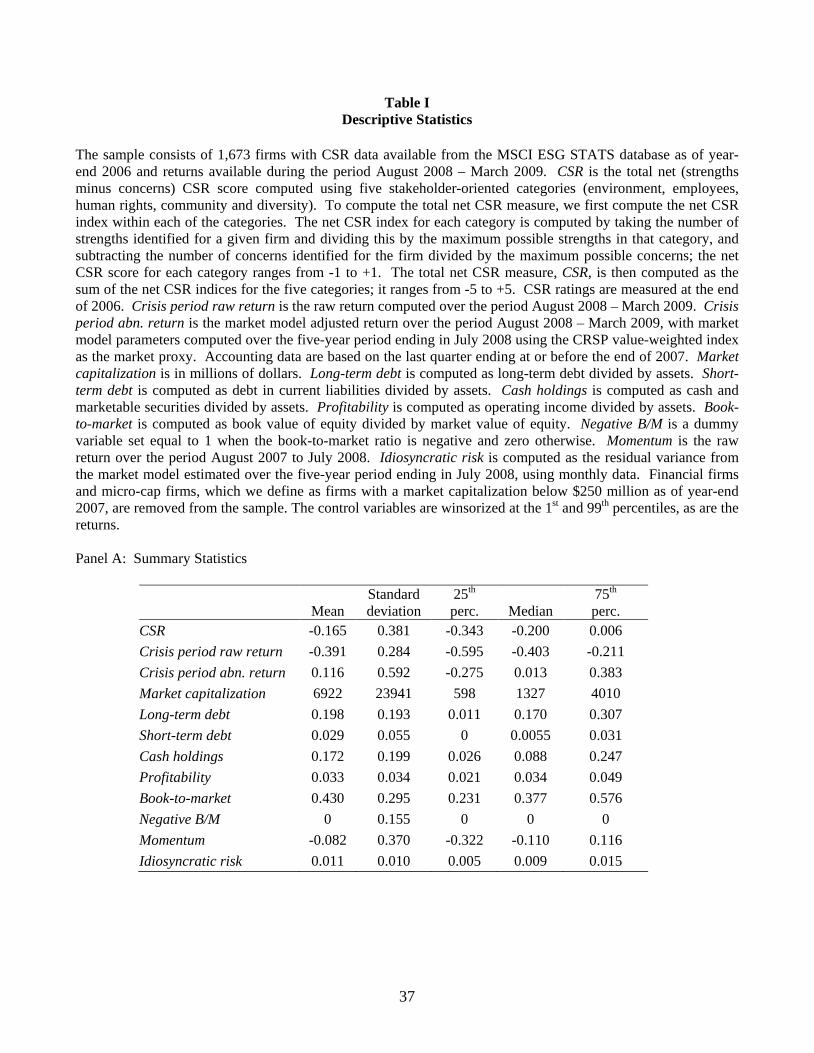
37
Table I Descriptive Statistics
The sample consists of 1,673 firms with CSR data available from the MSCI ESG STATS database as of year-end 2006 and returns available during the period August 2008 – March 2009. CSR is the total net (strengths minus concerns) CSR score computed using five stakeholder-oriented categories (environment, employees, human rights, community and diversity). To compute the total net CSR measure, we first compute the net CSR index within each of the categories. The net CSR index for each category is computed by taking the number of strengths identified for a given firm and dividing this by the maximum possible strengths in that category, and subtracting the number of concerns identified for the firm divided by the maximum possible concerns; the net CSR score for each category ranges from -1 to +1. The total net CSR measure, CSR, is then computed as the sum of the net CSR indices for the five categories; it ranges from -5 to +5. CSR ratings are measured at the end of 2006. Crisis period raw return is the raw return computed over the period August 2008 – March 2009. Crisis period abn. return is the market model adjusted return over the period August 2008 – March 2009, with market model parameters computed over the five-year period ending in July 2008 using the CRSP value-weighted index as the market proxy. Accounting data are based on the last quarter ending at or before the end of 2007. Market capitalization is in millions of dollars. Long-term debt is computed as long-term debt divided by assets. Short-term debt is computed as debt in current liabilities divided by assets. Cash holdings is computed as cash and marketable securities divided by assets. Profitability is computed as operating income divided by assets. Book-to-market is computed as book value of equity divided by market value of equity. Negative B/M is a dummy variable set equal to 1 when the book-to-market ratio is negative and zero otherwise. Momentum is the raw return over the period August 2007 to July 2008. Idiosyncratic risk is computed as the residual variance from the market model estimated over the five-year period ending in July 2008, using monthly data. Financial firms and micro-cap firms, which we define as firms with a market capitalization below $250 million as of year-end 2007, are removed from the sample. The control variables are winsorized at the 1st and 99th percentiles, as are the returns. Panel A: Summary Statistics
Mean Standard deviation
25th perc.
Median
75th perc.
CSR -0.165 0.381 -0.343 -0.200 0.006 Crisis period raw return -0.391 0.284 -0.595 -0.403 -0.211 Crisis period abn. return 0.116 0.592 -0.275 0.013 0.383 Market capitalization 6922 23941 598 1327 4010 Long-term debt 0.198 0.193 0.011 0.170 0.307 Short-term debt 0.029 0.055 0 0.0055 0.031 Cash holdings 0.172 0.199 0.026 0.088 0.247 Profitability 0.033 0.034 0.021 0.034 0.049 Book-to-market 0.430 0.295 0.231 0.377 0.576 Negative B/M 0 0.155 0 0 0 Momentum -0.082 0.370 -0.322 -0.110 0.116 Idiosyncratic risk 0.011 0.010 0.005 0.009 0.015
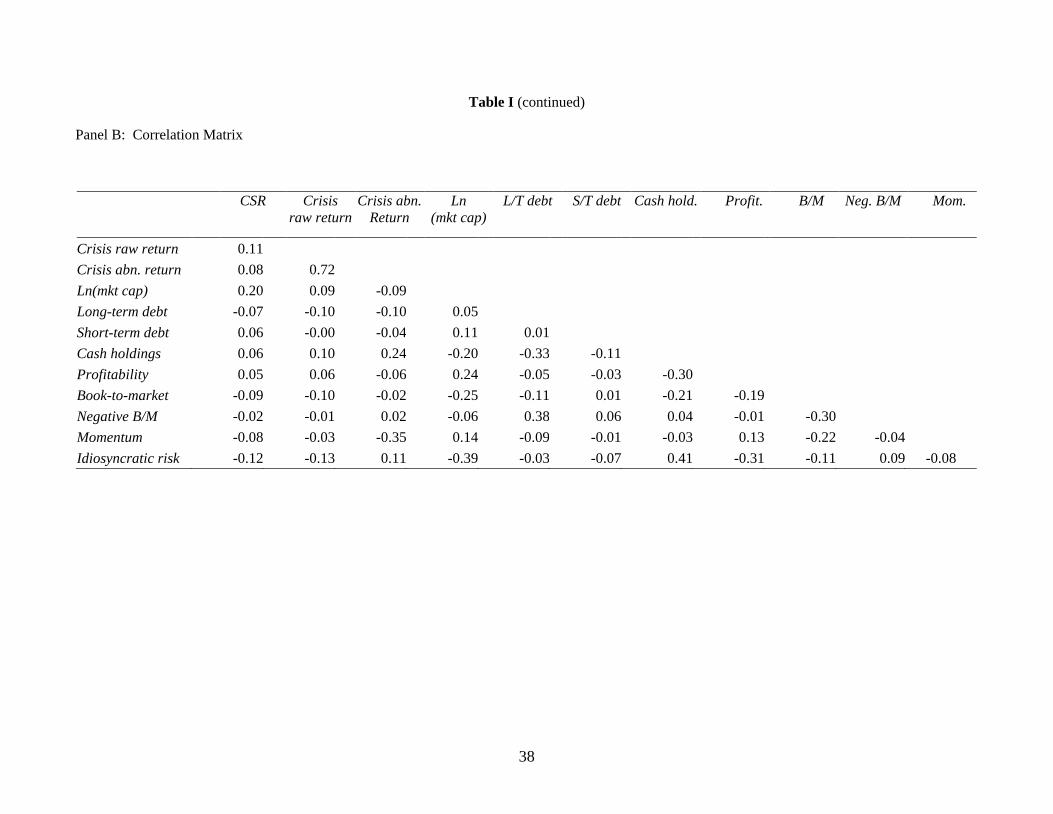
38
Table I (continued)
Panel B: Correlation Matrix
CSR Crisis raw return
Crisis abn. Return
Ln (mkt cap)
L/T debt S/T debt Cash hold. Profit. B/M Neg. B/M Mom.
Crisis raw return 0.11 Crisis abn. return 0.08 0.72 Ln(mkt cap) 0.20 0.09 -0.09 Long-term debt -0.07 -0.10 -0.10 0.05 Short-term debt 0.06 -0.00 -0.04 0.11 0.01 Cash holdings 0.06 0.10 0.24 -0.20 -0.33 -0.11 Profitability 0.05 0.06 -0.06 0.24 -0.05 -0.03 -0.30 Book-to-market -0.09 -0.10 -0.02 -0.25 -0.11 0.01 -0.21 -0.19 Negative B/M -0.02 -0.01 0.02 -0.06 0.38 0.06 0.04 -0.01 -0.30 Momentum -0.08 -0.03 -0.35 0.14 -0.09 -0.01 -0.03 0.13 -0.22 -0.04 Idiosyncratic risk -0.12 -0.13 0.11 -0.39 -0.03 -0.07 0.41 -0.31 -0.11 0.09 -0.08
39
Table II Crisis Period Returns and CSR
This table presents regression estimates of crisis period returns on CSR and control variables. Crisis period returns are measured as both raw buy and hold returns and abnormal returns over the period August 2008 to March 2009. In Panel A, we use a linear measure of CSR, CSR, which is the net (strengths minus concerns) CSR score computed using five stakeholder-oriented categories, measured at the end of 2006. In Panel B, we use 0/1 dummy variables for CSR quartiles such that: CSR2 takes the value of 1 if the firm is in the second CSR quartile and 0 otherwise; CSR3 takes the value of 1 if the firm is in the third CSR quartile and 0 otherwise; CSR4 takes the value of 1 if the firm is in the fourth CSR quartile and zero otherwise. In Panel C, we employ the linear measure of CSR and add measures of corporate governance. ESG Stats governance index is the net CSR index for the governance category and is computed by taking the number of strengths, divided by the possible maximum, and subtracting the number of concerns, divided by the possible maximum; the ESG Stats governance index ranges from –1 to +1. The E-index is the sum of six dummies reflecting the following anti-takeover provisions: (i) a staggered board, (ii) limits to amend the charter, (iii) limits to amend bylaws, (iv) supermajority voting requirements, (v) golden parachutes for executives, and (vi) the ability to adopt a poison pill (see Bebchuk, Cohen, and Ferrell (2009)), obtained from MSCI Governance Metrics. Board independence (fraction of board consisting of outside directors), Board size, a dummy if the CEO is not the Chairman, and Board ownership (fraction of outstanding shares owned by the board members) are obtained from the MSCI Directors database. When the governance metrics are not available on the MSCI databases, we set them equal to zero and code a missing variable dummy which we set equal to one if that governance item is missing. These dummies are included in all models, but their coefficients are not reported. All control variables are as defined in Table I. Industry dummies are defined at the two-digit SIC code level. Financial firms and micro-cap firms with a market capitalization below $250 million are removed from the sample. The control variables and returns are winsorized at the 1st and 99th percentiles. Heteroscedasticity consistent standard errors are presented in parentheses. ***, **, * indicate that the parameter estimate is significantly different from zero at the 1%, 5%, or 10% level, respectively.
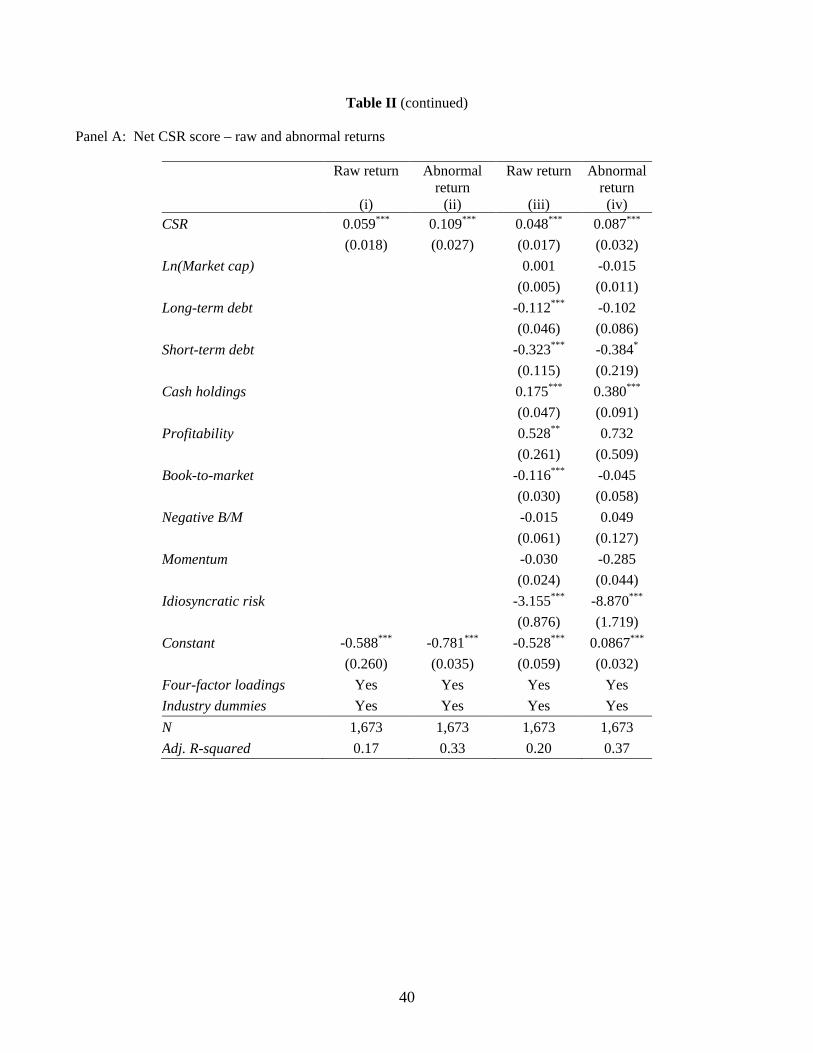
40
Table II (continued)
Panel A: Net CSR score – raw and abnormal returns
Raw return
(i)
Abnormal return
(ii)
Raw return
(iii)
Abnormal return (iv)
CSR 0.059*** 0.109*** 0.048*** 0.087*** (0.018) (0.027) (0.017) (0.032) Ln(Market cap) 0.001 -0.015 (0.005) (0.011) Long-term debt -0.112*** -0.102 (0.046) (0.086) Short-term debt -0.323*** -0.384* (0.115) (0.219) Cash holdings 0.175*** 0.380*** (0.047) (0.091) Profitability 0.528** 0.732 (0.261) (0.509) Book-to-market -0.116*** -0.045 (0.030) (0.058) Negative B/M -0.015 0.049 (0.061) (0.127) Momentum -0.030 -0.285 (0.024) (0.044) Idiosyncratic risk -3.155*** -8.870*** (0.876) (1.719) Constant -0.588*** -0.781*** -0.528*** 0.0867*** (0.260) (0.035) (0.059) (0.032) Four-factor loadings Yes Yes Yes Yes Industry dummies Yes Yes Yes Yes N 1,673 1,673 1,673 1,673 Adj. R-squared 0.17 0.33 0.20 0.37

41
Table II (continued)
Panel B: Dummies for quartiles of net CSR score – raw and abnormal returns
Raw return
(i)
Abnormal return
(ii)
Raw return
(iii)
Abnormal return (iv)
CSR2 0.0303 0.0560 0.0296 0.0480 (0.0192) (0.0347) (0.0188) (0.0341) CSR3 0.0365* 0.0649* 0.0405** 0.0562 (0.0197) (0.0373) (0.0192) (0.0361) CSR4 0.0552*** 0.0985*** 0.0453** 0.0727** (0.0126) (0.0356) (0.0194) (0.0362) Ln(Market cap) 0.002 -0.012 (0.006) (0.011) Long-term debt -0.113*** -0.103 (0.046) (0.087) Short-term debt -0.328*** -0.386* (0.115) (0.219) Cash holdings 0.175*** 0.381*** (0.047) (0.091) Profitability 0.530** 0.734 (0.260) (0.508) Book-to-market -0.117*** -0.046 (0.030) (0.057) Negative B/M -0.017 0.046 (0.061) (0.058) Momentum -0.031 -0.288 (0.024) (0.044) Idiosyncratic risk -3.184*** -8.934*** (0.874) (1.729) Four factor loadings Yes Yes Yes Yes Industry dummies Yes Yes Yes Yes N 1,673 1,673 1,673 1,673 Adj. R-squared 0.16 0.32 0.20 0.36
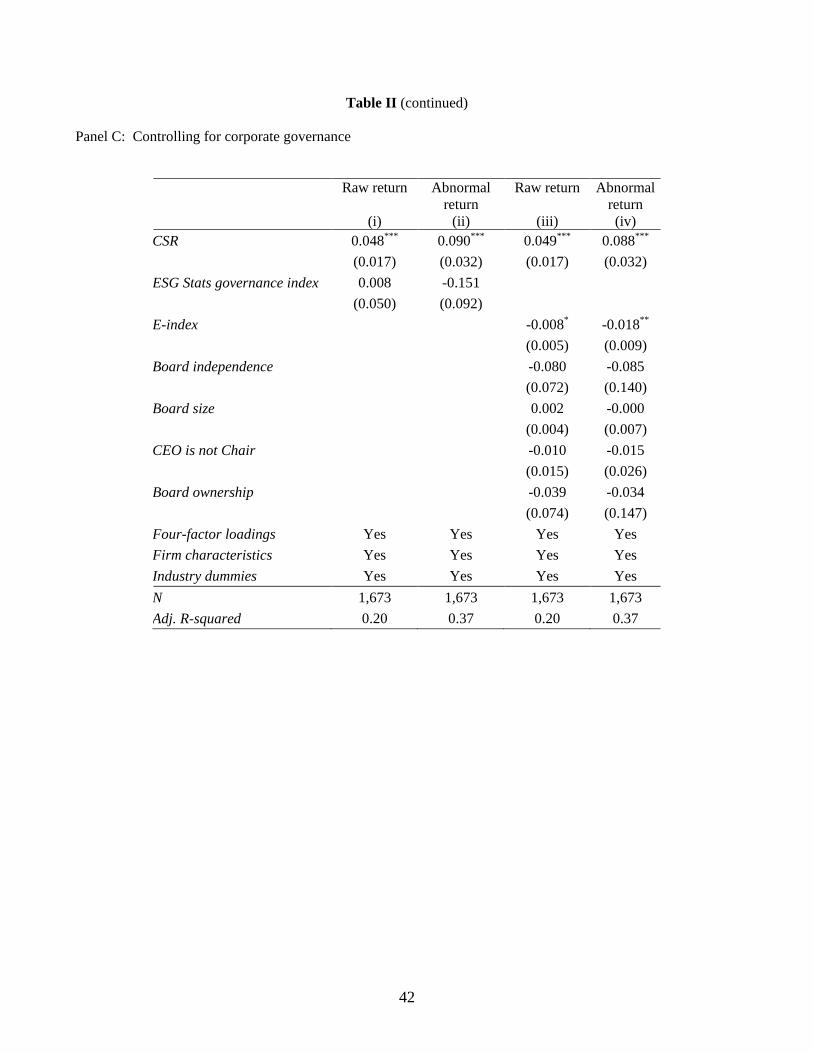
42
Table II (continued) Panel C: Controlling for corporate governance
Raw return
(i)
Abnormal return
(ii)
Raw return
(iii)
Abnormal return (iv)
CSR 0.048*** 0.090*** 0.049*** 0.088*** (0.017) (0.032) (0.017) (0.032) ESG Stats governance index 0.008 -0.151 (0.050) (0.092) E-index -0.008* -0.018** (0.005) (0.009) Board independence -0.080 -0.085 (0.072) (0.140) Board size 0.002 -0.000 (0.004) (0.007) CEO is not Chair -0.010 -0.015 (0.015) (0.026) Board ownership -0.039 -0.034 (0.074) (0.147) Four-factor loadings Yes Yes Yes Yes Firm characteristics Yes Yes Yes Yes Industry dummies Yes Yes Yes Yes N 1,673 1,673 1,673 1,673 Adj. R-squared 0.20 0.37 0.20 0.37
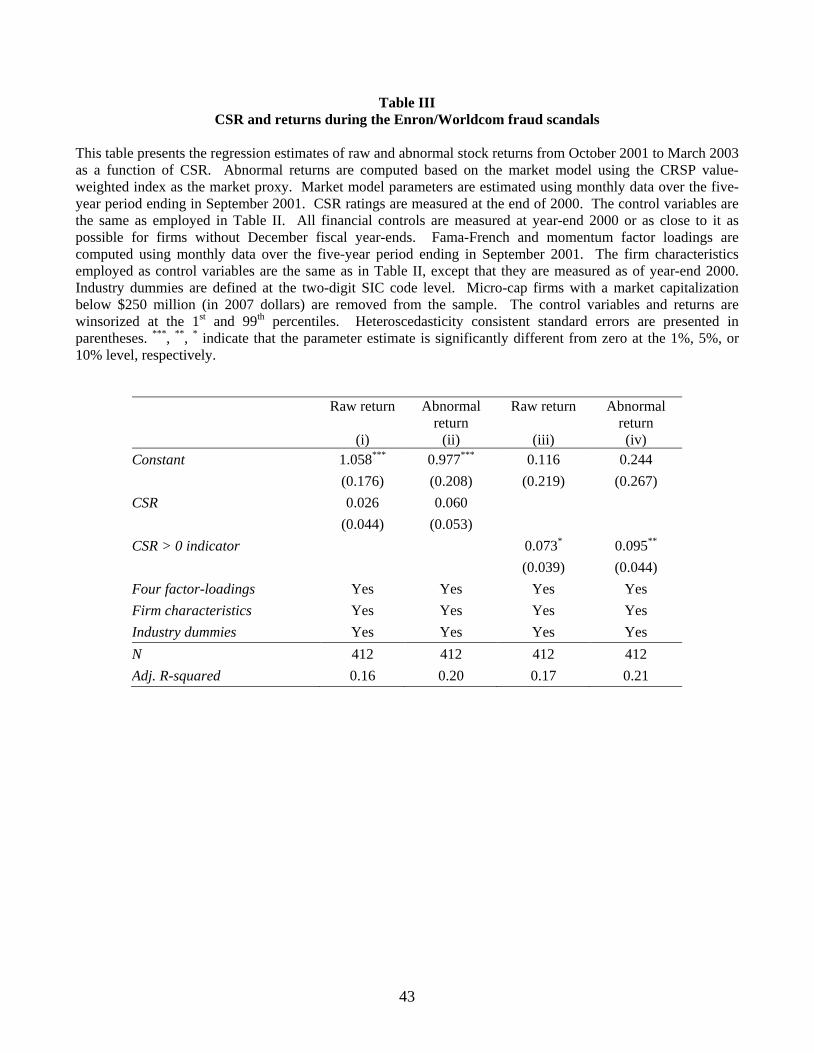
43
Table III CSR and returns during the Enron/Worldcom fraud scandals
This table presents the regression estimates of raw and abnormal stock returns from October 2001 to March 2003 as a function of CSR. Abnormal returns are computed based on the market model using the CRSP value-weighted index as the market proxy. Market model parameters are estimated using monthly data over the five-year period ending in September 2001. CSR ratings are measured at the end of 2000. The control variables are the same as employed in Table II. All financial controls are measured at year-end 2000 or as close to it as possible for firms without December fiscal year-ends. Fama-French and momentum factor loadings are computed using monthly data over the five-year period ending in September 2001. The firm characteristics employed as control variables are the same as in Table II, except that they are measured as of year-end 2000. Industry dummies are defined at the two-digit SIC code level. Micro-cap firms with a market capitalization below $250 million (in 2007 dollars) are removed from the sample. The control variables and returns are winsorized at the 1st and 99th percentiles. Heteroscedasticity consistent standard errors are presented in parentheses. ***, **, * indicate that the parameter estimate is significantly different from zero at the 1%, 5%, or 10% level, respectively.
Raw return
(i)
Abnormal return
(ii)
Raw return
(iii)
Abnormal return (iv)
Constant 1.058*** 0.977*** 0.116 0.244 (0.176) (0.208) (0.219) (0.267) CSR 0.026 0.060 (0.044) (0.053) CSR > 0 indicator 0.073* 0.095** (0.039) (0.044) Four factor-loadings Yes Yes Yes Yes Firm characteristics Yes Yes Yes Yes Industry dummies Yes Yes Yes Yes N 412 412 412 412 Adj. R-squared 0.16 0.20 0.17 0.21
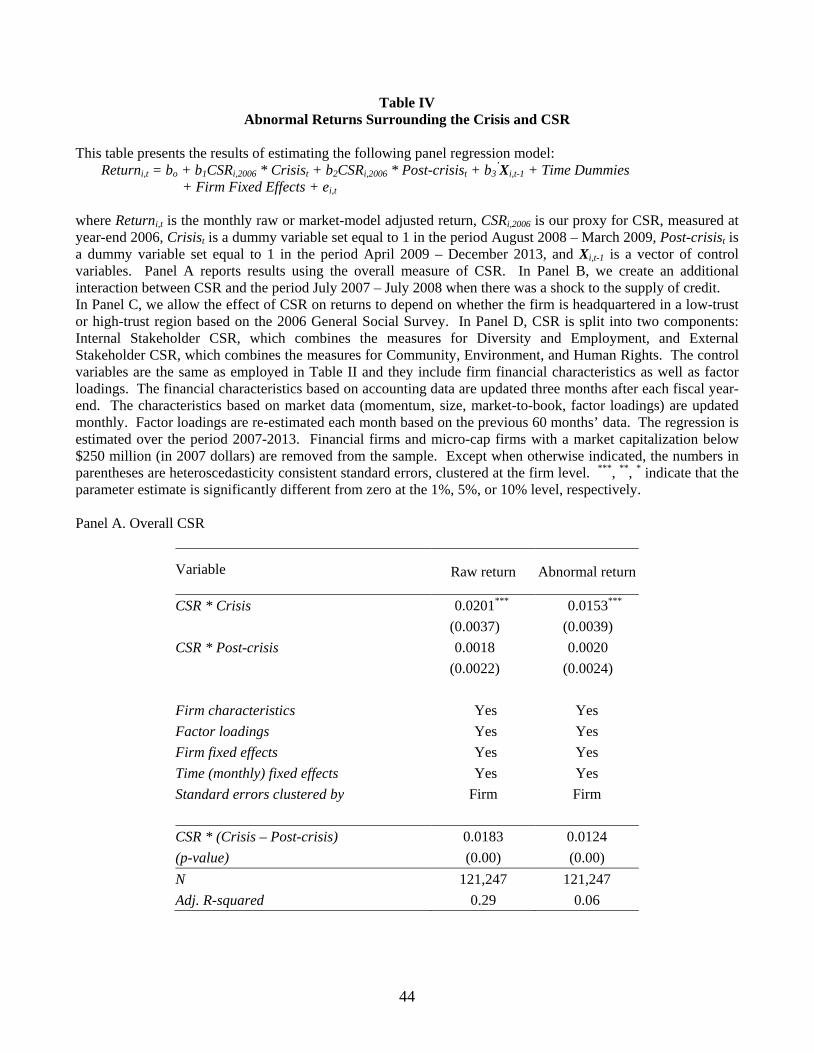
44
Table IV Abnormal Returns Surrounding the Crisis and CSR
This table presents the results of estimating the following panel regression model: Returni,t = bo + b1CSRi,2006 * Crisist + b2CSRi,2006 * Post-crisist + b3
’Xi,t-1 + Time Dummies + Firm Fixed Effects + ei,t
where Returni,t is the monthly raw or market-model adjusted return, CSRi,2006 is our proxy for CSR, measured at year-end 2006, Crisist is a dummy variable set equal to 1 in the period August 2008 – March 2009, Post-crisist is a dummy variable set equal to 1 in the period April 2009 – December 2013, and Xi,t-1 is a vector of control variables. Panel A reports results using the overall measure of CSR. In Panel B, we create an additional interaction between CSR and the period July 2007 – July 2008 when there was a shock to the supply of credit. In Panel C, we allow the effect of CSR on returns to depend on whether the firm is headquartered in a low-trust or high-trust region based on the 2006 General Social Survey. In Panel D, CSR is split into two components: Internal Stakeholder CSR, which combines the measures for Diversity and Employment, and External Stakeholder CSR, which combines the measures for Community, Environment, and Human Rights. The control variables are the same as employed in Table II and they include firm financial characteristics as well as factor loadings. The financial characteristics based on accounting data are updated three months after each fiscal year-end. The characteristics based on market data (momentum, size, market-to-book, factor loadings) are updated monthly. Factor loadings are re-estimated each month based on the previous 60 months’ data. The regression is estimated over the period 2007-2013. Financial firms and micro-cap firms with a market capitalization below $250 million (in 2007 dollars) are removed from the sample. Except when otherwise indicated, the numbers in parentheses are heteroscedasticity consistent standard errors, clustered at the firm level. ***, **, * indicate that the parameter estimate is significantly different from zero at the 1%, 5%, or 10% level, respectively. Panel A. Overall CSR
Variable
Raw return Abnormal return
CSR * Crisis 0.0201*** 0.0153*** (0.0037) (0.0039) CSR * Post-crisis 0.0018 0.0020
(0.0022) (0.0024) Firm characteristics Yes Yes Factor loadings Yes Yes Firm fixed effects Yes Yes Time (monthly) fixed effects Yes Yes Standard errors clustered by Firm Firm CSR * (Crisis – Post-crisis) 0.0183 0.0124 (p-value) (0.00) (0.00) N 121,247 121,247 Adj. R-squared 0.29 0.06
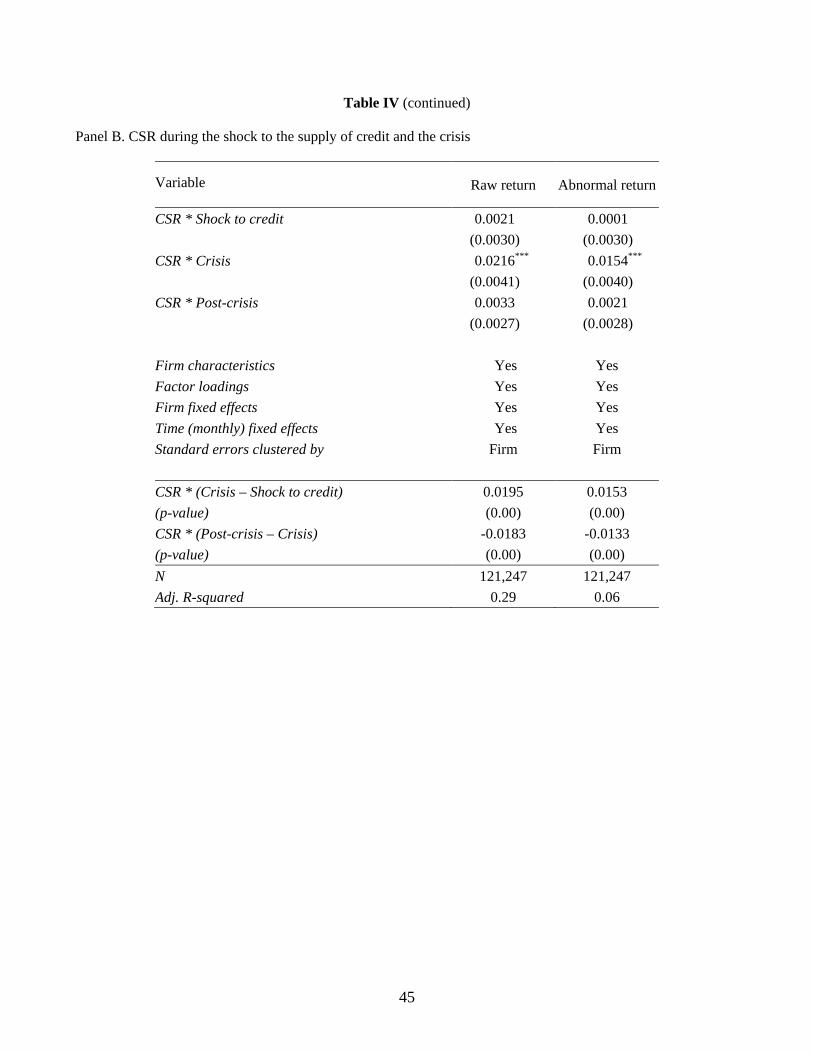
45
Table IV (continued) Panel B. CSR during the shock to the supply of credit and the crisis
Variable
Raw return Abnormal return
CSR * Shock to credit 0.0021 0.0001 (0.0030) (0.0030) CSR * Crisis 0.0216*** 0.0154*** (0.0041) (0.0040) CSR * Post-crisis 0.0033 0.0021
(0.0027) (0.0028) Firm characteristics Yes Yes Factor loadings Yes Yes Firm fixed effects Yes Yes Time (monthly) fixed effects Yes Yes Standard errors clustered by Firm Firm CSR * (Crisis – Shock to credit) 0.0195 0.0153 (p-value) (0.00) (0.00) CSR * (Post-crisis – Crisis) -0.0183 -0.0133 (p-value) (0.00) (0.00) N 121,247 121,247 Adj. R-squared 0.29 0.06
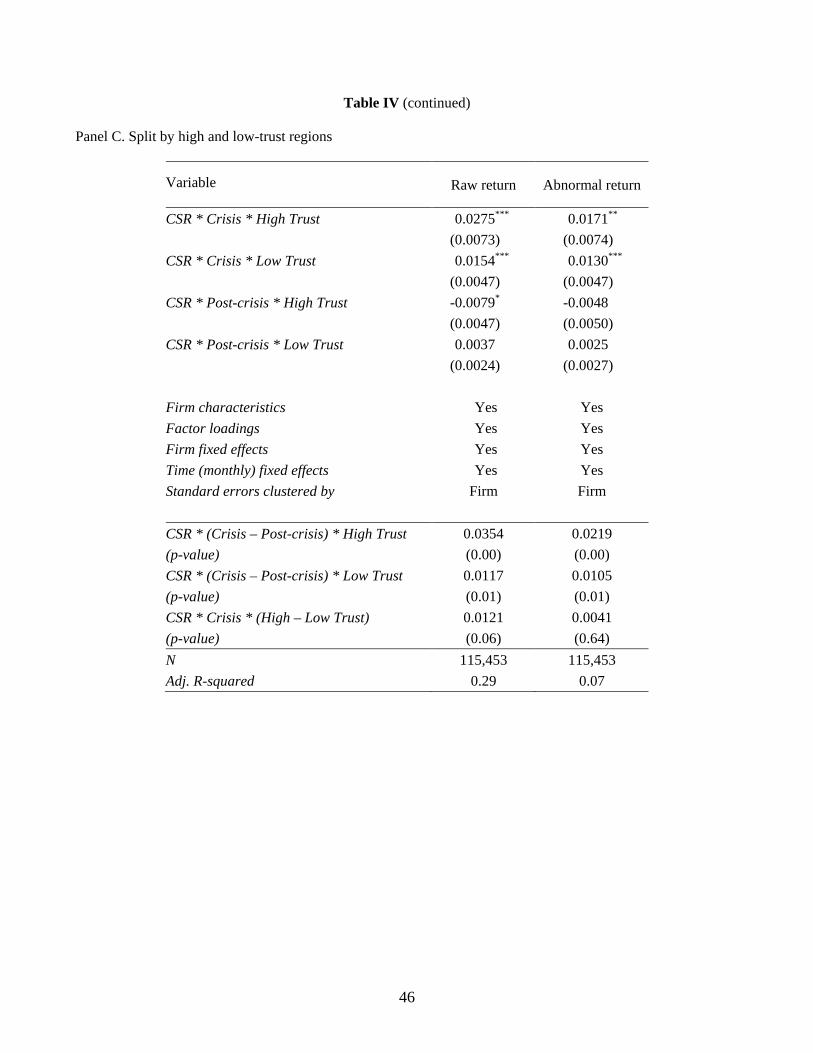
46
Table IV (continued) Panel C. Split by high and low-trust regions
Variable
Raw return Abnormal return
CSR * Crisis * High Trust 0.0275*** 0.0171** (0.0073) (0.0074) CSR * Crisis * Low Trust 0.0154*** 0.0130*** (0.0047) (0.0047) CSR * Post-crisis * High Trust -0.0079* -0.0048
(0.0047) (0.0050) CSR * Post-crisis * Low Trust 0.0037 0.0025
(0.0024) (0.0027) Firm characteristics Yes Yes Factor loadings Yes Yes Firm fixed effects Yes Yes Time (monthly) fixed effects Yes Yes Standard errors clustered by Firm Firm CSR * (Crisis – Post-crisis) * High Trust 0.0354 0.0219 (p-value) (0.00) (0.00) CSR * (Crisis – Post-crisis) * Low Trust 0.0117 0.0105 (p-value) (0.01) (0.01) CSR * Crisis * (High – Low Trust) 0.0121 0.0041 (p-value) (0.06) (0.64) N 115,453 115,453 Adj. R-squared 0.29 0.07
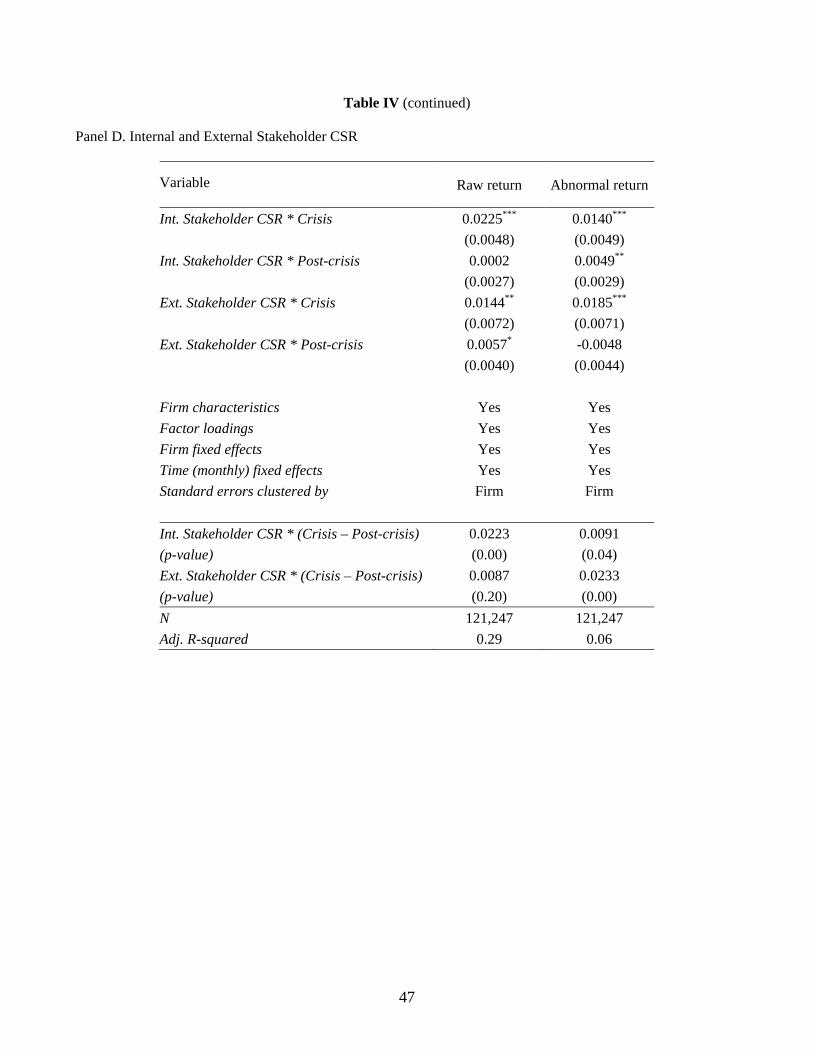
47
Table IV (continued) Panel D. Internal and External Stakeholder CSR
Variable
Raw return Abnormal return
Int. Stakeholder CSR * Crisis 0.0225*** 0.0140*** (0.0048) (0.0049) Int. Stakeholder CSR * Post-crisis 0.0002 0.0049**
(0.0027) (0.0029) Ext. Stakeholder CSR * Crisis 0.0144** 0.0185***
(0.0072) (0.0071) Ext. Stakeholder CSR * Post-crisis 0.0057* -0.0048
(0.0040) (0.0044) Firm characteristics Yes Yes Factor loadings Yes Yes Firm fixed effects Yes Yes Time (monthly) fixed effects Yes Yes Standard errors clustered by Firm Firm Int. Stakeholder CSR * (Crisis – Post-crisis) 0.0223 0.0091 (p-value) (0.00) (0.04) Ext. Stakeholder CSR * (Crisis – Post-crisis) 0.0087 0.0233 (p-value) (0.20) (0.00) N 121,247 121,247 Adj. R-squared 0.29 0.06
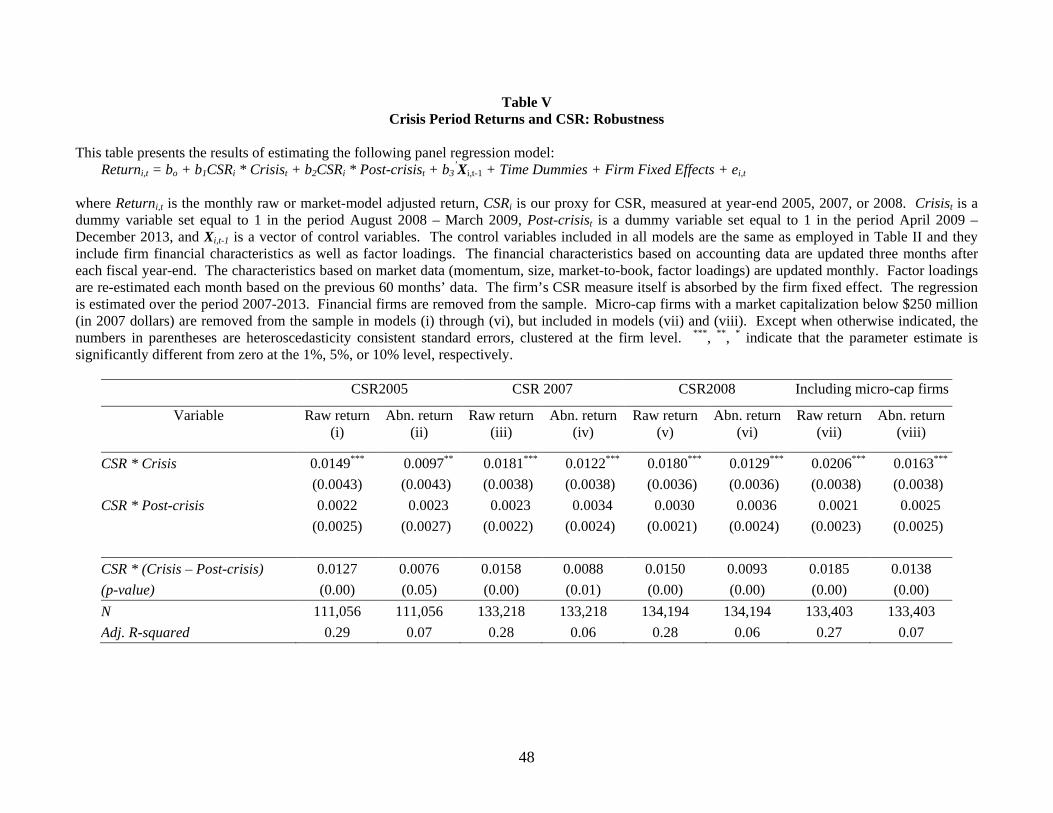
48
Table V Crisis Period Returns and CSR: Robustness
This table presents the results of estimating the following panel regression model: Returni,t = bo + b1CSRi * Crisist + b2CSRi * Post-crisist + b3
’Xi,t-1 + Time Dummies + Firm Fixed Effects + ei,t
where Returni,t is the monthly raw or market-model adjusted return, CSRi is our proxy for CSR, measured at year-end 2005, 2007, or 2008. Crisist is a dummy variable set equal to 1 in the period August 2008 – March 2009, Post-crisist is a dummy variable set equal to 1 in the period April 2009 – December 2013, and Xi,t-1 is a vector of control variables. The control variables included in all models are the same as employed in Table II and they include firm financial characteristics as well as factor loadings. The financial characteristics based on accounting data are updated three months after each fiscal year-end. The characteristics based on market data (momentum, size, market-to-book, factor loadings) are updated monthly. Factor loadings are re-estimated each month based on the previous 60 months’ data. The firm’s CSR measure itself is absorbed by the firm fixed effect. The regression is estimated over the period 2007-2013. Financial firms are removed from the sample. Micro-cap firms with a market capitalization below $250 million (in 2007 dollars) are removed from the sample in models (i) through (vi), but included in models (vii) and (viii). Except when otherwise indicated, the numbers in parentheses are heteroscedasticity consistent standard errors, clustered at the firm level. ***, **, * indicate that the parameter estimate is significantly different from zero at the 1%, 5%, or 10% level, respectively.
CSR2005 CSR 2007 CSR2008 Including micro-cap firms
Variable
Raw return (i)
Abn. return (ii)
Raw return (iii)
Abn. return (iv)
Raw return (v)
Abn. return (vi)
Raw return (vii)
Abn. return (viii)
CSR * Crisis 0.0149*** 0.0097** 0.0181*** 0.0122*** 0.0180*** 0.0129*** 0.0206*** 0.0163*** (0.0043) (0.0043) (0.0038) (0.0038) (0.0036) (0.0036) (0.0038) (0.0038) CSR * Post-crisis 0.0022 0.0023 0.0023 0.0034 0.0030 0.0036 0.0021 0.0025 (0.0025) (0.0027) (0.0022) (0.0024) (0.0021) (0.0024) (0.0023) (0.0025) CSR * (Crisis – Post-crisis) 0.0127 0.0076 0.0158 0.0088 0.0150 0.0093 0.0185 0.0138 (p-value) (0.00) (0.05) (0.00) (0.01) (0.00) (0.00) (0.00) (0.00) N 111,056 111,056 133,218 133,218 134,194 134,194 133,403 133,403 Adj. R-squared 0.29 0.07 0.28 0.06 0.28 0.06 0.27 0.07
49
Table VI Operating performance, employee growth, capital raising, and CSR surrounding the crisis
Models (i)-(v) and (viii)-(ix) are regressions of various measures of performance and capital raising using the following specification: Outcomei,t = bo + b1CSRi,2006 * Crisist + b2CSRi,2006 * Post-crisist + b3
’Xi,t-1 + Time Dummies + Firm Fixed Effects + ei,t where CSRi,2006 is our measure of CSR computed as of year-end 2006, Crisist is a dummy variable set equal to one for quarters ending from October 2008 to March 2009. Post-crisist is a dummy variable set equal to one for quarters ending from April 2009 to December 2013. Xi,t-1 is a vector of control variables. In the models of performance, we control for the log of total assets. In the models of security issuance, we control for the log of total assets, the ratio of cash holdings to assets lagged one quarter, the ratio of total debt to assets lagged one quarter and the ratio of operating income to assets. The performance measures are: Operating return on assets, measured as operating income to assets, Gross margin, measured as (sales – cost of goods sold) / sales, Sales growth, measured as the percentage change in sales from the previous quarter, Accounts Receivable divided by Sales, and Sales per employee. Measures of capital raising are: long-term debt issuance divided by assets and equity issuance divided by assets. All data items are from quarterly Compustat, except number of employees, which is from the annual Compustat database. Time dummies are specified at the quarterly level. All performance and security issuance measures have been winsorized at the 1st and 99th percentiles. Models (vi) and (vii) contain regressions of the following model: Employment growthi,t = bo + b1CSRi,2006 * 2008/2009 + b2CSRi,2006 * 2010/2013 + b3LogAssets + Time Dummies + Firm Fixed Effects + ei,t where employment growth is the percentage growth in employees relative to the prior year, 2008/2009 is a dummy for observations in 2008 and 2009, and 2010/2013 is a dummy for observations in 2010 to 2013. Data are from the annual Compustat data base and time dummies are specified at the annual level. In model (vi), employment growth is winsorized at the 1st and 99th percentiles. In both panels, the regression is estimated over the period 2007-2013. Financial firms and firms with a market capitalization below $250 million as of year-end 2007 are removed from the sample. Standard errors, clustered at the firm level are listed in parentheses. ***, **, * indicate that the parameter estimate is significantly different from zero at the 1%, 5%, or 10% level, respectively.
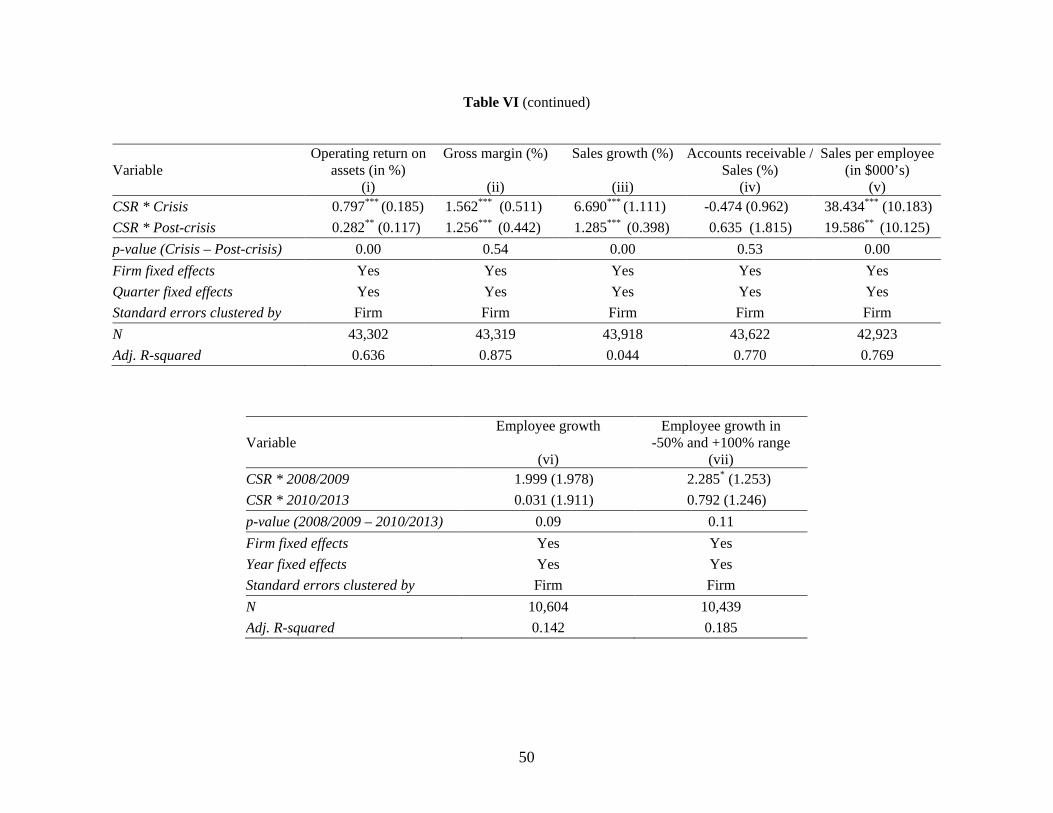
50
Table VI (continued)
Variable Operating return on
assets (in %) (i)
Gross margin (%)
(ii)
Sales growth (%)
(iii)
Accounts receivable / Sales (%)
(iv)
Sales per employee (in $000’s)
(v) CSR * Crisis 0.797*** (0.185) 1.562*** (0.511) 6.690*** (1.111) -0.474 (0.962) 38.434*** (10.183) CSR * Post-crisis 0.282** (0.117) 1.256*** (0.442) 1.285*** (0.398) 0.635 (1.815) 19.586** (10.125) p-value (Crisis – Post-crisis) 0.00 0.54 0.00 0.53 0.00 Firm fixed effects Yes Yes Yes Yes Yes Quarter fixed effects Yes Yes Yes Yes Yes Standard errors clustered by Firm Firm Firm Firm Firm N 43,302 43,319 43,918 43,622 42,923 Adj. R-squared 0.636 0.875 0.044 0.770 0.769
Variable Employee growth
(vi)
Employee growth in -50% and +100% range
(vii) CSR * 2008/2009 1.999 (1.978) 2.285* (1.253) CSR * 2010/2013 0.031 (1.911) 0.792 (1.246) p-value (2008/2009 – 2010/2013) 0.09 0.11 Firm fixed effects Yes Yes Year fixed effects Yes Yes Standard errors clustered by Firm Firm N 10,604 10,439 Adj. R-squared 0.142 0.185
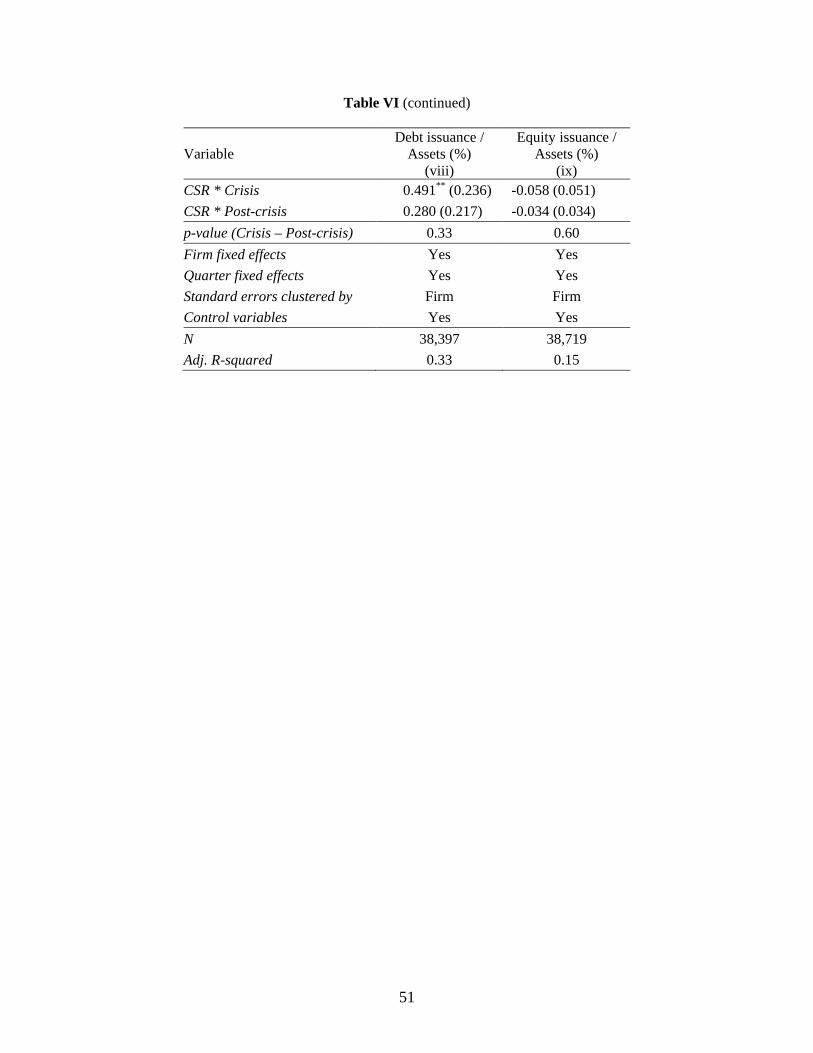
51
Table VI (continued)
Variable Debt issuance /
Assets (%) (viii)
Equity issuance / Assets (%)
(ix) CSR * Crisis 0.491** (0.236) -0.058 (0.051) CSR * Post-crisis 0.280 (0.217) -0.034 (0.034) p-value (Crisis – Post-crisis) 0.33 0.60 Firm fixed effects Yes Yes Quarter fixed effects Yes Yes Standard errors clustered by Firm Firm Control variables Yes Yes N 38,397 38,719 Adj. R-squared 0.33 0.15