Embed Size (px)
Citation preview
{ CORPORATE PRESENTATION }
Karin Technology Holdings Limited FY2013 Half Year Results

{ KARIN GROUP AT A GLANCE }
► A leading HK-based electronic and
industrial components and IT solutions
distributor and services provider, as well
as consumer electronics products retailer
► Established track record since 1977
► Strong Asia Pacific presence and network
Over 400 staff across 25 subsidiaries and
offices in the region
► Established business and distribution
channels in Hong Kong, Beijing,
Hangzhou, Qingdao, Xiamen, Shanghai,
Shenzhen, Guangzhou, Chongqing,
Changsha, Xian and Singapore
► Diversified customer base of more than
1,000 cutting across various sectors
► Listed on SGX Mainboard in 2005
Components Distribution: 17.9%
IC Application Design: 3.0%
IT Infrastructure:23.1%
1HFY13 Revenue by Business (Total: HK$2.1 billion)
Consumer Electronics Products: 56.0%

Non-Toys
Toys
Professional
Services
IC Application
Design
Components
Distribution
System Integrated
Solutions
Components
IT
Infrastructure
Industrial Materials & Instrumentation
Electronic Components
Application Consultancy
Systems/ Storage/ Network & Security
Integrated Solutions
Product Solutions
{ CORE BUSINESS }
Retail
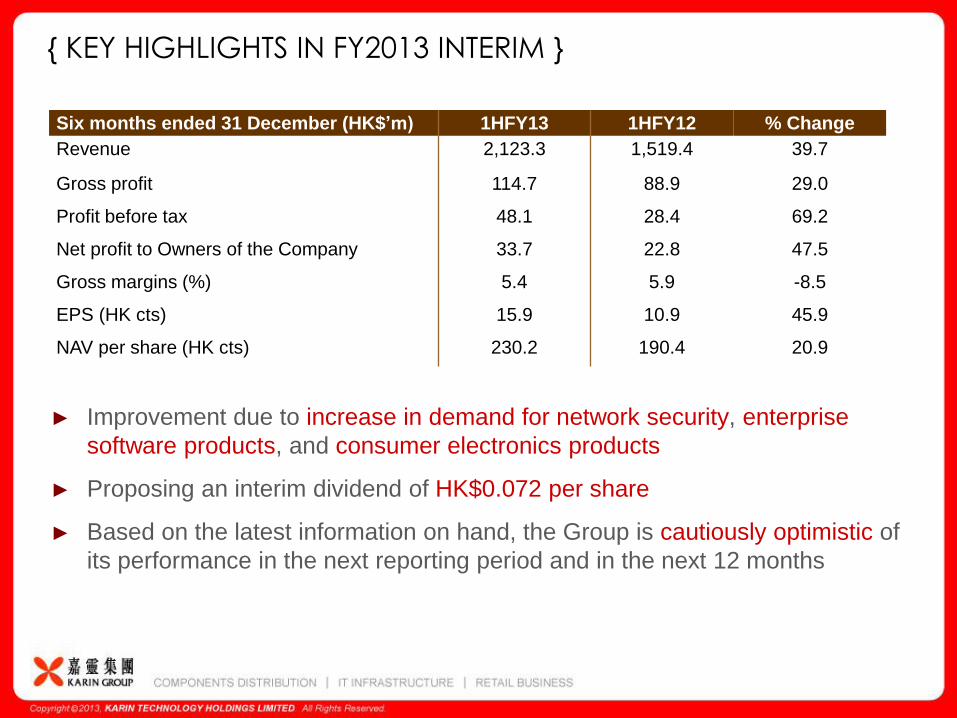
► Improvement due to increase in demand for network security, enterprise
software products, and consumer electronics products
► Proposing an interim dividend of HK$0.072 per share
► Based on the latest information on hand, the Group is cautiously optimistic of
its performance in the next reporting period and in the next 12 months
Six months ended 31 December (HK$’m) 1HFY13 1HFY12 % Change
Revenue 2,123.3 1,519.4 39.7
Gross profit 114.7 88.9 29.0
Profit before tax 48.1 28.4 69.2
Net profit to Owners of the Company 33.7 22.8 47.5
Gross margins (%) 5.4 5.9 -8.5
EPS (HK cts) 15.9 10.9 45.9
NAV per share (HK cts) 230.2 190.4 20.9
{ KEY HIGHLIGHTS IN FY2013 INTERIM }


{ REVENUE | Six Month Period }
619497 565 535
703 741908
986903
663757 805
901
1,266
1,519
1,713
2,123
0
500
1000
1500
2000
HK
$ [
mil
lio
n]
FY05 FY06 FY07 FY08 FY09 FY10 FY11 FY12 1HFY13
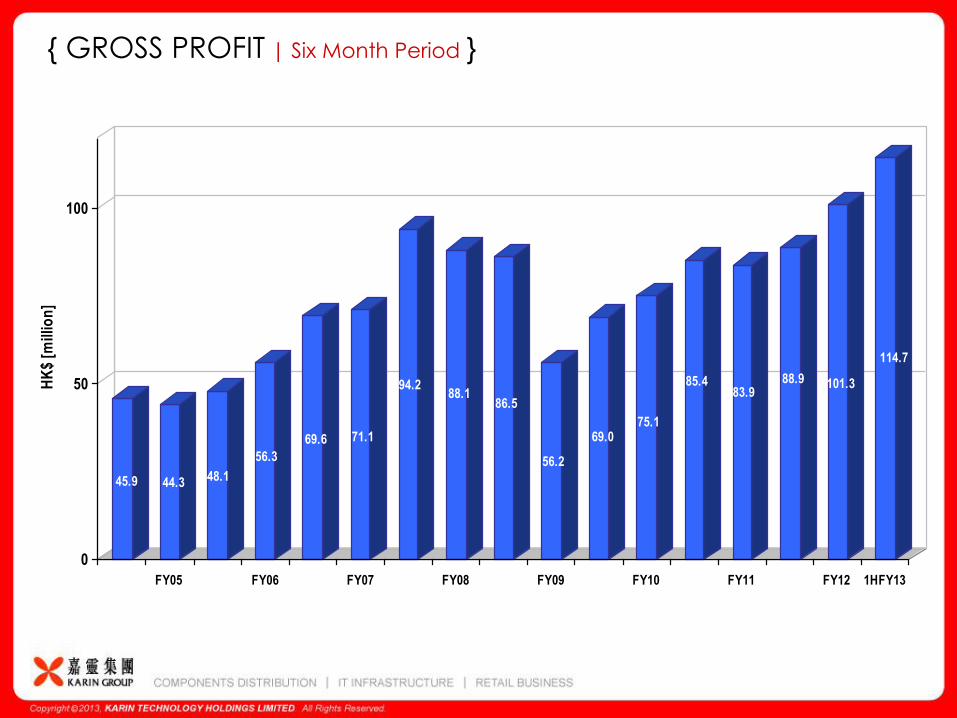
{ GROSS PROFIT | Six Month Period }
45.9 44.3 48.1
56.3
69.6 71.1
94.288.1
86.5
56.2
69.075.1
85.483.9
88.9 101.3
114.7
0
50
100
HK
$ [m
illio
n]
FY05 FY06 FY07 FY08 FY09 FY10 FY11 FY12 1HFY13
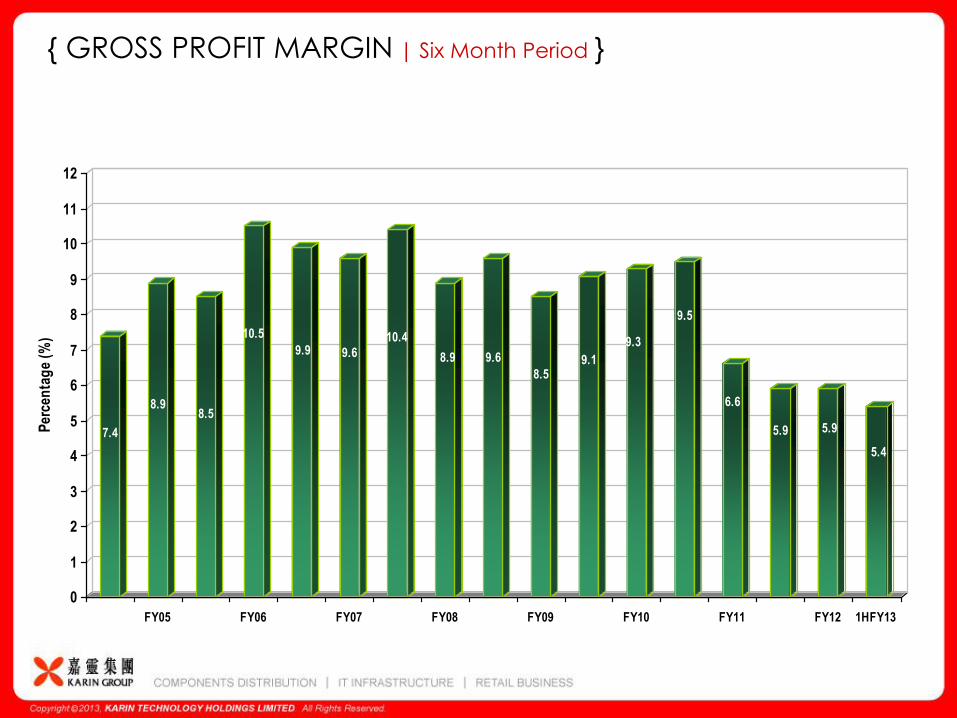
{ GROSS PROFIT MARGIN | Six Month Period }
7.4
8.98.5
10.5
9.9 9.6
10.4
8.9 9.6
8.59.1
9.3
9.5
6.6
5.9 5.9
5.4
0
1
2
3
4
5
6
7
8
9
10
11
12
Per
cen
tag
e (%
)
FY05 FY06 FY07 FY08 FY09 FY10 FY11 FY12 1HFY13
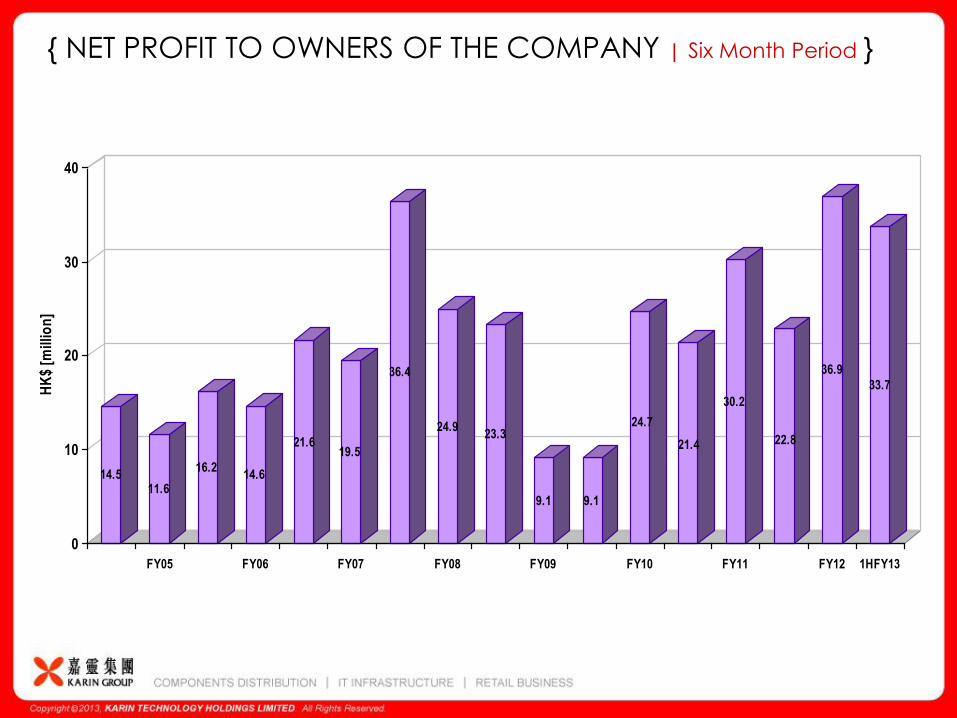
{ NET PROFIT TO OWNERS OF THE COMPANY | Six Month Period }
14.511.6
16.214.6
21.619.5
36.4
24.923.3
9.1 9.1
24.7
21.4
30.2
22.8
36.9
33.7
0
10
20
30
40
HK
$ [m
illio
n]
FY05 FY06 FY07 FY08 FY09 FY10 FY11 FY12 1HFY13

{ NET PROFIT MARGIN | Six Month Period }
2.3 2.3
2.9
2.6
3.0
2.6
4.1
2.62.5
1.2 1.2
3.1
2.4 2.4
1.5
2.2
1.6
0
1
2
3
4
5
Per
cen
tag
e (%
)
FY05 FY06 FY07 FY08 FY09 FY10 FY11 FY12 1HFY13
0
200
400
600
800
1000
1200
1400
FY05 FY06 FY07 FY08 FY09 FY10 FY11 FY12 1HFY13
HK
$ (m
illi
on
)
Consumer Electronic Product IT Infrastructure Components Distribution IC Application Design
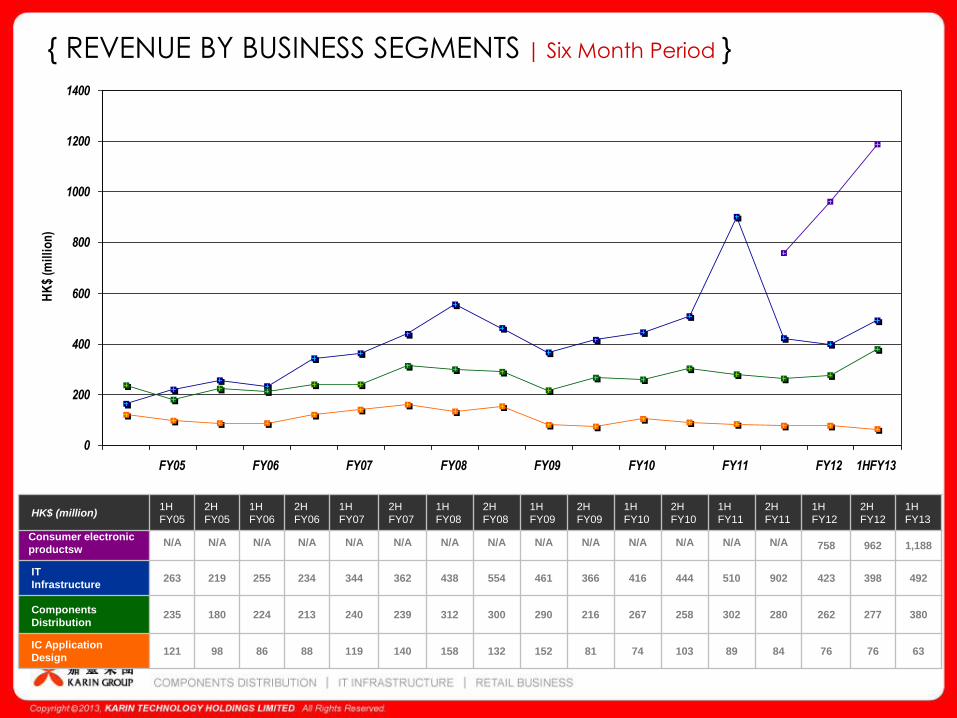
{ REVENUE BY BUSINESS SEGMENTS | Six Month Period }
HK$ (million) 1H
FY05
2H
FY05
1H
FY06
2H
FY06
1H
FY07
2H
FY07
1H
FY08
2H
FY08
1H
FY09
2H
FY09
1H
FY10
2H
FY10
1H
FY11
2H
FY11
1H
FY12
2H
FY12
1H
FY13
Consumer electronic
productsw N/A N/A N/A N/A N/A N/A N/A N/A N/A N/A N/A N/A N/A N/A 758 962 1,188
IT
Infrastructure 263 219 255 234 344 362 438 554 461 366 416 444 510 902 423 398 492
Components
Distribution 235 180 224 213 240 239 312 300 290 216 267 258 302 280 262 277 380
IC Application
Design 121 98 86 88 119 140 158 132 152 81 74 103 89 84 76 76 63
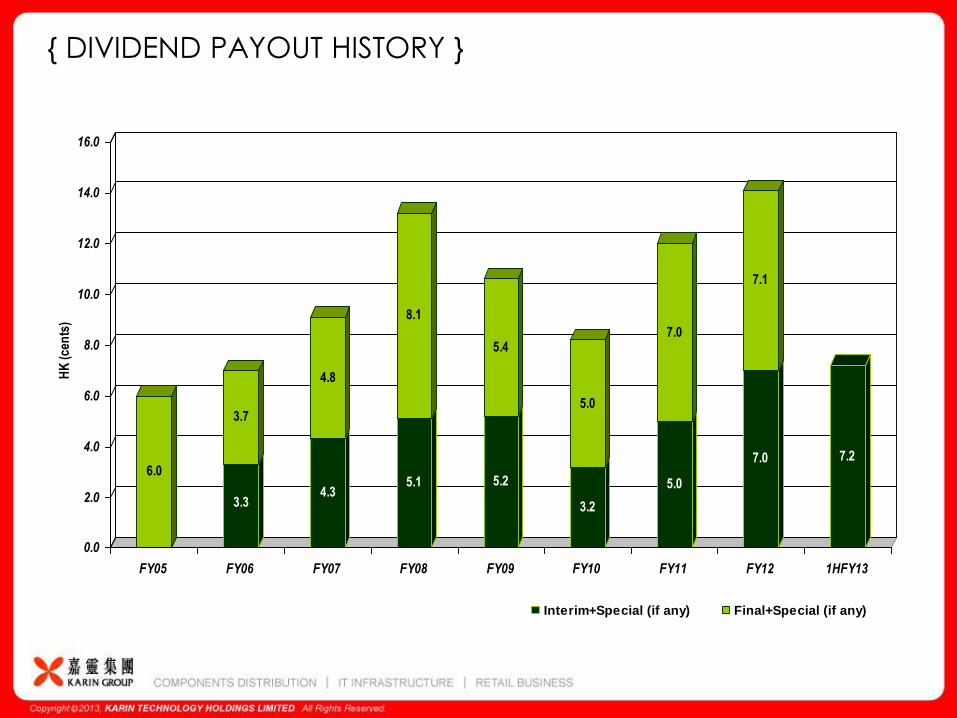
6.0
3.3
3.7
4.3
4.8
5.1
8.1
5.2
5.4
3.2
5.0
5.0
7.0
7.0
7.1
7.2
0.0
2.0
4.0
6.0
8.0
10.0
12.0
14.0
16.0
HK
(cen
ts)
FY05 FY06 FY07 FY08 FY09 FY10 FY11 FY12 1HFY13
Interim+Special (if any) Final+Special (if any)
{ DIVIDEND PAYOUT HISTORY }
0
5
10
15
20
FY05 FY06 FY07 FY08 FY09 FY10 FY11 FY12 1HFY13
Sin
gap
ore
cen
ts
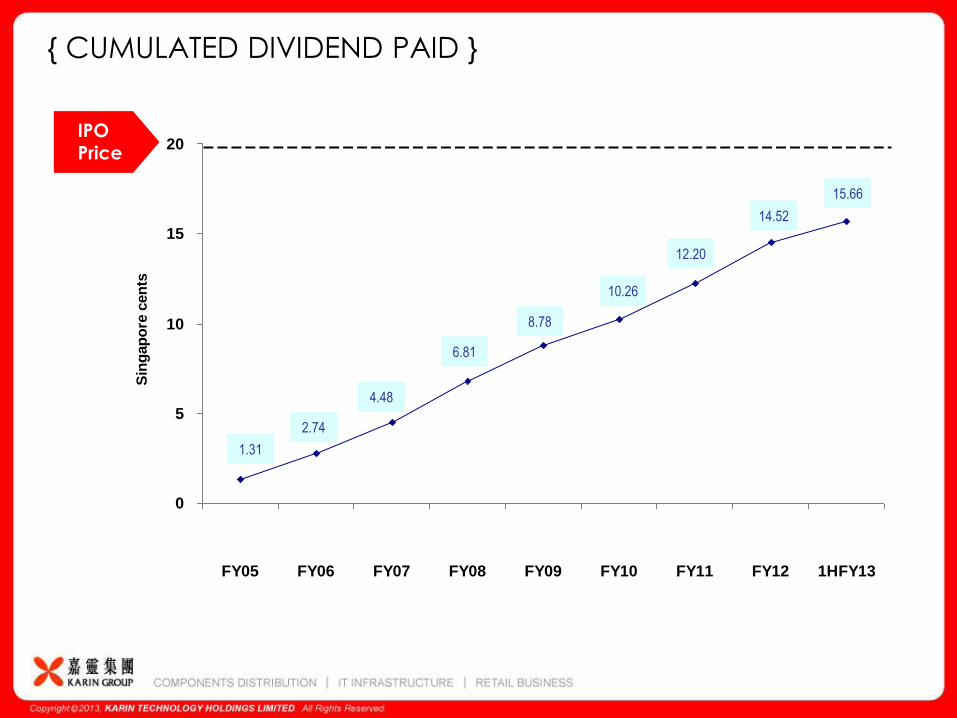
{ CUMULATED DIVIDEND PAID }
IPO Price
1.31
2.74
4.48
6.81
8.78
10.26
14.52
12.20
15.66
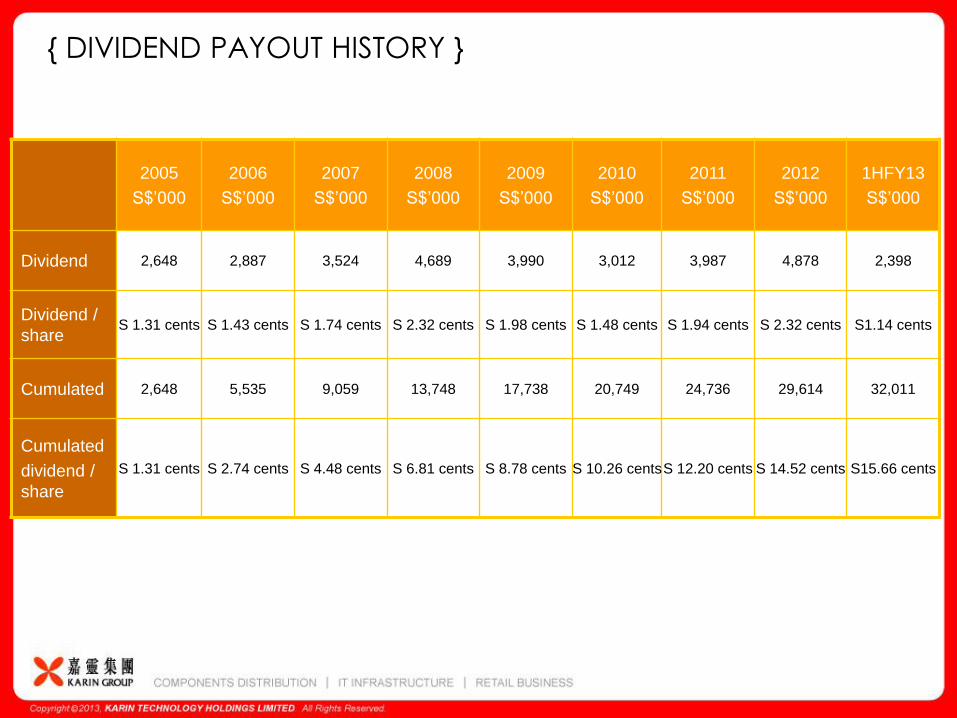
{ DIVIDEND PAYOUT HISTORY }
2005
S$’000
2006
S$’000
2007
S$’000
2008
S$’000
2009
S$’000
2010
S$’000
2011
S$’000
2012
S$’000
1HFY13
S$’000
Dividend 2,648 2,887 3,524 4,689 3,990 3,012 3,987 4,878 2,398
Dividend /
share S 1.31 cents S 1.43 cents S 1.74 cents S 2.32 cents S 1.98 cents S 1.48 cents S 1.94 cents S 2.32 cents S1.14 cents
Cumulated 2,648 5,535 9,059 13,748 17,738 20,749 24,736 29,614 32,011
Cumulated
dividend /
share
S 1.31 cents S 2.74 cents S 4.48 cents S 6.81 cents S 8.78 cents S 10.26 cents S 12.20 cents S 14.52 cents S15.66 cents
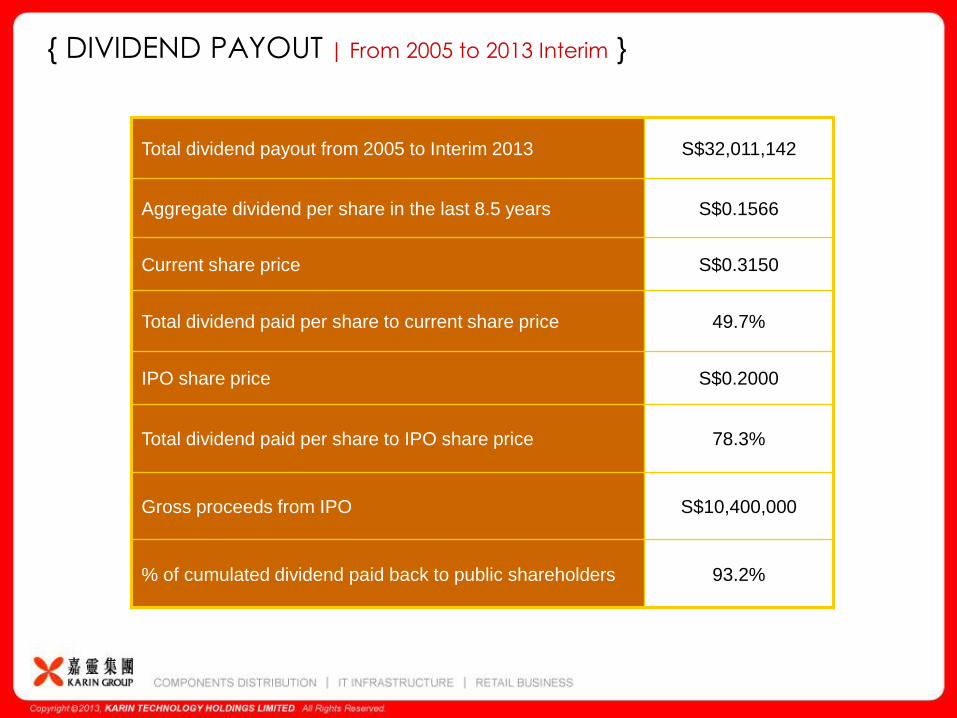
{ DIVIDEND PAYOUT | From 2005 to 2013 Interim }
Total dividend payout from 2005 to Interim 2013 S$32,011,142
Aggregate dividend per share in the last 8.5 years S$0.1566
Current share price S$0.3150
Total dividend paid per share to current share price 49.7%
IPO share price S$0.2000
Total dividend paid per share to IPO share price 78.3%
Gross proceeds from IPO S$10,400,000
% of cumulated dividend paid back to public shareholders 93.2%

{ CUMULATED NET PROFIT & DIVIDEND PAID SINCE LISTING }
12,120
26,260
44,642
71,306
92,814
109,523
134,210
164,174
179,375
26,080
56,901
98,018
159,352
191,703
225,506
277,105
336,802
370,500
0
50,000
100,000
150,000
200,000
250,000
300,000
350,000
FY05 FY06 FY07 FY08 FY09 FY10 FY11 FY12 1HFY13
HK
$'0
00
Cumulated Net Profit
Cumulated Dividend Paid
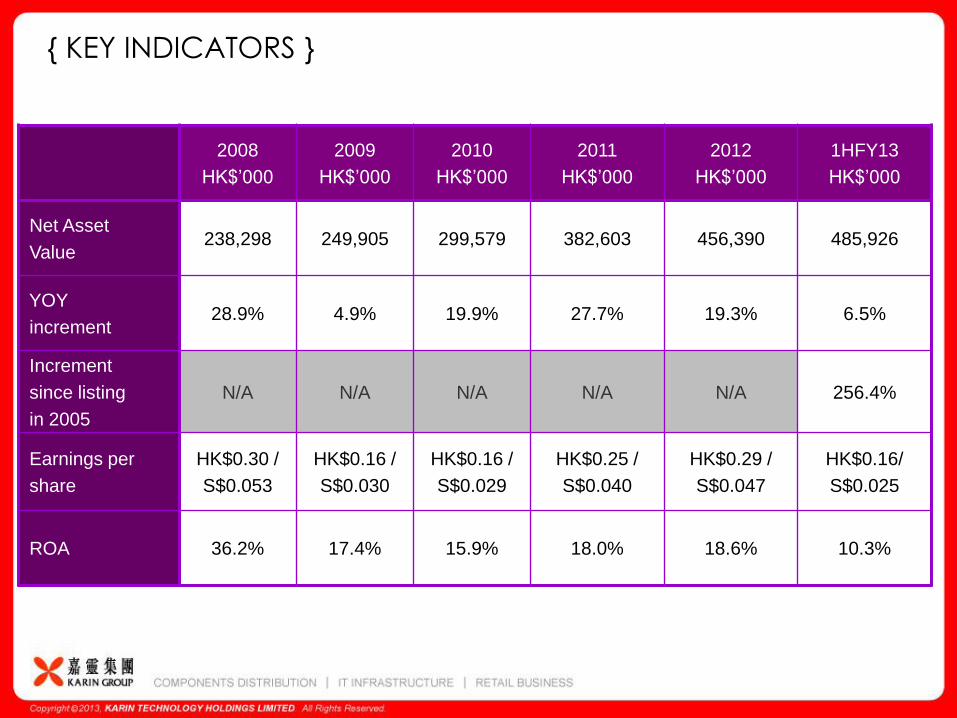
{ KEY INDICATORS }
2008
HK$’000
2009
HK$’000
2010
HK$’000
2011
HK$’000
2012
HK$’000
1HFY13
HK$’000
Net Asset
Value 238,298 249,905 299,579 382,603 456,390 485,926
YOY
increment 28.9% 4.9% 19.9% 27.7% 19.3% 6.5%
Increment
since listing
in 2005
N/A N/A N/A N/A N/A 256.4%
Earnings per
share
HK$0.30 /
S$0.053
HK$0.16 /
S$0.030
HK$0.16 /
S$0.029
HK$0.25 /
S$0.040
HK$0.29 /
S$0.047
HK$0.16/
S$0.025
ROA 36.2% 17.4% 15.9% 18.0% 18.6% 10.3%

{ 5.5 CONSECUTIVE YEARS FINANCIAL SUMMARY }
FY2008
HK$’000
FY2009
HK$’000
FY2010
HK$’000
FY2011
HK$’000
FY2012
HK$’000
1HFY13
HK$’000
Revenue 1,893,938 1,566,262 1,562,157 2,167,430 3,232,279 2,123,296
Gross profit 182,340 142,665 144,054 169,336 190,227 114,671
Profit before tax 73,754 36,429 42,375 60,613 76,593 48,068
Tax (11,583) (5,761) (9,508) (10,246) (12,705) (8,183)
Profit for the year 62,171 30,668 32,867 50,367 63,888 39,885
Minority interests 837 (1,683) (936) (1,232) 4,191 6,187
Profit for
shareholders 61,334 32,351 33,803 51,599 59,697 33,698
Dividends 26,664 21,412 16,805 24,687 29,964 15,201

{ 5.5 CONSECUTIVE YEARS FINANCIAL SUMMARY }
FY2008
HK$’000
FY2009
HK$’000
FY2010
HK$’000
FY2011
HK$’000
FY2012
HK$’000
1HFY13
HK$’000
Non-current assets 58,162 81,582 131,829 224,862 286,749 287,361
Current assets 644,139 368,193 449,974 529,615 609,708 887,589
Current liabilities 458,910 194,074 272,554 357,536 409,046 660,658
Non-current
liabilities 5,093 5,796 9,670 14,338 31,021 28,366
Net assets 238,298 249,905 299,579 382,603 456,390 485,926
Issued capital 20,200 20,200 20,478 20,683 21,143 21,213
Debtors turnover
(days) 66.7 76.2 54.9 46.3 34.1 29.0
Creditors turnover
(days) 45.0 47.3 35.3 35.6 28.3 28.1
Stock turnover
(days) 27.3 25.9 22.1 20.9 18.2 14.5

OUR BUSINESS
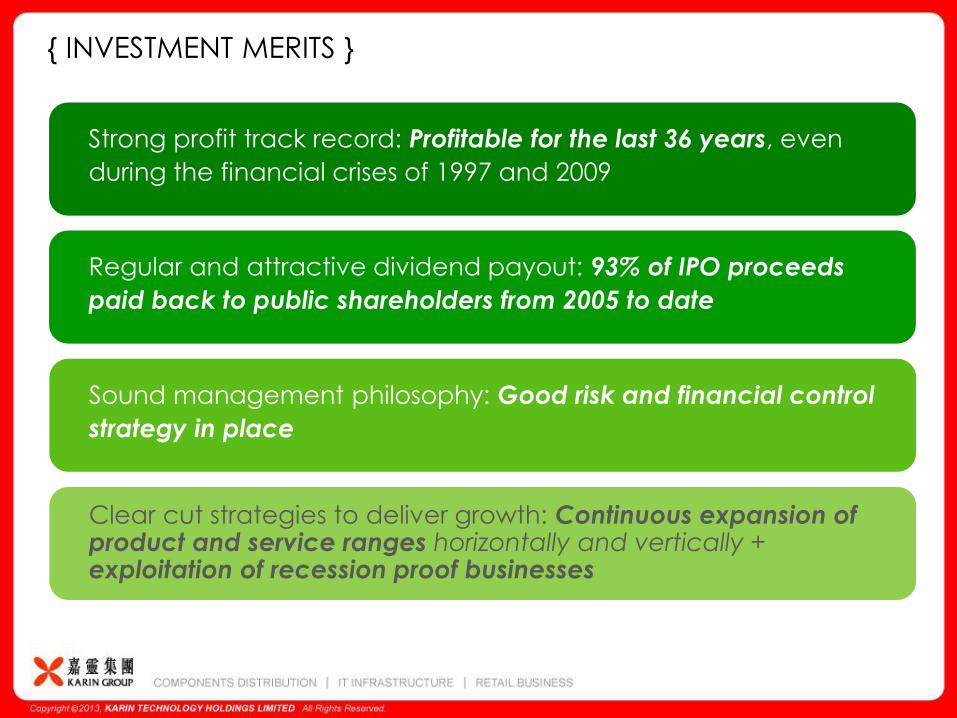
{ INVESTMENT MERITS }
Strong profit track record: Profitable for the last 36 years, even
during the financial crises of 1997 and 2009
Regular and attractive dividend payout: 93% of IPO proceeds
paid back to public shareholders from 2005 to date
Sound management philosophy: Good risk and financial control
strategy in place
Clear cut strategies to deliver growth: Continuous expansion of product and service ranges horizontally and vertically + exploitation of recession proof businesses

{ GROWTH STRATEGIES }
FUTURE GROWTH
• Expansion of product and service ranges horizontally and vertically
• Exploit recession-proof businesses such as energy saving and environmental protection
• Reinforce financial and operational controls
• Improve Human Capital and Company Value
• Development in new industries and industries not
yet covered in extended market regions
Improve
Profit Margins
Network Expansion
In PRC, HK
& ASEAN
Optimise
Operating
Efficiencies
• Extends into the consumer electronics products
and accessories retail market

FUTURE DIRECTION
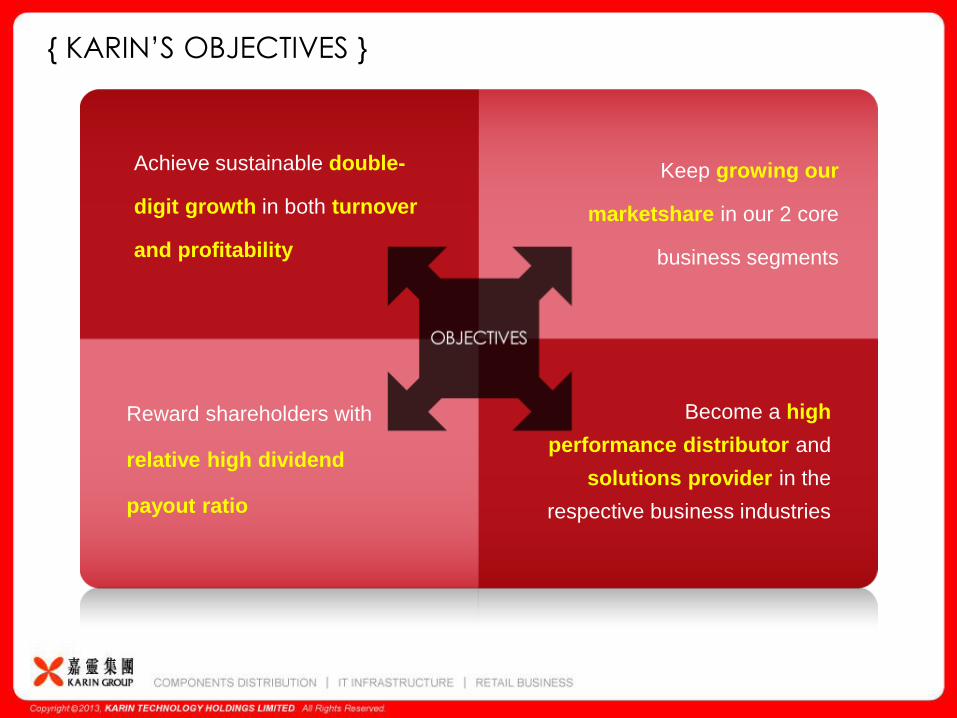
Keep growing our
marketshare in our 2 core
business segments
Achieve sustainable double-
digit growth in both turnover
and profitability
Reward shareholders with
relative high dividend
payout ratio
Become a high
performance distributor and
solutions provider in the
respective business industries
{ KARIN’S OBJECTIVES }
Hardware Software
Professional
Services
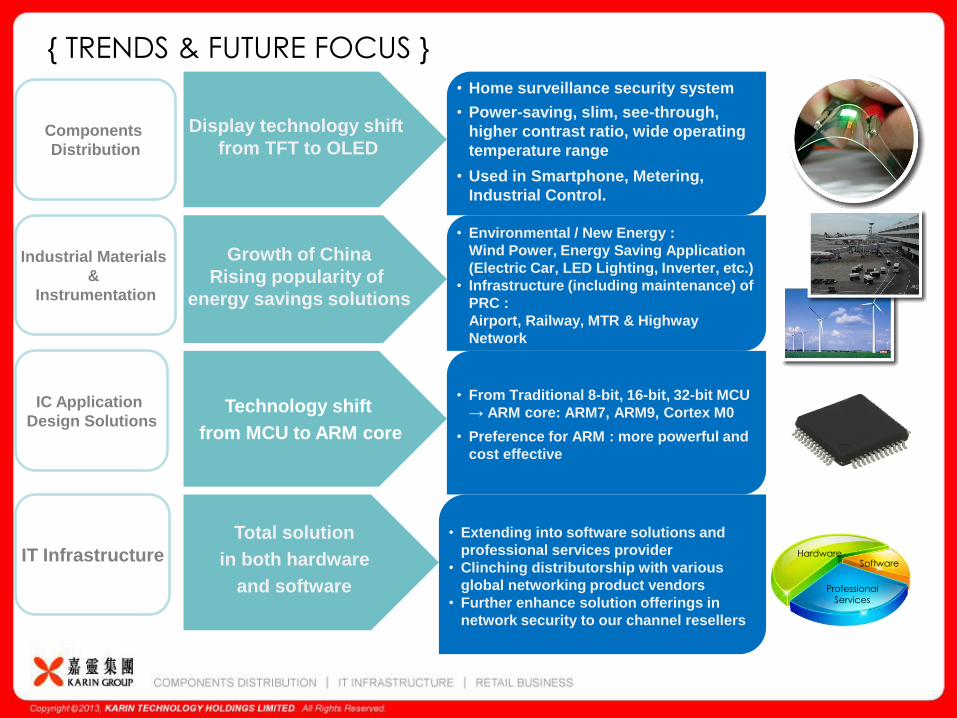
{ TRENDS & FUTURE FOCUS }
Display technology shift
from TFT to OLED
Components
Distribution
• Home surveillance security system
• Power-saving, slim, see-through,
higher contrast ratio, wide operating
temperature range
• Used in Smartphone, Metering,
Industrial Control.
Growth of China
Rising popularity of
energy savings solutions
Industrial Materials
&
Instrumentation
Technology shift
from MCU to ARM core
IC Application
Design Solutions
Total solution
in both hardware
and software
IT Infrastructure
• Environmental / New Energy :
Wind Power, Energy Saving Application
(Electric Car, LED Lighting, Inverter, etc.)
• Infrastructure (including maintenance) of
PRC :
Airport, Railway, MTR & Highway
Network
• From Traditional 8-bit, 16-bit, 32-bit MCU
→ ARM core: ARM7, ARM9, Cortex M0
• Preference for ARM : more powerful and
cost effective
• Extending into software solutions and
professional services provider
• Clinching distributorship with various
global networking product vendors
• Further enhance solution offerings in
network security to our channel resellers
Stringent cost controls
Offer services with higher margins
Cable : Electrical control cables branded by KARIN
Strengthening of IC Application Design and IT Services : Business units
enhancing products with higher margins through IP and service
incremental
{ IMPROVE PROFIT MARGINS }

Promote skill-set development among staff
Introduce staff achievement awards for professionalism, skill-
sets, and technology
Upgrade in-house IT infrastructure to promote synergy
building among business units
Automated eWorkflow
Group Intranet
Enterprise Instant Messaging Environment
{ IMPROVE HUMAN CAPITAL & COMPANY VALUE }

Thank You