Embed Size (px)
Citation preview
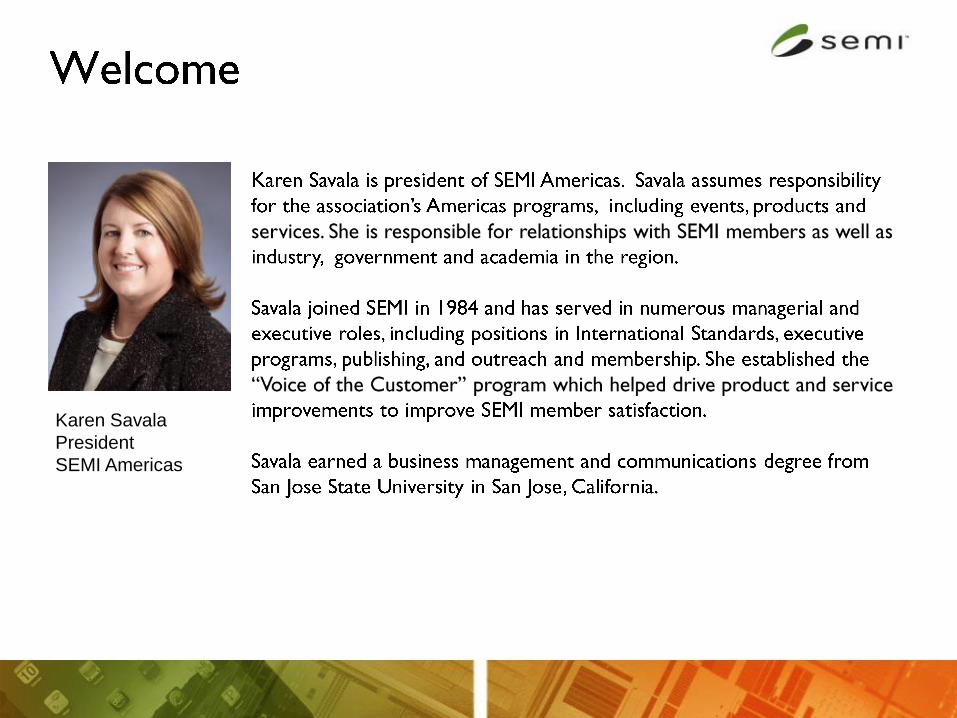
Karen Savala
President
SEMI Americas
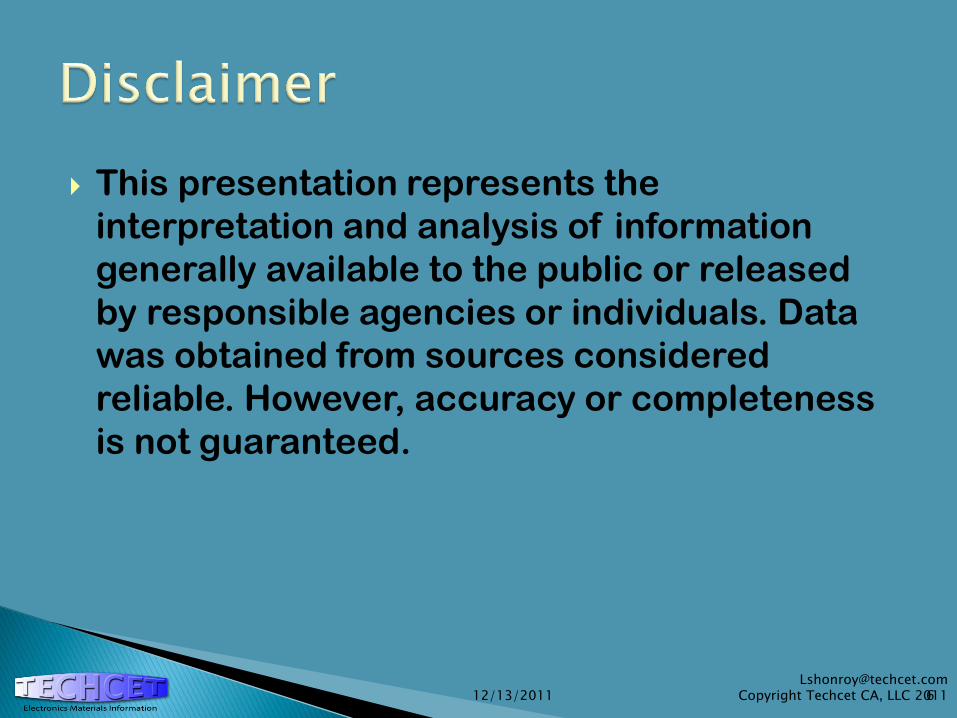
This presentation represents the
interpretation and analysis of information
generally available to the public or released
by responsible agencies or individuals. Data
was obtained from sources considered
reliable. However, accuracy or completeness
is not guaranteed.
12/13/2011 6 [email protected]
Copyright Techcet CA, LLC 2011
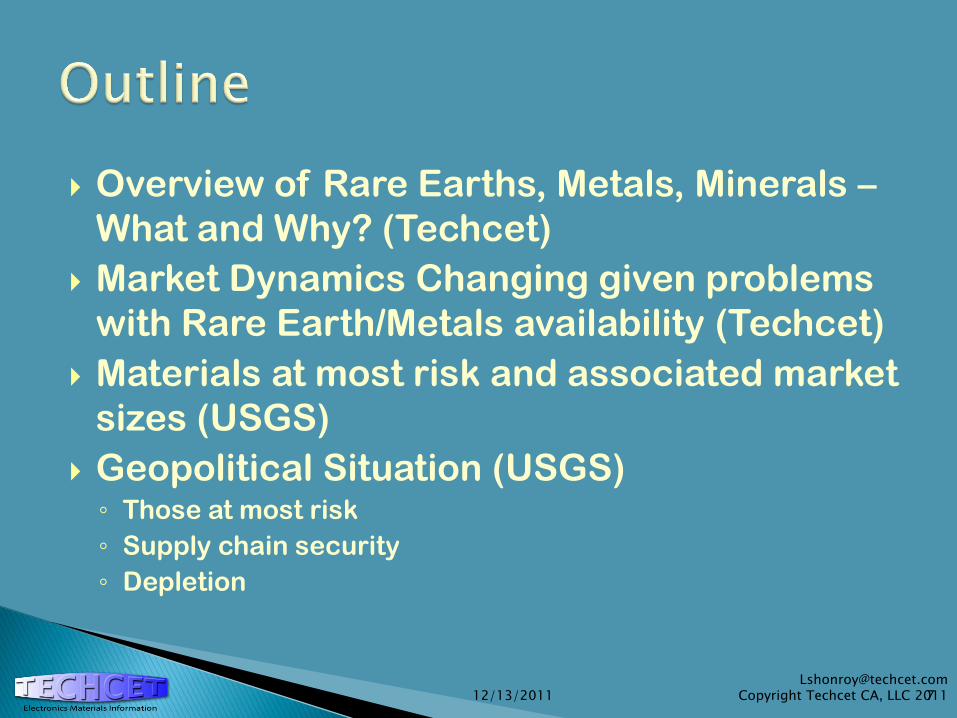
Overview of Rare Earths, Metals, Minerals –
What and Why? (Techcet)
Market Dynamics Changing given problems
with Rare Earth/Metals availability (Techcet)
Materials at most risk and associated market
sizes (USGS)
Geopolitical Situation (USGS) ◦ Those at most risk
◦ Supply chain security
◦ Depletion
12/13/2011 7 [email protected]
Copyright Techcet CA, LLC 2011
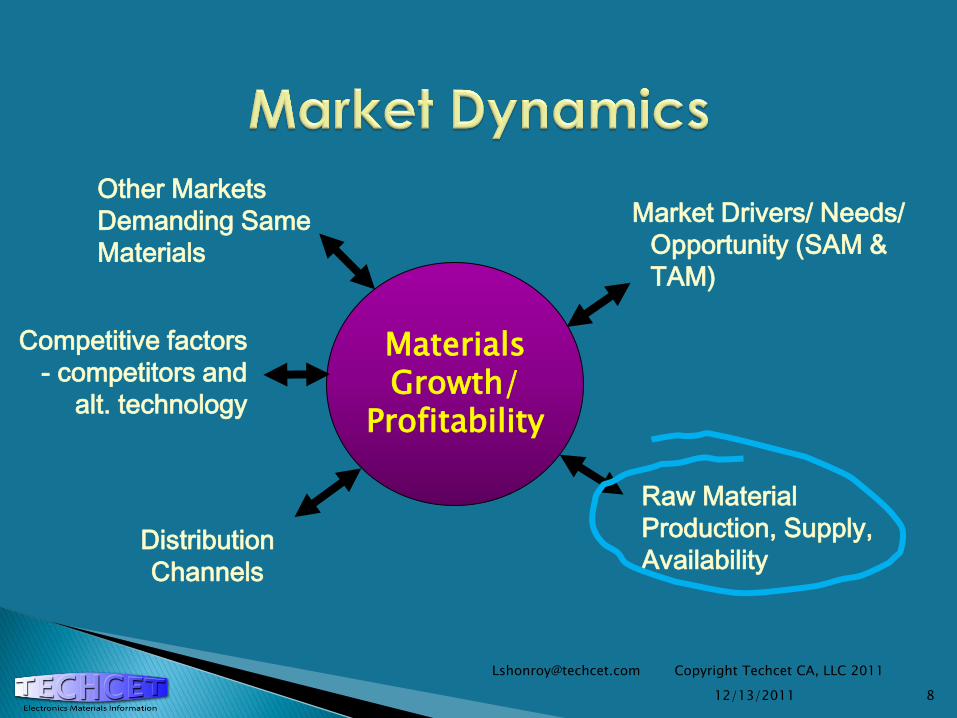
Materials Growth/
Profitability
Market Drivers/ Needs/
Opportunity (SAM &
TAM)
Other Markets
Demanding Same
Materials
Raw Material
Production, Supply,
Availability Distribution
Channels
8
[email protected] Copyright Techcet CA, LLC 2011
12/13/2011
Competitive factors
- competitors and
alt. technology
Rare Earth Elements – China Puts Materials on
Allocation ◦ All raw REE have export quotas
Asian Countries “Require” Local Content ◦ Significant Market Capture of Materials Business by
Locals (and Seeming Local)
Cost of “Earth, Wind, and Fire” Climbing –
REE, Metals, and Minerals will continue to be
constrained given increased cost of energy
and depletion of existing mines.
Copyright 2011 Techcet CA, LLC. 12/13/2011 9
10
1. Unprocessed rare earths, metals and
minerals controlled or at risk of being
limited by China
2. Unprocessed metals/minerals that are
limited or at risk because of only few
mines in existence.
3. The processing of ore being limited or at
risk because of few processing sites in
existence.
12/13/2011 [email protected]
Copyright Techcet CA, LLC 2011 10
The Rare Earth
Elements („REEs‟),
precious metals
and minerals ◦ Critically important
to tech world:
communication,
transportation, &
energy.
For many applications
there are no
alternatives
China - Major Producer China Supplies about 90% of
REEs.
China‟s Increased Internal
Demand
2011 35% Decrease in Export
of REEs
Alternative Producers Lower Abundance: Much
Exploration, Little Mining
Complex Isolation Chemistry
Copyright 2011 Techcet CA, LLC. 12/13/2011 11
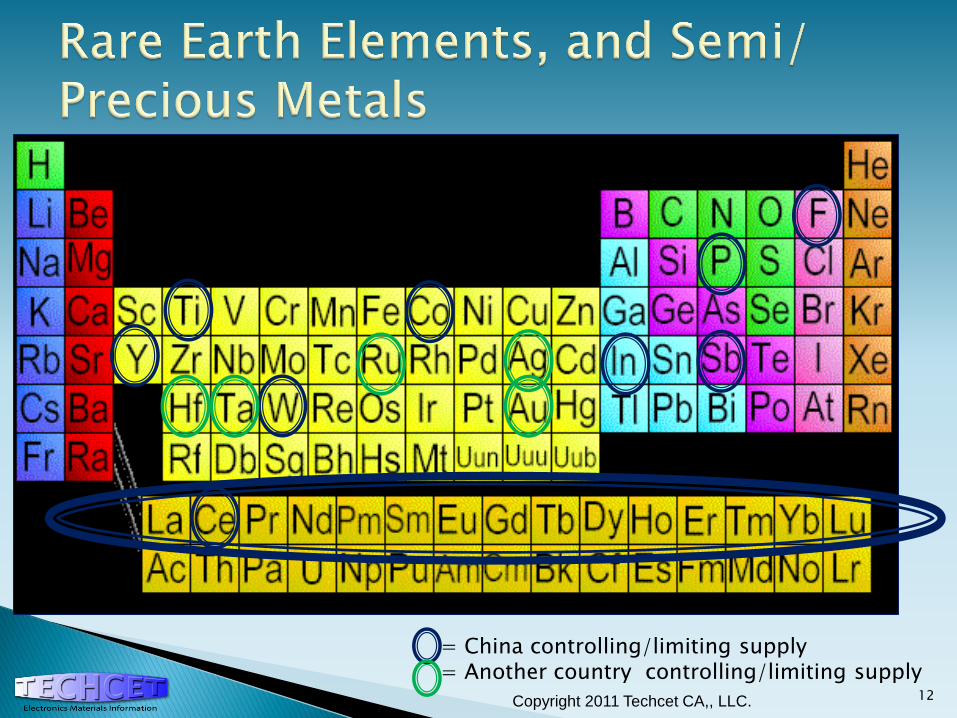
= China controlling/limiting supply = Another country controlling/limiting supply
Copyright 2011 Techcet CA,, LLC. 12
Copyright 2011 Techcet CA, LLC. 12/14/2011 13
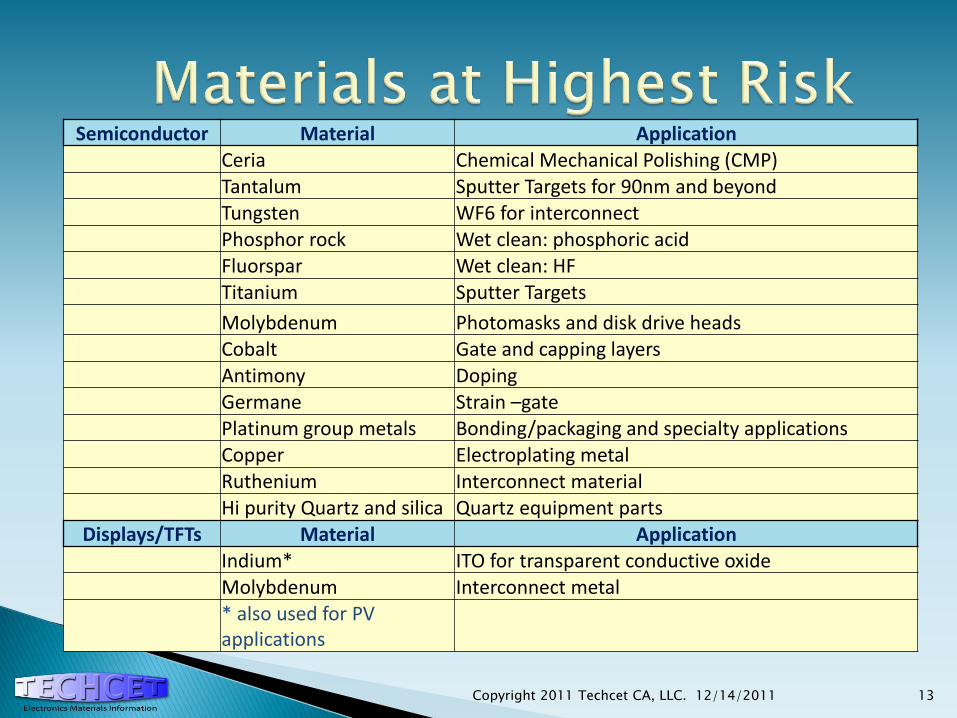
Semiconductor Material Application Ceria Chemical Mechanical Polishing (CMP) Tantalum Sputter Targets for 90nm and beyond Tungsten WF6 for interconnect Phosphor rock Wet clean: phosphoric acid Fluorspar Wet clean: HF Titanium Sputter Targets
Molybdenum Photomasks and disk drive heads Cobalt Gate and capping layers Antimony Doping Germane Strain –gate Platinum group metals Bonding/packaging and specialty applications Copper Electroplating metal Ruthenium Interconnect material Hi purity Quartz and silica Quartz equipment parts
Displays/TFTs Material Application Indium* ITO for transparent conductive oxide Molybdenum Interconnect metal
* also used for PV applications
Copyright 2011 Techcet CA, LLC. 12/14/2011 14
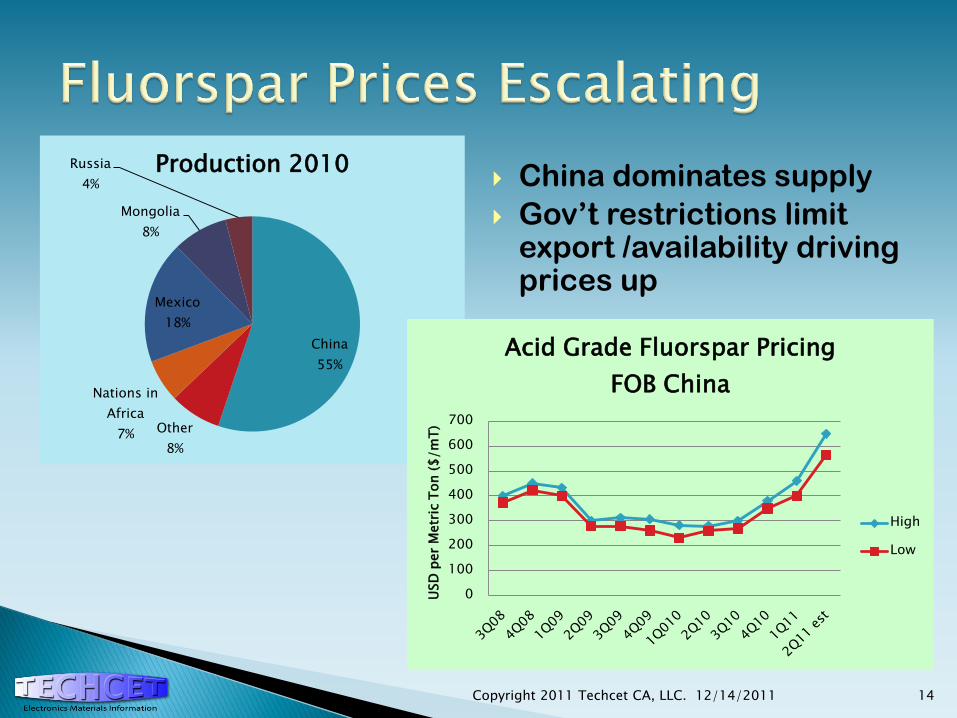
China
55%
Other
8%
Nations in
Africa
7%
Mexico
18%
Mongolia
8%
Russia
4%
Production 2010 China dominates supply
Gov‟t restrictions limit export /availability driving prices up
0
100
200
300
400
500
600
700U
SD
per
Metr
ic T
on
($
/m
T)
Acid Grade Fluorspar Pricing
FOB China
High
Low
www.techcet.com
15
Consumption
15
15
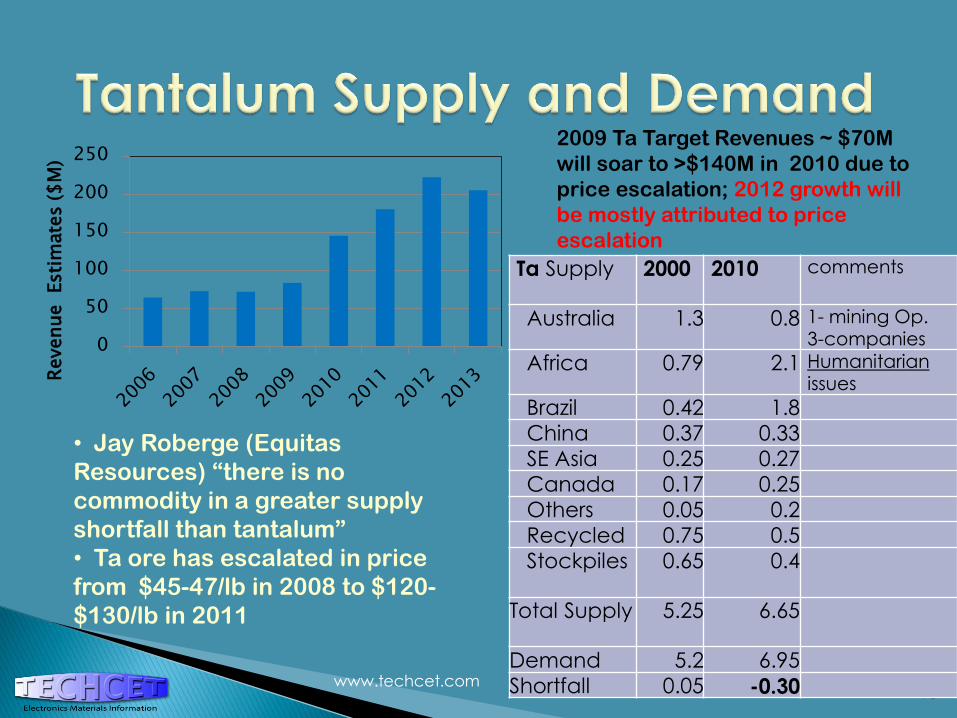
2009 Ta Target Revenues ~ $70M
will soar to >$140M in 2010 due to
price escalation; 2012 growth will
be mostly attributed to price
escalation
Ta Supply 2000 2010 comments
Australia 1.3 0.8 1- mining Op. 3-companies
Africa 0.79 2.1 Humanitarian issues
Brazil 0.42 1.8
China 0.37 0.33
SE Asia 0.25 0.27
Canada 0.17 0.25
Others 0.05 0.2
Recycled 0.75 0.5
Stockpiles 0.65 0.4
Total Supply 5.25 6.65
Demand 5.2 6.95
Shortfall 0.05 -0.30
• Jay Roberge (Equitas
Resources) “there is no
commodity in a greater supply
shortfall than tantalum”
• Ta ore has escalated in price
from $45-47/lb in 2008 to $120-
$130/lb in 2011
0
50
100
150
200
250
Revenue Esti
mate
s ($
M)
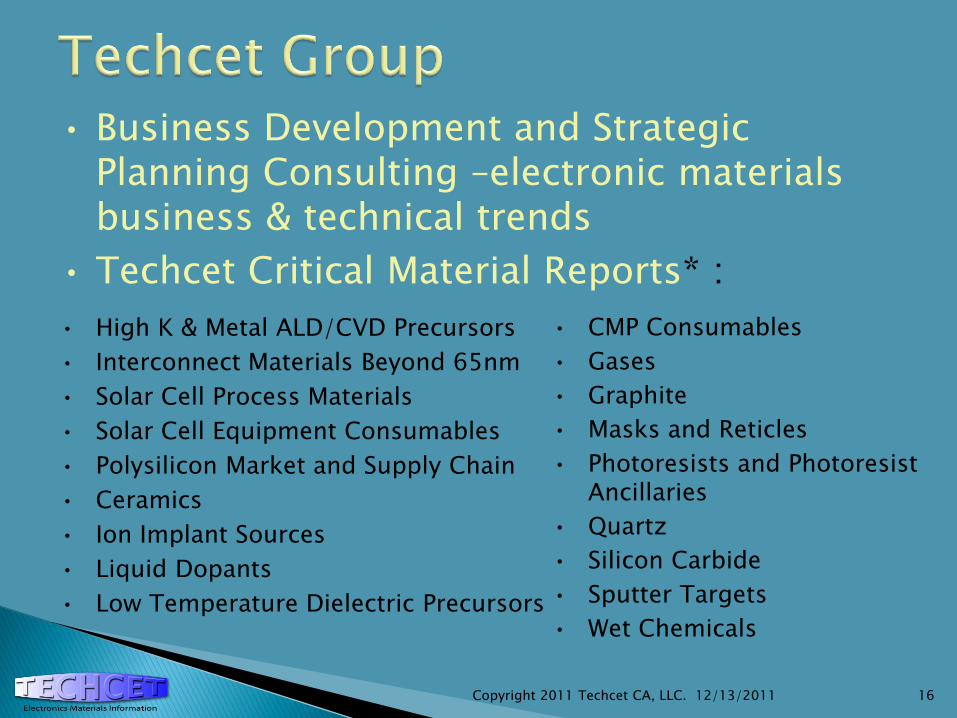
• Business Development and Strategic Planning Consulting –electronic materials business & technical trends
• Techcet Critical Material Reports* :
• High K & Metal ALD/CVD Precursors
• Interconnect Materials Beyond 65nm
• Solar Cell Process Materials
• Solar Cell Equipment Consumables
• Polysilicon Market and Supply Chain
• Ceramics
• Ion Implant Sources
• Liquid Dopants
• Low Temperature Dielectric Precursors
• CMP Consumables
• Gases
• Graphite
• Masks and Reticles
• Photoresists and Photoresist Ancillaries
• Quartz
• Silicon Carbide
• Sputter Targets
• Wet Chemicals
Copyright 2011 Techcet CA, LLC. 12/13/2011 16
Future Supplies of Critical
Elements
Geologic, technical, and political-economic constraints
By Keith R. Long, Mineral Resource Analysts Western Mineral and Environmental Resource Science Center
Tucson, AZ
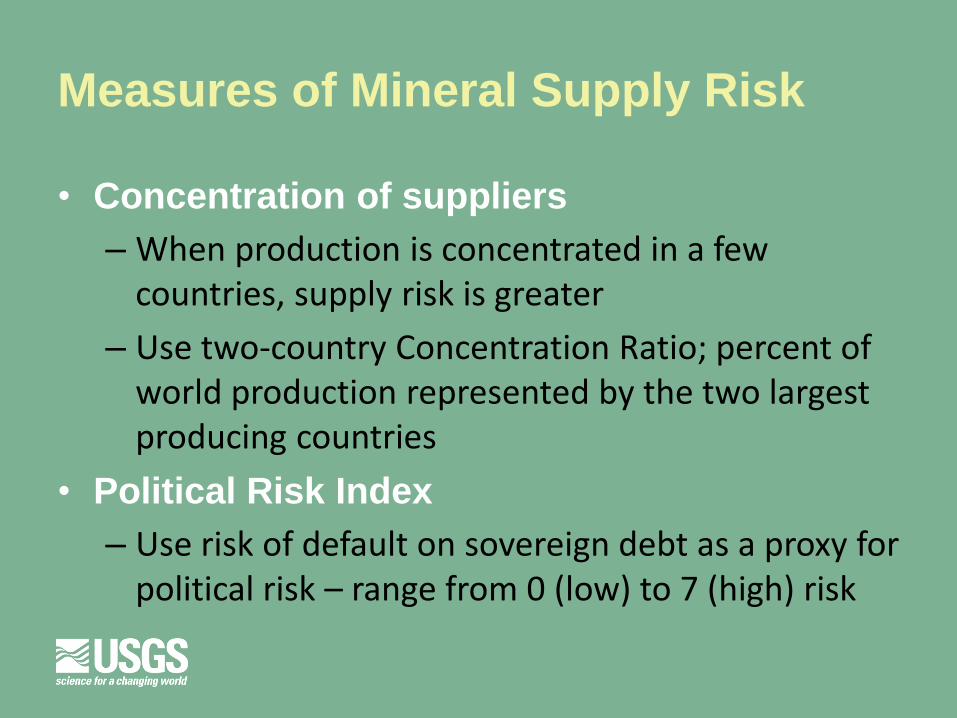
Measures of Mineral Supply Risk
• Concentration of suppliers
– When production is concentrated in a few countries, supply risk is greater
– Use two-country Concentration Ratio; percent of world production represented by the two largest producing countries
• Political Risk Index
– Use risk of default on sovereign debt as a proxy for political risk – range from 0 (low) to 7 (high) risk
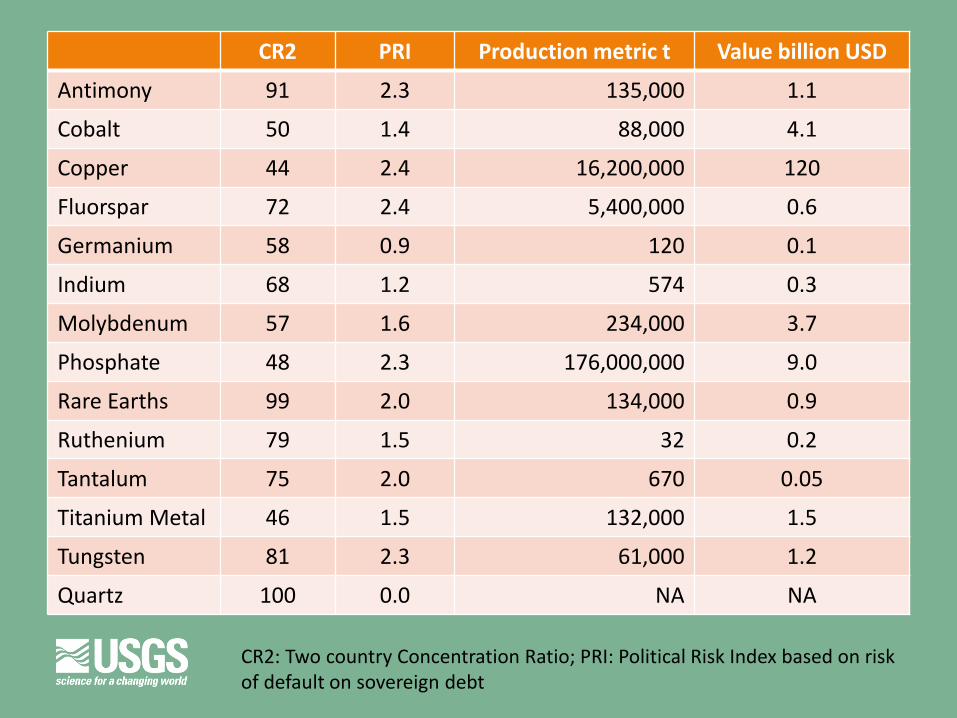
CR2 PRI Production metric t Value billion USD
Antimony 91 2.3 135,000 1.1
Cobalt 50 1.4 88,000 4.1
Copper 44 2.4 16,200,000 120
Fluorspar 72 2.4 5,400,000 0.6
Germanium 58 0.9 120 0.1
Indium 68 1.2 574 0.3
Molybdenum 57 1.6 234,000 3.7
Phosphate 48 2.3 176,000,000 9.0
Rare Earths 99 2.0 134,000 0.9
Ruthenium 79 1.5 32 0.2
Tantalum 75 2.0 670 0.05
Titanium Metal 46 1.5 132,000 1.5
Tungsten 81 2.3 61,000 1.2
Quartz 100 0.0 NA NA
CR2: Two country Concentration Ratio; PRI: Political Risk Index based on risk of default on sovereign debt
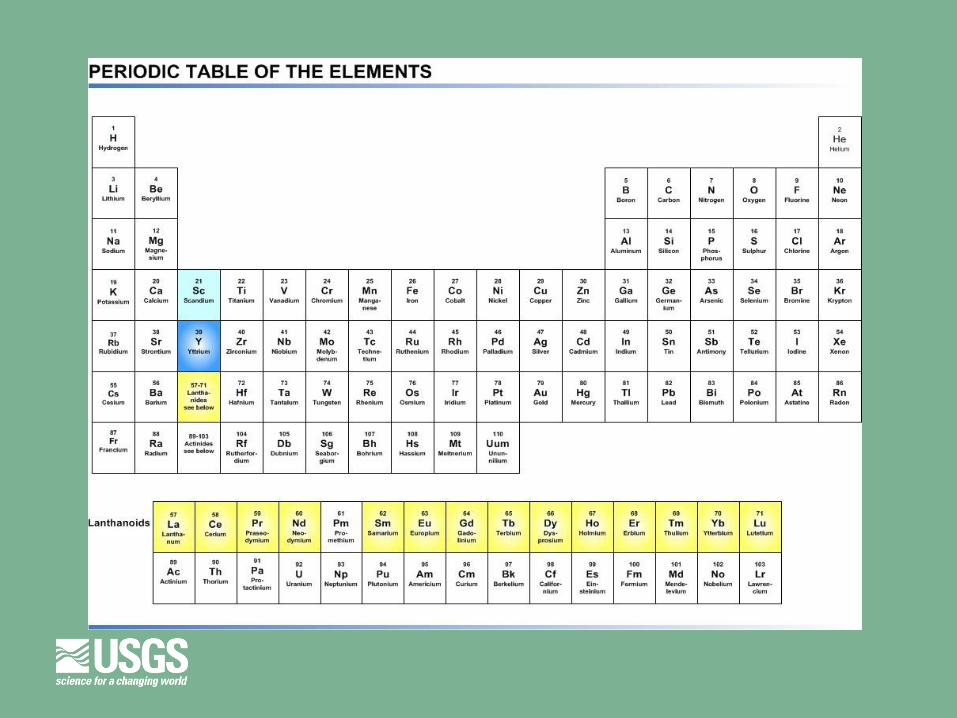
Rare Earth Elements
• What are the rare earths?
• How did China take over world production
from the United States?
• What are the prospects for new REE mines
outside of China?
• What has been the effect of Chinese export
restrictions?
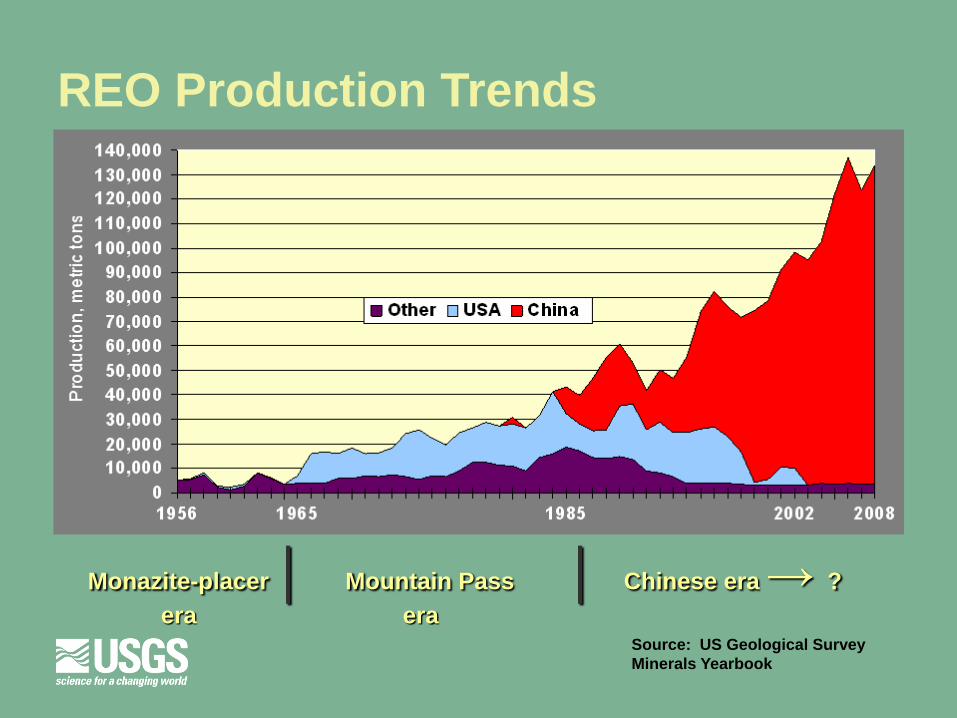
REO Production Trends
Monazite-placer │ Mountain Pass │ Chinese era → ?
era era Source: US Geological Survey
Minerals Yearbook
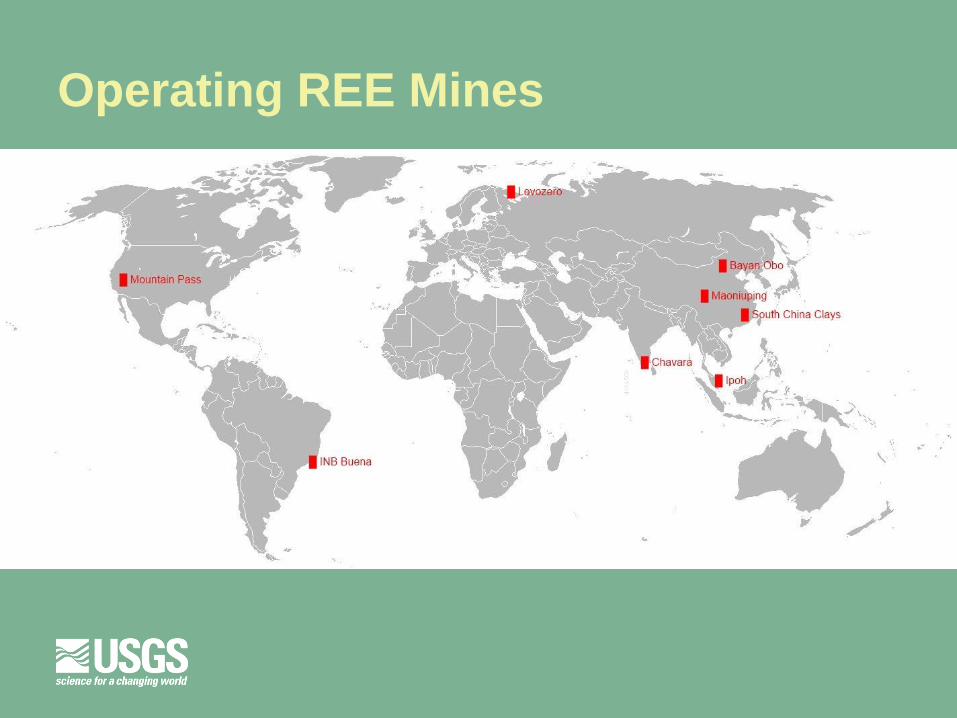
Operating REE Mines
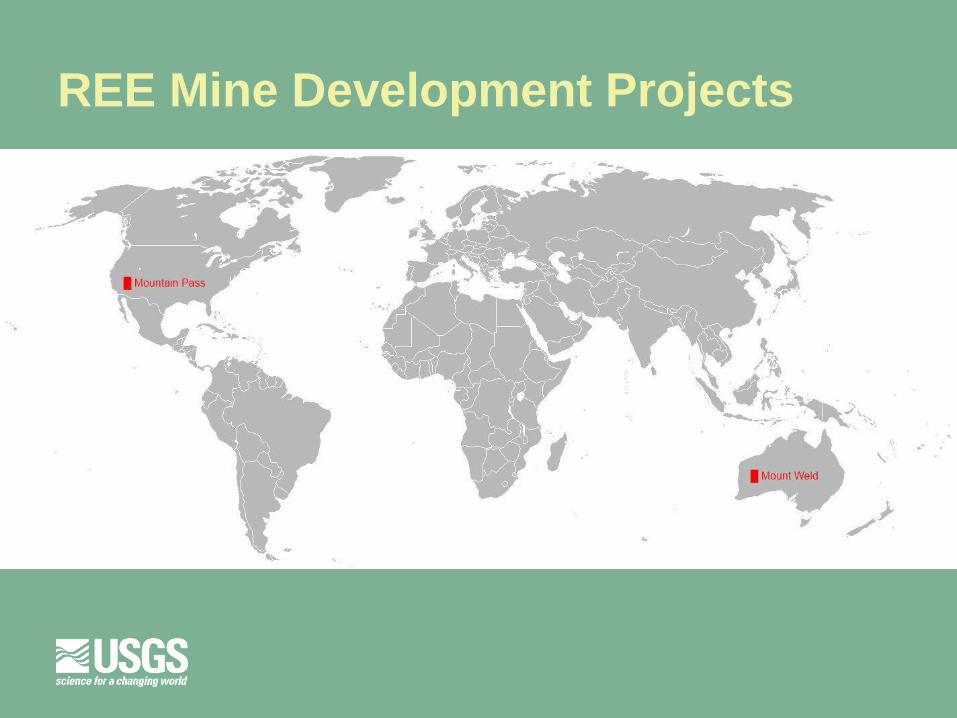
REE Mine Development Projects
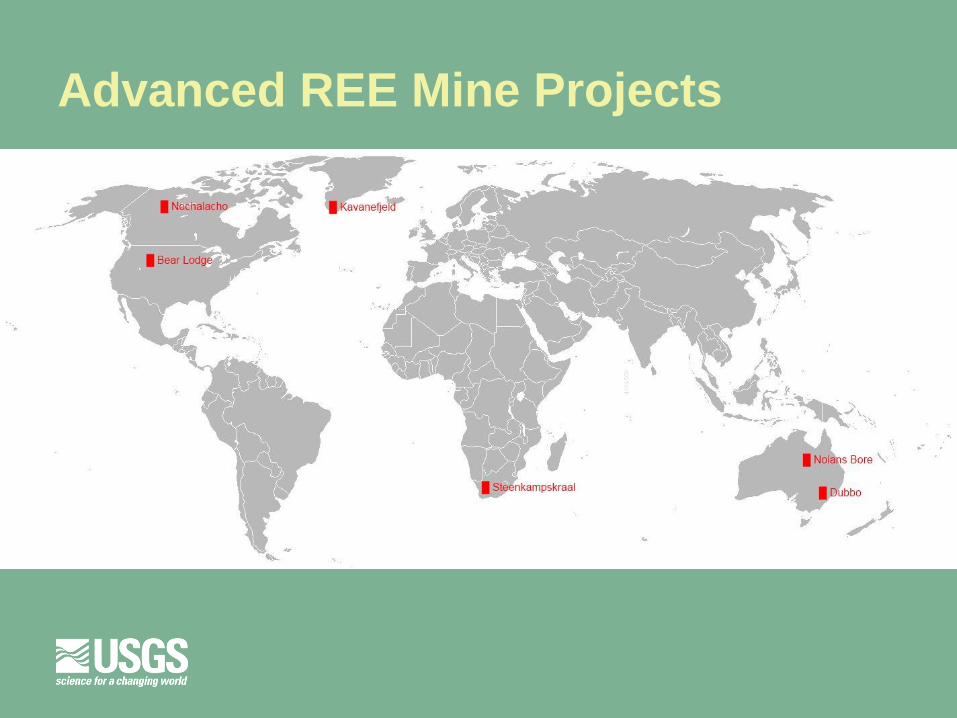
Advanced REE Mine Projects
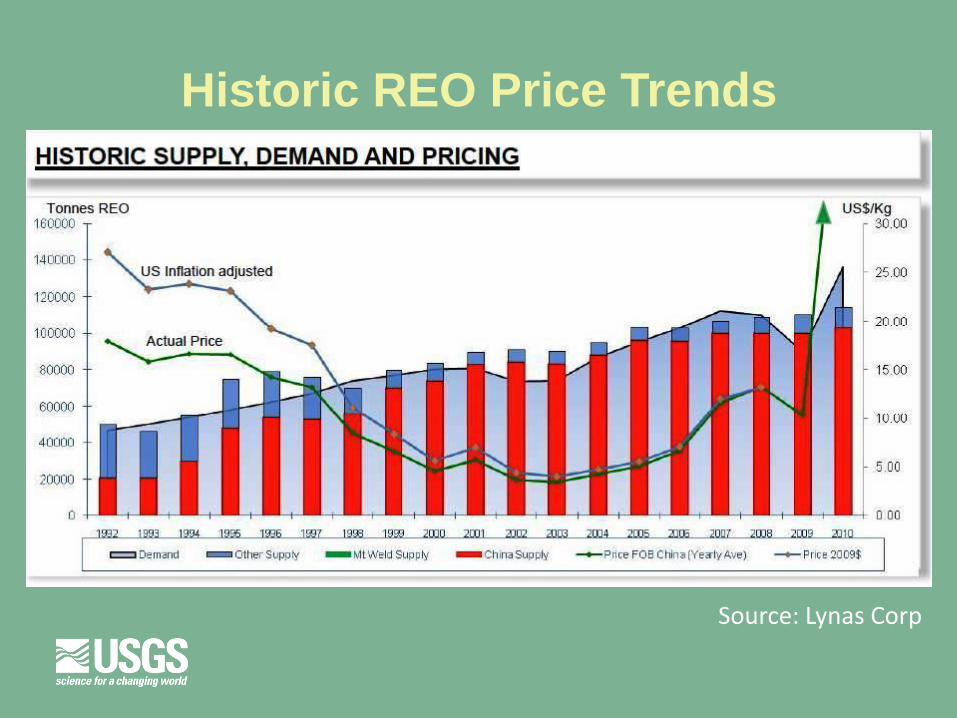
Historic REO Price Trends
Source: Lynas Corp
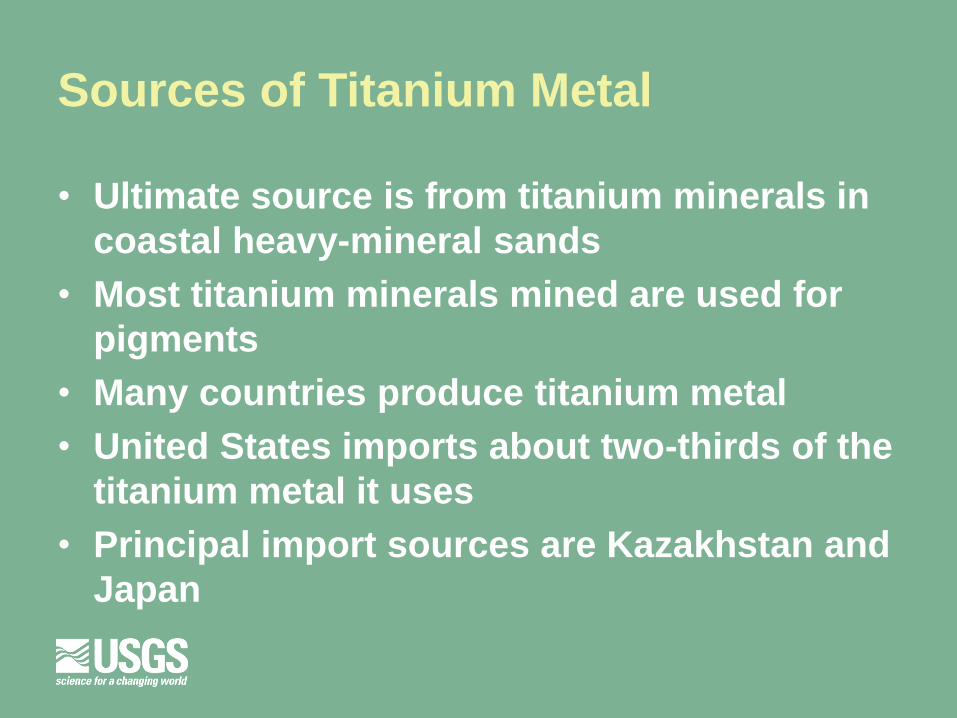
Sources of Titanium Metal
• Ultimate source is from titanium minerals in
coastal heavy-mineral sands
• Most titanium minerals mined are used for
pigments
• Many countries produce titanium metal
• United States imports about two-thirds of the
titanium metal it uses
• Principal import sources are Kazakhstan and
Japan
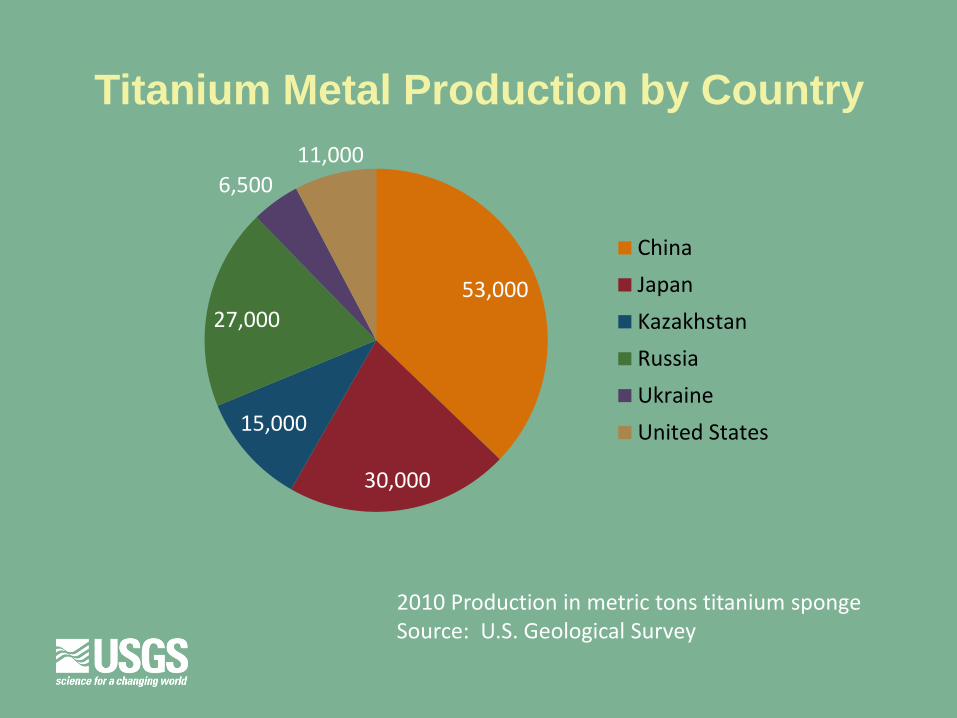
Titanium Metal Production by Country
CHINA
2010 Production in metric tons titanium sponge Source: U.S. Geological Survey
53,000
30,000
15,000
27,000
6,500
11,000
China
Japan
Kazakhstan
Russia
Ukraine
United States
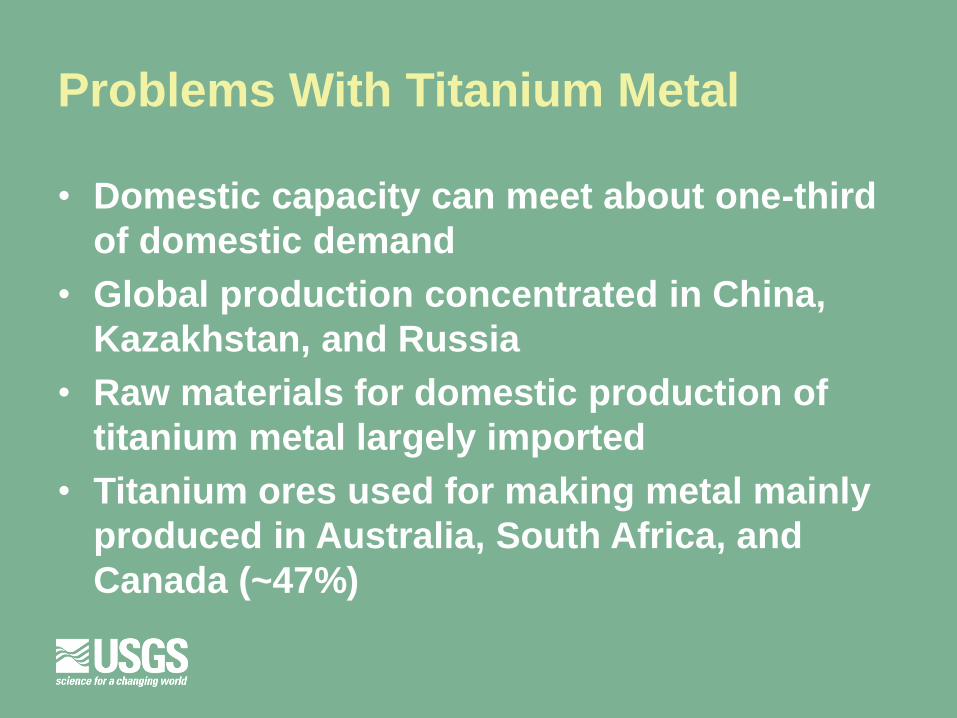
Problems With Titanium Metal
• Domestic capacity can meet about one-third
of domestic demand
• Global production concentrated in China,
Kazakhstan, and Russia
• Raw materials for domestic production of
titanium metal largely imported
• Titanium ores used for making metal mainly
produced in Australia, South Africa, and
Canada (~47%)
U.S. Geological Survey
Minerals Information
• http://minerals.usgs.gov/minerals
• Source of statistics and information on:
– Global mineral production, demand, and reserves
– Mineral material life-cycles
– Historic mineral prices
– Trends in production and demand
– Mineral Commodity Summaries
– Minerals Yearbook

32
Questions and Answer Session

![Yangibana Rare Earths Project Environmental Review ... · Yangibana Rare Earths Project Environmental Review Document [1] Yangibana Rare Earths Project Environmental Review Document](https://img.pdfslide.us/doc/110x75/5e4823f9e96f8107dc434563/yangibana-rare-earths-project-environmental-review-yangibana-rare-earths-project.jpg)