Embed Size (px)
Citation preview
State of Kansas Air Quality
State Implementation Plan
Regional Haze
October 26, 2009
Our Vision - Healthy Kansans living in safe and sustainable environments.
Department of Health and Environment Division of Environment
Bureau of Air (785) 296-6024

2
Table of Contents
List of Tables................................................................................................................................................................3
List of Figures ..............................................................................................................................................................4
List of Appendices .......................................................................................................................................................5
Submittal Letter...........................................................................................................................................................6
Executive Summary.....................................................................................................................................................7
1. Background and Overview of the Federal Regional Haze Regulation...............................................................9
1.1 General Background / History of Federal Regional Haze Rule ..........................................................................9 1.2 States and Tribes without Class I Areas............................................................................................................10
2. General Planning Provisions................................................................................................................................11
3. Regional Planning.................................................................................................................................................12
4. State and Federal Land Manager Coordination................................................................................................14
5. Assessment of Baseline and Current Conditions and Estimate of Natural Conditions in Class I Areas ......15
6. Monitoring Strategy .............................................................................................................................................17
6.1 Current Monitoring Strategy.............................................................................................................................17 6.1.1 Measuring Visibility Data .........................................................................................................................17 6.1.2 Characterizing Visibility Data...................................................................................................................20 6.1.3 Data Validation and Reporting..................................................................................................................21
6.2 Special Monitoring Studies...............................................................................................................................21 6.3 Future Monitoring Strategy ..............................................................................................................................22
7. Emissions Inventory .............................................................................................................................................23
7.1 Inventory Results ..............................................................................................................................................23 7.2 Point Sources ....................................................................................................................................................24
7.2.1 Natural Gas Compressor Stations..............................................................................................................25 7.2.2 Fuel Ethanol Manufacturing Facilities ......................................................................................................26
7.3 Nonpoint Sources..............................................................................................................................................26 7.4 On-Road Mobile Sources..................................................................................................................................29 7.5 Nonroad Mobile Sources ..................................................................................................................................29 7.6 Nonpoint Fires ..................................................................................................................................................29 7.7 Reporting ..........................................................................................................................................................30
8. Modeling Assessment............................................................................................................................................32
8.1 Model Inputs.....................................................................................................................................................33 8.2 Model Performance Evaluation ........................................................................................................................33
8.2.1 Sulfate (SO4) Model Performance.............................................................................................................34 8.2.2 Nitrate (NO3) Model Performance ............................................................................................................34 8.2.3 Organic Matter Carbon (OMC) Model Performance ................................................................................36 8.2.4 Other PM2.5 (soil) Model Performance......................................................................................................36
8.3 Base G Model Simulations ...............................................................................................................................37 8.4 Information from Modeling Performed by Other RPOs ...................................................................................39
8.4.1 MRPO .......................................................................................................................................................39 8.4.2 VISTAS.....................................................................................................................................................39 8.4.3 WRAP .......................................................................................................................................................39
8.5 Control Strategy Simulations............................................................................................................................40
9. Best Available Retrofit Technology.....................................................................................................................44
9.1 BART Eligible Sources in the State of Kansas.................................................................................................44

3
9.2 Determination of Sources Subject to BART.....................................................................................................46 9.3 Determination of BART Requirements for Subject-to-BART Sources ............................................................48
9.3.1 Kansas City Power & Light (KCP&L)......................................................................................................49 9.3.2 Westar Energy...........................................................................................................................................50
9.4 Projected Emissions Reductions Resulting from Installation of BART Controls.............................................51 9.5 Enforceability of BART Requirements.............................................................................................................51 9.6 Monitoring, Recordkeeping, & Reporting of BART Requirements .................................................................52
10. Reasonable Progress Goals / Long Term Strategy ..........................................................................................54
10.1 Determining Visibility Impact ........................................................................................................................54 10.1.2 Light Extinction at Wichita Mountains ...................................................................................................57
10.2 Selection of Kansas Sources for Reasonable Progress Evaluation .................................................................60 10.3 Reasonable Progress Conclusions...................................................................................................................72 10.4 Long-Term Strategy........................................................................................................................................74
10.4.1 Share of Emission Reductions.................................................................................................................74 10.4.1.1 Baseline Inventory.............................................................................................................................74 10.4.2 Anthropogenic Sources of Visibility Impairment ...................................................................................74 10.4.3 Factors the State Must Consider..............................................................................................................75 10.4.3.1 Emission Reductions Due to Ongoing Air Pollution Programs ........................................................75 10.4.3.2 Measures to Mitigate the Impacts of Construction Activities ...........................................................81 10.4.3.3 Emission Limitations and Schedules of Compliance ........................................................................82 10.4.3.4 Source Retirement and Replacement Schedules ...............................................................................83 10.4.3.5 Agricultural and Forestry Smoke Management.................................................................................83 10.4.3.6 Enforceability of Emission Limitations and Control Measures.........................................................83 10.4.3.7 Anticipated Net Effect on Visibility Resulting from Projected Changes to Emissions .....................83
11. Consultation ........................................................................................................................................................85
11.1 Consultation....................................................................................................................................................85 11.1.1 Arkansas and Missouri ............................................................................................................................85 11.1.2 Texas .......................................................................................................................................................86 11.1.3 Oklahoma ................................................................................................................................................86
12. Plan Revisions and Progress Reports................................................................................................................89
13. Determination of the Adequacy of the Existing Plan.......................................................................................90
14. Reference Information .......................................................................................................................................91
14.1 List of References ...........................................................................................................................................91 14.2 List of Acronyms and Abbreviations ..............................................................................................................91
List of Tables
Table 3.1 CENRAP Geographical Area ......................................................................................................................12 Table 7.1 2002 Kansas Emissions Summary, by Source Category and Pollutant .......................................................23 Table 7.2 2018 Kansas Projected Emissions Summary, by Source Category and Pollutant .......................................24 Table 7.3 Percent Changes in Kansas Air Emissions, by Source Category and Pollutant, from 2002 to 2018 ...........24 Table 7.4 Total 2018 Reductions in NOx and SO2 from Kansas Emission Sources Subject to BART........................25 Table 7.5 2002 Top PM10 Emissions from Kansas Nonpoint (Area) Sources .............................................................27 Table 7.6 2002 Top VOC Emissions from Kansas Nonpoint (Area) Sources .............................................................27 Table 7.7 2002 Top NOx Emissions from Kansas Nonpoint (Area) Sources ..............................................................28 Table 7.8 2002 Top SO2 Emissions from Kansas Nonpoint (Area) Sources ...............................................................28 Table 8.1 Kansas NOx Sources Included in the CENRAP Control Strategy Run Using the 2018 Base G Inventory .41 Table 8.2 Kansas SO2 Sources Included in the CENRAP Control Strategy Run Using the 2018 Base G Inventory ..41 Table 9.1 Facilities with BART-Eligible Units in the State of Kansas........................................................................45 Table 9.2 Kansas BART-Eligible Emission Units with at Least One > 0.5 dv Visibility Impact Day on Selected
Class I Areas during 2001–2003 ........................................................................................................................47 Table 9.3 Kansas Facilities with Units Subject to BART under the Regional Haze Rule ...........................................48
4
Table 9.4 BART Presumptive Limits and Operational Standards for NOx and SO2 at Subject-to-BART Emission Units in Kansas ..................................................................................................................................................49
Table 9.5 Projected Emissions Reductions from 2002 Levels after Installation of BART Controls for the Subject-to-BART Emission Units in Kansas. ......................................................................................................................51
Table 10.1 2018 Percent Total and Absolute Light Extinction Value for Worst 20% Visibility Days at Eleven Class I Areas Due to Kansas Air Emission Sources ......................................................................................................56
Table 10.2 2018 Percent Total Light Extinction > 0.5% Due to Kansas Sources for Worst and Best 20% Visibility Days for the Wichita Mountains Class I Area....................................................................................................57
Table 10.3 Light Extinction Attributable to Kansas Emission Sources at Wichita Mountains Class I Area, by Source Category and Particulate Species .......................................................................................................................59
Table 10.4 Kansas Emission Units Not Subject to BART Emitting at Least 500 Tons/Yr of NOx or SO2 in 2002 ....62 Table 10.5 Refinements to AirControlNET Control Technology Determinations ......................................................63 Table 10.6 Sources with Cost per Ton Reduced Greater than $10,000/ton.................................................................63 Table 10.7 Most Effective Control Technologies with Acceptable Control Costs for Kansas 500-Ton NOx and SO2
Emission Units ...................................................................................................................................................64 Table 10.8 Overall Visibility Improvements Resulting from Application of Most Effective Controls at Selected
Kansas 500-Ton NOx and SO2 Emission Units ..................................................................................................66 Table 10.9 Selected Kansas 500-ton NOx and SO2 Emission Units Showing Significant Visibility Improvement
Resulting from Application of Most Effective Controls ....................................................................................67 Table 10.10 Ranked List of Kansas Facilities, Emission Units, and Controls after Cost and Visibility Screening.....68 Table 10.11 Summary of Reasonable Progress Non-Cost Statutory Factors for Selected Kansas Point Sources .......69 Table 10.12 Ranked List of Sources under the Reasonable Progress Analysis ...........................................................71 Table 10.13 Kansas Sources Identified in the Control Strategy PSAT Run ................................................................73 Table 10.14 Additional Measures Implemented under the Long-Term Strategy to Meet Reasonable Progress Goals
...........................................................................................................................................................................82 Table 10.15 Net 2002 to 2018 Improvement in Visibility at Selected Class I Areas Due to BART Controls in Kansas
...........................................................................................................................................................................84 Table 11.1 Kansas Sources Identified by Oklahoma as Potentially Impacting Visibility at Wichita Mountains ........87
List of Figures
Figure 3.1 Geographical Areas of Regional Planning Organizations ..........................................................................12 Figure 6.1 Kansas Improve Protocol Monitoring Network .........................................................................................17 Figure 6.2 Tallgrass Prairie Improve Protocol Monitoring Site ..................................................................................18 Figure 6.3 Cedar Bluff Improve Protocol Monitoring Site..........................................................................................19 Figure 6.4 Sac and Fox Improve Protocol Monitoring Site .........................................................................................20 Figure 7.1 2002 Emissions of Pollutants Contributing to Regional Haze from Kansas Nonpoint Sources.................26 Figure 8.1 Light Extinction for 20% Worst Visibility Days at Wichita Mountains by Particulate Species, Showing
Observed (Left) versus Modeled (Right) Values ...............................................................................................35 Figure 8.2 Percent Visibility Extinction for the Best and Worst 20% Days at Wichita Mountains.............................36 Figure 8.3 URP Glide Path for Wichita Mountains Class I Area with 2018 Projected Results – 20% Worst Days....38 Figure 8.4 URP Glide Path for Wichita Mountains Class I Area with 2018 Projected Results - 20% Best Days.......38 Figure 8.5 Comparison of 2018 Modeling Results from CENRAP, VISTAS, WRAP, and MRPO ...........................40 Figure 8.6 Comparison of Modeling Results from Base G and Control Strategy Runs ..............................................42 Figure 10.1 2018 Percent Total Light Extinction at Eleven Class I Areas from Kansas Sources, by Species, for All
Source Categories during the Worst 20% Days .................................................................................................55 Figure 10.2 2018 Percent Total Light Extinction at Eleven Class I Areas from Kansas Air Emission Sources, by
Source Category, for All Species during the Worst 20% Visibility Days..........................................................56 Figure 10.3 Glide Path for Wichita Mountains Wilderness Area, Oklahoma, in Terms of Light Extinction ..............58 Figure 10.4 Population Growth for the State Of Kansas 1980-2005 and Projected Growth 2010-2020 .....................81

5
List of Appendices (The appendices are located on the enclosed compact disc.)
1.1 Guide to Locating 40 CFR § 51.308 Requirements 1.2 EPA Checklist for Regional Haze SIPs Submitted Under 40 CFR 51.308 2.1 Summary of Legal Authority, Public Participation Process, and Public Comments and Responses on SIP Drafts 4.1 Summary of Federal Land Manager Comments and Responses 4.2 US Department of the Interior Comments on the Kansas Regional Haze SIP 4.3 US Department of Agriculture Comments on the Kansas Regional Haze SIP 7.1 2002 Emissions Inventory 7.2 2018 Emissions Inventory 7.3 Emissions Inventory Technical Documentation 7.4 Natural Gas Production Trends 8.1 Emissions Modeling (TSD Chapter 2) 8.2 Model Performance Evaluation (TSD Chapter 3) 8.3 Additional Supporting Analysis (TSD Chapter 5) 9.1 Identification of BART-Eligible Sources in the State of Kansas 9.2 Modeling Protocol Used to Determine Subject-to-BART Sources 9.3 Results of Modeling to Screen for Sources Subject to BART 9.4 Guidance for Facilities Conducting a BART Analysis 9.5 BART Analysis for KCP&L - La Cygne Units 1 and 2 9.6 BART Analysis for Westar Energy - Gordon Evans Unit 2 and Jeffrey Units 1 and 2 (including May 2009
addendum for GEEC) 9.7 BART Agreements 9.8 BART Exemption modeling – Monarch Cement Kansas City BPU – Quindaro Kansas City BPU – Nearman Westar Energy – Hutchinson Westar Energy – Lawrence 10.1 PSAT Tool-Generated Tables 10.2 2018 Visibility Projections for CENRAP Class I Areas (TSD Appendix D) 10.3 Calculations for Emissions Reductions for Kansas Reasonable Progress Goals 10.4 Kansas Prescribed Fire Emissions 11.1 Sunflower Visibility Analysis Performed by KDHE 11.2 Holcomb Class I Visibility Modeling Report
6

7
Executive Summary
In amendments to the Clean Air Act (CAA) in 1977, Congress set a national goal to restore national parks and wilderness areas to pristine conditions by preventing any future, and remedying any existing man-made visibility impairment. In 1999, the U.S. Environmental Protection Agency (EPA) finalized the federal Regional Haze Rule, which aims to fulfill the goals set forth in the CAA by the year 2064. The Regional Haze Rule addresses the combined effects of several pollution sources over large geographic areas. It was therefore necessary to use a regional planning approach.
EPA designated five regional planning organizations (RPOs); the Central Regional Air Planning Association (CENRAP) was designated as the RPO representing the central portion of the United States. Since its inception, the State of Kansas has been actively involved in CENRAP. The Kansas Regional Haze Plan incorporates data analyses, modeling results, and technical support documents prepared for CENRAP members by various contractors. In addition, CENRAP has served as a platform for consultation between states, tribes, federal land managers (FLMs), and stakeholders.
The federal Regional Haze Rule requires states to submit revisions to their State Implementation Plans by December 17, 2007. The Regional Haze Rule applies to all states that contribute to visibility impairment, even those states that do not have Class I areas. Technical analyses has shown that, while Kansas sources only moderately impact most Class I areas in the CENRAP region, Kansas sources have been identified by Oklahoma as potential contributors to visibility impairment at the Wichita Mountains Class I area.
States are required by 40 CFR 51.308 to set reasonable progress goals for achieving natural visibility conditions, to develop a long-term emissions reduction strategy, and to maintain a monitoring network and emissions inventory to support regional haze programs. In addition, Section 51.308(e) outlines the requirements for applying Best Available Retrofit Technology (BART) to certain older emission sources that were not previously regulated by the CAA.
In July of 2005, EPA published a revised final rule, including Appendix Y to 40 CFR part 51, entitled “Guidelines for BART Determinations under the Regional Haze Rule.” Kansas followed these guidelines in its selection of sources that are subject to BART requirements. Kansas has five subject-to-BART emission units at three facilities. The BART requirements are outlined in Chapter 9 of this document.
In addition to requiring BART controls at subject facilities, the state also evaluated other sources to address reasonable progress goals. Kansas completed a multi-step analysis for large, non-BART sources which considered the cost of compliance, the time necessary for compliance, the energy and non-air quality environmental impacts, and the remaining useful life of the source. This analysis is referred to as the statutory factor analysis, or four-factor analysis. Several additional sources that were not subject to BART have agreed to implement controls as part of the long-term strategy as outlined in Chapter 12 of this document.
At the onset of the regional haze consultation process, states relied heavily on the Clean Air Interstate Rule (CAIR), a rule that addresses the interstate transport of air pollution to downwind states. CAIR covered 28 eastern states plus the District of Columbia, and would have reduced SO2 emissions by an estimated 5.4 million tons and NOx emissions by an estimated 2 million tons by 2015. Affected states had the choice of either meeting the state’s emission budget by

8
requiring power plants to participate in a cap and trade system, or by means of a measure of the state’s choosing. Although Kansas was not included in the final CAIR rulemaking, the rule was a major component in the underlying assumptions used to determine source apportionment because of the reductions expected in neighboring states with Class I areas.
In July 2008, the D.C. District Court of Appeals vacated the CAIR rule in its entirety. On September 24, 2008 EPA filed a petition for rehearing or for a remand of the case without vacatur. On December 23, 2008, the D.C. Court of Appeals remanded the case to EPA without vacatur so that EPA could remedy CAIR’s flaws as were discussed in their July ruling. At this time, it is unclear what the ramifications of this decision may be to the regional haze program.
Kansas will continue to coordinate in regional efforts to reduce visibility impairment at Class I areas by maintaining a visibility monitoring network and emissions inventory, and providing periodic progress reports and SIP revisions as required by the Regional Haze Rule.
9
1. Background and Overview of the Federal Regional Haze Regulation
1.1 General Background / History of Federal Regional Haze Rule In amendments to the Clean Air Act (CAA) in 1977, Congress added Section 169 (42 U.S.C. 7491) setting forth the following national visibility goal of restoring pristine conditions in certain national parks and wilderness areas, which it named Class I areas:
Congress hereby declares as a national goal the prevention of any future,
and the remedying of any existing, impairment of visibility in mandatory
Class I Federal areas which impairment results from man-made air
pollution.
Over the following years, modest steps were taken to address the visibility problems in Class I areas. The control measures taken mainly addressed plume blight from specific pollution sources, and did little to address regional haze issues in the Eastern United States. Plume blight is the visual impairment of air quality that manifests itself as a coherent plume. This results from specific sources, such as a power plant smoke stack, emitting pollutants into a stable atmosphere. The pollutants are then transported in some direction with little or no vertical mixing.
When the CAA was amended in 1990, Congress added Section 169B (42 U.S.C. 7492) authorizing further research and regular assessments of progress. In 1993, the National Academy of Sciences concluded: “current scientific knowledge is adequate and control technologies are available for taking regulatory action to improve and protect visibility” (1).
In addition to authorizing creation of visibility transport commissions and setting forth their duties, Section 169B(f) of the CAA specifically mandated creation of the Grand Canyon Visibility Transport Commission (Commission) to make recommendations to the U.S. Environmental Protection Agency (EPA) for the region affecting the visibility of the Grand Canyon National Park. Following four years of research and policy development the Commission submitted its report to EPA in June of 1996. This report, as well as the many research reports prepared by the Commission, contributed invaluable information to EPA in its development of the federal Regional Haze Rule.
EPA’s Regional Haze Rule was adopted July 1, 1999, and went into effect on August 30, 1999. The Regional Haze Rule aims at achieving national visibility goals by 2064. This rulemaking addressed the combined visibility effects of various pollution sources over a wide geographic region. This wide-reaching pollution net meant that many states, even those without Class I Areas, would be required to participate in haze reduction efforts. EPA designated five regional planning organizations (RPOs) to assist with the coordination and cooperation needed to address the visibility issue. The Central Regional Air Planning Association (CENRAP) was designated as the RPO to represent those states that make up the midsection of the contiguous United States.
On May 24, 2002, the U.S. Court of Appeals D.C. District Court ruled on the challenge brought by the American Corn Growers Association against EPA’s Regional Haze Rule of 1999. The Court denied industry’s challenge to the haze rule goals of natural visibility and no degradation requirements and remanded to EPA the Best Available Retrofit Technology (BART) provisions of the rule.
10
EPA revised the Regional Haze Rule pursuant to the remand. Amendments to the rule and guidelines for BART were finalized on June 15, 2005. To facilitate the review of this State Implementation Plan (SIP) by the EPA, federal land managers (FLMs), stakeholders, and the public, a guide is provided for locating 40 CFR Section 308 Requirements in this document (see Appendix 1.1). The EPA Checklist for Regional Haze SIPs Submitted under 40 CFR 51.308 can be found in Appendix 1.2. 1.2 States and Tribes without Class I Areas In accordance with 40 CFR 51.308(d), the State of Kansas must address regional haze in each mandatory Class I area located outside the State which may be affected by emissions from within the State. Kansas consulted with states and tribes in the CENRAP region as outlined in Chapter 3 and Chapter 11. The State of Oklahoma has determined that Kansas emission sources contribute to visibility impairment at the Wichita Mountains Class I area. Other states in the region did not find Kansas sources to be significant contributors to visibility impairment in Class I areas, at the present. New determinations could be made in the future by other states.
List of Chapter 1 Appendices 1.1 Guide to Locating 40 CFR Section 308 Requirements 1.2 EPA Checklist for Regional Haze SIPs Submitted under 40 CFR 51.308
11
2. General Planning Provisions
Pursuant to 40 CFR 51.308(a) and (b), the State of Kansas submits this SIP revision to meet the requirements of EPA’s Regional Haze Rule which was adopted to comply with the Clean Air Act. Elements of this plan address the requirements pursuant to 40 CFR 51.308(d) which include regional planning, state and federal land manager (FLM) coordination, setting reasonable progress goals, consulting with states that contain Class I areas, and developing a long-term strategy. This plan also addresses the Best Available Retrofit Technology (BART) components of 40 CFR 50.308(e). In addition, this SIP contains a commitment to provide plan revisions, periodic progress reports, and adequacy determinations. The State of Kansas has adopted this SIP in accordance with Kansas Air Quality Statutes 65-3005 et. seq. The State of Kansas provided public notice in the Kansas Register on July 17, 2008, of the opportunity to comment on the SIP. In addition, Kansas also provided a copy of the SIP to the Iowa Tribe in Kansas and Nebraska, the Kickapoo Tribe, the Prairie Band Potawatomi Nation, and the Sac and Fox Nation. The State of Kansas held a public hearing regarding the SIP on August 20, 2008, in Topeka. Public comments were addressed and are summarized in Appendix 2.1. The State of Kansas provided a second public notice in the Kansas Register on July 16, 2009, of the opportunity to comment on the revised SIP. In addition, Kansas also provided a copy of the revised SIP to the Iowa Tribe in Kansas and Nebraska, the Kickapoo Tribe, the Prairie Band Potawatomi Nation, and the Sac and Fox Nation. The State of Kansas held a public hearing regarding the revised SIP on August 27, 2009, in Topeka. Public comments were addressed and are summarized in Appendix 2.1.
List of Chapter 2 Appendices
2.1 Summary of Legal Authority, Public Participation Process, and Public Comments and Responses on SIP Drafts

12
3. Regional Planning
In 1999, EPA and affected states/tribes agreed to create five RPOs to facilitate interstate coordination on Regional Haze SIPs. The State of Kansas is a member of the Central Regional Air Planning Association (CENRAP) RPO. Member states of CENRAP are listed in Table 3.1. Figure 3.1 is a map of all five regional planning organizations.
Table 3.1 CENRAP Geographical Area
Arkansas Iowa
Kansas Louisiana
Minnesota Missouri
Nebraska Oklahoma
Texas *Includes both state and tribal areas
Figure 3.1 Geographical Areas of Regional Planning Organizations

13
The governing body of CENRAP is the Policy Oversight Group (POG). The POG is made up of 18 voting members representing the states and tribes within the CENRAP region and non-voting members representing local agencies, EPA, Fish and Wildlife Service, Forest Service, and National Park Service. The POG facilitates communication with federal land managers, stakeholders, and CENRAP staff.
Since its inception, CENRAP has established an active committee structure to address both technical and non-technical issues related to regional haze. The work of CENRAP is accomplished through five standing workgroups: Monitoring, Emissions Inventory, Modeling, Communications, and Implementation and Control Strategies. Participation in workgroups is open to all interested parties. Ad hoc workgroups are formed by the POG to address specific issues. Ultimately, policy decisions are made by the CENRAP POG.
CENRAP has adopted the approach that the Regional Haze Rule requires the states to “establish goals and emission reduction strategies for improving visibility in all 156 mandatory Class I parks and wilderness areas.” The Regional Haze Rule also encourages states and tribes to work together in regional partnerships.
This SIP utilizes data analyses, modeling results, and other technical support documents prepared for CENRAP members by contractors and provided through the CENRAP website or FTP site. By coordinating with CENRAP and other RPOs, the State of Kansas has worked to ensure that its long-term strategy, reasonable progress goals, and BART determinations provide sufficient reductions to mitigate impacts of sources from the State of Kansas on Class I areas.
14
4. State and Federal Land Manager Coordination
Coordination between states and federal land managers (FLMs) is required by 40 CFR 51.308(i). FLMs are part of CENRAP’s POG and the membership on standing committees. FLMs have contributed to the development of technical and non-technical work as a result of that participation. In addition, opportunities have been provided by CENRAP for FLMs to review and comment on each of the technical documents developed by CENRAP and included in this SIP. The State of Kansas has provided agency contacts to the FLMs as required. In development of this plan, the FLMs were consulted in accordance with the provisions of 40 CFR 51.308(i)(2). The State of Kansas sent copies of modeling protocols for BART screening, modeling results, and BART analyses to the FLMs. In addition, Kansas provided FLMs an opportunity for consultation, in person and at least 60 days prior to holding any public hearing on an implementation plan or plan revision. During the consultation process, the FLMs were given the opportunity to address their:
• Assessment of the impairment of visibility in any Class I areas
• Recommendations on the development of reasonable progress goals
• Recommendations on the development and implementation of strategies to address visibility impairment.
The State of Kansas sent the draft SIP to the FLMs on November 1, 2007. The State of Kansas notified the FLMs of a public hearing to be held on August 20, 2008. A summary of FLM comments and responses are included in Appendix 4.1 to this plan. The letters received from the FLMs can be found in Appendix 4.2 and 4.3. The State of Kansas sent the draft revised SIP to the FLMs on July 16, 2009. The State of Kansas notified the FLMs of a public hearing held on August 27, 2009. A summary of FLM comments and responses are included in Appendix 4.1 to this plan. The State of Kansas will continue to coordinate and consult with the FLMs during the development of future progress reports and plan revisions, as well as during the implementation of programs having the potential to contribute to visibility impairment in the mandatory Class I areas. List of Chapter 4 Appendices 4.1 Summary of Federal Land Manager Comments and Responses 4.2 US Department of the Interior Comments on the Kansas Regional Haze SIP 4.3 US Department of Agriculture Comments on the Kansas Regional Haze SIP
15
5. Assessment of Baseline and Current Conditions and Estimate of Natural Conditions in
Class I Areas
The goal of the Regional Haze Rule is to restore natural visibility conditions to the 156 Class I areas identified in the 1977 Clean Air Act Amendments. Section 51.301(q) defines natural conditions: “Natural conditions include naturally occurring phenomena that reduce visibility as measured in terms of light extinction, visual range, contrast, or coloration.” Regional Haze SIPs must contain measures that make “reasonable progress” toward this goal by reducing anthropogenic emissions that cause haze. Although Kansas does not have any Class I areas, this chapter is provided as background information to support the technical analyses presented throughout this document. For each Class I area, there are three metrics of visibility that are part of the determination of reasonable progress:
1) baseline conditions, 2) natural conditions, and 3) current conditions.
Each of the three metrics includes the concentration data of the visibility pollutants as different terms in the light extinction algorithm, with respective extinction coefficients and relative humidity factors. Total light extinction when converted to deciviews (dv) is calculated for the average of the 20 percent best and 20 percent worst visibility days. “Baseline” visibility is the starting point for the improvement of visibility conditions. It is the average of the IMPROVE monitoring data for 2000 through 2004 and can be thought of as “current” visibility conditions for this initial planning period. The comparison of initial baseline conditions to natural visibility conditions indicates the amount of improvement necessary to attain natural visibility by 2064.
Each state must estimate natural visibility levels for Class I areas within its borders in consultation with federal land managers and other states [40 CFR 51.308(d)(2)]. “Current conditions” are assessed every five years as part of the SIP review where actual progress in reducing visibility impairment is compared to the reductions committed to in the SIP. EPA’s Guidance for Estimating Natural Visibility Conditions under the Regional Haze Program (2) provides states a “default” estimate of natural visibility. The default values of concentrations of visibility pollutants are based on a 1990 National Acid Precipitation Assessment Program report(3). In the guidance, the United States is divided into “East” and “West” along the western boundary of the states one tier west of the Mississippi River. This division divides the CENRAP states into “East” (MN, IA, MO, AR, LA) with seven Class I areas, and “West” (NE, KS, OK, TX) with three Class I areas. In the two equations, only sulfate and organic carbon have different values, but the calculated deciview difference is significant. In the guidance, EPA also provides that states may use a “refined approach” to estimate the values that characterize the natural visibility conditions of the Class I areas. The purpose of such

16
a refinement would be to provide more accurate estimates with changes to the extinction algorithm that may include the concentration values, factors to calculate extinction from a measured particulate species and particle size, the extinction coefficients for certain compounds, geographical variation (by altitude) of a fixed value, and the addition of visibility pollutants. States can choose between the default and refined equations. One equation is used to calculate baseline and current conditions of visibility due to haze-causing pollutants and, with natural concentrations of the same pollutants; the same equation is used to calculate natural visibility.
The old (default) algorithm:
bext = 3 × f (RH) × [Sulfate]
+ 3 × f (RH) × [Nitrate]
+ 4 × [Organic Carbon]
+ 10 × [Elemental Carbon]
+ 1 × [Fine Soil]
+ 0.6 × [Coarse Mass] + 10 The new (refined) algorithm: (Differences from the default are in bold)
bext = 2.2 ×××× fS (RH) ×××× [Small Sulfate] + 4.8 ×××× fL(RH) ×××× [Large Sulfate]
+ 2.4 ×××× fS (RH) ×××× [Small Nitrate] + 5.1 ×××× fL(RH) ×××× [Large Nitrate]
+ 2.8 ×××× fS (RH) ×××× [Small Organic Carbon] + 6.1 ×××× fL(RH) ×××× [Large Organic Carbon]
+ 10 × [Elemental Carbon]
+ 1 × [Fine Soil]
+ 1.7 × fSS(RH) × [Sea Salt]
+ 0.6 × [Coarse Mass]
+ Rayleigh Scattering (Site Specific)
+ 0.33 ×××× [NO2 (ppb)]
The choice between use of the default or the refined equation for calculating the visibility metrics for each Class I area is made by the state in which the Class I area is located [40 CFR 51.308(d)(2)]. Kansas consulted with other CENRAP states as those states assessed baseline and natural visibility conditions in their respective Class I areas.

17
6. Monitoring Strategy
Section 51.308(d)(4) of the federal Regional Haze Rule requires a monitoring strategy for measuring, characterizing, and reporting regional haze visibility impairment that is representative of all mandatory Class I areas. The monitoring strategy relies, in large part, upon participation in the Interagency Monitoring of Protected Visual Environments (IMPROVE) network. The IMPROVE website is located at http://vista.cira.colostate.edu/improve/. 6.1 Current Monitoring Strategy 6.1.1 Measuring Visibility Data
Shortly after creation of the Central Regional Air Planning Association (CENRAP), the organization’s Monitoring Workgroup identified large visibility data voids in southern Arkansas, Iowa, Kansas, southern Minnesota, Nebraska, and Oklahoma. Only five IMPROVE sites were located in the CENRAP region. Between 2000 and 2003, five more IMPROVE sites and 15 IMPROVE Protocol sites (i.e., sites not managed by IMPROVE directly but by individual government or tribal organizations) were established in the CENRAP region.
In conjunction with CENRAP and EPA Region 7, Kansas installed one IMPROVE protocol sampler at Cedar Bluff State Park in Trego County in the western part of the State, and another at the Tallgrass Prairie National Preserve in the Flint Hills region of eastern Kansas. A third IMPROVE Protocol sampler in Kansas is operated independently at Reserve, Kansas, by the Sac and Fox Nation of Missouri in Kansas and Nebraska.
Figure 6.1 Kansas IMPROVE Protocol Monitoring Network

18
6.1.1.1 Tallgrass Prairie
The IMPROVE Protocol site at Tallgrass Prairie National Preserve is located in the heart of the Flint Hills of eastern Kansas. The 10,894 acre preserve was established in 1996, with most of the land held in trust, but managed by the National Park Service. This area is within the largest remaining expanse of tall grass prairie in North America.
Management of this prairie region requires seasonal burning of grass in the early spring to inhibit the invasion of woody and non-native plants and to maximize the rate of weight gain in beef cattle early in the grazing season. Kansas considers monitoring in the Flint Hills to be a priority, and future addition of monitors at the Tallgrass Prairie site is a possibility.
Tallgrass IMPROVE Protocol
Lat: 38.43411 Long: -96.56038
Chase County
Start: 9/2/2002
Figure 6.2 Tallgrass Prairie IMPROVE Protocol Monitoring Site
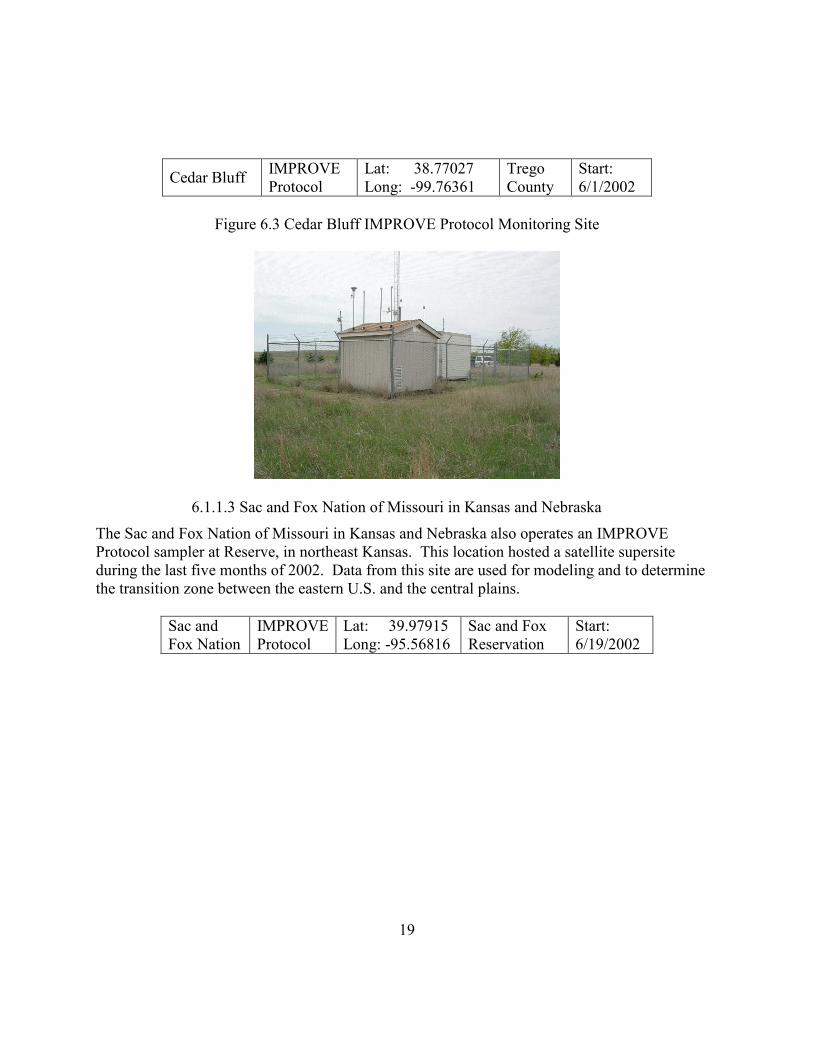
6.1.1.2 Cedar Bluff
The site at Cedar Bluff Reservoir in western Kansas serves as the State's background site for evaluating baseline levels of regional ambient air pollutants (i.e., PM2.5 and ozone) in Kansas. The Cedar Bluff site is approximately 175 miles from the Tallgrass Prairie site, 200 miles from the Newkirk, Oklahoma site, and 240 miles from the Sac and Fox (Reserve, Kansas) site. Because of its remote location, this site was selected for installation of an IMPROVE Protocol sampler to fill a very large spatial data gap in the CENRAP region. The site also hosts a CENRAP nephelometer. Preliminary analysis of data has indicated that the Cedar Bluff site is influenced by air masses originating in different regions at different times of the year, due to its location in the center of North America and associated meteorology. The State of Kansas considers the IMPROVE Protocol sampler at this site to be a priority.
19
Cedar Bluff IMPROVE Protocol
Lat: 38.77027 Long: -99.76361
Trego County
Start: 6/1/2002
Figure 6.3 Cedar Bluff IMPROVE Protocol Monitoring Site
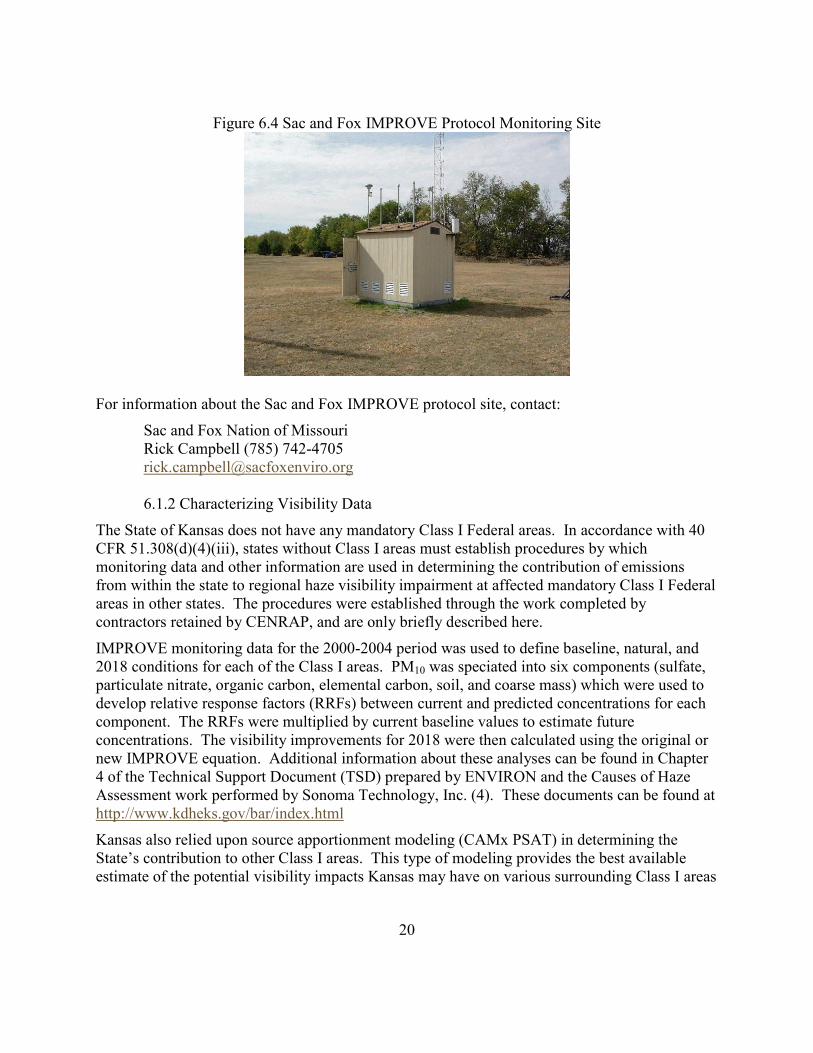
6.1.1.3 Sac and Fox Nation of Missouri in Kansas and Nebraska
The Sac and Fox Nation of Missouri in Kansas and Nebraska also operates an IMPROVE Protocol sampler at Reserve, in northeast Kansas. This location hosted a satellite supersite during the last five months of 2002. Data from this site are used for modeling and to determine the transition zone between the eastern U.S. and the central plains.
Sac and Fox Nation
IMPROVE Protocol
Lat: 39.97915 Long: -95.56816
Sac and Fox Reservation
Start: 6/19/2002
20
Figure 6.4 Sac and Fox IMPROVE Protocol Monitoring Site
For information about the Sac and Fox IMPROVE protocol site, contact:
Sac and Fox Nation of Missouri Rick Campbell (785) 742-4705 [email protected]
6.1.2 Characterizing Visibility Data
The State of Kansas does not have any mandatory Class I Federal areas. In accordance with 40 CFR 51.308(d)(4)(iii), states without Class I areas must establish procedures by which monitoring data and other information are used in determining the contribution of emissions from within the state to regional haze visibility impairment at affected mandatory Class I Federal areas in other states. The procedures were established through the work completed by contractors retained by CENRAP, and are only briefly described here.
IMPROVE monitoring data for the 2000-2004 period was used to define baseline, natural, and 2018 conditions for each of the Class I areas. PM10 was speciated into six components (sulfate, particulate nitrate, organic carbon, elemental carbon, soil, and coarse mass) which were used to develop relative response factors (RRFs) between current and predicted concentrations for each component. The RRFs were multiplied by current baseline values to estimate future concentrations. The visibility improvements for 2018 were then calculated using the original or new IMPROVE equation. Additional information about these analyses can be found in Chapter 4 of the Technical Support Document (TSD) prepared by ENVIRON and the Causes of Haze Assessment work performed by Sonoma Technology, Inc. (4). These documents can be found at http://www.kdheks.gov/bar/index.html
Kansas also relied upon source apportionment modeling (CAMx PSAT) in determining the State’s contribution to other Class I areas. This type of modeling provides the best available estimate of the potential visibility impacts Kansas may have on various surrounding Class I areas
21
in 2018. Source apportionment modeling for the CENRAP region is outlined in Chapter 10 of this document.
6.1.3 Data Validation and Reporting
The filter samples from all IMPROVE modules from the three IMPROVE-protocol sites in Kansas are sent for analysis to the Crocker Nuclear Laboratory at the University of California in Davis, and the resultant data are subjected to preliminary review and quality assurance/quality control (QA/QC) procedures. Nephelometer data from the Cedar Bluff site are validated by the CENRAP contractor. Other visibility-related data collected by the State of Kansas (PM2.5, SO2, NO2, and NH3) are subjected to review and QA/QC procedures prior to reporting.
After validation, data from the three IMPROVE-protocol sites in Kansas are sent by the Crocker Nuclear Laboratory at the University of California in Davis for posting to the IMPROVE website and the Visibility Information Exchange Web System (VIEWS) website [http://vista.cira.colostate.edu/views/]. Nephelometer data from the Cedar Bluff site are reported to the VIEWS database by the CENRAP contractor. Other visibility-related data collected by the State of Kansas (PM2.5, SO2, NO2, and NH3) are reported to EPA's Air Quality System (AQS) database on a quarterly basis. For the State of Kansas, this fulfills the reporting requirement of visibility data under 40 CFR 51.308(d)(4)(iv). 6.2 Special Monitoring Studies
CENRAP, in cooperation with member states and tribes, studied the impacts of ammonia on visibility impairment in the CENRAP region. Preliminary monitoring studies and monitoring data analysis suggest that ammonia contributes to visibility impairment in the CENRAP geographical area.
During two measurement periods in 2002 (August 24 – October 23 and November 18 –December 31), an intensive study was conducted to characterize ambient fine particulate matter (PM2.5) at the Sac and Fox Nation IMPROVE Protocol site in Reserve. The sampling station was configured in the same manner as the St. Louis, Missouri Supersite. Selected semi-continuous monitors remained in operation during the six-week interim period. This special study was funded by CENRAP and EPA Region 7. Daily 24-hour mass reconstructions demonstrated the episodic nature and seasonal variations of sulfate (summer/fall) and nitrate (fall/winter). Ion balances for 24-hour sampling periods were consistent with conditions favorable for formation of ammonium nitrate. A sulfate transport episode was captured as well as elevated local ammonia levels possibly associated with seasonal application of anhydrous ammonia to corn and soybean fields.
From November 1, 2003 through June 28, 2006, the Sac and Fox Nation also operated a passive ammonia monitoring station for a CENRAP ammonia monitoring project. Denuder-based gas-phase ammonia, nitric acid, and sulfur dioxide were monitored at the Reserve, Kansas site and six other sites within the CENRAP region. Twenty-four hour samples were collected on a one-in-six day schedule. The denuder-based samples were analyzed by the Illinois State Water Survey Laboratory. IMPROVE Protocol samplers were in operation at all but one of the
22
CENRAP ammonia study sites. This special ammonia study was conducted to collect data for evaluation of the role of ammonia in regional haze formation in the CENRAP region. 6.3 Future Monitoring Strategy
In order to assess progress in reducing visibility impairment in Class I areas, the existing IMPROVE and IMPROVE Protocol sites will be maintained contingent upon continued national funding. Data from the IMPROVE Protocol sites in Kansas will be used to characterize and model conditions within the State of Kansas. Data from IMPROVE monitors will be used to compare visibility conditions in Kansas to regional haze visibility impairment at Class I areas affected by emissions from Kansas to satisfy requirements of 40 CFR 51.308(d)(4)(i). The State of Kansas will evaluate the monitoring network periodically, including an evaluation of changes in technology and the need for new monitors. With continuation of adequate funding, the network will be reconfigured as necessary to enable assessment of reasonable progress toward goals for each of mandatory Class I area potentially affected by emissions from within the State of Kansas.

23
7. Emissions Inventory
Kansas is required by 40 CFR 51.308(d)(4)(v) to provide a statewide emissions inventory of pollutants that are reasonably anticipated to cause or contribute to visibility impairment in any mandatory Class I area(s).
7.1 Inventory Results
As specified in the applicable EPA guidance, the pollutants inventoried by Kansas include volatile organic compounds (VOCs), nitrogen oxides (NOx), fine particulates (PM2.5), coarse particulates (PM10), ammonia (NH3), and sulfur dioxide (SO2). An inventory was developed for the baseline year 2002; a summary of those inventory results is presented in Table 7.1. The complete 2002 emission inventory can be found in Appendix 7.1. Included in this appendix are two other categories, fugitive dust and road dust, which are not included in the summaries below.
Table 7.1 2002 Kansas Emissions Summary, by Source Category and Pollutant
VOC NOx PM2.5 PM10 NH3 SO2 Source category
tons/yr
Point 40,278 165,224 16,321 38,366 59,750 143,367
Nonpoint (except fires) 87,327 13,851 10,024 10,533 796 3,100
On-road mobile 74,519 100,152 1,607 2,179 2,816 3,097
Nonroad mobile 28,138 82,697 5,993 6,549 115 8,101
Nonpoint fire 35,046 29,322 117,597 129,187 19 11,051
Biogenic 575,073 49,616 N/A N/A N/A N/A
Totals 840,381 440,862 151,542 186,814 63,496 168,716
Methodologies for the 2002 emissions inventory are documented in Appendix 7.3.
These 2002 emissions were grown to year 2018, primarily using the Economic Growth Analysis System (EGAS6), MOBILE 6.2 vehicle emission modeling software, and the Integrated Planning Model (IPM) version 2.93 for electric generating units (EGUs). Table 7.2, a summary of those inventory results follows; the complete 2018 emissions inventory is submitted as Appendix 7.2.
Methodologies for the 2018 emissions inventory are documented in Appendix 7.3.
Table 7.3 presents percent changes in the inventory based on values in Tables 7.1 and 7.2, in relation to base year 2002. Discussions of the projected changes for different source categories follow.
24
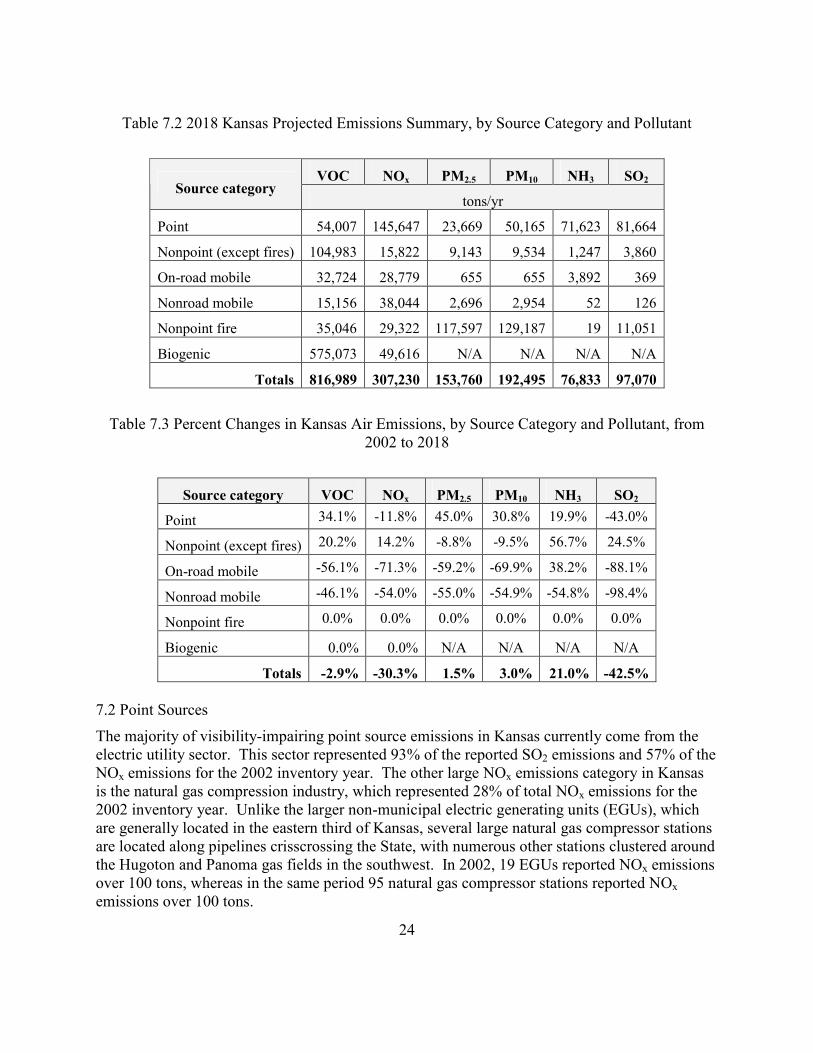
Table 7.2 2018 Kansas Projected Emissions Summary, by Source Category and Pollutant
VOC NOx PM2.5 PM10 NH3 SO2 Source category
tons/yr
Point 54,007 145,647 23,669 50,165 71,623 81,664
Nonpoint (except fires) 104,983 15,822 9,143 9,534 1,247 3,860
On-road mobile 32,724 28,779 655 655 3,892 369
Nonroad mobile 15,156 38,044 2,696 2,954 52 126
Nonpoint fire 35,046 29,322 117,597 129,187 19 11,051
Biogenic 575,073 49,616 N/A N/A N/A N/A
Totals 816,989 307,230 153,760 192,495 76,833 97,070
Table 7.3 Percent Changes in Kansas Air Emissions, by Source Category and Pollutant, from
2002 to 2018
Source category VOC NOx PM2.5 PM10 NH3 SO2
Point 34.1% -11.8% 45.0% 30.8% 19.9% -43.0%
Nonpoint (except fires) 20.2% 14.2% -8.8% -9.5% 56.7% 24.5%
On-road mobile -56.1% -71.3% -59.2% -69.9% 38.2% -88.1%
Nonroad mobile -46.1% -54.0% -55.0% -54.9% -54.8% -98.4%
Nonpoint fire 0.0% 0.0% 0.0% 0.0% 0.0% 0.0%
Biogenic 0.0% 0.0% N/A N/A N/A N/A
Totals -2.9% -30.3% 1.5% 3.0% 21.0% -42.5%
7.2 Point Sources
The majority of visibility-impairing point source emissions in Kansas currently come from the electric utility sector. This sector represented 93% of the reported SO2 emissions and 57% of the NOx emissions for the 2002 inventory year. The other large NOx emissions category in Kansas is the natural gas compression industry, which represented 28% of total NOx emissions for the 2002 inventory year. Unlike the larger non-municipal electric generating units (EGUs), which are generally located in the eastern third of Kansas, several large natural gas compressor stations are located along pipelines crisscrossing the State, with numerous other stations clustered around the Hugoton and Panoma gas fields in the southwest. In 2002, 19 EGUs reported NOx emissions over 100 tons, whereas in the same period 95 natural gas compressor stations reported NOx emissions over 100 tons.

25
For the point source sector, Kansas projects significant reductions in NOx and SO2 by 2018, primarily at the five EGU units in the State found to be subject to BART controls. Table 7.4 details the reductions predicted from these emission units.
Table 7.4 Total 2018 Reductions in NOx and SO2 from Kansas Emission Sources Subject to BART
2002
NOx1
2002
SO21
2018
NOx2
2018
SO22
NOx
reduction
SO2
reduction Subject-to-BART unit
tons/yr
KCP&L - La Cygne 1 30,058 6,648 2,576 3,948 27,482 2,700
KCP&L - La Cygne 2 8,362 19,355 6,229 3,993 2,133 15,362
Westar - Gordon Evans 2 2,023 3,211 138 0.0 1,886 3,211
Westar - Jeffrey 1 9,602 20,459 4,268 3,532 5,334 16,927
Westar - Jeffrey 2 10,892 23,715 4,040 3,465 6,852 20,251
Total BART reductions 43,687 58,451
1 Data from EPA Clean Air Markets 2 Data from IPM 3.0
The remaining 2002 to 2018 emissions differences reflect the projected growth in emissions due to construction of new sources. The projections were estimated by using EGAS 5.0 for the non-EGU sources and the Integrated Planning Model (IPM), version 2.93 for the EGU sector. At the time this document was being prepared, a 1,400 MW coal-fired power plant was in the permitting process in Kansas. This power plant, located in Holcomb in the southwest portion of the State, was analyzed for visibility impacts on the Wichita Mountains Class I area. It was determined, using CAMx PSAT modeling, that visibility impairment in the Wichita Mountains attributed to this new source would be below 0.5 delta deciview. The permit for the 1,400 MW power plant was denied by the Secretary of KDHE. However, on May 4, 2009, a settlement agreement was reached that allows for an 895 MW coal-fired power plant to be constructed in Holcomb.
7.2.1 Natural Gas Compressor Stations
From 1995 to 2005, production from the Hugoton gas field, the State’s largest natural gas production area, has decreased from approximately 460,000 billion cubic feet (Bcf) to 200,000 Bcf. Over the same period, actual NOx emissions reported from the compressor stations have steadily decreased from 75,000 tons/yr to 50,000 tons/yr. Kansas expects emissions from this sector to continue to decline as production declines and equipment is replaced with new, more efficient designs. Additional information on this sector can be found in Appendix 7.4.

26
7.2.2 Fuel Ethanol Manufacturing Facilities
In 2002, there were four ethanol plants in operation in Kansas, with a total production capacity of 164 million gallons per year (Mgal/yr). That number grew to 14 facilities in 2007 with a total capacity of 814 Mgal/yr. Currently, there are 12 active ethanol facilities, 3 facilities under construction, 1 facility that has been permitted but not yet built, 1 facility built but not active, and 1 facility whose permit application is pending. In 2008 and 2009, expansion of the fuel ethanol industry in Kansas has slowed dramatically. The actual emission rate of NOx for these plants is quite low. KDHE does not anticipate visibility impacts due to the operation of additional facilities. 7.3 Nonpoint Sources
Nonpoint source emissions were compiled from the final 2002 National Emissions Inventory (NEI) database. Although PM2.5 emissions values are not available from this data source, the NEI gives emissions estimates at a detailed level for source categories, so that source attribution is more easily analyzed. (Note also the ratio of PM2.5 to PM10, can for comparative purposes be approximated as 0.2). Only pollutants likely to contribute to regional haze (i.e., NOx, SO2, PM10, and VOC) were considered in this analysis. The relative contributions of these pollutants within the nonpoint source category are shown in Figure 7.1.
Figure 7.1 2002 Emissions of Pollutants Contributing to Regional Haze from Kansas Nonpoint
Sources
0
100,000
200,000
300,000
400,000
500,000
600,000
700,000
800,000
PM10 VOC NOx SO2
tons/yr

27
PM10 accounts for by far the largest nonpoint source category, and can be attributed primarily to agricultural crop production (including burning of crop residue), unpaved and paved road dust, and dust from construction activities. Tables 7.5 through 7.8 give the relative contributions from the top sources of nonpoint emissions for the State for each of the four haze-causing pollutants. These values are based on the 2002 National Emissions Inventory.
Table 7.5 2002 Top PM10 Emissions from Kansas Nonpoint (Area) Sources
Source classification tons/yr % of nonpoint PM10 % of total PM10
Unpaved roads 275,026 37.9% 36.6%
Agricultural crop production 253,845 35.0% 33.8%
Agricultural burning 99,292 13.7% 13.2%
Road construction 48,050 6.6% 6.4%
Paved roads 32,892 4.5% 4.4%
Mining and quarrying 7,539 1.0% 1.0%
Table 7.6 2002 Top VOC Emissions from Kansas Nonpoint (Area) Sources
Source classification tons/yr
% of nonpoint
VOC % of total VOC
Agricultural burning 55,058 41.4% 22.7%
Residential fuel combustion 18,758 14.1% 7.7%
Gasoline service stations 13,398 10.1% 5.5%
Misc. commercial solvents 7,986 6.0% 3.3%
Misc. consumer solvents 7,185 5.4% 3.0%
Misc. industrial solvents 6,554 4.9% 2.7%
Graphic arts solvents 6,476 4.9% 2.7%
Surface coatings (solvent evap.) 5,704 4.3% 2.4%
All other misc. solvent usage 4,044 3.0% 1.7%

28
Table 7.7 2002 Top NOx Emissions from Kansas Nonpoint (Area) Sources
Source classification tons/yr % of nonpoint
NOx
% of total NOx
Agricultural burning 29,099 68.8% 7.6%
Industrial fuel combustion 6,298 14.9% 1.6%
Residential fuel combustion 4,203 9.9% 1.1%
Table 7.8 2002 Top SO2 Emissions from Kansas Nonpoint (Area) Sources
Source classification tons/yr % of nonpoint
SO2
% of total
SO2
Industrial fuel combustion 24,218 66.6% 12.9%
Agricultural burning 10,949 30.1% 5.9%
The nonpoint source category represents a large portion of the total anthropogenic emissions inventory for VOC emissions. This pollutant from nonpoint sources is projected to grow by 20% in 2018 from the 2002 estimate. In 2018, the estimate is for approximately 105,000 tons/yr of VOC from the nonpoint source category. Much of the nonpoint VOC category is from solvent utilization and residential heating. Because VOC is not anticipated to be a large contributor to visibility impairment in the Class I areas surrounding Kansas, the remaining focus will be on NOx and SO2 nonpoint source emissions.
NOx and SO2 make up a relatively small proportion of the State’s nonpoint emissions inventory, at 42,282 tons/yr and 36,385 tons/yr, respectively. With the exception of agricultural burning, the major contributing source categories for NOx are associated with residential, industrial, and commercial natural gas combustion. These categories are projected to grow at a moderate pace between 2002 and 2018. For SO2, the major contributing categories are industrial fuel (primarily coal and distillate oil) combustion. These categories are also projected to grow at a moderate pace between 2002 and 2018. The nonpoint industrial coal combustion category in the National Emissions Inventory is overestimated, both in the 2002 and 2018 projected inventories, as most industrial sources utilizing coal are captured in the State’s point source inventory. In addition, the distillate and residual oil combustion in the nonpoint sector are likely to remain unchanged or decrease between 2002 and 2018. At worst, if the 2018 projections are correct, the nonpoint emissions for SO2 are still only a fraction of the point source SO2 emissions.

29
7.4 On-Road Mobile Sources
EPA’s MOBILE6.2 emissions model predicts reductions for NOx, SO2, and VOC from 2002 to 2018 of 71.3%, 88.1%, and 56.1%, respectively. These reductions are due to vehicle turnover and full implementation of current federal regulations, including the federal emission standards for light-duty vehicles and light-duty trucks and the Tier 2 Program. These rules are discussed in more detail in Chapter 10. Note that growth in the total vehicle miles traveled (VMT) metric for the 2002 to 2018 period for Kansas increased from 28,825 million vehicle miles in 2002 to 38,509 million vehicle miles in 2018, constituting a 34% increase.
7.5 Nonroad Mobile Sources
The nonroad mobile emissions category includes aircraft operations, marine vessels, recreational boats, railroad locomotives, and a broad category of other equipment ranging from large construction equipment to handheld string trimmers. Calculation methods for emissions from nonroad engine sources are based on information about equipment population, engine horsepower, load factor, emission factor, and annual usage. The EPA’s NONROAD 2005 model was used to estimate emissions for much of the nonroad category. For those categories not included in the NONROAD model, separate estimations were made.
All pollutants in the nonroad category are projected to decrease from 2002 to 2018. The majority of predicted emissions reductions in the nonroad category occur for SO2, with projected reductions of 98%. This large reduction is due to the requirement to use low sulfur diesel fuel by 2010. For the remaining pollutants, the reductions can be attributed to the use of newer equipment subject to more stringent emissions requirements, including the Clean Air Nonroad Diesel Rule, locomotive emission standards, the Large-Spark Ignition and Recreational Vehicle Rule, and Emissions Standards for New Nonroad Small Spark-Ignition Engines, Equipment, and Vessels. These rules are discussed in more detail in Chapter 10.
7.6 Nonpoint Fires
Fires within the nonpoint source category in Kansas make up a large portion of the State’s emissions inventory for certain pollutants. The majority of the fires are rangeland burning in the Flint Hills area, along with wheat stubble burning in counties just west of the Flint Hills. Both of these burning categories are very episodic in nature, with the rangeland burning occurring in the early spring and wheat stubble burning occurring after harvest in mid to late summer. Kansas is in the process of developing a Smoke Management Initiative, which will achieve reductions from both cropland and rangeland burning. The Smoke Management Initiative was developed after the completion of the emissions inventory and the associated reductions were not captured in the 2018 estimations. The emissions used in the modeling for burning remained unchanged from 2002 to 2018.
Kansas will continue to pursue methods and techniques to better characterize the emissions associated with agricultural burning, including the temporal and spatial allocation of these emissions. For more information on these efforts refer to Appendix 10.4, Kansas Prescribed Fire Emissions.

30
7.7 Reporting
States are required by 40 CFR 51.308(d)(4)(v) to include in their SIPs a commitment to update their statewide emissions inventories periodically. In reference to the emissions inventory work carried out for regional haze purposes, Kansas expects to update its emissions inventory as new data become available.
The State of Kansas tracks air emissions over time as required by current EPA regulations and the Air Emissions Reporting Rule (AERR). This federal rule, proposed in December 2005 and finalized in December 2008, consolidates the current emission inventory reporting requirements, and will require that emissions be reported every three years from the following source categories in all parts of the State, excluding sources located on tribal lands:
• Point
• Nonpoint
• On-road mobile
• Nonroad mobile
In addition, all visibility-impairing pollutants are required to be included for the reportable categories listed above. These pollutants will include NOx, SO2, PM10, PM2.5, VOCs, and NH3.
The rule states that beginning in 2009, emissions reports will be due 12 months after the end of the year instead of the current 17 months. The rule can be found at: http://www.epa.gov/ttn/chief/aerr/
Kansas intends to follow the reporting requirements of the AERR where funding and staffing allow. Kansas commits to updating its point source emissions inventory annually and to analyze sectors identified in the regional haze planning process that need improvement.
In the past, Kansas provided complete point source inventories, and partial supplemental inventories for the nonpoint (area), on-road mobile, and nonroad mobile source categories. Kansas chose to supplement EPA-generated nonpoint, on-road, and nonroad inventories with more accurate information when available. Thus, except for point source categories, future inventories will likely continue to be a hybrid EPA/Kansas-generated product.
It is anticipated that the initial five-year progress report will occur in 2014. The 2011 National Emissions Inventory will likely be the most current available inventory at that time and will be used as part of the progress report. It is expected that Kansas will also have access to a later point source inventory and continuous emissions monitoring systems (CEMS) data for EGUs. Where this more up-to-date information is available, it will used to supplement the 2011 National Emissions Inventory.
Kansas will use the latest available inventory for the five-year progress report, and compare that with the projected 2018 inventories. Because the 2018 projected inventory contains BART controls that may not yet be reflected in the 2011 inventory, these sources will be addressed individually in this review. For the remaining sectors, EGAS growth rates will be used, where applicable, and projected growth will be compared with actual emissions. If this comparison
31
indicates overall emissions are growing at a rate significantly (i.e., more than 10%) higher, on an individual species basis than previously projected, Kansas will reassess the visibility impacts on potentially affected Class I areas and consult with the appropriate federal land manager (FLM) and EPA to identify additional measures. This could potentially include a SIP revision to address the visibility goal for the affected Class I area(s). List of Chapter 7 Appendices
7.1 2002 Emissions Inventory 7.2 2018 Emissions Inventory 7.3 Emissions Inventory Technical Documentation 7.4 Natural Gas Production Trends
32
8. Modeling Assessment
Modeling guidelines for conducting regional-scale modeling for particulate matter and visibility are provided in 40 CFR Part 51 Appendix W. In Appendix W, EPA recommends the use of three models to simulate pollutants impairing visibility: the Community Multiscale Air Quality (CMAQ) model, the Comprehensive Air quality Model with extensions (CAMx), and the Regional Modeling System for Aerosols and Deposition (REMSAD). CENRAP contractors performed regional modeling using CMAQ and CAMx.
The CMAQ model is an Eulerian model that simulates the atmospheric and surface processes affecting the transport, transformation, and deposition of air pollutants and their precursors. An Eulerian model approximates the numerical solutions of partial differential equations of plumes on a fixed grid, while other models may lose accuracy or need re-gridding as the plumes expand.
CAMx is a computer modeling system for the integrated assessment of photochemical and particulate air pollution. CAMx incorporates all of the technical attributes demanded of state-of-the-art photochemical grid models, including two-way grid nesting, a subgrid-scale Plume-in-Grid module to treat the early dispersion and chemistry of point source NOx plumes, and a fast chemistry solver.
CAMx Mechanism 4 (M4) provides “one atmosphere” modeling for fine and coarse PM and ozone. Aqueous phase chemistry is modeled using the Regional Acid Deposition Model (RADM) mechanism. Inorganic sulfate/nitrate/ammonium chemistry is modeled with ISORROPIA thermodynamic equilibrium aerosol model. Secondary organic aerosols are modeled using a semi-volatile module in CAMx called SOAP. Wet and dry deposition processes are included for gases and particles. Gridded deposition information is outputted along with the concentrations. In the July 1, 1999 publication of the Regional Haze Rule in the Federal Register, EPA discussed the uses of regional modeling as follows:
• Analyses and determination of the extent of emissions reductions needed from individual states
• Analyses and determination of emissions needed to meet the reasonable progress goal for the Class I area
• Analyses to support conclusion that the long-term strategy provides for reasonable progress
• Analyses to calculate the resulting degree of visibility improvement that would be achieved at each Class I area
• Analyses to compare visibility improvement between proposed control strategies
33
8.1 Model Inputs
For regional haze, the full 2002 modeling year was chosen as the episode period to evaluate. This year corresponds to the baseline emissions inventory available and is also included within the five-year monitoring baseline period used in establishing the glide slopes.
As one of the five national regional planning organizations (RPOs), CENRAP chose to use the unified grid domain developed by all of the other RPOs. This domain covers all RPO areas and was chosen to enable sharing of data and results between RPOs in a consistent manner. The grid consists of 36km grid cells and is 148 x 112 in size.
Generating the source inventory for modeling is intertwined with the creation of the pollutant inventory. Each emission source and the pollutants it emits must be specifically identified. For photochemical and aerosol modeling, each source must be classified as a point, nonpoint, mobile (on-road or nonroad), or biogenic source, then spatialized, temporalized, and speciated. In addition, three or more inventories need to be generated, including a base inventory for model performance evaluation, a typical inventory for the base year, and a future year inventory. Control strategy inventories are also developed to evaluate potential controls. In all, CENRAP developed multiple modeling inventories. The Base G inventory is the latest future year inventory and is considered the most reflective of future year emissions. The Base A through Base D inventories include known errors and should not be used in the analysis of future year visibility. Chapter 2 of the Technical Support Document (Appendix 8.1) provides the methodologies for the development of the emissions inventories; Kansas-specific emission inventory information can be found in Chapter 7 of this SIP.
For meteorological inputs, the Fifth-Generation NCAR / Penn State Mesoscale Model (MM5) was selected. MM5 is the latest in a series that developed from a mesoscale model used by Anthes at Penn State in the early 1970s, and was later documented by Anthes and Warner(5). Since that time, MM5 has undergone many changes designed to broaden its usage. These changes include: (1) multiple-nest capability; (2) non-hydrostatic dynamics, which allows the model to be used at a few-kilometer scale; (3) multitasking capability on shared and distributed memory machines; (4) four-dimensional data assimilation capability; and (5) more physics options. The MM5 model is supported by several auxiliary programs, which are referred to collectively as the MM5 modeling system. Since MM5 is a regional model, it requires an initial condition as well as a lateral boundary condition to run. To produce a lateral boundary condition for a model run, gridded data is needed to cover the entire time period that the model is integrated. 8.2 Model Performance Evaluation Model evaluations compared concentrations of various pollutants simulated by CMAQ and CAMx with observations from:
• Interagency Monitoring of Protected Visual Environments (IMPROVE)
34
• Clean Air Status and Trends Network (CASTNet)
• Speciated Trends Network (STN)
• Aerometric Information Retrieval Systems (AIRS)
• South Eastern Aerosol Research and Characterization (SEARCH)
Model performance evaluation summaries follow. Detailed model performance evaluations are found in Appendix 8.2
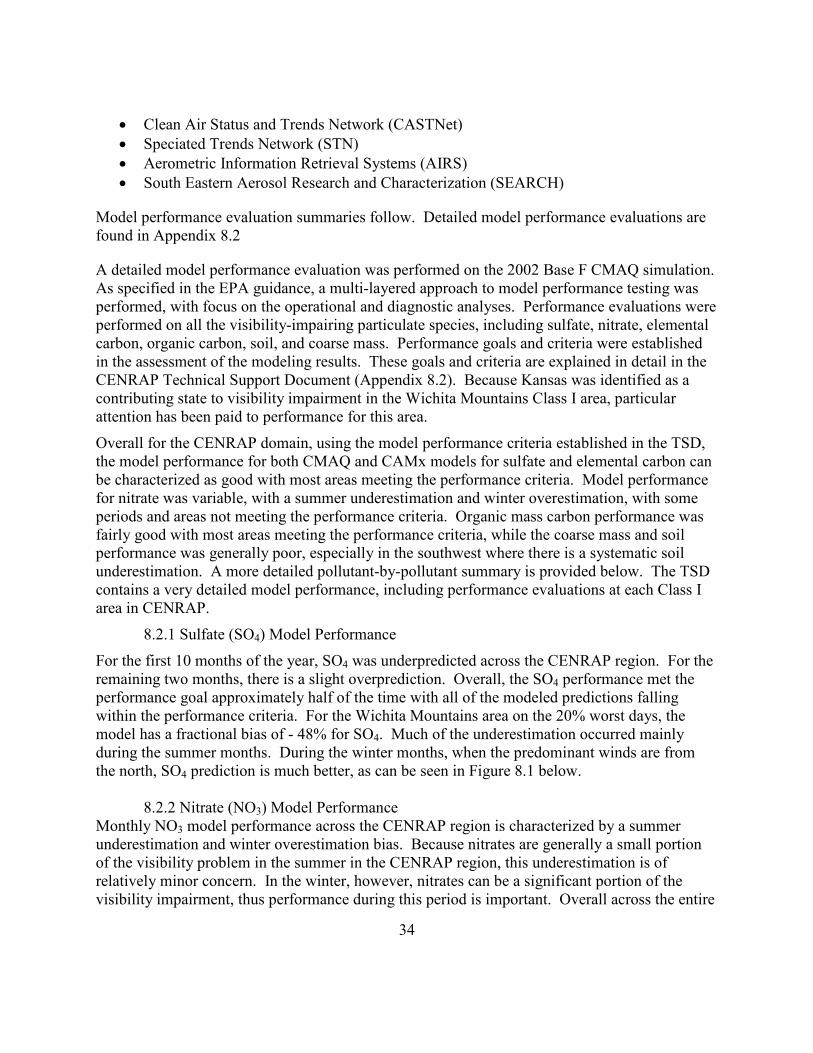
A detailed model performance evaluation was performed on the 2002 Base F CMAQ simulation. As specified in the EPA guidance, a multi-layered approach to model performance testing was performed, with focus on the operational and diagnostic analyses. Performance evaluations were performed on all the visibility-impairing particulate species, including sulfate, nitrate, elemental carbon, organic carbon, soil, and coarse mass. Performance goals and criteria were established in the assessment of the modeling results. These goals and criteria are explained in detail in the CENRAP Technical Support Document (Appendix 8.2). Because Kansas was identified as a contributing state to visibility impairment in the Wichita Mountains Class I area, particular attention has been paid to performance for this area.
Overall for the CENRAP domain, using the model performance criteria established in the TSD, the model performance for both CMAQ and CAMx models for sulfate and elemental carbon can be characterized as good with most areas meeting the performance criteria. Model performance for nitrate was variable, with a summer underestimation and winter overestimation, with some periods and areas not meeting the performance criteria. Organic mass carbon performance was fairly good with most areas meeting the performance criteria, while the coarse mass and soil performance was generally poor, especially in the southwest where there is a systematic soil underestimation. A more detailed pollutant-by-pollutant summary is provided below. The TSD contains a very detailed model performance, including performance evaluations at each Class I area in CENRAP.
8.2.1 Sulfate (SO4) Model Performance
For the first 10 months of the year, SO4 was underpredicted across the CENRAP region. For the remaining two months, there is a slight overprediction. Overall, the SO4 performance met the performance goal approximately half of the time with all of the modeled predictions falling within the performance criteria. For the Wichita Mountains area on the 20% worst days, the model has a fractional bias of - 48% for SO4. Much of the underestimation occurred mainly during the summer months. During the winter months, when the predominant winds are from the north, SO4 prediction is much better, as can be seen in Figure 8.1 below. 8.2.2 Nitrate (NO3) Model Performance Monthly NO3 model performance across the CENRAP region is characterized by a summer underestimation and winter overestimation bias. Because nitrates are generally a small portion of the visibility problem in the summer in the CENRAP region, this underestimation is of relatively minor concern. In the winter, however, nitrates can be a significant portion of the visibility impairment, thus performance during this period is important. Overall across the entire
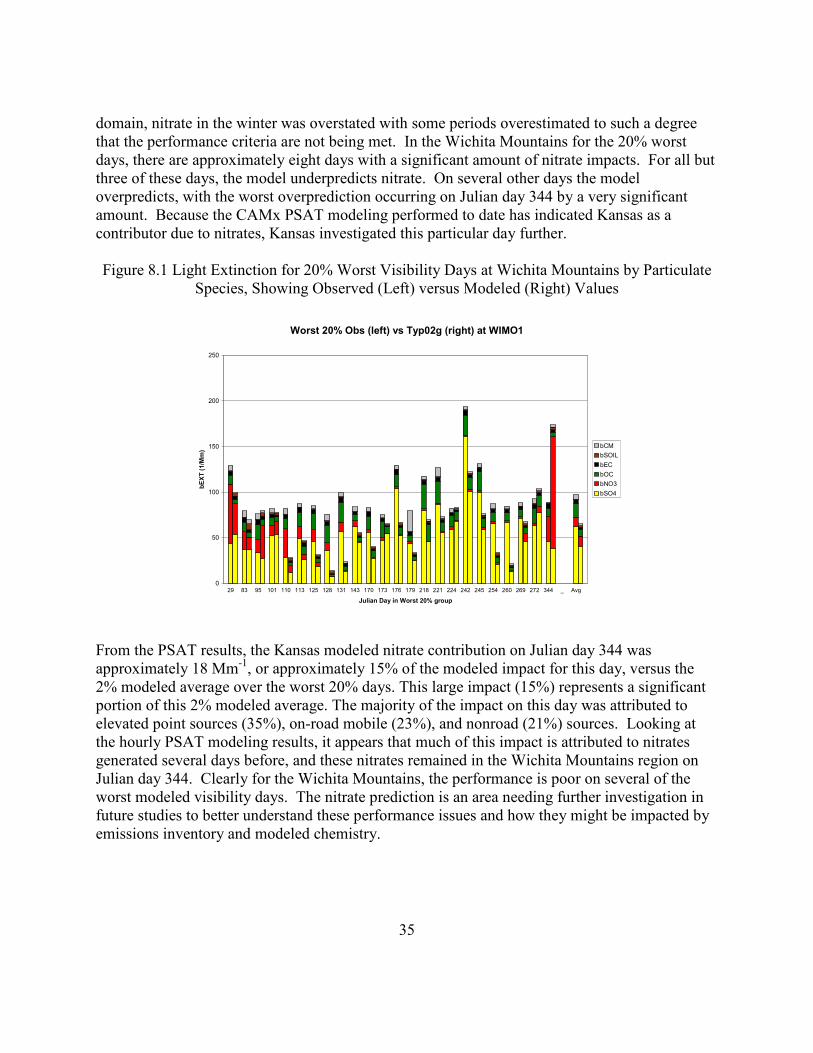
35
domain, nitrate in the winter was overstated with some periods overestimated to such a degree that the performance criteria are not being met. In the Wichita Mountains for the 20% worst days, there are approximately eight days with a significant amount of nitrate impacts. For all but three of these days, the model underpredicts nitrate. On several other days the model overpredicts, with the worst overprediction occurring on Julian day 344 by a very significant amount. Because the CAMx PSAT modeling performed to date has indicated Kansas as a contributor due to nitrates, Kansas investigated this particular day further.
Figure 8.1 Light Extinction for 20% Worst Visibility Days at Wichita Mountains by Particulate
Species, Showing Observed (Left) versus Modeled (Right) Values
Worst 20% Obs (left) vs Typ02g (right) at WIMO1
0
50
100
150
200
250
29 83 95 101 110 113 125 128 131 143 170 173 176 179 218 221 224 242 245 254 260 269 272 344 _ Avg
Julian Day in Worst 20% group
bEXT (1/Mm)
bCM
bSOIL
bEC
bOC
bNO3
bSO4
From the PSAT results, the Kansas modeled nitrate contribution on Julian day 344 was approximately 18 Mm-1, or approximately 15% of the modeled impact for this day, versus the 2% modeled average over the worst 20% days. This large impact (15%) represents a significant portion of this 2% modeled average. The majority of the impact on this day was attributed to elevated point sources (35%), on-road mobile (23%), and nonroad (21%) sources. Looking at the hourly PSAT modeling results, it appears that much of this impact is attributed to nitrates generated several days before, and these nitrates remained in the Wichita Mountains region on Julian day 344. Clearly for the Wichita Mountains, the performance is poor on several of the worst modeled visibility days. The nitrate prediction is an area needing further investigation in future studies to better understand these performance issues and how they might be impacted by emissions inventory and modeled chemistry.
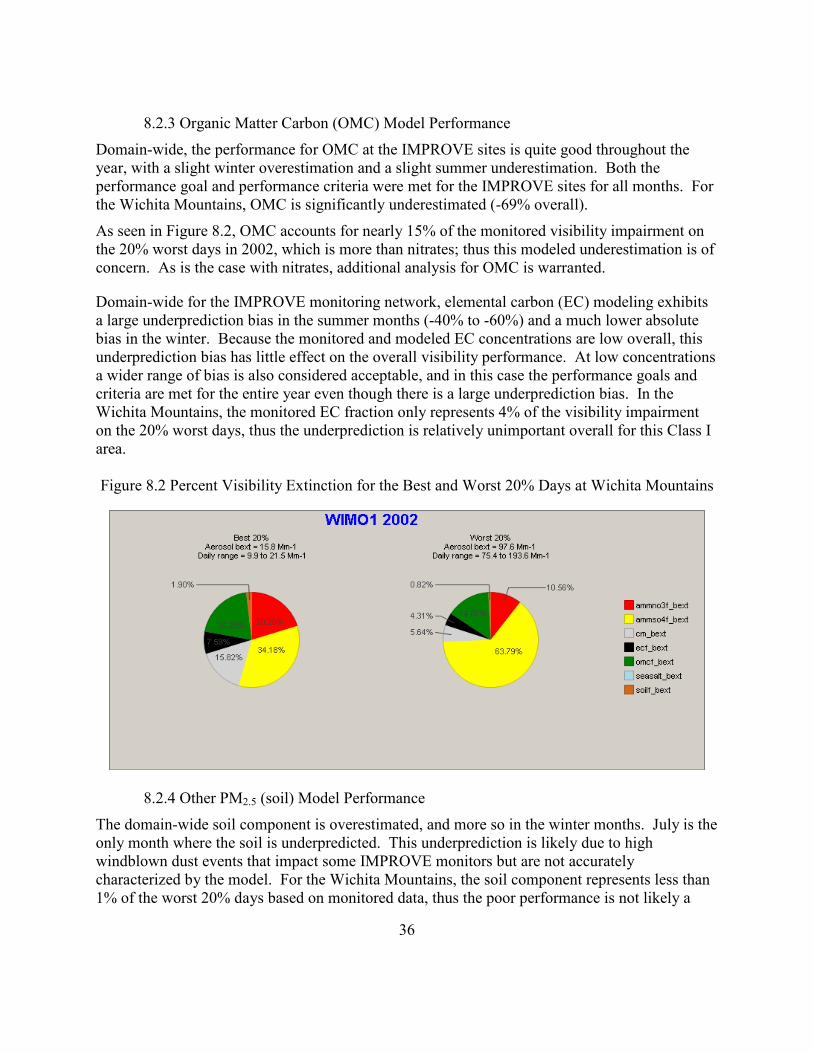
36
8.2.3 Organic Matter Carbon (OMC) Model Performance
Domain-wide, the performance for OMC at the IMPROVE sites is quite good throughout the year, with a slight winter overestimation and a slight summer underestimation. Both the performance goal and performance criteria were met for the IMPROVE sites for all months. For the Wichita Mountains, OMC is significantly underestimated (-69% overall).
As seen in Figure 8.2, OMC accounts for nearly 15% of the monitored visibility impairment on the 20% worst days in 2002, which is more than nitrates; thus this modeled underestimation is of concern. As is the case with nitrates, additional analysis for OMC is warranted.
Domain-wide for the IMPROVE monitoring network, elemental carbon (EC) modeling exhibits a large underprediction bias in the summer months (-40% to -60%) and a much lower absolute bias in the winter. Because the monitored and modeled EC concentrations are low overall, this underprediction bias has little effect on the overall visibility performance. At low concentrations a wider range of bias is also considered acceptable, and in this case the performance goals and criteria are met for the entire year even though there is a large underprediction bias. In the Wichita Mountains, the monitored EC fraction only represents 4% of the visibility impairment on the 20% worst days, thus the underprediction is relatively unimportant overall for this Class I area.
Figure 8.2 Percent Visibility Extinction for the Best and Worst 20% Days at Wichita Mountains
8.2.4 Other PM2.5 (soil) Model Performance
The domain-wide soil component is overestimated, and more so in the winter months. July is the only month where the soil is underpredicted. This underprediction is likely due to high windblown dust events that impact some IMPROVE monitors but are not accurately characterized by the model. For the Wichita Mountains, the soil component represents less than 1% of the worst 20% days based on monitored data, thus the poor performance is not likely a

37
factor for this Class I area. As seen in the overall performance, the modeled results do indicate an overprediction in the Wichita Mountains. However, this overestimation is still just a small fraction of the overall modeled visibility impact at this Class I area. 8.3 Base G Model Simulations The 2018 Base G modeling simulations represent the final version of the modeling simulations prepared by CENRAP. The latest 2018 version reflects the projected emissions growth as well as the known “on the books” controls that will occur before 2018. For Kansas emission sources, this also includes estimated reductions for all five of the electric generating units (EGUs) subject to BART. All EGU emissions were projected based on IPM runs, and included the impacts of the CAIR trading program and other federal programs. Remaining point and nonpoint (area) sources were projected using the EGAS model. The mobile on-road and nonroad projections were performed with the MOBILE 6 and NONROAD models, respectively.
The results of this 2018 Base G modeling run, along with the 2002 typical modeling run, were used to estimate the projected visibility improvements at each Class I area within the CENRAP region. For regional haze, two metrics are important: (1) the improvement of the average visibility for the 20% worst days, and (2) no degradation occurring on the 20% best visibility days. These 20% best and worst days are chosen based on the IMPROVE monitored days and are kept the same in the 2018 Base G run. The projected modeling results can then be compared to the 2018 uniform rate of progress (URP) glide path developed for each Class I area. This same analysis can also be performed for the 20% best visibility days.
Figures 8.3 and 8.4 are examples of this analysis for the Wichita Mountains Class I area; with the upper trend line (blue) representing the projected modeling results. In this case, the model prediction is indicating the 2018 URP will not be met for the Wichita Mountains area. Overall, for the CENRAP region, the 2018 projections indicate that the central portion of the CENRAP area will meet the URP glide paths, while the northern and southern Class I areas in CENRAP will not meet their respective glide paths. The State of Missouri’s Class I areas are projected to meet the URP glide path based upon the modeling projections that included all of Kansas’ BART reductions. For Kansas, the main concern is the Wichita Mountains Class I area, as emissions from Kansas have not been predicted to significantly impact Class I areas in other surrounding states. Additional discussion on Kansas impacts and the 2018 modeling projections are included in Chapter 10.
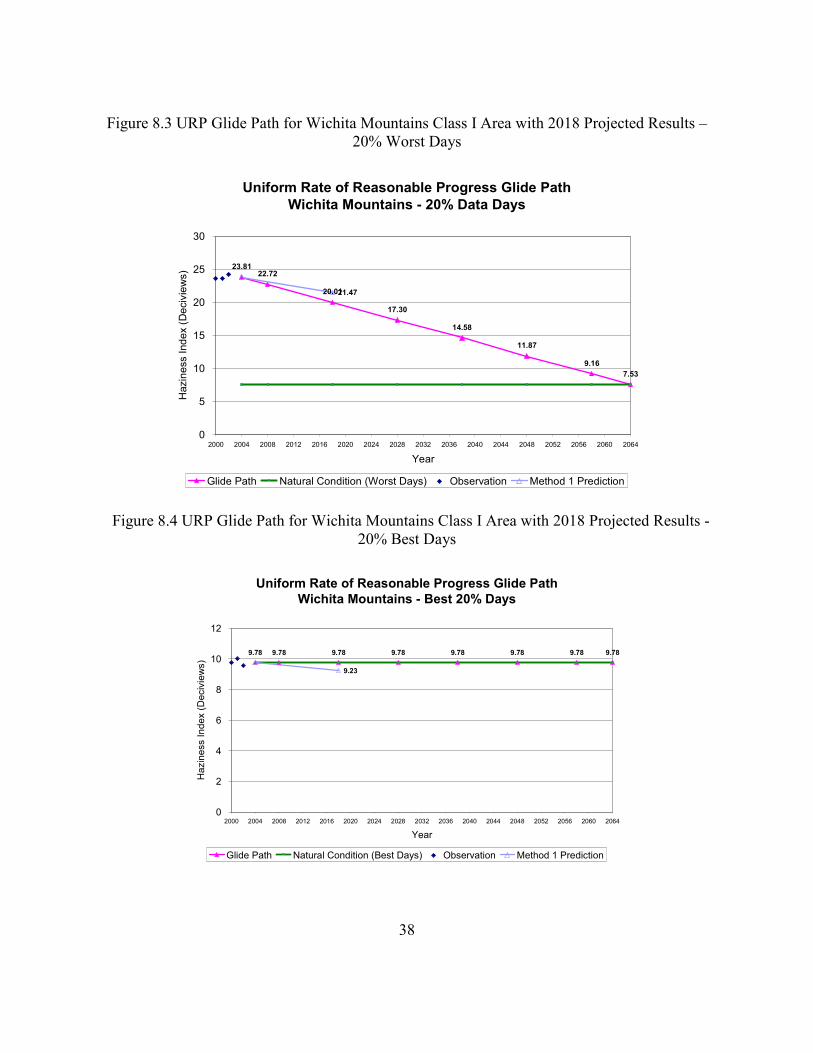
38
Figure 8.3 URP Glide Path for Wichita Mountains Class I Area with 2018 Projected Results – 20% Worst Days
Uniform Rate of Reasonable Progress Glide Path
Wichita Mountains - 20% Data Days
23.8122.72
20.01
17.30
14.58
11.87
9.16
7.53
21.47
0
5
10
15
20
25
30
2000 2004 2008 2012 2016 2020 2024 2028 2032 2036 2040 2044 2048 2052 2056 2060 2064
Year
Haziness Index (Deciviews)
Glide Path Natural Condition (Worst Days) Observation Method 1 Prediction
Figure 8.4 URP Glide Path for Wichita Mountains Class I Area with 2018 Projected Results -
20% Best Days
Uniform Rate of Reasonable Progress Glide Path
Wichita Mountains - Best 20% Days
9.78 9.78 9.78 9.78 9.78 9.78 9.78 9.78
9.23
0
2
4
6
8
10
12
2000 2004 2008 2012 2016 2020 2024 2028 2032 2036 2040 2044 2048 2052 2056 2060 2064
Year
Haziness Index (Deciviews)
Glide Path Natural Condition (Best Days) Observation Method 1 Prediction
39
8.4 Information from Modeling Performed by Other RPOs Chapter 5 of the TSD (Appendix 8.3) includes a discussion of the modeling being performed at the three RPOs surrounding CENRAP, the Visibility Improvement State and Tribal Association of the Southeast (VISTAS), Midwest Regional Planning Organization (MRPO), and Western Regional Air Partnership (WRAP). These RPOs have all performed either CMAQ or CAMx modeling for both 2002 and 2018. 8.4.1 MRPO In general, the MRPO modeling was less optimistic in 2018 for the Class I areas in states surrounding Kansas. This difference is likely a result of different emissions inventories. The 2018 CENRAP Base F and G emissions inventories included BART reductions in the CENRAP region, while the MRPO inventory did not. The MRPO inventory was also not the latest available for the CENRAP region at the time of this run. 8.4.2 VISTAS The VISTAS modeling indicates very close agreement with the CENRAP modeling, with the VISTAS modeling being more optimistic in the Class I areas surrounding Kansas.
8.4.3 WRAP The WRAP modeling did not cover the Class I areas of most interest to Kansas. For the Class I areas that were covered, the CENRAP modeling and WRAP modeling were in fairly close agreement. Unfortunately, the Class I area of most interest to Kansas, the Wichita Mountains, was not included in any of the other surrounding RPO modeling. A comparison of all the modeling results to date is shown in Figure 8.5 above. The full discussion of regional visibility projection comparisons can be found in Chapter 5 of the TSD (Appendix 8.3).

40
Figure 8.5 Comparison of 2018 Modeling Results from CENRAP, VISTAS, WRAP, and MRPO
CMAQ Method 1 predictions with new IMPROVE algorithm at CENRAP+ sites Across RPOs
0%
20%
40%
60%
80%
100%
120%
140%
BIBE1
GUMO1
WIM
O1
CACR1
UPBU1
HEGL1
MING1
BRET1
VOYA2
BOWA1
MACA1
SIPS1
ISLE1
SACR1
WHIT1
WHPE1
GRSA1
ROMO1
WICA1
BADL1
THRO1
LOST1
Percent of target reduction achieved
CENRAP 36k Base18g/Typ02g
VISTAS 12k 2018g2b/2002gt2a
WRAP 36k Base18b/Plan02b corrected
MwRPO 2018 R4S1a
CENRAP non-CENRAP
8.5 Control Strategy Simulations
CENRAP performed one control strategy simulation using the 2018 Base G inventory. This control run identified several Kansas point sources based on a Q/d (i.e., tons NOx plus tons SO2 divided by distance) greater than or equal to 5 analysis with cost per ton reduced less than $5,000. The Kansas sources included in the control run are listed in Tables 8.1 and 8.2.
The control run shows improvements in all the Class I areas surrounding Kansas. Because most of the controls identified occur in the central portion of the CENRAP region, most of the improvements are also seen in this area. Controls were identified in both Kansas and the surrounding states, and no source apportionment was performed in this control run. Therefore, the direct Kansas contribution to visibility improvements in the surrounding Class I areas from Kansas emissions reductions could not be determined. There were 181,107 tons/yr of total NOx reductions identified in the overall control run, with the Kansas portion being 17,927 tons. For SO2, 725,025 tons/yr of overall reductions were identified, with the Kansas portion being 21,617 tons/yr.

41
Table 8.1 Kansas NOx Sources Included in the CENRAP Control Strategy Run Using the 2018 Base G Inventory
Table 8.2 Kansas SO2 Sources Included in the CENRAP Control Strategy Run Using the 2018
Base G Inventory
Plant ID Plant Name Control
Measure
Tons
SO2
Tons
Reduced
Cost per
Ton
Reduced
1770030 Westar Energy - Tecumseh FGD Wet Scrubber
2,631 2,368 $4,519
1770030 Westar Energy - Tecumseh FGD Wet Scrubber
4,199 3,779 $3,715
2090008 Kansas City BPU - Nearman FGD Wet Scrubber
8,999 8,099 $2,239
2090048 Kansas City BPU - Quindaro FGD Wet Scrubber
4,216 3,795 $3,522
2090049 Kansas City BPU - Kaw FGD Wet Scrubber
1,674 1,506 $4,658
2090049 Kansas City BPU - Kaw FGD Wet Scrubber
2,300 2,070 $4,095
Plant
ID Plant Name
Control
Measure
Tons
NOx
Tons
Reduced
Cost per
Ton
Reduced
2057022 Lafarge Midwest - Fredonia Mid-kiln Firing
1,416 425 $83
0010009 Monarch Cement Biosolid Injection Technology
1,559 359 $466
0450014 Westar Energy - Lawrence LNC3 1,688 984 $407
2090048 Kansas City BPU - Quindaro SCR 2,181 1,963 $738
1490001 Westar Energy - Jeffrey LNC3 5,585 1,767 $1,043
1490001 Westar Energy - Jeffrey LNC3 5,585 1,191 $1,560
0450014 Westar Energy - Lawrence LNC3 3,403 565 $1,628
1490001 Westar Energy - Jeffrey LNC3 5,585 1,106 $1,755
0210002 Empire District Electric - Riverton
SCR 992 840 $1,581
1070005 KCP&L - La Cygne SCR 6,647 5,318 $2,308
2090008 Kansas City BPU - Nearman LNBO 3,501 371 $3,144
0550023 Sunflower Electric - Holcomb LNBO 3,683 390 $3,839
1250015 Heartland Cement SNCR - Urea Based
1,336 668 $1,657
0910057 AGC Flat Glass North America Oxy-Firing 2,330 1,981 $4,088

42
For the Wichita Mountains, even with the controls identified in this control scenario, the modeling still does not predict the area will meet its URP target. This is also the case in other CENRAP Class I areas, such as in Texas and Minnesota, where Kansas is less likely to contribute to visibility impairment. For specific comparisons at other Class I areas, refer to Figure 8.6 below.
Figure 8.6 Comparison of Modeling Results from Base G and Control Strategy Runs
CMAQ BaseGc1 vs BaseG Method 1 predictions for CENRAP+ sites
0%
20%
40%
60%
80%
100%
120%
140%
160%
180%
200%
BIBE1
GUMO1
WIM
O1
CACR1
UPBU1
HEGL1
MING1
BRET1
VOYA2
BOWA1
MACA1
SIPS1
ISLE1
SACR1
WHIT1
WHPE1
GRSA1
ROMO1
WICA1
BADL1
THRO1
LOST1
Percent of target reduction achieved
BaseGc1 BaseG
CENRAP non-CENRAP
Kansas evaluated the cost effective and technically feasible controls identified in the CENRAP control scenario above. A summary of that evaluation follows. For the NOx controls identified in this control run for Kansas, the State has evaluated all of the sources and controls identified. Several of the sources included in the control run will be controlled for NOx. They include:
• Westar Energy - Jeffrey Unit 3 – Low NOx burners/overfire air
• Westar Energy - Lawrence Units 3, 4, and 5 – Low NOx burners The two units at BPU Kaw facility are currently in cold stand-by and Kansas does not anticipate these units will be placed back into operation without additional SO2 control requirements. Westar Energy - Tecumseh, was evaluated for SO2 controls but it was determined they were not cost effective considering the predicted visibility improvements associated with those controls. Three sources identified in the control run above will be subject to controls as part of ozone contingency measures being implemented in the Kansas City metropolitan area:

43
• Kansas City BPU – Nearman and Quindaro – Kansas City NOx Emission Reduction Rule
• AGC Flat Glass North America – Kansas City NOx Emission Reduction Rule
Two Westar Energy - Jeffrey EGUs identified in this control run are subject to BART and will not be subject to additional NOx controls for reasonable progress. The remaining sources identified in this control were evaluated as part of reasonable progress and it was determined that further controls at this time would not be pursued. These evaluations can be found in Chapter 10.
List of Chapter 8 Appendices 8.1 Emissions Modeling (TSD Chapter 2) 8.2 Model Performance Evaluation (TSD Chapter 3) 8.3 Additional Supporting Analysis (TSD Chapter 5)

44
9. Best Available Retrofit Technology
EPA’s 1999 Regional Haze Rule requires additional controls for certain older emission sources. The State of Kansas is required to have those older sources that contribute to visibility impairment in Class I areas to install Best Available Retrofit Technology (BART) or implement an emissions trading or other alternative program that will achieve greater reasonable progress than would be achieved through the installation and operation of BART. On July 6, 2005, EPA published a revised final rule, including Appendix Y to 40 CFR part 51 “Guidelines for BART Determinations under the Regional Haze Rule,” hereinafter BART Guidelines, which provides direction to states on determining which of these older sources may need to install BART and how to determine BART.
The State of Kansas is requiring sources subject to BART to install, operate, and maintain BART rather than implement an emission trading program or other alternative measure in place of BART.
9.1 BART Eligible Sources in the State of Kansas Kansas BART-eligible sources were identified using the methodology in the BART Guidelines. For an emission source to be identified as BART eligible, the State of Kansas used these criteria from the BART Guidelines:
• One or more emissions units at the facility fit within one of the 26 categories listed in the BART Guidelines
• The emission unit was in existence on August 7, 1977 and began operation at some point on or after August 7, 1962
• The limited potential emissions from all emission units identified in the previous two bullets were 250 tons or more per year of any of these visibility-impairing pollutants: SO2, NOx, or PM10.
To identify the sources that met the criteria above, Kansas performed a multi-step search and analysis including a database query of the permitted air sources in its point source emissions inventory database, and a survey of the facilities. Refer to detailed description of the identification process in Appendix 9.1. This analysis indicated there were 19 facilities in Kansas with BART-eligible units. The 19 facilities, along with their BART-eligible units, are listed in Table 9.1.

45
Table 9.1 Facilities with BART-Eligible Units in the State of Kansas
BART Source
Category Name Facility ID Facility Name BART-Eligible Emission Units
0090002 Aquila (now Sunflower Electric) - Arthur Mullergren
Unit 3 (Stacks 1 and 2)
1750001 Aquila (now Sunflower Electric) - Cimarron River
Unit 1
0570001 Aquila (now Sunflower Electric) - Judson Large
Unit 4
2090008 Kansas City BPU - Nearman
Unit 1
2090048 Kansas City BPU - Quindaro
Unit 1
Unit 2
1070005 KCP&L - La Cygne
Unit 1
Unit 2
1130014 McPherson Municipal Power Plan #2
Unit 1
0550026 Sunflower Electric - Garden City
Unit S2
1730012 Westar Energy - Gordon Evans
Unit 2 (Stacks 2 and 3)
1550033 Westar Energy - Hutchinson
Unit 4 (Stacks A and B)
1490001 Westar Energy - Jeffrey
Unit 1
Unit 2
0450014 Westar Energy - Lawrence
Unit 5
Fossil-Fuel Fired Electric Generating Units
0350012 Winfield Municipal Power Plant #2
Unit 4
Portland Cement Plants
0010009 Monarch Cement Co.
No. 4 Kiln Stack, No.4 Kiln Clinker Cooler, No.5 Kiln Stack, No. 5 Kiln Clinker Cooler, Raw Material Unloading, Clinker Grinding and Cement Handling, Stone Quarry Processing
0150004 Frontier El Dorado Refining Co.
Boiler B-105, Boiler B-107, Plant Process Heaters, Refinery Flare System B-1303, Plant Cooling Towers, Storage Tanks, Gas Oil Hydrotreater
Petroleum Refineries
1130003 National Cooperative Alky Heater HA-002, No.9 Boiler SB-009,
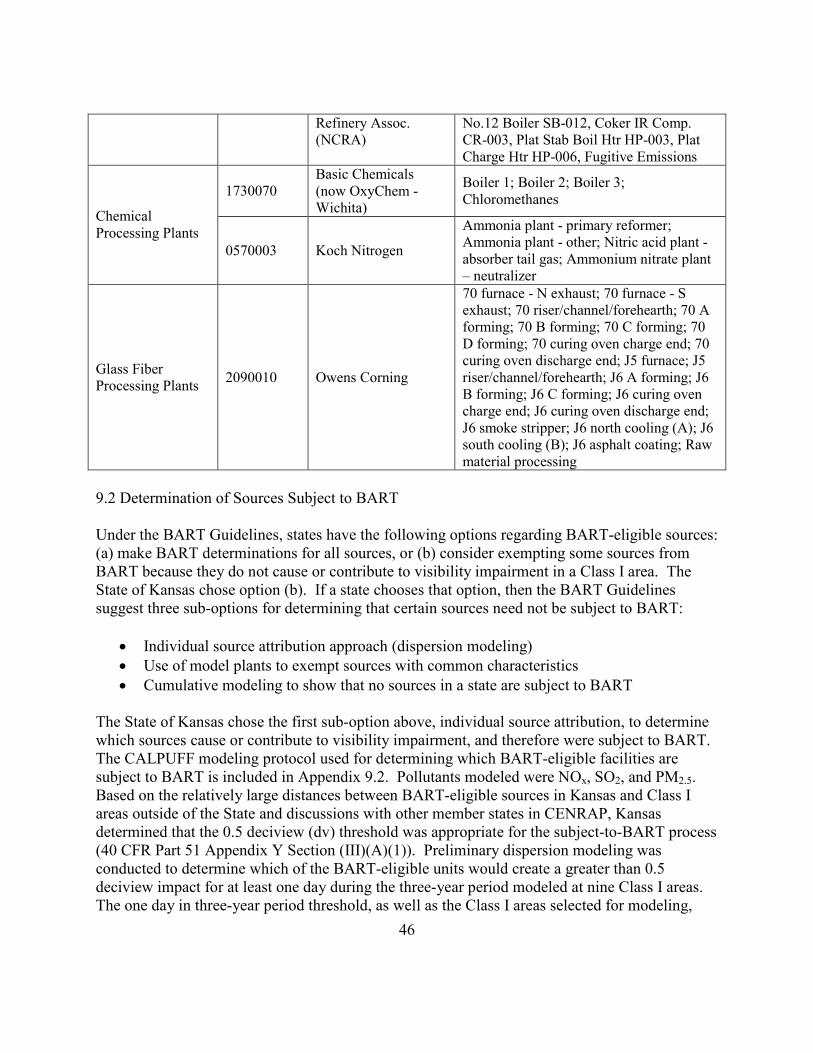
46
Refinery Assoc. (NCRA)
No.12 Boiler SB-012, Coker IR Comp. CR-003, Plat Stab Boil Htr HP-003, Plat Charge Htr HP-006, Fugitive Emissions
1730070 Basic Chemicals (now OxyChem - Wichita)
Boiler 1; Boiler 2; Boiler 3; Chloromethanes
Chemical Processing Plants
0570003 Koch Nitrogen
Ammonia plant - primary reformer; Ammonia plant - other; Nitric acid plant - absorber tail gas; Ammonium nitrate plant – neutralizer
Glass Fiber Processing Plants
2090010 Owens Corning
70 furnace - N exhaust; 70 furnace - S exhaust; 70 riser/channel/forehearth; 70 A forming; 70 B forming; 70 C forming; 70 D forming; 70 curing oven charge end; 70 curing oven discharge end; J5 furnace; J5 riser/channel/forehearth; J6 A forming; J6 B forming; J6 C forming; J6 curing oven charge end; J6 curing oven discharge end; J6 smoke stripper; J6 north cooling (A); J6 south cooling (B); J6 asphalt coating; Raw material processing
9.2 Determination of Sources Subject to BART Under the BART Guidelines, states have the following options regarding BART-eligible sources: (a) make BART determinations for all sources, or (b) consider exempting some sources from BART because they do not cause or contribute to visibility impairment in a Class I area. The State of Kansas chose option (b). If a state chooses that option, then the BART Guidelines suggest three sub-options for determining that certain sources need not be subject to BART:
• Individual source attribution approach (dispersion modeling)
• Use of model plants to exempt sources with common characteristics
• Cumulative modeling to show that no sources in a state are subject to BART The State of Kansas chose the first sub-option above, individual source attribution, to determine which sources cause or contribute to visibility impairment, and therefore were subject to BART. The CALPUFF modeling protocol used for determining which BART-eligible facilities are subject to BART is included in Appendix 9.2. Pollutants modeled were NOx, SO2, and PM2.5. Based on the relatively large distances between BART-eligible sources in Kansas and Class I areas outside of the State and discussions with other member states in CENRAP, Kansas determined that the 0.5 deciview (dv) threshold was appropriate for the subject-to-BART process (40 CFR Part 51 Appendix Y Section (III)(A)(1)). Preliminary dispersion modeling was conducted to determine which of the BART-eligible units would create a greater than 0.5 deciview impact for at least one day during the three-year period modeled at nine Class I areas. The one day in three-year period threshold, as well as the Class I areas selected for modeling,
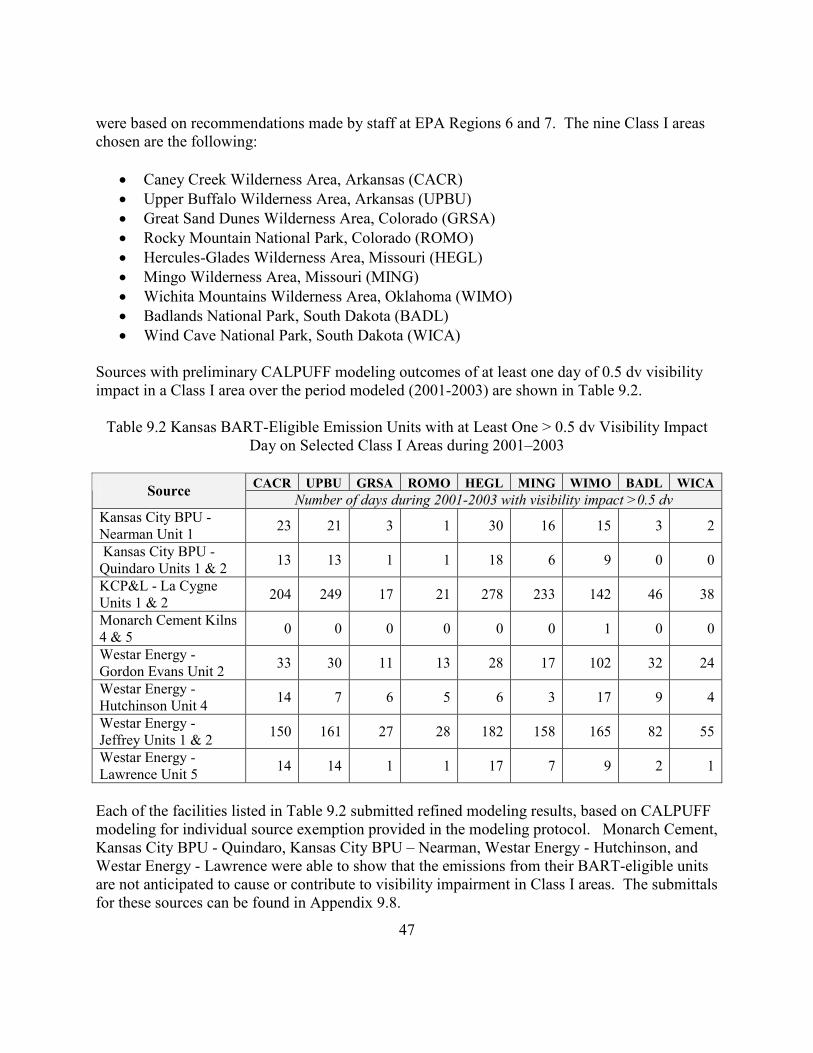
47
were based on recommendations made by staff at EPA Regions 6 and 7. The nine Class I areas chosen are the following:
• Caney Creek Wilderness Area, Arkansas (CACR)
• Upper Buffalo Wilderness Area, Arkansas (UPBU)
• Great Sand Dunes Wilderness Area, Colorado (GRSA)
• Rocky Mountain National Park, Colorado (ROMO)
• Hercules-Glades Wilderness Area, Missouri (HEGL)
• Mingo Wilderness Area, Missouri (MING)
• Wichita Mountains Wilderness Area, Oklahoma (WIMO)
• Badlands National Park, South Dakota (BADL)
• Wind Cave National Park, South Dakota (WICA) Sources with preliminary CALPUFF modeling outcomes of at least one day of 0.5 dv visibility impact in a Class I area over the period modeled (2001-2003) are shown in Table 9.2. Table 9.2 Kansas BART-Eligible Emission Units with at Least One > 0.5 dv Visibility Impact
Day on Selected Class I Areas during 2001–2003
CACR UPBU GRSA ROMO HEGL MING WIMO BADL WICA Source
Number of days during 2001-2003 with visibility impact >0.5 dv
Kansas City BPU - Nearman Unit 1
23 21 3 1 30 16 15 3 2
Kansas City BPU - Quindaro Units 1 & 2
13 13 1 1 18 6 9 0 0
KCP&L - La Cygne Units 1 & 2
204 249 17 21 278 233 142 46 38
Monarch Cement Kilns 4 & 5
0 0 0 0 0 0 1 0 0
Westar Energy - Gordon Evans Unit 2
33 30 11 13 28 17 102 32 24
Westar Energy - Hutchinson Unit 4
14 7 6 5 6 3 17 9 4
Westar Energy - Jeffrey Units 1 & 2
150 161 27 28 182 158 165 82 55
Westar Energy -Lawrence Unit 5
14 14 1 1 17 7 9 2 1
Each of the facilities listed in Table 9.2 submitted refined modeling results, based on CALPUFF modeling for individual source exemption provided in the modeling protocol. Monarch Cement, Kansas City BPU - Quindaro, Kansas City BPU – Nearman, Westar Energy - Hutchinson, and Westar Energy - Lawrence were able to show that the emissions from their BART-eligible units are not anticipated to cause or contribute to visibility impairment in Class I areas. The submittals for these sources can be found in Appendix 9.8.
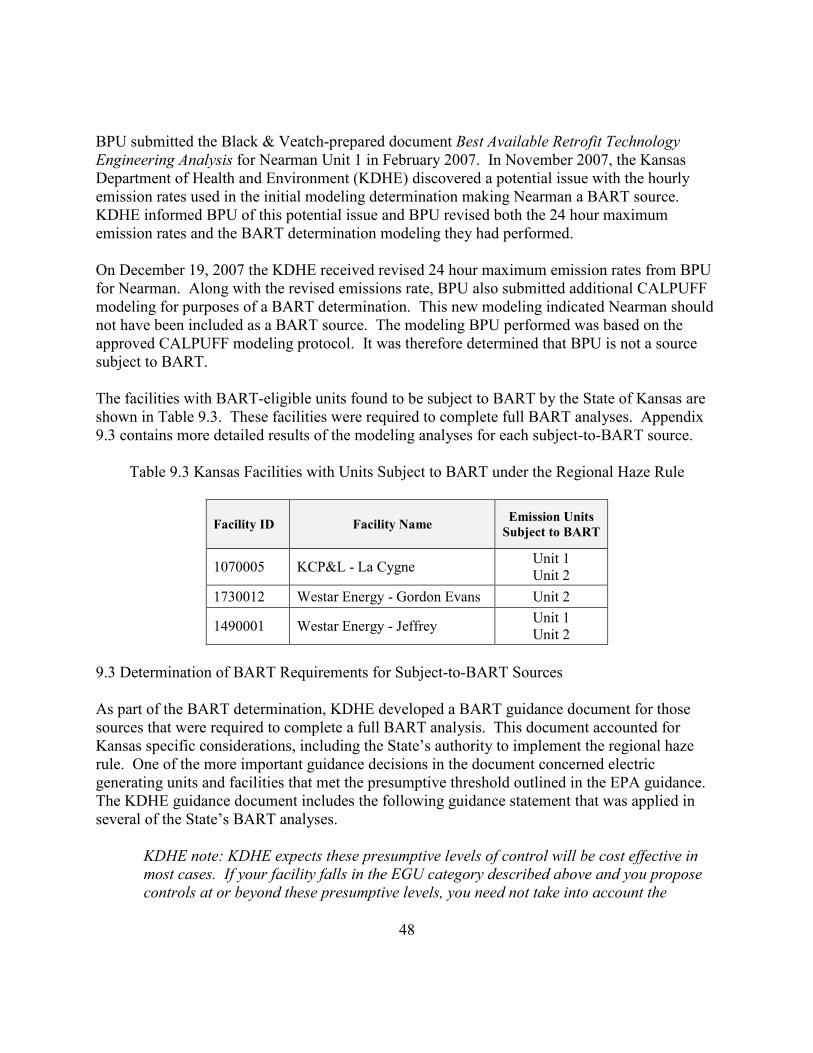
48
BPU submitted the Black & Veatch-prepared document Best Available Retrofit Technology Engineering Analysis for Nearman Unit 1 in February 2007. In November 2007, the Kansas Department of Health and Environment (KDHE) discovered a potential issue with the hourly emission rates used in the initial modeling determination making Nearman a BART source. KDHE informed BPU of this potential issue and BPU revised both the 24 hour maximum emission rates and the BART determination modeling they had performed. On December 19, 2007 the KDHE received revised 24 hour maximum emission rates from BPU for Nearman. Along with the revised emissions rate, BPU also submitted additional CALPUFF modeling for purposes of a BART determination. This new modeling indicated Nearman should not have been included as a BART source. The modeling BPU performed was based on the approved CALPUFF modeling protocol. It was therefore determined that BPU is not a source subject to BART. The facilities with BART-eligible units found to be subject to BART by the State of Kansas are shown in Table 9.3. These facilities were required to complete full BART analyses. Appendix 9.3 contains more detailed results of the modeling analyses for each subject-to-BART source.
Table 9.3 Kansas Facilities with Units Subject to BART under the Regional Haze Rule
Facility ID Facility Name Emission Units
Subject to BART
1070005 KCP&L - La Cygne Unit 1 Unit 2
1730012 Westar Energy - Gordon Evans Unit 2
1490001 Westar Energy - Jeffrey Unit 1 Unit 2
9.3 Determination of BART Requirements for Subject-to-BART Sources As part of the BART determination, KDHE developed a BART guidance document for those sources that were required to complete a full BART analysis. This document accounted for Kansas specific considerations, including the State’s authority to implement the regional haze rule. One of the more important guidance decisions in the document concerned electric generating units and facilities that met the presumptive threshold outlined in the EPA guidance. The KDHE guidance document includes the following guidance statement that was applied in several of the State’s BART analyses.
KDHE note: KDHE expects these presumptive levels of control will be cost effective in most cases. If your facility falls in the EGU category described above and you propose
controls at or beyond these presumptive levels, you need not take into account the

49
remaining statutory factors, as BART will be met. If you propose controls above these
presumptive levels, justification incorporating the statutory factors will be required.
KDHE elected to include this guidance based on an examination of how EPA set these presumptive limits coupled with the EGU’s in the state that this would apply to. One of the major driving factors that shaped this guidance was the consideration of the State’s authority to implement the regional haze rule which includes a “no more stringent than” clause, see Appendix 2.1. KDHE believes this guidance provided an efficient means for presumptive BART units to meet BART while meeting the State’s authority to implement the regional haze program. BART determinations for the five subject-to-BART units in Kansas were carried out by third-party contractors on behalf of the sources’ two owners and submitted to the State for approval. Because all five of the BART units are electric generating units (EGUs) and are located at 750 MW facilities, the State stipulated that the minimum BART control level would be the presumptive limits specified in the BART Guidelines. As discussed above, Kansas provided each owner with a guideline for conducting their determination, titled, Guidance for Facilities Conducting a BART Analysis, and found in Appendix 9.4. The resulting analyses are found in Appendix 9.5 (KCP&L) and Appendix 9.6 (Westar Energy) and are discussed below. The operational standards prescribed for the application of BART for sources will be in terms of maximum emission rates for the primary visibility-impairing pollutants NOx and SO2. In all cases here, added PM2.5 controls would help visibility only marginally, and would not be cost effective. These standards, along with presumptive limits from the BART Guidelines, are summarized in Table 9.4 and have been included in Agreements with each source.
Table 9.4 BART Presumptive Limits and Operational Standards for NOx and SO2 at Subject-to-
BART Emission Units in Kansas
Subject-to-BART Emission Unit BART Presumptive Limit BART Operational Standard
NOx SO2 NOx SO2 lb/MMBtu
KCP&L - La Cygne Unit 1 0.10 0.15
KCP&L - La Cygne Unit 2 0.23 0.16*
0.15 0.15* 0.13* 0.10*
Westar Energy - Jeffrey Unit 1 0.15 0.15 0.15 0.15
Westar Energy - Jeffrey Unit 2 0.15 0.15 0.15 0.15 * Weighted average
9.3.1 Kansas City Power & Light (KCP&L)
KCP&L submitted the document, BART Five Factor Analysis: Kansas City Power & Light La Cygne Generating Station, for La Cygne Units 1 and 2 in August 2007 (Appendix 9.5), prepared by Trinity Consultants. Both Units 1 and 2 meet the presumptive definition and the BART analysis submitted determined that presumptive limits were BART based on the BART guidance document provided by KDHE. KDHE concurred that presumptive limits were BART for this
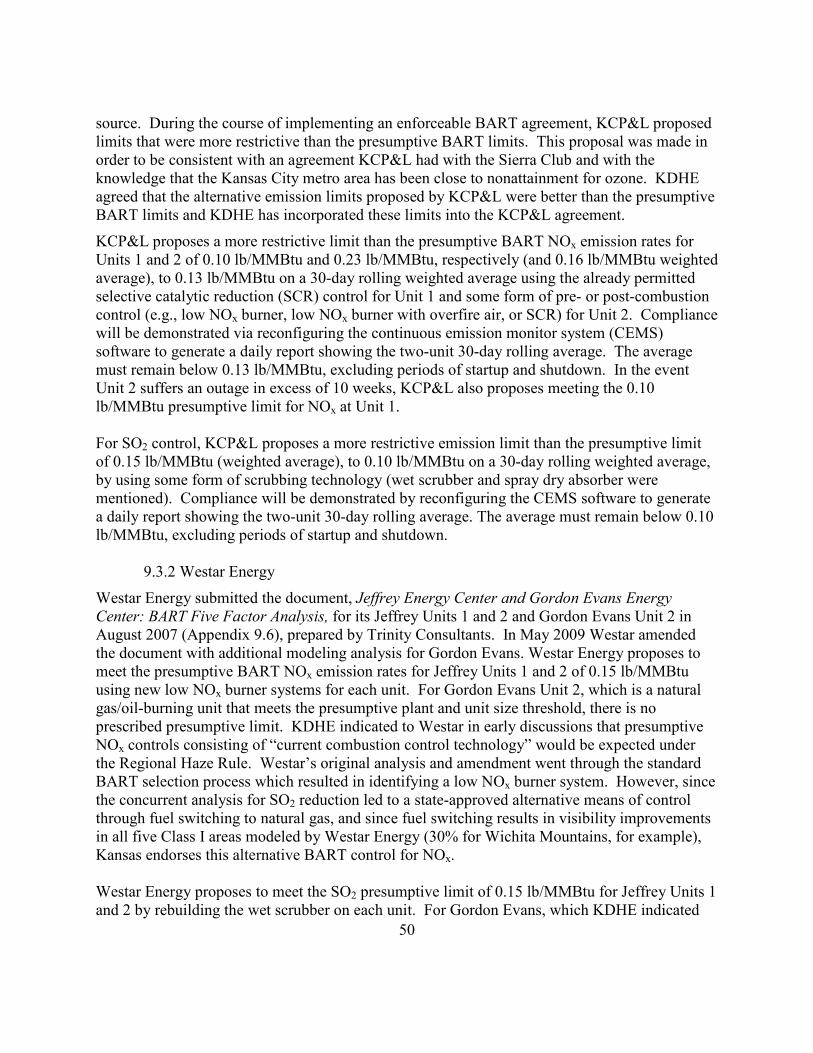
50
source. During the course of implementing an enforceable BART agreement, KCP&L proposed limits that were more restrictive than the presumptive BART limits. This proposal was made in order to be consistent with an agreement KCP&L had with the Sierra Club and with the knowledge that the Kansas City metro area has been close to nonattainment for ozone. KDHE agreed that the alternative emission limits proposed by KCP&L were better than the presumptive BART limits and KDHE has incorporated these limits into the KCP&L agreement.
KCP&L proposes a more restrictive limit than the presumptive BART NOx emission rates for Units 1 and 2 of 0.10 lb/MMBtu and 0.23 lb/MMBtu, respectively (and 0.16 lb/MMBtu weighted average), to 0.13 lb/MMBtu on a 30-day rolling weighted average using the already permitted selective catalytic reduction (SCR) control for Unit 1 and some form of pre- or post-combustion control (e.g., low NOx burner, low NOx burner with overfire air, or SCR) for Unit 2. Compliance will be demonstrated via reconfiguring the continuous emission monitor system (CEMS) software to generate a daily report showing the two-unit 30-day rolling average. The average must remain below 0.13 lb/MMBtu, excluding periods of startup and shutdown. In the event Unit 2 suffers an outage in excess of 10 weeks, KCP&L also proposes meeting the 0.10 lb/MMBtu presumptive limit for NOx at Unit 1. For SO2 control, KCP&L proposes a more restrictive emission limit than the presumptive limit of 0.15 lb/MMBtu (weighted average), to 0.10 lb/MMBtu on a 30-day rolling weighted average, by using some form of scrubbing technology (wet scrubber and spray dry absorber were mentioned). Compliance will be demonstrated by reconfiguring the CEMS software to generate a daily report showing the two-unit 30-day rolling average. The average must remain below 0.10 lb/MMBtu, excluding periods of startup and shutdown. 9.3.2 Westar Energy
Westar Energy submitted the document, Jeffrey Energy Center and Gordon Evans Energy Center: BART Five Factor Analysis, for its Jeffrey Units 1 and 2 and Gordon Evans Unit 2 in August 2007 (Appendix 9.6), prepared by Trinity Consultants. In May 2009 Westar amended the document with additional modeling analysis for Gordon Evans. Westar Energy proposes to meet the presumptive BART NOx emission rates for Jeffrey Units 1 and 2 of 0.15 lb/MMBtu using new low NOx burner systems for each unit. For Gordon Evans Unit 2, which is a natural gas/oil-burning unit that meets the presumptive plant and unit size threshold, there is no prescribed presumptive limit. KDHE indicated to Westar in early discussions that presumptive NOx controls consisting of “current combustion control technology” would be expected under the Regional Haze Rule. Westar’s original analysis and amendment went through the standard BART selection process which resulted in identifying a low NOx burner system. However, since the concurrent analysis for SO2 reduction led to a state-approved alternative means of control through fuel switching to natural gas, and since fuel switching results in visibility improvements in all five Class I areas modeled by Westar Energy (30% for Wichita Mountains, for example), Kansas endorses this alternative BART control for NOx. Westar Energy proposes to meet the SO2 presumptive limit of 0.15 lb/MMBtu for Jeffrey Units 1 and 2 by rebuilding the wet scrubber on each unit. For Gordon Evans, which KDHE indicated
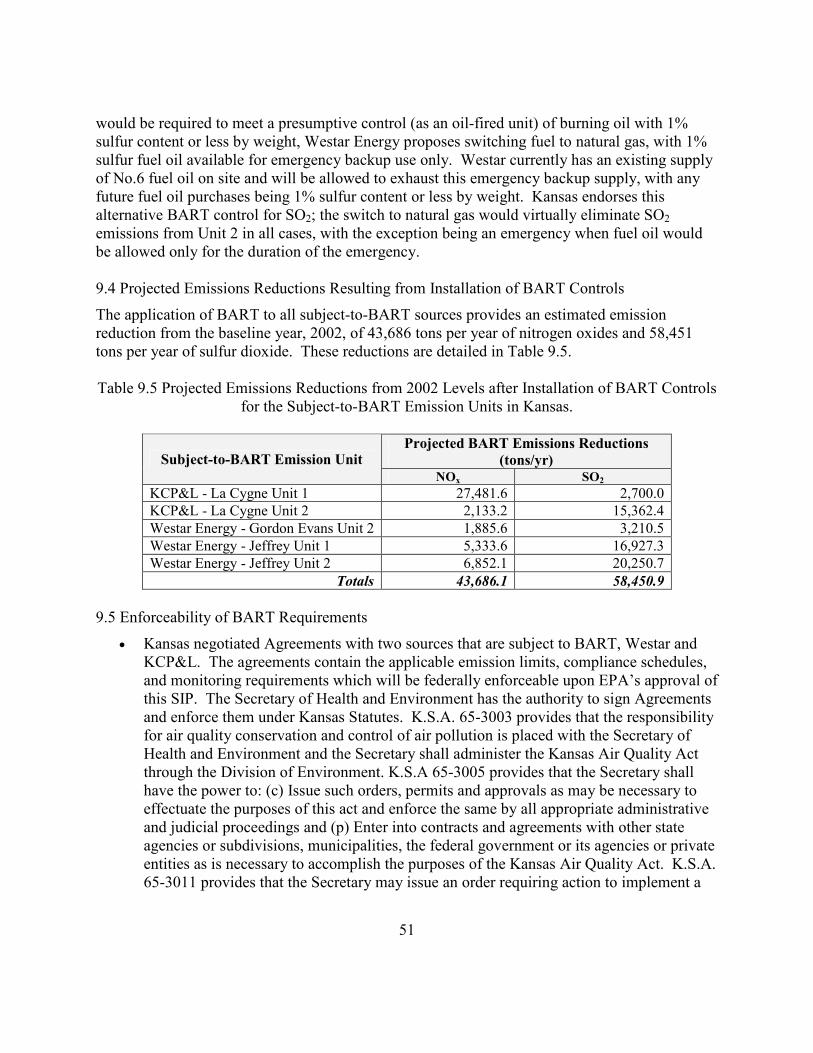
51
would be required to meet a presumptive control (as an oil-fired unit) of burning oil with 1% sulfur content or less by weight, Westar Energy proposes switching fuel to natural gas, with 1% sulfur fuel oil available for emergency backup use only. Westar currently has an existing supply of No.6 fuel oil on site and will be allowed to exhaust this emergency backup supply, with any future fuel oil purchases being 1% sulfur content or less by weight. Kansas endorses this alternative BART control for SO2; the switch to natural gas would virtually eliminate SO2 emissions from Unit 2 in all cases, with the exception being an emergency when fuel oil would be allowed only for the duration of the emergency. 9.4 Projected Emissions Reductions Resulting from Installation of BART Controls
The application of BART to all subject-to-BART sources provides an estimated emission reduction from the baseline year, 2002, of 43,686 tons per year of nitrogen oxides and 58,451 tons per year of sulfur dioxide. These reductions are detailed in Table 9.5.
Table 9.5 Projected Emissions Reductions from 2002 Levels after Installation of BART Controls
for the Subject-to-BART Emission Units in Kansas.
Projected BART Emissions Reductions
(tons/yr) Subject-to-BART Emission Unit
NOx SO2
KCP&L - La Cygne Unit 1 27,481.6 2,700.0
KCP&L - La Cygne Unit 2 2,133.2 15,362.4
Westar Energy - Gordon Evans Unit 2 1,885.6 3,210.5
Westar Energy - Jeffrey Unit 1 5,333.6 16,927.3
Westar Energy - Jeffrey Unit 2 6,852.1 20,250.7
Totals 43,686.1 58,450.9
9.5 Enforceability of BART Requirements
• Kansas negotiated Agreements with two sources that are subject to BART, Westar and KCP&L. The agreements contain the applicable emission limits, compliance schedules, and monitoring requirements which will be federally enforceable upon EPA’s approval of this SIP. The Secretary of Health and Environment has the authority to sign Agreements and enforce them under Kansas Statutes. K.S.A. 65-3003 provides that the responsibility for air quality conservation and control of air pollution is placed with the Secretary of Health and Environment and the Secretary shall administer the Kansas Air Quality Act through the Division of Environment. K.S.A 65-3005 provides that the Secretary shall have the power to: (c) Issue such orders, permits and approvals as may be necessary to effectuate the purposes of this act and enforce the same by all appropriate administrative and judicial proceedings and (p) Enter into contracts and agreements with other state agencies or subdivisions, municipalities, the federal government or its agencies or private entities as is necessary to accomplish the purposes of the Kansas Air Quality Act. K.S.A. 65-3011 provides that the Secretary may issue an order requiring action to implement a
52
compliance plan. K.S.A. 65-3012 provides authority to enforce an administrative order in district court.
The Agreements between affected sources and the State of Kansas require that each source subject to BART install and operate BART controls as expeditiously as practicable, but in no event later than five years after approval of this SIP or plan revision by EPA. The Agreements also include a requirement that each source maintain the control equipment and establish procedures to ensure such equipment is properly operated and maintained. The emissions limits in the agreements and compliance verification requirements will be incorporated into each facility’s Title V operating permit when they are reopened or approved. Amendments to the Agreements confirm and improve the monitoring, record keeping and reporting requirements and enforceability of the Agreements. The Agreements and Amendments for Westar and KCP&L are found in Appendix 9.7. If the 5-year progress report and/or the 10-year SIP revision indicate that additional controls are necessary, Kansas will consider adoption of a Regional Haze Regulation. The Regional Haze Regulation would adopt relevant sections of 40 CFR part 51.301 and 40 CFR Part 51 Appendix Y by reference and would outline the process by which determinations would be made and enforced for BART and Reasonable Progress sources. The Agreements between KDHE and the affected BART sources currently exclude emissions associated with startup, shutdowns, and malfunctions (SSM) in the agreed upon emission limits. As part of the five-year review, KDHE will analyze SSM events and characterize the actual emission rates including and excluding these periods for the affected BART sources. Should the actual emissions rates including the SSM periods exceed the agreed upon emission rate limits, and be found to be adversely affecting visibility at Class I areas, KDHE commits to address these emissions with a SIP modification. 9.6 Monitoring, Recordkeeping, & Reporting of BART Requirements Monitoring, recordkeeping, and reporting requirements to ensure compliance with the terms and conditions of 40 CFR Part 51 Appendix Y are required for all units subject to BART as authorized by Kansas Air Quality Regulation 28-19-512. Existing monitoring and recordkeeping requirements in place at each unit will provide KDHE with sufficient data to ensure compliance with BART requirements. As stated above, amendments to the Agreements confirm and improve the monitoring, record keeping and reporting requirements. All but one unit subject to BART are required to calibrate, operate, and maintain a certified Continuous Emission Monitoring system (CEMS) following procedures outlined in either 40 CFR 60 or 40 CFR 75, depending on applicable requirements currently in place at each emission unit. Nitrogen oxide and sulfur dioxide emissions are monitored and recorded following procedures outlined in either 40 CFR Part 60 or 40 CFR 75. Semi-annual excess emission reports and monitoring systems performance reports are submitted and records are maintained
53
following procedures in either 40 CFR 60 or 40 CFR 75. For the unit that will use fuel switching to meet the requirements of BART, the owner or operator will monitor and record the types and amounts of fuel oils fired and submit them as part of the semi-annual report. List of Chapter 9 Appendices
9.1 Identification of BART-Eligible Sources in the State of Kansas 9.2 Modeling Protocol Used to Determine Subject-to-BART Sources 9.3 Results of Modeling to Screen for Sources Subject to BART 9.4 Guidance for Facilities Conducting a BART Analysis 9.5 BART Analysis for KCP&L - La Cygne Units 1 and 2 9.6 BART Analysis for Westar Energy - Gordon Evans Unit 2 and Jeffrey Units 1 and 2 (including May 2009 addendum for GEEC) 9.7 BART Agreements 9.8 BART Exemption modeling –
Monarch Cement Kansas City BPU – Quindaro Kansas City BPU – Nearman Westar Energy – Hutchinson Westar Energy - Lawrence
54
10. Reasonable Progress Goals / Long Term Strategy
The Regional Haze Rule stipulates that each state “must address regional haze in each mandatory Class I Federal area located within the state and in each mandatory Class I Federal area located outside the state which may be affected by emissions from within the state” [40 CFR 51.308(d)]. Although there are no Class I areas located within Kansas, the State is still required to address regional haze by determining any Class I area(s) that may be significantly impacted by emissions from sources within the State. As part of the CENRAP RPO process, regional modeling was performed that showed several surrounding Class I areas were being affected by sources in Kansas. It was projected that several of these Class I areas would not meet a linear uniform rate of progress in 2018. With this information, Kansas anticipated the surrounding states would request that we consult with them to address the requirements to meet reasonable progress at their Class I areas. Kansas prepared the following reasonable progress analysis to meet the requirements of the rule and to be prepared for the consultation process that was anticipated in light of the CENRAP modeling analysis. 10.1 Determining Visibility Impact
Kansas is required by 40 CFR 51.308(d)(3)(iii) to document the technical basis for the State’s apportionment of emission reductions necessary to meet reasonable progress goals in each Class I area affected by the State’s emissions. In order to address the issue of source attribution of regional haze for its member states, CENRAP contracted with ENVIRON to carry out PM Source Apportionment Technology (PSAT) modeling, a well known “probing tool” for the CAMx photochemical model. ENVIRON delivered its results in the form of a customized Microsoft Access database query tool, hereinafter the PSAT tool, which allows users to select among various inputs to produce charts and tables. Visibility impact can be represented in terms of absolute light extinction (Bext), inverse megameters (Mm-1), and percent total light extinction. Data can be queried from source categories within individual states on individual or grouped Class I area receptors, for the years 2002, 2000-2005 (baseline), and 2018 (end of current planning period). The PSAT tool used for this document is the third version posted, dated July 18, 2007 and available at http://www.cenrap.org/projects.asp Kansas used the PSAT tool to find projected absolute and percent total light extinction values at eleven Class I areas. The analysis helped determine which Class I areas may be impacted by Kansas sources, and also provides a quantifiable basis of discussion for meeting the reasonable progress goals for Class I areas potentially impacted by emission sources within Kansas.
Figures 10.1 and 10.2 below show projected 2018 percent total extinction values for the worst 20% visibility days for nine Class I areas nearest Kansas, and two Class I areas in Texas. The Texas Class I areas were included because Kansas participated in that State’s consultation process. Figure 10.1 breaks down source contribution by particulate species over all source categories, while Figure 10.2 shows source category contributions over all particulate species.

55
Table 10.2 shows the numerical values for percent total extinction as well as for absolute extinction in terms of inverse megameters (Mm-1) for the 12 Class I areas. Note that the nine Class I areas chosen here (besides the two Texas areas) are the same as those selected by EPA Region 7 for Kansas for CALPUFF modeling of the State’s BART-eligible emission sources. They comprise the set of Class I areas nearest to Kansas in all directions around the State border. The eleven areas are:
• Caney Creek Wilderness Area, Arkansas (CACR)
• Upper Buffalo Wilderness Area, Arkansas (UPBU)
• Great Sand Dunes Wilderness Area, Colorado (GRSA)
• Rocky Mountain National Park, Colorado (ROMO)
• Hercules-Glades Wilderness Area, Missouri (HEGL)
• Mingo Wilderness Area, Missouri (MING)
• Wichita Mountains Wilderness Area, Oklahoma (WIMO)
• Badlands National Park, South Dakota (BADL)
• Wind Cave National Park, South Dakota (WICA)
• Big Bend National Park, Texas (BIBE)
• Guadalupe Mountains National Park, Texas (GUMO) Figure 10.1 2018 Percent Total Light Extinction at Eleven Class I Areas from Kansas Sources,
by Species, for All Source Categories during the Worst 20% Days
0.0
1.0
2.0
3.0
4.0
5.0
6.0
CACR
UPBU
GRSA
ROMO
HEGL
MING
WIMO
BADL
WICA
BIBE
GUMO
Percent total extinction (%
)
CM
Soil
EC
POA
NO3
SO4
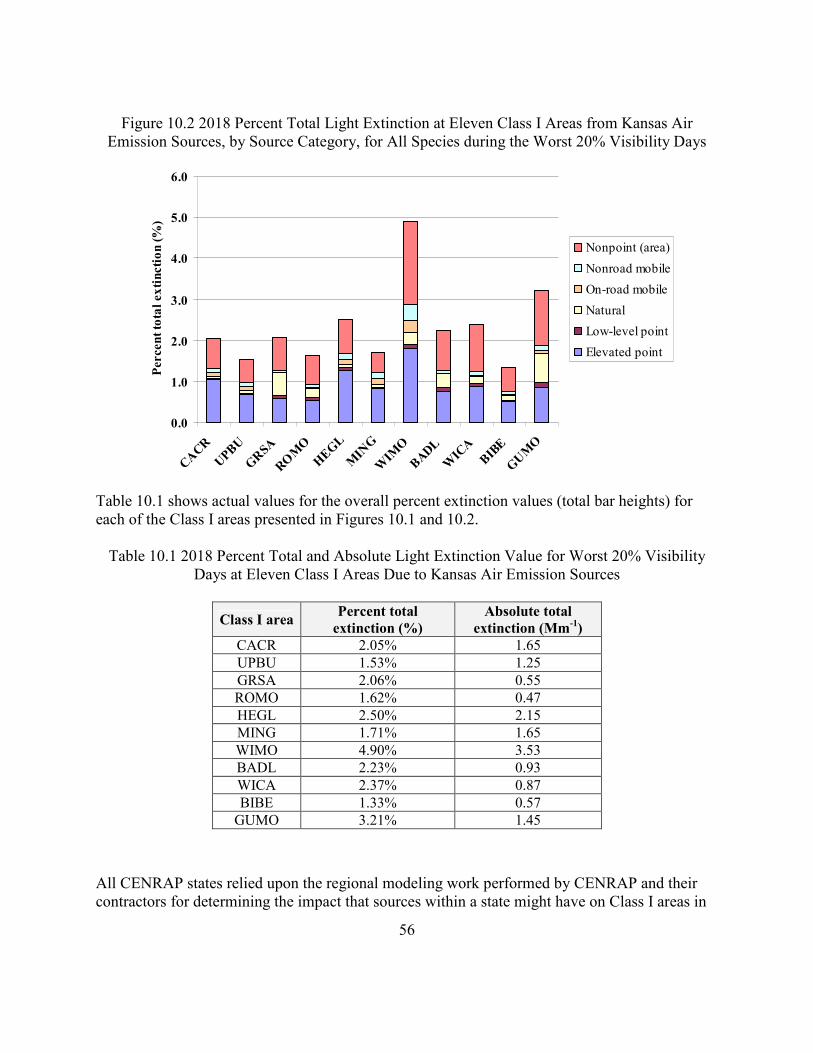
56
Figure 10.2 2018 Percent Total Light Extinction at Eleven Class I Areas from Kansas Air Emission Sources, by Source Category, for All Species during the Worst 20% Visibility Days
0.0
1.0
2.0
3.0
4.0
5.0
6.0
CACR
UPBU
GRSA
ROMO
HEGL
MING
WIMO
BADL
WICA
BIBE
GUMO
Percent total extinction (%)
Nonpoint (area)
Nonroad mobile
On-road mobile
Natural
Low-level point
Elevated point
Table 10.1 shows actual values for the overall percent extinction values (total bar heights) for each of the Class I areas presented in Figures 10.1 and 10.2. Table 10.1 2018 Percent Total and Absolute Light Extinction Value for Worst 20% Visibility
Days at Eleven Class I Areas Due to Kansas Air Emission Sources
Class I area Percent total
extinction (%)
Absolute total
extinction (Mm-1)
CACR 2.05% 1.65
UPBU 1.53% 1.25
GRSA 2.06% 0.55
ROMO 1.62% 0.47
HEGL 2.50% 2.15
MING 1.71% 1.65
WIMO 4.90% 3.53
BADL 2.23% 0.93
WICA 2.37% 0.87
BIBE 1.33% 0.57
GUMO 3.21% 1.45
All CENRAP states relied upon the regional modeling work performed by CENRAP and their contractors for determining the impact that sources within a state might have on Class I areas in

57
the region. For Kansas, the modeling indicated that Kansas sources were most likely to have the highest impact at the Wichita Mountains in Oklahoma, with the Guadalupe Mountains in Texas being the next highest impacted area by Kansas sources. KDHE choose to focus its reasonable progress analysis primarily on the Wichita Mountains because it was the location with modeling showing the highest impact from Kansas sources and was the closest Class I area where modeling indicated the linear uniform rate of progress for 2018 was unlikely to be met. KDHE choose not to perform a detailed analysis and discussion on each additional surrounding Class I area as KDHE believes that the emission reductions realized from Kansas BART sources and through the reasonable progress analysis will positively impact not only the Wichita Mountains but the remaining Class I areas. It is also important to note that CENRAP modeling indicates approximately a three percent or less light extinction from Kansas sources in the remaining Class I areas making a detailed analysis for each area a lower priority. Kansas instead chose to focus primarily on the Wichita Mountains, but did perform modeling and indicated the maximum impacted Class I area for each reasonable progress source analyzed as can be seen in Table 10.9.
10.1.2 Light Extinction at Wichita Mountains
Figures 10.1 and 10.2 reveal that the largest contributors to haze for Wichita Mountains from Kansas sources are nitrates (NO3) from point sources and nonpoint (area) sources. To get a more precise idea of relative contributions, the PSAT tool was used to generate tables for individual species, for the best 20% visibility days as well as for the worst 20% visibility days. The Regional Haze Rule requires reasonable progress goals to ensure no degradation in visibility for the least impaired days at each Class I area as well as improvement of the worst [40 CFR 51.308(d)(1)]. Table 10.2 summarizes the PSAT tool-generated tables, which are found in Appendix 10.1. Table 10.2 shows percent total extinction values greater than 0.5% to represent percent total extinction for the respective source category and species combinations. Values of less than 0.5% were considered to be insignificant.
Table 10.2 2018 Percent Total Light Extinction > 0.5% Due to Kansas Sources for Worst and
Best 20% Visibility Days for the Wichita Mountains Class I Area
Source category / particulate species Percent total extinction > 0.5% (%)
Worst 20% visibility days (total extinction = 72.01 Mm-1)
Point sources – NO3 0.9572
Point sources – SO4 0.8404
Area sources – POA 0.7210
Best 20% visibility days (total extinction = 15.14 Mm-1)
Point sources – NO3 0.7386
Point sources – SO4 1.6518
Area sources – SO4 0.5526
Area sources – POA 1.6600
Area sources – EC 0.6497

58
Appendix D of the Technical Support Document was consulted to find light extinction values for Wichita Mountains (see Appendix 10.2). Figure 10.3 shows the glide path for Wichita Mountains in inverse megameters, in order to compare with the percent total extinction values derived from the PSAT tool. Figure 10.3 shows that the 2018 extinction value on the Wichita Mountains glide path is 73.97 Mm-1, while the 2064 (natural) extinction value is 21.23 Mm-1. These values are derived from CMAQ, which is a different photochemical model than CAMx / PSAT.
Figure 10.3 Glide Path for Wichita Mountains Wilderness Area, Oklahoma, in Terms of Light
Extinction
Uniform Rate of Reasonable Progress Glide Path
Wichita Mountains - 20% Data Days
108.20
97.03
73.97
56.39
42.99
32.78
24.9921.23
87.81
0
20
40
60
80
100
120
2000 2004 2008 2012 2016 2020 2024 2028 2032 2036 2040 2044 2048 2052 2056 2060 2064
Year
Bext (1/M
m)
Glide Path Natural Condition (Worst Days) Observation Method 1 Prediction
The PSAT-derived value for 2018 total extinction at Wichita Mountains from Kansas sources is 72.01 Mm-1, and is less conservative than the CMAQ value shown on the glide slope. The CMAQ value will be used here. Table 10.3 shows the absolute light extinction values attributable to Kansas emission sources by source category and particulate species at Wichita Mountains, which result from combining percent total extinction with total extinction values. PSAT modeling shows that by the end of the current planning period (2018), Kansas emission sources are projected to contribute only moderately to haze conditions at Wichita Mountains. On the haziest days, Kansas contributions are predicted to be chiefly due to point sources (0.71 Mm-
1 by nitrates and 0.62 Mm-1 by sulfates), and to a lesser extent area sources (0.53 Mm-1 by

59
primary organic aerosols), primarily from direct emissions from burning activities or natural gas combustion. On the clearest days, Kansas contributions will again be due chiefly to point sources (nitrates and sulfates), with minor contributions of nitrates from area, biogenic, and nonroad mobile source categories. Table 10.3 Light Extinction Attributable to Kansas Emission Sources at Wichita Mountains Class I Area, by Source Category and Particulate Species
Source category / particulate
species
Percent
total
extinction >
0.5%
2018
projected
total light
extinction
Kansas
attributable
light
extinction
% Mm-1
Worst 20% visibility days
Point sources - NO3 0.9572 73.97 0.71
Point sources - SO4 0.8404 73.97 0.62
Area sources - POA 0.7210 73.97 0.53
Best 20% visibility days
Point sources – NO3 0.7386 21.23 0.16
Point sources – SO4 1.6518 21.23 0.35
Area sources – SO4 0.5526 21.23 0.12
Area sources – POA 1.6600 21.23 0.35
Area sources – EC 0.6497 21.23 0.14
These amounts of projected light extinction are not large. For example, if the entire modeled 2018 percent extinction contribution from Kansas (4.9%) were removed, the visibility at Wichita Mountains would improve by only 0.5 deciviews (dv). Calculations for this example are the following:
Uniform rate of progress for 2018 at WIMO = 73.97 Mm-1 Kansas modeled 2018 contribution from all sources = 4.9% x 73.97 Mm-1 = 3.62 Mm-1 Converting to deciviews: 73.97 Mm-1 � 20.0 dv, 70.35 Mm-1 � 19.5 dv Visibility Improvement: 20.0 dv - 19.5 dv = 0.5 dv
Because modeled overall percent light extinction exceeds the threshold for visibility impact at Wichita Mountains, and the projected 2018 visibility at Wichita Mountains fails to fall below the glide path, additional measures for reducing visibility-impairing emissions at Wichita Mountains from Kansas sources beyond those achieved by installing controls at Kansas sources subject to BART will be needed in the future.
60
10.2 Selection of Kansas Sources for Reasonable Progress Evaluation
Under the Regional Haze Rule 40 CFR 51.308(d), “states must address regional haze in each mandatory Class I Federal area located within the State and in each mandatory Class I Federal area located outside the State which may be affected by emissions from within the State. To meet the core requirements for regional haze for these areas, the State must submit an implementation plan containing the following plan elements and supporting documentation for all required analyses: (1) Reasonable progress goals. (2) Calculations of baseline and natural visibility conditions. (3) Long-term strategy for regional haze. (4) Monitoring strategy and other implementation plan requirements.” This language was the basis for Kansas to develop this process.
According to the Rule, “In establishing a reasonable progress goal for any mandatory Class I Federal area within the state, the state must: consider the costs of compliance, the time necessary for compliance, the energy and non-air quality environmental impacts of compliance, and the remaining useful life of any potentially affected sources, and include a demonstration showing how these factors were taken into consideration in selecting the goal” [40 CFR 51.308(d)(1)(i)(A)]. This part of the Regional Haze Rule is the basis for the four factor analysis. EPA’s Guidance for Setting Reasonable Progress Goals under the Regional Haze Program, states:
In determining reasonable progress, CAA Section 169A(g)(1) requires states to take into consideration a number of factors. However, [states] have flexibility in how to take into consideration these statutory factors and any other factors that [states] have determined to be relevant. For example, the factors could be used to select which sources or activities should or should not be regulated, or they could be used to determine the level or stringency of control, if any, for selected sources or activities, or some combination of both. The factors may be considered both individually and/or in combination (6).
In addition, EPA’s guidance suggests the following measures:
• Identify the key pollutants and sources and/or source categories that are contributing to visibility impairment at each Class I area. The sources of impairment for the most impaired and least impaired days may differ.
• Identify the control measures and associated emission reductions that are expected to result from compliance with existing rules and other available measures for the sources and source categories that contribute significantly to visibility impairment.
• Determine what additional control measures would be reasonable based on the statutory factors and other relevant factors for the sources and/or source categories.
• Estimate through the use of air quality models the improvement in visibility that would result from implementation of the control measures found to be reasonable and compare this to the uniform rate of progress.

61
In order to perform this analysis for point sources, the State of Kansas developed a multi-step process, to apply the statutory factor analysis in a manner that is both equitable and simple. The first several steps used readily available actual emissions, visibility impact modeling, and cost of controls (i.e., cost of compliance) estimates to identify, screen, and rank the State’s large emission facilities. Geographic location was not considered, since this process was carried out before state consultations had begun. Each of the facilities remaining from the initial screening were then scrutinized for the statutory factors of time necessary, energy and non-air quality environmental impacts, and remaining useful life, resulting in a ranked list of facilities that would potentially be called on to install controls if further emission reductions are necessary to meet the reasonable progress goal at a given Class I area. The process steps are as follows:
1. Identify all Kansas emission units that had greater than or equal to 500 tons for NOx and/or SO2
2. Identify the most effective control technologies and screen for excessive cost 3. Model visibility impacts and screen for low-impact facilities 4. Calculate, screen, and rank based on cost per ton per deciview 5. Screen for non-cost statutory factors, i.e., time necessary for compliance, energy and non-
air quality environmental impacts of compliance, and remaining useful life 6. Re-sort and make final ranked list of potential facilities
Step 1: Identify 500 ton NOx and SO2 emission units Using the 2002 base year inventory, a database query was run on the Kansas point source emissions inventory to find all emission units whose NOx and/or SO2 emissions were 500 tons per year or more. Kansas chose to use 500 tons for two reasons. First, this is the level agreed upon in discussions among CENRAP members for this purpose; and second, visibility impacts from modeling that Kansas has performed on larger sources indicate a 500 ton source would not significantly impact (> 0.5 delta deciview) a surrounding Class I area. The latter reason applies for all locations within the State as Kansas contains no Class I areas. The closest Class I area is Hercules Glades, Missouri, and is a distance of 151 km from the Kansas state line. A total of 30 NOx units and 28 SO2 units were found. Of this set of emission units, 8 NOx and 10 SO2 units were removed from the initial candidate list for the following reasons: The remaining set of 22 NOx units included 11 electric generating units (EGUs), 6 cement kilns, 2 gas compressor engines, 1 refinery fluid-bed catalytic cracking unit (FCCU) , 1 ammonia plant, and 1 glass furnace, all located at 15 facilities. The 18 SO2 units were comprised of 13 EGUs, 4
Reason for exclusion NOx units SO2 units Already subject to BART 6 6 Controls installed since 2002 (now <500 tons) 2 2 Source has no commercially available controls 0 2

62
cement kilns, and 1 refinery FCCU, all located at 12 facilities. These data are detailed in Table 10.4. Step 2: Identify most effective control technologies and screen for excessive cost Next, each of the 500 ton or greater units was aligned with the emission control technology selected for it by the CENRAP contractor, Alpine Geophysics, utilizing the least marginal cost. For units not identified by Alpine, EPA’s AirControlNET version 4.1 was used to identify control technologies, control efficiencies, and costs. The most appropriate control identified by the AirControlNET program was selected. Refinements to this selection process were made for two facilities, and are summarized in Table 10.5.
Table 10.4 Kansas Emission Units Not Subject to BART Emitting at Least 500 Tons/Yr of NOx
or SO2 in 2002
2002 NOx 2002 SO2 Source ID Facility Unit ton/yr
0910057 AGC Flat Glass North America Glass furnace 1,375 [234.2] 1
1330001 Ash Grove Cement Kiln 2,121 747
0210002 Empire District Electric - Riverton
Unit 7 582 2,393
0210002 Empire District Electric - Riverton
Unit 8 1,040 866
0150004 Frontier El Dorado Refinery FCCU 688 856
1250015 Heartland Cement Kiln 928 1,007
2090048 Kansas City BPU - Quindaro Unit 1 1,599 1,288
2090048 Kansas City BPU - Quindaro Unit 2 1,330 2,123
2090008 Kansas City BPU – Nearman Unit 1 3,860 7,625
0930012 Kinder Morgan - Lakin Station EU-2 579 [0.1]
0570003 Koch Nitrogen Ammonia plant
585 [0.5]
2057022 Lafarge Midwest - Fredonia Kiln 1 596 660
2057022 Lafarge Midwest - Fredonia Kiln 2 883 978
0010009 Monarch Cement Kiln 4 652 [74.7]
0010009 Monarch Cement Kiln 5 972 [254.6]
0670035 ONEOK - Ulysses Station Clark 1 619 [0.1]
0550023 Sunflower Electric - Holcomb Unit 1 3,781 1,669
1730012 Westar Energy - Gordon Evans Unit 1 [208.5] 618
1550033 Westar Energy - Hutchinson Unit 4 [209.2] 734
1490001 Westar Energy – Jeffrey Unit 3 10,481 23,206
0450014 Westar Energy – Lawrence Unit 3 738 1,965
0450014 Westar Energy – Lawrence Unit 4 2,037 1,430
0450014 Westar Energy – Lawrence Unit 5 3,762 4,354
1770030 Westar Energy – Tecumseh Unit 7 1,531 2,693
1770030 Westar Energy – Tecumseh Unit 8 1,877 4,515 1 Values within brackets indicate 2002 emissions less than 500 tons per year.
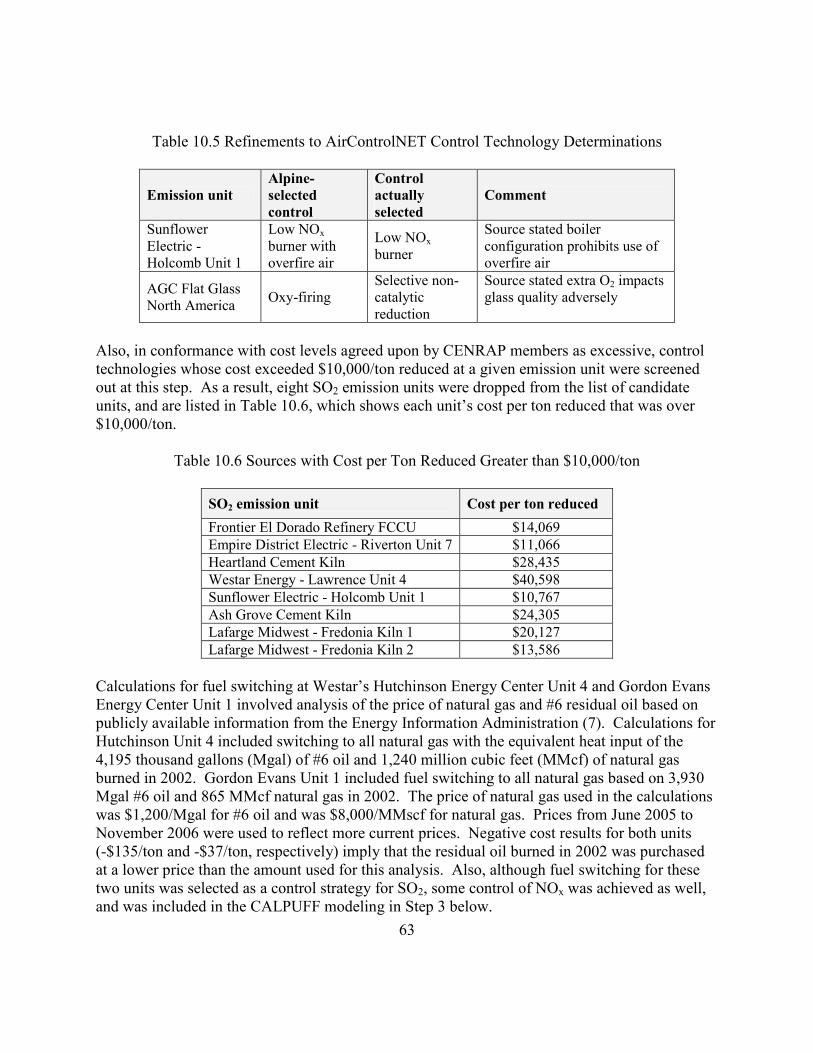
63
Table 10.5 Refinements to AirControlNET Control Technology Determinations
Emission unit
Alpine-
selected
control
Control
actually
selected
Comment
Sunflower Electric - Holcomb Unit 1
Low NOx burner with overfire air
Low NOx burner
Source stated boiler configuration prohibits use of overfire air
AGC Flat Glass North America
Oxy-firing Selective non-catalytic reduction
Source stated extra O2 impacts glass quality adversely
Also, in conformance with cost levels agreed upon by CENRAP members as excessive, control technologies whose cost exceeded $10,000/ton reduced at a given emission unit were screened out at this step. As a result, eight SO2 emission units were dropped from the list of candidate units, and are listed in Table 10.6, which shows each unit’s cost per ton reduced that was over $10,000/ton.
Table 10.6 Sources with Cost per Ton Reduced Greater than $10,000/ton
SO2 emission unit Cost per ton reduced
Frontier El Dorado Refinery FCCU $14,069
Empire District Electric - Riverton Unit 7 $11,066
Heartland Cement Kiln $28,435
Westar Energy - Lawrence Unit 4 $40,598
Sunflower Electric - Holcomb Unit 1 $10,767
Ash Grove Cement Kiln $24,305
Lafarge Midwest - Fredonia Kiln 1 $20,127
Lafarge Midwest - Fredonia Kiln 2 $13,586
Calculations for fuel switching at Westar’s Hutchinson Energy Center Unit 4 and Gordon Evans Energy Center Unit 1 involved analysis of the price of natural gas and #6 residual oil based on publicly available information from the Energy Information Administration (7). Calculations for Hutchinson Unit 4 included switching to all natural gas with the equivalent heat input of the 4,195 thousand gallons (Mgal) of #6 oil and 1,240 million cubic feet (MMcf) of natural gas burned in 2002. Gordon Evans Unit 1 included fuel switching to all natural gas based on 3,930 Mgal #6 oil and 865 MMcf natural gas in 2002. The price of natural gas used in the calculations was $1,200/Mgal for #6 oil and was $8,000/MMscf for natural gas. Prices from June 2005 to November 2006 were used to reflect more current prices. Negative cost results for both units (-$135/ton and -$37/ton, respectively) imply that the residual oil burned in 2002 was purchased at a lower price than the amount used for this analysis. Also, although fuel switching for these two units was selected as a control strategy for SO2, some control of NOx was achieved as well, and was included in the CALPUFF modeling in Step 3 below.

64
Table 10.7 shows a summary of Step 2 results. Table 10.7 Most Effective Control Technologies with Acceptable Control Costs for Kansas 500-
Ton NOx and SO2 Emission Units
Source ID Facility Unit
Selected
control
measure
Control
efficiency
(%)
Cost per ton
reduced ($2002
AirControlNET
or $2005 Alpine)
Source
NOx sources
0910057
AGC Flat Glass North America
Glass Furnace
SNCR 40.0 $1,041 AirControlNET
1330001 Ash Grove Cement
Cement Kiln
LNB 25.0 $509 AirControlNET
0210002 Empire District Electric - Riverton
Unit 7 LNBO 55.9 $1,398 Alpine
0210002 Empire District Electric - Riverton
Unit 8 LNC3 53.1 $873 Alpine
0150004 Frontier El Dorado Refinery
FCCU LNB + FGR 55.0 $5,314 Alpine
1250015 Heartland Cement
Cement Kiln
Mid-kiln firing 30.0 $83 Alpine
2090008 Kansas City BPU – Nearman
Unit 1 LNB+OFA+NN 45.2 $750 BPU – 2006
dollars
2090048 Kansas City BPU - Quindaro
Unit 1 NGR 50.0 $579 Alpine
2090048 Kansas City BPU - Quindaro
Unit 2 LNB 40.3 $849 AirControlNET
0930012 Kinder Morgan - Lakin Station
EU-2 A/F + IR 30.0 $2,027 AirControlNET
0570003 Koch Nitrogen Ammonia Plant
OT + WI 65.0 $688 Alpine
2057022 Lafarge Midwest - Fredonia
Kiln 1 Mid-kiln firing 30.0 $83 Alpine
2057022 Lafarge Midwest - Fredonia
Kiln 2 Mid-kiln firing 30.0 $83 Alpine
0010009 Monarch Cement
Kiln 4 Biosolid injection
23.0 $466 Alpine
0010009 Monarch Kiln 5 Biosolid 23.0 $466 Alpine
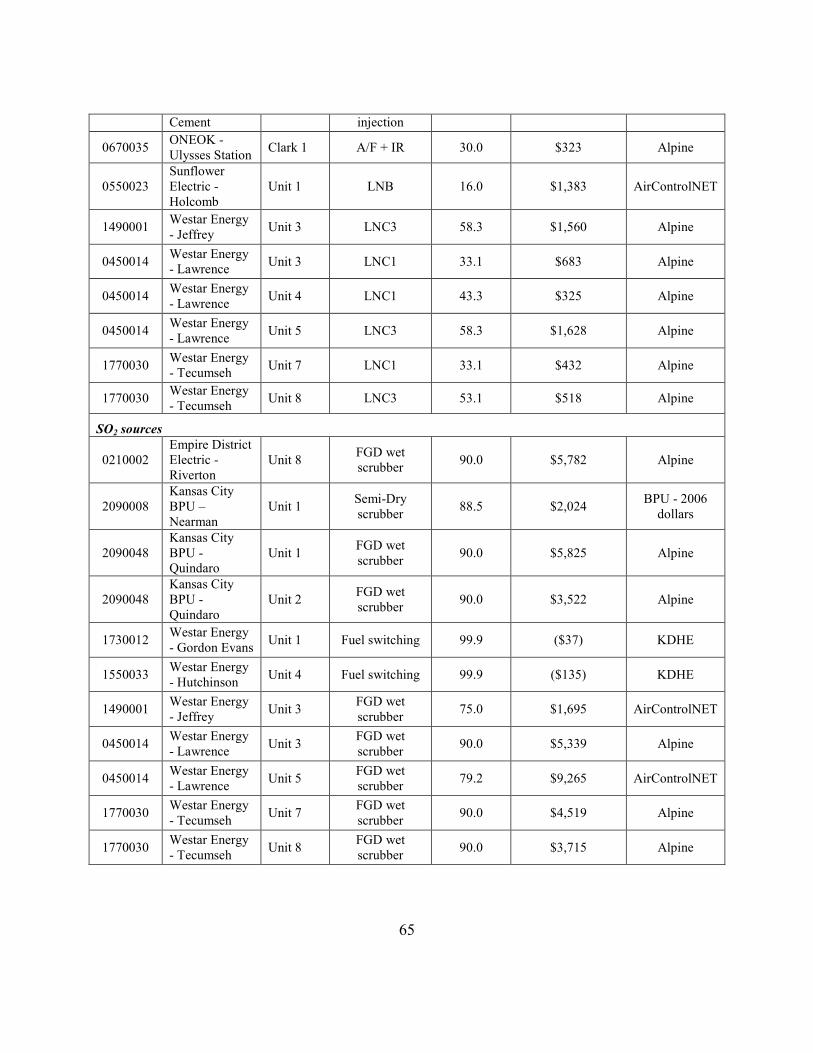
65
Cement injection
0670035 ONEOK - Ulysses Station
Clark 1 A/F + IR 30.0 $323 Alpine
0550023 Sunflower Electric - Holcomb
Unit 1 LNB 16.0 $1,383 AirControlNET
1490001 Westar Energy - Jeffrey
Unit 3 LNC3 58.3 $1,560 Alpine
0450014 Westar Energy - Lawrence
Unit 3 LNC1 33.1 $683 Alpine
0450014 Westar Energy - Lawrence
Unit 4 LNC1 43.3 $325 Alpine
0450014 Westar Energy - Lawrence
Unit 5 LNC3 58.3 $1,628 Alpine
1770030 Westar Energy - Tecumseh
Unit 7 LNC1 33.1 $432 Alpine
1770030 Westar Energy - Tecumseh
Unit 8 LNC3 53.1 $518 Alpine
SO2 sources
0210002 Empire District Electric - Riverton
Unit 8 FGD wet scrubber
90.0 $5,782 Alpine
2090008 Kansas City BPU – Nearman
Unit 1 Semi-Dry scrubber
88.5 $2,024 BPU - 2006
dollars
2090048 Kansas City BPU - Quindaro
Unit 1 FGD wet scrubber
90.0 $5,825 Alpine
2090048 Kansas City BPU - Quindaro
Unit 2 FGD wet scrubber
90.0 $3,522 Alpine
1730012 Westar Energy - Gordon Evans
Unit 1 Fuel switching 99.9 ($37) KDHE
1550033 Westar Energy - Hutchinson
Unit 4 Fuel switching 99.9 ($135) KDHE
1490001 Westar Energy - Jeffrey
Unit 3 FGD wet scrubber
75.0 $1,695 AirControlNET
0450014 Westar Energy - Lawrence
Unit 3 FGD wet scrubber
90.0 $5,339 Alpine
0450014 Westar Energy - Lawrence
Unit 5 FGD wet scrubber
79.2 $9,265 AirControlNET
1770030 Westar Energy - Tecumseh
Unit 7 FGD wet scrubber
90.0 $4,519 Alpine
1770030 Westar Energy - Tecumseh
Unit 8 FGD wet scrubber
90.0 $3,715 Alpine
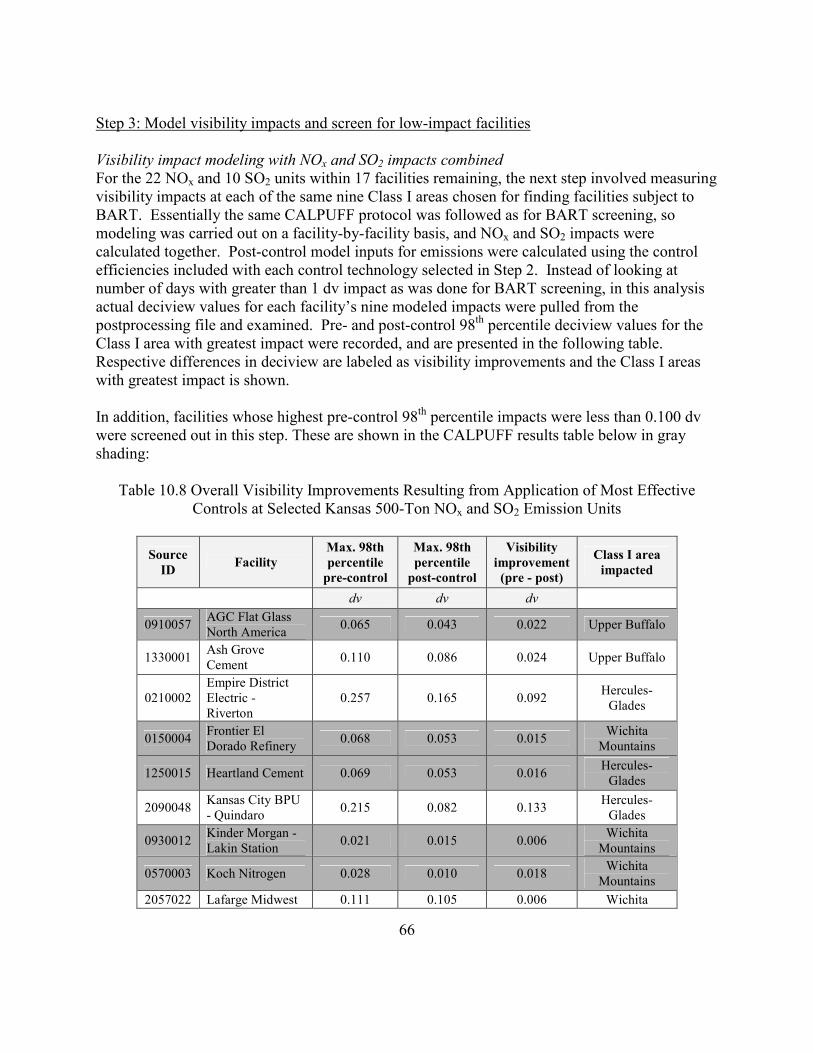
66
Step 3: Model visibility impacts and screen for low-impact facilities
Visibility impact modeling with NOx and SO2 impacts combined For the 22 NOx and 10 SO2 units within 17 facilities remaining, the next step involved measuring visibility impacts at each of the same nine Class I areas chosen for finding facilities subject to BART. Essentially the same CALPUFF protocol was followed as for BART screening, so modeling was carried out on a facility-by-facility basis, and NOx and SO2 impacts were calculated together. Post-control model inputs for emissions were calculated using the control efficiencies included with each control technology selected in Step 2. Instead of looking at number of days with greater than 1 dv impact as was done for BART screening, in this analysis actual deciview values for each facility’s nine modeled impacts were pulled from the postprocessing file and examined. Pre- and post-control 98th percentile deciview values for the Class I area with greatest impact were recorded, and are presented in the following table. Respective differences in deciview are labeled as visibility improvements and the Class I areas with greatest impact is shown. In addition, facilities whose highest pre-control 98th percentile impacts were less than 0.100 dv were screened out in this step. These are shown in the CALPUFF results table below in gray shading:
Table 10.8 Overall Visibility Improvements Resulting from Application of Most Effective Controls at Selected Kansas 500-Ton NOx and SO2 Emission Units
Source
ID Facility
Max. 98th
percentile
pre-control
Max. 98th
percentile
post-control
Visibility
improvement
(pre - post)
Class I area
impacted
dv dv dv
0910057 AGC Flat Glass North America
0.065 0.043 0.022 Upper Buffalo
1330001 Ash Grove Cement
0.110 0.086 0.024 Upper Buffalo
0210002 Empire District Electric - Riverton
0.257 0.165 0.092 Hercules-Glades
0150004 Frontier El Dorado Refinery
0.068 0.053 0.015 Wichita
Mountains
1250015 Heartland Cement 0.069 0.053 0.016 Hercules-Glades
2090048 Kansas City BPU - Quindaro
0.215 0.082 0.133 Hercules-Glades
0930012 Kinder Morgan - Lakin Station
0.021 0.015 0.006 Wichita
Mountains
0570003 Koch Nitrogen 0.028 0.010 0.018 Wichita
Mountains
2057022 Lafarge Midwest 0.111 0.105 0.006 Wichita
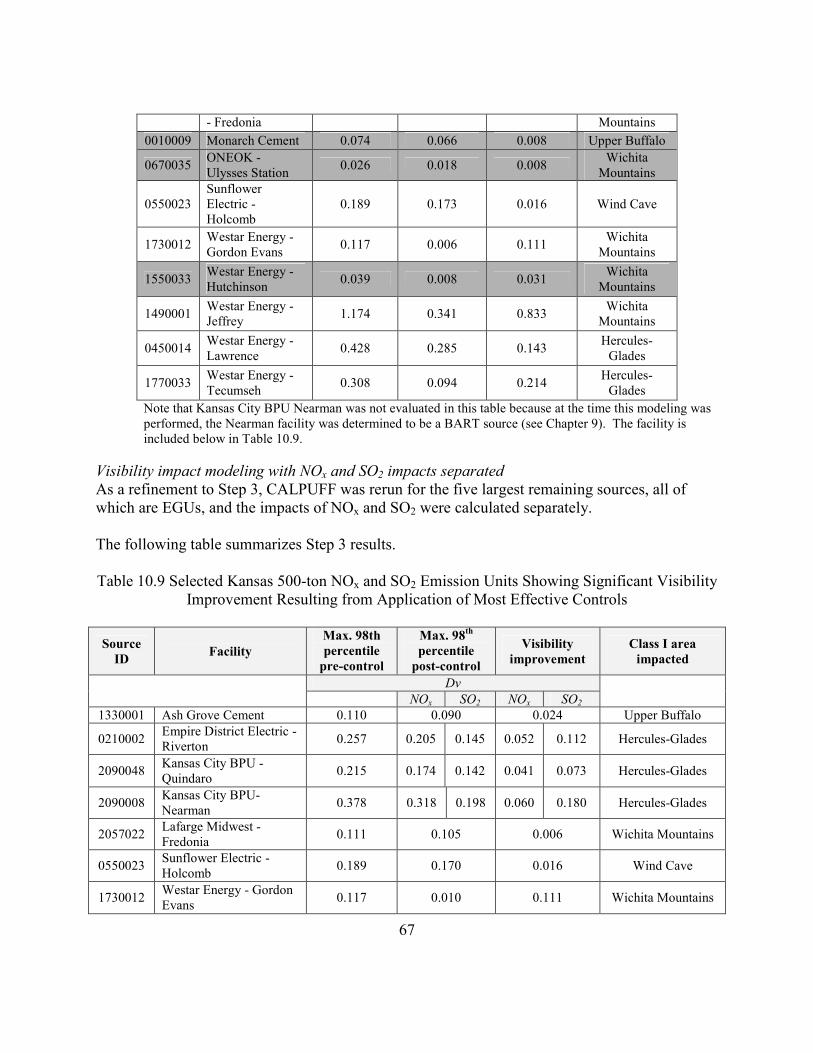
67
- Fredonia Mountains
0010009 Monarch Cement 0.074 0.066 0.008 Upper Buffalo
0670035 ONEOK - Ulysses Station
0.026 0.018 0.008 Wichita
Mountains
0550023 Sunflower Electric - Holcomb
0.189 0.173 0.016 Wind Cave
1730012 Westar Energy - Gordon Evans
0.117 0.006 0.111 Wichita
Mountains
1550033 Westar Energy - Hutchinson
0.039 0.008 0.031 Wichita
Mountains
1490001 Westar Energy - Jeffrey
1.174 0.341 0.833 Wichita
Mountains
0450014 Westar Energy - Lawrence
0.428 0.285 0.143 Hercules-Glades
1770033 Westar Energy - Tecumseh
0.308 0.094 0.214 Hercules-Glades
Note that Kansas City BPU Nearman was not evaluated in this table because at the time this modeling was performed, the Nearman facility was determined to be a BART source (see Chapter 9). The facility is included below in Table 10.9.
Visibility impact modeling with NOx and SO2 impacts separated As a refinement to Step 3, CALPUFF was rerun for the five largest remaining sources, all of which are EGUs, and the impacts of NOx and SO2 were calculated separately. The following table summarizes Step 3 results.
Table 10.9 Selected Kansas 500-ton NOx and SO2 Emission Units Showing Significant Visibility Improvement Resulting from Application of Most Effective Controls
Source
ID Facility
Max. 98th
percentile
pre-control
Max. 98th
percentile
post-control
Visibility
improvement
Class I area
impacted
Dv
NOx SO2 NOx SO2
1330001 Ash Grove Cement 0.110 0.090 0.024 Upper Buffalo
0210002 Empire District Electric - Riverton
0.257 0.205 0.145 0.052 0.112 Hercules-Glades
2090048 Kansas City BPU - Quindaro
0.215 0.174 0.142 0.041 0.073 Hercules-Glades
2090008 Kansas City BPU- Nearman
0.378 0.318 0.198 0.060 0.180 Hercules-Glades
2057022 Lafarge Midwest - Fredonia
0.111 0.105 0.006 Wichita Mountains
0550023 Sunflower Electric - Holcomb
0.189 0.170 0.016 Wind Cave
1730012 Westar Energy - Gordon Evans
0.117 0.010 0.111 Wichita Mountains

68
1490001 Westar Energy - Jeffrey 1.174 1.06 0.469 0.114 0.705 Wichita Mountains
0450014 Westar Energy - Lawrence
0.428 0.329 0.310 0.099 0.118 Hercules-Glades
1770033 Westar Energy - Tecumseh
0.308 0.271 0.159 0.037 0.149 Hercules - Glades
Step 4: Calculate, screen, and rank based on cost per ton per deciview The final calculation is the derivation of cost per ton per unit of change in deciview, the metric used to sort the remaining sources for meeting reasonable progress goals. The single value of cost per ton per deciview combines cost and visibility improvement in such a way that its numeric value increases: (1) as cost of controls increases; and (2) as visibility improvement decreases. Thus, the facility with the lowest cost per ton per deciview would be the first to be reviewed for possible controls to meet reasonable progress goals if further emission reductions of NOx or SO2 are needed. For the five higher-impact sources (from Step 3), NOx and SO2 impacts were kept separate for this step, since future needs may call for cuts in NOx only or SO2 only. Following is a summary table, Table 10.10, showing Step 4 results.
Table 10.10 Ranked List of Kansas Facilities, Emission Units, and Controls after Cost and Visibility Screening
Source
ID Facility Pollutant
Emission
unit(s)
Cost per
ton1
Visibility
improvement
Class I
area (98th
percentile)
Cost per ton
per dv
$2002 Dv $2002/ton-dv
1330001 Ash Grove Cement NOx Cement kiln
$509 0.024 Upper Buffalo
$21,208
0210002 Empire District Electric - Riverton
NOx Units 7 &
8 $9842 0.052
Hercules-Glades
$18,923
0210002 Empire District Electric - Riverton
SO2 Unit 8 $5,326 0.112 Hercules-Glades
$47,554
2090048 Kansas City BPU - Quindaro
NOx Units 1 &
2 $660 0.041
Hercules-Glades
$16,098
2090048 Kansas City BPU - Quindaro
SO2 Units 1 &
2 $4,045 0.073
Hercules-Glades
$55,411
2090008 Kansas City BPU - Nearman
NOx Unit 1 $7433 0.060 Hercules-Glades
$12,383
2090008 Kansas City BPU - Nearman
SO2 Unit 1 $2,0243 0.213 Caney Creek
$9.502
2057022 Lafarge Midwest - Fredonia
NOx Kilns 1 &
2 $76 0.006
Wichita Mountains
$12,667
0550023 Sunflower Electric - Holcomb
NOx Unit 1 $1,383 0.016 Wind Cave $86,438

69
1730012 Westar Energy - Gordon Evans
SO2 Unit 1 ($37) 0.111 Wichita
Mountains ($333)
1490001 Westar Energy - Jeffrey
NOx Unit 3 $1,437 0.114 Wichita
Mountains $12,605
1490001 Westar Energy - Jeffrey
SO2 Unit 3 $1,695 0.705 Wichita
Mountains $2,404
0450014 Westar Energy - Lawrence
NOx Units 3, 4,
& 5 $989 0.099
Hercules-Glades
$9,990
0450014 Westar Energy - Lawrence
SO2 Units 3 &
5 $7,791 0.118
Hercules-Glades
$66,025
1770030 Westar Energy - Tecumseh
NOx Units 7 &
8 $450 0.037
Hercules-Glades
$12,162
1770030 Westar Energy - Tecumseh
SO2 Units 7 &
8 $3,699 0.149
Hercules-Glades
$24,826
1 Alpine Geophysics reported costs in $2005, which have here been adjusted to 2002 dollars using a factor derived the ratio of Consumer Price Index average price data values for the two years, or 179.9/195.3 = 0.92115 (8) 2 Empire submitted estimates of $2,427 (60% efficient) and $1,826 (30% efficient) for NOx controls on Units 7 and 8, respectively. The values shown are from Alpine, however, since further visibility modeling was not carried out for the source. 3 Cost supplied by Kansas City BPU in an engineering analysis report. Costs are in 2006 dollars.
Step 5: Screen for non-cost statutory factors The table below presents a summary of the three non-cost statutory factors analyzed for the source remaining after cost and visibility impact was considered.
Table 10.11 Summary of Reasonable Progress Non-Cost Statutory Factors for Selected Kansas Point Sources
Source ID Facility Pollutant Emission
unit(s)
Selected
control
measure
Compliance
Timeframe
Non-air
quality
environmental
impacts
Remaining
useful life
NOx
1330001 Ash Grove Cement
NOx Cement kiln
LNB
Potential permitting
issues, control device energy requirements
10-30 years
0210002 Empire District Electric - Riverton
NOx Unit 7 LNBO
0210002 Empire District Electric - Riverton
NOx Unit 8 LNC3
3-4 years following
SIP approval
Potential permitting issues,
reduction in electricity production capacity
5-10 years

70
2090048 Kansas City BPU - Quindaro
NOx Unit 1 NGR
2090048 Kansas City BPU - Quindaro
NOx Unit 2 LNB
30-50 years
2090008 Kansas City BPU - Nearman
NOx Unit 1 LNB+OFA+NN
Potential permitting issues,
reduction in electricity production capacity 30-50 years
2057022 Lafarge Midwest - Fredonia
NOx Kilns 1 & 2 Mid-kiln firing Control device
energy requirements
10-30 years
0550023 Sunflower Electric - Holcomb
NOx Unit 1 LNB
1490001 Westar Energy - Jeffrey
NOx Unit 3 LNC3
0450014 Westar Energy - Lawrence
NOx Units 3 & 4 LNC1
1770030 Westar Energy - Tecumseh
NOx Unit 7 LNC1
1770030 Westar Energy - Tecumseh
NOx Unit 8 LNC3
Potential permitting issues,
reduction in electricity production capacity
30-50 years
SO2
0210002 Empire District Electric - Riverton
SO2 Unit 8 FGD wet scrubber
5-10 years
2090048 Kansas City BPU - Quindaro
SO2 Units 1 & 2 FGD wet scrubber
3-4 years following
SIP approval
Potential permitting & wastewater issues,
reduction in electricity production capacity
2090008 Kansas City BPU - Nearman
SO2 Unit 1 Semi-Dry scrubber
3-4 years following
SIP approval
Potential permitting issues,
reduction in electricity production capacity
1730012 Westar Energy - Gordon Evans
SO2 Unit 1 Fuel switching Currently feasible
—
1490001 Westar Energy - Jeffrey
SO2 Unit 3 FGD wet scrubber
1770030 Westar Energy - Tecumseh
SO2 Units 7 & 8 FGD wet scrubber
3-4 years following
SIP approval
Potential permitting & wastewater issues,
reduction in electricity production capacity
30-50 years

71
The two EGUs at Empire District - Riverton, Units 7 and 8, have startup dates of 1950 and 1954, respectively, and it is likely they will be retired before 2018. It is unknown why the IPM 3.0 future year modeling did not reflect this, but merely indicated reduced (controlled) SO2 emissions for Unit 7 starting in 2010. In addition, there is currently a question about Westar Energy’s ability to use wet scrubbers at its Jeffrey facility, which is comprised of Units 1 and 2 (subject to BART) and 3 (under scrutiny here), due to environmental concerns for wastewater sulfur levels.
Step 6: Source ranking The final step is source ranking, which is simply listing the sources from Step 5 in increasing order of cost per ton per deciview, and trimming the list at a natural break in the results, which occurred at $15,000 per ton per dv. The final ranked list is given below in Table 10.12.
Table 10.12 Ranked List of Sources under the Reasonable Progress Analysis
Rank Source
ID Facility
Emission
unit(s) Pollutant
Visibility
improvement
Cost per ton per
deciview
Dv $2002/ton-dv
1 1730012 Westar Energy - Gordon Evans
Unit 1 SO2 0.111 ($333)
2 1490001 Westar Energy – Jeffrey
Unit 3 SO2 0.705 $2,404
3 2090008 Kansas City BPU - Nearman
Unit 1 SO2 0.213 $9,502a
4 0450014 Westar Energy – Lawrence
Units 3, 4, & 5
NOx 0.099 $9,990
5 1770030 Westar Energy – Tecumseh
Units 7 & 8 NOx 0.037 $12,162
6 2090008 Kansas City BPU - Nearman
Unit 1 NOx 0.060 $12,383
7 1490001 Westar Energy – Jeffrey
Unit 3 NOx 0.114 $12,605
8 2057022 Lafarge Midwest – Fredonia
Kilns 1 & 2 NOx 0.006 $12,667
a Cost is based on 2006 dollars at Caney Creek. Hercules-Glades cost is $11,244 again in 2006 dollars.

72
10.3 Reasonable Progress Conclusions
The results of this process are described below. Kansas determined that controls or fuel switching on the sources listed below are reasonable and will result in significant visibility improvements at the Wichita Mountains Wilderness Area:
• Westar Energy – o Gordon Evans Unit 1 — Westar will implement fuel switching to natural
gas at all times, with the only exception being a gas curtailment order from the gas supplier, in which case the facility will be allowed to utilize backup #6 fuel oil.
o Jeffrey Unit 3 — Westar will install controls for both NOx and SO2. Emissions limits will be established at control levels of 0.15 lb/MMBtu for SO2 and 0.15 lb/MMBtu for NOx.
o Lawrence Units 3, 4, & 5, and Tecumseh Units 7/9 & 8/10 — Westar has agreed to controls or emission limits at each of these units and are outlined in Table 10.14 in section 10.4.3.3.
For the remaining facilities identified in the table above:
• BPU - Nearman Unit 1. This source primarily impacts the Class I areas in Missouri and Arkansas. Through the consultation process with Missouri and Arkansas it was determined that no additional controls beyond expected BART and on the books controls would be needed for the Class I areas in these states. However, with the vacatur of the Clean Air Interstate Rule (CAIR), an on the books rule covering many sources in Missouri and Arkansas, that occurred on July 11, 2008, and subsequent December 23, 2008, remanding of the case back to EPA without vacatur so that EPA could remedy CAIR’s flaws as were discussed in the courts July ruling, it may be necessary to revisit the consultation process with Missouri and Arkansas and reconsider whether controls on Nearman Unit 1 should be required. This consultation would occur once a final CAIR decision is made and would be initiated by Missouri and/or Arkansas.
• Lafarge Midwest - Fredonia Kilns 1 & 2- Kansas held a conference call with representatives from each of the four cement facilities in the State. A request for information was made for feedback regarding the technical feasibility and cost estimates for the controls identified by Alpine and AirControlNET. The 2018 estimates show a growth in emissions for three of the state’s facilities to be in the range of 40-60 % increases between 2002 and 2018. Industry representatives did not agree with these estimates. Additionally, information received from the information request raised concerns regarding design and lay-out constraints of some of the control technologies identified. These considerations combined with the small level of improvements in visibility gained by controls at this facility (0.006 dv for Wichita

73
Mountains), led to the decision not to require controls at this time. Additional technical and cost evaluations will be conducted during the five-year progress review.
Overall, the State expects to achieve reductions of approximately 11,500 tons/yr of reductions in NOx and 26,000 tons/yr of reductions in SO2 from the sources required to control as part of the regional haze reasonable progress goals. Table A10.3.1 in Appendix 10.3 shows the derivation for these values. CENRAP has also performed a control strategy run (discussed in Chapter 8) that included sources identified above along with several additional sources. This control run identified the following Kansas sources based on selection criteria approved by the CENRAP Policy Oversight Group (POG). The selection criteria and modeled controls can be found on the CENRAP website at http://www.cenrap.org/projects.asp. The Kansas sources identified are shown in Table 10.13 below.
Table 10.13 Kansas Sources Identified in the Control Strategy PSAT Run
Source ID Facility
Pollutant: NOx
2057022 Lafarge Midwest - Fredonia
0010009 Monarch Cement
0450014 Westar Energy - Lawrence
2090048 Kansas City BPU - Quindaro
1490001 Westar Energy - Jeffrey
0910057 AGC Flat Glass North America
0210002 Empire District - Riverton
1070005 KCP&L - La Cygne
2090008 Kansas City BPU - Nearman
0550023 Sunflower Electric - Holcomb
1250015 Heartland Cement
Pollutant: SO2
1770030 Westar Energy - Tecumseh
2090008 Kansas City BPU - Nearman
2090048 Kansas City BPU - Quindaro
2090049 Kansas City BPU - Kaw
Kansas City BPU - Kaw has been on cold stand-by since 2001 (Unit 1) and 2003 (Unit 3); Unit 2 was retired in 1992. Any additional controls required for this facility would be determined and implemented should the facility restart. The State of Kansas is currently finalizing a NOx Emission Reduction Rule as part of the implementation of the Kansas City Ozone Maintenance Plan (see section 10.4.3.1.9). The timeframe for implementation of the NOx Emission Reduction Rule will achieve emission

74
reductions sooner than would have been achieved under the Regional Haze Rule, therefore, we are not pursuing further NOx controls from the Nearman facility at this time. Kansas commits to review emissions changes and potential new technology developments that may apply to the sources identified above as part of the five-year progress report. If a determination is made that controls are feasible, cost-effective, and needed for visibility improvements, the State will explore additional controls at that time.
10.4 Long-Term Strategy Kansas is required by 40 CFR 51.308(d)(3) to submit a long-term strategy that addresses visibility impairment for each mandatory Class I Federal area within and outside the State which may be affected by emissions from within the State. The long-term strategy must include enforceable emissions limitations, compliance schedules, and other measures necessary to achieve the reasonable progress goals established by states where the Class I areas are located. This section describes how Kansas meets the long-term strategy requirements. 10.4.1 Share of Emission Reductions Kansas is required by 40 CFR 51.308(d)(3)(ii) to demonstrate that its implementation plan includes all measures necessary to obtain its fair share of emission reductions needed to meet reasonable progress goals. The technical analysis discussed in Chapter 10 demonstrates that the State’s long-term strategy, when coordinated with other state/tribes’ strategies, is sufficient to meet reasonable further progress goals.
10.4.1.1 Baseline Inventory Kansas is required by 40 CFR 51.308(d)(3)(iii) to identify the baseline inventory on which the long-term strategy is based. Kansas used the 2002 CENRAP Base G Emissions Inventory as its baseline inventory. See Table 7.1, Chapter 7. 10.4.2 Anthropogenic Sources of Visibility Impairment Kansas is required by 40 CFR 51.308(d)(3)(iv) to identify all anthropogenic sources of visibility impairment considered by the State in developing its long-term strategy. Appendix 7.1 provides the 2002 emissions inventory used in developing this SIP.
75
10.4.3 Factors the State Must Consider Kansas is required by 40 CFR 51.308(d)(3)(v) to consider several factors in developing its long-term strategy. These are discussed below.
10.4.3.1 Emission Reductions Due to Ongoing Air Pollution Programs
Kansas is required by 40 CFR 51.308(d)(3)(v)(A) to consider emission reductions from ongoing air pollution control programs. Kansas considered the following ongoing programs in developing its long-term strategy: on-board refueling vapor recovery (ORVR), on-board diagnostics (OBD), federal on-road and nonroad emission standards, low sulfur fuel standards, the Kansas City Ozone Maintenance Plan, the Clean Air Interstate Rule (CAIR), National Emission Standards for Hazardous Air Pollutants (NESHAP), and Agreements between the State and certain facilities.
Significant reductions in NOx, PM, and SO2 are expected due to existing and new federal standards for on-road and nonroad engines and fuels. 10.4.3.1.1 On-Board Refueling Vapor Recovery (ORVR)
In 1994, federal standards were promulgated requiring new vehicles to be equipped with on-board refueling vapor recovery (ORVR) technology. The phase-in of ORVR was completed as follows:
• Light duty vehicles (<6,000 lbs) began in 1998 and were completed in 2000
• Pickup trucks and SUVs (6,001-8,500 lbs) began in 2001 and were completed in 2003
• Heavy duty vehicles (8,501-10,000lbs) began in 2004 and will be completed with the 2006 model year
10.4.3.1.2 On-Board Diagnostics (OBD)
The first version of On-Board Diagnostic systems (OBD I) was implemented in 1988. A second version (OBD II) was developed to expand on the earlier technology. The Clean Air Act Amendments of 1990 mandated that beginning in 1996, all light-duty cars and trucks be equipped with OBD II systems. Beginning in the model year 2004, all medium duty vehicles weighing up to 14,000 pounds were also required to be equipped with OBD II. Beginning with the model year 2010, all heavy-duty vehicles weighing over 14,000 pounds are required to be equipped with OBD II.
10.4.3.1.3 Tier 2 Vehicle and Gasoline Sulfur Program
Under the Tier 2 program, which was adopted in 1999, new emission standards were developed for passenger cars, light duty trucks, and larger passenger vehicles which were placed in a new classification called “medium-duty passenger vehicles.” The medium-duty vehicles include pick-up trucks, sports utility vehicles (SUVs), and vans. The phase-in of new standards began with model year (MY) 2004, and was completed in MY 2007 for cars and light-duty trucks, and in

76
2008 for medium-duty vehicles. By 2007, the emission limit for NOx was 0.07 grams per mile (g/mi). In addition to more stringent emission standards for vehicles, the Tier 2 program also required reductions in sulfur levels in gasoline to be phased in between the years 2000 and 2006. The sulfur levels in gasoline were capped at 300 parts per million (ppm) and limited to an average of 120 ppm in 2004, and by 2006 the cap was lowered to 80 ppm with a limit on average sulfur levels of 30 ppm.
10.4.3.1.4 Clean Air On-Road Diesel Rule (2007 Highway Rule)
In December of 2000, the EPA promulgated the Clean Air On-Road Diesel Rule, also called the 2007 Highway Rule. The rule has two components, emission standards and diesel fuel regulation. The new emission standards include limits on PM, NOx, and non-methane hydrocarbons (NMHC). The PM standard took effect in the 2007 model year, while the NOx and NMHC standards will be phased in between 2007 and 2010. The diesel fuel regulation limits the sulfur content in on-highway diesel fuel to 15 ppm. Ultra low sulfur diesel fuel became available nationwide in October 2006.
10.4.3.1.5 Clean Air Nonroad Diesel Rule
The first federal standards (Tier 1) for new nonroad diesel engines over 50 horsepower (hp) were adopted in 1994 and were phased in between 1996 and 2000. In 1998 EPA finalized a new rule, which applied Tier 1 to equipment under 37 hp and applied more stringent Tier 2 and Tier 3 standards to all equipment with phase-in schedules between 2000 and 2008. The Tier 1–3 standards consisted primarily of engine design standards, with no or very limited use of exhaust after-treatment. In May 2004, EPA finalized the Clean Air Nonroad Diesel Rule, also known as Tier 4 standards. Tier 4 standards will be phased in over the period of 2008 to 2010, and will consist of exhaust after-treatment (oxidation catalysts) and other control technologies. Another component of the Tier 4 standards will reduce the sulfur content of nonroad diesel fuel to enable the use of sulfur-sensitive control technology. The sulfur content was to be reduced to 500 ppm by June 2007 and reduced to 15 ppm by June 2010. When fully implemented, the Tier 4 standards are expected to reduce NOx and PM emissions by 90%.
10.4.3.1.6 Locomotive Emission Standards
The first emission standards regulating locomotive engines (Tier 0-2) were adopted in 1997. The Tier 0-2 standards regulated the emission of NOx, PM, CO, and hydrocarbons (HC) for new engines or any engine built after 1973 being remanufactured. The rule became effective in 2000 and was implemented by the following schedule:
• Tier 0 standards applied to locomotive engines built between 1973 and 2001
• Tier 1 standards applied to engines built between 2002 and 2004
• Tier 2 standards applied to engines built in 2005 and later years On March 2, 2007, EPA published a proposed ruling for locomotives and marine engines. The proposed rule would require stricter emission standards for locomotives being remanufactured starting in 2010. The rule also established Tier 3 standards for newly built locomotive and diesel

77
marine engines starting in 2009. Tier 4 standards, which require exhaust after-treatments, will become effective for marine engines in 2014 and for locomotives in 2015.
10.4.3.1.7 Large Spark-Ignition and Recreational Vehicle Rule
In 2002, EPA adopted new standards for emissions of NOx, HC, and carbon monoxide (CO) from several groups of previously unregulated nonroad engines, including spark-ignition (SI) engines powered by: gasoline, liquid propane gas and compressed natural gas rated over 19 kilowatts (kW), snowmobiles, off-highway motorcycles, all terrain vehicles, and diesel marine engines over 37 kW. The emission standards were phased in between 2004 and 2007.
10.4.3.1.8 Proposed Emission Standards for New Nonroad Small Spark-Ignition Engines, Equipment, and Vessels
In April 2007, EPA released proposed exhaust emission standards for marine spark-ignition engines and small land-based nonroad engines. The new standards apply to SI nonroad engines rated below 25 horsepower (19 kW) used in household and commercial applications, including lawn and garden equipment, utility vehicles, generators, and a variety of other construction, farm, and industrial equipment. The new standards also apply to spark-ignition engines used in marine vessels, including outboard engines, personal watercraft, and stern-drive/inboard engines. For SI nonroad engines, the EPA proposed HC+NOx exhaust emission standards of 10 g/kW-hr for Class I engines starting in the 2012 model year and 8 g/kW-hr for Class II engines starting in the 2011 model year. The proposed standards for SI marine engines above 40 kW are 16 g/kW-hr for HC+NOx and 200 g/kW-hr for CO. For marine engines below 40 kW, the standards increase gradually based on the engine’s maximum power. The new standards include requirements to control fuel tank permeation, fuel line permeation, and diffusion emissions for nonroad and marine engines.
10.4.3.1.9 Kansas City Ozone Maintenance Plan
The Kansas City Maintenance Area (KCMA) is currently designated as an attainment area for the 8-hour ozone standard and as a maintenance area under the previous 1-hour ozone standard. Based on these designations, the KCMA is required to have a maintenance plan under Section 110(a)(1) of the Clean Air Act (CAA) and the provisions of the EPA’s Phase 1 Implementation Rule for the 8-hour Ozone Standard (40 CFR Section 51.905(a)(3) and (4)). KDHE prepared a maintenance plan to meet all of the requirements for the 8-hour ozone standard for its portion of the KCMA.
The 8-hour ozone maintenance plans constitute revisions to the State Implementation Plans and provide for continued maintenance of the 8-hour ozone standard for a period of 10 years, ending in 2014. The plans also provide contingency control measures to be implemented if a violation of the 8-hour ozone standard occurs. On June 15, 2007, one of the monitors in the KCMA registered an 8-hour average ozone concentration in exceedance of the ozone standard, thereby violating the standard. The contingency measures will be implemented in two phases.
The control measure in Phase I, Measure #1, is to reduce NOx emissions from point sources in Johnson and Wyandotte counties. This will be implemented via a new set of Kansas

78
Administrative Regulations, K.A.R. 28-19-713 through 28-19-713d. These new regulations will affect a total of three facilities in Johnson and Wyandotte counties. Two are power generating facilities, and the remaining one is a flat glass manufacturing plant. The two power generating facilities are Nearman Creek Power Station and Quindaro Power Station, both of which are owned by the Kansas City Board of Public Utilities (BPU), and located in northeastern Wyandotte County. When K.A.R. 28-19-713 through 28-19-713d are implemented, the combined NOx emissions from these two sources will be reduced by approximately 2,948 tons/year (8.08 tons/day). The flat glass manufacturing facility is AGC Flat Glass North America, located near Spring Hill in southern Johnson County. When K.A.R. 28-19-713 through 28-19-713d are implemented, emissions are projected to be reduced by approximately 292 – 487 tons/year (0.8 – 1.33 tons/day), depending on the control technology implemented. The control measure in Phase I, Measure #2, is to reduce idle time of heavy-duty diesel vehicles in Johnson and Wyandotte counties. This will also be implemented via a new set of Kansas Administrative Regulations, K.A.R. 28-19-712 through 28-19-712d. These new regulations will apply to all owners and operators of commercial, public and institutional diesel vehicles in Johnson and Wyandotte counties having a gross vehicle weight rating greater than 14,001 pounds. In the event that technical feasibility or other conditions change after the submittal date of this SIP that would result in any of the Phase I contingency measures not being able to be implemented, the State of Kansas will evaluate the need to propose alternate measures that would result in equivalent or greater emissions reductions. The EPA’s desired timeline for adoption and implementation of control measures is as expeditious as practicable, but no longer than 24 months. It is anticipated that all of these control measures can meet the desired timeframe. Control options being considered for the Kansas portion of the KCMA for Phase II include:
• Reductions in NOx emissions from point sources >100 tons of actual annual emissions from the entire facility averaged over the last three years of complete, quality assured inventory data from Wyandotte and Johnson Counties. This would be accomplished through either NOx Emission Reduction Rules or signed agreements with the affected sources.
• Reduction in NOx emissions from point sources >1000 tons of actual annual emissions from the entire facility averaged over the last three years of complete, quality assured inventory data in areas located south of the KCMA (Miami and Linn Counties). Based on the current emissions inventory, this would affect two sources. Because of this fact, these two counties would not be incorporated into the KCMA. This would be accomplished through either a regional NOx administrative regulation or signed agreements with the affected sources.
• Open burning restrictions in Wyandotte and Johnson Counties

79
• Lower threshold for major sources of VOC, to 75 tons/yr in Wyandotte and Johnson Counties. KDHE would evaluate remaining large VOC emitters subject to existing VOC RACT rules to determine if further reductions could be achieved. (VOC RACT rules can be found at K.A.R. 28-19-63–74, -76, -77, -714, -717, and -719.)
• VOC control for 46 sources associated with the source classification code Architectural and Industrial Maintenance Coatings, including traffic coatings in Wyandotte and Johnson Counties.
• Diesel engine chip re-flash regulation in Wyandotte and Johnson Counties Control measures will be selected from the above list based on emission reduction benefits, cost effectiveness, and timeframe of implementation. In order to aid in determining the most beneficial control measures, photochemical modeling may be used as a tool for evaluation. Adoption and implementation of controls shall take place no later than 18–24 months after KDHE makes a determination, based on quality-assured ambient data, that a trigger established by this plan has been exceeded.
10.4.3.1.10 Clean Air Interstate Rule
At the onset of the regional haze consultation process, states relied heavily on the Clean Air Interstate Rule (CAIR), a rule that addresses the interstate transport of air pollution to downwind states. CAIR covered 28 eastern states plus the District of Columbia, and would have reduced SO2 emissions by an estimated 5.4 million tons and NOx emissions by an estimated 2 million tons by 2015. Affected states had the choice of either meeting the state’s emission budget by requiring power plants to participate in a cap and trade system, or by means of a measure of the state’s choosing. Although Kansas was not included in the final CAIR rulemaking, the rule was a major component in the underlying assumptions used to determine source apportionment because of the reductions expected in neighboring states with Class I areas. In July 2008, the D.C. District Court of Appeals vacated the CAIR rule in its entirety. On September 24, 2008 EPA filed a petition for rehearing or for a remand of the case without vacatur. On December 23, 2008, the D.C. District Court of Appeals remanded the case to EPA without vacatur so that EPA could remedy CAIR’s flaws as were discussed in their July ruling. At this time, it is unclear what the ramifications of this decision may be to the regional haze program. Kansas will continue to engage with states in the CENRAP region and will participate in future consultation processes if necessary to address reasonable progress goals at Class I areas. 10.4.3.1.11 NESHAP MACT Standards
National Emission Standards for Hazardous Air Pollutants (NESHAP) have been promulgated in recent years that will not only achieve reductions in hazardous air pollutants (HAPs), but will also reduce visibility impairing pollutants such as SO2, NOx, and PM. Emission standards for stationary reciprocating internal combustion engines (RICE) and industrial, commercial, and

80
institutional boilers are NESHAP’s most notable Maximum Achievable Control Technology (MACT) standards related to reductions in pollutants contributing to regional haze. Additional MACT-related reductions are also expected from the following industries in Kansas: cellulose products manufacturing, hazardous waste combustion, and secondary aluminum production. 10.4.3.1.12 Kansas City Power & Light (KCP&L) Collaboration Agreement
On January 31, 2006, the MoDNR issued a Prevention of Significant Deterioration (PSD) permit for KCP&L’s Iatan project, which included the installation of new pollution control technology on Iatan Unit 1, to set a permit limit on the heat input rate of Iatan Unit 1, and to construct a second pulverized coal-fired boiler (Iatan Unit 2). Upon issuance of the PSD permit, the Sierra Club filed a complaint with the Missouri Air Conservation Commission (MACC) to appeal the issuance of the Iatan PSD permit, urging that the MDNR require more stringent emission limits at Iatan Units 1 and 2. On March 19, 2007, KCP&L signed a collaboration agreement with the Sierra Club and the Concerned Citizens of Platte County. As part of the agreement, KCP&L agreed to more stringent emission limits for Iatan Units 1 and 2 for NOx, SO2, opacity, and sulfuric acid. The emission limits that relate to regional haze purposes are as follows: • Iatan Unit 1
o NOx – 0.09 lbs/MMBtu, based on a 30-day rolling average o SO2 – 0.07 lbs/MMBtu, based on a 30-day rolling average
• Iatan Unit 2 o NOx – 0.07 lbs/MMBtu, based on a 30-day rolling average o SO2 – 0.06 lbs/MMBtu, based on a 30-day rolling average
In addition to tighter controls at Iatan, KCP&L agreed to accept emissions limits for their two BART-eligible units at La Cygne, Kansas (La Cygne Units 1 and 2) that will be lower than presumptive limits in the Regional Haze Rule for NOx, SO2, filterable PM10, and total PM10. These emission limits are as follows:
• NOx – 0.13 lbs/MMBtu, based on a 30-day rolling average, excluding periods of startup and shutdown
• SO2 – 0.1 lbs/MMBtu, based on a 30-day rolling average, excluding periods of startup and shutdown
• PM10 (filterable) – 0.015 lbs/MMBtu, based on either an average of 3 one-hour stack tests annually, or a Continuous Assurance Monitoring (CAM) plan before baghouses go online
• PM10 (total) – 0.024 lbs/MMBtu, based on either an average of 3 one-hour stack tests annually, using EPA Method 202 or a CAM plan before baghouses go online
10.4.3.1.13 Visibility Requirements under the New Source Review Program
Section 40 CFR 52.21(o) requires owners or operators of new major sources or modifications to provide an analysis of visibility impairment as part of the prevention of significant deterioration process. New sources or modifications also require notification and consultation with federal

81
land managers (FLMs) of Class I areas which may be affected. Kansas has adopted the federal regulation by reference at K.A.R. 28-19-350.
10.4.3.2 Measures to Mitigate the Impacts of Construction Activities
Kansas is required by 40 CFR 51.308(d)(3)(v)(B) to consider measures to mitigate the impacts of construction activities. When EPA first promulgated the Regional Haze Rule in 1999, emissions related to construction activities such as windblown dust and nonroad diesel engines were a major concern. This was especially a problem in rapidly growing metropolitan areas such as Los Angeles and Phoenix. Construction activities are directly related to population growth. Kansas has not experienced rapid growth and is not forecasted to in the future. Figure 10.4 below shows the population growth for Kansas between the years of 1980 and 2005, with projected figures out to 2020 appearing in red triangles (9). Between the years 1990 and 2000, over half of Kansas counties underwent a decline in population, mostly in rural counties but also in parts of the Kansas City metropolitan area (10). Population growth is projected to remain at a steady pace and construction activities are not expected to cause a significant impact to visibility. In fact, construction permitting in Kansas and new regulations on diesel equipment will achieve reductions in the future. Construction projects in Kansas that disturb one acre or more are required to obtain a general permit under the National Pollutant Discharge Elimination System (NPDES). The permitting program was implemented to protect the waters of the State from sediment and other contaminants, and may also reduce the amount of particulate matter emissions from these activities.
Figure 10.4 Population Growth for the State Of Kansas 1980-2005 and Projected Growth 2010-
2020
Kansas Population (in thousands)
0
500
1,000
1,500
2,000
2,500
3,000
3,500
1980 1985 1990 1995 2000 2005 2010 2015 2020
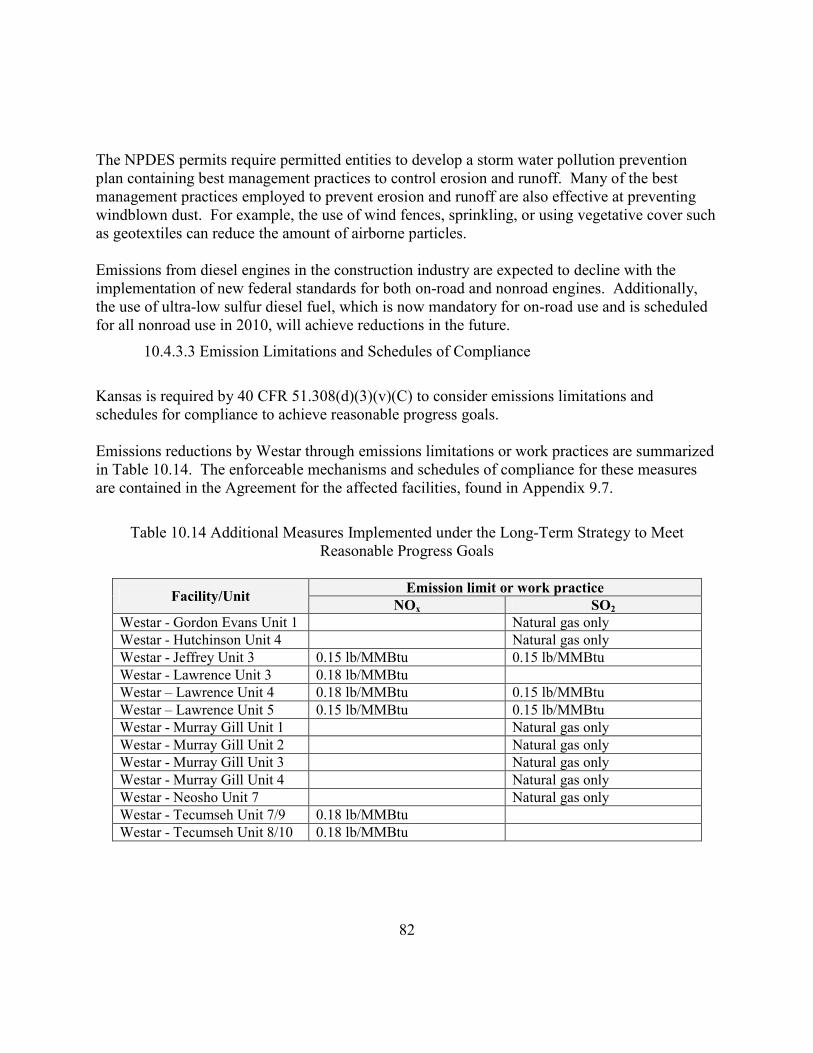
82
The NPDES permits require permitted entities to develop a storm water pollution prevention plan containing best management practices to control erosion and runoff. Many of the best management practices employed to prevent erosion and runoff are also effective at preventing windblown dust. For example, the use of wind fences, sprinkling, or using vegetative cover such as geotextiles can reduce the amount of airborne particles. Emissions from diesel engines in the construction industry are expected to decline with the implementation of new federal standards for both on-road and nonroad engines. Additionally, the use of ultra-low sulfur diesel fuel, which is now mandatory for on-road use and is scheduled for all nonroad use in 2010, will achieve reductions in the future.
10.4.3.3 Emission Limitations and Schedules of Compliance
Kansas is required by 40 CFR 51.308(d)(3)(v)(C) to consider emissions limitations and schedules for compliance to achieve reasonable progress goals. Emissions reductions by Westar through emissions limitations or work practices are summarized in Table 10.14. The enforceable mechanisms and schedules of compliance for these measures are contained in the Agreement for the affected facilities, found in Appendix 9.7.
Table 10.14 Additional Measures Implemented under the Long-Term Strategy to Meet
Reasonable Progress Goals
Emission limit or work practice Facility/Unit
NOx SO2
Westar - Gordon Evans Unit 1 Natural gas only
Westar - Hutchinson Unit 4 Natural gas only
Westar - Jeffrey Unit 3 0.15 lb/MMBtu 0.15 lb/MMBtu
Westar - Lawrence Unit 3 0.18 lb/MMBtu
Westar – Lawrence Unit 4 0.18 lb/MMBtu 0.15 lb/MMBtu
Westar – Lawrence Unit 5 0.15 lb/MMBtu 0.15 lb/MMBtu
Westar - Murray Gill Unit 1 Natural gas only
Westar - Murray Gill Unit 2 Natural gas only
Westar - Murray Gill Unit 3 Natural gas only
Westar - Murray Gill Unit 4 Natural gas only
Westar - Neosho Unit 7 Natural gas only
Westar - Tecumseh Unit 7/9 0.18 lb/MMBtu
Westar - Tecumseh Unit 8/10 0.18 lb/MMBtu
83
10.4.3.4 Source Retirement and Replacement Schedules
Kansas is required by 40 CFR 51.308(d)(3)(v)(D) to consider source retirement and replacement schedules in developing reasonable progress goals. The Integrated Planning Model (IPM) runs projected the closure of several gas-fired boilers in Kansas. However, communication with owners of these sources revealed that these projections are incorrect. Kansas is aware of two coal-fired EGU sources that could potentially be retired within the next 10 years. The first, Kansas City BPU - Kaw, has two units that have been on cold stand-by since 2001 (Unit 1) and 2003 (Unit 3). Unit 2 was retired in 1992. This source would be subject to existing SIP requirements pertaining to PSD permitting should BPU decide to restart. In addition, as part of its long-term planning process, BPU is evaluating options for adding new capacity and may decide to retire another existing facility in the future. The second source, Empire District Electric - Riverton Units 7 and 8, have startup dates of 1950 and 1954, respectively, and will likely be retired before 2018. Beyond these two sources, Kansas is not aware of additional sources scheduled for retirement or replacement. Any additional sources that retire or are replaced will be managed in conformance with the existing Kansas SIP requirements pertaining to PSD and NSR permitting.
10.4.3.5 Agricultural and Forestry Smoke Management
Kansas is required by 40 CFR 51.308(d)(3)(v)(E) to consider smoke management techniques for the purposes of agricultural and forestry management in developing reasonable progress goals. Kansas will work to implement smoke management techniques to address rangeland burning. See Appendix 10.4 for Kansas Prescribed Fire Emissions.
10.4.3.6 Enforceability of Emission Limitations and Control Measures Kansas is required by 40 CFR 51.308(d)(3)(v)(F) to ensure that emission limitations and control measures used to meet reasonable progress goals are enforceable. Kansas has ensured that all emission limitations and control measures are enforceable by embodying these in the Agreements found in Appendix 9.7. The agreements contain the applicable emission limits and compliance schedules, which will be federally enforceable upon EPA’s approval of this SIP. The emissions limits and compliance verification requirements will be incorporated into each facility’s Title V operating permit when they are reopened or approved.
10.4.3.7 Anticipated Net Effect on Visibility Resulting from Projected Changes to Emissions
Kansas is required by 40 CFR 51.308(d)(3)(v)(G) to address the net effect on visibility resulting from changes projected in point, area, and mobile source emissions by 2018. The 2002 to 2018 projected visibility improvement at the nine Class I areas selected for analysis and discussed in Chapter 8 will, for the State of Kansas, result chiefly from the implementation of NOx and SO2 controls on the five electric generating units (EGUs) subject to BART. These

84
projected visibility improvements are shown in Table 10.15, based on the ENVIRON PSAT tool, and shown in terms of light extinction. The impact on the Wichita Mountains from Kansas sources is expected to be reduced by 1.03715 Mm-1, which represents a 23% change in Kansas’ impact on the Wichita Mountains between 2002 and 2018. Further improvement will come from the “beyond-BART” controls at sources referred to in Chapter 10. Table 10.15 Net 2002 to 2018 Improvement in Visibility at Selected Class I Areas Due to BART
Controls in Kansas
Class I area Net 2002-2018 light extinction difference
(improvement) from Kansas sources (Mm-1)
Caney Creek (Arkansas) 0.63493
Upper Buffalo (Arkansas) 0.44533
Great Sand Dunes (Colorado) 0.03322
Rocky Mountain (Colorado) 0.06051
Hercules-Glades (Missouri) 0.56911
Mingo (Missouri) 0.58719
Wichita Mountains (Oklahoma) 1.03715
Badlands (South Dakota) 0.12856
Wind Cave (South Dakota) 0.16741
List of Chapter 10 Appendices 10.1 PSAT Tool-Generated Tables 10.2 2018 Visibility Projections for CENRAP Class I Areas (TSD Appendix D) 10.3 Calculations for Emissions Reductions for Kansas Reasonable Progress Goals 10.4 Kansas Prescribed Fire Emissions

85
11. Consultation
Kansas does not contain any Class I Areas. Kansas participated in state consultation processes with Arkansas, Missouri, Texas, and Oklahoma. A summary of these consultation processes is given below. In each case, the states established a threshold to determine whether neighboring states would be expected to contribute emissions reductions for meeting their Class I areas’ reasonable progress goals. Kansas fell below the established thresholds for all but one Class I area. Kansas is anticipated to contribute to visibility impairment at the Wichita Mountains Wilderness Area in Oklahoma. 11.1 Consultation Kansas is required by 40 CFR 51.308(d)(3)(i) to consult with other states/tribes to develop coordinated emission strategies. This requirement applies both where emissions from the state are reasonably anticipated to contribute to visibility impairment in Class I areas outside the state and when emissions from other states/tribes are reasonably anticipated to contribute to visibility impairment in Class I areas within the state/tribe. Kansas consulted with other states and tribes by participation in CENRAP in an effort to develop coordinated strategies to meet reasonable progress goals. In addition, Kansas participated in discussions focused on Class I areas in Arkansas, Missouri, Texas, and Oklahoma. Following is a summary of the calls, and the conclusions reached through the consultation process. 11.1.1 Arkansas and Missouri
The States of Arkansas and Missouri elected to combine their consultation processes for the central Class I areas contained within their boundaries:
• Caney Creek Wilderness Area (Arkansas)
• Upper Buffalo Wilderness Area (Arkansas)
• Hercules Glades Wilderness Area (Missouri)
• Mingo Wilderness Area (Missouri) Arkansas and Missouri developed a consultation plan in which they outlined the consultation process and timeline, described the methodology for determining the significantly contributing states, and delineated the roles and responsibilities of the various agencies involved in the consultation process. Three conference calls were scheduled to facilitate consultation, and were held on April 3, May 11, and June 7, 2007.
Arkansas and Missouri’s consultation plan included a methodology in which three criteria were used to determine whether a neighboring state significantly contributes to visibility impairment at on or more of the Class I areas listed above. If any state was indicated in two of the three criteria, they were determined to be significant contributors. A fourth index, quantity of emissions over distance (Q/d), was also used for informational purposes. The states of Arkansas
86
and Missouri did not request emission reduction commitments from the State of Kansas beyond its BART reductions. 11.1.2 Texas
The State of Texas contains the following Class I areas:
• Big Bend National Park
• Guadalupe Mountains National Park Texas initiated their consultation process in July 2007, with three conference calls that took place on July 11, 18, and 31. Texas developed and distributed a series of technical papers before the calls, outlining their positions on the estimation of natural conditions, uniform rate of progress, IPM, and reasonable progress. Of particular interest to Kansas, Texas Commission on Environmental Quality (TCEQ) staff have recommended that course mass and fine soil contributions to haze be considered natural (i.e., non-anthropogenic), and therefore held constant when projecting to 2018. In addition, TCEQ staff intends to present two glide slopes for each Class I area in their Regional Haze SIP. The first would be a standard glide slope with a 2064 target of natural visibility conditions at the Class I areas; the second glide slope would have a target of zero U.S. anthropogenic contribution by 2064. TCEQ chose a threshold of 3% total contribution to light extinction at their two Class I areas for determining which states would participate in consultation. Although Kansas contributed slightly more than 3% at Guadalupe Mountains (3.21%), over 50% of that impact can be attributed to soil and coarse mass, which are being discounted by Texas as non-anthropogenic sources. Texas informed Kansas that it will not expect Kansas to contribute emissions reductions for meeting their Class I areas’ reasonable progress goals for the first planning period beyond the BART reductions for Kansas included in the PSAT modeling. 11.1.3 Oklahoma
The State of Oklahoma contains the Wichita Mountains Wilderness Area. Oklahoma initiated the process of consultation for Wichita Mountains in August 2007, with a series of conference calls. Oklahoma distributed their consultation plan, which included an overview of the consultation objectives, technical information used to identify contributing states, and outlined the roles and responsibilities of each of the participants in the consultation process. Kansas participated in calls held by Oklahoma on August 14, August 30, and September 13, 2007.
Instead of using percent total extinction, Oklahoma selected a threshold of absolute extinction from all sources and particulate species greater than 1.0 Mm-1 to determine which states should participate in their consultation process. Kansas’ overall 2018 absolute extinction contribution to Oklahoma’s Wichita Mountains Wilderness Area is projected to be 3.53 Mm-1 (and percent extinction to be 4.90%), which Kansas recognizes as a potentially significant impact to visibility at that Class I area.

87
In applying the criteria for meeting reasonable progress goals at Wichita Mountains, Oklahoma identified three Kansas facilities that they concluded had the potential to impact visibility in the Wichita Mountains. The Kansas sources identified are listed in the table below.
Table 11.1 Kansas Sources Identified by Oklahoma as Potentially Impacting Visibility at Wichita Mountains
Source ID Facility / Emission Units
1
0450014 Westar Energy - Lawrence Units 3, 4, and 5
0550023 Sunflower Electric - Holcomb Unit 1 (and proposed Units 2 and 3)
1490001 Westar Energy – Jeffrey Unit 3 (Units 1 and 2 are already subject to BART) 1 Oklahoma named only facilities; unit information is supplied editorially These three sources were identified for potential NOx impacts only, since one of the selection criteria used by Oklahoma was the “area of influence” (AOI) tool, a source contribution mapping tool developed by CENRAP contractor Alpine Geophysics prior to PSAT, and based largely on back trajectory analysis. The Wichita Mountains AOI for nitrates runs along or through 72 counties, more or less through the center of Kansas. Only 4 counties in extreme southeast Kansas lie along or inside the AOI boundary for sulfates. Thus, nearly all the candidate Kansas sources considered by Oklahoma at the start of their analysis were large NOx emitters. All three of these sources have also been addressed in Kansas’ own analysis of reasonable progress, described in Chapter 10. As part of the first consultation call, Oklahoma requested any additional information Kansas could provide on potential visibility impacts, control applicability—both technical feasibility and costs for controls, future life of source, and any known or projected growth. Kansas provided this information on August 24, 2007. Information provided included CALPUFF modeling Kansas performed on the sources for prior regional haze purposes, along with CALPUFF and CAMx modeling that was performed as part of a visibility analysis for a proposed expansion at Sunflower Electric - Holcomb. A summary of that information follows.
Sunflower Electric Power had planned to build two 700 MW EGUs alongside their current 349 MW EGU (Unit 1), located in Holcomb, Kansas. Current plans now call for one 895 MW coal-fired power plant to be constructed in Holcomb. Emissions from the existing boiler are controlled by low NOx burners, a spray dry absorber scrubber and a low ratio, reverse-air baghouse. The existing boiler is permitted to burn Powder River Basin (PRB) coal. Sunflower proposes to install Holcomb Unit 2, a supercritical 895 MW pulverized coal-fired boiler. The existing coal, lime, and ash handling equipment with the addition of equipment to double throughput capability will be utilized. The Holcomb Unit 2 boiler will fire PRB subbituminous coal and low-sulfur bituminous coal as primary fuel and natural gas as a backup fuel.
Kansas performed CAMx PSAT modeling on this expansion as originally proposed (three 700MW EGUs), relying on the 2002 Base F CENRAP emissions datasets, along with the 2002 MM5 dataset to perform the CAMx modeling (see Appendix 11.1). Version 4.42 of CAMx was used with the PSAT/OSAT “point source override” feature. The worst-case normal operating
88
rate, excluding startups, shutdowns, malfunctions, and maintenance activities, was modeled. It was determined that the rates would be 0.09 lb/MMBtu for SO2 and 0.05 lb/MMBtu for NOx for each unit. Because these two pollutants dominate the visibility impacts, no other pollutants were modeled. CAMx requires emissions to be speciated and expressed in moles per hour; therefore, the emissions rates used in CAMx were NO - 5,769 moles/hr, NO2 - 641 moles/hr, and SO2 - 12,427 moles/hr (note this represents all three initially proposed units operating - Sunflower is now only proposing one 895 MW unit). Results of the modeling indicated a maximum visibility impact at the Wichita Mountains Class I area of 0.47 delta deciview.
In addition to the CAMx modeling review, Sunflower Electric was required to submit a FLAG visibility analysis to the State as part of the permit application. This analysis included both a CALPUFF Method 2 and Method 6 evaluation of the visibility impacts. The method 2 results indicated a maximum 30.6 % extinction in the Wichita Mountains. The method 6 results indicated a 98% impact of 0.331 delta deciview. The maximum Method 6 impact was 1.107 delta deciview. The source concluded, and Kansas concurred, that the proposed Holcomb expansion is not expected to adversely affect the visibility at the Wichita Mountains. A full description of modeling and results can be found in Appendix 11.2.
In summary, Kansas has not yet been asked by any other state to reduce emissions beyond those required under BART during the consultation processes. However, going into the consultation process, modeling provided by CENRAP indicated that Class I areas in both Texas and Oklahoma were being impacted by Kansas emissions. These states, and perhaps others impacted by the vacatur of the Clean Air Interstate Rule (CAIR), may be required to request additional emission reductions from Kansas in the future. Certainly, additional emission reductions from Kansas sources will be the subject of consultation discussions in the future. List of Chapter 11 Appendices 11.1 Sunflower Visibility Analysis Performed by KDHE 11.2 Holcomb Class I Visibility Modeling Report

89
12. Plan Revisions and Progress Reports
Kansas is required by 40 CFR 51.308(f) to revise its regional haze implementation plan and submit a plan revision to EPA by July 31, 2018, and every ten years thereafter. In accordance with the requirements listed in 40 CFR 51.308(f) of the federal rule for regional haze, Kansas commits to revising and submitting this regional haze implementation plan by July 31, 2018 and every ten years thereafter.
In addition, 40 CFR 51.308(g) requires periodic reports evaluating progress towards the reasonable progress goals established for each mandatory Class I area. In accordance with the requirements listed in 40 CFR 51.308(g) of the federal rule for regional haze, Kansas commits to submitting a report on reasonable progress to EPA every five years following the initial submittal of the SIP. The report will be in the form of a SIP revision. The reasonable progress report will evaluate the progress made towards the reasonable progress goal for each mandatory Class I area located outside Kansas, which may be affected by emissions from within Kansas. All requirements listed in 40 CFR 51.308(g) shall be addressed in the SIP revision for reasonable progress. The first five-year progress report will be completed by October 26, 2014.

90
13. Determination of the Adequacy of the Existing Plan
Depending on the findings of the five-year progress report, Kansas commits to taking one of the actions listed in 40 CFR 51.308(h). The findings of the five-year progress report will determine which action is appropriate and necessary. List of Possible Actions – 40 CFR 51.308(h)
1) Kansas would determine that the existing SIP required no further substantive revision in order to achieve established goals. Kansas would provide to the Administrator a declaration that further revision of the SIP will not be needed at that time.
2) Kansas would determine that the existing SIP may be inadequate to ensure reasonable progress due to emissions from other states which participated in the regional planning process. Kansas would provide notification to the Administrator and the states that participated in regional planning. Kansas would collaborate with states through the regional planning process to address the SIP’s deficiencies.
3) Kansas would determine that the existing SIP may be inadequate to ensure reasonable progress due to emissions from another country. Kansas would provide notification, along with available information, to the Administrator.
4) Kansas would determine that the existing SIP is inadequate to ensure reasonable progress due to emissions within Kansas. Kansas would revise its SIP to address the plan’s deficiencies within one year.
91
14. Reference Information
14.1 List of References
1. Protecting Visibility in National Parks and Wilderness Areas. National Research Council. Washington, DC: 1993. 2. Guidance for Estimating Natural Visibility Conditions under the Regional Haze Rule.
U.S. Environmental Protection Agency. Research Triangle Park: 2003. 3. Trijonis, J., et. al. Visibility: Existing and Historical Conditions- Causes and Effects.
State of the Science/Technology Report 24, Volume III of the National Acid Precipitation Assessment Program. Washington DC: 1990.
4. Analysis of the Causes of Haze for the Central States Phase II. Sonoma Technology, Inc. Petaluma: 2005.
5. Anthes, R.A. and T.T. Warner. 1978. Development of Hydrodynamic Models Suitable for Air Pollution and Other Mesometeorological Studies. Monthly Weather Review, 106, 1045-1078.
6. Guidance for Setting Reasonable Progress Goals under the Regional Haze Rule. US Environmental Protection Agency. Research Triangle Park: 2007.
7. Petroleum Marketing Monthly February 2007. Energy Information Administration. Accessed online: http://www.eia.doe.gov/pub/oil_gas/petroleum/data_publications/petroleu m_marketing_monthly/historical/2007/2007_02/pdf/pmmall.pdf
8. Consumer Price Index: All Urban Consumers, US City Average. Bureau of Labor and Statistics. Accessed online: http://www.bls.gov/cpi/
9. U.S. Census Bureau. 2007 Statistical Abstract. 10. U.S. Census Bureau. County and City Data Book, 2000.
14.2 List of Acronyms and Abbreviations A/F Air/fuel (adjustment) AERR Air Emissions Reporting Rule AIRS Aerometric Information Retrieval Systems AOI Area of influence AQS Air Quality System BART Best available retrofit technology Bcf Billion cubic feet BPU (Kansas City) Board of Public Utilities CAA Clean Air Act CAIR Clean Air Interstate Rule CAMx Comprehensive Air Quality Model with extensions CASTNet Clean Air Status and Trends Network CEMS Continuous emissions monitor CENRAP Central Regional Air Planning Association
92
CM Coarse mass CMAQ Community Multiscale Air Quality CO Carbon monoxide dv Deciview EC Elemental carbon EGAS Economic Growth Analysis System EGU Electric generating units EPA United States Environmental Protection Agency FCCU Fluid-bed catalytic cracking unit FGD Flue gas desulfurization FGR Flue gas recirculation FLM Federal land managers FOFEM First Order Fire Effects Model GCVTC Grand Canyon Visibility Transport Commission GVWR Gross vehicle weight rating IMPROVE Interagency Monitoring of Protected Visual Environments IPM Integrated Planning Model IR Ignition retard LNB Low NOx burner LNBO Low NOx burner with overfire air LNC1 Low NOx coal-and-air nozzles with cross-coupled overfire air LNC3 Low NOx coal/air nozzles with close-coupled and separated overfire air LTS Long term strategy MACT Maximum achievable control technology Mgal/yr Million gallons per year Mm-1 Inverse megameters MM5 Mesoscale Model (5th generation) MRPO Midwest Regional Planning Organization NEI National Emissions Inventory NESHAP National emission standards for hazardous air pollutants NGR Natural gas reburn NH3 Ammonia NO2 Nitrogen dioxide NO3 Nitrate NOx Nitrous oxides OBD On-board diagnostics OMC Organic matter carbon ORVR On-board refueling vapor recovery OT Oxygen trim PM2.5 Particulate matter (fine) PM10 Particulate matter (coarse) POA Primary organic aerosol POG Policy Oversight Group
93
ppb Parts per billion ppm parts per million PSAT PM Source Apportionment Technology PSD Prevention of significant deterioration QA/QC Quality assurance/quality control RACT Reasonably achievable control technology RADM Regional Acid Deposition Model REMSAD Regional Modeling System for Aerosols and Deposition RH Relative humidity RHR Regional Haze Rule RICE Reciprocating internal combustion engines RPO Regional planning organization RRF Relative response factor SCC Source classification code SCR Selective catalytic reduction SEARCH South Eastern Aerosol Research and Characterization SIC Standard industrial classification SIP State Implementation Plan SMOKE Sparse matrix operator kernel emissions SNCR Selective non-catalytic reduction SO2 Sulfur dioxide SO4 Sulfate SSM Startup, shutdowns and malfunctions STI Sonoma Technology, Inc. STN Speciated Trends Network TSD Technical Support Document ULSD Ultra-low sulfur diesel URP Uniform rate of progress VIEWS Visibility Information Exchange Web System VISTAS Visibility Improvement State and Tribal Association of the Southeast VMT Vehicle miles traveled VOC Volatile organic compound WI Water injection WRAP Western Regional Air Partnership

94
Appendices
The appendices for the Regional Haze SIP are located on the enclosed compact disc.


![[Insert Exercise Title] Our vision is 'healthy Kansans living in safe and sustainable environments'. The state belongs to all of us - "Kansas Don't Spoil](https://img.pdfslide.us/doc/110x75/56649d1a5503460f949efb43/insert-exercise-title-our-vision-is-healthy-kansans-living-in-safe-and-sustainable.jpg)