Embed Size (px)
DESCRIPTION
A great resource if you're a restaurateur, hotelier or attraction wondering what makes tourists and visitors to Kansas tick.
Citation preview
Executive Summary – Page 1
1533 E. SPRUCE
OLATHE, KANSAS 66061-3646
TELE 913.782.8544
FAX 913.782.0150
E X E CU TIV E SU MMA R Y OVERVIEW The following summary will help to highlight some of the key findings from the analysis Ruf Strategic Solutions performed on your data. The Smart Profile Analysis respects the rigors of statistics, assuring statistically valid numbers of observations as well as high degrees of predictability. The success of the Smart Profile Analysis is due to the expertise and experience needed to not only design an experiment but to evaluate it. Objective statistics are an important element of the analysis, as is subjective interpretation. Kansas Department of Tourism identified a need to answer the following questions to achieve its marketing goals: 1. Determine characteristic traits of Kansas Department of Tourism inquiries with an Inquiry per Household
Profile. 2. Segment these inquiries by market penetration. Ruf completed analysis to meet these objectives by utilizing Smart Household clustering technology on 101,385 Kansas Department of Tourism inquiries. Our model appends a cluster code to each unique record on the customer database based on the respective demographic and psychographic traits. The records are grouped together and summarized by cluster code. We then compare the percentage of customers to the percentage of market-area households within each cluster code, and develop an index ((% of inquiries) / (% of households) * 100). Finally, each cluster is ranked from highest to lowest based on the index. Inquiry per Household Profile TOP PERFORMING CLUSTERS Kansas Department of Tourism penetration reports show strong segmentation opportunities. Below are the top performing household clusters:
Cluster Inquiries % of Total Inquiries
% of Total.HH
Index (%I/% HH)
A06 1,830 3.29% .81% 408.37 L10 2,219 3.99% 1.34% 297.91 L12 1,820 3.28% 1.20% 273.90 A07 1,871 3.37% 1.26% 267.62 E06 1,885 3.39% 1.75% 193.93
These top five clusters represent 17.32% of Kansas Department of Tourism inquiry file and only 6.36% of the market area. The lift for these top five clusters is 172.33% (272.33 – 100). Stated differently, the indices show that targeting these top five clusters would generate results 2.72times better than targeting the entire file. The top quintile of Ruf Household Clusters captures 44.79% of the total Kansas Department of Tourism inquiries. This quintile has an overall/cumulative index of 225.71, signifying over 2.25 times the likelihood to become a customer than the average market area household.
Executive Summary – Page 2
Analyzing the demographic and psychographic characteristics of the top ranked clusters, the segments show the following similarities:
Strong Demographic Traits Weak Demographic Traits Married Householder Female Householder Max Education Level – High School White Collar Occupation - Agricultural
Strong Psychographic Traits Weak Psychographic Traits Own workshop equipment Drinks any type of distilled spirits Any civic/public activities in the last year Bought CD’s, tapes in the last year
MEDIA ANALYSIS Our clustering allows us to segment the client’s data into finely tuned clusters. These clusters have similar traits in several aspects; the chart below highlights the media types most likely and least likely used by Kansas Department of Tourism inquiries:
Strong Media Traits Weak Media Traits
Reads Magazines in Family Circle/McCall’s Group Listen to Spanish radio Highly Loyal Reader of Reader’s Digest Read African-American Appeal Magazines Read Women’s Seven Sisters Magazines Highly Loyal Reader of Ebony Highly Loyal Reader of Prevention Watch BET Watch TNN Listen to urban contemporary radio Read Seniors’ Interest Magazines Watch African-American Appeal Sitcoms Watch early evening news 3 or more times a week Read women’s fashion, beauty & grooming publications Highly Loyal Reader of Family Circle Watch Dating/Matchmaking Shows Listen to country (or western) radio Read Metropolitan/regional/state publications Watch Country Music Television channel Read Women’s – Bridal Magazines
Lifestyle Analysis The chart below highlights the Strong and Weak lifestyle traits most likely displayed by Kansas Department of Tourism inquiries.
Strong Lifestyle Traits Weak Lifestyle Traits Own a riding/tractor-type lawn mower Visited South Pacific (Oceania) in the last 3 years Carry $50,000-$99,999 in home/tenant insurance Flex Mexicana for travel outside the continental US in
last 3 years Carry medical/hospital/health insurance from Medicare; Medigap/Medicare supplement; Medicaid
Rent apartment
Gardened (outdoor vegetable) in the last year Attended Disneyland theme park most often in the last year
Belong to American Association of Retired Persons (AARP)
Bought 3 or more formal/cocktail dresses last year
Obtained home/tenant policy through an agent Attended Universal Studios (CA) most often in the last year
Ordered from Lane Bryant in last 12 months Drink malt liquor Own a garden tiller Bought men’s tennis clothing (not shoes/socks) in the
last year Own a air compressor Spent $500 or more on a watch in the last year
Executive Summary – Page 3
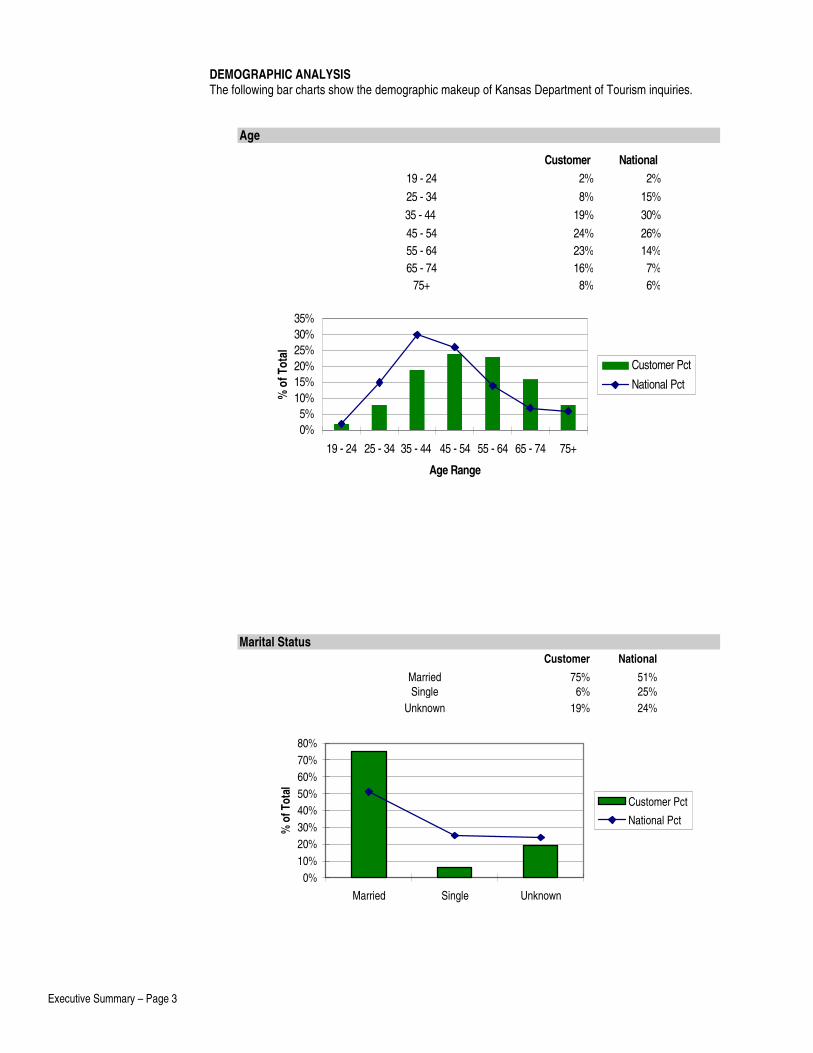
DEMOGRAPHIC ANALYSIS The following bar charts show the demographic makeup of Kansas Department of Tourism inquiries.
Age
Customer National 19 - 24 2% 2%25 - 34 8% 15%35 - 44 19% 30%45 - 54 24% 26%55 - 64 23% 14%65 - 74 16% 7%
75+ 8% 6%
0%5%
10%15%20%25%30%35%
19 - 24 25 - 34 35 - 44 45 - 54 55 - 64 65 - 74 75+
Age Range
% o
f Tot
al
Customer Pct
National Pct
Marital Status Customer National
Married 75% 51%Single 6% 25%
Unknown 19% 24%
0%10%20%30%40%50%60%70%80%
Married Single Unknown
Marital Status
% o
f Tot
al
Customer Pct
National Pct
Executive Summary – Page 4
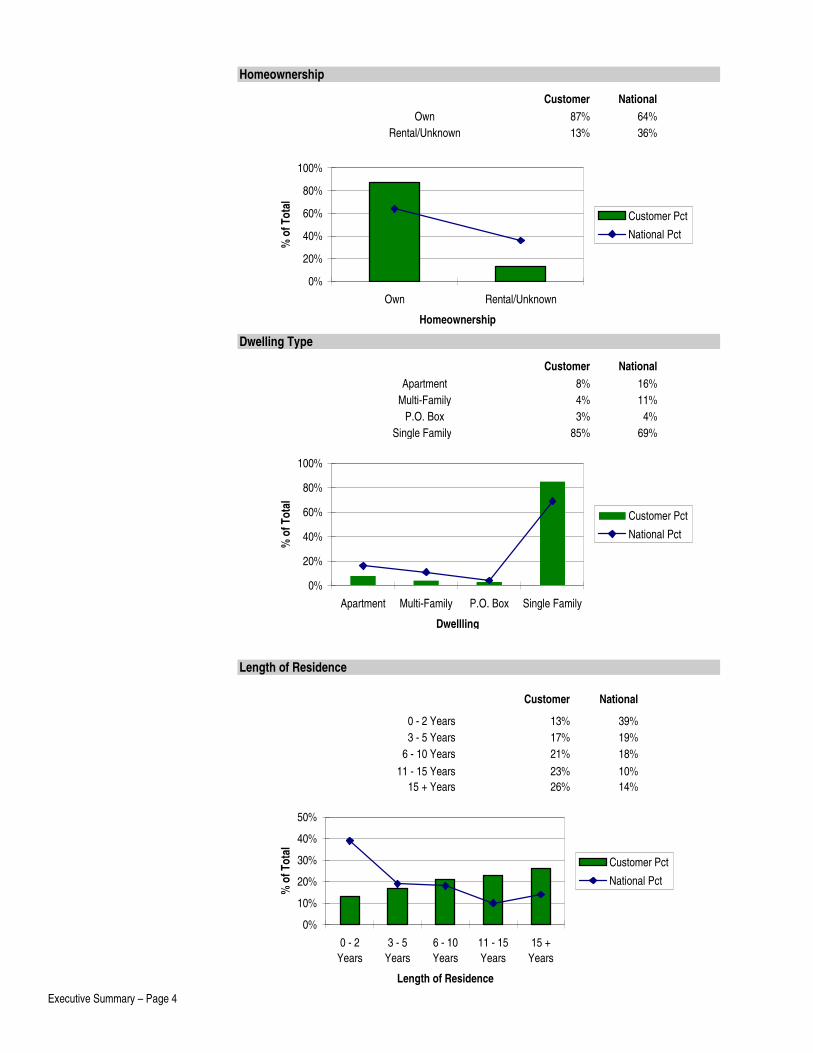
Homeownership
Customer NationalOwn 87% 64%
Rental/Unknown 13% 36%
0%
20%
40%
60%
80%
100%
Own Rental/Unknown
Homeownership
% o
f Tot
al
Customer PctNational Pct
Dwelling Type
Customer NationalApartment 8% 16%
Multi-Family 4% 11%P.O. Box 3% 4%
Single Family 85% 69%
0%
20%
40%
60%
80%
100%
Apartment Multi-Family P.O. Box Single Family
Dwellling
% o
f Tot
al
Customer Pct
National Pct
Length of Residence
Customer National
0 - 2 Years 13% 39%3 - 5 Years 17% 19%
6 - 10 Years 21% 18%11 - 15 Years 23% 10%
15 + Years 26% 14%
0%
10%
20%
30%
40%
50%
0 - 2Years
3 - 5Years
6 - 10Years
11 - 15Years
15 +Years
Length of Residence
% o
f Tot
al
Customer Pct
National Pct
Executive Summary – Page 5
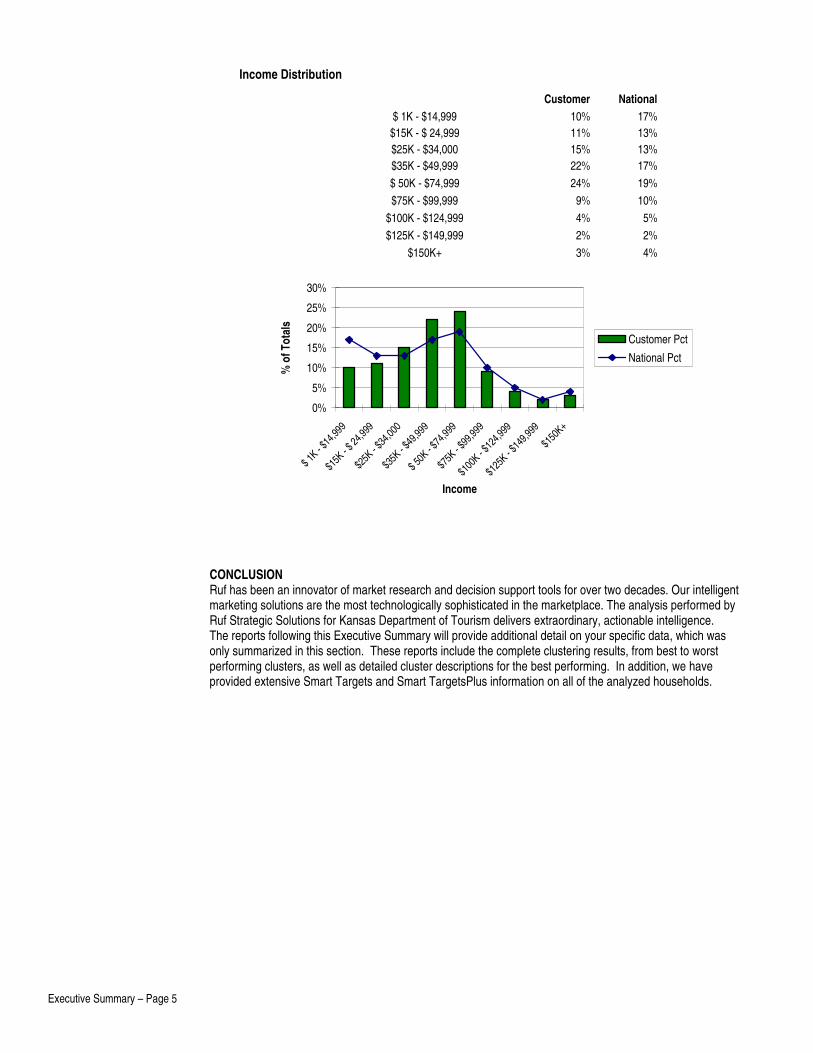
Income Distribution
Customer National$ 1K - $14,999 10% 17%$15K - $ 24,999 11% 13%$25K - $34,000 15% 13%$35K - $49,999 22% 17%$ 50K - $74,999 24% 19%$75K - $99,999 9% 10%
$100K - $124,999 4% 5%$125K - $149,999 2% 2%
$150K+ 3% 4%
0%
5%
10%
15%
20%
25%
30%
$ 1K - $
14,99
9
$15K
- $ 24
,999
$25K
- $34
,000
$35K
- $49
,999
$ 50K
- $74
,999
$75K
- $99
,999
$100
K - $12
4,999
$125
K - $14
9,999
$150
K+
Income
% o
f Tot
als
Customer Pct
National Pct
CONCLUSION Ruf has been an innovator of market research and decision support tools for over two decades. Our intelligent marketing solutions are the most technologically sophisticated in the marketplace. The analysis performed by Ruf Strategic Solutions for Kansas Department of Tourism delivers extraordinary, actionable intelligence. The reports following this Executive Summary will provide additional detail on your specific data, which was only summarized in this section. These reports include the complete clustering results, from best to worst performing clusters, as well as detailed cluster descriptions for the best performing. In addition, we have provided extensive Smart Targets and Smart TargetsPlus information on all of the analyzed households.
Key Definitions – Page 1
1533 E. SPRUCE
OLATHE, KANSAS 66061-3646
TELE 913.782.8544
FAX 913.782.0150
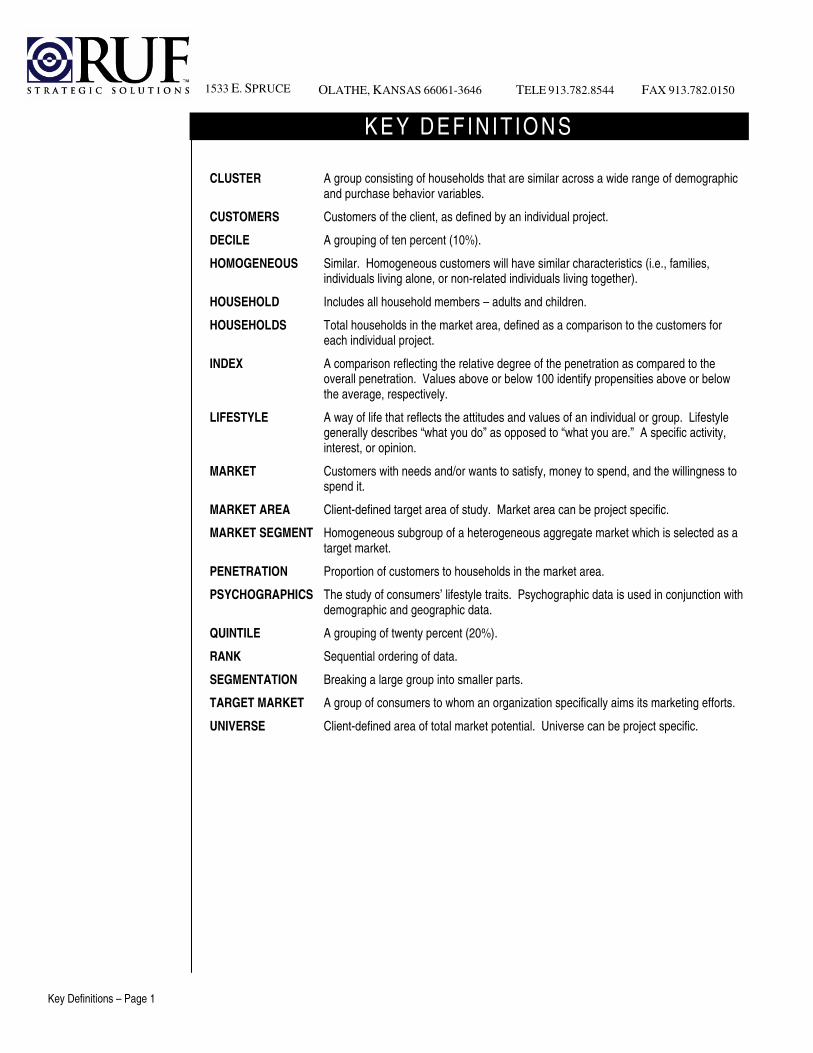
K E Y D E F IN IT IO N S CLUSTER A group consisting of households that are similar across a wide range of demographic
and purchase behavior variables.
CUSTOMERS Customers of the client, as defined by an individual project.
DECILE A grouping of ten percent (10%).
HOMOGENEOUS Similar. Homogeneous customers will have similar characteristics (i.e., families, individuals living alone, or non-related individuals living together).
HOUSEHOLD Includes all household members – adults and children.
HOUSEHOLDS Total households in the market area, defined as a comparison to the customers for each individual project.
INDEX A comparison reflecting the relative degree of the penetration as compared to the overall penetration. Values above or below 100 identify propensities above or below the average, respectively.
LIFESTYLE A way of life that reflects the attitudes and values of an individual or group. Lifestyle generally describes “what you do” as opposed to “what you are.” A specific activity, interest, or opinion.
MARKET Customers with needs and/or wants to satisfy, money to spend, and the willingness to spend it.
MARKET AREA Client-defined target area of study. Market area can be project specific.
MARKET SEGMENT Homogeneous subgroup of a heterogeneous aggregate market which is selected as a target market.
PENETRATION Proportion of customers to households in the market area.
PSYCHOGRAPHICS The study of consumers’ lifestyle traits. Psychographic data is used in conjunction with demographic and geographic data.
QUINTILE A grouping of twenty percent (20%).
RANK Sequential ordering of data.
SEGMENTATION Breaking a large group into smaller parts.
TARGET MARKET A group of consumers to whom an organization specifically aims its marketing efforts.
UNIVERSE Client-defined area of total market potential. Universe can be project specific.
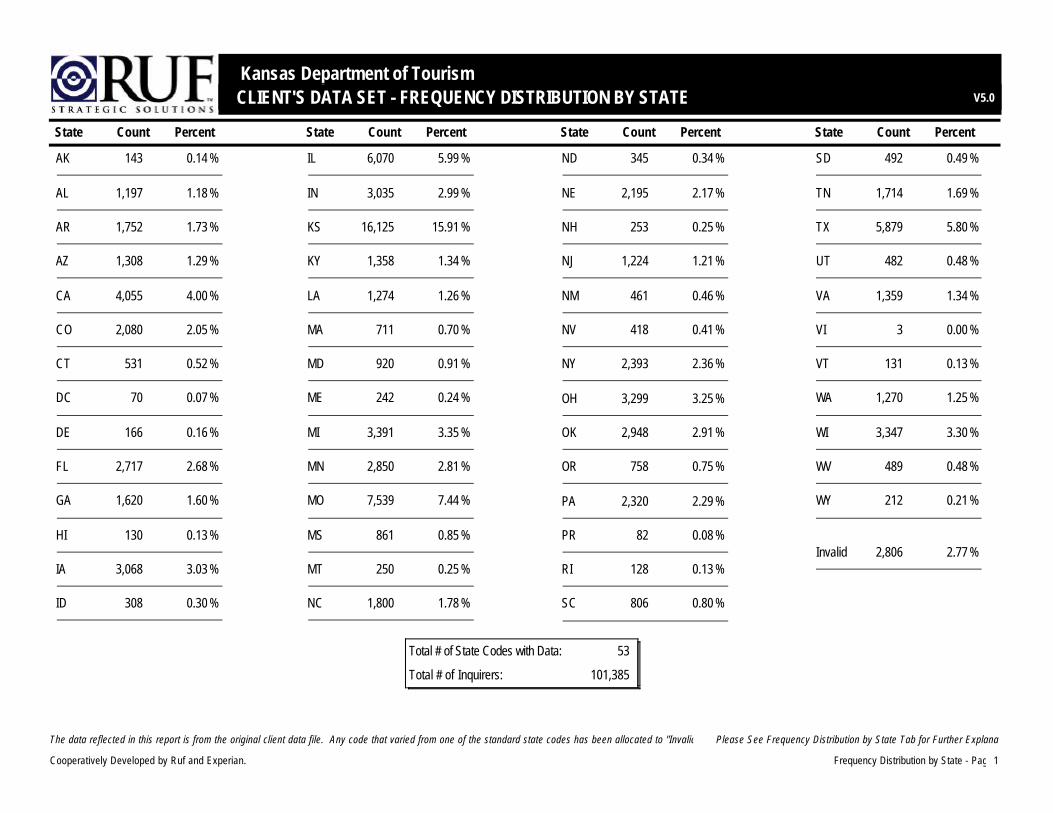
CLIENT'S DATA SET - FREQUENCY DISTRIBUTION BY STATE V5.0
Kansas Department of Tourism
State Count Percent State Count Percent State Count Percent State Count Percent
143 0.14 %
1,197 1.18 %
1,752 1.73 %
1,308 1.29 %
4,055 4.00 %
2,080 2.05 %
531 0.52 %
70 0.07 %
166 0.16 %
2,717 2.68 %
1,620 1.60 %
130 0.13 %
3,068 3.03 %
308 0.30 %
6,070 5.99 %
3,035 2.99 %
16,125 15.91 %
1,358 1.34 %
1,274 1.26 %
711 0.70 %
920 0.91 %
242 0.24 %
3,391 3.35 %
2,850 2.81 %
7,539 7.44 %
861 0.85 %
250 0.25 %
1,800 1.78 %
345 0.34 %
2,195 2.17 %
253 0.25 %
1,224 1.21 %
461 0.46 %
418 0.41 %
3,299 3.25 %
2,948 2.91 %
758 0.75 %
2,320 2.29 %
82 0.08 %
128 0.13 %
806 0.80 %
492 0.49 %
1,714 1.69 %
5,879 5.80 %
482 0.48 %
1,359 1.34 %
3 0.00 %
131 0.13 %
1,270 1.25 %
3,347 3.30 %
489 0.48 %
212 0.21 %
2,806 2.77 %
AK
AL
AR
AZ
CA
CO
CT
DC
DE
FL
GA
HI
IA
ID
IL
IN
KS
KY
LA
MA
MD
ME
MI
MN
MO
MS
MT
NC
ND
NE
NH
NJ
NM
NV
OH
OK
OR
PA
PR
RI
SC
SD
TN
TX
UT
VA
VI
VT
WA
WI
WV
WY
Invalid
2,393 2.36 %NY
Total # of State Codes with Data:
Total # of 101,385
53
Inquirers:
1
The data reflected in this report is from the original client data file. Any code that varied from one of the standard state codes has been allocated to "Invalid".
Frequency Distribution by State - Page
Please See Frequency Distribution by State Tab for Further Explanation.
Cooperatively Developed by Ruf and Experian.