Embed Size (px)
Citation preview
Development of Crop Production Functions
For lrrigation in North Central Kansas
Dr. Norman L. Klocke, P,E.
NLK Engineering
November L8,2ALL
No. 126, Orig"Ex. K99
KS000471

Table of Contents
Summary.......r!..r..,¡n.¡¡.¡; ....¡r¡r...r"....... 3
Mathematical Model,...
Parameters for the Cobb-Douglas Model...
Ca lcu lated Yields."........
Field Results Compared with Cobb-Douglas Equation.,.. ,..........,".,"....., 7
References.
2
KS000472

Summary
Crop production functions for irrigation show the relationship of crop yield and irrigation. Often,especially in economic analyses, yield needs to be calculated from the amount of applied irrigation.Crop production functions can be derived from field studies where different amounts of irrigation are
applied and yields are measured. Crop production functions can also be in the form of mathematicalequations that describe the diminishing return characteristic of yield resulting from more and moreirrigation.
Field studies to find yields with respect to irrigation are usually conducted at research sites where a
range of irrigation amounts can be applied with specialized equipment and statistical analyses can be
applied to the data. Mathematical models are calibrated to field conditions and then used in otherlocations.
It was necessary to calculate the crop yields that would have been produced during 2005 and 2006 had
additional water been available to irrigators in the Kansas Bostwick lrrigation District (KBID). lrrigationrecords from previous years were available by crop and the type of irrigation system, but the yields
resulting from the amount of irrigation applied were not available. Yields from fully irrigated and
dryland management are reported by county by the National Agricultural Statistical Service (NASS), butthe yields from irrigation between the extremes are not. Likewise, Kansas State University cropperformance testing in the KBID region was conducted with either fully irrigated or drylandmanagement.
Production functions, based on a mathematical model developed by researchers at the University ofNebraska-Lincoln (UNL), were chosen to calculate crop yields over the range of irrigation that had been
used by irrigators in the KBID prior to 2005. The numerical parameters needed for the UNL model werederived by the UNL researchers for counties in Nebraska, eastern Colorado and central and westernKansas. The model was used to calculate yields for north-central Kansas. The differences betweenyields that would have been produced in 2005 and 2006 with irrigation and yields expected when no
irrigation was available were the basis for the economic analysis.
The modeldeveloped at UNL was further evaluated with field data gathered at Kansas State University'sresearch center in Garden City. This study, conducted with six irrigation treatments, produced yield
results with respect to irrigation. The production function from these data was compared with UNL's
production function that used parameters derived for the Garden City location. The results from thefield data and the mathematical model were very similar.
Mathematical Model
Crops generally respond positively to inputs like fertilizer and irrigation until maximum yield is obtained.However, the increment of yield gain from each increment of input declines as more inputs are added,
A "diminishing return" curvilinear mathematical model often fits observed data and describes thephenomenon. ln L984, Dr. Derrel Martin, Professor, University of Nebraska (Martin et al., 1984)
suggested that the Cobb-Douglas mathematical model could be used to describe grain yield response toirrigation. The equation was presented in Martin et al., 2010:
y =yn + (yr-y") t1-(1 -D/O,¡t/ø I where p = (ETr-ET")/Df (1)
3
KS000473
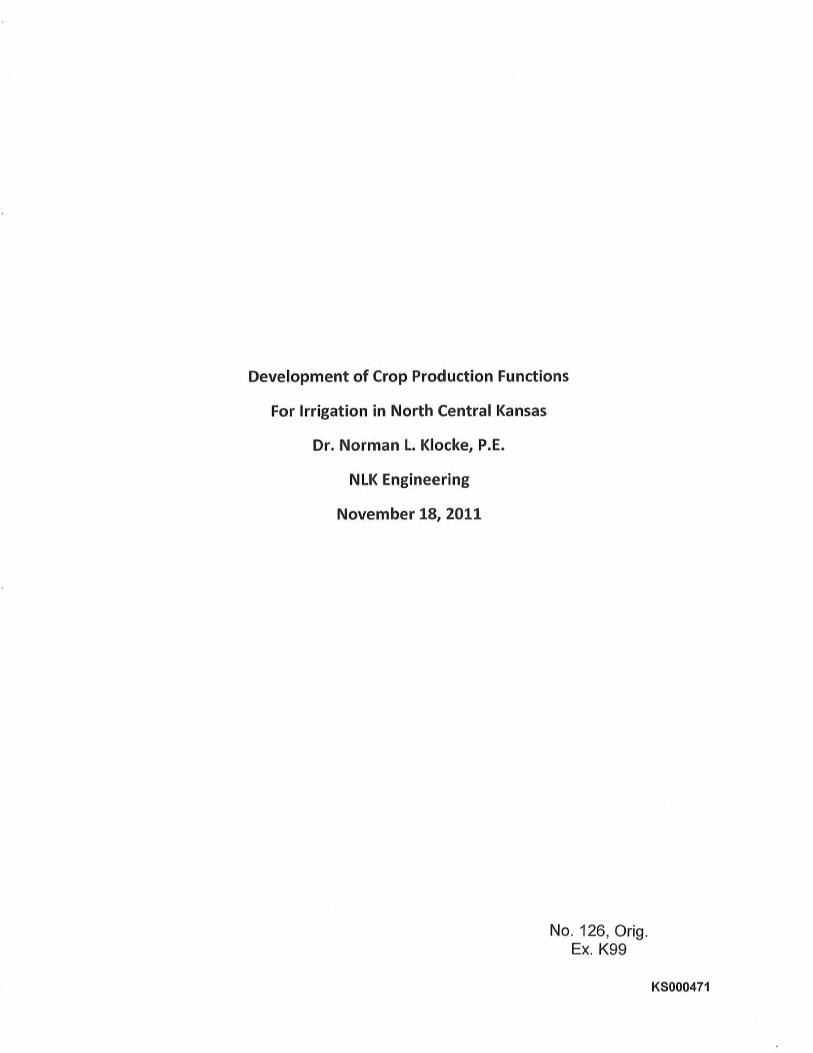
The equation also can be written as:
Y = Yn + b (ETr - ET" ) [ 1 - ( 1 -DlDr)l/P 1 where b (ETr - Etn) = (y1- y") (2)
The second form of the equation was used in developing the crop production function for north centralKansas
"Y" is the unknown grain yield (dependent variable) that is derived with equation 2.
"D" is the amount of irrigation (independent variable) that is delivered to the field.
"D/' is the amount of irrigation required to produce maximum yield. Net irrigation requirement(NlR) is the infiltrated irrigation water that is necessary to produce maximum yield. lt depends ongeographic location (particularly precipitation) and crop. NIR requirement varies with rainfallprobabilities; hence, location is important. Dl can be derived from NIR by dividing NIR by applicationefficiency (AE).
"Yn" is the non-irrigated yield that is produced from precipitation only. Values for Yn are as aresult of growing a summer row crop that was not irrigated the year before. County yield averages fordryland crops, reported by NASS, include crops that may have followed the same or another row crop orthe crop may have followed winter wheat. The typical 3-year dryland crop rotation across theRepublican River Basin is winter wheat followed by sorghum or corn followed by fallow from harvest ofsorghum or corn until wheat planting. Dr. Martin derived values for Yn from a crop simulation modelexplained later in this report.
"Y/' is the maximum yield that a crop can produce if unrestricted by inputs such as fertilizer andchemicals for weed control and insect control.
"b" is the slope of the yield-evapotranspiration (ET) function that has been proven to follow alinear model by many field studies. ET is the combination of the water consumed by the crop,transpiration (T) and water evaporated directly from the soil surface (E). The form of the yield-ETfunction is (Martin et al., 201-0):
Y = Yn + b (ET- ET") (3)
"ET¡ ETn" or "ET-increase" (ET¡n.). ET¡ is the amount of water used by a fully irrigated crop formaximum yield. ETn is the amount of water used by a non-irrigated crop. ET¡n" is the difference betweenET¡and ET", which is the amount of water used by the crop to produce yield. Yield is grain in the case ofgrain crop and forage in the case of forage crops such as alfalfa.
"p" (beta) is the value for the exponent in equations L and 2. lt influences the curvilinear shapeor the yield response to irrigation and is related to application efficiency (AE), the ability of the irrigationsystem to deliver water to the soil surface. lrrigation systems cannot deliver all of the pumped ordiverted water to the soil surface with complete spatial uniformity so different irrigation systems,particularly sprinkler versus furrow irrigation, deliver water more or less efficiently.
Ê = AE (ET¡n./NlR) (4)
4
KS000474
Parameters for Cobb-Douglas Model
Dr. Martin has determined the numerical values of the parameters for the Cobb-Douglas equation forcorn and soybean from executions of CROPSIM, a simulation model, based on results from field research
and mathematical descriptions of irrigation delivery and crop development (Martin et al,, 2010). Dr.
Martin has described CROPSIM as a soil water balance of inputs to a soil volume and outputs from thatsame soil volume. He derived parameters by county for most of Nebraska, western and central Kansas,
and eastern Colorado where irrigated crops are grown (Supalla, 2011\. The parameters for Republic CO,
Kansas were used across the KBID region because the preponderance of the acreage in KBID is in
Republic, CO.
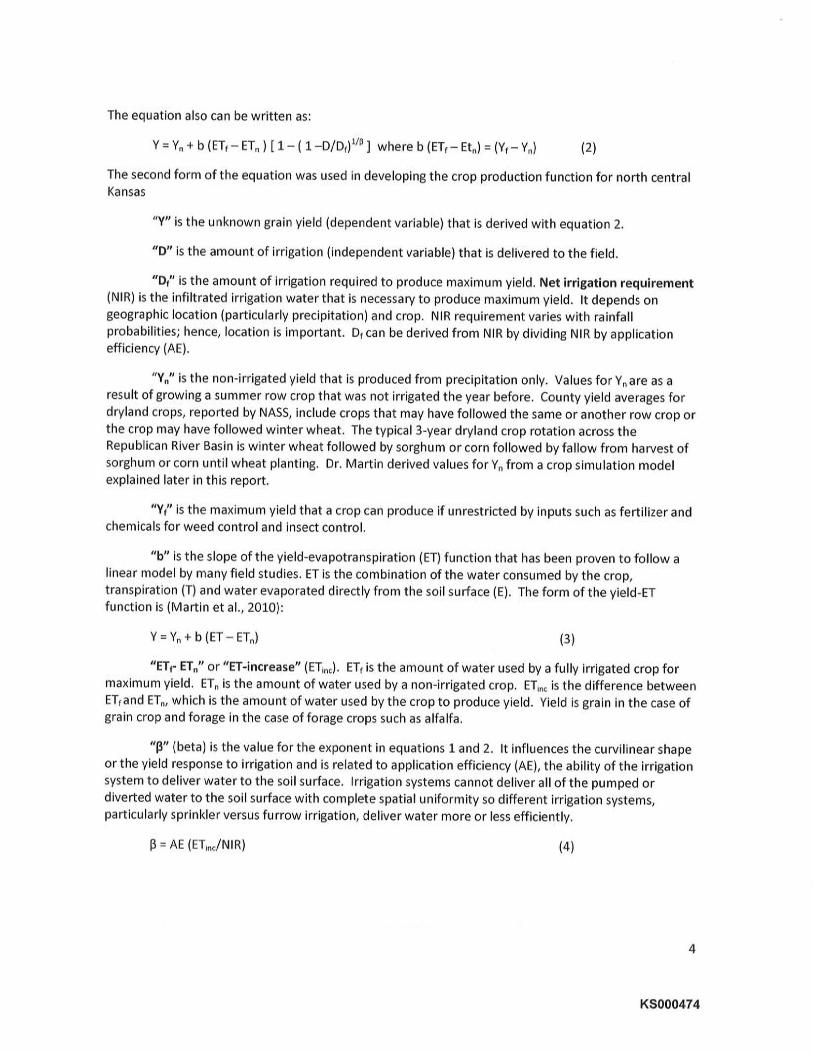
Table L. Parameters for Cobb-Douglas equation for Republic CO, Kansas as applied to north-central
Kansas (parameters in bold were derived by Martin with CROPSIM).
From USDA Natural Resources Conseruation Service Kansas lrrigation Guide.
ttlFrom Kansas State University Performance Test Data & National Agricultural Statistical Service (NASS).
ltlFrom consultation with Scott Staggenborg, Kansas State University Agronomist
talFrom NASS
The parameters for sorghum and alfalfa (ET¡n., and b) were derived by Dr. Klocke based on data he
collected in field studies at Kansas State University's Research Center at Garden City, Kansas which were
adapted to north central Kansas. Yield and ET data for sorghum and alfalfa were collected in the field
study. From these data, b and ET¡n. could be calculated. AE values were the same as those used by
Martin. The calculation of p used NIR data from the USDA Soil Conservation Service, AE values fromMartin, and ET¡n. from Klocke's data.
Calculated Yields
Parameters from table 1 were applied to equation 2 to calculate yields for each amount of appliedirrigation in table 2 and figures 1-3.
5
Crop System NIR ETrn. Y,/Y¡ Yr
bu/ac bu/ac-in bu/ac %ln tn
b Yn AEß
Corn
Corn
Soybean
Soybean
Sorghum
Sorghum
10.1
10.1
8.6
8.6
7.4lll
7.4ttt
0.54
0.54
0.68
0.68
0.76
0.76
t82182
63
63
L34t2l
!34t21
Lt.2tt.23.5
3.5
6.4
6.4
98
98
43
43
LOII?Ì
102121
Center Pivot
Furrow
Center Pivot
Furrow
Center Pivot
Furrow
85
60
85
60
85
60
85
0.63
0.45
0.s6
0.40
0.57
o.4L
7.5
7.5
5.7
5.7
5
5
Alfalfa center Pivot L6tu Lz 0.60 6.5t31 0.2 3.9tol 0.64
ton/ac ton/ac-in Ton/ac
KS000475

Applied
lrrigation
Corn
cPfll
Corn Soybean
Furrow CP
Soybean
Furrow
Sorghum
CP
Sorghum
Furrow
Alfalfa
CP
inches bu/ac bu/ac bu/ac bu/ac bu/ac bu/ac tons/ac0
t2
3
4
5
6
7
8
9
10
L1
12
13
t4L5
1.6
t7L8
98
109
I20r29139
1.47
L55
162
168
L73
178
181
t82182
r82L82
1.82
182
r82
98
109
1.19
t28r.36
1.44
151.
'1.57
L62
167
17L
L74
177
t79L80
181
t82L82
L82
43
46
49
52
54
57
59
60
61
62
63
63
63
63
63
63
63
63
63
43
46
49
52
54
56
57
59
60
61
62
62
62
63
63
63
63
63
63
102
108
rt4119
123
127
1_30
132
134
134
L34
134
134
L34
t34734
134
L34
!34
102
108
1.L3
1L8
r22t25128
130
r32L33
133
!34L34
134
134
134
L34
734
134
3.9
4.L
4.3
4.5
4.7
4.9
5.1
5.2
5.4
5.6
5.7
5.8
6
6.1
6.2
6.3
6.4
6.4
6.5
Table 2. Yield response to irrigation as calculated with equation 2.
tllCP=Center Pivot
^ -..^^^ ^A^a ++l- -t Àrr¡rÃÄrÃnafarÀ
t
tI tI.r
0 5 10 1s
Applied lrrigation (inches)
2A
200
180
160
G t4o
$ rzo
I roo
Ë80
40
20
0
O Corn
I Soybean
r,. Sorghunr
6
Figure L. Yield response to irrigation for corn, soybean, and sorghum using center pivots
KS000476

2W
180
160
^ 140IJ
{. rzoJ3 roo
Ë80
40
20
0
^ô 1|
^?Tîll^'^ AAAAAAAAAAlr^-
O Corn
I Soybean
I Sorghumrr_r!:!r rrr rtttt_:_1tt ]l
0 51015Applied lrrigation (inches)
20
Figure 2. Yield response to irrigation for corn, soybean, and sorghum using
furrow irrigation.
7.O
6.0
5.0
4.0
tltt+(}it.}
Io t +a
ã.o2.4
1.0
0.00 51015
Applied lrrigation (inchesl
20
Figure 3. Yield response to irrigation for alfalfa using center pivot irrigation.
Field Results Compared with Cobb-Douglas Equation
To measure yield responses to irrigation in the field, irrigation needs to vary across plots from no
irrigation or very little ¡rrigation to irrigation for maximum yields. Because the yield response toirrigation is curvilinear, several levels of irrigation need to be applied to describe the diminishing yields
as irrigation increases. Dr. Klocke has conducted field experiments to gather corn yield data for six levels
of irrigation during 2005-2009 in Garden City, Kansas (Klocke et al., 2011). The measured yields for each
7
KS000477

irrigation amount for each year were divided by the maximum yield for that year to produce "relativeyields"' The relative yield for the maximum irrigation for every year was L and the remaining 5 irrigationtreatment yields were fractions of L, Relative yields can be compared across years better than themeasured yields because the year-to-year differences in factors that affect yield except irrigation can beminimized.
A statistical regression of the field data for corn (relative yield versus irrigation) was derived in the formof a quadratic equation (Klocke et al., 20L1):
Relative Yield = -0.0026 (Nt)2 + 0.084 (Nt) + 0.33 (5)
where Nl = net irrigation in inches.
The net irrigation results were converted to applied irrigation and the results from equation 5 are infigure 4 as the "KSU" data points. The parameters for the Cobb-Douglas equation for Garden City, asdetermined by Dr. Martin, produced the relative yield results in figure 4 denoted by the C-D data points.
Relative Yields from KSU field dataand Cobb-Douglas equatíon
TIITI
I() c-D
TKSU
5L0L5Applied lrrigation (inches)
20
Figure 4. Relative yield for corn versus applied irrigation from Cobb-Douglas equation (C-D) and fielddata (2005-2009)from Kansas State University at Garden City (KSU).
The results in figure 4 show that the Cobb-Douglas equation matched the field data very well. When thevalue for Nl in equation 5 was zero,YlfYnwas calculated to be 0.33. Martin determined that yr/yn was0.3L using CROPSIM for Garden City. Also, when Relative Yield was in equation 5 was 1, Nl wascalculated to be L4 inches. This corresponds to the NIR calculated by Martin which was 13.8 inches forGarden City.
1.0
E 0.8.o> 0.6o
E o.aoÉ o.2
0.0
0
8
KS000478

References
Klocke, N.1,, R.S. Currie, D.J. Tomsicek, J. Koehn. 2011. Cor¡ yield response to deficit irri8at¡on.
Transactions of the American Society of Agricultural and Biological Engineers, 5a(3):931-940.
Martin, D.L, D.G. Watts, and J.R. Gilley. 1984, Model and production function for iffigation
management. Journal of the lrrigation Drainage DÍvision of the American Society of Civil Engineers. 11-0
(4):149-164.
Martin, D,1., R.J. Supalla, C.L Thompson, B.P. McMullen, G.W. Hergert, and P.A. Burgener. 2010.
Advances in deficit irrigation management. 5ü National Decennial lrrigation Conference, American
Society of Agricultural and Biological Engineers. Publication No' 7L1P0810cd. Phoenix, AZ. Dee. 5-8,
20LO.
Supalla, R.J. 2011. Procedurès for adjusting API-I when implementing a deficit irrigation insurance
practice. April tr5, 2O1L.
Appendix
Testìmony bv Dr. Klocke in the last 4 years: One deposition, ín SpearT Ronch, lnc, v, Knøub, et al.,
MorrillCo., Neb., Case No. C¡03-1.6.
Compensation to be paid for Dr. Klocke's study and testimony in this case: $fZSlhour.
9
KS000479


![2017-2018 VERSION 29 - Central Christian College of Kansas Strategic Plan [29].pdf · Strategic planning, as it is viewed by Central Christian College of Kansas, is a systemic process](https://img.pdfslide.us/doc/110x75/5d64e68388c993535f8bc8a0/2017-2018-version-29-central-christian-college-of-strategic-plan-29pdf.jpg)