Embed Size (px)
DESCRIPTION
Comparison Between ICI and KIA
Citation preview

7/15/2019 Kansai.pdf
http://slidepdf.com/reader/full/kansaipdf 1/13
FISCAL CHARACTERISTICS OF INCHEON INTERNATIONAL
AIRPORT AND KANSAI INTERNATIONAL AIRPORT
Tomoki ISHIKURAResearcher
Airport Planning DivisionAirport Department
National Institute for Land, Infrastructure,and Management
Nagase 3-1-1, Yokosuka, Kanagawa,239-0826 JapanFAX: +81-46-844-5080E-mail: [email protected]
Yoshihisa SUGIMURAResearcher
Airport Planning DivisionAirport Department
National Institute for Land, Infrastructure,and Management
Nagase 3-1-1, Yokosuka, Kanagawa,239-0826 JapanFAX: +81-46-844-5080E-mail: [email protected]
Masaki ISHIIHead of Airport Planning DivisionAirport Department
National Institute for Land, Infrastructure,and Management
Nagase 3-1-1, Yokosuka, Kanagawa,239-0826 JapanFAX: +81-46-844-5080E-mail: [email protected]
Abstract: Kansai International Airport (KIX) needed a large amount of initial investment isthe land development by marine landfill to avoid environmental problems such as the noise.
It brought a heavy debt to the KIX’s administrator, KIAC. Seoul's Incheon InternationalAirport faces the similar situation to KIX. This paper analyzes the two Airport’s fiscalconditions by comparing with world's other airport operators and considers policyimplications for the improvement of the airport management.
Key Words: Airport Management, Fiscal Analysis, Kansai International Airport, IncheonInternational Airport
1. INTRODUCTION
In East Asia and Southeast Asia, air demand recorded a high growth rate and construction anddevelopment of a huge airport continued from 1990's. The examples are KansaiInternational Airport (hereafter KIX) in 1994, Hong Kong Chek Lap Kok Airport, KualaLumpur International Airport in 1998, Shanghai Pudong Airport in 1999, Seoul's IncheonInternational Airport (hereafter ICN) in 2001. Furthermore, the opening of New Bangkok International Airport approaches in Thailand.
New airport construction needs a large amount of investment. Construction (only inPhase-1) of KIX took costs more than 1.5 trillion yen (about 13 billion dollar). It stands outin the world. 12 local governments supplied capital to Kansai Airport as an investor as wellas the nation government. However, many of project costs are financed by a debt, and that is
why a large amount of interest payment arises.
Proceedings of the Eastern Asia Society for Transportation Studies, Vol. 5, pp. 520 - 532, 2005
520
7/15/2019 Kansai.pdf
http://slidepdf.com/reader/full/kansaipdf 2/13
The greatest reason why KIX needed a large amount of initial investment is because the landwas developed by marine landfill. The land development method was adopted to avoid anenvironmental problem such as the noise. Korea which was a Japanese neighboring countryinvested a large amount of land development expense same as KIX and built ICN.KIX and ICN have various similarities, for example, airport on the ocean, a location of the
east end of East Asia, hinterland city scale and distance from a down town area. AlthoughKIX passes through ten years from the opening, ICN is a young airport. It is interesting for future policy decision of both airports to compare a performance of ICN with KIX. This
paper reviews characteristics and differences of KIX and ICN, in particular, from a viewpointof financial affairs and traffic demand.
2. COMPARATIVE ANALYSIS OF ICN AND KIX
2.1 Physical Aspects
Both of ICN and KIX were constructed by land development on the ocean. These airportsfurthermore have similarities for example the scale of hinterland city and access distance fromdowntown. This section summarizes specifications of the airports, the hinterlandcharacteristics and the recent air transportation results before the financial comparativeanalysis.
Table-1 shows physical aspects of ICN and KIX. ICN has about 2 times site areas of KIX,and two runways. Although physical scale of an airport of ICN is larger, hinterland scale of the two airports is approximately the same. In addition, access environment from downtown region is also similar. According to the transport results, the difference of cargodemand is larger than the flight movement's difference and the passenger demand's difference.KIX has a characteristic that a ratio of domestic demand is big and it is much different fromICN. Although the difference of the number of air carriers operated is small, ICN has 50more points served than KIX.
Since Korea's airport policy gives ICN a role of an international airport of Seoul (Gimpo(GMP) as domestic airport), there are only three regular routes from ICN. Therefore, mostof air demand in ICN are international service demand as a necessity. With respect to onlyinternational air services, the numbers of movements and passengers of ICN are almost 2times of KIX. Although there is a much difference of international air demand (both
passenger and cargo) between ICN and KIX, domestic air demand of KIX makes the demand
difference of the two airports look small.
Proceedings of the Eastern Asia Society for Transportation Studies, Vol. 5, pp. 520 - 532, 2005
521

7/15/2019 Kansai.pdf
http://slidepdf.com/reader/full/kansaipdf 3/13
Table- 1 Specification of ICN and KIX
Incehon Int’l Airport (ICN) Kansai Int’l Airport (KIX)
Runway 2 x 3,750m
(4 x 3750-4000m: Final Plan)
1 x 3,500m
(1 x 3,500m, 1 x 4000m: SecondPhase)
Airport Site Area 11,724,000m2 (47,428,000m
2: Final Plan)
5,103,100m2 (10,550,000m
2: Second Phase)
Passenger Terminal Floor Space 496,000m2
301,636m2
Administrator IIAC (Incheon InternationalAirport Corporation)
KIAC (Kansai InternationalAirport Co.,Ltd)
Hinterland Population about 2 million about 2.4 million
Modes of Access Exp way (,and Rail scheduled in2005)
Exp way, Rail, High SpeedFerry
Accessibility from Downtown 52km, 50min
(from Seoul by Exp way)
57km, 45min
(from Osaka by rail)Aircraft Movement Capacity 240,000(410,000: Final Plan)
160,000(230,000: Second Phase)
Passenger Handling Capacity 30 million passengers 25 million passengers
Cargo Handling Capacity 2.7 million ton 1.0 million ton
Aircraft Movement Result inFY2002(international)
126,094**
(122,518)**
108,366
(63,870)
Total Passenger Result inFY2002(international)
20,924,167**(20,552,659)**
16,920,882(10,441,672)
Total Cargo Result in FY2002
(international)
1,705,891 ton**
(1,703,602 ton)**
767,310 ton
(715,699 ton)Airlines Operating* 51 49
Countries Served* 39 29
Cities Served* 119 69(*ICN in Apr 2004, KIX in March 2004)**include non-scheduledsources: brochure of each airport , Incheon International Airport’s web (http://www.airport.or.kr),
IIA Newsletter (various issues), Kansai International Airport Co.,Ltd web (http://www.kiac.co.jp)
2.2 Administration System
There are 16 civil aviation airports in Korea including Incheon International Airport, andamong them 7 airports are international airports. Pure civil aviation airports are only sixairports in Korea, and the remainder are common use airports with the military authorities.The administrator of ICN is Incheon International Airport Corporation (hereafter: IIAC) andKorea Airport Corporation (hereafter: KAC) is the administrator of other 15 airports. IIACis a public corporation fully financed by Korea's national government. KAC is also a publiccorporation which has a responsibility of operation and maintenance of airports and does notconstruct airports. The national government itself builds airports. Different from other airports, however, IIAC has a role of not only the management and maintenance of ICN butalso the construction.
Airport Development Act prescribes Japanese airport administration system. AirportDevelopment Act classifies airports to 4 classes in some standards such as a subsidy ratio by
Proceedings of the Eastern Asia Society for Transportation Studies, Vol. 5, pp. 520 - 532, 2005
522
7/15/2019 Kansai.pdf
http://slidepdf.com/reader/full/kansaipdf 4/13
national government for the airport development cost. National government or localgovernments are prescribed as airport administrators basically. Administrator of KIX isKansai International Airport Co., Ltd. (hereafter: KIAC) which is the joint stock companyshared by national government ,local government and private sectors. KIAC has a role of construction, management and maintenance of KIX. The establishment system of KIAC is
an exceptional construction management framework in Japan, as well as IIAC in Korea. National government has 2/3 control shares of KIAC, and ,12 local governments hold 21.4%of the stocks. Remaining stocks are held by private enterprises.
2.3 Aspects of Profit and Loss
The flow analysis considers the situations and problems of ICN and KIX from viewpoints of sales scale, profit, expense and so on.
Although both airports appropriate operating profit, net deficits occurs (Table-2). Thefinancial situations of the airport administrators are extremely near. The most representative
common flow characteristic of IIAC and KIAC is that interest expense is the greatest cause of net deficits. Both ICN and KIX needed a large amount of financial resource for airportconstruction on the ocean and most of the cost was financed by debt. This point becomesclearer by the next section’s comparative analysis of stock.
The structure of operating revenue in each airport is also similar. Airport charge includeslanding charges, stoppage charges, and other airside charges such as lighting charges.Although KIX is often criticized for its high landing charges, the percentage that airportcharge occupies in total revenue is only less than 20% (Figure-1). Airport charge is notequivalent to “aviation revenue” here. We cannot divide total revenue to “aviation revenue”and “non-aviation revenue” because of data constraint.
Proceedings of the Eastern Asia Society for Transportation Studies, Vol. 5, pp. 520 - 532, 2005
523

7/15/2019 Kansai.pdf
http://slidepdf.com/reader/full/kansaipdf 5/13
Table- 2 Profit Loss Statements of IIAC and KIAC
source: IIAC (2003), KIAC (2003)*Some errors occur because of round off.
IIAC KIAC
Revenue 489.9 977.7
Airport Charge 129.7 188.5
Other Operating Revenue360.3 789.3
Operating Expenses 359.0 813.5
Operating Profit 131.0 164.2
Non-operating Revenue 3.0 3.8
Interest Revenue 0.6 0.3
Other Non-operating Income 2.4 3.5
Non-operating Expenses 225.3 312.2
Interest Expenses 216.8 306.1
Other Non-operating Expenses 8.5 6.1
Ordinary Profit -91.3 -144.2Extraordinary Profit and Loss -11.3
Income Taxes -0.3
Net Profit -91.3 -155.2
million $
Proceedings of the Eastern Asia Society for Transportation Studies, Vol. 5, pp. 520 - 532, 2005
524

7/15/2019 Kansai.pdf
http://slidepdf.com/reader/full/kansaipdf 6/13
Figure- 1 Ratio of Airport Charge to Total Revenue
Although air passenger demand and movement of ICN is larger than KIX's, revenue of KIACis larger than IIAC. Table-3 shows the comparison of revenue per passenger demand andrevenue per movement between ICN and KIX. These values mean average price per
passenger and average price of movement. KIX's price is over two times of ICN's price.Regarding the international airport competition, ICN has an advantage.
Table- 3 Revenue/Pax and Revenue/Movement
0%
20%
40%
60%
80%
100%
IIAC KIAC
Other Operating Revenue
Airport Charge
IIAC KIAC KIAC/IIACTotal Revenue/Total Pax ($) 23.4 57.8 2.47
Airport Charge/Total Pax ($) 6.2 11.1 1.80
Total Revenue/Total Movement ($) 3885.6 9038.1 2.33Airport Charge/Total Movement ($) 1028.3 1742.1 1.69
Proceedings of the Eastern Asia Society for Transportation Studies, Vol. 5, pp. 520 - 532, 2005
525

7/15/2019 Kansai.pdf
http://slidepdf.com/reader/full/kansaipdf 7/13
2.4 Aspects of Capital Stock Situation
Table-3 Balance Sheets of IIAC and KIAC
The analysis discusses on a fiscal resources system as well as financial conditions of ICN andKIX. The balance sheets (Table-3) describe that total assets of KIX is a little less than 3times of ICN's assets. The physical scale comparisons of the airports mentioned aboveshowed that a site area and terminal floor space of ICN were larger than KIX. Physical scaleand assets scale reverse. A difference of land price level between Japan and Korea can beone of the reasons of it. However, the financial result shows that how large investment toKIX was.
Although equity ratio is in general an important index of safety in financial statementsanalysis, it simply means a capital finance system in this comparative analysis of the two
airports where government is shareholder. More than 60% of fiscal resources of airportconstruction are supplied in both airports by debt. The airport administrator holds the assets.For this reason, an operator has to continue payments of interest cost constantly. Thischaracteristic is common to ICN and KIX.
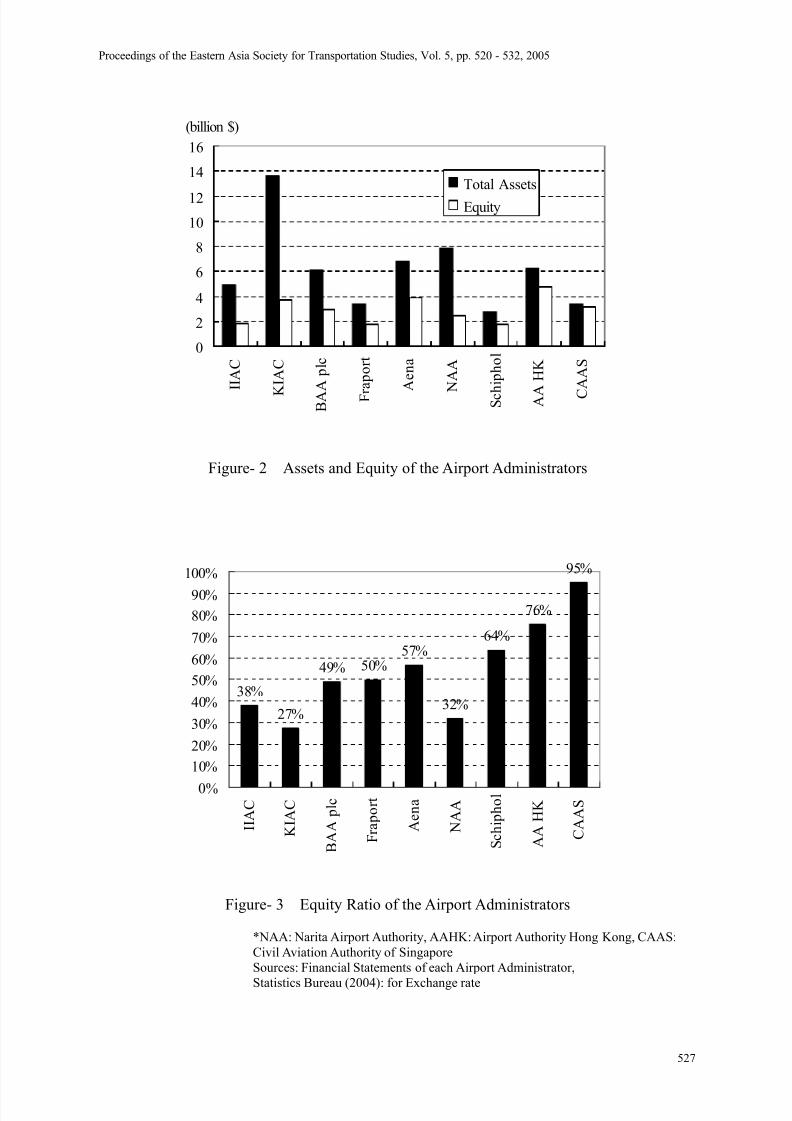
The following Figure-2 shows the comparison of assets and equity ratio of some world major airport administrators. The figure takes up administrators whose revenue are the highest of the world (BAA, Fraport, Aena, Schiphol Group: by Airline Business issue Dec 2003) andsome Asian big airports administrators (NAA, AAHK, CAAS).
IIAC KIAC
AssetsCurrent Assets 127 353
Fixed Assets
Property, Plant and Equipment
(ex. Construction in Progress)5,416 14,026
Accumlated Depreciation -288 -2,562
Intangible Assets 117 47
Construction in Progress 44 3,348
Investments 43 16
Total Fixed Assets 5,331 14,875
Deffered Charges 0 13
Total Assets 5,459 15,241
Liabilities
Current Liabilities 543 1,897
Long-term Liabilities 2,859 9,195
Total Liabilities 3,401 11,092
Shareholder's Equity
Total Shareholder's Equity 2,057 4,149
Total Liabilities and Equity 5,459 15,241
million $
Proceedings of the Eastern Asia Society for Transportation Studies, Vol. 5, pp. 520 - 532, 2005
526
7/15/2019 Kansai.pdf
http://slidepdf.com/reader/full/kansaipdf 8/13
Figure- 2 Assets and Equity of the Airport Administrators
Figure- 3 Equity Ratio of the Airport Administrators
*NAA: Narita Airport Authority, AAHK: Airport Authority Hong Kong, CAAS:Civil Aviation Authority of SingaporeSources: Financial Statements of each Airport Administrator,
Statistics Bureau (2004): for Exchange rate
38%
27%
49% 50%57%
32%
64%
76%
95%
0%
10%
20%
30%
40%
50%
60%
70%
80%
90%
100%
I I A C
K I A C
B A A
p l c
F r a p o r t
A e n a
N A A
S c h i p h o l
A A
H K
C A A S
0
2
4
6
8
10
12
14
16
I I A C
K
I A C
B A A
p l c
F r
a p o r t
A e n a
N A A
S c h
i p h o l
A A
H K
C
A A S
(billion $)
Total Assets
Equity
Proceedings of the Eastern Asia Society for Transportation Studies, Vol. 5, pp. 520 - 532, 2005
527
7/15/2019 Kansai.pdf
http://slidepdf.com/reader/full/kansaipdf 9/13
Since these airport administrators include both private enterprise and one branch of government, it is not appropriate to easily compare the values. However, there is no doubtthat assets scale of KIX is remarkably large. Although Fraport and Schiphol manage manyairports, the assets of them are smaller than KIX, ICN, NAA and AAHK (These Asian airport
administrator manages only one airport). In Asia, equity ratio of AAHK and CAAS arerelatively high (Figure-3). These facts will reflect that a government invested it in hubairport development intensively. ICN and KIX (Japanese NAA) comparatively have asmaller equity ratio than other airport administrators.
2.5 Comparative Analysis of Financial Conditions of IIAC and KIAC
The financial analysis considers safety and profitability of IIAC and KIAC by some indexes.Since the government sectors are principal shareholders about both airport administrators,
bankruptcy risk is small. Therefore, this analysis puts a focus in liquidity of financialresource than safety. Liquidity ratio and fixed assets ratio are often used as finance safety
indexes. Since airport infrastructure has a characteristic that proportion of fixed assets islarge, this analysis adopts ratio of fixed assets to long-term capital as an index (Equation (1)).The index shows balance of long-term capital finance source and money fixed in the longterm. If the value is small, in general, the financial situation can be judged stable. If thisvalue is large, short-term money liquidity is not good.
LL EQ
FA RFL
+
= (1)
Where RFL: Ratio of Fixed Assets to Long-Term Capital FA: Fixed Assets EQ: Equity LL: Long Term LiabilityAbout both of IIAC and KIAC, a large amount of interest expense causes net deficits. Thisanalysis compares an interest coverage ratio (Equation (2)) index of both airportadministrators. Interest coverage ratio is an index evaluating an interest on money ability to
pay and expresses short-term financial safety from a viewpoint of flow.
IP
II OP ICR
+= (2)
Where ICR: Interest Coverage RatioOP : Operating Profit II : Interest Income IP : Interest Payable
The indices of other airport administrators are shown in Figure-4 in order to consider common point as well as difference of KIAC with IIAC. One of chosen airport
administrators is BAA that the profitability is the highest of the world. The other is AAHK that is administrator of one Asian major airport Hong Kong.
Proceedings of the Eastern Asia Society for Transportation Studies, Vol. 5, pp. 520 - 532, 2005
528

7/15/2019 Kansai.pdf
http://slidepdf.com/reader/full/kansaipdf 10/13
Figure- 4 Stability of the Airport Administrators
In Figure-4, the upper left direction means low safety, and the lower right direction meanshigh safety. Comparing with BAA and AAHK, financial safety condition of IIAC and KIACare not good. If value of FLR is larger than 100%, it means that investment is excessive tocapital. Although FLR of KIAC is the highest, the difference with other airportadministrator is small.
On the other hand, a comparison result of interest coverage ratio shows the tragic situation of IIAC and KIAC. Interest cost cannot be paid back only by operating activity if the index issmaller than 1. In other words net deficits will increase over future. Enlargement of operating profit or decrease of debt burden is necessary to improve this index. Comparedwith BAA and AAHK, there is remarkable difference.
The second financial analysis compares KIAC with IIAC from a viewpoint of profitability.Profitability analysis considers financial characteristic by two indexes which are Ratio of Operating Profit to Sales and Ratio of Net Profit to Sales. In this analysis, BAA and AAHK are comparison objects again.
90%
95%
100%
105%
110%
115%
0% 100% 200% 300% 400% 500% 600%
ICR
R F L
KIAC
IIAC
AAHK
BAA
Proceedings of the Eastern Asia Society for Transportation Studies, Vol. 5, pp. 520 - 532, 2005
529

7/15/2019 Kansai.pdf
http://slidepdf.com/reader/full/kansaipdf 11/13
Figure- 5 Profitability of the Airport Administrators
Figure-5 shows the two indexes of the airport administrators. Both IIAC and KIAC areunder net deficit condition. Operating profit to sales ratio of IIAC is higher than AAHK andKIAC and it is almost BAA's level. IIAC compresses operating cost, and that is the
productive efficiency is high. Operating profit to sales ratio of KIAC is also higher thanAAHK, that is, the productivity is not bad at all. The comparison with other major airportoperators shows the same result (Figure-6). This fact shows that non operating expense of interest cost is fatal reason of difficult financial condition of IIAC and KIAC.
Figure- 6 Operating Profit to Sales Ratio
-30%
-20%
-10%
0%
10%
20%
30%
40%
0% 5% 10% 15% 20% 25% 30% 35%
Ratio of Operating Profit to Sales
R a t i o o f N e t P r o f i t
t o S a l e s
BAA
AAHK
KIACIIAC
26.7%
16.8%
30.6%
15.8%
12.4%
31.7% 32.0%
15.7%
32.1%
0%
5%
10%
15%
20%
25%
30%
35%
I I A C
K I A C
B A A p
l c
F r a p o r t
A e n a
N A A
S c h i p h o l
A A
H K
C A A S
Proceedings of the Eastern Asia Society for Transportation Studies, Vol. 5, pp. 520 - 532, 2005
530

7/15/2019 Kansai.pdf
http://slidepdf.com/reader/full/kansaipdf 12/13
2.6 Summary and Prospect of the Fiscal Characteristics
A serious problem of KIX which ICN did not experience is the slump of demand growth(Figure-7, Figure-8). Actual passengers demand of KIX is less than estimated value beforethe open. The Asian economic crisis of the later half of 1990's, 9.11 Attack in 2001, andSARS and Iraq War in 2003 brought an undesirable influence on Asian international air demand. Air demand of KIX was not of course an exception.
Figure- 7 Passenger Demand Result and Forecast of ICN
Figure- 8 Passenger Demand Result and Forecast of KIX
As well as the social economy situation, the effect of competition between domestic airportsis also one element of KIX's demand slump. Second runway of NRT opened in 2002, and
the capacity increased. As a result, some of international air demand of KIX shifted to NRT.KIX and nearby Osaka Itami Airport are competitive relationship in terms of domestic air transport. Domestic air passengers of Osaka area in general prefer Osaka airport that is
0
5
10
15
20
25
30
35
1 9 9 5
1 9 9 6
1 9 9 7
1 9 9 8
1 9 9 9
2 0 0 0
2 0 0 1
2 0 0 2
2 0 0 3
( m i l l i o n
Result
Forecast
0
5
10
15
2025
30
35
1 9 9 1
1 9 9 3
1 9 9 5
1 9 9 7
1 9 9 9
2 0 0 1
2 0 0 2
2 0 0 3
2 0 0 5
2 0 1 0
( m i l l i o
n
Result
(1991-1999: Gimpo)Forecast
Proceedings of the Eastern Asia Society for Transportation Studies, Vol. 5, pp. 520 - 532, 2005
531

7/15/2019 Kansai.pdf
http://slidepdf.com/reader/full/kansaipdf 13/13
closer from the city center. Since there is no rule regulating domestic air route assignment between the neighbor 2 airports, airlines let services at Osaka Itami Airport be substantial.This artificial supply constraint may help to shift some air demand to KIX. However, it will
be hard to acquire drastic increase.
The airport administrator undertook not only airport operation but also debt burden of theconstruction costs including the land development cost. As a result, only the revenue of theoperation of a single airport and some related businesses must cover debt service payment aswell as operating cost. The current difficult financial condition of KIAC is the consequencewhich is not avoided by capital finance scheme and assets transfer scheme.
3. CONCLUDING REMARKS
Although the current financial situation of IIAC and KIAC is not stable, the operating profitof these operators does not have serious problems. Only "interest payment" is a fatal reason
of net loss. Both airport administrators recognize necessity of buildup of equity capital.User charge increase to cover interest cost (as a fixed cost) enlarges the gap of Airport priceand marginal cost.It will decrease benefit of user and be a factor of demand shift. Decrease of debt burden isthe simplest and most fundamental method to improve financial condition.
Korean government and Japanese government cannot share the budget easily for financing tothe airport administrators. In Japan, non-efficiency of public work projects is criticizedstrictly, and public investment budget is reduced. Even if it meets under such situation, it istask of the government which is largest shareholder to find a way of capital buildup. TheJapanese government decided subsidy expenditure of 9 billion yen per year from FY2003 inorder to strengthen management foundation of KIAC (Ministry of Land, Infrastructure andTransport(2003)). Such strategic fiscal policy is important to achieve successful airport
privatization that needs enormous initial cost.
REFERENCES
Incheon International Airport Corporation (2003): Financial Statement 2002
Kansai Airport Research Institute, Kansai International Airport Co., Ltd. and KansaiInternational Airport Land Development Co., Ltd. (2001): Report of International Airport
Symposium 2001
Kansai International Airport Co., Ltd. (2003): Fiscal 2002 Accounts Settlement
Ministry of Land, Infrastructure and Transport (2003): White Paper on Land,
Infrastructure and Transport in Japan 2003
Statistics Bureau (2004): Sekai no Toukei 2004
Proceedings of the Eastern Asia Society for Transportation Studies, Vol. 5, pp. 520 - 532, 2005
532


