Embed Size (px)
Citation preview


Kangaroo Island
Natural Resources Management Plan
2009
Volume 1 State of the Region 2009

KI Natural Resources Management State of the Region 2009 iv
Kangaroo Island Natural Resources Management Plan 2009 © Kangaroo Island Natural Resources Management Board Introduction to the Plan
Volume 1 – State of the Region 2009 Volume 2 – Kangaroo Island Natural Resources Management Strategic Plan 2009–2019 Volume 3 – Implementation A: Regulatory and Operational Policy Volume 4 – Implementation B: Kangaroo Island Natural Resources Management Board
Business Plan 2009–2012 Volume 5 – Monitoring, Evaluating, Reporting, Learning and Improving NRM ISBN 978-1-921595-00-4 (paperback) ISBN: 978-1-921595-01-1 (CD-ROM) ISBN: 978-1-921595-02-8 (online)

KI Natural Resources Management State of the Region 2009 v
Contents
Introduction............................................................................................................................................ 1 Indigenous people................................................................................................................................. 2
Indigenous cultural assets................................................................................................................... 2 Threats to cultural heritage ................................................................................................................. 3
Socioeconomic profile of Kangaroo Island ........................................................................................ 4 Community capacity for natural resources management................................................................. 5
Human capital ..................................................................................................................................... 6 Social capital ....................................................................................................................................... 7 Natural capital ..................................................................................................................................... 8 Physical capital.................................................................................................................................... 8 Financial capital................................................................................................................................... 8
Land use and economic activity .......................................................................................................... 9 Status and trends ................................................................................................................................ 9 Agriculture ......................................................................................................................................... 11 Inland aquaculture............................................................................................................................. 12 Marine aquaculture ........................................................................................................................... 12 Commercial fishing............................................................................................................................ 12 Plantation forestry ............................................................................................................................. 12 Tourism ............................................................................................................................................. 13 Threats .............................................................................................................................................. 13 Opportunities ..................................................................................................................................... 13
Threats to natural resources.............................................................................................................. 14 Climate and rainfall information......................................................................................................... 14 Climate change ................................................................................................................................. 14 Pest plants, animals and diseases.................................................................................................... 18 Risk analysis framework ................................................................................................................... 21
Soils and landscapes.......................................................................................................................... 24 Socioeconomic values ...................................................................................................................... 24 Region description............................................................................................................................. 24 Land degradation threats and risk analysis ...................................................................................... 31 Current monitoring and investigations .............................................................................................. 45 Information gaps................................................................................................................................ 45
Water resources and aquatic ecosystems........................................................................................ 46 Socioeconomic values ...................................................................................................................... 46 Ecological values............................................................................................................................... 46 Region description............................................................................................................................. 47 Threats and risk analysis .................................................................................................................. 61 Current monitoring and investigations .............................................................................................. 65 Information gaps................................................................................................................................ 65
Terrestrial ecosystems and biodiversity........................................................................................... 66 Socioeconomic values ...................................................................................................................... 66
KI Natural Resources Management State of the Region 2009 vi
Regional description.......................................................................................................................... 66 Condition and trends ......................................................................................................................... 70 Threats and risk analysis .................................................................................................................. 73
Coastal estuarine and marine ecosystems and biodiversity.......................................................... 74 Socioeconomic values ...................................................................................................................... 74 Regional description.......................................................................................................................... 74 Condition and trends ......................................................................................................................... 81 Threats and risk analysis .................................................................................................................. 81 Current monitoring and investigations .............................................................................................. 82 Information gaps................................................................................................................................ 85
Geological features ............................................................................................................................. 88 Overview of geology.......................................................................................................................... 88 Geological monuments ..................................................................................................................... 88
References ........................................................................................................................................... 90

KI Natural Resources Management State of the Region 2009 1
Introduction The State of the Region report describes the natural resources of Kangaroo Island; summarises their condition and the threats to those resources; and outlines the socioeconomic values of the resources. This information is critical in setting the strategic direction for natural resources management on Kangaroo Island for the next 10 years. The report summarises natural resources information under the themes:
soils and landscapes
water resources
native biota
terrestrial ecosystems
aquatic ecosystems
coastal, estuarine and marine ecosystems. The State of the Region report is intended to provide sufficient information to:
enable someone with no prior knowledge to gain a overview understanding of the Island’s natural resources and natural resources issues
identify key issues and risks and set strategic directions for natural resources management on the Island
determine the Board’s investments and actions. More detailed information is available from the referenced sources or by contacting the Board. As required by Regulation 10 (section 4) of the Natural Resources Management Act 2004,this section also includes additional analyses of the risks to natural resources from pest plants and animals. Specific actions to address these risks are detailed in Volumes 2, 3 and 4.

KI Natural Resources Management State of the Region 2009 2
Indigenous people As of the 2006 census, 0.8% of the resident population on Kangaroo Island identified themselves as Indigenous. The Kaurna, Ramindjeri and Ngarrindjerri peoples from nearby mainland South Australia all have a cultural interest in Kangaroo Island. Their traditional association with Kangaroo Island is mythological, with the Island identified as the land of the spirits and the place of the dead where people come to have their spirits cleansed before departing to the after-life. The last permanently resident Indigenous peoples, the Kartan people, left Kangaroo Island some 2300–4000 years ago (Lampert 2002). During the development of the regional NRM plan the Board has endeavoured to effectively engage with those Aboriginal communities with interests in the region. Contact has been made with each community, with a number of meetings and workshops taking place with representatives of the Ramindjeri Heritage Association.
Indigenous cultural assets For Aboriginal people, land and waters have many interconnected and complex values. The significance of land and waters is central to all aspects of Aboriginal people’s lives: at birth, at death, in ceremonies, and socially while hunting, gathering and travelling. The term ‘creation and teaching’ is used to describe the combination of this aspect of life, religion, mythology, lore and history that incorporates the past, present and future. The land or water that an Aboriginal person has a traditional or contemporary association with is commonly referred to as ‘country’. Both ‘country’ and ‘creation and teaching’ are complex concepts and can be difficult for non-aboriginal people to understand. For example, creation and teaching can be a site located in song, in physical space or embodied in an object. Its physical, social or physiological importance can vary according to the speaker’s traditional country, gender, age and personal experience. For these reasons the dreaming is rarely mapped in the Western sense but the significance of a site is integral for Aboriginal people. Furthermore, only Aboriginal people with cultural knowledge of the area know sites associated with these stories. These sites are often landscape features, which can be one or many trees, rocky outcrops, a riverbed or waterhole. These sites physically represent the ancestors and their activities in story, with the knowledge, creation and teachings associated with these sites, passed down through stories of travelers, ancestors and beings. Many creation and teaching stories travel throughout an area and may be known as a ‘creation and teachings trail’, track or line. Some stories focus on specific sacred sites. These stories and traditions exclusively belong to Aboriginal people. Who tells them, where they are told, to whom they are told and when, are all part of Aboriginal culture and must be respected.
KI Natural Resources Management State of the Region 2009 3
The types of Aboriginal sites of significance most likely to be found in South Australia are:
archaeological sites, including open campsites, rock shelters, shell middens and artefact manufacturing sites
burial sites that can be 200 to 20,000 years old
quarry sites, including stone tool, grindstone and ochre quarries
arrangements, including ceremonial sites, hunting hides and fish traps
mythological sites associated with dreamings
historic sites include missions, ration depots, birthplaces and fringe camps
painting and engraving sites
scarred tree sites. Any land, developed or undeveloped, can contain sites relating to the traditions, living patterns and the use of environmental resources such as water, animal and vegetable foods and stone by Aboriginal people, and/or their spiritual beliefs and ceremonial activities. These features in the landscape may be prominent or easily disregarded. Historical sites may have very little material evidence left but are still known in the oral history passed on by Aboriginal people. Certain landforms are more likely to contain evidence of Aboriginal occupation, including stone artefact scatters, campsites or ovens, quarries, shell middens, rock art, ceremonial/religious sites, stone arrangements. These landforms include:
claypans, lakes, rivers and estuaries
areas within 100 m of the banks of creeks, rivers, watercourses, lakes, waterholes, rock holes, wells, and springs especially in arid areas
rocky outcrops
dunes, sand hills and sand bodies, especially in the vicinity of water sources, wells, springs, waterholes
craters and sinkholes
areas within 200 m of coasts and waterways
unusual land features are likely to have mythological significance
bush or forested areas
areas of natural vegetation or intact ground surface such as parklands, reserves, open space and road verges.
Threats to cultural heritage Most elements of Indigenous cultural heritage are intimately related to land. This means that the same threats that pose risks to natural resources can also be a risk for

KI Natural Resources Management State of the Region 2009 4
Indigenous cultural heritage assets. These include threats such as vegetation clearance, erosion, poorly planned earthworks and infrastructure, and loss of environmental flows. The Aboriginal Heritage Act 1988 covers all areas of South Australia, providing blanket protection for Aboriginal remains and Aboriginal sites and objects of significance to Aboriginal archaeology, anthropology, history and tradition. The Board will work with and support Aboriginal communities in the management of their lands and cultural assets within the region.
Socioeconomic profile of Kangaroo Island The Kangaroo Island resident population of 4446 (ABS 2006) is forecast to be 4662 by 2016. The bulk of the population is concentrated around the eastern end of the Island at Kingscote, American River and Penneshaw, with the remaining scattered throughout the rural areas and in the centre of the Island at Parndana. Off-Island ownership of land is a significant characteristic of the Island’s real estate; approximately 40% of ratepayers living off the Island. Kangaroo Island’s population is characterised by an ‘hour-glass’ configuration, with 28.4% in the 0–24 age group, 9.7% in the 25–34 age group, and 62% in the 35 and over age group (ABS 2006). At 30 June 2006, 44.9% of the population over 15 years had post-school qualifications. According to the 2006 ABS Census, 2206 residents aged 15 years and over were in the labour force. Of these, 52.9% were employed full-time, 35.3% were employed part-time, 5.4% were employed but away from work, 2.1% were employed but did not state their hours worked and 4.2% were unemployed. There were 1007 usual residents aged 15 years and over not in the labour force. Table 1 shows the distribution of employment across occupations (ABS 2006).
Table 1. Employment occupations on Kangaroo Island
Occupation % of total employed persons
Managers 28.2
Professionals 10.1
Technicians and trades workers 10.5
Community and personal service workers 11.0
Clerical and administrative workers 9.1
Sales workers 8.4
Machinery operators and drivers 5.4
Labourers 15.8
Inadequately described/not stated 1.5

KI Natural Resources Management State of the Region 2009 5
Incomes on the Island are on average lower than across Australia. The 2006 ABS Census identified the median weekly individual income for persons aged 15 years and over who were usual Kangaroo Island residents as $414, compared with $466 across all of Australia. The median weekly household income was $749 ($1027 across Australia). The median weekly family income was $1002 ($1171 across Australia). The Island’s economy is predominately based on natural resources with primary industries and tourism together accounting for around 90% of the gross regional product. Agriculture, fisheries and forestry are the largest employing industries on Kangaroo Island, accounting for 29% (or 542 jobs). Retail and hospitality industries account for a further 25% (472) of jobs, providing a broad indication of the significance of tourism to the Kangaroo Island economy (Econsearch 2005). Kangaroo Island hosts in the order of 165,000 visitors annually: around 35,000 from overseas, with the remainder from interstate and mainland South Australia (SATC 2008). A 2002 report assessing the economic impacts of protected areas on Kangaroo Island estimated that tourism created 650 jobs on the Island (Hudson Howells 2002). Major industry developments on Kangaroo Island over the past 10 years include:
growth in the tourism industry from visitation of an estimated 85,000 in 1991–94 (PPK 1991) to 165,000 in 2007( SATC 2008)
growth in the cropping industry, from around 8000 ha in 1990 to over 23,000 ha in 2003 – the most significant land use change on the Island over this time period – producing around 60,000 tonnes per annum
decline in the sheep flock from around 864,441 in 1996–97 to 805,443 in 2002 (Econsearch 2005) although the sheep meat and wool industries remain the largest contributors to the Island’s agricultural sector
increase in cattle production
some small–medium scale farm diversification into viticulture, seed potatoes, dairying, chickens (meat and eggs), apiary, marron
a small number of large scale land-based aquaculture developments
growth in the plantation forestry industry from 3200 ha in 2000 to 20,300 ha in 2008.
Community capacity for natural resources management Community capacity to undertake any action, whether natural resources management, agricultural production or running a major event, can be described by the levels of human, social, natural, physical and financial capital within the community (Nilsen et al. 2006). Table 2 shows examples of the attributes that describe each of these capitals.

KI Natural Resources Management State of the Region 2009 6
Table 2. Community capacity – capitals and examples of attributes
Capital Attributes
Human Population Education, skills, knowledge Health, physical capabilities, age
Social Networks and connections Involvement in industry/community bodies Access to information/support Shared awareness, values and understandings
Natural Soil, water and biological resources Levels of resource degradation
Physical Land Infrastructure Tools and machinery
Financial Income sources and diversity Access to credit Debt levels Government intervention and support
Source: Nilsen et al. 2006 There have been numerous workshops undertaken with the Kangaroo Island community in recent years that have looked at a range of issues include values, goals and visions for the island. Previous community consultation and planning activities have identified the following community values of:
a safe, clean and healthy environment
expansive and relatively unchanged rural and natural landscapes (particularly coastline)
abundant and highly visible wildlife
relative solitude through a small and sparsely spread population
unpretentious and relaxed lifestyle
strong sense of community and common bond with the land and its heritage
a viable and healthy economy.
Human capital The Island’s relatively small population is increasing at less than 1% per annum, and is older on average than the whole of South Australia. This is largely due to the small number of people in the 15–24 year age group and large number in the 55–64 year age group (ABS 2006). The lack of young people is common to many rural communities and does limit capacity.

KI Natural Resources Management State of the Region 2009 7
Table 3 compares the occupations of all employed people over 15 on Kangaroo Island to all of Australia. The large percentage of managers reflects the large number of small businesses including farmers. The relatively high number of labourers and low numbers of professionals and clerical/administrative workers reflects the importance of primary industries. The relatively low level of technical and trades workers is also a capacity constraint. There is a great diversity in qualifications and the skills of some people on the Island, such as artists, are not reflected in the occupation statistics.
Table 3. Occupations of employed people over 15, on Kangaroo Island and in all of Australia
Occupation Kangaroo Island Australia
Managers 28.3% 13.2%
Labourers 16.0% 10.5%
Community and personal service workers 10.9% 8.8%
Technicians and trades workers 10.5% 14.4%
Professionals 10.2% 19.8%
Clerical and administrative workers 9.2% 15.0%
Sales workers 8.3% 9.8%
Machinery operators and drivers 5.3% 6.6%
Source: ABS Census 2006
Social capital Social networks and membership of organisations are strong on Kangaroo Island reflecting the self-reliant nature of most island communities. The level of volunteering on Kangaroo Island is high with 42.4% of the population 15 years and over, undertaking voluntary work for an organisation or group (ABS 2006). Volunteers make significant contributions to natural resources management through their involvement in on-ground works, biodiversity surveys, Landcare activities and revegetation projects. The Island’s progress associations, Landcare and industry groups form an extensive network of volunteers within the region. Access to information is problematic for parts of the Island community especially for those without the capability to access the internet, which increasingly delivers industry, community, government and social information. At June 2006, 55.2% of occupied private dwellings on Kangaroo Island had access to the internet. Other social infrastructure, such as meeting places, appears to be adequate. The Island is well served by educational and health providers with primary and secondary schools at the three major centres. Post-secondary education and training is available at TAFE at Kingscote. Non-government organisations also contribute to the enhancement of community capacity through training and education opportunities.

KI Natural Resources Management State of the Region 2009 8
Environmental/natural resource management education is a strong theme in the education and training sector within the region. The Kangaroo Island Health Service, in combination with visiting professionals and some private practitioners, provides a wide range of services.
Natural capital The natural assets are described elsewhere in this volume.
Physical capital Agricultural land on the Island occupies about 210,000 ha. Full descriptions of the Island’s telecommunications, transport, water and electricity infrastructure can be found at the Kangaroo Island Development Board’s website.
Financial capital Kangaroo Island had an estimated gross regional product in 2001–02 of $135 million with the value of agricultural industries estimated at $69 million and tourism expenditure contributing $53 million to the Kangaroo Island economy. Econsearch (2003) estimated the value of household income on the Island to be $60 million, with the sheep industry, trade, and transport being the greatest contributors. Kangaroo Island’s average annual taxable income has been consistently lower over a 10-year period than South Australia as a whole, and other South Australian regions. Information on median weekly income (ABS 2006) shows that on Kangaroo Island, the median weekly income for resident individuals aged 15 years and over, for households and for families is lower than the Australia-wide median.

KI Natural Resources Management State of the Region 2009 9
Land use and economic activity The major land uses are primary production (~50% of the Island’s area) and conservation (~50%). Agriculture is the largest sector of the Island’s economy. It is based predominately on livestock and increasingly on field crops, with some viticulture and horticultural developments, particularly seed potatoes. Plantation forestry is expanding rapidly. Tourism is the second largest section of the economy and is largely nature-based, with one-third of visitors being international. Conservation areas, notably national parks, play a significant role in that nature-based tourism. Other smaller land uses include inland aquaculture and food-related farm tourism.
Status and trends Kangaroo Island land use remains dominated by dryland agriculture and conservation, with plantation forestry the next largest in terms of area (Figure 1). Land use was mapped in March 2008 (Table 4) and previously in 2000. The most significant trend in land use change in the period, 2000–08, has been the conversion of approximately 17,000 ha of land from agriculture to plantation forestry.
Table 4. Major land uses, March 2008*
Land use Area (ha)
Conservation and natural environments 215,970
Hardwood forestry production 18,637
Softwood forestry production 5,257
Dryland agriculture 183,363
Irrigated agriculture 611
Intensive uses (includes urban and commercial) 8,805
Wetlands – marshes 2,019
Wetlands – open water 5,175
TOTAL 439,836
* DWLBC Land use survey, March 2008

KI Natural Resources Management State of the Region 2009 11
Agriculture On the approximately 184,000 ha of dryland and irrigated agriculture, the major enterprises are still sheep for wool and, increasingly, prime lambs. In the late 1980s and early 1990s, the value of agriculture to the Kangaroo Island economy declined by 20%. Agricultural land was converted to other purposes and farms were amalgamated. During this time there was a significant decline in sheep numbers. Many primary producers were driven to diversify into alternative on-farm activities such as prime lamb, dairy (including sheep dairies), aquaculture (including marron) and a broader range of crops (wheat, canola, triticale and pulses) as well as horticultural pursuits like vines and olives. Growth in the cropping industry, from around 8000 ha in 1990 to over 23,000 ha in 2003 has been a significant land use change. Emerging industries include farm and plantation forestry, orchards and horticultural ventures (including viticulture, olives and essential oils) and seed potatoes. In recent years the trend among many farmers has been to remain in the same traditional enterprises, such as wool or lambs, but to aim for improvements in production and reduction of costs, for example an increased focus on increasing wool clip and on higher-priced finer fleeces. Farm-gate value of production peaked in 2002–2003 at an estimated $80 million and has declined since then (Figure 2).
Figure 2. Farm gate value of primary production on Kangaroo Island (Source: Food SA Kangaroo Island Regional Food Scorecard 2005–06)

KI Natural Resources Management State of the Region 2009 12
Inland aquaculture Inland aquaculture using yabbies and marron developed in the 1990s as farmers sought to diversify away from traditional enterprises. In recent years this trend has reversed and there are only a small number of commercial growers although opportunities to expand exist.
Marine aquaculture Marine and land-based farming of oysters, and greenlip and blacklip abalone, is currently undertaken on the Island.
Commercial fishing Commercial fishing targets all major species including whiting, shark, garfish, salmon, wild abalone and rock lobsters. Fish are freighted to the mainland for processing or sale. The estimated annual value of the Kangaroo Island fish catch is around $10 million (KINRB 2003).
Plantation forestry Plantation forestry has grown by around 17,000 ha in the period 2000–2008 to a total area of around 23,000 ha (DWLBC 2008). Almost all of this growth has been in areas planted to Tasmanian blue gums (Eucalyptus globulus). The forest industry considers around 82,000 ha as suitable for plantation forestry in the 600–900 mm mean annual rainfall zone on Kangaroo Island (Kangaroo Island Forestry Steering Committee 2001). Viticulture There are 30 grape growers and several processing facilities on the island. Kangaroo Island is emerging as South Australia’s newest wine region. Bee industry Kangaroo Island is home to the last remaining pure strain of Ligurian bees in the world. Several commercial growers are developing a thriving honey products and processing industry that is supported by a statutory sanctuary zone. Food industry and processing Kangaroo Island has become well known for its high quality corn-fed free-range chickens and free-range eggs. There are several olive growers on the Island, with one having reached the stage of commercial production of high quality oil. The Island also boasts a sheep dairy, producing a range of quality cheeses and yoghurts. Yacca harvesting is undertaken on a relatively small scale with limited processing serving export markets. Horticulture Vegetable seed production, notably potato, has emerged as a new industry on the Island in the past 10 years. The Island has been declared a potato production zone effectively providing quarantine restrictions for the industry. Local producers are using the KI Narrow Leaf Mallee to produce quality eucalyptus oil and products. Lavender growers are also producing a range of quality cosmetic products.

KI Natural Resources Management State of the Region 2009 13
Tourism Tourism is the second largest contributor to the Island’s economy after primary industries. Estimates of the economic value of the industry vary but all are significant. A 2002 report assessing the economic impacts of protected areas on Kangaroo Island estimated that tourism created 650 jobs on the Island (Hudson Howells 2002). In the period 2001–2004 the total average annual expenditure by visitors was an estimated $65 million (URPS 2006).
Threats All of Kangaroo Island’s key industries rely on natural resources. Any of the threats to natural resources documented elsewhere in the Plan can have impacts on, and economic consequences for, these industries. Those threats, such as soil acidity or water quality decline or loss of biodiversity, are addressed in other sections of this volume. Apart from natural resources threats, other threats to natural resources-based industries are largely outside the scope of the influence of NRM Boards, for example: loss of highly productive agricultural land to other uses, rising international and national travel costs, currency and commodity price fluctuations, and loss of rural populations. These threats need to be monitored for their potential impacts on Kangaroo Island’s natural resources and natural resources-based industries.
Opportunities A range of potential future industry options will require good natural resources information and management if they are to be economically and ecologically successful:
Aquaculture (land based and marine): The Island’s clean marine waters are a significant advantage for aquaculture. Any expansion will require a sound approach to environmental and planning issues so as to maintain the Island’s ‘wilderness’ appeal for the international tourism market.
Tourism: The Island’s international profile has grown in recent years with several key awards such as being listed in National Geographic’s Top Ten Island destinations. The Kangaroo Island Strategic Tourism Plan (URPS 2006) identifies a range of opportunities to grow tourism.
Existing agricultural enterprises: The productive capacity of these enterprises can continue to improve, for example through wool improvements and cropping technology.
Plantation forestry: Pulp prices and costs will influence the capacity of forestry to develop into a sustainable future industry. Forestry can contribute to reducing salinity and improving water quality when placed appropriately within the landscape.
High-value horticulture: Climate projections for South Australia will only increase the attractiveness of Kangaroo Island’s relatively plentiful water supply for certain horticultural crops. Crop suitability modelling using DWLBC data combined with micro-climate modelling may assist.
Biomass for fuel: This could be an industry in conjunction with plantation forestry using thinnings and waste.

KI Natural Resources Management State of the Region 2009 14
Carbon capture and storage: A future emissions trading scheme could find a place in forests and other planted woody vegetation on Kangaroo Island.
Threats to natural resources Natural resources on Kangaroo Island are exposed to a range of threats to their condition. Specific threats to specific natural resources are described in later sections on each natural resource. Some broader threats pose a risk to the condition of many natural resources and the socioeconomic values for the resources. These general threats are addressed below.
Climate and rainfall information The Island experiences a relatively mild temperate climate during summer and winter (Table 5). Central areas of the Island occasionally have cooler and hotter days.
Table 5. Kingscote weather
January June
Average temperatures max. 23.5 min. 14.6 max. 15.2 min. 9.2
Daily bright sunshine 9.9 hours 4.5 hours
Rain days (more than 1.0 mm) 0 2 12 Average annual rainfall varies significantly across the Island. Areas of the Gosse Plateau on the northwestern end of the Island receive up to 900–1000 mm, while the area around Kingscote receives approximately 400 mm.
Climate change Predicted changes to climate pose serious risks to natural resources and to the socioeconomic values of those resources on Kangaroo Island. Climate Change 2007, the fourth assessment report on climate change by the Intergovernmental Panel on Climate Change (IPCC) provides greater clarity on climate change causes, impacts, adaptation and mitigation strategies. According to the Synthesis Report (IPPC 2007) climate change is real and is more than 90% likely to be caused by the increases in atmospheric greenhouse gas concentrations due to human activities. The report states “Warming of the climate system is unequivocal, as is now evident from observations of increases in global average air and ocean temperatures, widespread melting of snow and ice and rising global average sea level” (IPCC 2007, pg 8). Further it states “Most of the observed increase in global average temperatures since the mid-20th century is very likely due to the observed increase in anthropogenic GHG [greenhouse gas] concentrations” (IPCC 2007, pg 17). The IPCC use specific definitions of terms describing the probability of occurrence. The definition of ‘very likely’ is that, on the basis of expert judgment and statistical analysis of a body of evidence, the

KI Natural Resources Management State of the Region 2009 15
probability of global warming being due to human induced increases in greenhouse gas concentrations is more than 90%. More recent evidence suggests that climate change impacts are occurring sooner and more rapidly than predicted by the IPCC 2007 (Brook 2007). This includes increases in global temperature, changes in annual rainfall and sea level rise. There are scientific uncertainties in assessing potential climate change impacts at a regional scale. The best available information for Kangaroo Island comes from a CSIRO study commissioned by the South Australian Government to assess climate change impacts in South Australia (Suppiah et al. 2006). Table 6 shows the range of predicted impacts on rainfall and temperature for Kangaroo Island using global scenarios that assume no policies to reduce emissions (SRES 2000). Tables 7 and 8 show the range of predicted impacts on rainfall and temperature for Kangaroo Island using two levels of reductions in greenhouse gas emissions, stabilising at 450 ppm in 2100 and 550 ppm in 2150.
Table 6. Predicted impacts for Kangaroo Island using all SRES 2000* scenarios
Predicted impacts Annual Summer Autumn Winter Spring
Range of warming (°C) by 2030 0.3 to 1.0 0.3 to 1.1 0.3 to 1.1 0.3 to 1.0 0.3 to 1.0
Range of rainfall changes in percentage by 2030 -11 to -1 -10 to +2 -10 to +1 -11 to -1 -18 to -2
Range of warming (°C) by 2070 0.6 to 3.0 0.6 to 3.4 0.7 to 3.3 0.6 to 3.1 0.6 to 3.1
Range of rainfall changes in percentage by 2070 -30 to -3 -30 to +7 -30 to +4 -35 to -3 -55 to -4
Source: Suppiah et al. 2006
*SRES 2000, Special Report on Emission Scenarios (IPCC Working Group 3 report)
Table 7. Predicted impacts for Kangaroo Island using emission reduction scenario 1*
Predicted impacts Annual Summer Autumn Winter Spring
Range of warming (°C) by 2030 0.3 to 0.7 0.3 to 0.8 0.3 to 0.8 0.3 to 0.7 0.3 to 0.7
Range of rainfall changes in percentage by 2030 -8 to -1 -7 to +2 -7 to +1 -8 to -1 -13 to -2
Range of warming (°C) by 2070 0.6 to 1.6 0.6 to 1.8 0.6 to 1.7 0.6 to 1.6 0.6 to 1.6
Range of rainfall changes in percentage by 2070 -17 to -3 -16 to +3 -16 to +2 -18 to -3 -30 to -3
Source: Suppiah et al. 2006
* Emission reduction scenario 1 – a path that stabilises CO2 at 450 ppm by the year 2100
Table 8. Predicted impacts for Kangaroo Island using emission reduction scenario 2*
Predicted impacts Annual Summer Autumn Winter Spring
Range of warming (°C) by 2030 0.3 to 0.8 0.3 to 0.9 0.3 to 0.8 0.3 to 0.8 0.3 to 0.8
Range of rainfall changes in percentage by 2030 -8 to -1 -8 to +2 -8 to +1 -9 to -1 -14 to -2
Range of warming (°C) by 2070 0.7 to 1.9 0.7 to 2.1 0.8 to 2.0 0.7 to 1.9 0.7 to 2.0
Range of rainfall changes in percentage by 2070 -20 to -3 -20 to +4 -19 to +2 -21 to -3 -35 to -4
Source: Suppiah et al. 2006
* Emission reduction scenario 2 – a path that stabilises CO2 at 550 ppm by the year 2150

KI Natural Resources Management State of the Region 2009 16
Other predicted changes to global climate that may impact on Kangaroo Island include increased annual rainfall variability, increased frequency of droughts, more severe rainfall events and storms, and a projected sea level rise of 18-59 cm by 2100 (CSIRO and Bureau of Meteorology 2007). Others predict that sea levels may rise much higher (Rahmstorf et al. 2007). Potential risks for Kangaroo Island arising from these predicted changes to climate are:
reduced and increased variability in mean annual runoff – may have serious implications for public water supply, farm water supplies and aquatic ecosystem function (a 10% decline in mean annual rainfall could lead to a 20-30% decline in runoff)
damage to coastal ecosystems and infrastructure from rising sea levels and storm surges – Western Cove and Brownlow are high risk areas
increased fire risks and likely increased bushfire frequency – will increase the resources needed to protect infrastructure and produce unpredictable ecosystem and biodiversity impacts
impacts on biodiversity and ecosystems including the distribution, abundance, life cycles and physiology of plants and animals
increased erosion risks in coastal dune systems due to drying and loss of vegetative cover
more unpredictable and episodic groundwater recharge processes with unknown impacts on dryland salinity
increased risks of environmental and agricultural pest species becoming established due to changing temperature and moisture conditions
changes to land suitability especially in relation to soil erosion risk
reductions in crop yields and pasture production due to lower and more variable rainfall – the predicted large reductions in spring rainfall could significantly reduce animal production
impacts on oceans and fisheries due to changes in temperature, ocean currents, winds, rainfall, sea level, ocean chemistry and extreme weather conditions.
Assessing NRM vulnerabilities to climate change A framework to assess how vulnerable NRM sectors are to climate change was applied to the Adelaide and Mount Lofty Ranges NRM region (Bardsley 2006). This framework (Figure 3) was developed for the Australian Government (The Allen Consulting Group 2005). In this framework ‘exposure’ encompasses the magnitude and probability of climate change to which a system is exposed; ‘sensitivity’ covers the degree to which systems might change in response to climate changes and the nature and reversibility of any changes to a system; ‘adaptive capacity’ describes the ability of a system to change in a way that makes it better adapted to the new climate.

KI Natural Resources Management State of the Region 2009 17
Table 9 summarises the vulnerability analysis for the AMLR region. Given the coarseness of regional climate change predictions and the many similarities between the two regions, these analyses could be taken as indicative for the Kangaroo Island NRM region. If so, then the following NRM assets and issues on Kangaroo Island have a medium–high vulnerability to predicted climate change: riparian flood management, coastal flooding, beaches, terrestrial and freshwater biodiversity, horticulture (mainly vines) and bushfires. Marine systems, including fisheries and aquaculture, were not included in the AMLR analysis. Freshwater biodiversity is at the single biggest risk as it is rated as having a high vulnerability and also limited adaptive capacity, as has riparian flood management. Coastal flooding, beaches, terrestrial biodiversity, bushfires and horticulture can all have effective adaptation measures implemented to increase their capacity to deal with predicted changes.
Figure 3. Process to assess vulnerability to climate change Source: The Allen Consulting Group 2005

KI Natural Resources Management State of the Region 2009 18
Table 9. Summary of vulnerability analyses for NRM in the Adelaide and Mount Lofty Ranges NRM region
Source: Bardsley 2006
Pest plants, animals and diseases Existing pests and potential new pests arriving on Kangaroo Island have the potential to devastate natural ecosystems and primary production as well as impact on water quality. Identifying species that pose significant threats to the Island is a key step in protecting its assets. Risk assessments of potential new pest species in the Kangaroo Island Biosecurity Strategy Project (Gellard 2005) are presented here. Additional information on pest plant and animal risk assessment and management is available on the Board’s website (www.kinrm.sa.gov.au). Phytophthora cinnamomi is a member of the Phytophthora family. It originated in Sumatra and can now be found on Kangaroo Island. Where it becomes established it can kill a high proportion of the understorey. The primary mode of spread of Phytophthora cinnamomi is through wet soil. Within large blocks of native vegetation it poses significant threat to biodiversity because of its potential to kill an array of plant species and alter habitat for animals.

KI Natural Resources Management State of the Region 2009 19
In addition to introduced non-native species, there are a number of native species including kangaroos, wallabies, possums, koalas, cape barren geese and little corellas whose over-abundance can have significant impacts on biodiversity and primary production assets. Table 10 lists high priority potential pest plants that have been identified using a risk assessment framework, which considered the potential invasiveness of each pest species. This framework, used by DWLBC, was developed specifically for pest species (Virtue et al. 2004). Table 11 lists high priority potential pest vertebrate animals that have been identified using a risk assessment framework that considered the potential invasiveness of each pest species (Bomford 2003). Tables 12 and 13 list high-risk potential invertebrate and marine pest species for Kangaroo Island. These lists were developed using specific risk assessment methods for invertebrates (Gellard 2005). and marine pest vectors (Kinloch et al, 2003) Not all of these pests are prohibited from entry to Kangaroo Island and legislative changes are required to ensure that all the listed species are declared as serious pests for the Kangaroo Island region. Some species may also be present on Kangaroo Island as domestic pets, garden plants or species used in primary production.
Table 10. High priority potential Kangaroo Island pest plants
Common name Scientific name Comparative weed risk
Feasibility of containment
Priority for action
Skeleton weed (d) Chondrilla juncea 114 18 1 Mexican feathergrass (d) Nassella tenuissima 112 25 2 Serrated tussock (d) Nassella trichotoma 112 25 3 Boneseed (d) Chrysanthemoides monilifera 98 15 4 Coolatai grass (d) Hyparrhenia hirta 90 18 5 Chilean needlegrass (d) Nassella hyalina 88 22 6 Texas needlegrass (d) Nassella leucotricha 88 22 7 Branched broomrape (d) Orobanche ramosa 77 12 8 Innocent weed (d) Cenchrus incertus 62 18 9 African lovegrass (d) Eragrostis curvula 45 10 10 Soldier thistle (d) Picnomon acama 39 11 11 Cape tulip, 2-leaf (d) Moraea miniata 39 18 12 Alligator weed (d) Altemanthera philoxeroides 51 33 13

KI Natural Resources Management State of the Region 2009 20
Table 11. High priority potential pest vertebrate animals for Kangaroo Island
Common name Scientific name Birds All exotic birds (except domestic
turkey, goose and fowl)
Mammals European rabbit (d) Oryctolagus cuniculus European hare (d) Lepus europaeus Red fox (d) Vulpes vulpes Domestic cat* Felis catus Domestic ferret* Mustela putorius furo Hog deer Axis porcinus Java Rusa deer Cervis timorensis Sambar Cervis unicolor Chital (axis) deer Axis axis Red deer*or Wapiti Cervus elaphus Fallow deer* Cervus dama Goat* Capra hircus Guinea pig* Cavia porcellus Brown rat Rattus norvegicus Zebu cattle Bos indicus Alpaca* Vicugna pacos Llama Lama glama Arabian camel Camelus dromedarius
(d) declared under state legislation for Kangaroo Island * present on Kangaroo Island as domestic animals Table 12. Potential pest invertebrates for Kangaroo Island
Common name Scientific name Risk category European Honeybee Apis melifera High American foulbrood Paenibacillus High European foulbrood Melissococcus plutonius High Chalkbrood Ascosphaera apis High European wasp Vespula germanica High Phylloxera Phylloxera High Common white snail Cernuella virgato Significant White Italian snail Theba pisana Significant Pointed snail Cochlicella acuta Significant Small pointed snail Cochlicella barbara Significant Australian plague locust Chortoicetes terminifera Significant Red fire ant Solenopsis invicta Significant Citrus canker Xanthomonas axonopodis pathovar citri Significant European house borer Hylotrupes bajulus Significant Yellow crazy ant Anoplolepis gracilipes Significant

KI Natural Resources Management State of the Region 2009 21
Table 13. High priority potential marine pests for Kangaroo Island
Common name Scientific name Notes Dinoflagellate (D) Alexandrium catenella Ascidean Ascidiella aspera Colonial ascidean Botryllus schlosseri Bryozoan (sea moss) Bugula flabetalla Bryozoan (sea moss) Bugula neritina European shore crab Carcinus maenas Tropical jellyfish Cassiopea ndrosia Aquarium caulerpa (D) Caulerpa taxifolia European sea squirt Ciona intestinalis First dicovered American River, Nov 2008 Slater Eurylana arcuata New Zealand greenlip mussel Perna canaliculus Red alga Polysiphonia brodiaei European fan worm (D) Sabella spallanzanii First discovered Kingscote, Feb 2008 and
American River Nov 2008 Sea squirt Styela plicata Lace coral Watersipora arcuata European clam (D) Corbula gibba Dinoflagellate (D) Alexandrium tamarense Northern Pacific seastar (D) Asterias amurensis Dinoflagellate (D) Botrylloides leachi Northern Pacific seastar (D) Maoricolpus roseus Colonial ascidean Mytilopsis sallei New Zealand screw shell Perna viridis Black striped mussel (D) Undaria pinnatifida Asian Green mussel Alexandrium catenella Wakame (Japanese) (D) Ascidiella aspera
(D) declared as a national exotic marine species
Risk analysis framework A risk analysis framework was developed and applied to specific threats to specific natural resources. The results of that analysis are summarised in each of the following sections describing natural resources. The risk analysis framework was used to determine technical priorities for action to address the threats. Technical priorities are based purely on a technical assessment and take no account of social and economic drivers. Additional analysis and planning processes were then used to identify the final priorities. The risk analysis framework allows for qualitative analysis of both biophysical and management need factors to determine an overall technical priority (Figure 4). The biophysical risk assessment considers the likelihood of the risk occurring and the

KI Natural Resources Management State of the Region 2009 22
consequence of it occurring. The management need assessment considers the technical feasibility and urgency of taking action. The framework was used, as shown in the following equations, in a workshop process using technical experts in each field. A 10-year risk assessment horizon was used consistent with the timeframe of the strategic plan.
Biophysical risk assessment (RA) = Likelihood of threat occurring in next 10 years × Consequence of threat occurring
Management need assessment (MN) = Lag (from threat occurring to impact) × Preventability (of threat)/reversibility (of impact)
Technical priority (TP) = RA + MN

KI Natural Resources Management State of the Region 2009 23
Days 6 Certain 6 12 18 24 30 36
Weeks 5 Almost certain 5 10 15 20 25 30
Months 4 Likely 4 8 12 16 20 24
Years 3 Possible 3 6 9 12 15 18
Decades 2 Unlikely 2 4 6 8 10 12
Centuries 1 Rare 1 2 3 4 5 6
Indicative recurrence
interval
1 No detectable
impact
2 Insignificant
3 Minor
4 Moderate
5 Major
6 Catastrophic
Area affected Insignificant Minor Small Some
Large proportion of
region Entire region
Severity of impact Not measurable Minor Some Moderate Severe Catastrophic
Recovery potential Hours Weeks Months Years Decades Nil or >100 years
6 Immediate 6 12 18 24 30
5 Weeks 5 10 15 20 25
4 Months 4 8 12 16 20
3 Years 3 6 9 12 15
2 Decades 2 4 6 8 10
1 Centuries 1 2 3 4 5
1
Not preventable / irreversible
2 Major resources &/or new
technology needed to reverse below threshold /
prevent reaching threshold
3 Preventable / reversible with
current technology but needs significant
resources
4 Preventable / reversible with
current technology & some additional
resources
5 Easily reversed / prevented with
current resources & technology
6 Will recover / or be prevented with no intervention
Like
lihoo
d of
risk
occ
urrin
g in
nex
t 10
year
s
Consequence of risk occurring
Biophysical risk assessment (RA)
Management need assessment (MN)
Lag
(from
risk
occ
urrin
g to
impa
ct)
Preventability/reversibility
Figure 4. Risk assessment framework

KI Natural Resources Management State of the Region 2009 24
Soils and landscapes
Socioeconomic values Soils and landscapes are of major socioeconomic importance for the Kangaroo Island community. These resources support primary industries and tourism, which collectively are the basis of the Island’s economy. Landscape forms part of the social and tourism value of the Island’s environment and lifestyle. In 2002–2003, primary industries contributed 33% of gross regional product and 35% of total employment; and tourism demand contributed 20% of gross regional product and 23% of total employment (Econsearch 2005). Collectively, lifestyle and environment were the main or other reason that 61% of the residents surveyed choose to live on Kangaroo Island (Colmar Brunton Research Services 2007).
Region description The soils and landscapes are described using information primarily from Hall (2008) with additional information from Grinter and Mooney (2001). The region description (Table 14) incorporates information on land degradation risks, interrelationships with other natural resources and some key land management issues. Hall (2008), which is based upon the mapping and resource information from DWLBC (2007a), is the most detailed land resource information that exists and can be presented at different scales and used for a range of purposes. It is presented here at a biophysical subregional scale. The finer scale mapping and information that forms the basis for the subregional scale can be used to show the distribution of soil types, land degradation risks, and to undertake crop suitability analyses. Biophysical subregions are areas of land that form broad divisions within biophysical regional areas, their delineation is based on considerations of the nature of soils, landscapes, geology, native vegetation, climate and land use. The region has been divided into 5 biophysical subregions (Figure 5), which have been derived from amalgamations of the 56 land systems mapped across the Island. These, in turn, are made up of soil landscape map units and described map unit components. Based on defined criteria (see Maschmedt 2002), 40 land and soil characteristics have been described for each map unit or component. For detailed maps, data and background information see DWLBC (2007a,b) or contact the Board.

KI Natural Resources Management State of the Region 2009 26
Table 14. Biophysical subregions of Kangaroo Island – description and land degradation risks
Central Plains (KP) Central Plateau (KC) Eastern Plateau (KE) Northern Slopes (KN) South Coast (KS)
Area (ha) 44,200 179,000 52,300 69,700 95,800
Average rainfall (mm/yr)
450–550 600–900 500–650 550–800 550–750
Reso
urce
des
crip
tion
Description The subregion is predominantly formed on Tertiary–Quaternary age marine and riverine clayey sediments, with an overlay of wind-blown sand in many areas, and lies below the level of adjacent plateaus and rises. Lagoons and old lake floors are a common feature of the Central Plains landscapes. Included in the subregion are the plains associated with Lake Ada, Murray Lagoon and White Lagoon, the MacGillivray Plains, the plains associated with the lower Cygnet River, and the plains adjacent to the Bay of Shoals.
The subregion is formed on Cambrian-age Kanmantoo Group rocks (mostly meta-sandstone). Plateau surfaces and adjacent creek and gully slopes dominate the landscape; some plateaus are highly dissected by streams, especially in the west and southwest. Plateau areas have thick (e.g. 10–20 m), deeply weathered sediments on rock, and contain ironstone gravel in surface layers. Included in the subregion are the main central Kangaroo Island plateau and the northern plateau, which are separated by the Cygnet–Snelling Fault Zone.
The subregion is similar to the Central Plateau subregion in many regards, with many areas comprising deeply weathered regolith with ironstone gravel in upper layers and underlying Cambrian-age rocks. However, basement rocks often have finer texture, topsoils are typically thinner, the ironstone gravelly soil layer contains less gravel and is also thinner; clayey soils cover a significant area, and carboneous subsoils are a relatively common feature. In addition, this subregion includes the unique flat-topped Wisanger Hills, which are formed from Jurassic-age basalt, with adjacent slopes formed from clayey outwash and some Permian-age, glacially derived clayey sediments. A large intrusive granitic area also occurs in the very eastern part of the Dudley Peninsula. Most landscapes consist of plateau areas; streams and drainage depressions, rises to low hills and coastal slopes also occur.
The subregion is formed of Cambrian-age rock, mostly siltstone, phyllite and meta-sandstone, predominantly at shallow depth. It mainly consists of steep, rocky terrain of slopes and gullies, although minor areas of ironstone plateau occur. The part of this subregion that aligns with the Cygnet–Snelling Fault separates the northern plateau of the Central Plateau subregion from the main central plateau.
The subregion is predominantly formed from wind-blown Quaternary-age sediments. The area is very different from the rest of Kangaroo Island; it is directly comparable to areas on Lower Eyre Peninsula. Two main land types occur: more recent areas of wind-deposited carbonate-rich sand underlain at depth by consolidated and semi-consolidated carbonate sand (calcarenite); and older areas, where former carbonate-rich sand deposits have been converted by leaching and removal of materials by wind into landscapes with calcreted calcarenite at shallow depth. Coastal sands have penetrated more than 15 km inland in places. These materials, in the main, overlay deeply weathered sediments (see Central Plateau subregion), Tertiary–Quaternary age marine sediments (see Central Plains subregion), or Cambrian-age bedrock. General topographies are defined by underlying older landscapes.

KI Natural Resources Management State of the Region 2009 27
Central Plains (KP) Central Plateau (KC) Eastern Plateau (KE) Northern Slopes (KN) South Coast (KS)
Landforms and soils
Dryland landscapes with a deep clayey base and a sandy (69%) or loamy (31%) cover account for 20,300 ha or 46% of the subregion; wetland, coastal areas and old lake floors for 36%, and are mostly saline or marginally saline; relict ridges dominated by shallow soils on calcreted calcarenite (or ‘limestone’), 6%; ironstone plateau landscapes, 5%; outwash from adjacent highland areas, 3%; dunes with deep sands, 3%. Most soils are formed in unconsolidated clayey sediments, with sandy topsoils dominating in southern areas and loamy ones in northern areas. 15,800 ha or 36% of the subregion are sand over clay soils, 20% acidic loamy texture-contrast soils with brown subsoil, 13% saline soils, 9% shallow soil on calcrete, 6% deep sands, 5% ironstone soils, and 2% brown cracking clay (on northern plains). Sandy surface textures account for 59% of area, sandy loam and loam 25%, and heavier textures 13%; waterbodies for remaining area.
Flat to undulating plateau regions with moderate to steep slopes around margins. Ironstone plateau landscapes make up 99,400 ha or 55% of the subregion; slopes below plateau level, where brown texture-contrast soils have formed on highly weathered rock, 21%; steep slopes with rock at shallow depth, 7%; plains or plateaus with a deep clayey base and a sandy cover, 6%; almost 7% are (predominantly non-saline) wetland areas, some in surface depressions on plateau surfaces; 1.5% is gentle drainage depressions with deep clayey bases. 90,200 ha or 50% are ironstone soils (8% having a ferricrete layer at shallow depth), 23% acidic loamy soils over brown clay on rock, 12% deep acidic loamy texture-contrast soils with brown subsoil, 5% sand over clay soils, 3% deep sands, and 3% deep sandy loams. Sandy loam surface textures account for 75% of area, sandy for 25%; there are almost no areas of heavier texture.
Most landscapes consist of plateau areas; streams and drainage depressions, rises to low hills, and coastal slopes also occur. Ironstone plateau landscapes account for 17,600 ha or 34% of the subregion; steep slopes with rock at shallow depth (mostly coastal slopes), 10%; slopes below plateau level, where brown texture-contrast soils have formed on highly weathered rock, 14%; landscapes with a deep clayey base and a loamy cover, which include most plateaus drainage depressions, 9%; areas of deep clay, 6%; slopes and rises with red texture-contrast soils formed on rock, 7%; plains, plateaus or rises with a deep clayey base and a sandy cover, 4%. 14,300 ha or 27% are ironstone soils, 21% deep acidic loamy texture-contrast soil over brown clay, 15% acidic loamy soil over brown clay on rock, 7% shallow soils on calcrete, 6% cracking clay soil, 5% loam over red clay on rock, 5% sand over clay, 5% shallow soil on rock, 3% gradational loam on rock, and 3% deep gradational soil. Loamy surface textures (predominantly sandy loam) account for 68% of area; sands 20%; clayey surfaces 11%.
The less steep slopes and summit surfaces are largely cleared and used for grazing; some forestry also occurs. Slopes with acidic loamy texture-contrast soil formed on weathered rock account for 29,200 ha or 42% of the subregion; steep, rocky landscapes, 35%; ironstone plateau areas, 9%, and plateau surfaces and drainage depressions with a deep clayey base and a loamy cover, 6%. Brown acidic soils on rock dominate the subregion (37,600 ha or 54%); 15% are deep acidic loamy texture-contrast soils with brown subsoil, 12% ironstone soils, 10% shallow rocky soils, and 2% deep sandy loams. Sandy loam and loam surface textures account for 58% and 19% of area, respectively; sands account for 21%.
Surface topography is generally undulating to gently undulating; jumbled dunes and long dune fronts are common in areas of deep sand. Relict landscapes formed by leaching and erosion of former deposits and spreads of carbonate sand, and dominated by shallow soils on calcreted calcarenite (or ‘limestone’), account for 59,400 ha or 62% of the subregion. Most of the remaining subregional area consists of deposits and spreads of carbonate sand, derived in Recent geological times from exposed coastal sediments (29% of area). Only minor areas of other landscapes occur: most notably ironstone plateau surfaces where younger deposits have been removed (2% of area). 48,700 ha or 51% are shallow stony soils on calcrete (most loamy; many calcareous throughout), 31% are deep sands (mostly calcareous throughout), 5% deep calcareous loamy soils, 3% sand over clay soils, and 2% sheet calcrete (mostly atop coastal cliffs). Calcareous soils tend to occur closer to the coast than the older, more leached, non-calcareous soils. Sandy surface soils account for 91% of area.
Catchments Lake Ada, Murray Lagoon and White Lagoon, lower Cygnet River, and the Bay of Shoals drainage
Flinders Chase rivers, South West River and Eleanor River
Chapman River, part of the Willson River, Emu and Smith bays drainage, and some tributaries of the lower Cygnet River
Lower catchments of Western River, Middle River, De Mole and other smaller watercourses
Little or no surface drainage; lower end of South West, Stunsail Boom, Rocky and Willson rivers

KI Natural Resources Management State of the Region 2009 28
Central Plains (KP) Central Plateau (KC) Eastern Plateau (KE) Northern Slopes (KN) South Coast (KS)
Major vegetation types and wetlands
This area has been extensively cleared. Remnant vegetation is dominated by Eucalyptus cneorifolia open mallee associations, with sugar gum (E. cladocalyx)/red gum (E. camaldulensis var. camaldulensis)/manna gum (E. viminalis ssp. cygnetensis) woodland along the Cygnet River and associated wetlands; also coastal mallee (E. diversifolia) open mallee associations, with some sugar gum (E. cladocalyx) woodland along Timber Creek and melaleuca shrubland around lagoons. Several threatened plant species occur in this area, chiefly along roadsides, including the endangered endemic daisy Olearia microdisca, Beyeria subtecta and the nationally endangered Phebalium equestre. The tidal flats and the estuary of the Cygnet river are unique on Kangaroo Island. Murray Lagoon, White and Rush lagoons, Wiadrowski Lagoon and Lake Ada and a 13-kilometre length of river wetlands between Cygnet River township and Gilgandra bridge have been included on the Directory of Important Wetlands in Australia.
Predominantly open low mallee (Eucalyptus remota) and low stringybark (E. baxteri and E. obliqua) woodland, with some sugar gum (E. cladocalyx) woodland. KI narrow-leaf (E. cneorifolia) open mallee in eastern areas. The relatively undisturbed Flinders Chase River systems, including the Rocky and Breakneck rivers and Larrikin Lagoon, are listed in the Directory of Important Wetlands in Australia. Most gullies, creeks, streams and drainage depressions retain a cover of native vegetation.
This area has been extensively cleared. Remnant vegetation is dominated by KI narrow-leaf (Eucalyptus cneorifolia) open mallee associations, with drooping sheoak (Allocasuarina verticillata) open forest and sugar gum (E. cladocalyx) woodland in coastal areas. The sheoak is important feeding habitat for the critically endangered Kangaroo Island subspecies of the glossy black-cockatoo (Calyptorhynchus lathami ssp halmaturinus). Lashmar Lagoon on Dudley Peninsula is listed in the Directory of Important Wetlands in Australia.
Large areas are covered with native vegetation, some of which occurs in conservation reserves (e.g. Lathami Conservation Park and Western River Wilderness Protection Area). The great mass of drooping sheoaks (Allocasuarina verticillata) on Kangaroo Island occur in this subregion, and primarily exist on steep rocky slopes in shallow soil formed on sandstone, providing the main food source for the endangered and unique KI glossy black-cockatoo (Calyptorhynchus lathami ssp halmaturinus). In addition, this subregion contains unusual woodland stands of imposing South Australian sugar gum (Eucalyptus cladocalyx), which occur on shallow but fertile soil formed on phyllites and siltstones.
Less than 10% of this area has been cleared of native vegetation and nearly half is protected in Cape Gantheaume National Park and Wilderness Protection Area, Flinders Chase NP and a series of conservation parks. Predominantly open mallee vegetation (Eucalyptus diversifolia and E. rugosa), and coastal tea-tree and heath (Melaleuca lanceolata and Leucopogon parviflorus) shrubland. A few areas of woodland with stands of tall sugar gum (E. cladocalyx) occur, largely where deep sands have accumulated in well-watered vales. Threatened plant species include the nationally endangered eyebright (Euphrasia collina ssp. osbornii). Grassdale lagoons, including the South West River to Hanson Bay are listed in the Directory of Important Wetlands in Australia.
Key land management issues
The soils with sodic clay subsoil are highly prone to waterlogging, especially at the bottom of the Cygnet River catchment, where river floodwaters spread out onto large areas of flat land. Even on gentle slopes, these soils are prone to loss of topsoil through water erosion because water-logging makes them soupy and easily washed away. Drainage lines are prone to gullying. The texture contrast soils are also highly susceptible to breakdown of soil structure and loss of organic matter. The waters of the Cygnet River have become increasingly saline and some of the bordering land has developed salinity problems. Some roadside vegetation is critical habitat for threatened plant species.
The plateau soils are particularly prone to waterlogging and acidity. Potentially serious acidification issues include aluminium toxicity and soil structure decline. Liming is strongly recommended on all soils with pH(CaCl) below 4.7. Soils generally have naturally low fertility and organic matter content and are prone to loss of organic matter. Small areas of dryland salinity have developed and are spreading on the Seddon Plateau. Wind and water erosion are significant issues on sandy soils and slopes, respectively. Waterlogged soils on gentler slopes are also prone to loss of topsoil through water erosion. Significant areas of remnant vegetation along watercourses remain unfenced from stock and prone to decline in condition. Phytophthora has infested some areas of bush and constitutes a significant threat to the integrity of remnant vegetation.
Land in this unit is prone to similar land degradation problems to land in the Gosse–Seddon plateau, with waterlogging, acidity and decline in soil structure and organic matter as the dominant issues. Water erosion is a land use limitation on sloping land and gilgai country and dryland salinity has developed in some areas. Native vegetation along watercourses should be fenced from stock.
Soils are highly susceptible to water erosion on the moderate to steep slopes that characterise these land units. There is a danger of landslips on steeper shale bedrock slopes and the risk of headward eroding gullies cutting back the coastline. The lighter, sandier soils may be prone to wind erosion and loss of organic matter from topsoil. Significant areas of remnant vegetation, along steep gullies and creek lines and on stony ridges, remain unfenced from stock and prone to decline in condition. Small areas of river floodplains and flatter land may be prone to waterlogging while dryland salinity is a potential issue in the eastern lower rainfall areas. Acidity problems are only likely to develop on the pockets of ironstone soils.
Being primarily a conservation area, the natural land and soil conditions of this subregion are of little relevance for agriculture; however, they indicate the nature of the subregion’s natural landscapes and habitats. Sands and sandy soils are highly susceptible to wind erosion and very low in natural fertility and are best fenced off to conserve the native vegetation.

KI Natural Resources Management State of the Region 2009 29
Central Plains (KP) Central Plateau (KC) Eastern Plateau (KE) Northern Slopes (KN) South Coast (KS)
Acidity Acidity is a moderate problem: 49% of surface soils are acidic and most of these are sandy with low buffering capacity (low capacity to resist further acidification) but almost none of the area has strongly acidic surfaces. Similarly, 11% of soils are acidic throughout but profiles with strongly acidic subsoils do not feature. Over 1200 ha of coastal land has the potential to develop acid sulfate soils if drained or disturbed.
Acidity is a major problem on agricultural land in this subregion, with almost all soils having acidic to strongly acidic surfaces and subsoils. Of particular concern are soils with sandy, acidic surfaces, and therefore low capacity to resist further acidification (4% of area), and soils with strongly acidic surfaces or subsoils (74% and 55% of area, respectively). From soils that become strongly acidic the range of problems include reduced plant growth and organic matter development and turnover, leading to increased recharge into groundwater and associated watertable rise, the possibility of erosion, and release into solution of toxic substances, which can accumulate in plants, and ground and surface waters, and thereby adversely affect plant, animal and human health.
Acidic and strongly acidic surface soils are extensive (54% and 9% of area, respectively), as are acidic subsoils (32% of area) but strongly acidic subsoils were not found. The highest risk of further acidification occurs where surface soils are strongly acidic (9% of area) or sandy and acidic with low buffering capacity (2% of area). Many subsoils are alkaline owing to the presence of finely dived carbonate.
Most soils are acidic, with 97% having acidic to strongly acidic surfaces; however, these are predominantly highly buffered because of non-sandy textures and, in many cases, relatively high organic matter content. Furthermore, almost 59% of soils have strongly acidic subsoils. Liming should be a standard practice where these soils are used for agriculture.
Unlike most of Kangaroo Island, most soils of this subregion are alkaline or neutral. However, areas of acidic soil do occur, with 11% having acidic to strongly acidic surfaces, and some having acidic and strongly acidic subsoils (5% and 1% of area, respectively). Acidic conditions feature in some shallow soils on calcrete, and in leached to highly leached deep sands.
Dryland salinity Of all the Island’s subregions, the Central Plains contains by far the most saline land caused by watertable-induced salinity, with 13,700 ha or 31% of the subregion affected by moderately high to extreme salinity.
Only 2.5% of the subregion is saline land caused by watertable-induced salinity; however, the additional recharge into groundwater caused by land use change from native vegetation to agriculture would add to the watertable rise and salinisation in other subregions, especially the Central Plains.
Watertable-induced salinity is of significance in the subregion, with 5% of area being saline land, much of which occurs in the beds of drainage depressions and streams.
There is almost no saline land caused by watertable-induced salinity.
Only 1.8% of the subregion is saline land caused by watertable-induced salinity, mostly in tidal areas.
Land
deg
rada
tion
cond
ition
and
trend
s
Soil nutritional fertility
90% of soils have restricted inherent fertility, and this is a significant problem in more than 54% of soils.
Inherent infertility is a major problem with soils in this subregion; fertility levels and organic matter turnover have been built up on agricultural land after many years of productive use and prudent application of fertiliser (including trace elements). Nonetheless, almost all soils have restricted inherent fertility, a significant problem in more than 69% of soils.
87% of soils have restricted inherent fertility, a significant problem in 38% of soils.
Inherent fertility levels are good compared to other areas of Kangaroo Island because of parent material and soil age: many soils are formed directly from fine to medium grained rock (not sandstone or deeply weathered materials) and so contain greater amounts of more chemically reactive clays; also, many soils are relatively young, and so have not been subjected to extended leaching, owing to the natural removal of soil material on slopes and the continual but slow exposure to soil-forming processes of previously unexposed basement rock. Hence older soil material is slowly but constantly replaced with fresher material. However, many soils are formed from ancient sandstone, and many are strongly acidic, both of which reduce fertility. 87% of soils have restricted inherent fertility, a considerable problem in 42% of soils.
Natural fertility levels are low, even for Kangaroo Island, with 96% of soils having restricted fertility, 93% to a considerable degree. Just over a quarter of all soils have very low inherent fertility – mostly carbonate sands and leached to highly leached sands.

KI Natural Resources Management State of the Region 2009 30
Central Plains (KP) Central Plateau (KC) Eastern Plateau (KE) Northern Slopes (KN) South Coast (KS)
Soil physical condition
The rooting depth of plants is mostly limited by poorly structured subsoils, which occur at varying depth: 47% of soils have a rooting depth of 50 cm or less for hardy, perennial horticultural plants; 83% of soils have a poorly structured subsoil within 60 cm; 6% of surface soils have hardsetting problems.
The rooting depth of plants is mostly limited by infertile, relatively poorly structured and strongly acidic subsoil and upper regolith layers, which occur at varying depth; however, only 7% of soils have a rooting depth of 50 cm or less for hardy, perennial horticultural plants. Almost no surface soils have hard-setting problems.
The rooting depth of plants is mostly limited by poorly structured clayey subsoils, which occur at varying depth: 46% of soils have a rooting depth of 50 cm or less for hardy, perennial horticultural plants, while 90% of soils have poorly structured subsoil within 60 cm; 11% of surface soils have hardsetting problems.
The rooting depth of plants in the subregion is mostly limited by depth to bedrock, nonetheless, only 10% have a rooting depth of 50 cm or less for hardy, perennial horticultural plants. No surface soils are known to have hardsetting problems.
The rooting depth of plants is mainly limited by hard calcrete or highly infertile sandy layers; 22% of soils have a rooting depth of 50 cm or less for hardy, perennial horticultural plants. Few soils have poor structure, with only 9% having poorly structured subsoil (mostly sand over clay soils, including some that are shallow over calcrete), and very few surface soils (less than 1%) set hard when dry.
Water erosion Water erosion potential is not a significant problem in this subregion.
The potential for water erosion is significant in this subregion, with 25% having a moderately low potential, 27% moderate to moderately high, and 5% a high potential. Steeper areas with higher erosion potential (2%) have little risk of erosion, as they are predominantly covered with native vegetation, although high-risk situations can occur following bushfire.
Water erosion potential is significant in some areas, with 25% having a moderately low potential, 29% moderate to moderately high, and 6% a high potential. Steeper areas with higher erosion potential (5% of area) have little risk of erosion, as they are predominantly covered with native vegetation, although high-risk situations can occur following bushfire.
The potential for water erosion is significant in this subregion, with 16% having a moderately low potential, 41% moderate to moderately high, and 14% a high potential. Steeper areas with higher erosion potential (16% of area) have little risk of erosion, as they are predominantly covered with native vegetation, although high risk situations can occur following bushfire. Also, in agricultural areas, the dominant land use of grazing of pasture typically has low water erosion risk.
Water erosion risk is small given the protective cover of native vegetation; however, there is some risk on slopes with shallow soils following bushfire.
Wind erosion Almost 72% of the area is susceptible to wind erosion, 12% to a moderately high degree
29% of area is susceptible to wind erosion, only 4% to a moderately high degree
57% of the area is susceptible to wind erosion, 5% to a moderately high degree.
23% of the area is susceptible to wind erosion, but only 4% to a moderately high degree.
94% of the area is susceptible to wind erosion, 55% to a considerable degree. However, native vegetation cover significantly reduces the risk of erosion; in the areas of naturally bare sand hill (e.g. ‘Little Sahara’) where natural wind erosion is an almost daily event.
Waterlogging Flooding can potentially affect 27% of the subregion (including lagoons and tidal areas); 88% is susceptible to waterlogging to some degree, with land ranging from moderately well drained to permanently inundated: 29% moderately well drained, 34% imperfectly drained, 8% poorly drained, 12% very poorly drained and 4% inundated most of the time.
Flooding can potentially affect 14% of area, while waterlogging is a serious problem for agriculture in the subregion, with almost all areas susceptible to seasonal waterlogging to some degree. Land ranges from moderately well drained to permanently inundated: 13% is moderately well drained, 71% is imperfectly drained, while 10% is poorly drained and 5% very poorly drained.
Flooding can potentially affect 5% of the subregion (including drainage depressions and lagoons); 87% of area is susceptible to seasonal waterlogging to some degree, with land ranging from moderately well drained to permanently inundated: 39% is moderately well drained, 41% imperfectly drained, 5% poorly drained and 1% very poorly drained. Agriculture in the subregion is affected to a considerable degree by seasonal waterlogging.
Flooding can potentially affect 14% of area (mostly in drainage depressions); waterlogging is a problem in some areas. Almost all of the subregion is susceptible to seasonal waterlogging to some degree but this is ameliorated in many cases by steep slopes. 22% of land is moderately well drained, 56% imperfectly drained, 15% poorly drained and 4% very poorly drained.
Flooding can potentially affect 5% of the subregion, mostly in tidal areas. Waterlogging can occur to some degree over 34% of the subregion, a much lesser percentage than all other subregions; 19% of land moderately well drained, 11% imperfectly drained, 2% poorly drained, 1% very poorly drained; 1% inundated most of the time.
Water repellence 53% of soils are water repellent. 31% of area has soils that are water repellent Water repellence is significant; 57% of land is affected
34% of soils exhibit water repellent characteristics Almost 91% of soils are water repellent to some degree

KI Natural Resources Management State of the Region 2009 31
Land degradation threats and risk analysis The key land degradation threats and the risk analysis of those threats are shown in Table 15. This information is drawn primarily from Hall (2008), Hall et al. (2008) with some material from Grinter and Mooney (2001).

KI Natural Resources Management State of the Region 2009 32
Table 15. Land degradation threats and risk analysis
Threat Description Extent (ha) Severity Impacts on primary industries Impacts on other natural resources
Technical priority assessment1 (TP = RA+MN)
185,000 Moderate–highly susceptible to acidification (see Figure 6)
145,000 Affected by subsoil acidification
Acidity Many soils on Kangaroo Island are naturally neutral to acidic, have a low buffering capacity and are in areas of high rainfall. Collectively this increases the risk of further acidification. Acidification is also a consequence of most modern high-input, high-output agricultural production systems. Acid soils are typically associated with nutrient deficiencies, imbalances or toxicities; soil biological activity declines, notably nitrogen fixing rhizobia bacteria associated with legumes. Clay minerals are also decomposed in strongly acidic conditions, resulting in permanent loss of soil fertility. While soil acidification does occur naturally, it can be significantly accelerated by agricultural practices, such as: • use of acidifying forms of nitrogen fertilisers (e.g. urea or ammonium based) • removal of agricultural products (especially hay) • breakdown of organic matter • nitrogen fixation by legumes • leaching of nitrate from the soil profile.
Uneven pasture and crop growth, stunted growth in clovers and subclovers and invasion by acid-tolerant weeds such as sorrel, geranium and annual grasses. Where soils are strongly acid, with pH(CaCl2) below 4.3, subclovers start to die out and bare patches develop. Acidity causes stunted root growth and in severe cases pasture can be peeled off in sods. Reduced fertility is a problem on strongly acid soils in the district, especially the ironstone plateau soils which also have a high aluminium content. Iron and aluminium tie up phosphorus in the soil, reducing the efficiency of fertilisers. Fewer plant species are available for use and there is poor legume nodulation. Reduced activity of earthworms and soil microbes, resulting in less effective breakdown and cycling of organic matter and nutrients.
The off-site impacts of soil acidity, and associated poor plant growth and water use, include greater accessions to watertables and potential salinity, increased nutrient loads in groundwater and streams, as well as, increased risk of soil erosion.
45 = 30 + 15
15,000 Saline
107,000 Subclinical salinity
Dryland salinity
The naturally occurring saline areas and lagoons on Kangaroo Island were limited in area. Dryland salinity (or human-induced secondary salinity) has been a result of the replacement of large areas of deep-rooted perennial native vegetation with shallow-rooted annual pastures and crops. Much of the landscape contains salt derived mostly from marine salt spray. Vegetation clearance creates an imbalance with more recharge leading to higher watertables, which bring salts upwards in the soil profile. Once saline groundwater rises to within 1–2 metres of the surface, surface and subsurface salinity occurs. Large areas are affected on Kangaroo Island (Figure 7). Sea barley grass often dominates and subclovers are absent and small bare areas may be present. Affected areas may appear as ‘scalds’ exposed by grazing on flats or hillsides. In extreme cases only highly salt tolerant plants such as samphire, spiny rush and native melaleucas (tea-trees) occur, or even just bare areas and dead trees. Recent work by Hall et al. (2008) to define groundwater flow systems (Figure 8) in combination with recharge potential mapping (Figure 9) provides a way to target actions to reduce recharge.
Pasture and crop options are restricted with increasing salinity. Pastures decline with loss of subclovers and increases in the density of less desirable species such as sea barley grass. Scalds occur and erosion risks increase.
Increased saline discharge into riparian zones, watercourses and wetlands. This in turns leads to the loss of sensitive aquatic plant and animal species, and degradation of riparian and wetland habitats. Rising saline groundwater impacts on native vegetation and wetlands by the loss of sensitive aquatic plant and animal species, and degradation of riparian and wetland habitats.
32 = 24 + 8
Soil fertility Much of Kangaroo Island’s soils are naturally deficient in phosphorus and many have significant trace element deficiencies (see Figure 10). Most soil nutrients are either contained in clay minerals and organic matter, or retained on their charged surfaces. Therefore the ability of the soil to store and supply nutrients is largely determined by clay type and content.
135,400 Moderately low to very low inherent soil fertility
Agricultural production not only requires a higher level of nutrition than natural ecosystems but also involves removal of nutrients at an accelerated rate. Without fertilisers in some form, to firstly build fertility and then maintain it, current levels of agricultural productivity could not be achieved. Low fertility soils and increasing costs of fertilisers are a significant issue for agriculture.
Although the inherent fertility of a soil does not necessarily directly lead to an impact upon natural resource values, under agricultural usage soils with a low fertility status can become susceptible to issues such as wind and or water erosion as their ability to produce and maintain sufficient vegetative cover can be reduced if not adequately managed. Water use is a factor of plant growth and productivity; hence low soil fertility will indirectly, adversely impact on recharge and salinity impacts. In addition soils of inherent low fertility, in particularly the deeper sands, have low cation exchange capacities which can result in nutrient
45 = 30 + 15
1 Technical priority (TP) = Biophysical risk assessment (RA) + Management need assessment (see Risk analysis framework section)
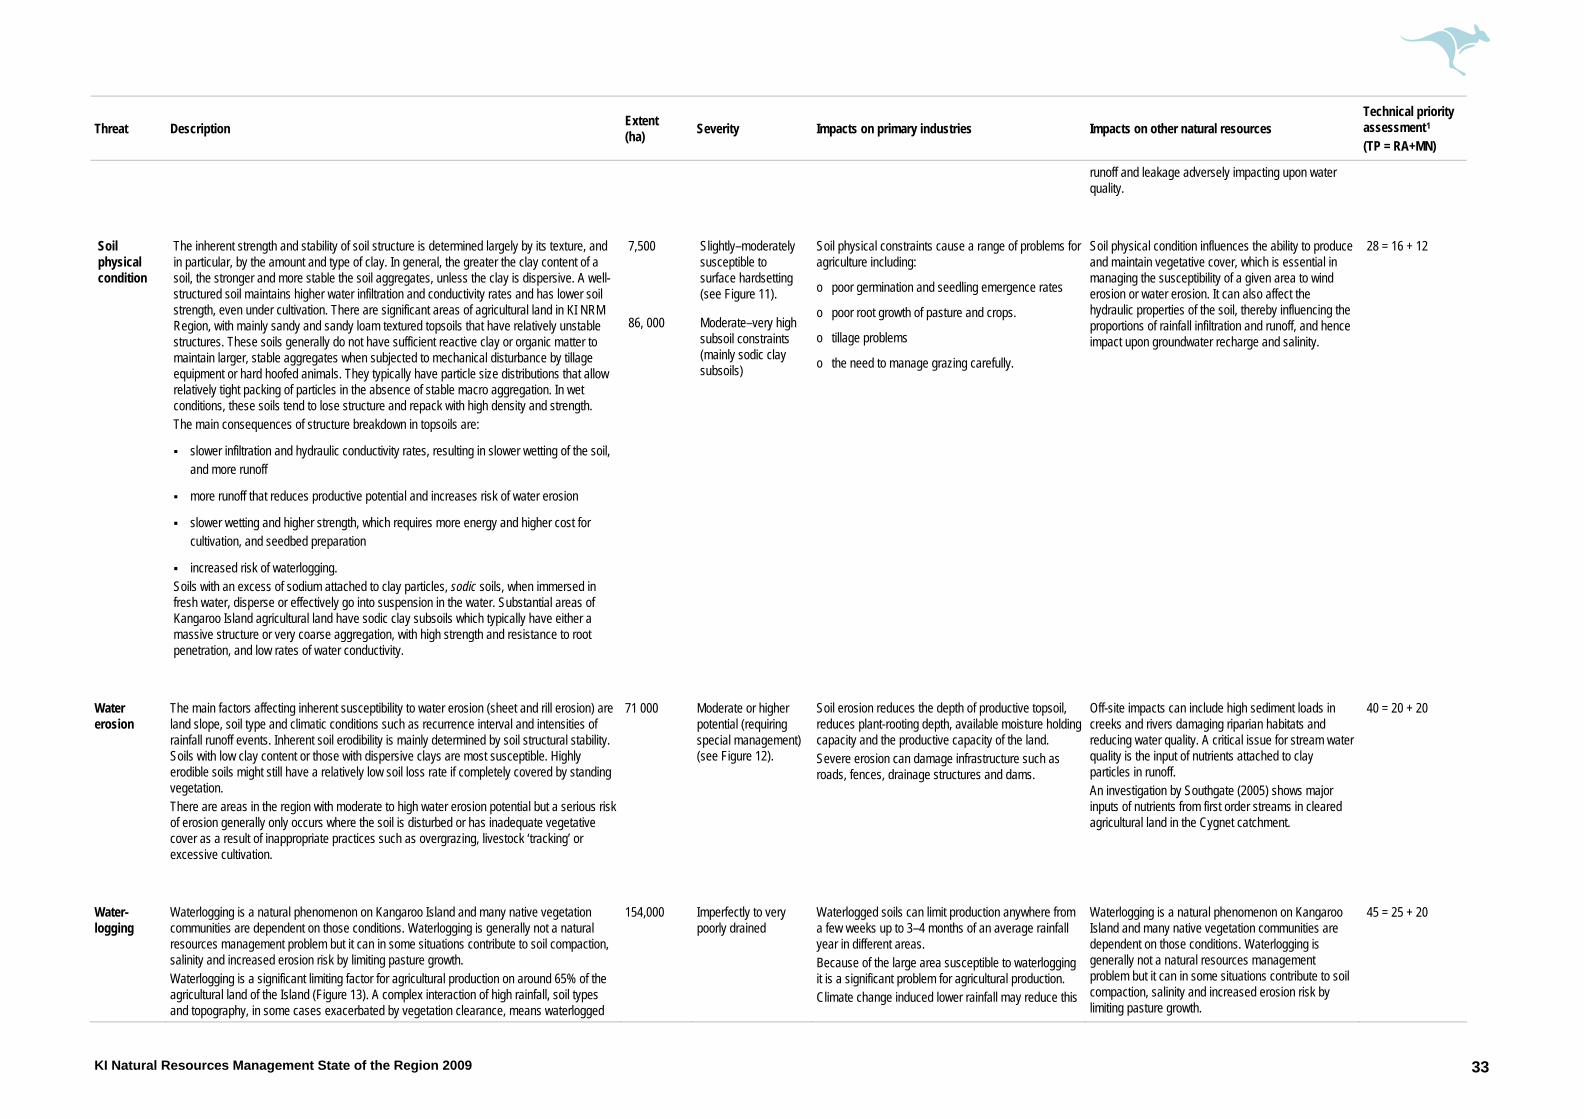
KI Natural Resources Management State of the Region 2009 33
Threat Description Extent (ha) Severity Impacts on primary industries Impacts on other natural resources
Technical priority assessment1 (TP = RA+MN)
runoff and leakage adversely impacting upon water quality.
7,500 Slightly–moderately susceptible to surface hardsetting (see Figure 11).
Soil physical condition
The inherent strength and stability of soil structure is determined largely by its texture, and in particular, by the amount and type of clay. In general, the greater the clay content of a soil, the stronger and more stable the soil aggregates, unless the clay is dispersive. A well-structured soil maintains higher water infiltration and conductivity rates and has lower soil strength, even under cultivation. There are significant areas of agricultural land in KI NRM Region, with mainly sandy and sandy loam textured topsoils that have relatively unstable structures. These soils generally do not have sufficient reactive clay or organic matter to maintain larger, stable aggregates when subjected to mechanical disturbance by tillage equipment or hard hoofed animals. They typically have particle size distributions that allow relatively tight packing of particles in the absence of stable macro aggregation. In wet conditions, these soils tend to lose structure and repack with high density and strength. The main consequences of structure breakdown in topsoils are:
slower infiltration and hydraulic conductivity rates, resulting in slower wetting of the soil, and more runoff
more runoff that reduces productive potential and increases risk of water erosion
slower wetting and higher strength, which requires more energy and higher cost for cultivation, and seedbed preparation
increased risk of waterlogging. Soils with an excess of sodium attached to clay particles, sodic soils, when immersed in fresh water, disperse or effectively go into suspension in the water. Substantial areas of Kangaroo Island agricultural land have sodic clay subsoils which typically have either a massive structure or very coarse aggregation, with high strength and resistance to root penetration, and low rates of water conductivity.
86, 000 Moderate–very high subsoil constraints (mainly sodic clay subsoils)
Soil physical constraints cause a range of problems for agriculture including:
o poor germination and seedling emergence rates
o poor root growth of pasture and crops.
o tillage problems
o the need to manage grazing carefully.
Soil physical condition influences the ability to produce and maintain vegetative cover, which is essential in managing the susceptibility of a given area to wind erosion or water erosion. It can also affect the hydraulic properties of the soil, thereby influencing the proportions of rainfall infiltration and runoff, and hence impact upon groundwater recharge and salinity.
28 = 16 + 12
Water erosion
The main factors affecting inherent susceptibility to water erosion (sheet and rill erosion) are land slope, soil type and climatic conditions such as recurrence interval and intensities of rainfall runoff events. Inherent soil erodibility is mainly determined by soil structural stability. Soils with low clay content or those with dispersive clays are most susceptible. Highly erodible soils might still have a relatively low soil loss rate if completely covered by standing vegetation. There are areas in the region with moderate to high water erosion potential but a serious risk of erosion generally only occurs where the soil is disturbed or has inadequate vegetative cover as a result of inappropriate practices such as overgrazing, livestock ‘tracking’ or excessive cultivation.
71 000 Moderate or higher potential (requiring special management) (see Figure 12).
Soil erosion reduces the depth of productive topsoil, reduces plant-rooting depth, available moisture holding capacity and the productive capacity of the land. Severe erosion can damage infrastructure such as roads, fences, drainage structures and dams.
Off-site impacts can include high sediment loads in creeks and rivers damaging riparian habitats and reducing water quality. A critical issue for stream water quality is the input of nutrients attached to clay particles in runoff. An investigation by Southgate (2005) shows major inputs of nutrients from first order streams in cleared agricultural land in the Cygnet catchment.
40 = 20 + 20
Water-logging
Waterlogging is a natural phenomenon on Kangaroo Island and many native vegetation communities are dependent on those conditions. Waterlogging is generally not a natural resources management problem but it can in some situations contribute to soil compaction, salinity and increased erosion risk by limiting pasture growth. Waterlogging is a significant limiting factor for agricultural production on around 65% of the agricultural land of the Island (Figure 13). A complex interaction of high rainfall, soil types and topography, in some cases exacerbated by vegetation clearance, means waterlogged
154,000 Imperfectly to very poorly drained
Waterlogged soils can limit production anywhere from a few weeks up to 3–4 months of an average rainfall year in different areas. Because of the large area susceptible to waterlogging it is a significant problem for agricultural production. Climate change induced lower rainfall may reduce this
Waterlogging is a natural phenomenon on Kangaroo Island and many native vegetation communities are dependent on those conditions. Waterlogging is generally not a natural resources management problem but it can in some situations contribute to soil compaction, salinity and increased erosion risk by limiting pasture growth.
45 = 25 + 20

KI Natural Resources Management State of the Region 2009 34
Threat Description Extent (ha) Severity Impacts on primary industries Impacts on other natural resources
Technical priority assessment1 (TP = RA+MN)
soils can limit production anywhere from a few weeks up to 3–4 months of an average rainfall year in different areas.
threat.
Water repellence
Water repellence is a naturally occurring soil condition in which waxy (hydrophobic) organic materials coat the surface of soil particles, resulting in uneven wetting of surface soil. It can occur in all soils but only has significant impact in silicious sands. Uneven wetting of surface soil causes ponding of water and/or dry patches, resulting in patchy crop and pasture establishment and significant production loss. The occurrence of water repellence can be highly variable between years and sites, and is usually less of a problem in wetter sites and years. The land areas inherently at high risk of water repellence are those with significant proportions of siliceous sand topsoils. They are generally acid to neutral greyish sands, which may be deep sands or overlie clay.
100,000 Repellent to strongly repellent (Figure 14)
Patchy emergence of pastures and crops Repellent soils require more rainfall at the break of the season to work up and seed and are therefore exposed to longer periods of wind damage and associated loss of organic matter; this delay in seeding also reduces the yield potential of the crop Wet and dry sand patches in paddocks that affect the efficiency of fertiliser and herbicide, leading to patchy plant growth Weeds tend to get an early foothold, partly because weed seeds tend to be concentrated in the depressions where runoff water collects Increased water runoff which can lead to gully and rill erosion Nutrient uptake by the plant can be inhibited, resulting in lower yields Reduced productivity of clover pastures
Water repellence itself is not strictly a degradation problem as it is naturally occurring. It is predominantly a soil management issue since its impacts are most apparent during establishment of crops and pastures. Because it results in poor plant establishment and growth on sandy soils, it can contribute to increased wind erosion risk, particularly in dry spells. Poor plant growth and water use can also contribute to increased groundwater recharge and dryland salinity risk and the low cation exchange capacity of these sands to lead to increase nutrient runoff and leakage causing declining water quality.
40=20+20
80,000 Moderately low potential (needs conservation tillage practices) (Figure 17)
Wind erosion
Most soils are relatively resistant to erosion provided their surfaces are left undisturbed and vegetative cover is maintained. However, clearance of perennial vegetation for agriculture, and inappropriate management practices increases erosion rates by 10 to 100 times. The obvious signs of wind erosion are airborne dust storms and active sand dune drifts. Less obvious is the stripping of fine clay particles and organic matter from topsoils, the principal components of soil fertility. ‘Sandblasting’ also damages emerging plants in eroding paddocks. The principal factors affecting wind erosion potential are soil type, rainfall, local wind conditions and the topography of the land. Generally speaking, steeper slopes, sandier soils and drier conditions provide the greatest potential for wind erosion problems to develop. Strong winds during the sensitive late summer to early winter period have the greatest potential to cause damage. Soil types most susceptible are sandy textured with very low clay content; susceptibility decreases as clay content increases as clay binds soil particles into more stable aggregates. The inherent potential for wind erosion is higher in districts that have low rainfall and higher incidence of dry periods, which increases the risk of inadequate plant cover on the soil. While cultivation practices for cropping contributes most of the risk, grazing can also contribute to wind erosion risk. As livestock reduce cover they are more likely to loosen the surface of sandy soils and make them more erosion prone.
15,000 Moderate to high potential (needs special practices or crops or careful grazing only)
Wind erosion causes loss of fine clay particles and organic matter from topsoils, which means the loss of the principal components of soil fertility. ‘Sandblasting’ also damages emerging plants in eroding paddocks. Wind erosion risks require careful land and stock management and so puts additional requirements and costs onto primary producers.
Minor risks of nutrient input into waterways and native vegetation.
40 = 20 + 20

KI Natural Resources Management State of the Region 2009 45
Current monitoring and investigations The mix of current land related monitoring and investigations include:
monitoring of piezometer network for dryland salinity purposes
landholder surveys assessing land condition
soil monitoring
data collection of NRM Board funded on-ground works (e.g. areas of perennial pastures established)
soils analyses.
Information gaps The soils and landscape information collected and held by DWLBC makes up the most comprehensive datasets of their type in Australia. There is no need for additional resource descriptive information but it would be useful to integrate new land use data with land capability data. With the increasing level of cropping on the Island there is a need to expand the DWLBC Land Condition Monitoring Program to Kangaroo Island. A targeted salinity monitoring program is also needed to evaluate the appropriateness and effectiveness of Board investments.

KI Natural Resources Management State of the Region 2009 46
Water resources and aquatic ecosystems
Socioeconomic values The socioeconomic values of the Island’s water resources can be classified into recreational, aesthetic, public water supply and industry. The numerous rivers, wetlands and estuaries are an essential part of the character of the Island, and provide recreational and aesthetic opportunities for residents and visitors. The SA Water major public water supply from Middle River Reservoir delivers on average 550 ML/yr to around 75% of the Island’s population, in Parndana, Brownlow and Kingscote. Poor water quality was an issue in the past but a major upgrade in 2007 to the water treatment plant has alleviated the problem. A reliable public water supply is fundamental to the community, and for industry including tourism. Livestock based agriculture is the largest proportion of the Island’s gross regional product and almost entirely dependent on surface water. Irrigation enterprises are still relatively small scale but there is a growing area of viticulture. Inland aquaculture is a small user of water.
Ecological values
Rivers and streams Kangaroo Island, more specifically Flinders Chase, has the only entire catchments in the state that are still largely in pre-European settlement condition. This makes them significant in conservation and ecological values. The two most notable catchments are Rocky River and Breakneck River. The following rivers are listed as being of national significance in the Australian Directory of Important Wetlands (Environment Australia 2001):
Lower Cygnet River between Gilgandra Bridge and Cygnet River township
Lower Chapman River (including Lashmar Lagoon)
Flinders Chase rivers
Lower South West River including Grassdale lagoons. Many other watercourses are of significant ecological value due to considerable lengths of largely intact riparian vegetation, with few in-stream barriers and minimal erosion problems (Nilsen 2006).

KI Natural Resources Management State of the Region 2009 47
Wetlands Kangaroo Island has a total of 15 wetland systems (including the 4 river systems listed above) listed as of national significance in the Australian Directory of Important Wetlands:
American River wetland system
Birchmore Lagoon
Busby and Beatrice islets
Cygnet Estuary
Cygnet River and Duck Lagoon
D’Estrees Bay
Flinders Chase River systems
Grassdale lagoons
Lake Ada
Lashmar Lagoon and Chapman River
Murray Lagoon
Rush Lagoon
Six Mile Lagoon
Wiadrowski Lagoon
White Lagoon wetland system.
Region description
Surface water systems About 20 major water catchments and many smaller catchment areas make up the 53 catchments of Kangaroo Island. Major catchments, wetlands and watercourses are shown in Figure 16. Some 5700 kilometres of watercourses carry surface water flow across the Island (approximately 10 times the length of the coastal perimeter). The headwaters of central and western catchments radiate out from a large dissected plateau (Gosse Ritchie plateau), which broadly divides water catchment boundaries, with many watercourses generally flowing in north–south orientations. The largest catchment, the Cygnet River, drains about 12% of Kangaroo Island’s surface area. It flows from west to east, bound between the Gosse Ritchie plateau and north coast hills (including Wisanger), although its many subcatchments are orientated north–south.

KI Natural Resources Management State of the Region 2009 49
Most of the watercourses of Kangaroo Island are generally considered to be ephemeral systems, meaning that in most years watercourses cease to flow. Towards the end of summer, most watercourses have extensive sections of dry riverbed, except where groundwater discharges into streambeds. Figure 17 shows flow variability for the Rocky River.
Many of the larger catchments have their watercourses terminating in estuaries at the coastline (e.g. Stunsail Boom River, Middle River, Cygnet River). Some watercourses do not reach the coastline but terminate at inland lakes and lagoons (e.g. Timber Creek, and less defined watercourses in the Haines–Macgillivray landscape). Kangaroo Island wetlands are many and diverse; there are numerous small lakes (or lagoons). A particularly high concentration of lagoons can be found within the Haines and Macgillivray districts. There are some large inland lakes include Murray Lagoon and Birchmore Lagoon. Lakes and lagoons can be inundated by water year-round or on more of a seasonal basis. Many wetlands that may once have been seasonally inundated have in recent decades become more permanently inundated and more saline. These include Birchmore Lagoon, Wiadowski Lagoon, Murray Lagoon and the Lower Cygnet River (Dooley et al. 2002). Many swampy wetlands can be found where upwelling groundwater saturates soil, often in the headwaters of catchments.
Jan Feb Mar Apr May Jun Jul Aug Sep Oct Nov Dec
DWLBC, Surface Water Archive HYMXMEAN V91 Output 19/11/2008
Plot of Daily Maximum, Minimum and MeanSite A5130501 ROCKY RIVER @ U/S Gorge Falls (K.I.)Period of Record 26/08/1970 to 12/08/2008
Stre
am D
isch
arge
Vol
ume
in M
egal
itres
0
500
1000
1500
2000
2500
Figure 17. Flow variability across the year (Source: DWLBC surface water archive 2008)

KI Natural Resources Management State of the Region 2009 50
Surface water quantity and flow regime Water data for Kangaroo Island is limited with only five operating flow-gauging stations (Table 16). Only the Rocky River and Middle River stations have relatively long data records. This means that most catchments have to be described by modelled average annual runoff data (Table 17 and Figure 18).
Table 16. Operating gauging stations on Kangaroo Island
Site ID Name Parameters Period of record Responsibility
A5131014 CYGNET RIVER @ U/S Koala Lodge
Flow/level, water temp, salinity
13.01.2003–15.08.2006 DWLBC
A5131001 CYGNET RIVER @ Huxtable Forest.
Flow/level, water temp, salinity
09.07.2002–14.06.2006 DWLBC
A5131002 TIMBER CREEK @ South Coast Road
Flow/level, water temp, salinity
24.06.2004–13.11.2006 DWLBC
A5130502 MIDDLE RIVER @ Middle River Dam
Flow/level 18.06.1969–14.02.2006 SA Water
A5130501 ROCKY RIVER @ U/S Gorge Falls
Flow/level 26.08.1970–19.07.2006 DWLBC

KI Natural Resources Management State of the Region 2009 51
Figure 18. Mean annual modelled runoff (Source: Nilsen 2006)
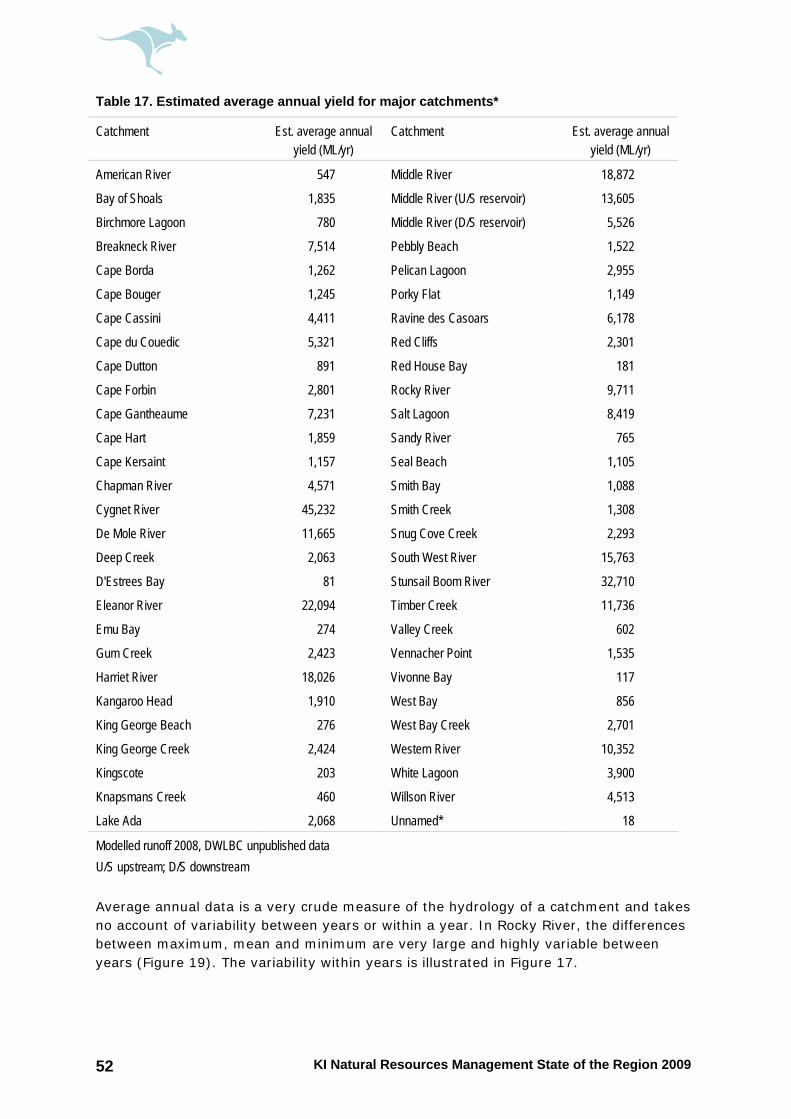
KI Natural Resources Management State of the Region 2009 52
Table 17. Estimated average annual yield for major catchments*
Catchment Est. average annual yield (ML/yr)
Catchment Est. average annual yield (ML/yr)
American River 547 Middle River 18,872
Bay of Shoals 1,835 Middle River (U/S reservoir) 13,605
Birchmore Lagoon 780 Middle River (D/S reservoir) 5,526
Breakneck River 7,514 Pebbly Beach 1,522
Cape Borda 1,262 Pelican Lagoon 2,955
Cape Bouger 1,245 Porky Flat 1,149
Cape Cassini 4,411 Ravine des Casoars 6,178
Cape du Couedic 5,321 Red Cliffs 2,301
Cape Dutton 891 Red House Bay 181
Cape Forbin 2,801 Rocky River 9,711
Cape Gantheaume 7,231 Salt Lagoon 8,419
Cape Hart 1,859 Sandy River 765
Cape Kersaint 1,157 Seal Beach 1,105
Chapman River 4,571 Smith Bay 1,088
Cygnet River 45,232 Smith Creek 1,308
De Mole River 11,665 Snug Cove Creek 2,293
Deep Creek 2,063 South West River 15,763
D'Estrees Bay 81 Stunsail Boom River 32,710
Eleanor River 22,094 Timber Creek 11,736
Emu Bay 274 Valley Creek 602
Gum Creek 2,423 Vennacher Point 1,535
Harriet River 18,026 Vivonne Bay 117
Kangaroo Head 1,910 West Bay 856
King George Beach 276 West Bay Creek 2,701
King George Creek 2,424 Western River 10,352
Kingscote 203 White Lagoon 3,900
Knapsmans Creek 460 Willson River 4,513
Lake Ada 2,068 Unnamed* 18
Modelled runoff 2008, DWLBC unpublished data U/S upstream; D/S downstream Average annual data is a very crude measure of the hydrology of a catchment and takes no account of variability between years or within a year. In Rocky River, the differences between maximum, mean and minimum are very large and highly variable between years (Figure 19). The variability within years is illustrated in Figure 17.
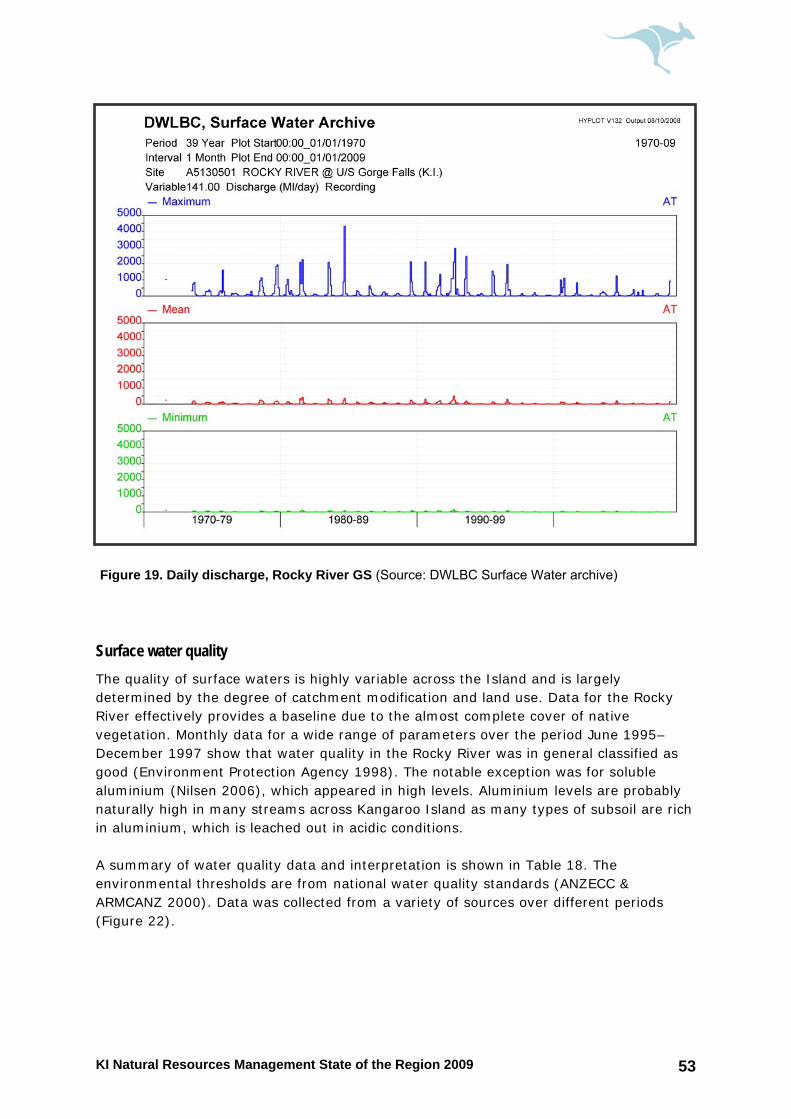
KI Natural Resources Management State of the Region 2009 53
Surface water quality The quality of surface waters is highly variable across the Island and is largely determined by the degree of catchment modification and land use. Data for the Rocky River effectively provides a baseline due to the almost complete cover of native vegetation. Monthly data for a wide range of parameters over the period June 1995–December 1997 show that water quality in the Rocky River was in general classified as good (Environment Protection Agency 1998). The notable exception was for soluble aluminium (Nilsen 2006), which appeared in high levels. Aluminium levels are probably naturally high in many streams across Kangaroo Island as many types of subsoil are rich in aluminium, which is leached out in acidic conditions. A summary of water quality data and interpretation is shown in Table 18. The environmental thresholds are from national water quality standards (ANZECC & ARMCANZ 2000). Data was collected from a variety of sources over different periods (Figure 22).
Figure 19. Daily discharge, Rocky River GS (Source: DWLBC Surface Water archive)

KI Natural Resources Management State of the Region 2009 54
Table 18. Surface water quality assessment 1996–2004
Parameter (threshold value) Within environmental threshold limit?
Rocky River Cygnet River Middle River* Harriett River** Timber Creek***
Willson River*
Stokes Bay Road
Bark Hut Road
Conductivity (100–5000 μS cm –1) Yes Yes 50% of data Yes Mostly yes No No
pH (6.5–9.0) Mostly yes Yes Yes Yes Yes Yes No
Turbidity (1–50 NTU) Mostly yes Yes Yes Mostly yes Yes Yes Yes
Dissolved oxygen (%saturation >90%)
No Yes Yes Yes No NO Mostly yes
Stan
dard
para
meter
s
Temperature (< 21ºC) Mostly yes Mostly yes Mostly yes Yes Yes Mostly yes Yes
Total phosphorus (< 100 µg L –1) Yes Mostly yes Yes Yes No Inconclusive Yes
Filterable reactive phosphorus (< 40 µg L –1)
Yes Yes Yes Yes (no data) (no data) Yes
Total nitrogen (< 1000 µg L –1) Mostly yes Mostly yes Yes Yes Yes Inconclusive No Nutrie
nts
Oxidised nitrogen (< 100 µg L –1) Yes Mostly yes 50% of data Yes (no data) (no data) No
Aluminium at pH > 6.5 (< 55 µg L –1) No No No No (no data) (no data) No
Copper (< 1.4 µg L –1) 50% of data Mostly yes Mostly yes Mostly yes (no data) (no data) Mostly yes
Lead (< 3.4 µg L –1) Mostly yes Yes Yes Yes (no data) (no data) Mostly yes Metal
s
Zinc (< 8 µg L –1) 50% of data Yes Yes Mostly yes (no data) (no data) Yes
(Source: Nilsen 2006 – using EPA data except where indicated)
* EPA data from 2003 & 2004 only
** nutrient data interpreted from combined River of Life, SW Landcare Group and EPA data and over 2004 only
*** Rivers of Life data 2004 only

KI Natural Resources Management State of the Region 2009 56
In the Cygnet River catchment at least, the majority of nutrients in streamflows comes from the first and second order streams, and especially after 1–2 days of heavy rainfall in the order of 40–60 mm (Southgate 2005). Grazing/cropping land is the major source of nutrients, and farmland with poor riparian vegetation is the source of most nutrients (Southgate 2005). These results are consistent with research across southern Australia and would probably be similar in other catchments. Increasing stream salinity resulting from dryland salinity is a major issue in parts of Kangaroo Island, especially in the Central Plains subregion. Typically, stream salinity varies across the year, peaking in late summer–autumn when saline groundwater baseflow is often the only input into streams. Stream salinity is typically at its lowest in late winter–spring, when a period of flow has flushed salt from the system. While this is typical for many streams it is not the case in all, for example the Harriet River (Figure 21).
River and stream condition River and stream condition on Kangaroo Island has been assessed using different methods at different times and spatial scales (EPA 2002; Nilsen 2006 unpublished). Most river condition assessments take account of flow regime, water quality, geomorphic structure and stability, habitat complexity and condition, lateral and longitudinal connectivity, and biological structure and diversity. The Rivers of Life project (Nilsen 2006) assessed many of these factors across a large proportion of the Island in six focus catchments. Other recent work (DWLBC 2008) has compiled similar data for another six catchments. Tables 19 and 20 show catchment land
Figure 21. Average stream salinity – summer and winter (Source: Nilsen 2006)

KI Natural Resources Management State of the Region 2009 57
cover and riparian vegetation cover for the surveyed catchments. Both parameters are often good predictors of watercourse condition in southern Australia. Some of the Island’s rivers and streams are in better condition than many other parts of the state, reflecting the fact that broad scale landscape clearance for agricultural development occurred only in the past few decades. Consequently, there have been less water resources development, few significant in-stream structures and relatively intact riparian vegetation along significant lengths of watercourses within private property. There are also still large areas of native vegetation within protected areas such as under Heritage Agreements or conservation reserves. In general, the overall condition of rivers and streams improves from east to west across the Island reflecting the more recent agricultural development in central and western catchments associated with the Soldier Settlement Scheme after World War 2 (Table 20). In contrast, agricultural land use had become established earlier in eastern and many central catchments. Riparian zone vegetation is fairly extensive throughout Kangaroo Island but tends to be wider and more connected in central and western regions (Table 19). Stability of stream banks follows a similar pattern. Unstable stream banks and erosion heads were more common in central and eastern catchments. Water quality, mainly based on salinity, tends to progressively improve from east to west across the Island.
Table 19. Riparian vegetation width (≥ 3rd order streams) in surveyed catchments
1 Data from Nilsen 2006 2 Data from DWLBC 2008 – interpreted from aerial photography 3 Data from DWLBC 2008 – interpreted from videography
River length for of 3 vegetation width classes (each side of watercourse) & % of total river length ( ≥ 3rd order )
Catchment > 15 m % of total
length < 15 m
% of total
length Nil
% of total
length
Not surveyed
% of total
length
Total stream length (km)
Cygnet River 1 161 62 84 32 16 6 0 0 260
Middle River 1 49 64 24 32 3 4 0 0 76
Harriet River 1 57 86 9 13 0 1 0 0 66
Timber Creek 1 52 86 6 10 2 4 0 0 60
Willson River 1 9 49 7 38 2 13 0 0 18
Rocky River 1 82 100 0 0 0 0 0 0 82
De Mole River2 67 99 1 1 0 0 0 0 68
Eleanor River 2 92 95 4 5 0 0 0 0 96
South West River2 47 92 4 7 0 0 1 1 51
Chapman River 3 21 54 6 15 2 5 10 26 38
Deep Creek 3 2 7 4 12 9 26 19 55 35
Stunsail Boom River 3 40 29 8 6 1 1 90 65 138

KI Natural Resources Management State of the Region 2009 58
Table 20. Catchment land cover (area and percentage of total to nearest 1%)
Catchment Agricultural land Native vegetation Plantation forestry Total
ha % ha % ha % ha
American River 1,117 87% 164 13% 0 0% 1,281
Bay of Shoals 5,299 84% 985 16% 1 0% 6,285
Birchmore Lagoon 1,588 87% 243 13% 0 0% 1,831
Breakneck River 43 0% 9,160 100% 0 0% 9,203
Cape Borda 594 23% 2,023 77% 0 0% 2,617
Cape Bouger 188 5% 3,930 95% 0 0% 4,118
Cape Cassini 3,144 49% 3,330 51% 0 0% 6,474
Cape du Couedic 386 4% 10,118 96% 0 0% 10,504
Cape Dutton 1,654 73% 587 26% 19 1% 2,260
Cape Forbin 1,072 50% 1,068 50% 11 1% 2,151
Cape Gantheaume 1,716 5% 31,196 95% 0 0% 32,912
Cape Hart 1,446 30% 3,296 70% 0 0% 4,742
Cape Kersaint 763 20% 3,026 80% 0 0% 3,789
Chapman River 5,407 74% 1,914 26% 0 0% 7,321
Cygnet River 44,628 74% 11,827 19% 4,255 7% 60,710
De Mole River 2,938 28% 6,022 58% 1,490 14% 10,450
Deep Creek 2,566 81% 583 18% 5 0% 3,154
D'Estrees Bay 205 65% 110 35% 0 0% 315
Eleanor River 20,708 79% 5,358 20% 193 1% 26,259
Emu Bay 771 80% 191 20% 0 0% 962
Gum Creek 1,932 58% 1,376 42% 1 0% 3,309
Harriet River 9,796 64% 3,056 20% 2,340 15% 15,192
Kangaroo Head 2,689 78% 746 22% 0 0% 3,435
King George Beach 471 84% 88 16% 0 0% 559
King George Creek 2,410 69% 1,084 31% 5 0% 3,499
Kingscote 620 95% 32 5% 1 0% 653
Knapsmans Creek 88 8% 1,022 92% 0 0% 1,110
Lake Ada 3,746 69% 1,654 31% 3 0% 5,403
Middle River 6,946 48% 5,474 38% 2,158 15% 14,578
Pebbly Beach 1,072 71% 441 29% 0 0% 1,513
Pelican Lagoon 3,113 30% 7,299 70% 0 0% 10,412
Porky Flat 820 27% 2,202 73% 0 0% 3,022
Ravine des Casoars 387 4% 9,054 95% 132 1% 9,573
Red Cliffs 5,305 79% 1,430 21% 13 0% 6,748
Red House Bay 351 78% 97 22% 0 0% 448

KI Natural Resources Management State of the Region 2009 59
Catchment Agricultural land Native vegetation Plantation forestry Total
ha % ha % ha % ha
Rocky River 102 0% 21,507 99% 35 0% 21,644
Salt Lagoon 20,053 83% 3,929 16% 47 0% 24,029
Sandy River 38 2% 1,493 98% 0 0% 1,531
Seal Beach 285 22% 1,018 78% 0 0% 1,303
Smith Bay 2,653 88% 365 12% 2 0% 3,020
Smith Creek 2,381 70% 1,024 30% 0 0% 3,405
Snug Cove Creek 807 44% 1,032 56% 7 0% 1,846
South West River 4,946 32% 6,650 43% 3,859 25% 15,455
Stunsail Boom River 8,670 27% 20,346 63% 3,386 10% 32,402
Timber Creek 18,860 77% 5,270 21% 490 2% 24,620
Valley Creek 189 25% 572 75% 2 0% 763
Vennacher Point 148 5% 2,837 95% 0 0% 2,985
Vivonne Bay 133 33% 269 67% 0 0% 402
West Bay 110 6% 1,747 94% 0 0% 1,857
West Bay Creek 13 0% 3,996 100% 0 0% 4,009
Western River 2,444 28% 4,547 51% 1,848 21% 8,839
White Lagoon 8,176 93% 593 7% 28 0% 8,797
Willson River 4,604 72% 1,782 28% 0 0% 6,386
Not named* 27 93% 2 7% 0 0% 29
Figure 22 shows a 2002 assessment of river health conducted by the Environment Protection Authority (EPA) for Kangaroo Island. This assessment is based upon statistical analysis of macro-invertebrate and water quality data collected during 1994–99 at small sites (EPA 2002). It shows that sites on the Willson and Middle rivers and Timber Creek were significantly impaired compared to expected reference condition, while other sites were in very good condition. The poor status of Willson River and Timber Creek reflects the high and highly variable salinity of these streams, which limit the diversity of macro-invertebrate fauna. More recent work by the EPA suggests that broader scale assessments of catchment and riparian health such as the work quoted above may be more useful for describing river condition and assessing longer terms trends (P Goonan, EPA Aquatic Ecologist, pers. com. 2008). In summary, the current condition of Kangaroo Island’s rivers and streams is highly variable from relatively unchanged since European settlement, to highly modified and degraded.

KI Natural Resources Management State of the Region 2009 60
Condition of inland wetlands There is no comprehensive assessment of the condition of all inland wetlands on Kangaroo Island. The most recent relevant analysis was for a representative sample of 26 wetlands (Seaman 2002), of which only two were freshwater, five marginal to brackish and the remainder saline. Dryland salinity is driving increasing wetland salinisation and is a major threat to wetlands on Kangaroo Island. Seaman (2002) developed a wetland condition score based on a range of biological, physio-chemical, and habitat parameters, and identified:
14 sites as being ‘degraded’ – have a high level of disturbance and received low rapid assessment scores
9 sites as ‘natural’ – have little disturbance, received moderate to high rapid assessment scores (usually located within national parks and wildlife reserves or managed on private lands for conservation purposes)
3 sites as being ‘intact’ – have no obvious sign of disturbance, scored very highly in the rapid assessment and are formally conserved within national parks and wildlife reserves.
Figure 22. River health assessment 1994–1999 (Source: EPA 2002)
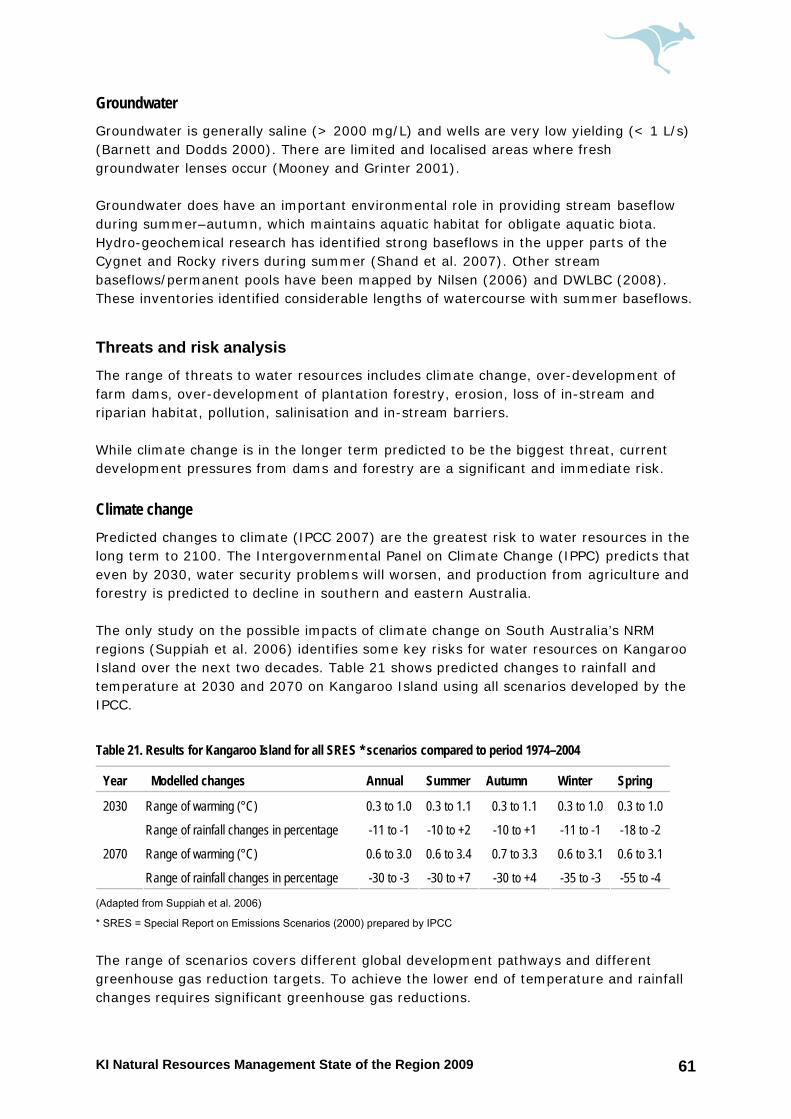
KI Natural Resources Management State of the Region 2009 61
Groundwater Groundwater is generally saline (> 2000 mg/L) and wells are very low yielding (< 1 L/s) (Barnett and Dodds 2000). There are limited and localised areas where fresh groundwater lenses occur (Mooney and Grinter 2001). Groundwater does have an important environmental role in providing stream baseflow during summer–autumn, which maintains aquatic habitat for obligate aquatic biota. Hydro-geochemical research has identified strong baseflows in the upper parts of the Cygnet and Rocky rivers during summer (Shand et al. 2007). Other stream baseflows/permanent pools have been mapped by Nilsen (2006) and DWLBC (2008). These inventories identified considerable lengths of watercourse with summer baseflows.
Threats and risk analysis The range of threats to water resources includes climate change, over-development of farm dams, over-development of plantation forestry, erosion, loss of in-stream and riparian habitat, pollution, salinisation and in-stream barriers. While climate change is in the longer term predicted to be the biggest threat, current development pressures from dams and forestry are a significant and immediate risk.
Climate change Predicted changes to climate (IPCC 2007) are the greatest risk to water resources in the long term to 2100. The Intergovernmental Panel on Climate Change (IPPC) predicts that even by 2030, water security problems will worsen, and production from agriculture and forestry is predicted to decline in southern and eastern Australia. The only study on the possible impacts of climate change on South Australia’s NRM regions (Suppiah et al. 2006) identifies some key risks for water resources on Kangaroo Island over the next two decades. Table 21 shows predicted changes to rainfall and temperature at 2030 and 2070 on Kangaroo Island using all scenarios developed by the IPCC.
Table 21. Results for Kangaroo Island for all SRES * scenarios compared to period 1974–2004
Year Modelled changes Annual Summer Autumn Winter Spring
Range of warming (°C) 0.3 to 1.0 0.3 to 1.1 0.3 to 1.1 0.3 to 1.0 0.3 to 1.0 2030
Range of rainfall changes in percentage -11 to -1 -10 to +2 -10 to +1 -11 to -1 -18 to -2
Range of warming (°C) 0.6 to 3.0 0.6 to 3.4 0.7 to 3.3 0.6 to 3.1 0.6 to 3.1 2070
Range of rainfall changes in percentage -30 to -3 -30 to +7 -30 to +4 -35 to -3 -55 to -4
(Adapted from Suppiah et al. 2006)
* SRES = Special Report on Emissions Scenarios (2000) prepared by IPCC
The range of scenarios covers different global development pathways and different greenhouse gas reduction targets. To achieve the lower end of temperature and rainfall changes requires significant greenhouse gas reductions.

KI Natural Resources Management State of the Region 2009 62
The modelling decline in mean annual rainfall is highly significant, as it would lead to a serious decline in average annual runoff. The rainfall–runoff relationship derived from Middle River Reservoir data (McMurray 2007), shows that even a 5% drop in rainfall from 800 mm/yr would lead to approximately a 20% drop in mean annual runoff. A 10% drop in mean annual runoff would lead to an up-to 40% decline in mean annual runoff. The predicted decline in spring rainfall is also significant for agriculture and catchment yields to the Middle River reservoir.
Farm dams Farm dams can have serious downstream impacts for other users, including the environment, depending on their number, density, size, location in a catchment, whether on- or off-stream, and their manner of operation. In 2001 there were around 8500 farm dams with the vast majority being smaller stock dams (Figure 23). This number is now likely to be an underestimate given the succession of dry years. In the only catchment where there is more recent data, Middle River, total farm dam volume increased by 8% from 2001 to 2006 (AWE 2008).
Commercial forestry Plantation forestry now occupies approximately 20,300 ha on Kangaroo Island (DWLBC 2008), having grown from approximately 3200 ha in 2000. The area mapped by DWLBC includes existing plantations and areas prepared but not yet planted as of March 2008 (see Figure 1). The impacts of plantation forestry on water resources have been well documented nationally and internationally. Trees use and intercept more water than pasture due to greater levels of transpiration, interception of rainfall and groundwater extraction through roots. Consequences of afforestation include reductions in runoff, and groundwater recharge and lowered watertables, which tend to be at their greatest under dry conditions (DWLBC Technical Note 2007/12). Studies in Australia show that plantation forestry (whether blue gums or pines) reduces mean annual runoff by 60–100% more than pasture. A South Australian study, from the Mount Lofty Ranges, found an 85% higher reduction in runoff compared to pasture. Plantation forestry can contribute to reductions in salinity and improved water quality when appropriately placed within the landscape. The forest industry has previously identified around 82,000 ha as suitable for plantation forestry in the 600–900 mm mean annual rainfall zone on Kangaroo Island (Kangaroo Island Forestry Steering Committee 2001).
Cumulative impacts The cumulative impacts of plantation forestry, farm dams and the predicted decline in rainfall due to climate change will reduce streamflows on average. However, the most serious impacts will be in drier years, which are likely to become more common under climate change.

KI Natural Resources Management State of the Region 2009 63
Recent modelling of the combined impacts of existing plantation forestry and farm dams identifies a reduction already in mean annual streamflows (DWLBC 2008). The modelling shows that significant parts of the Island are over the South Australian Government’s ‘25%’ policy for sustainable use: parts of the Cygnet River catchment, all of the De Mole River catchment, a large part of the Harriet River catchment, all of the catchments of the Stunsail Boom, South West and Western rivers. For details of these catchments see the Water Resources policy section of Volume 3 of the Plan. Any future decline in rainfall due to climate change will seriously compound these problems.
Erosion There is considerable data for existing watercourse erosion and erosion risk for 12 catchments (Nilsen 2006; DWLBC 2008). In general, unstable stream banks and erosion heads were more common in central and eastern catchments.
Loss of instream and riparian habitat Width of riparian vegetation has been mapped for the larger watercourses (≥ 3rd order) for 12 catchments (Nilsen 2006; DWLBC 2008). This information, although extremely valuable, does not provide information on the condition or likely trend of the vegetation. This is critical information to assist in targeting investment and actions. Given experience in other regions it is likely that many areas of riparian vegetation will decline and disappear in time without active intervention.
Salinisation Stream salinisation is a well-documented problem on Kangaroo Island (Shand et al. 2007; Dooley et al. 2002). This trend will continue until a new hydrological balance is reached. Predicting the timeframe is difficult given land use change and climate change.
In-stream barriers The locations of in-stream barriers have been mapped for the larger watercourses (≥ 3rd order) for 12 catchments (Nilsen 2006; DWLBC 2008). In-stream barriers prevent the movement of aquatic biota. This can be especially significant for fish species that move upstream, such as climbing galaxiids, black bream or short-headed lamprey.

KI Natural Resources Management State of the Region 2009 65
Current monitoring and investigations There are five gauging stations operated on Kangaroo Island by DWLBC; three of these collect salinity and temperature as well as discharge. The EPA’s state-wide ambient water quality monitoring program has seven monitoring sites on Kangaroo Island: five stream sites at Cygnet River (Stokes Bay Road), Cygnet River (Bark Hut Road), Middle River, Willson River, Rocky River; and two estuarine sites in the lower Cygnet River.
Information gaps The critical information gaps are:
flow, salinity and temperature data for more watercourses
better understanding of groundwater–surface water interactions
finer scale modelling of the impacts of interception activities and climate change on streamflows
quantification of environmental water requirements
comprehensive but targeted water monitoring program
condition of, and risks to, riparian vegetation.

KI Natural Resources Management State of the Region 2009 66
Terrestrial ecosystems and biodiversity
Socioeconomic values Kangaroo Island benefits from a unique biological system sustained by the significant tracts of protected areas but also its diverse and spectacular coastal features. although it is difficult to put an economic value on conserving and preserving the Islands biodiversity, a value can be derived for the attraction the Island’s ‘natural environment and abundant wildlife’ has to visitors. This does not in any way devalue biodiversity’s intrinsic value. Nature-based activities are the main attraction for visitors to Kangaroo Island, especially for international visitors (Colmar Brunton 2007). According to the 2006–07 TOMM Visitor Exit Survey Report, the main attractions for visitors were observing/interacting with native animals/wildlife (83%), bush walking/hiking (56%), and wine tasting and purchasing local produce (50%). Estimates of the economic value of tourism to the Island vary. URPS (2006) quotes a total annual visitor spend of approximately $65 million for the period 2001–04. Hudson Howells (2002) estimated the economic contribution of National Parks to Kangaroo Island tourism was $21.9 million and generated 359 jobs.
Regional description Kangaroo Island is part of the Kanmantoo Interim Biogeographic Framework of Australia (IBRA) region (Environment Australia 2000). The IBRA framework was endorsed by ANZECC as the conservation planning tool for addressing the status of Australia’s native ecosystems. The framework provides a systematic and comparable way of describing the distribution and status of ecosystems, and subsequently identifying priority ecosystems for protection. Kangaroo Island has been separated from mainland Australia for 8900 years and it exhibits a number of biodiversity traits typical of isolated areas including high endemism in plants (Belperio and Flint 1999).
Regional ecological areas Kangaroo Island has been classified into 6 regional ecological areas (Figure 24) on the basis of geology, soils, pre-European vegetation types and other environmental factors (Willoughby et al. 2001). Each of these regions has very different biodiversity conservation issues (see section Condition and Trends).

KI Natural Resources Management State of the Region 2009 67
Flora In 1883 the vegetation of Kangaroo Island was described to be “mainly blanketed by heathy scrubland involving E. cosmophylla and E. baxterii sp. and sclerophyll heath vegetation so thick as to create an almost impenetrable barrier to man and horse”. In addition he noted woodlands confined to borders of watercourses and ‘savannah’ vegetation of grassy areas interspersed with sheoaks seen near Kingscote and on the north coast of the Dudley Peninsula. Before European settlement Kangaroo Island was described as being a mixture of stringybark mallee woodland and scrubland associations with a sclerophyllous (hard-leaved) heath understorey. Typical upper storey species include cup gum (Eucalyptus cosmophylla), brown stringybark (E. baxteri), SA coastal mallee (E. diversifolia), KI mallee ash (E. remota) and, at the eastern end, Kangaroo Island narrow-leaf mallee (E. cneorifolia) which is often associated with broombrush (Melaleuca uncinata). Most large trees including sugar gum (E. cladocalyx), SA blue gum (E. leucoxylon ssp. leucoxylon), manna gum (E. viminalis) and river red gum (E. camaldulensis) are typically found on the deeper alluvial soils of valley bottoms and lower slopes and along larger watercourses () (KINRB 2003) Neagle (1995) recognised 55 major plant communities on Kangaroo Island. Ball and Carruthers (1998) recognised 37 main remnant vegetation groups based on overstorey with 132 subgroups. In addition, 7 one-off categories were also defined plus beaches, lakes and swamps. Broad vegetation structural formations are shown in Figure 25.
Fauna At the time of European settlement there appear to have been 12 species of terrestrial mammal. The presence of two species (Dasyurus viverrinus, eastern quoll and Phascogale tapoatafa, brush-tailed phascogale) is known only on the accounts of wallaby trappers and an 1839 newspaper account (Robinson and Armstrong 1999). Sub-fossil remains indicate both Dasyurus maculatus (spotted-tailed quoll) and D. viverrinus (eastern quoll) were present. The bat fauna includes 6 resident species and 2 vagrant species (Pteropus scapulatus, little red flying fox and Tadarida australis, white-striped mastiff bat). In addition to the terrestrially based mammals, 3 species of fur-seal and one species of sea-lion haul out along parts of the island coastline; 18 species of whale and dolphin have been recorded from the waters surrounding the Island. One mammal species Sminthopsis aitkenii (Kangaroo Island dunnart) is considered endemic to the Island. Around 180 bird species could be considered resident on Kangaroo Island at the time of European settlement (Willoughby et al. 2001). The number is subject to the definition of ‘resident’. This number includes the Dromaius baudinianus (Kangaroo Island emu, now extinct) and several endemic subspecies (Carpenter and Horton 1999). The invertebrate fauna of Kangaroo Island are poorly documented. There are some rare species of butterfly that are found in the region due to its wetland habitats.
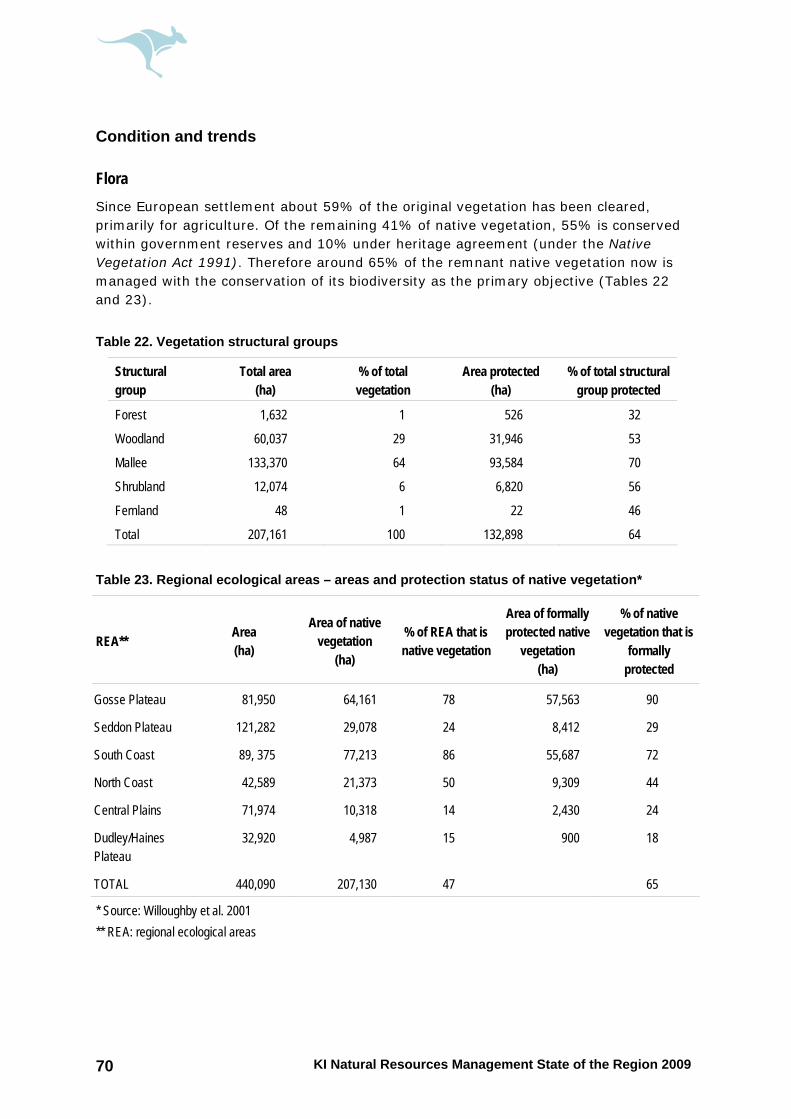
KI Natural Resources Management State of the Region 2009 70
Condition and trends
Flora Since European settlement about 59% of the original vegetation has been cleared, primarily for agriculture. Of the remaining 41% of native vegetation, 55% is conserved within government reserves and 10% under heritage agreement (under the Native Vegetation Act 1991). Therefore around 65% of the remnant native vegetation now is managed with the conservation of its biodiversity as the primary objective (Tables 22 and 23).
Table 22. Vegetation structural groups
Structural group
Total area (ha)
% of total vegetation
Area protected (ha)
% of total structural group protected
Forest 1,632 1 526 32
Woodland 60,037 29 31,946 53
Mallee 133,370 64 93,584 70
Shrubland 12,074 6 6,820 56
Fernland 48 1 22 46
Total 207,161 100 132,898 64
Table 23. Regional ecological areas – areas and protection status of native vegetation*
REA** Area (ha)
Area of native vegetation
(ha)
% of REA that is native vegetation
Area of formally protected native
vegetation (ha)
% of native vegetation that is
formally protected
Gosse Plateau 81,950 64,161 78 57,563 90
Seddon Plateau 121,282 29,078 24 8,412 29
South Coast 89, 375 77,213 86 55,687 72
North Coast 42,589 21,373 50 9,309 44
Central Plains 71,974 10,318 14 2,430 24
Dudley/Haines Plateau
32,920 4,987 15 900 18
TOTAL 440,090 207,130 47 65
* Source: Willoughby et al. 2001 ** REA: regional ecological areas

KI Natural Resources Management State of the Region 2009 71
Key issues in each of the regional ecological areas are:
Gosse Plateau: threats of feral goats and pigs, and Phytophthora
South Coast: threats of feral goats, weed invasion and Phytophthora
Seddon Plateau: fragmented vegetation, threats of feral goats, weed invasion, salinity and Phytophthora
North Coast: fragmented vegetation, threats of feral goats, weed invasion, salinity and Phytophthora
Central Plains: highly fragmented vegetation, which is mostly in many small blocks, serious weed invasion, salinity, lack of burning
Dudley–Haines Plateau: highly fragmented vegetation, which is mostly in many small blocks, serious weed invasion, salinity, lack of burning.
Floristics in remnant areas A relatively large percentage of South Australian plant species (891 species) occur on Kangaroo Island for its small area (28% of species in 0.5% of the state area). There are 45 taxa considered endemic to the Island and another 11 that are near endemic. Of the 891 species on the Island, 14 are listed as threatened under the Commonwealth Environment Protection and Biodiversity Conservation Act 1999 and 42 are listed as threatened under the South Australian National Parks and Wildlife Act 1972 with a further 118 listed as rare (Willoughby et al. 2001).
Flora of particular regional significance Of the 14 plant species that are considered nationally threatened (Environment Australia 2000), 3 are listed as endangered and 11 as vulnerable. Details of these species can be found in the Kangaroo Island Biodiversity Plan (Willoughby et al. 2001, page 54). One further species will be brought to the attention of the Commonwealth for listing. Of the 55 major plant communities on KI recognised by Neagle (1995) 4 were not represented or poorly represented in reserves in SA and 3 were assigned priority ratings. Davies and Overton (1998) have recognised another 2 communities of importance (Willoughby 2001, page 29). Phytophthora is known to cause the death of many plants within specific habitats. Willoughby et al. (2001) used the Floristic Vegetation Mapping of KI (Ball and Carruthers 1998) to identify a number of plant communities considered regionally important based on: small representative area (< 100 ha) or under-represented in the system of reserves on KI (< 64% protected). Particularly important to preserve are Eucalyptus viminalis (rough-bark manna gum) communities exposed to browsing by koalas and E. baxteri (brown stringybark) communities because of a vulnerability to dieback from an unspecified cause (Willoughby et al. 2001).
KI Natural Resources Management State of the Region 2009 72
In addition to the 891 native plant species, 277 plants have been introduced to the Island and become naturalised since European settlement (Robinson 1999). Many other garden or crop plants could become naturalised. It is thought that no genetically modified organisms have been introduced to Kangaroo Island.
Fauna Three species of mammal have been successfully introduced to the Island (koala, platypus and the common ringtail possum). The native common ringtail possum may have been present in small numbers before being introduced from the mainland. Numerous other mammal species on the Island, including sheep, cattle and dogs, have the potential to become naturalised. Only one endemic bird species on Kangaroo Island (Dromaius baudinianus, Kangaroo Island Emu) is known to have become extinct since European settlement. The Flora and Fauna Board deliberately introduced 16 bird species to the island and 4 of these, including the Cape Barren Goose, have established self-sustaining or increasing populations. Five species of domestic game fowl have established pest populations requiring management. The Flora and Fauna Board introduced 3 species of reptile (shingleback, eastern blue tongue and the common long-necked turtle) to the island around 1946 and the eastern bearded dragon has been introduced more recently. The eastern blue tongue and the eastern bearded dragon have become naturalised with apparently self-sustaining populations. The common long necked tortoise may have been present before its introduction. No species of frog has been introduced onto the island and none are known to have become extinct. Records of freshwater fish on Kangaroo Island have been described primarily from native fish enthusiasts and taxonomists. Taxonomic inventories have been built up by the South Australian Museum. More recently, fish distribution data has been compiled from field studies performed by Native Fish Australia (South Australia) The predominant native freshwater fish include two galaxias species and a goby (Nilsen 2006). Many invertebrates have been introduced to the island and become naturalised including notably the Ligurian bee, marron and yabby (Cherax tenuimanus and C. destructor) and the Portuguese millipede.
Fauna of particular regional significance Three species of Australian mammal, native to Kangaroo Island, are listed nationally. Sminthopsis aitkeni (Kangaroo Island dunnart) and the subspecies Isoodon obesulus obesulus (southern brown bandicoot) are considered endangered while Pseudomys shortridgei (heath rat) is considered vulnerable (Environment Australia 2001). However, there is only one record of the heath rat on Kangaroo Island. No other mammal species is listed as threatened by the Department for Environment and Heritage (DEH). At a national level the SA glossy black-cockatoo (Calyptorhynchus lathami halmaturinus) is considered endangered and at a state level the hooded plover (Thinornis rubricollis) is

KI Natural Resources Management State of the Region 2009 73
considered vulnerable (Environment Australia 1998). A further 12 species of ‘resident’ birds, excluding the extinct emu, are considered threatened (endangered or vulnerable) by DEH. One reptile recorded on Kangaroo Island, Rosenberg's goanna (Varanus rosenbergii), is, listed as a vulnerable species at the state level, under the National Parks and Wildlife Act 1972. A vagrant species, the leathery turtle (Dermochelys coriacea) is listed as vulnerable. None of the species of frog are listed as threatened. Naturalised species such as koalas, goats, pigs, deer, house mice, black rats and feral cats pose problems for biodiversity conservation and agricultural production. Most of these species are beyond feasible eradication although there are some management plans in place to reduce the impact caused by these species. Deer and goat numbers are currently at a level that may enable eradication. The koala has reached pest status as an introduced species and threatens riparian vegetation communities on the Island. The tammar wallaby is present in large numbers on Kangaroo Island. This species is presumed extinct on mainland South Australia (Kemper and Queale 1990). Kangaroo Island therefore probably has the largest remaining population of the tammar wallaby. It also has a reputation as an agricultural pest and can cause disruptions to revegetation projects. This presents a management problem (Willoughby et al. 2001). The absence of European rabbits (Oryctolagus cuniculus) and red foxes (Vulpes vulpes) from Kangaroo Island is particularly notable as evidenced by the persistence of a number of ground-dwelling species that no longer exist on the mainland.
Threats and risk analysis The key threats to terrestrial biodiversity were assessed using the framework described in the section Risk analysis framework. The results are shown in Table 24. The risk assessment provides a guide to the development of strategic and operational priorities. Note that the threat of climate change has scored relatively low as the timeframe for the risk assessment is 10 years.

KI Natural Resources Management State of the Region 2009 74
Table 24. Risk analysis of key threats to terrestrial biodiversity
Threat Extent
Biophysical risk
assessment score
Management need
assessment score
Technical priority score
Climate change Entire Island 18 9 27
Fragmentation All Island except Gosse Plateau and South Coast REAs
24 12 36
Grazing (stock and over-abundant native species)
All Island except Gosse Plateau and South Coast REAs
20 16 36
Changed fire regime Most of the Island 30 9 39
Feral animals Most of the Island 30 16 46
Weeds and pathogens Most of the Island 16 12 28
Soil erosion All Island except Gosse Plateau and South Coast REAs
6 6 12
Salinity Central Plains & parts of Seddon Plateau 20 6 26
Coastal estuarine and marine ecosystems and biodiversity
Socioeconomic values The coast is an important element of the Kangaroo Island experience for visitors and strongly contributes to tourism. The aquaculture and commercial fishing industries are significant employers and contributors to the Island’s economy.
Regional description Along the southern coast of Australia, marine biogeographers recognise a major biogeographic region known as the Flindersian Province that extends from southwest Western Australia to southern New South Wales including the waters of South Australia, Victoria and Tasmania. Within the Flindersian Province, the seas surrounding KI fall into 2 well-defined marine bioregions known as the Eyre Bioregion and the Gulf St Vincent Bioregion. KI is also on the edge of the Coorong Bioregion. The Gulf St Vincent Bioregion extends from Cape Borda to Cape Willoughby along the north coast of KI and is dominated by a calm-water seagrass habitat and given protection by the southern side of Kangaroo Island and the Fleurieu, Yorke and Eyre Peninsulas. The Eyre Bioregion

KI Natural Resources Management State of the Region 2009 75
extends along the remaining southern and western end of the Island and is dominated by rough-water rocky habitat exposed to the southern ocean (KINRB 2003). Based on coastal geology, wave climate and coastal orientation, Short and Fotheringham (1986) identified 3 coastal geomorphological regions (or biounits) for the KI coast. These include North Coast Cassini Biounit (from Cape Borda to North Cape, 111 km), the North Eastern Coast Nepean Biounit (from North Cape to Cape Willoughby, 114 km); and, the Southern and Western Coast Gantheaume Biounit (Cape Willoughby to Cape Borda, 232 km). A surface current flows from west to east along both sides of KI and is strongest from May to July. The mean sea surface temperatures ranges 18–20°C in summer and 14–16°C in winter. The salinity of waters is relatively uniform (25.5–36%) but has a greater range, as does water temperature, in sheltered bays and inlets. The inshore regions of the northwest coast of KI are under the influence of seasonal cold water and nutrient rich coastal upwellings. This can result in offshore water temperatures of 18°C and inshore water temperatures of 11°C during summer months. The major influence of the coastal upwellings extends from Coffin Bay (Eyre Peninsula) to Cape Borda and is responsible for the relatively high levels of productivity and pilchard abundance in the region (KINRB 2003). This may be linked to the abundance of sea birds, marine mammals and high levels of marine benthic diversity in the region. Kangaroo Island (along with Pages Islands in Backstairs Passage) is a region of considerable conservation significance for marine flora and fauna. The marine environment has long been recognised as one of the richest and most fascinating of the southern Australian coasts. This richness is partly due to the great variety of coastal habitats provided by the Island. The marine benthic flora is extremely rich and diverse and includes over half of the species found in southern Australia (KINRB 2003). Algae dominate rocky coasts while sheltered coastal areas are dominated by seagrass. Five genera of seagrass and 500–600 species of marine algae have been recorded. Figure 26 illustrates Kangaroo Island’s benthic habitats and water reserves. A number of reserves exist along this stretch of coastline that assist in protecting Kangaroo Island’s valuable flora and fauna. Most notable are the Western River Conservation Park, Pelican Lagoon and Seal Bay. The fish fauna of the Kangaroo Island Province is diverse but typical of the species found in the Flindersian Province along the southern coast of Australia. Along the inshore coastal waters of KI, some 231 species of fish have been recorded. Such diversity over a relatively small geographic range is in part due to the wide variety of aquatic habitats (KINRB 2003). There are a number of important sea bird populations on Kangaroo Island including little penguins, sooty and pied oystercatchers, Australian pelicans, osprey and white-breasted sea eagle, 4 species of cormorants, pacific gulls and 3 species of tern. Migratory wading birds are protected under the Japan–Australia Migratory Bird Agreement (JAMBA) and the China–Australia Migratory Bird Agreement (CAMBA). These agreements are in place to protect birds at either end of their migratory route. The

KI Natural Resources Management State of the Region 2009 76
coastline of Kangaroo Island is a site of international importance because it provides habitat for the red-necked stint, ruddy turnstone and sharp-tailed sandpipers (KINRB 2003). The region contains not only breeding sites for the rare Australian sea lion (Neophoca cinerea) and the New Zealand fur seal (Arctocephalus forsteri) but also areas which are regularly frequented by southern right whales on their northern migration to calving and breeding areas in the Great Australian Bight (KINRB 2003). Several other species of whales and dolphin frequent the waters around KI. Together, The Pages Islands in the Backstairs Passage and the south coast of KI provide habitat for the largest breeding group of sea lions in the world and account for 30% of the world population. The southern and western coasts of KI are the second largest breeding area for the New Zealand fur seal in SA (after the Neptune Isles) and account for 26% of the SA population. Vast expanses of seagrass meadows grow around the eastern coastlines of Kangaroo Island including in Emu and Boxing bays, Nepean Bay, Antechamber Bay and D’Estrees Bay. Significant seagrass loss (of up to 2700 ha) is suspected to have occurred in Nepean Bay, particularly in Western Cove (KI NRM Board 2003). The cause of this loss is attributable mainly to increased sediment and nutrient inputs coming from the Cygnet River and stormwater runoff from the township of Kingscote. Long term monitoring is currently being established to assess the health of key seagrass meadows around the Island. The Kangaroo Island coast is approximately 487 km in length. Nearly 65% of the coastal margin is dominated by native vegetation and the remainder by cleared farmland. Approximately 38% of the coast is conserved within government-protected areas (KINRB 2003). Coastal salt marsh communities are important because they provide a buffer zone between marine and terrestrial environments. Mangrove and salt marsh communities along the SA coast amount to 820 km2. The saltmarsh community on Kangaroo Island amounts to 70 km2 (11% of State) and much of it is contained within freehold title and used for agriculture and urban settlement. There are 25 estuaries identified on Kangaroo Island (DEH 2007), with a mixture of saltmarsh, mudflats and seagrass communities; 7 are listed as being a wetland of national significance, and 10 (and/or associated habitats) are listed on the register of the National Estate (Figure 27). There are 16 conservation areas adjacent to the coast and three offshore island reserves conserving a total area of 2730 ha (KINRB 2003). Netting closures apply for 3 localities along the coast and for waters within the proximity of 5 rivers entering the sea. Introduced species compete with indigenous marine species and threaten the ecological integrity and function of ecosystems.

KI Natural Resources Management State of the Region 2009 77
Coastal and/or marine areas protected by legislation are located at Pelican Lagoon (1503 ha), Seal Bay (447 ha), Bales Beach (1011 ha) and The Pages (7013 ha). All these protected areas are adjacent to terrestrial protected areas managed by DEH. All, except The Pages, are managed by PIRSA Fisheries under the Fisheries Management Act 2007. DEH manages The Pages. Islands in Pelican Lagoon, The Pages, Beatrice Islet and Busby Islet, West Island, Casuarina Islands, Pelorus Islet and Nobby Island are protected within DEH reserves. The South Australian Government has a policy of creating 19 marine parks by 2010. The primary goal of the marine parks is to “conserve and protect the biodiversity of all South Australian marine ecosystems, including species, habitats, populations and ecological processes” (DEH 2008). Currently the Government proposes three marine parks that will include waters within the Kangaroo Island NRM regions boundary. The Marine Parks Act 2007 is the legislative framework for the establishment of a representative system of marine parks in our State's waters. Regional NRM plans must be consistent with any management plans produced under the Marine Parks Act 2007. Up to 80% of pollution in the marine environment originates on the adjacent land and is carried by wind or water into the sea (DEH 2008). Water quality problems associated with land-based pollution sources are documented in several areas within the Encounter Marine Park. The regional natural resources management boards and the EPA will address land-based impacts on the marine environment. In addition to a representative marine park system the conservation and management of coast estuarine and marine environments of Kangaroo Island is being addressed through the Marine Planning Framework (NRM Act), the Estuaries Policy and Action Plan for South Australia (EPAPSA) (2005), the Living Coast Strategy for SA (2006) and the KI NRM Board’s participation in the Marine Integration Project (MIP) (2006) (see Current monitoring and investigations section below). The KI NRM Board has also signed a Memorandum of Understanding with the Northern and Yorke, and Adelaide and Mount Lofty Ranges NRM Boards regarding the management of Gulf St Vincent.
Protected species A number of marine mammals have national recovery plans of relevance to Kangaroo Island e.g. southern right whale and Australian sea lion. In addition, leafy sea dragons, white pointer sharks, rock lobster with eggs, sand crabs with eggs, giant crabs with eggs and the Southern blue groper (north coast of KI to Cape Willoughby) are protected under fisheries legislation. Kangaroo Island’s sandy beaches and dunes are also home to the state listed Hooded Plover. Intertidal reefs in South Australia are fully protected under the Fisheries Act 1982. It is illegal to remove any bottom dwelling organism from an intertidal rocky reef between the high tide mark and out to a depth of 2 m. This closure does not include sand or beach areas.

KI Natural Resources Management State of the Region 2009 78
PIRSA maintain a Fisheries team on Kangaroo Island which regularly patrols both coastal and marine areas. Reportable offences include, but are not limited to:
illegal fishing of protected species
fishing in prohibited areas or during seasonal closures
exceeding bag or boat limits
keeping of undersized fish
inappropriate or dangerous boating.

KI Natural Resources Management State of the Region 2009 81
Condition and trends Data and information on Kangaroo Island coastal, estuarine and marine (CEM) ecosystems are patchy, having only recently been collected in a systematic and geographically widespread manner. However, much can be said about their general status, if not trends at this early stage. As might be anticipated given the low level of coastal development around most of the Island, many of the Island’s CEM ecosystems are in good condition. Subtidal reefs are covered in a dense canopy of macroalgae (M. Kinloch pers. obs.) and fish diversity and abundance are high (Brock and Kinloch 2007). Intertidal reefs along the north and south coasts have high invertebrate and algal biodiversity, with two sites (Browns Beach and Hanson Bay) identified as biodiversity hotspots when compared with other Australian temperate coastlines (Benkendorff et al. 2007). Seagrass meadows in some bays such as D’Estrees Bay, Antechamber Bay and Emu Bay have been assessed as being in good condition, with long, lush seagrass blades, low epiphyte loads and average densities of seagrass cover estimated at 79%, 82% and 90% respectively (Southgate 2005; Kinloch and Brock unpubl. data). In contrast, epiphyte loads are high to very high in Western Cove, Bay of Shoals and Pelican Lagoon (Kinloch and Brock unpubl. data). In the last two areas, seagrass cover appears to be still quite high but in the first, the situation appears more dire. In Western Cove, high epiphyte loads and an abundance of drift red macroalgae appear to be literally smothering seagrass beds in some areas and there are large areas of bare sand in the bay. There are a number of anecdotal reports from local fishermen of seagrass loss in Western Cove. These claims will be investigated this summer by searching the seabed in Western Cove for the presence of seagrass roots and rhizomes, which are known to exist for some time after the above-ground biomass has disappeared (Shepherd pers. comm.). Three annual censuses of the Little Penguin colony at Kingscote (2006–08) have indicated that population numbers are stable and good numbers of chicks are being produced each year (Brock and Kinloch 2008; Brock 2009). However, there are indications that penguin numbers at the Penneshaw colony have declined as a result of fur seal attacks (S Somerfield, Penneshaw Penguin Centre, unpublished data) and anecdotal reports that other colonies around the Island have been displaced by expanding fur seal colonies.
Threats and risk analysis The key threats to CEM ecosystems were assessed using the framework described in the section Risk analysis framework. The results are shown in Table 25. Many of the threats are inter-related and may have cumulative impacts. Wetlands and estuarine systems are especially vulnerable to impacts, as they have limited adaptive capacity.

KI Natural Resources Management State of the Region 2009 82
Table 25. Risk analysis of key threats to coastal, estuarine and marine ecosystems and biodiversity
Threat Extent Biophysical risk
assessment score
Management need
assessment score
Technical Priority score
Sea level rise (due to climate change)
Western Cove 6 6 12
Overharvesting Anywhere 20 12 32
Introduced marine pests
Very high-risk areas at American River and Kingscote and high risk sites at Christmas Cove and Penneshaw
15 20 35
Coastal/estuarine weed invasion
Everywhere 30 12 42
Input and movement of pollutants
Predominantly Nepean Bay and Pelican Lagoon, plus localised areas around Emu Bay and other settlements.
30 24 54
Habitat fragmentation
Entire Island, except for the Flinders Chase coastline and minor other areas
24 16 36
Loss of river flows to estuaries
All estuaries except Rocky, Ravine Des Casoars and Breakneck rivers
25 12 37
Loss of riparian/ wetland habitats
Everywhere 25 9 34
Inappropriate disturbances (e.g. recreation)
Everywhere 30 16 46
Lack of awareness of ecosystems services
Everywhere 25 18 43
Coastal erosion 24 10 34
Poor or inappropriate infrastructure
Mainly focused on towns and township development areas
15 30 45
Current monitoring and investigations The coast, estuarine and marine environments are of great significance socially, economically and environmentally for Kangaroo Island. The Kangaroo Island NRM board and its predecessor (Kangaroo Island Natural Resources Board Inc.) have invested in, or contributed towards, a considerable number of coastal, estuarine and marine projects. Much of this activity is undertaken in partnership with the community, PIRSA, DEH and the EPA. The following summarises current monitoring and investigations.
1. Seagrass meadows (2004–ongoing)

KI Natural Resources Management State of the Region 2009 83
Seagrass mapping in eastern bays of Kangaroo Island. Ongoing inshore surveys of seagrass cover and condition to assess baseline status and report trends in resource condition. Project encompasses seven bays and uses aerial photography to map seagrass distribution, and underwater videography to assess percentage cover, species composition and epiphyte load.
2. Seagrass biodiversity (2005–ongoing)
Assessment of biodiversity and abundance of marine fauna in seagrass meadow habitats of KI, Comparison of assemblages in degraded versus healthy seagrass meadows and investigation into indicator species for ongoing seagrass-health monitoring.
3. Marine pests (2005–ongoing, KI NRM Board, PIRSA)
Comprehensive underwater surveys at 4 high-risk boating and shipping nodes (ports and harbours) supplemented by ongoing community education, training and monitoring programs (aided by PIRSA and ReefWatch) aimed at extending community capacity to mitigate threats through prevention, detection and reporting strategies.
4. Little penguins (2005–ongoing)
An annual community census of the little penguin colony at Kingscote, KI is conducted by counting and mapping the active and inactive burrows around the foreshore. This provides trends in the distribution and abundance of the little penguin population at Kingscote.
This project is being supplemented by a penguin burrow activity study that is investigating the breeding cycle of the Kingscote little penguins by monitoring a subset of burrows every week to observe occupation levels and activities such as nesting, egg-laying and moulting.
In addition, a project has just commenced to tag and satellite track little penguins at the Kingscote, Penneshaw and Granite Island colonies to investigate foraging behaviour and grounds, colony fidelity and migration rates between colonies across the Encounter region.
5. Intertidal reefs (2006–ongoing, KI NRM Board)
Assessment and monitoring of biodiversity at five representative intertidal reef sites across Kangaroo Island. Development of biodiversity inventories and indices and selection of indicator species for ongoing biodiversity and intertidal reef health monitoring to detect and evaluate changes in resource condition.
6. Beach litter/marine debris (2005–ongoing)
An Island-wide community beach litter survey is run in conjunction with Clean Up Australia Day. This identifies the distribution, type and impact of coastal litter, reduces pollution and potential dangers to wildlife and provides consistent long-term monitoring of ‘presence and extent of litter’ (a national CEM indicator). It is currently being expanded to include explicit analysis of marine debris collected on KI beaches, for input into State threat mitigation strategies.
7. Recreational fishing survey (2007)

KI Natural Resources Management State of the Region 2009 84
A roving creel survey of the eight main public boat ramps and beach launching sites across Kangaroo Island to quantify catch and effort and investigate target and by-catch species and the demographics of the fishing sector
8. Coastal raptor census (2005; 2010)
A census of the Kangaroo Island populations of white-bellied sea-eagles and ospreys was conducted in 2005 and will be repeated in 2010 (Dennis 2005).
9. Pelican Lagoon Management Plan (2007–2009)
Development of a catchment-scale management plan encompassing land-based impacts to the environment of Pelican Lagoon and supporting and informing the parallel management plans being developed for the site as an Aquatic Reserve (PIRSA Fisheries) and a Sanctuary Zone (proposed Encounter Marine Park). This project generated a number of ancillary investigations:
Bathymetric Survey of Pelican Lagoon (Sept 2008 DEH, PIRSA, KINRMB) – Mapping of depth and shoreline variations to provide a bathymetric map of bottom topography. When combined with data from the tide gauges (see below) this also provides information on total water exchange and flushing rates.
Tidal flow – two tide gauges were installed, one at American River and the other inside Pelican Lagoon during the course of the bathymetric survey to provide an 8-day time-series of data on tidal currents in and out of the Lagoon, providing information on total water exchange and potential accumulation of environmental contaminants.
Ambient Water Quality Monitoring – Water quality indicators monitored at three sites in Pelican Lagoon during the course of the bathymetric survey to provide an 8-day time-series of data on chlorophyll a, temperature, salinity, turbidity and dissolved solids.
Shorebirds Survey of Pelican Lagoon (2008) – Data collected on the occurrence, abundance and preferred habitat of resident and migratory waders in Pelican Lagoon.
Ambient Water Quality Monitoring at five sites in Nepean Bay (1999–ongoing, EPA) Routine investigation of water quality in Bay of Shoals, Western Cove, Kingscote and adjacent offshore waters by monitoring nutrients, temperature, turbidity, salinity, microbial concentration and chlorophyll a.
Marine Integration Project (MIP) (2006–ongoing). The MIP is a partnership between five NRM Boards (including Kangaroo Island) and DEH. It is focused on achieving integration between Commonwealth and State marine planning initiatives, and the coast, estuarine and marine planning process in NRM regions. It adopts an integrated ‘catchment-coast-seas’ model and promotes investment in activities that address, for example, land-based impacts on marine environments, habitat mapping and restoration, threat abatement and monitoring and evaluation.
KI Natural Resources Management State of the Region 2009 85
Information gaps Critical information gaps have been identified for the CEM environments and more generally for the CEM biodiversity and ecosystem processes.
Information gaps in the coastal zone Impact of unmanaged coastal recreation and unregulated vehicle and pedestrian access to beaches, reefs and clifftops on:
coastal vegetation, much of which is endemic and/or rare
roosting and nesting sea and shorebird populations
intertidal reef biodiversity
cliff and dune erosion and vegetation trampling. Impact of existing and proposed residential and urban developments on:
the 4 points above
increased stormwater and effluent contamination and other pollution and environmental contaminants
infill and modification of estuarine and marshland environments and tidal flows through construction of levee banks, roads and drains
impact of decreased freshwater flows to estuarine and near shore environments through water extraction for human use
habitat fragmentation with reduction and interruption of foraging and breeding territories of coastal wildlife
impact of grazing stock, domestic pets and feral pests including sheep, cattle, dogs, cats, rodents, weeds and invasive or introduced garden plants, invertebrates and disease
vulnerability and impact of response to sea level change in low-lying coastal developments.
Information gaps in the estuarine and marine environments Extent and impacts of eutrophication and sedimentation in coastal, estuarine and marine environments from:
agricultural runoff
overflowing or leaking septic and STEDS systems
urban stormwater outfalls
fish processing and land-based aquaculture effluent discharge.
Extent and impacts of habitat destruction, disturbance and deterioration by:
direct physical disturbance of the seabed (e.g. anchor drag, dredging, wharf and marina developments)

KI Natural Resources Management State of the Region 2009 86
indirect physical and chemical disturbance (e.g. sedimentation, turbidity, breakwater construction, barge activity)
hydrocarbon and other contaminant pollution. Current and potential impacts and long-term management issues associated with fishing and aquaculture through:
declining populations, sizes and breeding capacity of both commercial and recreational catch species
entanglement of marine mammals in lost, discarded or operational fishing gear
escape of feral non-native species (e.g. mussels)
physical and biological impact on seabed communities from prawn trawling in Investigator Strait.
Existing and potential risk, extent and impact of marine pests due to:
routine and constant movement of ferry, barge, commercial and recreational vessels between areas of high international and national boating traffic and Kangaroo Island’s sensitive marine environments
ballast water discharges from merchant ships transiting Backstairs Passage adjacent to KI.
Impact of tourism activities that focus on regular wildlife encounters such as:
seal tours and observation in the wild at Seal Bay and Cape de Couedic
organised penguin tours at Kingscote, Penneshaw and opportunistic search and observation at other natural penguin burrow sites around KI
existing and potential whale and dolphin observation and interaction tours.
Information gaps in understanding local biodiversity and ecology Despite a long and active history of scientific enquiry on Kangaroo Island reflected in a good general understanding of the coastal zone and some detailed knowledge for specific areas and taxa, there have been very few systematic, comprehensive or long-term studies on Kangaroo Island’s marine, coastal and estuarine biodiversity, with the exception of seals, large raptors and Hooded Plovers. Apart from an intensive focus on seals, there are currently no short- or long-term studies being made of marine biota (either subtidal or intertidal) apart from the relatively recent and incomplete investigations listed in the section above. There have been a few, ad hoc, irregular and infrequent reef fish surveys that have documented and quantified localised reef fish abundances with limited replication and wide confidence limits. There is a need to establish a system of spatially and temporally replicated baseline and monitoring surveys of reef communities (including fish, invertebrates and algae) in each marine biounit and in ‘control’ and ‘impact’ sites to establish benchmarks and detect

KI Natural Resources Management State of the Region 2009 87
trends in condition. Similarly intertidal environments should be monitored for species diversity and abundance to detect potential impacts on rocky shores. With a few notable exceptions, research and monitoring studies to date have largely been under-resourced, short-term, patchy and fragmented and there is a need to develop a coordinated framework of indicators and sampling regimes for monitoring critical habitats and keystone biota that generates information about the condition of Kangaroo Island CEM ecosystems through time. The impacts of global warming associated with climate change will have far-reaching impacts on marine systems. Kangaroo Island is well placed to establish continuous, ongoing monitoring programs to provide early warning information to the world of its likely and actual effects.

KI Natural Resources Management State of the Region 2009 88
Geological features Kangaroo Island has a great diversity of geological features from a range of geological periods. Geological features can be of great importance for the scientific data and information they yield. In some cases they are also of significant tourism value such as Remarkable Rocks.
Overview of geology It is thought that the sediments that now form the oldest rocks on the Island were deposited in a basin about 750 million years ago during the late Precambrian era. The subsequent early Cambrian Period was the most significant period of sedimentation for Kangaroo Island and equates to a period of substantial sedimentary deposition in what are now the eastern Mount Lofty Ranges. At the end of this period, the sea that occupied the basin retreated as the compacted sediments of the region were locally uplifted. The ubiquitous Kanmantoo Group metasandstones of Kangaroo Island were formed from these compacted sediments. About 500 million years ago, the sedimentary rocks of Kangaroo Island, the Mount Lofty Ranges and the Flinders Ranges were heated, stressed and folded during a period of deep burial and mountain formation. Granites, formed from the melting of rocks deep in the earth’s crust, were injected into the overlaying sedimentary rocks, where they crystallised below the earth’s surface. During the next 200 million years, this mountainous area was extensively eroded. A large thickness of sedimentary rock was removed, revealing the top of the granites (e.g. Remarkable Rocks). Later, during the Permian period, glaciation spread northwestwards across South Australia, gouging out Backstairs Passage in the process. Clays and glacier-transported rocks were deposited during this period. Evidence of smooth glacier-transported rocks can be seen on the land surface in the Smith Bay–Emu Bay area of the Island. About 150 million years ago, Australia began to break away from its connection with Antarctica. Lava flowed from cracks in the earth’s crust, and eventually formed basalt rock, remnants of which can be found in Tasmania, Antarctica and on the basalt-capped Wisanger Hills of Kangaroo Island. Many periods of climate change have characterised the last 2 million years (the Quaternary Period). Sea levels have risen and fallen many times. During periods of low sea level, large areas of ocean floor have been exposed. Shell-rich ocean floor materials have been transported by wind-action, and deposited upon older sediments. Such deposits dominate the southern parts of the Island.
Geological monuments The Geological Society of Australia with assistance from Primary Industries and Resources SA (PIRSA) develop and maintain a database of geological monuments. These are geological features and landscapes of outstanding geological significance, which also

KI Natural Resources Management State of the Region 2009 89
have aesthetic appeal, rarity or historical links. Kangaroo Island has 20 listed geological monuments (Table 26).
Table 26. Geological monuments
Name Geological unit(s)
Big Gully White Point Conglomerate, Boxing Bay Formation, Emu Bay Shale
Cape D’Estaing White Point Conglomerate, Boxing Bay Formation, Emu Bay Shale
Emu Bay Emu Bay Shale
Glacial Pavements, Smith Bay Smith Bay Shale, Stokes Bay Sandstone
Stokes Bay
Old Government Quarry, Kingscote Wisanger Basalt
Kingscote Foreshore Kingscote Limestone
Harveys Return Kanmantoo Group, Inman Hill Subgroup
Ravine Des Casoars
West Bay Kanmantoo Group
D'Estrees Bay
Little Sahara
Cape Gantheaume Dunes
Point Ellen, Vivonne Bay Kanmantoo Group
Remarkable Rocks
Cape Du Couedic Kanmantoo Group
Christmas Cove, Penneshaw Tapanappa Formation, Kanmantoo Group
Alex Lookout to Snapper Point Mount Terrible Formation, Brighton Limestone, Tapley Hill Formation, Sturt Tillite, Marino Group, Hallett Arkose, Carrickalinga Head Formation
Cape Willoughby Granite Contact Encounter Bay Granite, Kanmantoo Group, Middleton Sandstone
Willson River, At Murray Flat The status of ‘geological monument’ conferred on any site by the Geological Society of Australia does not give to that site any automatic protection or an automatic right of access. Legal protection can come from a variety of laws, which may be applicable to the particular place, or as provided by the State, national or international heritage registers. For example, geological monuments located within reserves declared under the National Parks and Wildlife Act 1972 are protected due to them being of ‘natural and scientific interest’. When development of a parcel of land containing a listed Geological Monument is proposed, the State’s Geological Heritage Subcommittee provides councils with locations and descriptions of monument sites within the council area.

KI Natural Resources Management State of the Region 2009 90
References ABS. 2006. 2006 Census QuickStats: Kangaroo Island (DC) Australian Bureau of
Statistics, Canberra. www.censusdata.abs.gov.au/ABSNavigation/prenav/ ViewData?producttype=QuickStats&subaction=-1&areacode=LGA42750&action =401&collection=Census&textversion=true&breadcrumb=LP&period=2006&navmapdisplayed=false&
ABS. 2008. National Regional Profile: Kangaroo Island (DC). Australian Bureau of Statistics, Canberra. [www.abs.gov.au/AUSSTATS/[email protected]/Latestproducts/LGA42750Population/People12002-006?opendocument&tabname=Summary&prodno=LGA42750&issue=2002-2006]
ANZECC and ARMCANZ. 2000. Australian Water Quality Guidelines for Fresh and Marine Waters. Australian & New Zealand Environment and Conservation Council, and Agriculture and Resource Management Council of Australia and New Zealand.
AWE. 2008. Middle River Hydrological Assessment Reports. Prepared for SA Water by Australian Water Environments, Adelaide.
Ball, D and Carruthers, S. 1998. Kangaroo Island Native Vegetation Mapping (Technical Report). Department for Transport, Urban Planning and the Arts, Adelaide.
Bardsley, D. 2006. There's a change on the way — An initial integrated assessment of projected climate change impacts and adaptation options for Natural Resource Management in the Adelaide and Mt Lofty Ranges Region, DWLBC Report 2006/06, Department of Water, Land and Biodiversity Conservation, Adelaide.
Barnett, SR and Dodds, 2000. Groundwater resources on Kangaroo Island. Report 2000/00015. Primary Industries and Resources SA, Adelaide.
Bomford, M. 1991. Importing and keeping exotic vertebrates in Australia. Criteria for the assessment of risk. Bureau of Rural Resources Bulletin No. 12. Australian Government Publishing Service, Canberra.
Bomford, M. 2003. Risk assessment for the import and keeping of exotic vertebrates in Australia. Bureau of Rural Sciences, Canberra.
Brook, BW. 2007. Climate change: Anticipated trends and NRM implications. Presentation to DWLBC Climate Change Workshop 28 November 2007.
Carpenter, G and Horton, P. 1999. Birds. In AC Robinson and DM Armstrong (eds) A Biological survey of Kangaroo Island. Department of Environment, Heritage and Aboriginal Affairs, Adelaide.
Colmar Brunton Research Services. 2007. Kangaroo Island Resident Survey 2007/2008. Report for TOMM Kangaroo Island Committee.
CSIRO and Bureau of Meteorology. 2007. Climate Change in Australia – observed changes and projections. Summary Report. Australian Climate Change Science Program.

KI Natural Resources Management State of the Region 2009 91
Davies, R and Overton, B. 1998. The management of KI Narrow-Leaved Mallee–Kingscote Mallee plant communities on Kangaroo Island, South Australia. Report prepared for the Kangaroo Island Mallee Project Steering Committee, Kingscote.
DEH. 2007. Kangaroo Island Natural Resources Management Region Estuaries Information Package. Department for Environment and Heritage, Adelaide.
DEH. 2008. Marine parks. www.environment.sa.gov.au
Dooley, T, Dohle, L, Ciganovic, P and Henschke, C. 2002. Regional salinity management plan for Kangaroo Island. Prepared for KI Natural Resources Board and KI Soil Conservation Board, Kingscote SA.
DWLBC. 2007a. Regional land resource information for southern South Australia. (CD ROM) Soil and Land Program, Department of Water, Land and Biodiversity Conservation, Adelaide.
DWLBC. 2007b. Land and soil spatial data for southern South Australia – GIS Format. (CD ROM) Soil and Land Program, Department of Water, Land and Biodiversity Conservation, Adelaide.
DWLBC. 2008. Land use Survey – Kangaroo Island. Spatial data set.
DWLBC. 2007 Technical Note 2001/12 Plantation Forestry Design Guidelines for Sustainable Water Resources Management (AJ Greenwood, G Scholz, and JM Vanlaarhoven).
Econsearch. 2005. The economic contribution of Kangaroo Island to the state economy. Report prepared for Kangaroo Island Development Board, Kingscote, SA.
Environment Australia. 1998. Environmental Indicators for National State of the Environment Reporting: Biodiversity. Environment Australia, Canberra.
Environment Australia. 2000. Revision of the Interim Biogeographic Regionalisation of Australia (IBRA) and development of Version 5, Summary Report. Environment Australia, Canberra
Environment Australia. 2001. A directory of important wetlands in Australia. Third edition. Environment Australia, Canberra.
Environment Australia. 2001. National Objectives and Targets for Biodiversity Conservation 2001-2005. Environment Australia, Canberra.
Environment Protection Agency. 1998. Ambient water quality monitoring of South Australia’s rivers and streams (chemical and physical quality) Report No 1. Environment Protection Authority, Adelaide.
Environment Protection Authority. 2002. River health in the Fleurieu Peninsula and Kangaroo Island. Environment Protection Authority, Adelaide.
Environment Protection Authority. 2008. Water quality. www.epa.sa.gov.au/water_quality.html
Gellard, J. 2005. Repel the Invaders – Border detection program Kangaroo Island Biosecurity Strategy. Department for Environment and Heritage, Adelaide.
Hall, JA, Henschke, CJ, Dooley, T and Walker G. 2008. Adding detail to the National Groundwater Flow Systems Framework – Kangaroo Island as a regional case study. Paper for Second International Salinity Forum, Adelaide, 2008.

KI Natural Resources Management State of the Region 2009 92
Hall, JA. 2008. A description of the biophysical subregions of Kangaroo Island. DWLBC internal report prepared for Kangaroo Island NRM Board.
Hudson Howell Economic Research Consultants. 2002. Assessment of the economic impacts of the protected areas of Kangaroo Island.
IPCC. 2001. Third Assessment Report. Intergovernmental Panel on Climate Change, Geneva, Switzerland
IPCC. 2007. Climate change 2007: Synthesis Report. Intergovernmental Panel on Climate Change, Geneva, Switzerland
Kangaroo Island Forestry Steering Committee. 2001. Plantation forestry development on Kangaroo Island.
Kemper, CM. and Queale, L. 1990. Mammals. In CHS Watts (ed) A List of the Vertebrates of South Australia. Biological Survey Coordinating Committee and Department of Environment and Planning, Adelaide.
Kinloch, M, Summerson, R and Curran, D. 2003. Domestic vessel movements and the spread of marine pests – Risks and management approaches. Department of Agriculture, Fisheries and Forestry, Canberra.
KINRB. 2003. Integrated Natural Resources Management Plan for Kangaroo Island. Kangaroo Island Natural Resources Board, Kingscote SA.
Lampert, RJ. 2002. Aborigines. Chap 7 in M Davies, CR Twidale, and MJ Tyler (eds) Natural History of Kangaroo Island, 2nd edition. Royal Society of South Australia, Adelaide.
Maschmedt, DJ. 2002. Assessing agricultural land. (CD ROM) Soil and Land Information, Department of Water, Land and Biodiversity Conservation, Adelaide.
McMurray, D. 2007. A risk assessment of the impact of farm dams on streamflow in catchments on Kangaroo Island. DWLBC Technical Note 2007/16. Department of Water, Land and Biodiversity Conservation, Adelaide.
Mooney, T. and Grinter, K. 2000. Kangaroo Island Soil Conservation Board District Plan Review. Kangaroo Island Soil Conservation Board, South Australia
Neagle, N. 1995. An update of the conservation status of the major plant associations of South Australia. Native Vegetation Conservation Section, Department of Environment and Natural Resources, South Australia
Nelson, R, Webb, T and Byron, I. 2006. Socio-economic Data – Prioritising Collection to Support Australian Government Natural Resources Management Programs: Principles and Priorities, ABARE-BRS report for NLWRA.
NHMRC. 1990. Australian Drinking Water Guidelines. National Health and Medical Research Council, Canberra.
NHRMC and ARMCANZ. 1996. Australian Guidelines for Recreational Use of Water. National Health & Medical Research Council, and Agriculture & Resource Management Council of Australian & New Zealand.
Nilsen, T. 2006. Technical background to water management planning on Kangaroo Island, South Australia. Draft report for the Kangaroo Island Natural Resources Management Board, Kingscote SA.

KI Natural Resources Management State of the Region 2009 93
PPK. 2001. Natural Resources Management Strategy Final Report. Report for Kangaroo Island Natural Resources Board, Kingscote SA.
Rahmstorf, S, Cazenave, A, Church, JA, Hansen, JE, Keelin, RF, Parker, DE and Somerville, RCJ. 2007. Recent climate observations compared to projections. Science 316: 709. [DOI: 10.1126/science.1136843].
Robinson, AC and Armstrong, DM. 1999. Biological survey of Kangaroo Island. Department of Environment, Heritage and Aboriginal Affairs, South Australia.
SATC. 2008. Regional Profile – Kangaroo Island 2007. South Australian Tourism Commission, Adelaide
Seaman, RL. 2002. Wetland inventory of Kangaroo Island, South Australia. Department for Environment and Heritage, Adelaide.
Shand, P, James-Smith, J, Love, AJ, Nilson, T and Thomas, D. 2007. Hydrogeochemistry of surface waters and groundwaters, Kangaroo Island. DWLBC Technical Report 2007/18. Department of Water, Land and Biodiversity Conservation, Adelaide.
Southgate R. 2005. On-ground work priorities: the relationship between stream order, land use and water quality in the Cygnet River catchment. Save our Seagrass Program. Report for the KI Natural Resources Management Board, Kingscote SA.
SRES. 2000. Special Report on Emission Scenarios: Summary for Policymakers. A Special Report of Working Group III of the Intergovernmental Panel on Climate Change. Cambridge University Press, Cambridge, UK.
Suppiah, R, Preston, B, Whetton, PH, McInnes, KL, Jones, RN, Macadam, I, Bathols, J and Kirono, D. 2006. Climate change under enhanced greenhouse conditions in South Australia. An updated report on: Assessment of climate change, impacts and risk management strategies relevant to South Australia. Report for the South Australian Government by the Climate Impacts and Risk Group, CSIRO Marine and Atmospheric Research
The Allen Consulting Group. 2005. Climate Change Risk and Vulnerability Promoting an efficient adaptation response in Australia. Report to the Australian Greenhouse Office, Department of the Environment and Heritage, Canberra.
URPS. 2006. Kangaroo Island Strategic Tourism Plan.
Virtue, JG, Cunningham, DC, Hanson, CST, Hosking, JR, Miller, IL, Panetta, FD, Pheloung, PC, Randall, RP, Timmins, SM, Walton, CS, Weiss, JER and Williams, PA. 2004. A Draft National Protocol for Post-Border Weed Risk Management. CRC for Weed Management, Adelaide.
Willoughby, N, Oppermann, A and Inns, RW. 2001. Biodiversity Plan for Kangaroo Island. Department for Environment and Heritage, Adelaide.