Embed Size (px)
Citation preview
* 7 :
. -. KAF'L-P-0000 17 (K95156)
* 7 :
. -.
KAPL ATOMIC POWER LABORATORY SCIBNECTADY,
Operated for the U. S. Department of Energy by KAPL, Inc. a Lockheed Martin company
J. Ashcroft, D. A. Kaminski
June 1996
\
NOTICE
This report was prepared as an account of work sponsored by the United States Government. Neither the United States, nor the United States Department of Energy, nor any of their employees, nor any of their contractors, subcontractors, or their employees, makes any warranty, express or implied, or assumes any legal liability or responsibility for the accuracy, completeness or usefulness of any information, apparatus, product or process disclosed, or represents that its use would not infringe privateJy owned rights.
KAPL ATOMIC POWER LABORATORY SCIBNECTADY,
Operated for the U. S. Department by KAPL, Inc. a Lockheed Martin
of Energy company
NEW YORK 12301

DISCLAIMER
This report was prepared as an account of work sponsored by an agency of the United States Government. Neither the United States Government nor any agency thereof, nor any of their employees, make any warranty, express or implied, or assumes any legal liability or responsibility for the accuracy, completeness, or usefulness of any information, apparatus, product, or process disclosed, or represents that its use would not infringe privately owned rights. Reference herein to any specific commercial product, process, or service by trade name, trademark, manufacturer, or otherwise does not necessarily constitute or imply its endorsement, recommendation, or favoring by the United States Government or any agency thereof. The views and opinions of authors expressed herein do not necessarily state or reflect those of the United States Government or any agency thereof.
DISCLAIMER
Portions of this document may be illegible in electronic image products. Images are produced from the best available original document.

A Thermal Mixing Model of Crossflow in Tube Bundles For Use With the Porous Body Approximation
John Ashcroft Lockheed Martin Corporation
Box 1072, Schenectady NY 12301
Deborah A. Kaminski Department of Mechanical Engineering, Aeronautical Engineering and Mechanics
RPI Troy, NY 12180-3590
Abstract
D f i s i v e thermal mixing in a heated tube bundle with a cooling fluid in crossflow was analyzed numerically. From the results of detailed two-dimensional models, which calculated the diffusion of heat downstream of one heated tube in an otherwise adiabatic flow field, a diffusion model appropriate for use with the porous body method was developed. The model accounts for both molecular and turbulent diffusion of heat by determining the effective thermal conductivity in the porous region. The model was developed for triangular shaped staggered tube bundles with pitch to diameter ratios between 1.10 and 2.00 and for Reynolds numbers between 1,000 and 20,000. The tubes are treated as nonconducting. Air and water were considered as working fluids. The effective thermal conductivity was found to be linearly dependent on the tube Reynolds number and fluid Prandtl number, and dependent on the bundle geometry. The porous body thermal mix- ing model was then compared against numerical models for flows with multiple heated tubes with very good agreement.
Introduction
Cross flo6 over rows of staggered tubes or rods is a geometry common to many types of heat transfer devices. The staggered tube bundle arrangement is compact, provides good heat transfer, and is easily manufactured.
Analysis of large tube bundles is usually performed by invoking the porous body assump- tion [ 13. The porosity of the tube bundle can be determined geometrically. The hydraulic resis- tance can be determined from the numerous pressure drop correlations available in the open literature [2-51. Similarly, the heat transfer coefficient and the comsponding tube surface temper- ature can be determined, once the fluid temperature field is known, from correlations [2 and 61.
Turbulent diffusion of heat in a tube bundle in the cross-stream direction cannot ade- quately be modeled using the porous body approximation without knowing the effective thermal conductivity of the tube bundle. Adnani, et al[7] discuss the effective thermal conductivity in a packed bed. Their model accounts for the conduction through the solids in the porous body as well as the molecular conductivity of the fluid. This is inadequate for high speed turbulent flows
because the rate of turbulent diffusion can be orders of magnitude greater than molecular diffu- sion. The inadequacy in only considering the stagnant conductivity becomes more noticeable for tube bundles with nonuniform heat addition, since flow rates in a tube bundle are often consider- ably Ggher than those in a packed bed. Yagi and W h o [SI considered the effect of higher speed flow in packed beds, developing a model which adds the contribution of stagnant conductivity and the diffusive effects of turbulent flow. This work was extended by Cheng and Vortmeyer [SI and Adnani, et al [lo]. Cheng and Vortmeyer considered the effects of wall channeling on the radial thermal conductivity, and Adnani, et al, modeled the axial and radial components of con- ductivity with inertial effects included. All the models developed show the flow dependent term to be linearly proportional to the particle based Reynolds number and to the Prandtl number.
While little research has been devoted to the study of thermal mixing in a tube bundle with cross flow, some information is available on thermal mixing in tube (or rod) bundles with flow parallel to the tubes. Skinner, et al [ 11 J and Rogers and Rosehart [ 121 first investigated thermal d w i o n in tube bundles with parallel flow. The researchers determined that the rate of thermal mixing was greater than could be explained by diffusive energy transfer alone. They determined that turbulent secondary velocities between tubes was supplementing the transfer of heat. Models were developed for effective conductivities and effective mixing lengths.
Governine Eauations
The flow geometry under investigation, two-dimensional flow in a tube bundle, is shown in Figure 1. The governing equations for steady, incompressible, non-buoyant, fluid flow with constant properties were used in the numerical model:
Continuity: V.0 = 0
Momentum: V . P ( ~ @ O = -VP+V. (pefl(VO+VOT))
Energy:
The effective Viscosity is calculated using the standard k-e turbulence model. In the numerical model, the inlet turbulence intensity is assumed to be 3%. The effective thermal conductivity in the numerical model is calculated using the turbulent Prandtl number:
The turbulent Prandtl number was assumed to be a constant value of 0.9.
The governing equations were discretized using higher order upwind differencing of the momentum equations and standard upwind differencing of the scalar equations.
Porous Bodv Model Governing Euuatiom -
In order to model the tube bundle as a porous body, governing equations applicable for use with the porous model must also be developed. The porosity in a tube bank is related to the pitch

1
to diameter ratio in the tube bank. For an equilateral triangular arrangement, the porosity is:
y = V’/ V = 1 - zd2/[4p2sin(6O)] (5)
For the geometry under consideration, in which the porous body flow field is one-dimensional, the momentum equation does not need to be solved. The velocity magnitude is dictated by the cotinu- ity equation. The velocity in the porous region is the free stream velocity divided by the bundle porosity:
upor = UfJY (6)
Note that the porous body velocity differs from the velocity used in calculating the Reynold’s number. The velocity used in the Reynold’s number is the velocity between two adjacent tubes:
U = Uf, (p/d)l(p/d- 1) (7)
The energy equation, away from the heated tube surface, reduces to:
PCpV.(uT) - vckp,, VT) = 0 (8) I
The first teim represents the convection of heat and the second represents the diffusion of heat, The cross-stream thermal conductivity and the streamwise thermal conductivity are assumed to be the same.
Numerical Model of the Tube Bundle
In order to determine the rate of thermal diffusion in a tube bundle with cross flow, a set of detailed two-dimensional models of tube bundle sections were made. The seven tube bundle mod- els all had an equilateral triangular configuration, as shown in Figure 1, and a tube OD of 9.5 mm (0.375”).The pitch to diameter ratios considered were 1.10,1.20,1.25,1.33,1.50,1.75, and 2.00. A total of 11,760 nodes were used in each of the models. In each case, the flow of air or water (see Table 1 for air and water properties used) in the t u b bundle is left to right and a single heated tube, positioned near the inlet, is used to add heat to the flow. Heat from this tube diffuses through the flow as the flow moves downstream. The temperature distribution at the exit is a measure of the thermal mixing in the tube bundle. The flow rate was varied from case to case in order to pro- vide Reynolds numbers between 1,OOO and 20,000.
In the numerical models, the heat addition rate is kept proportional to the fluid’s heat capacity in order to directly compare the temperature distributions at the exit between cases. The fluid inlet temperature in each case is 300 K and the heat addition rate is sufficient to create a 1.9 K average temperature rise.
The models created were run using the FLOW3D-CFDS program on a CRAY-BO com- puter. Models with 20,30, and 60 nodes between adjacent tubes were run. The case with 30 nodes between tubes provided temperature profiles within 0.02 K of that of the 60 nodes case and was therefore determined to be sufficiently well discretized. The pressure drop and heat transfer coef-

I .
Property
Density (kg/m3)
ficients calculated by the model were compared against correlations, as shown in Figures 2 and 3. The flow distribution was compared against cross flow calculations made by Diaper and Haseler [13]. The calculated wake location and size were consistent with this previous analysis.
Air Water
1.16 997
Table 1:
I Viscosity (Ns/m2) I 1.85E-5 I 8.55E-4 I I SpecificHeat(J/kgK) I 1007 I 4179 I I .026 I I Thermal Conductivity
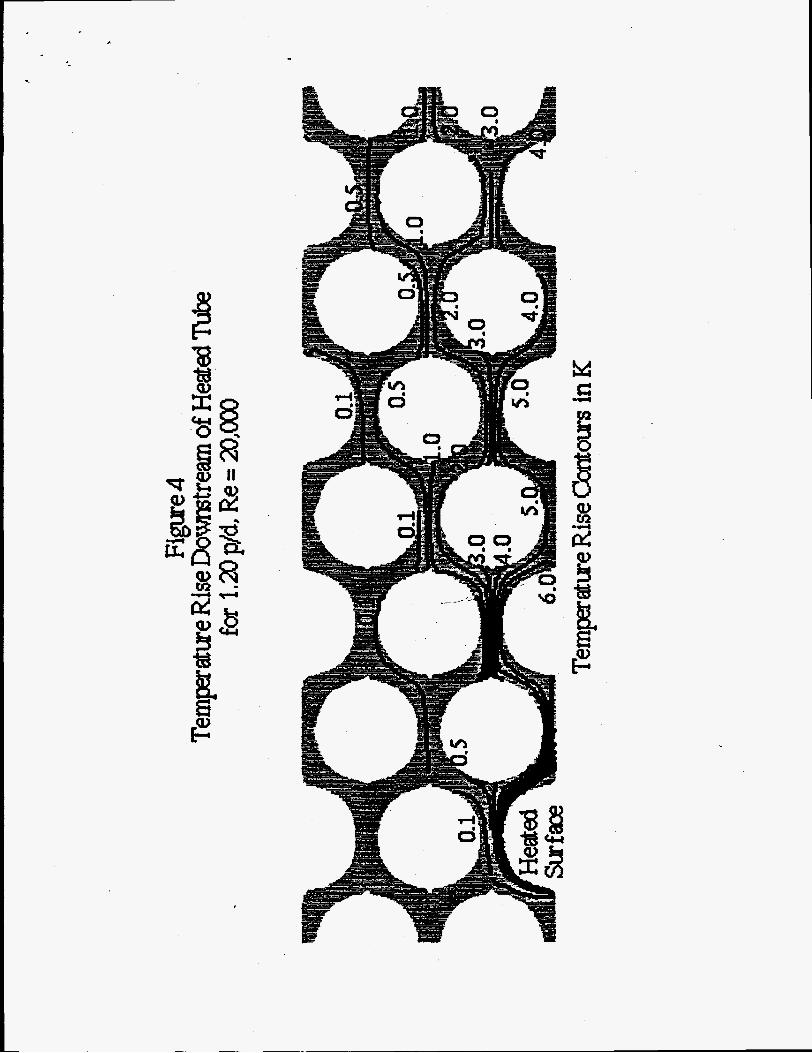
Numerical Model Results
The numerical model results show that the thermal mixing rate is strongly dependent on the pitch to diameter ratio in the tube bundle. The temperature distribution downstream of the heated tube in the numerical model for the 1.20 pitch to diameter ratio case with air at a Re = 20,000 is shown in Figure 4. The results show that for this small pitch to diameter ratio, the mix- ing rate is good. The relatively uniform tempera- distribution at the exit of the model shows significant energy transfer to the second, third, and fourth flow paths. For larger pitch to diameter ratios, the mixing rate is reduced and the transfer of energy to the second, third, and fourth flow paths is greatly reduced. As shown in Figure 5, the 1-75 P/D case, again run with air at Re = 2O,OO0, has an outlet temperature distribution that is far less uniform.
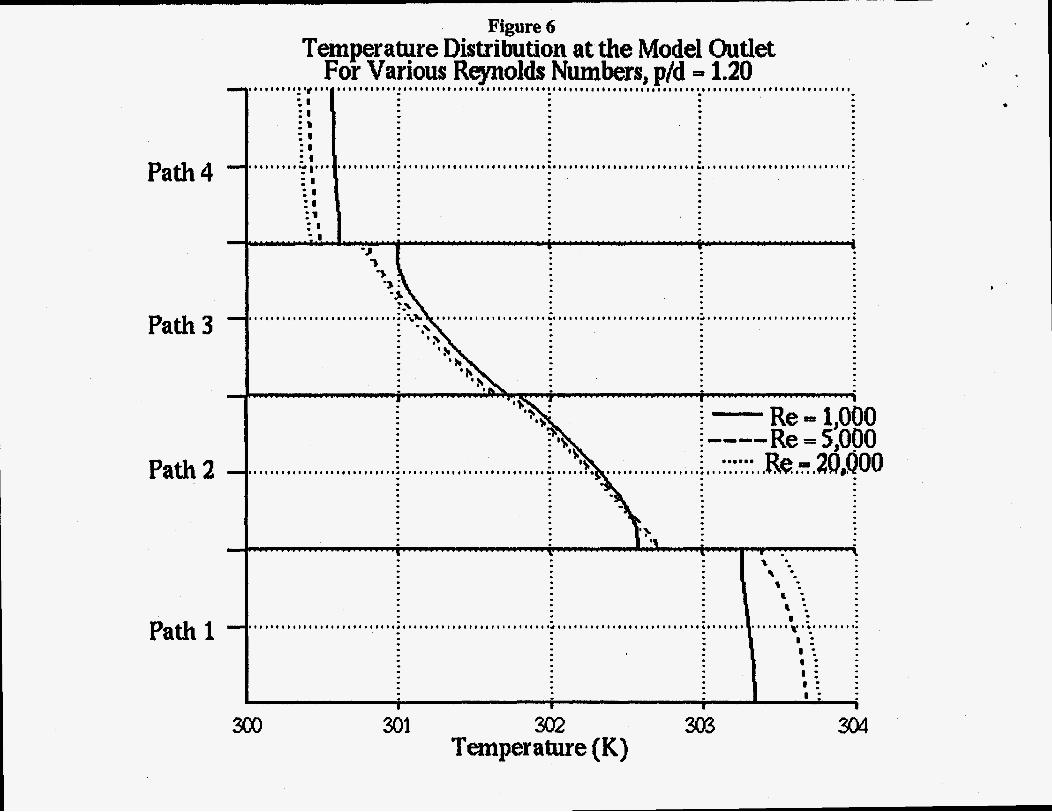
The Reynolds number dependence of the mixing rate is linear at high Reynolds numbers, where the effects of molecular diffusion can be ignored. Figure 6 shows the outlet temperature profile for each of the four separate flow paths through the bundle for various Reynolds numbers for air with a P/D of 1.20. In each case, the heating rate was kept proportional to the flow rate. All cases with Re > 5000 show nearly identical profiles. Lower Reynolds number cases show a slight increase in thermal mixing (a more uniform profile) due to the influence of molecular diffusion, which is not Reynolds number dependent, at lower flow rates. Similarly, the Prandtl number dependence can be demonstrated to be linear, at least in the range of 0.7 < Pr < 7, by comparing the mixing rate in air to that in water. Downstream of the heated tube, the temperature distribu- tions for the air case and water case are virtually identical.
The Po rous Bodv Thermal Mixing Mode 1
The thermal mixing in the actual tube bundle is approximated in the porous body case by determining an effective thermal conductivity. The effective thermal conductivity for the porous
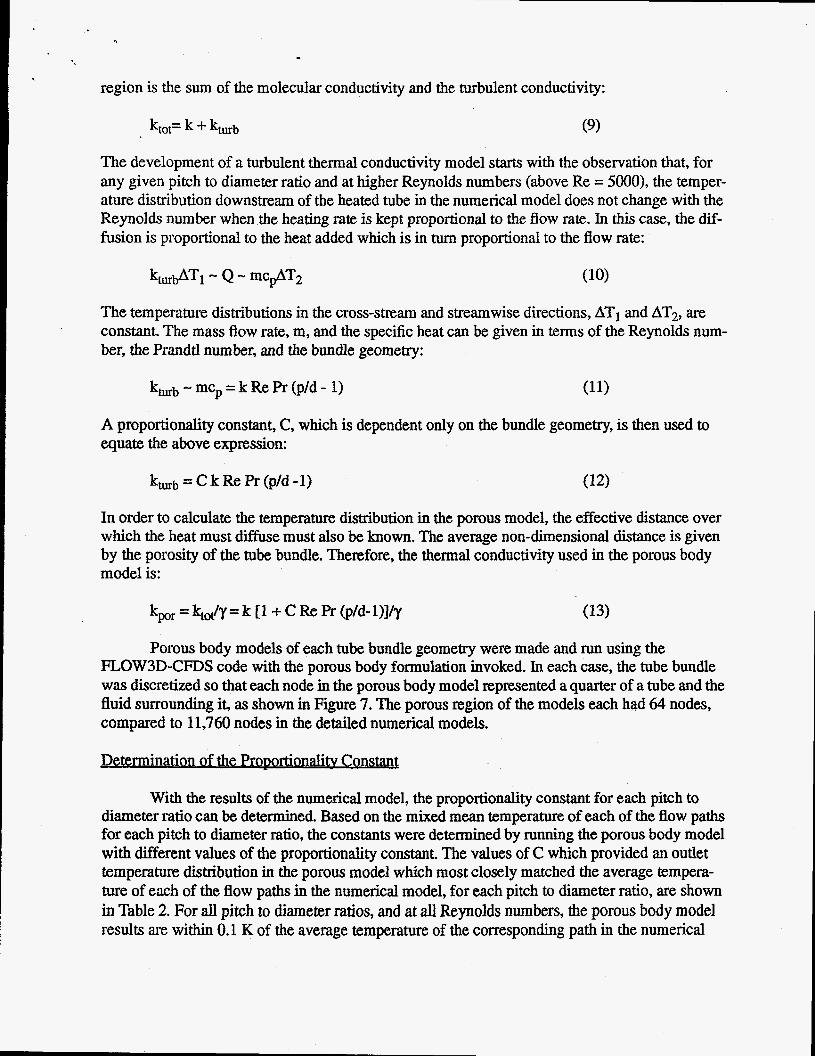
region is the sum of the molecular conductivity and the turbulent conductivity:
. ktot= 4- kturb (9)
The development of a turbulent thermal conductivity model starts with the observation that, for any given pitch to diameter ratio and at higher Reynolds numbers (above Re = 5000), the temper- ature distribution downstream of the heated tube in the numerical model does not change with the Reynolds number when the heating rate is kept proportional to the flow rate. In this case, the dif- fusion is proportional to the heat added which is in turn proportional to the flow rate:
The temperature distributions in the cross-stream and streamwise directions, AT1 and AT2, are constant. The mass flow rate, m, and the specific heat can be given in terms of the Reynolds num- ber, the Prandtl number, and the bundle geometry:
k,, - mcp = k Re Pr (p/d - 1) (11)
A proportionality constant, C, which is dependent only on the bundle geometry, is then used to equate the above expression:
In order to calculate the temperature distribution in the porous model, the effective distance over which the heat must diffuse must also be known. The average non-dimensional distance is given by the porosity of the tube bundle. Therefore, the thermal conductivity used in the porous body model is:
kPr = b/y= k [I + C Re Pr (p/d-l)]ly (13)
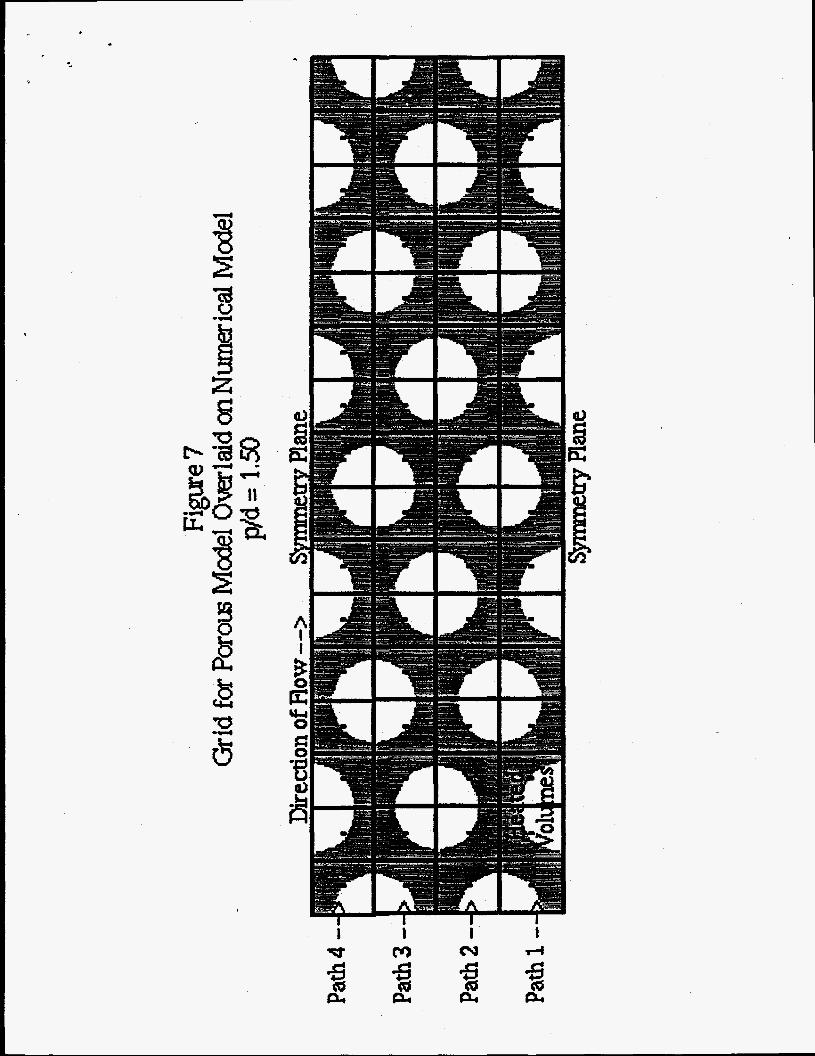
Porous body models of each tube bundle geometry were made and run using the FLOW3D-CFDS code with the porous body formulation invoked. In each case, the tube bundle was discretized so that each node in the porous body model represented a quarter of a tube and the fluid surrounding it, as shown in Figure 7. The porous region of the models each had 64 nodes, compared to 11,760 nodes in the detailed numerical models.
Determ ination of the ProDortional ity Constant
With the results of the numerical model, the proportionality constant for each pitch to diameter ratio can be determined. Based on the mixed mean temperature of each of the flow paths for each pitch to diameter ratio, the constants were determined by running the porous body model with different values of the proportionality constant. The values of C which provided an outlet temperature distribution in the porous model which most closely matched the average ternpera- ture of each of the flow paths in the numerical model, for each pitch to diameter ratio, are shown in Table 2. For all pitch to diameter ratios, and at all Reynolds numbers, the porous body model results are within 0.1 K of the average temperature of the corresponding path in the numerical
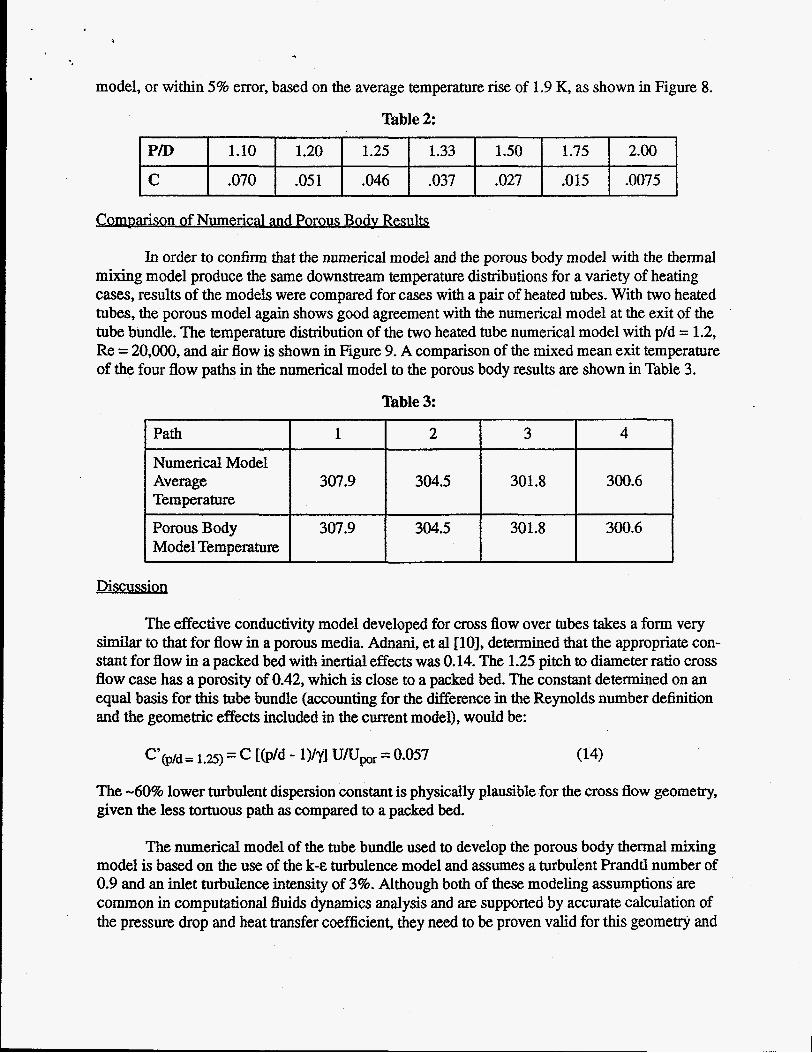
model, or within 5% error, based on the average temperature rise of 1.9 K, as shown in Figure 8.
P/D 1.10 1.20 1.25 1.33
c .070 .05 1 .046 .037
1 S O 1.75 2.00
.027 .015 .0075
Como - arison of Numerical and Po rous Bodv Results
Numerical Model Average 307.9 304.5 Temperature
Porous Body 307.9 304.5 Model Temperature
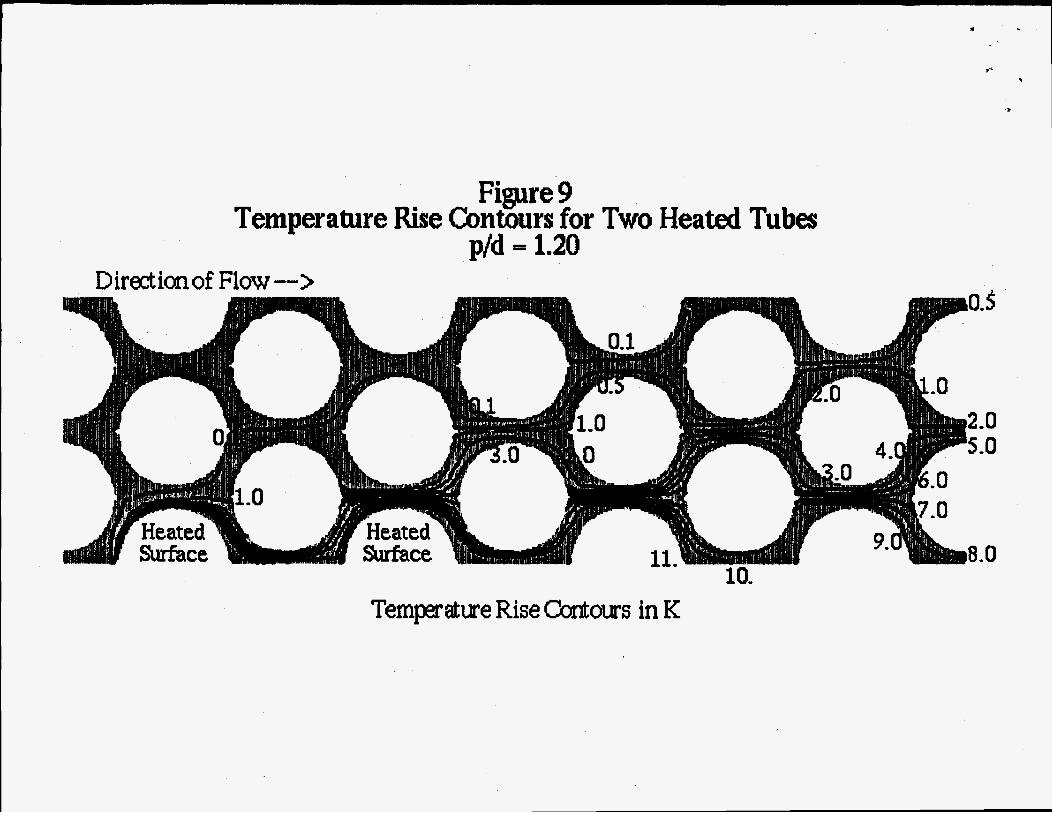
In order to confirm that the numerical model and the porous body model with the thermal mixing model produce the same downstream temperature distributions for a variety of heating cases, results of the models were compared for cases with a pair of heated tubes. With two heated tubes, the porous model again shows good agreement with the numerical model at the exit of the tube bundle. The temperature distribution of the two heated tube numerical model with p/d = 1.2, Re = 20,000, and air flow is shown in Figure 9. A comparison of the mixed mean exit temperature of the four flow paths in the numerical model to the porous body results are shown in Table 3.
301.8 300.6
30 1.8 300.6
Table 3:
Path I 1 I 2 I 3 I 4 I
Discussioq
The effective conductivity model developed for cross flow over tubes takes a form very similar to that for flow in a porous media. Adnani, et al [lo], determined that the appropriate con- stant for flow in a packed bed with inertial effects was 0.14. The 1.25 pitch to diameter ratio cross flow case has a porosity of 0.42, which is close to a packed bed. The constant determined on an equal basis for this tube bundle (accounting for the difference in the Reynolds number definition and the geometric effects included in the current model), would be:
The -60% lower turbulent dispersion constant is physically plausible for the cross flow geometry, given the less tortuous path as compared to a packed bed.
The numerical model of the tube bundle used to develop the porous body thermal mixing model is based on the use of the k-E turbulence model and assumes a turbulent Prandtl number of 0.9 and an inlet turbulence intensity of 3%. Although both of these modeling assumptions are common in computational fluids dynamics analysis and are supported by accurate calculation of the pressure drop and heat transfer coefficient, they need to be proven valid for this geometry and

calculated rate of mixin heating condition. Higher rates of inlet turbulence $dl increase th as will lower values of the turbulent Prandtl number. Therefore, experimental verification of the rate of theimal mixing in a tube bundle is desirable.
Conclusions
A thermal mixing model applicable for use with the porous body formulation has been developed in order to estimate more accurately the temperature distribution in a staggered tube bundle with cross flow. The model uses an effective thermal conductivity to account for the molecular and turbulent diffusion of heat in the cross stream direction. The turbulent thermal con- ductivity was found to be linearly dependent on the Reynolds number and the Prandtl number. The sensitivity to the tube bundle pitch to diameter ratio was also determined. Although the cur- rent model was developed for two-dimensional flow, it is applicable in calculating the rate of ther- mal mixing in the cross-stream direction in a three-dimensional flow.
Nomenclatu re
C = Turbulent diffusion proportionality constant C’ = Turbulent diffusion constant comparable to that developed for packed beds cp = Huid specific heat at constant pressure d = Tube outside diameter k = Molecular thermal conductivity of the fluid k-por = Effective thermal conductivity used in the porous flow formulation bot = Sum of the molecular and turbulent thermal conductivities b b = Turbulent thermal conductivity of the flow m = Mass flow rate of the fluid p = Tube centerhe to centerline pitch Pr = Fluid Prandtl number = cy.& Pr, = Turbulent Prandtl number AP = Pressure gradient in the porous region R = Porous body resistance tensor Re = Tube based Reynolds number = pUd/p Q = Heat transfer rate from the heated tube AT = Temperature change in the flow field AT- = Mixed mean temperature rise in the flow = 1.9 K U = Average flow velocity at the minimum flow ’area in the bundle Upor = How velocity calculated by the porous body model U, = Free stream velocity of the flow V = Total cell volume V’ = Fluid volume in a cell
y = Tube bundle porosity p = Fluid molecular viscosity peff = Effective viscosity in the fluid = p + p, = Turbulent viscosity p = Fluid density
References
1) Sha, W.T. “An Overview on Rod-Bundle Thermal-Hydraulic Analysis”, Nuclear Engineering and Design, 1980,62, 1-24.
2) Zukauskas, A.A. High Pe~ormance Single Phase Heat Exchangers, 1989, Hemisphere Pub- lishing Co.
3) Gunter, A.Y. and Shaw, W.A. “A General Correlation of Friction Factors of Various Types on Surfaces in Crossflow” ASME Transactions, 1945,67,643-660.
4) Chilton, T.H. and Genereaux R.l? “Pressure Drop Across Tube Banks” AIChE Transactions, 1933,29, 161-172.
5) Idel’chik, LE. Handbook of Hydraulic Resistance, 2nd Edition, 1986, Hemisphere Publishing Company
6) Grimison, E.D. “Correlation and Utilization of New Data on Flow Resistance and Heat Trans- fer for Crossflow of Gases Over Tube Banks’,, ASME Transactions, 1937,59,583-594.
7) Adnani, P., Raffray, A.R., Abdou, M A , and Catton, I., “Modeling of Effective Thermal Con- ductivity for a Packed Bed,” Report No. UCLA-FNT-29, University of California Los Angeles, 1989.
8) Yagi, S. and Wakao, N. “Heat and Mass Transfer from Wall to Fluid in Packed Beds”, AIChEi JOUITI~, 1959,79-85.
9) Cheng, P. and Vortmeyer, D. ‘Transverse Thermal Dispersion and Wall Channeling in a Packed Bed with Forced Convective Flow”, Chemical Engineering Science, 1988,43,2523-2532.
10) Adnani, P., Catton, I., and Abdou, M.A. “Non-Darcian Forced Convection in Porous Media with Anisotropic Dispersion”, ASME Journal of Heat Transfer, 1995,117,447-451.
11) Skinner, V.R., Freeman, A.R. and Lyall, H.G., “Gas Mixing in Rod Bundles”, Int. Journal of Heat and Mass Transfer, 1969,12,265-278.
12) Rogers, J.T. and Rosehart, R.G. ‘Turbulent Interchange Mixing in Fuel Bundles”, ASME Publication 72-HT-53,1969.
13) Diaper AD. and Haseler L. E. “Crossflow Pressure Drop and FLOW Distribution within a Tube Bundle Using Computational Fluid Dynamics”, Heat Transfer 1990: Proceedings of the Int. Heat Transfer Conferznce.


Figure 2 Comparison of Pressure Drop Results to Correlations
0.50 I I I I I I I I I I I I I I I I 1 I I
3
ti5
2
3 0.40 - - P Q
c3 - e . . . . * . . . . * . . . . . . .- \
\
0.30 - 4.
3 v)
I \ \
\ \
II -I - * - * - - - %
& 5 0.20 - -
E 5 0.10 - -
a
v) c .-
z -
I I I I I I I I 1 I I I 1.5000E4 I I I I 1 2.0000~4 I
0.00 5.0000E3 I .0000~4 0.0000EO Reynolds Number
Zukauskas Gunt-Shaw - - .
Idelchik- - - - - FLOW3D Results

0 0 v
0 a0
0 (D
0 d-
0 cu
0 w 0 0
08 0

m N
Path 4
Path 3
Path 2
Path 1
e o 0 0 0 .I I.
@ : 8 :
I I 1 1
301 302 Temperature (K)
303 304

a
a
A
a 0 A
I.
A A A
0 0
E A A
I RE = 1000 A RE = 2000
RE = 5000 0 RE =I 0000 ARE =ZOO00
Figure 8 Error Between Numerical Results and Porous Model
I I I I I I I 1 I I I I I I I I I I 1 I I I I
-
- -
-
-
- -
-
I I I I I I I I I I I I I I I I , I I I I I I I
1 .o 1.2 1.4 1.6 1.8 Pitch to Diameter Ratio
2.0
Fipre 9 Temperature Rise Contours for Two Heated Tubes:
p/d = 1.20 Directionof Flow -->
O S
2.0 5.0
8.0 I t l
Temperature Rise W o w s in K