Embed Size (px)
Citation preview
428
JKMU Journal of Kerman University of Medical Sciences, 2018; 25 (5): 428-440
The Effect of Different Solutions on Optical Behavior of Polished and Glazed
Zirconia-Reinforced Lithium Silicate Ceramics
Farnaz Firouz, M.Sc. 1, Alireza Izadi, M.Sc.
1, Farnoush Fotovat, M.Sc.
1, Somaye Ghorbani Gholiabad, Ph.D.
2,
Saeed Nikanjam, 3
1- Assistant professor, Department of Prosthodontics, Faculty of Dentistry, Hamadan University of Medical Sciences, Hamadan, Iran
2- PhD Candidate, Department of Biostatistics, Faculty of Health, Hamadan University of Medical Sciences, Hamadan, Iran
3- Resident of Prosthodontics, Department of Prosthodontics, Faculty of Dentistry, Hamadan University of Medical Sciences, Hamadan, Iran
(Corresponding author; E-mail: [email protected])
Received: 21 June, 2018 Accepted: 18 August, 2018
ARTICLE INFO
Original Article
Dental ceramics
Zirconia reinforced ceramics
CAD/CAM ceramic
Optical properties
Translucency
This study sought to assess the effect of glazing and polishing surface
treatments on the optical behavior of zirconia-reinforced lithium silicate ceramics
thermocycled in different solutions.
Computer-aided design/computer-aided manufacturing ceramics (VITA
Suprinity) were cut into samples (n=104) measuring 1.5x14x10 mm according to the
manufacturer’s instructions. Also, the samples were then randomly divided into four groups
for immersion in artificial saliva, tea, orange juice and cola. A spectrophotometer was used
to assess the color change and changes in L* coordinate against a white and a black
background. The translucency parameter and contrast ratio were also calculated. The ∆E
and L* values were analyzed using two-way ANOVA test. Student’s t-test was applied to
analyze TP and CR.
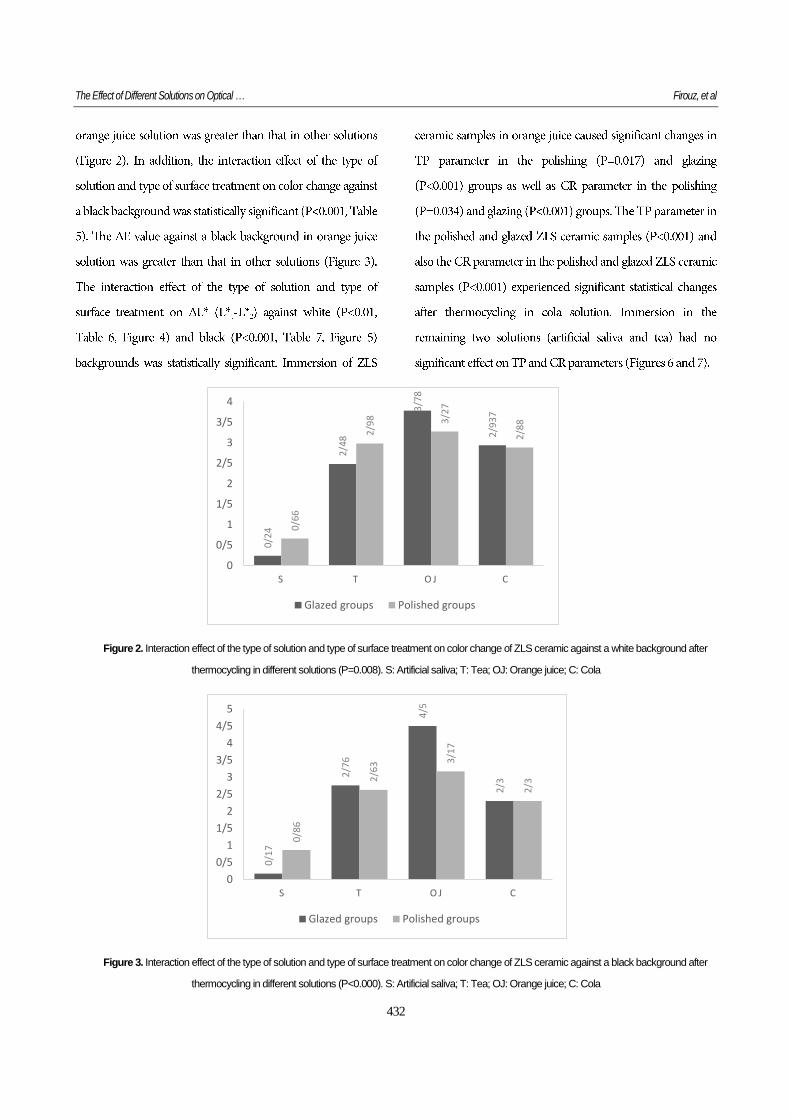
The interaction effect of the type of solution and type of surface treatment on color
change against a white (P=0.008) and black (P<0.001) background was statistically
significant. Immersion of ceramic samples in orange juice and cola caused significant
changes in TP and CR in the polishing and glazing groups (P < 0.05).
Immersion in orange juice causes clinically perceivable color change in glazed
ZLS ceramics. Immersion in cola decreases the translucency of both polished and glazed
ZLS ceramics.
Introduction
Journal of Kerman University of Medical Sciences 2018, Vol. 25, Issue 5
429
Materials and Methods
Table 1. shows the characteristics of the ceramic used in this study.
Material Composition Manufacturer Code Shade/Translucency
Vita Suprinity PC
Zirconia
reinforced Lithium silicate
glass-ceramic
(SiO2, Li2O, K2O, P2O5,
Al2O3, ZrO2,
CeO2, pigments)
Vita Zahnfabrik
Germany VS A2/HT
Preparation of samples
The Effect of Different Solutions on Optical … Firouz, et al
430
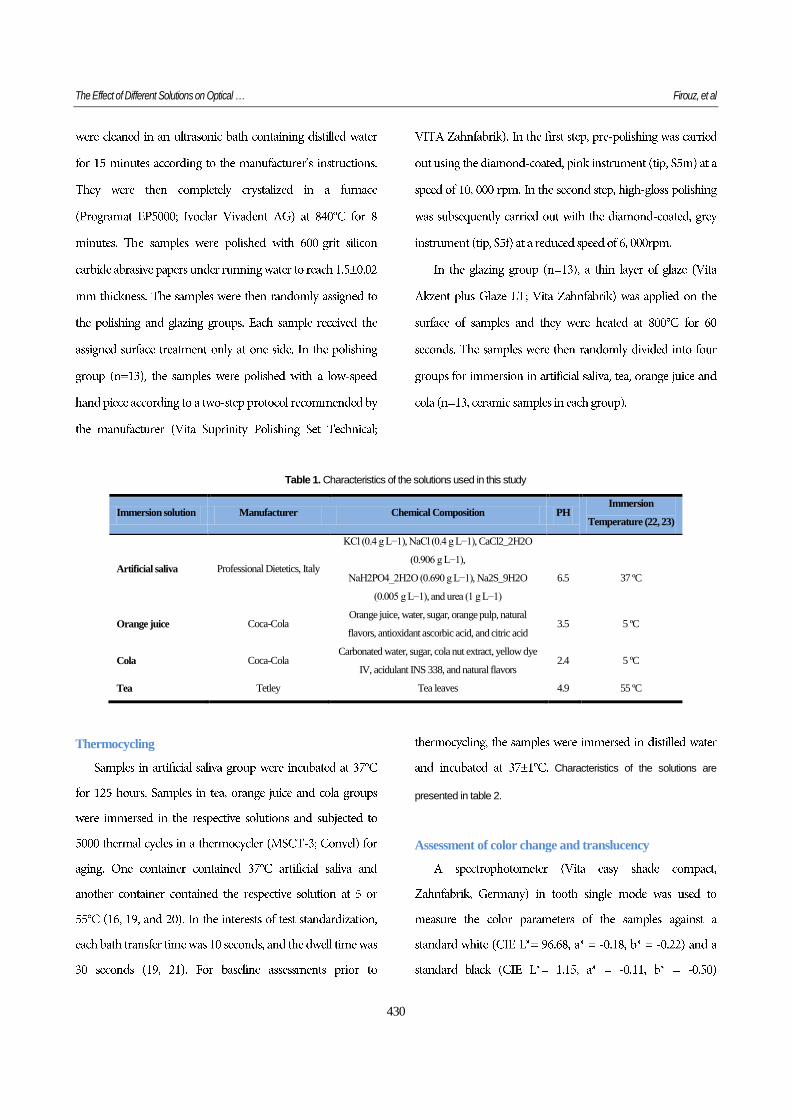
Table 1. Characteristics of the solutions used in this study
Immersion solution Manufacturer Chemical Composition PH Immersion
Temperature (22, 23)
Artificial saliva Professional Dietetics, Italy
KCl (0.4 g L−1), NaCl (0.4 g L−1), CaCl2_2H2O
(0.906 g L−1),
NaH2PO4_2H2O (0.690 g L−1), Na2S_9H2O
(0.005 g L−1), and urea (1 g L−1)
6.5
37 ºC
Orange juice Coca-Cola Orange juice, water, sugar, orange pulp, natural
flavors, antioxidant ascorbic acid, and citric acid 3.5 5 ºC
Cola Coca-Cola Carbonated water, sugar, cola nut extract, yellow dye
IV, acidulant INS 338, and natural flavors 2.4 5 ºC
Tea Tetley Tea leaves 4.9 55 ºC
Thermocycling
Characteristics of the solutions are
presented in table 2.
Assessment of color change and translucency
Journal of Kerman University of Medical Sciences 2018, Vol. 25, Issue 5
431
Table 2. Characteristics of the spectrophotometer used in this study
Operation mode Calibration Light source Measurement range (nm) Measurement region Spectral resolution (nm)
Spectrophotometer Ceramic standard LED 400–700 Spot measurement 25
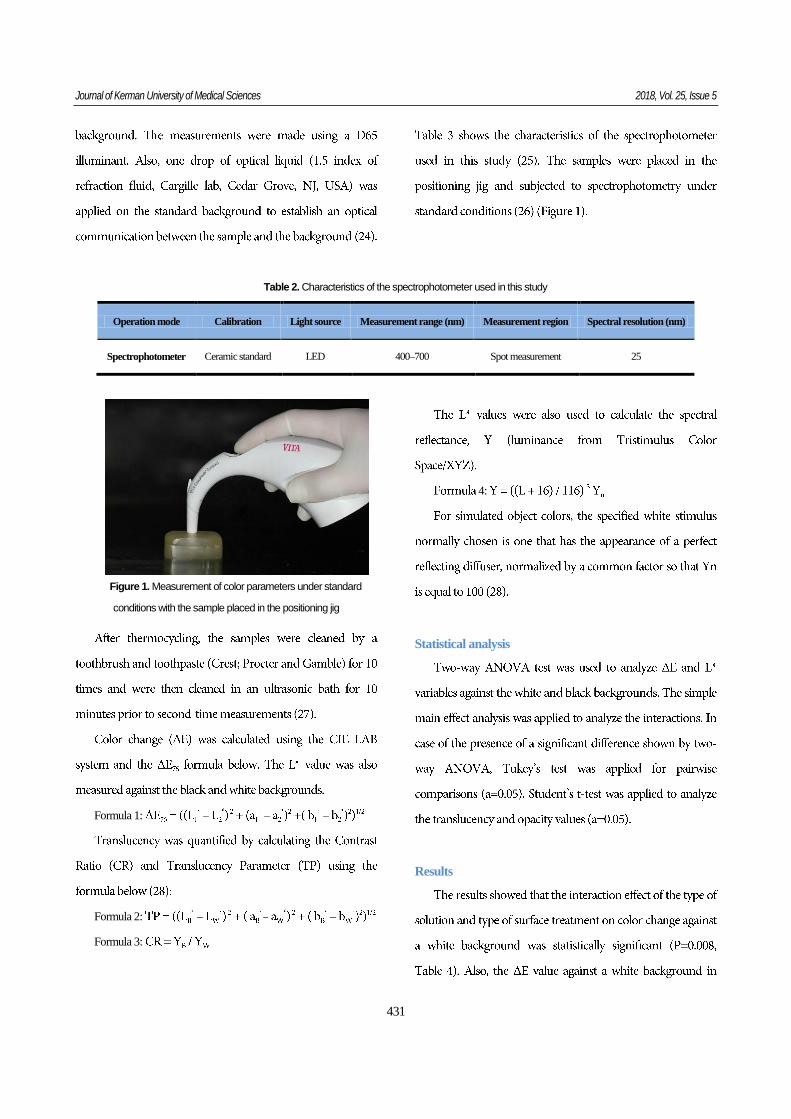
Figure 1. Measurement of color parameters under standard
conditions with the sample placed in the positioning jig
Formula 1:
Formula 2:
Formula 3:
4:
Statistical analysis
Results
The Effect of Different Solutions on Optical … Firouz, et al
432
0/2
4
2/4
8
3/7
8
2/9
37
0/6
6
2/9
8
3/2
7
2/8
8
0
0/5
1
1/5
2
2/5
3
3/5
4
S T O J C
Glazed groups Polished groups
0/1
7
2/7
6
4/5
2/3
0/8
6
2/6
3 3/1
7
2/3
0
0/5
1
1/5
2
2/5
3
3/5
4
4/5
5
S T O J C
Glazed groups Polished groups
Figure 2. Interaction effect of the type of solution and type of surface treatment on color change of ZLS ceramic against a white background after
thermocycling in different solutions (P=0.008). S: Artificial saliva; T: Tea; OJ: Orange juice; C: Cola
Figure 3. Interaction effect of the type of solution and type of surface treatment on color change of ZLS ceramic against a black background after
thermocycling in different solutions (P<0.000). S: Artificial saliva; T: Tea; OJ: Orange juice; C: Cola
Journal of Kerman University of Medical Sciences 2018, Vol. 25, Issue 5
433
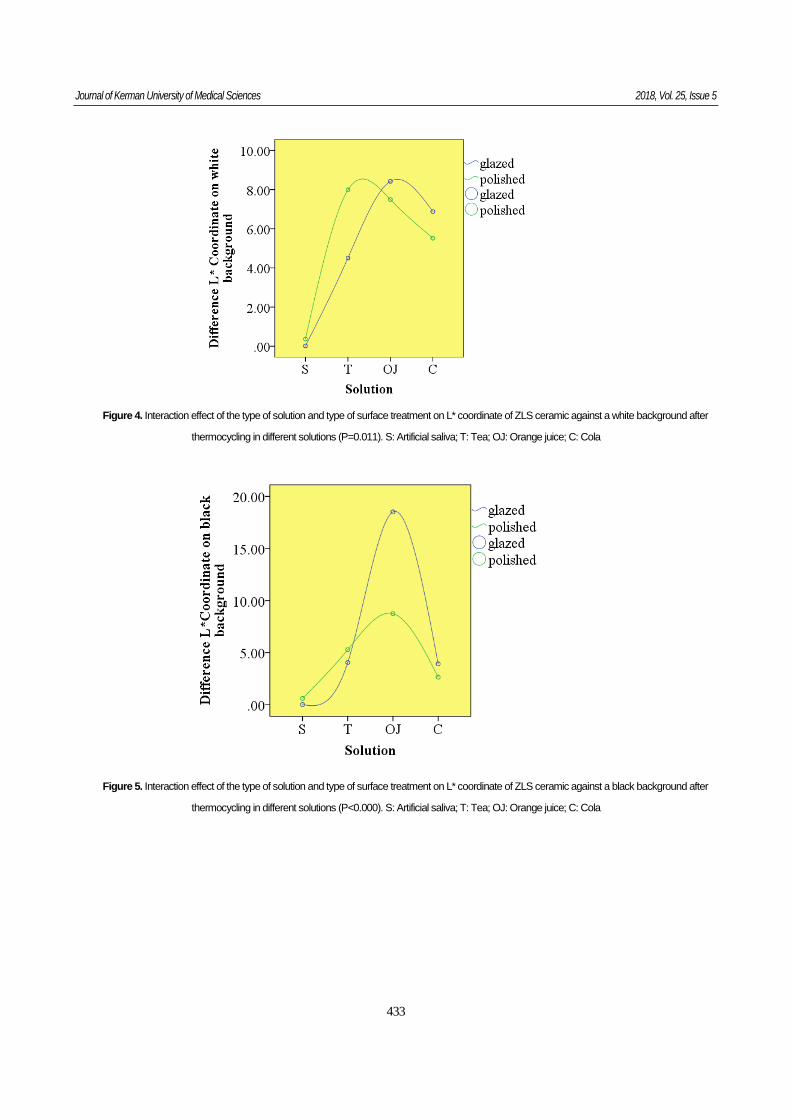
Figure 4. Interaction effect of the type of solution and type of surface treatment on L* coordinate of ZLS ceramic against a white background after
thermocycling in different solutions (P=0.011). S: Artificial saliva; T: Tea; OJ: Orange juice; C: Cola
Figure 5. Interaction effect of the type of solution and type of surface treatment on L* coordinate of ZLS ceramic against a black background after
thermocycling in different solutions (P<0.000). S: Artificial saliva; T: Tea; OJ: Orange juice; C: Cola
The Effect of Different Solutions on Optical … Firouz, et al
434
0
2
4
6
8
10
12
14
16
18
20T
ran
slu
cen
cy P
ara
met
er
S T OJ C
TP B Glazed
groups
TP A Glazed
groups
TP B polished
groups
TP A polished
groups
0
0/1
0/2
0/3
0/4
0/5
0/6
0/7
0/8
0/9
1
Co
ntr
ast
Ra
tio
S T OJ C
CR B Glazed
groups
CR A Glazed
groups
CR B Polished
groups
CR A Polished
groups
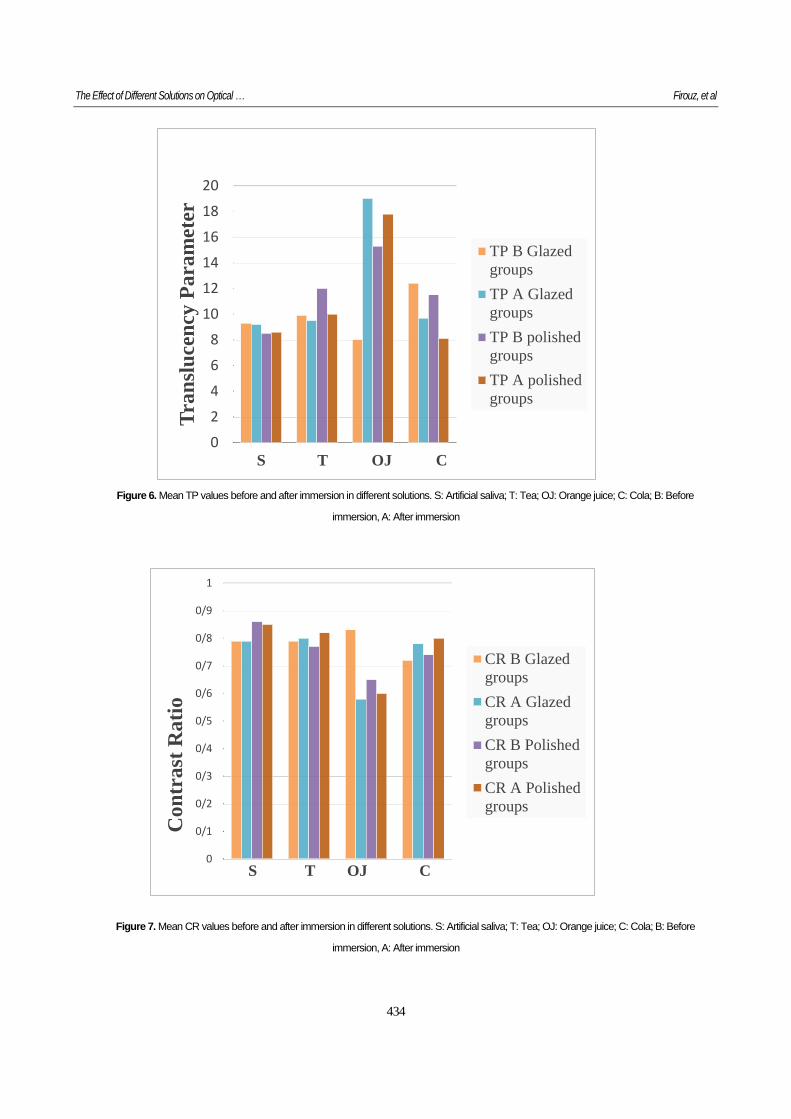
Figure 6. Mean TP values before and after immersion in different solutions. S: Artificial saliva; T: Tea; OJ: Orange juice; C: Cola; B: Before
immersion, A: After immersion
Figure 7. Mean CR values before and after immersion in different solutions. S: Artificial saliva; T: Tea; OJ: Orange juice; C: Cola; B: Before
immersion, A: After immersion
Journal of Kerman University of Medical Sciences 2018, Vol. 25, Issue 5
435
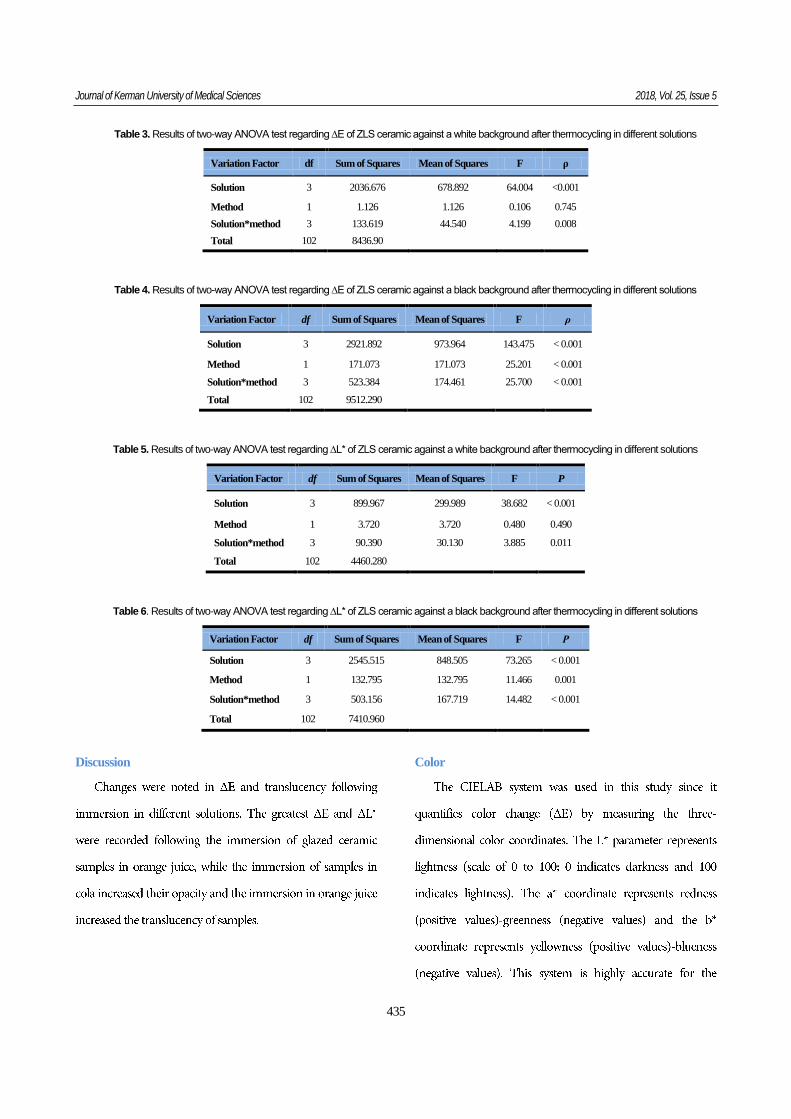
Table 3. Results of two-way ANOVA test regarding ∆E of ZLS ceramic against a white background after thermocycling in different solutions
Variation Factor df Sum of Squares Mean of Squares F ρ
Solution 3 2036.676 678.892 64.004 <0.001
Method 1 1.126 1.126 0.106 0.745
Solution*method 3 133.619 44.540 4.199 0.008
Total 102 8436.90
Table 4. Results of two-way ANOVA test regarding ∆E of ZLS ceramic against a black background after thermocycling in different solutions
Variation Factor df Sum of Squares Mean of Squares F ρ
Solution 3 2921.892 973.964 143.475 < 0.001
Method 1 171.073 171.073 25.201 < 0.001
Solution*method 3 523.384 174.461 25.700 < 0.001
Total 102 9512.290
Table 5. Results of two-way ANOVA test regarding ∆L* of ZLS ceramic against a white background after thermocycling in different solutions
Variation Factor df Sum of Squares Mean of Squares F P
Solution 3 899.967 299.989 38.682 < 0.001
Method 1 3.720 3.720 0.480 0.490
Solution*method 3 90.390 30.130 3.885 0.011
Total 102 4460.280
Table 6. Results of two-way ANOVA test regarding ∆L* of ZLS ceramic against a black background after thermocycling in different solutions
Variation Factor df Sum of Squares Mean of Squares F Ρ
Solution 3 2545.515 848.505 73.265 < 0.001
Method 1 132.795 132.795 11.466 0.001
Solution*method 3 503.156 167.719 14.482 < 0.001
Total 102 7410.960
Discussion
Color
The Effect of Different Solutions on Optical … Firouz, et al
436
Translucency
Journal of Kerman University of Medical Sciences 2018, Vol. 25, Issue 5
437
Conclusion
Acknowledgment
The Effect of Different Solutions on Optical … Firouz, et al
438
References
‐
Journal of Kerman University of Medical Sciences 2018, Vol. 25, Issue 5
439
‐
‐
The Effect of Different Solutions on Optical … Firouz, et al
440