Embed Size (px)
Citation preview
1
SEMI-ANNUAL REPORTFor the financial period ending 31 December 2012
Mendaki Global Fund
1
MANAGERSNikko Asset Management Asia Limited8 Cross Street PWC Building #08-01
Singapore 048424Company Registration No. 198202562H
DIRECTORSCharles John Sherard Beazley
Frederick ReidenbachBlair Chilton Pickerell
Lim Say BoonV Arivazhagan
Seet Oon Hui EleanorNg Soo Nam
TRUSTEE/REGISTRARHSBC Institutional Trust Services (Singapore) Limited
21 Collyer Quay, #10-02 HSBC BuildingSingapore 049320
AUDITORSPricewaterhouseCoopers LLP
8 Cross Street, #17-00 PWC BuildingSingapore 048424
REGISTRAR’S AGENTRBC Investor Services Trust Singapore Limited
20 Cecil Street, #28-01 Equity PlazaSingapore 049705
PROMOTERMendaki Holdings Pte Ltd
51 Kee Sun Avenue, Wisma MendakiSingapore 457056
SOLICITORS TO THE MANAGERS Allen & Gledhill LLP
One Marina Boulevard #28-00Singapore 018989
SOLICITORS TO THE PROMOTERRodyk & Davidson LLP
80 Raffl es Place, #33-00 UOB Plaza 1Singapore 048624
SOLICITORS TO THE TRUSTEEShook Lin & Bok LLP
1 Robinson Road, #18-00, AIA Tower,Singapore 048542
CUSTODIANThe Northern Trust Company Singapore Branch
One George Street, #12-06Singapore 049145
This report is also available on our website (www.nikkoam.com.sg)
2
PERFORMANCE SUMMARY
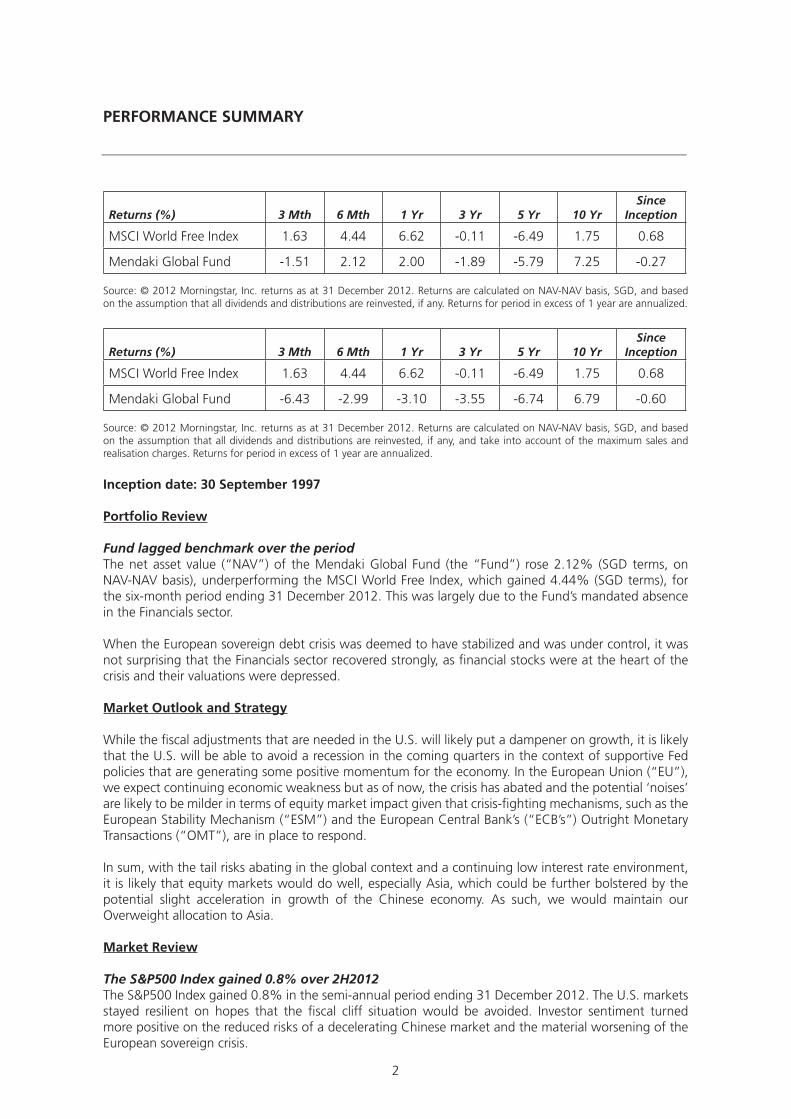
Returns (%) 3 Mth 6 Mth 1 Yr 3 Yr 5 Yr 10 YrSince
Inception
MSCI World Free Index 1.63 4.44 6.62 -0.11 -6.49 1.75 0.68
Mendaki Global Fund -1.51 2.12 2.00 -1.89 -5.79 7.25 -0.27
Source: © 2012 Morningstar, Inc. returns as at 31 December 2012. Returns are calculated on NAV-NAV basis, SGD, and based on the assumption that all dividends and distributions are reinvested, if any. Returns for period in excess of 1 year are annualized.
Returns (%) 3 Mth 6 Mth 1 Yr 3 Yr 5 Yr 10 YrSince
Inception
MSCI World Free Index 1.63 4.44 6.62 -0.11 -6.49 1.75 0.68
Mendaki Global Fund -6.43 -2.99 -3.10 -3.55 -6.74 6.79 -0.60
Source: © 2012 Morningstar, Inc. returns as at 31 December 2012. Returns are calculated on NAV-NAV basis, SGD, and based on the assumption that all dividends and distributions are reinvested, if any, and take into account of the maximum sales and realisation charges. Returns for period in excess of 1 year are annualized.
Inception date: 30 September 1997
Portfolio Review
Fund lagged benchmark over the periodThe net asset value (“NAV”) of the Mendaki Global Fund (the “Fund”) rose 2.12% (SGD terms, on NAV-NAV basis), underperforming the MSCI World Free Index, which gained 4.44% (SGD terms), for the six-month period ending 31 December 2012. This was largely due to the Fund’s mandated absence in the Financials sector.
When the European sovereign debt crisis was deemed to have stabilized and was under control, it was not surprising that the Financials sector recovered strongly, as fi nancial stocks were at the heart of the crisis and their valuations were depressed.
Market Outlook and Strategy
While the fi scal adjustments that are needed in the U.S. will likely put a dampener on growth, it is likely that the U.S. will be able to avoid a recession in the coming quarters in the context of supportive Fed policies that are generating some positive momentum for the economy. In the European Union (“EU”), we expect continuing economic weakness but as of now, the crisis has abated and the potential ‘noises’ are likely to be milder in terms of equity market impact given that crisis-fi ghting mechanisms, such as the European Stability Mechanism (“ESM”) and the European Central Bank’s (“ECB’s”) Outright Monetary Transactions (“OMT”), are in place to respond.
In sum, with the tail risks abating in the global context and a continuing low interest rate environment, it is likely that equity markets would do well, especially Asia, which could be further bolstered by the potential slight acceleration in growth of the Chinese economy. As such, we would maintain our Overweight allocation to Asia.
Market Review
The S&P500 Index gained 0.8% over 2H2012The S&P500 Index gained 0.8% in the semi-annual period ending 31 December 2012. The U.S. markets stayed resilient on hopes that the fi scal cliff situation would be avoided. Investor sentiment turned more positive on the reduced risks of a decelerating Chinese market and the material worsening of the European sovereign crisis.
3
The U.S. equity market was in positive territory over 3Q2012 despite some turbulence on Euro zone debt concerns and worries of a China slowdown. The U.S. looming fi scal cliff, high unemployment and weakening demand raised fears about U.S. economic growth. In a continued bid to bring down long-term interest rates, the Federal Open Market Committee agreed to extend ‘Operation Twist’. In 3Q2012, U.S. Purchasing Managers Index (“PMI”), housing and employment data painted a picture of subdued expansion. Having bottomed at 49.6 in August, U.S. PMI rebounded to 51.7 in October. Both retail sales and industrial production pointed to a modest improvement from their August lows. The commencement of open-ended quantitative easing by the U.S. Federal Reserve (“Fed”) towards the end of 3Q2012 kept growth going. This time the U.S. Fed announced that it will buy $40 billion of agency mortgage-backed securities per month and maintain its zero rate policy until mid-2015.
U.S. politics dominated fi nancial markets’ direction in 4Q2012. With President Obama sealing a second term in offi ce, and ensuring continuity of U.S. administration, investors swiftly turned their attention to a possible deadlock on the upcoming budget talks. As the year-end deadline drew near, an iteration of proposal and counterproposal between the House Speaker and the President towards coming up with a deal to avert a fall off the ‘fi scal cliff’ led to volatility in the U.S. equity market. The severe damage in New York caused by U.S. ‘super storm’ Sandy also weighed on U.S. equities.
European leaders were determined to defend the Euro In 3Q2012, ECB president Mario Draghi’s pledge to do ‘whatever it takes’ to tackle the debt crisis prompted a rally as the quarter started. Bouts of optimism followed which arose from central bank pledges in the U.S. and Europe to support economic growth – easing fears of a Euro zone meltdown and a faltering global economy. The main prop for investor confi dence in Europe was the ECB’s announced bond buying programme aimed at bringing down borrowing costs for struggling nations and lowering peripheral sovereign bond yields. In order to benefi t from the new OMT programme, countries have to agree on tough conditions, implement economic reforms to tackle debt and enhance their competitiveness. This helped European stockmarkets as investors were soothed by the measures taken by central banks and Euro zone leaders to tackle the debt crisis.
Despite the optimism in European markets, economic data continued to disappoint as demand weakened both within the region and globally. In the face of tough austerity measures, the Euro-zone population voiced their objections via protests across Spain, Portugal, France and Greece. In the last quarter of 2012, European equities performed strongly on the array of monetary and political measures taken to stabilise the Euro zone and the Euro currency. In November, authorities agreed on a debt restructuring for Greece. In the last days of the year, European ministers agreed on a common banking supervisor and established terms for the ECB to directly supervise up to 200 banks in the Euro zone.
Quantitative easing/bond-buying measures saw infl ows back into Asian markets in 2H2012Asian equity markets advanced despite continuing Euro zone worries and a slowing Chinese economy. While Asian Gross Domestic Product (“GDP”) growth fi gures were within expectations for a slowdown, investor sentiment was bolstered by the U.S. Fed, the ECB and the Bank of Japan (“BoJ”) all announcing further easing measures. The benign infl ation outlook across Asia facilitated benchmark interest rate cuts in China, Korea and the Philippines. China’s fundamentals, though, proved to be weak with GDP growth for the second quarter at 7.6%, its lowest rate in over three years. In September, Asian equities added to gains after the ECB’s announcement on unlimited buying for sovereign bonds of troubled members, effectively acting as a backstop to avoid destructive scenarios in the Euro area. The U.S. Fed’s decision for further quantitative easing via an open-ended, bond purchasing program of agency mortgage-backed securities was another positive booster for equity performance.
China’s improved outlook was a boost for Asian markets in 4Q2012In 4Q2012, Asian markets continued to climb as economic news fl ow improved in China and leading indicators pointed towards some pickup in growth momentum. There were some profi t-taking in markets that had done well, such as in Singapore and India, although the liquidity infl ows lifted all markets in the region. The last quarter in 2012 was also politically signifi cant, with Barrack Obama re-elected as
4
the U.S. President and a new leadership team elected in China. The political continuity was signifi cant as it bode well for sustaining economic recovery. In the South Korean Presidential Election, the victory of Park Geun-Hye from the ruling Saenuri (New Frontier) Party helped boost market sentiment particularly for the conglomerate sector, given that her opponent Moon Jae-In was viewed as less friendly to big-business.
The housing market in China continued to stage gradual price recovery, which added to the positive sentiment towards Hong Kong and Singapore property stocks with most of them having varying degrees of exposure in the various Chinese cities. Chinese banks reported better-than-consensus 3Q12 results showing benign non-performing loans and resilient net interest margins. The political rhetoric post the 18th Party Congress, while offering nothing too surprising, was also re-assuring in its tone towards continued reforms and the focus on sustainable growth. The improved outlook for China also helped bolster a recovery in the resources sector across the region.
5
IMPORTANT INFORMATION
This document is for information only with no consideration given to the specifi c investment objective, fi nancial situation and particular needs of any specifi c person. Any securities mentioned herein are for illustration purposes only and should not be construed as a recommendation for investment. You should seek advice from a fi nancial adviser before making any investment. In the event that you choose not to do so, you should consider whether the investment selected is suitable for you. Investments in unit trusts are not deposits in, obligations of, or guaranteed or insured by Nikko Asset Management Asia Limited (“Nikko AM Asia”).
Past performance or any prediction, projection or forecast is not indicative of future performance. The funds may use or invest in fi nancial derivative instruments. The value of units and income from them may fall or rise. Investments in the funds are subject to investment risks, including the possible loss of principal amount invested. You should read the relevant prospectus and product highlights sheet obtainable from appointed distributors of Nikko AM Asia or our website (www.nikkoam.com.sg) before investing.
The information contained herein may not be copied, reproduced or redistributed without the express consent of Nikko AM Asia. While reasonable care has been taken to ensure the accuracy of the information as at the date of publication, Nikko AM Asia does not give any warranty or representation, either express or implied, and expressly disclaims liability for any errors or omissions. Information may be subject to change without notice. Nikko AM Asia accepts no liability for any loss, indirect or consequential damages, arising from any use of or reliance on this document.
For Hong Kong Investors
The Fund is offered only to professional investors and is not authorized by the Securities and Futures Commission in Hong Kong. The contents of this document have not been reviewed by any regulatory authority in Hong Kong. You are advised to exercise caution in relation to this document. If you are in any doubt about any of the contents of this document, you should obtain independent professional advice.
Nikko Asset Management Asia Limited. Registration Number 198202562H
6
SOFT DOLLAR COMMISSIONS/ARRANGEMENTS
The Managers of the Mendaki Global Fund (the “Fund”) shall be entitled to and currently do receive and enter into soft-dollar commissions or arrangements in respect of the Fund. The Managers will comply with applicable regulatory and industry standards on soft dollar commissions or arrangements. The soft dollar commissions or arrangements include specifi c advice as to the advisability of dealing in, or as to the value of any investments, research and advisory services, economic and political analyses, portfolio analyses including valuation and performance measurements, market analyses, data and quotation services, computer hardware and software or any other information facilities to the extent that they are used to support the investment decision making process, the giving of advice, or the conduct of research or analysis, and custodial services in relation to the investments managed for clients.
Soft dollar commissions or arrangements shall not include travel, accommodation, entertainment, general administrative goods and services, general offi ce equipment or premises, membership fees, employees’ salaries or direct money payments.
The Managers will not accept or enter into soft dollar commissions or arrangements unless (a) such soft dollar commissions or arrangements would, in the opinion of the Managers, assist the Managers in its management of the Fund, (b) best execution is carried out for the transactions, and (c) no unnecessary trades are entered into in order to qualify for such soft dollar commissions or arrangements.
7
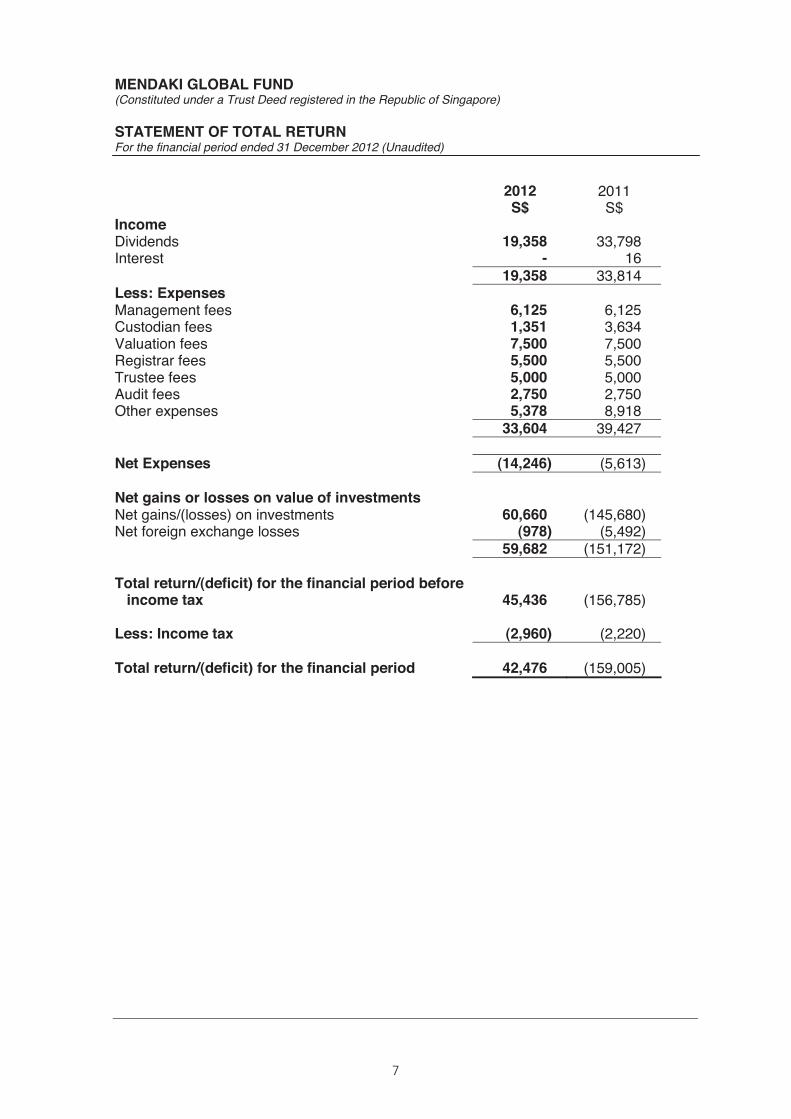
MENDAKI GLOBAL FUND (Constituted under a Trust Deed registered in the Republic of Singapore) STATEMENT OF TOTAL RETURN For the financial period ended 31 December 2012 (Unaudited)
2012 2011 S$ S$ Income Dividends 19,358 33,798 Interest - 16 19,358 33,814 Less: Expenses Management fees 6,125 6,125 Custodian fees 1,351 3,634 Valuation fees 7,500 7,500 Registrar fees 5,500 5,500 Trustee fees 5,000 5,000 Audit fees 2,750 2,750 Other expenses 5,378 8,918 33,604 39,427 Net Expenses (14,246) (5,613) Net gains or losses on value of investments Net gains/(losses) on investments 60,660 (145,680) Net foreign exchange losses (978) (5,492) 59,682 (151,172) Total return/(deficit) for the financial period before
income tax 45,436 (156,785) Less: Income tax (2,960) (2,220) Total return/(deficit) for the financial period 42,476 (159,005)
8
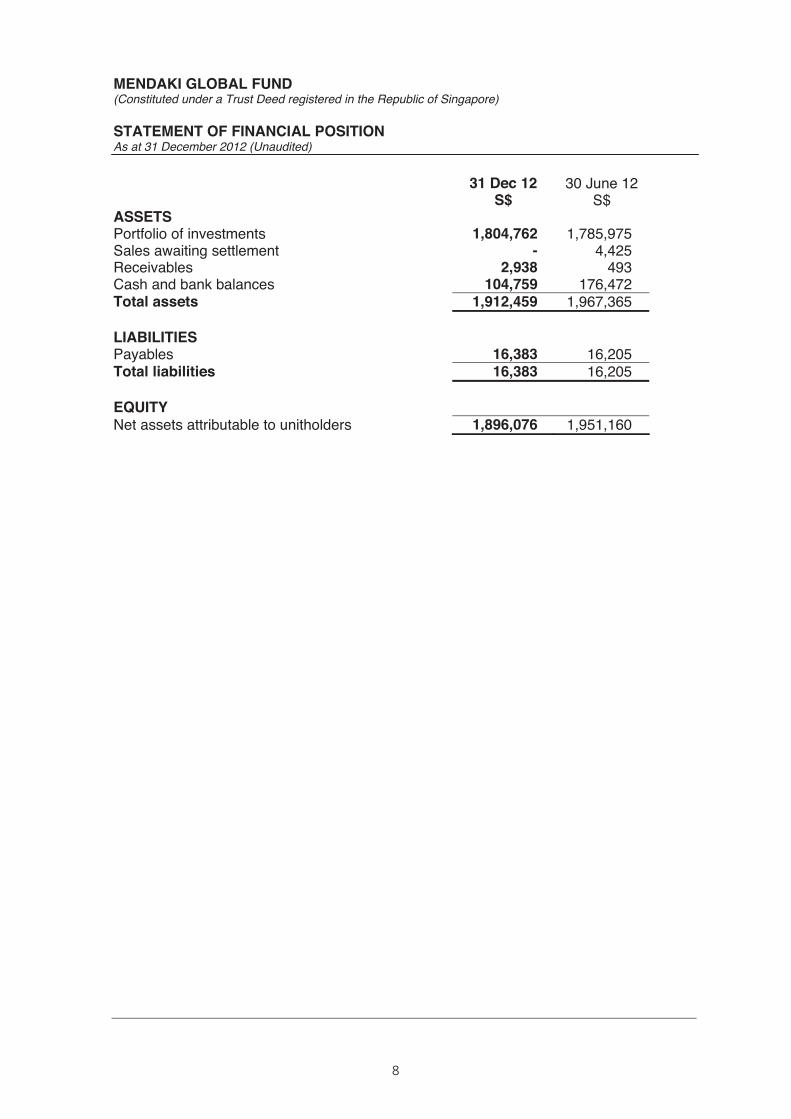
MENDAKI GLOBAL FUND(Constituted under a Trust Deed registered in the Republic of Singapore)
STATEMENT OF FINANCIAL POSITIONAs at 31 December 2012 (Unaudited)
31 Dec 12 30 June 12S$ S$
ASSETSPortfolio of investments 1,804,762 1,785,975Sales awaiting settlement - 4,425Receivables 2,938 493Cash and bank balances 104,759 176,472Total assets 1,912,459 1,967,365
LIABILITIESPayables 16,383 16,205Total liabilities 16,383 16,205
EQUITYNet assets attributable to unitholders 1,896,076 1,951,160
9
MENDAKI GLOBAL FUND(Constituted under a Trust Deed registered in the Republic of Singapore)
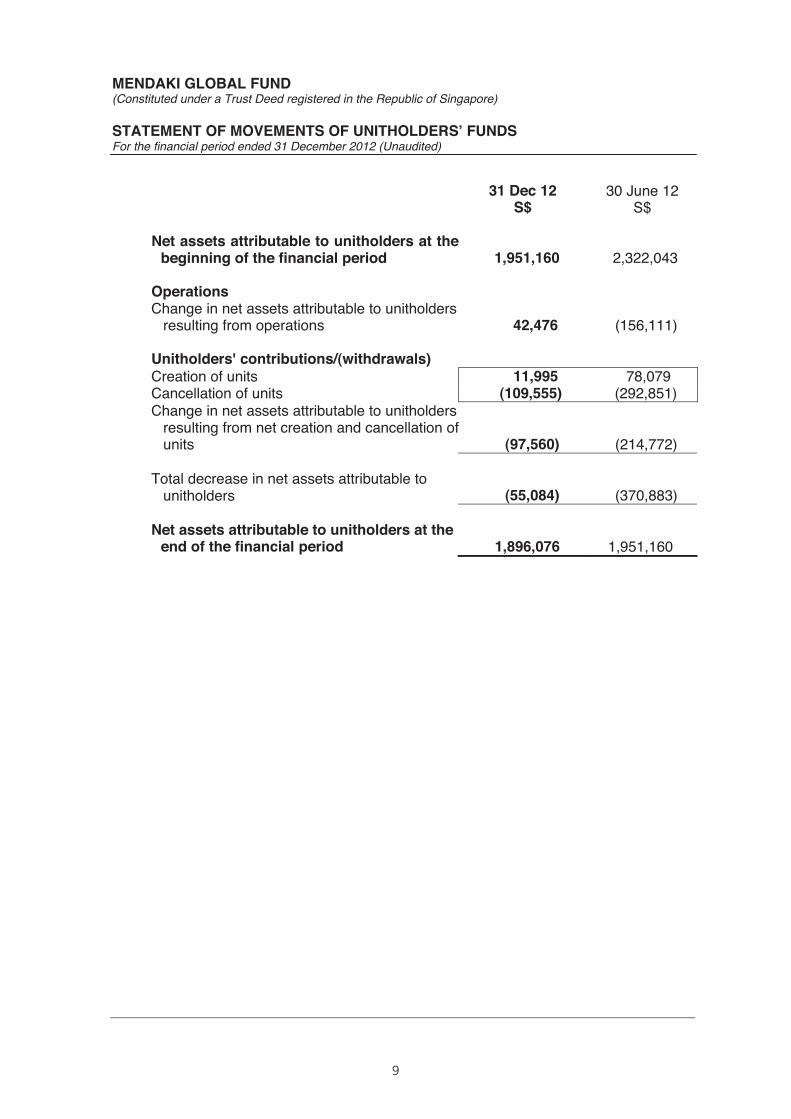
STATEMENT OF MOVEMENTS OF UNITHOLDERS’ FUNDSFor the financial period ended 31 December 2012 (Unaudited)
31 Dec 12 30 June 12S$ S$
Net assets attributable to unitholders at thebeginning of the financial period 1,951,160 2,322,043
OperationsChange in net assets attributable to unitholders
resulting from operations 42,476 (156,111)
Unitholders' contributions/(withdrawals)Creation of units 11,995 78,079Cancellation of units (109,555) (292,851)Change in net assets attributable to unitholders
resulting from net creation and cancellation of units (97,560) (214,772)
Total decrease in net assets attributable to unitholders (55,084) (370,883)
Net assets attributable to unitholders at the end of the financial period 1,896,076 1,951,160
10
MENDAKI GLOBAL FUND(Constituted under a Trust Deed registered in the Republic of Singapore)
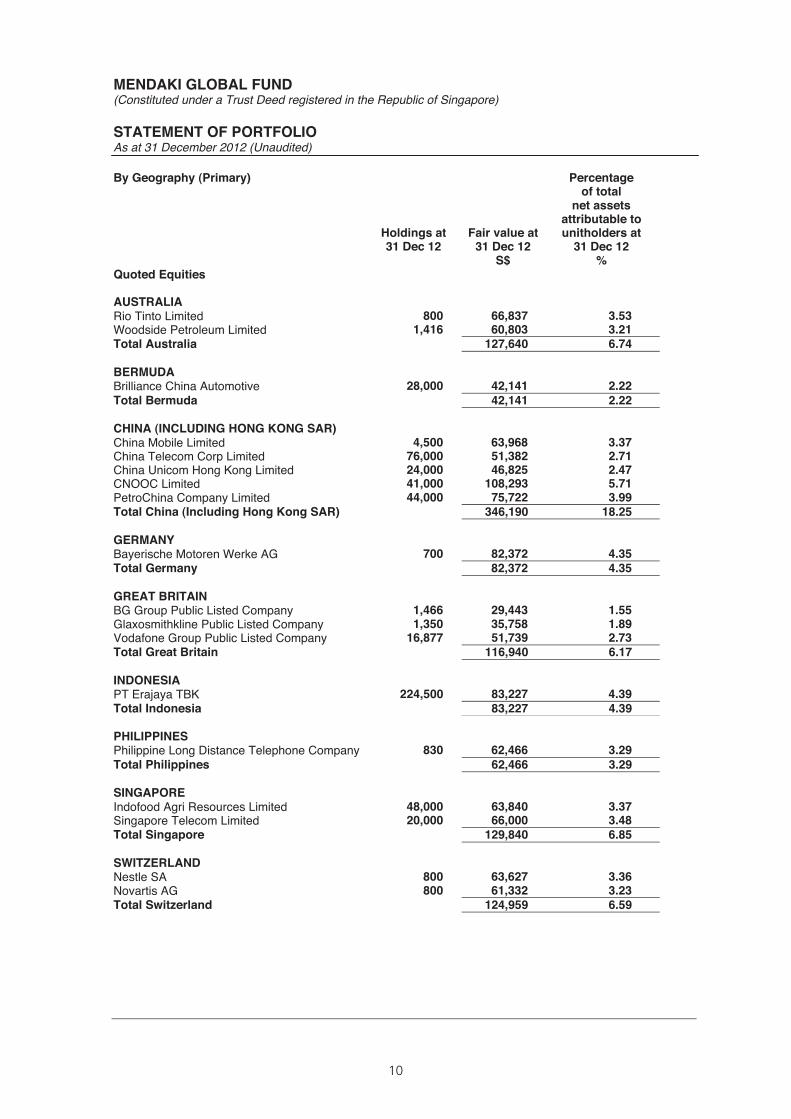
STATEMENT OF PORTFOLIOAs at 31 December 2012 (Unaudited)
By Geography (Primary)
Holdings at31 Dec 12
Fair value at31 Dec 12
Percentageof total
net assetsattributable to unitholders at
31 Dec 12S$ %
Quoted Equities
AUSTRALIARio Tinto Limited 800 66,837 3.53Woodside Petroleum Limited 1,416 60,803 3.21Total Australia 127,640 6.74
BERMUDABrilliance China Automotive 28,000 42,141 2.22Total Bermuda 42,141 2.22
CHINA (INCLUDING HONG KONG SAR)China Mobile Limited 4,500 63,968 3.37China Telecom Corp Limited 76,000 51,382 2.71China Unicom Hong Kong Limited 24,000 46,825 2.47CNOOC Limited 41,000 108,293 5.71PetroChina Company Limited 44,000 75,722 3.99Total China (Including Hong Kong SAR) 346,190 18.25
GERMANYBayerische Motoren Werke AG 700 82,372 4.35Total Germany 82,372 4.35
GREAT BRITAINBG Group Public Listed Company 1,466 29,443 1.55Glaxosmithkline Public Listed Company 1,350 35,758 1.89Vodafone Group Public Listed Company 16,877 51,739 2.73Total Great Britain 116,940 6.17
INDONESIAPT Erajaya TBK 224,500 83,227 4.39Total Indonesia 83,227 4.39
PHILIPPINESPhilippine Long Distance Telephone Company 830 62,466 3.29Total Philippines 62,466 3.29
SINGAPOREIndofood Agri Resources Limited 48,000 63,840 3.37Singapore Telecom Limited 20,000 66,000 3.48Total Singapore 129,840 6.85
SWITZERLANDNestle SA 800 63,627 3.36Novartis AG 800 61,332 3.23Total Switzerland 124,959 6.59
11
MENDAKI GLOBAL FUND(Constituted under a Trust Deed registered in the Republic of Singapore)
STATEMENT OF PORTFOLIOAs at 31 December 2012 (Unaudited)
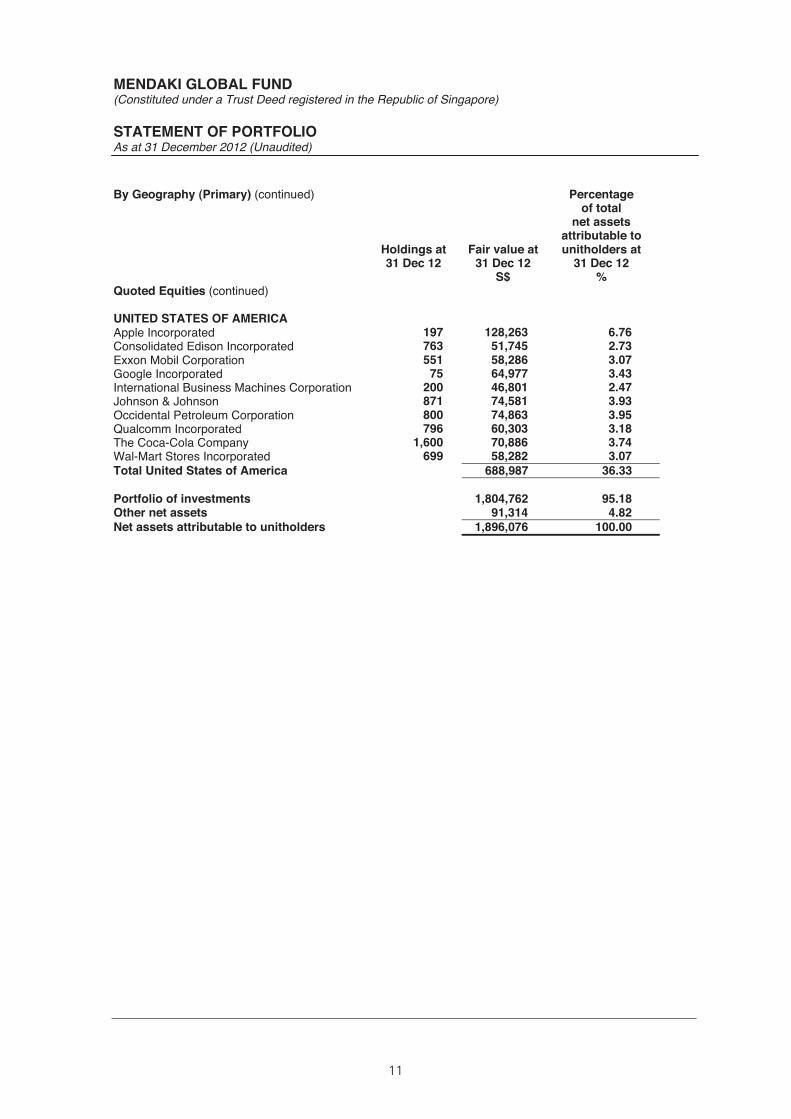
By Geography (Primary) (continued)
Holdings at31 Dec 12
Fair value at31 Dec 12
Percentageof total
net assetsattributable to unitholders at
31 Dec 12S$ %
Quoted Equities (continued)
UNITED STATES OF AMERICAApple Incorporated 197 128,263 6.76Consolidated Edison Incorporated 763 51,745 2.73Exxon Mobil Corporation 551 58,286 3.07Google Incorporated 75 64,977 3.43International Business Machines Corporation 200 46,801 2.47Johnson & Johnson 871 74,581 3.93Occidental Petroleum Corporation 800 74,863 3.95Qualcomm Incorporated 796 60,303 3.18The Coca-Cola Company 1,600 70,886 3.74Wal-Mart Stores Incorporated 699 58,282 3.07Total United States of America 688,987 36.33
Portfolio of investments 1,804,762 95.18Other net assets 91,314 4.82Net assets attributable to unitholders 1,896,076 100.00
12
MENDAKI GLOBAL FUND(Constituted under a Trust Deed registered in the Republic of Singapore)
STATEMENT OF PORTFOLIOAs at 31 December 2012 (Unaudited)
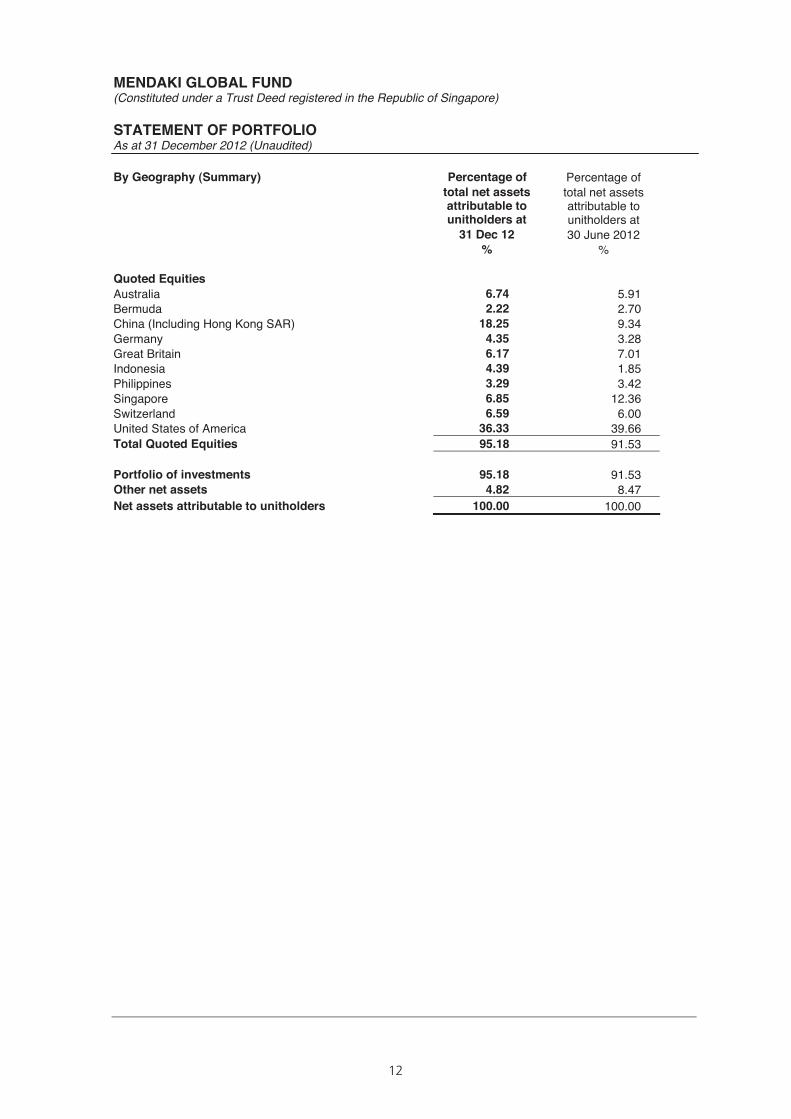
By Geography (Summary) Percentage of Percentage oftotal net assets total net assetsattributable to unitholders at
attributable to unitholders at
31 Dec 12 30 June 2012% %
Quoted EquitiesAustralia 6.74 5.91Bermuda 2.22 2.70China (Including Hong Kong SAR) 18.25 9.34Germany 4.35 3.28Great Britain 6.17 7.01Indonesia 4.39 1.85Philippines 3.29 3.42Singapore 6.85 12.36Switzerland 6.59 6.00United States of America 36.33 39.66Total Quoted Equities 95.18 91.53
Portfolio of investments 95.18 91.53Other net assets 4.82 8.47Net assets attributable to unitholders 100.00 100.00
13
MENDAKI GLOBAL FUND(Constituted under a Trust Deed registered in the Republic of Singapore)
STATEMENT OF PORTFOLIOAs at 31 December 2012 (Unaudited)
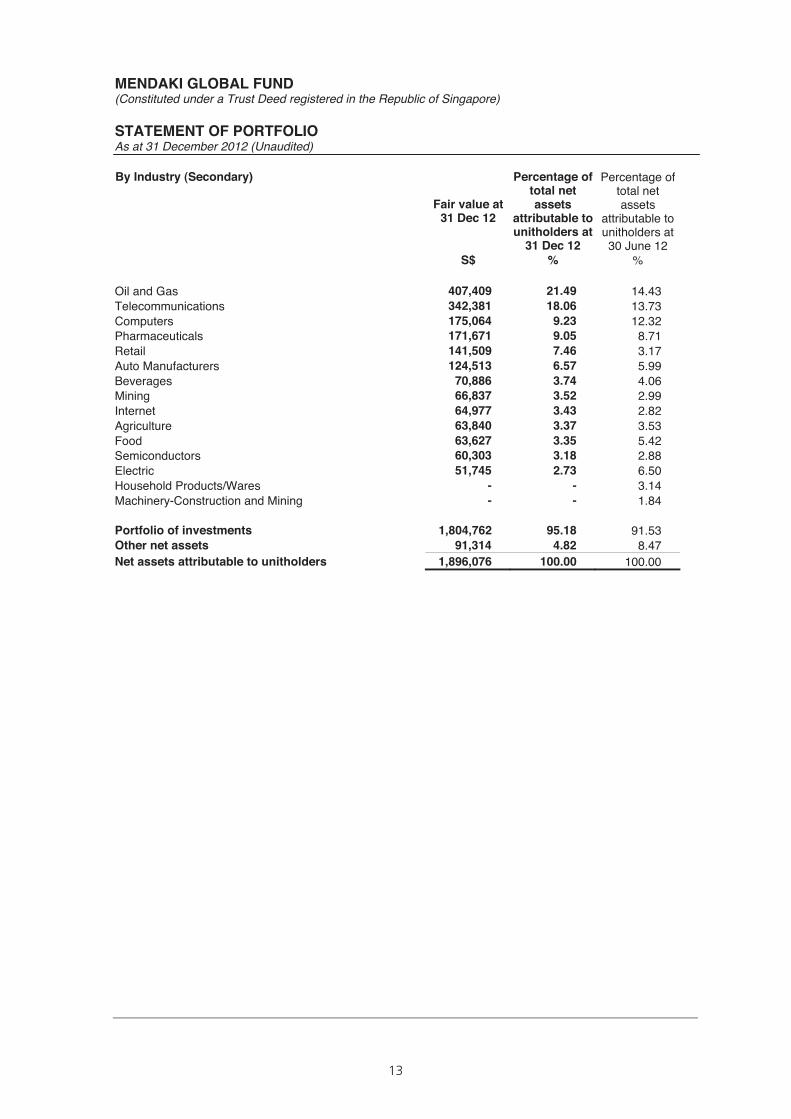
By Industry (Secondary)
Fair value at31 Dec 12
Percentage oftotal net assets
attributable to unitholders at
31 Dec 12
Percentage oftotal netassets
attributable to unitholders at30 June 12
S$ % %
Oil and Gas 407,409 21.49 14.43Telecommunications 342,381 18.06 13.73Computers 175,064 9.23 12.32Pharmaceuticals 171,671 9.05 8.71Retail 141,509 7.46 3.17Auto Manufacturers 124,513 6.57 5.99Beverages 70,886 3.74 4.06Mining 66,837 3.52 2.99Internet 64,977 3.43 2.82Agriculture 63,840 3.37 3.53Food 63,627 3.35 5.42Semiconductors 60,303 3.18 2.88Electric 51,745 2.73 6.50Household Products/Wares - - 3.14Machinery-Construction and Mining - - 1.84
Portfolio of investments 1,804,762 95.18 91.53Other net assets 91,314 4.82 8.47Net assets attributable to unitholders 1,896,076 100.00 100.00
14
MENDAKI GLOBAL FUND(Constituted under a Trust Deed registered in the Republic of Singapore)
REPORT TO UNITHOLDERSFor the financial period ended 31 December 2012 (unaudited)
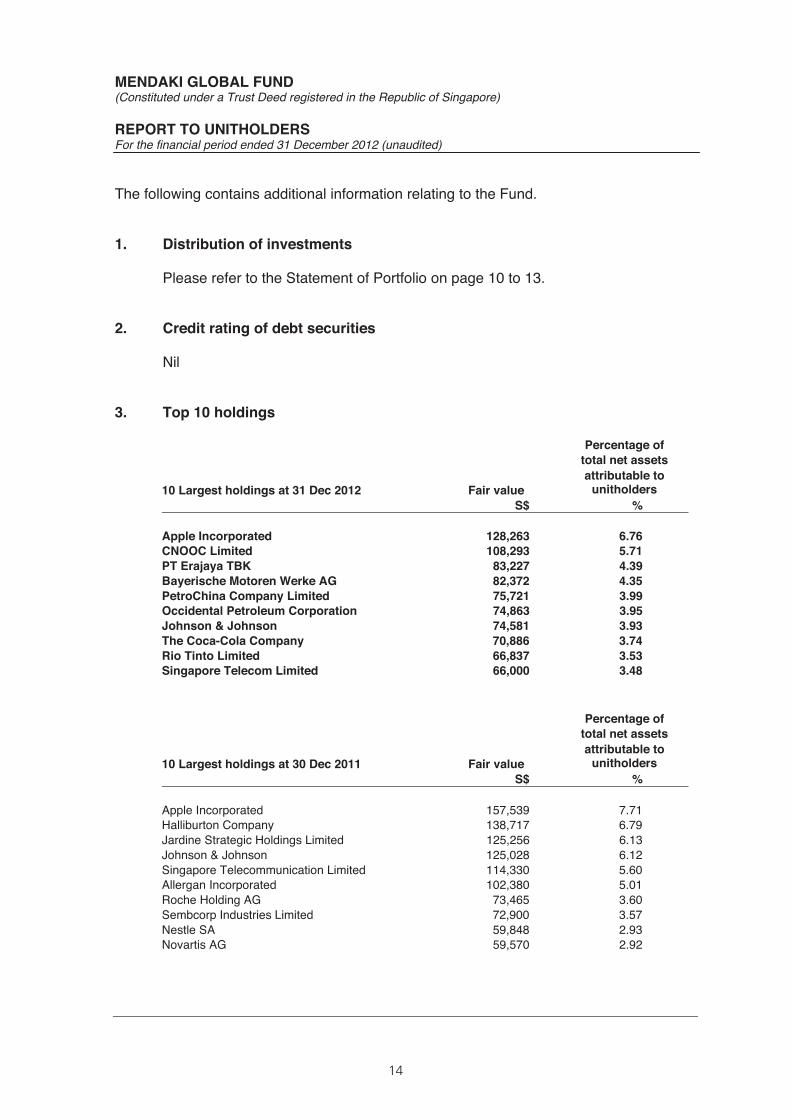
The following contains additional information relating to the Fund.
1. Distribution of investments
Please refer to the Statement of Portfolio on page 10 to 13.
2. Credit rating of debt securities
Nil
3. Top 10 holdings
Percentage oftotal net assets
10 Largest holdings at 31 Dec 2012 Fair valueattributable to
unitholdersS$ %
Apple Incorporated 128,263 6.76CNOOC Limited 108,293 5.71PT Erajaya TBK 83,227 4.39Bayerische Motoren Werke AG 82,372 4.3PetroChina Company Limited 75,721 3.99Occidental Petroleum Corporation 74,863 3.95Johnson & Johnson 74,581 3.93The Coca-Cola Company 70,886 3.74Rio Tinto Limited 66,837 3.53Singapore Telecom Limited 66,000 3.48
Percentage oftotal net assets
10 Largest holdings at 30 Dec 2011 Fair valueattributable to
unitholdersS$ %
Apple Incorporated 157,539 7.71Halliburton Company 138,717 6.79Jardine Strategic Holdings Limited 125,256 6.13Johnson & Johnson 125,028 6.12Singapore Telecommunication Limited 114,330 5.60Allergan Incorporated 102,380 5.01Roche Holding AG 73,465 3.60Sembcorp Industries Limited 72,900 3.57Nestle SA 59,848 2.93Novartis AG 59,570 2.92
5
15
MENDAKI GLOBAL FUND(Constituted under a Trust Deed registered in the Republic of Singapore)
REPORT TO UNITHOLDERSFor the financial period ended 31 December 2012 (unaudited)
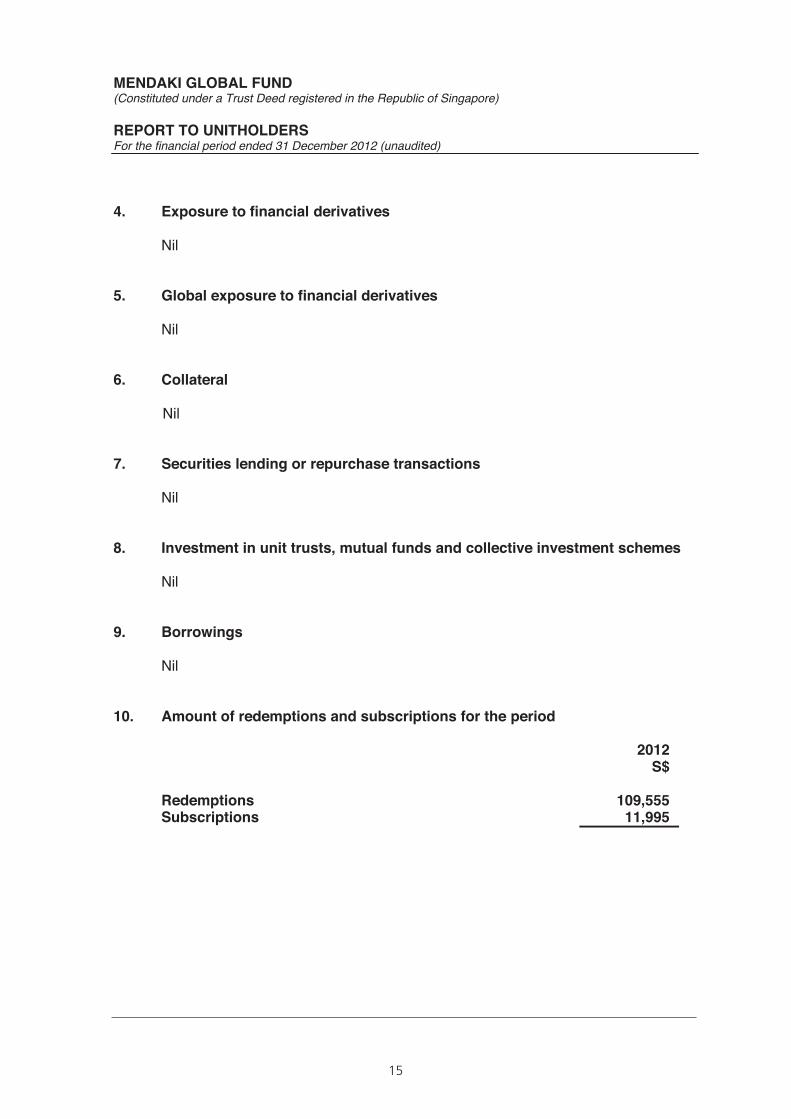
4. Exposure to financial derivatives
Nil
5. Global exposure to financial derivatives
Nil
6. Collateral
Nil
7. Securities lending or repurchase transactions
Nil
8. Investment in unit trusts, mutual funds and collective investment schemes
Nil
9. Borrowings
Nil
10. Amount of redemptions and subscriptions for the period
2012S$
Redemptions 109,555Subscriptions 11,995
16
MENDAKI GLOBAL FUND(Constituted under a Trust Deed registered in the Republic of Singapore)
REPORT TO UNITHOLDERSFor the financial period ended 31 December 2012 (unaudited)
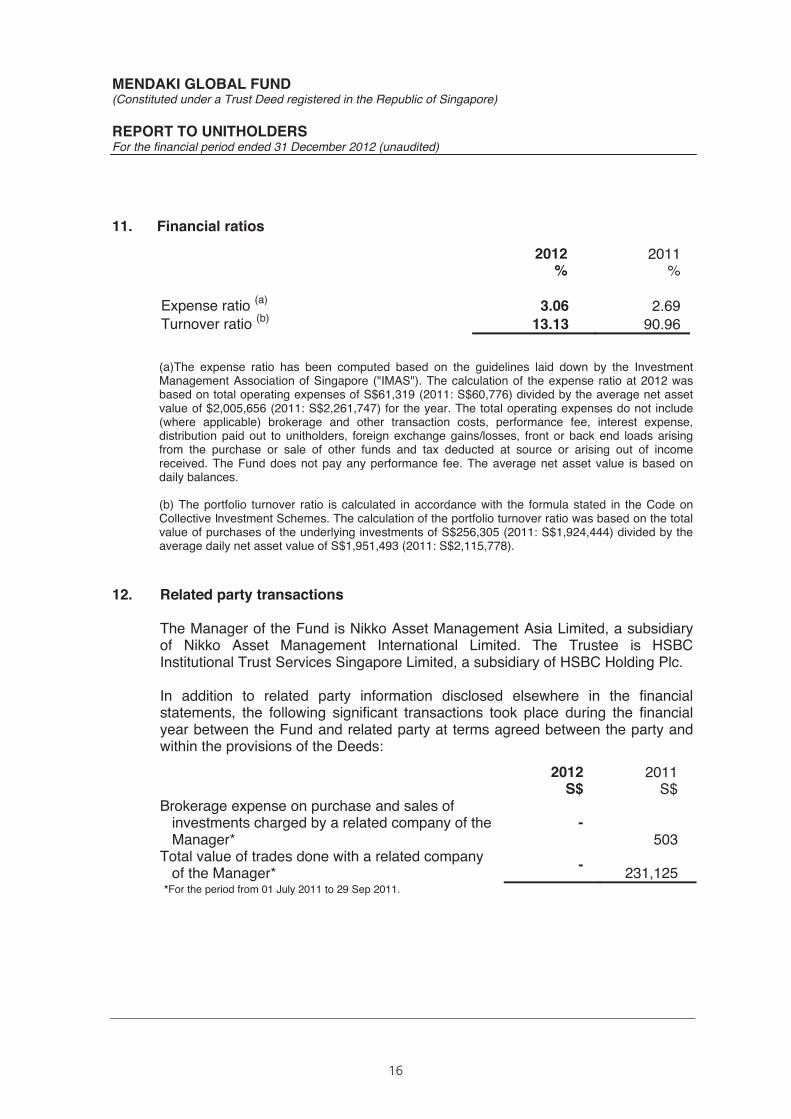
11. Financial ratios
(a)The expense ratio has been computed based on the guidelines laid down by the InvestmentManagement Association of Singapore ("IMAS"). The calculation of the expense ratio at 2012 wasbased on total operating expenses of S$61,319 (2011: S$60,776) divided by the average net assetvalue of $2,005,656 (2011: S$2,261,747) for the year. The total operating expenses do not include(where applicable) brokerage and other transaction costs, performance fee, interest expense,distribution paid out to unitholders, foreign exchange gains/losses, front or back end loads arisingfrom the purchase or sale of other funds and tax deducted at source or arising out of incomereceived. The Fund does not pay any performance fee. The average net asset value is based ondaily balances.
(b) The portfolio turnover ratio is calculated in accordance with the formula stated in the Code onCollective Investment Schemes. The calculation of the portfolio turnover ratio was based on the total value of purchases of the underlying investments of S$256,305 (2011: S$1,924,444) divided by theaverage daily net asset value of S$1,951,493 (2011: S$2,115,778).
12. Related party transactions
The Manager of the Fund is Nikko Asset Management Asia Limited, a subsidiaryof Nikko Asset Management International Limited. The Trustee is HSBCInstitutional Trust Services Singapore Limited, a subsidiary of HSBC Holding Plc.
In addition to related party information disclosed elsewhere in the financialstatements, the following significant transactions took place during the financialyear between the Fund and related party at terms agreed between the party andwithin the provisions of the Deeds:
2012 2011 S$ S$
Brokerage expense on purchase and sales of investments charged by a related company of the Manager*
-503
Total value of trades done with a related company of the Manager* - 231,125
*For the period from 01 July 2011 to 29 Sep 2011.
2012 2011% %
Expense ratio (a) 3.06 2.69Turnover ratio (b) 13.13 90.96
17
MENDAKI GLOBAL FUND (Constituted under a Trust Deed registered in the Republic of Singapore) REPORT TO UNITHOLDERS For the financial period ended 31 December 2012 (unaudited)
14. Adoption of Revised Recommended Accounting Practice RAP 7
The Fund has adopted the recommendations of Statement of Recommended
012 for financial year beginning have been reclassified to conform with changes
13. Any other material information that will adversely impact the valuation of the fund
Nil
. 1 July 2012. Certain comparative figuresin the current presentation
Accounting Practice 7 “Reporting Framework for Unit Trusts” issued by the Institute ofCertified Public Accountants of Singapore in June 2

Intentionally left blank.

Intentionally left blank.

Intentionally left blank.

8 Cross Street #08-01 PWC Building Singapore 048424Intermediaries Hotline: 1800 535 8025 / 65 6535 8025Website: www.nikkoam.com.sg
Company registration number 198202562H