Embed Size (px)
Citation preview
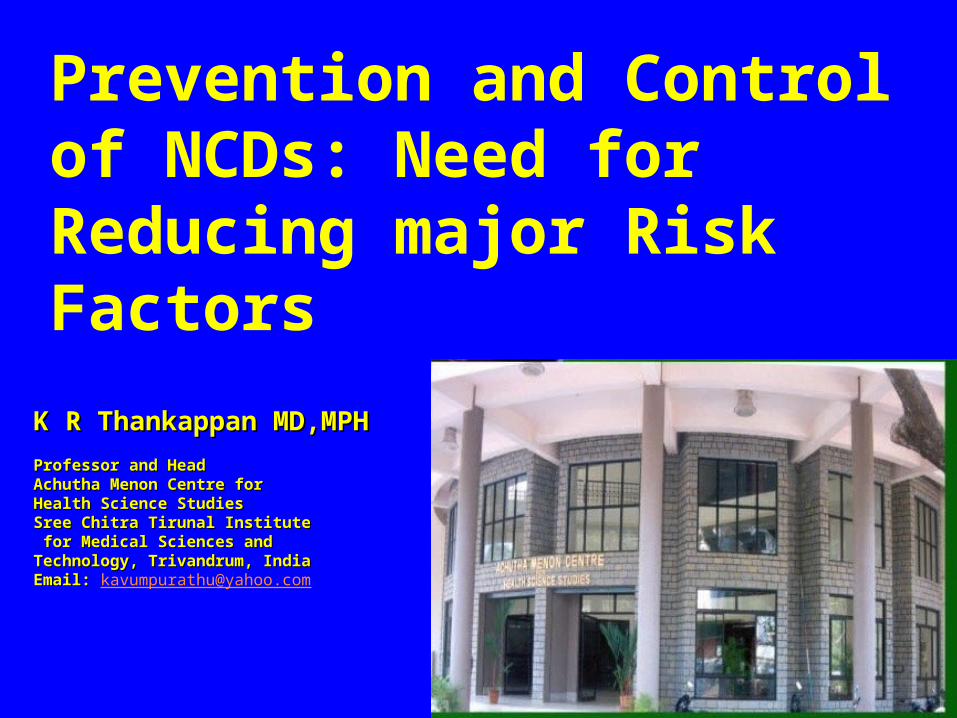
K R Thankappan MD,MPHK R Thankappan MD,MPH
Professor and HeadProfessor and HeadAchutha Menon Centre for Achutha Menon Centre for Health Science StudiesHealth Science StudiesSree Chitra Tirunal Institute Sree Chitra Tirunal Institute for Medical Sciences and for Medical Sciences and Technology, Trivandrum, IndiaTechnology, Trivandrum, IndiaEmail: Email: [email protected]
Prevention and Control of NCDs: Need for Reducing major Risk Factors
Outline
Global Burden of Disease
NCD Risk Factors in Gujarat and India
Health Expenditure pattern
Challenges for prevention
Way forward
Conclusions
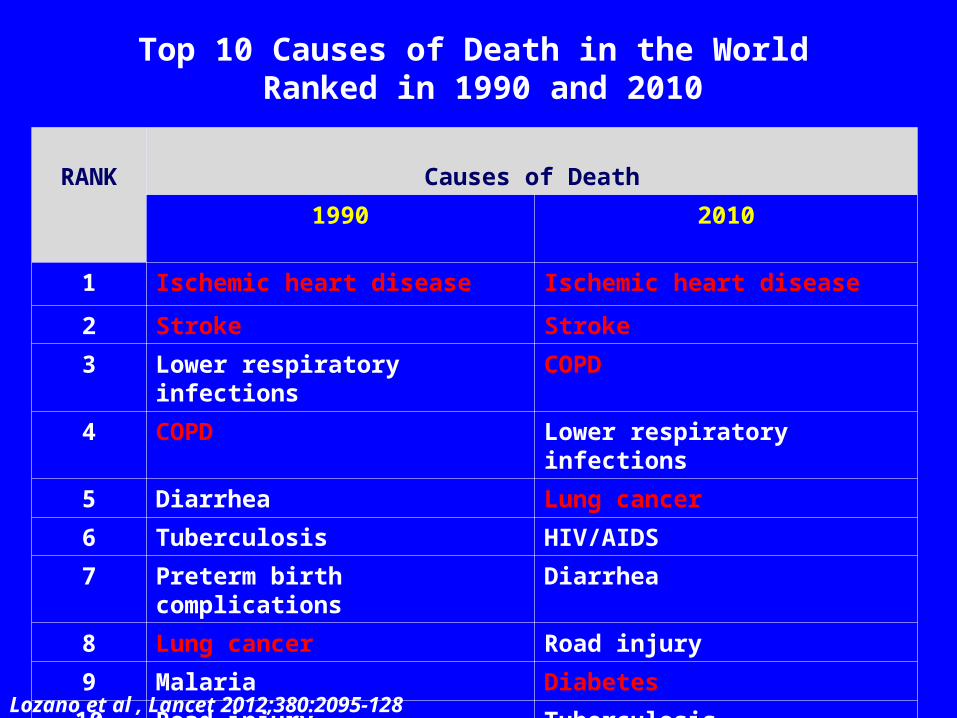
RANK Causes of Death
1990 2010
1 Ischemic heart disease Ischemic heart disease
2 Stroke Stroke
3 Lower respiratory infections COPD
4 COPD Lower respiratory infections
5 Diarrhea Lung cancer
6 Tuberculosis HIV/AIDS
7 Preterm birth complications Diarrhea
8 Lung cancer Road injury
9 Malaria Diabetes
10 Road injury Tuberculosis
Lozano et al , Lancet 2012;380:2095-128
Top 10 Causes of Death in the World Ranked in 1990 and 2010
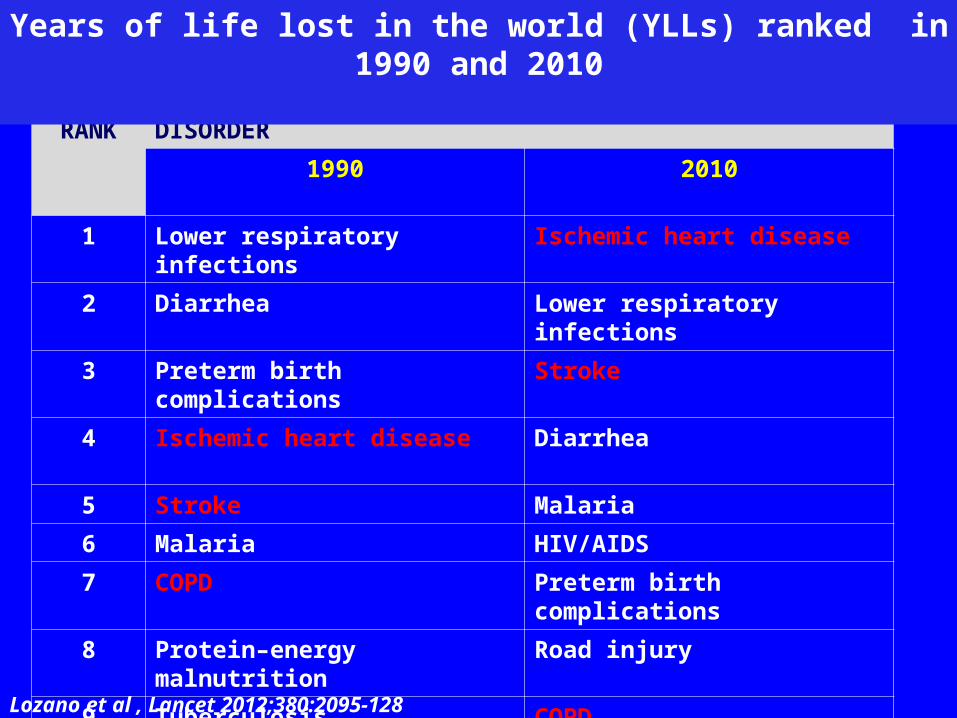
RANK DISORDER
1990 2010
1 Lower respiratory infections Ischemic heart disease
2 Diarrhea Lower respiratory infections
3 Preterm birth complications Stroke
4 Ischemic heart disease Diarrhea
5 Stroke Malaria
6 Malaria HIV/AIDS
7 COPD Preterm birth complications
8 Protein–energy malnutrition Road injury
9 Tuberculosis COPD
10 Neonatal encephalopathy Neonatal encephalopathy
Years of life lost in the world (YLLs) ranked in 1990 and 2010
Lozano et al , Lancet 2012;380:2095-128
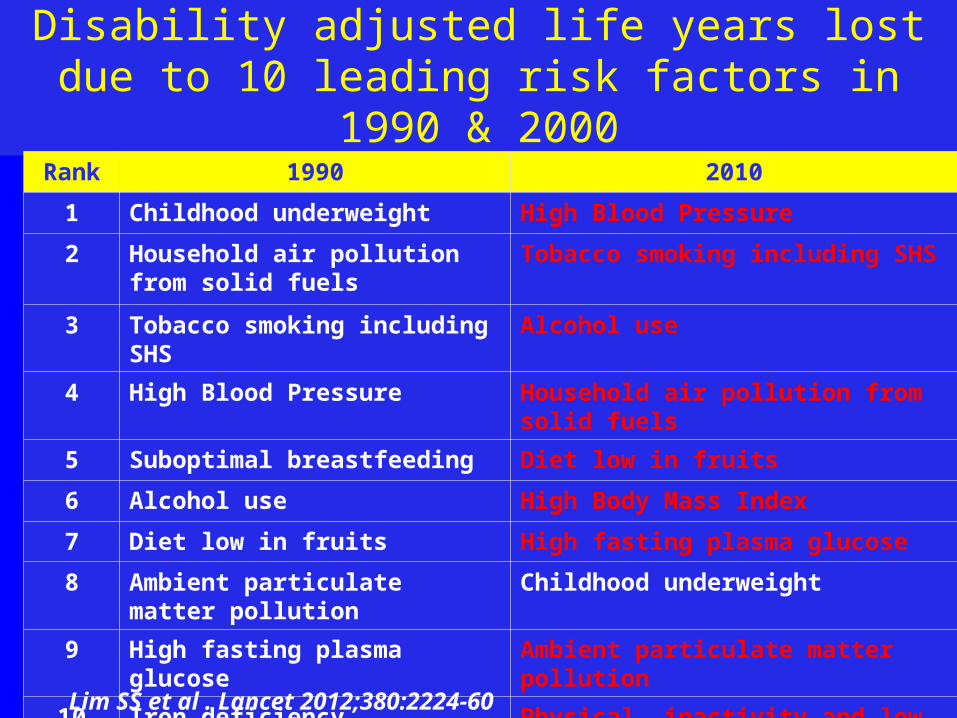
Disability adjusted life years lost due to 10 leading risk factors in 1990 & 2000
Rank 1990 2010
1 Childhood underweight High Blood Pressure
2 Household air pollution from solid fuels
Tobacco smoking including SHS
3 Tobacco smoking including SHS Alcohol use
4 High Blood Pressure Household air pollution from solid fuels
5 Suboptimal breastfeeding Diet low in fruits
6 Alcohol use High Body Mass Index
7 Diet low in fruits High fasting plasma glucose
8 Ambient particulate matter pollution
Childhood underweight
9 High fasting plasma glucose Ambient particulate matter pollution
10 Iron deficiency Physical inactivity and low physical activity
Lim SS et al . Lancet 2012;380:2224-60
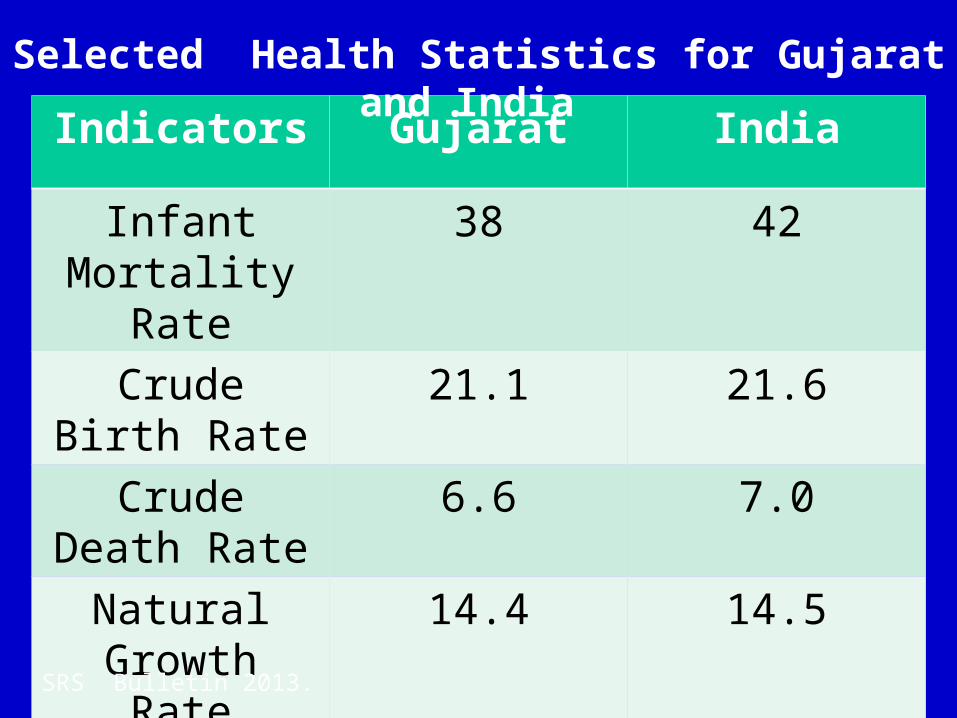
Indicators Gujarat India
Infant Mortality Rate
38 42
Crude Birth Rate
21.1 21.6
Crude Death Rate
6.6 7.0
Natural Growth Rate
14.4 14.5
Selected Health Statistics for Gujarat and India
SRS Bulletin 2013.
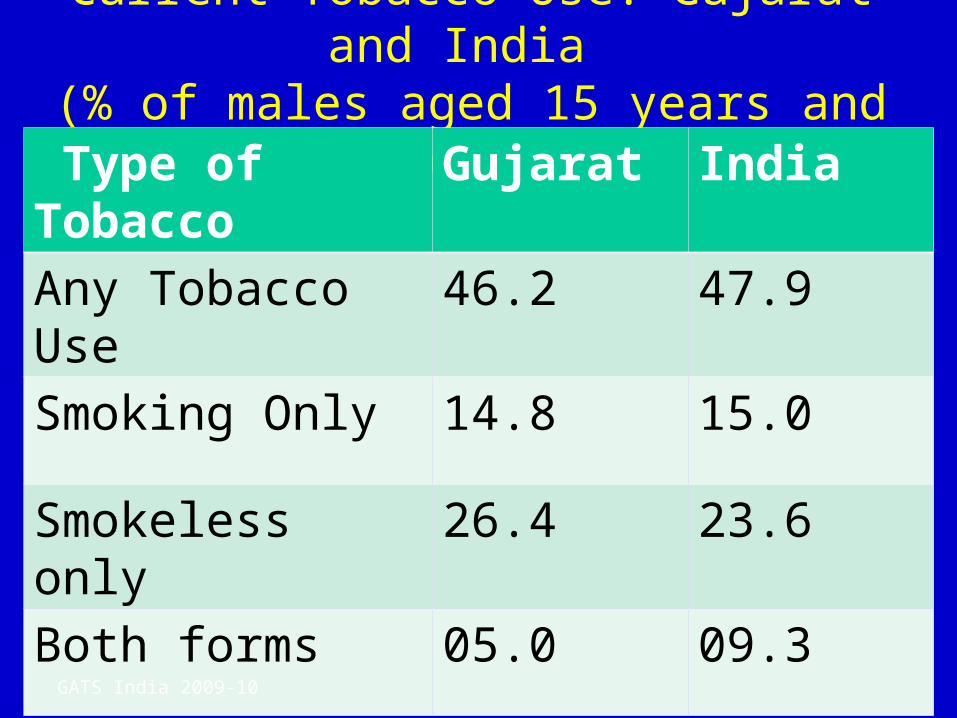
Current Tobacco Use: Gujarat and India (% of males aged 15 years and above)
Type of Tobacco Gujarat India
Any Tobacco Use 46.2 47.9
Smoking Only 14.8 15.0
Smokeless only 26.4 23.6
Both forms 05.0 09.3
GATS India 2009-10
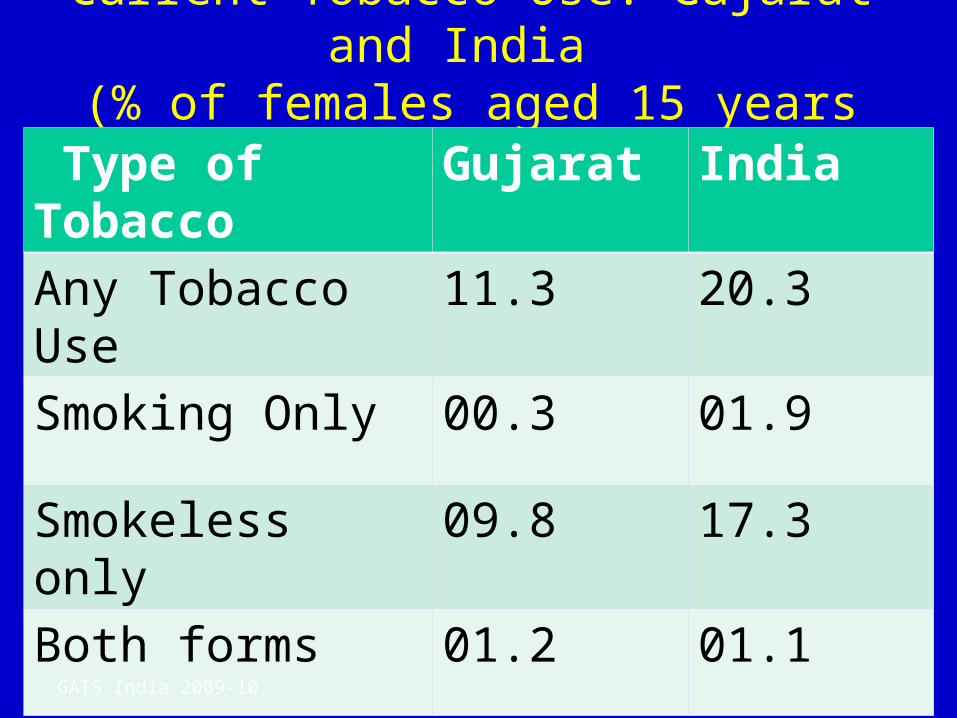
Current Tobacco Use: Gujarat and India (% of females aged 15 years and above)
Type of Tobacco Gujarat India
Any Tobacco Use 11.3 20.3
Smoking Only 00.3 01.9
Smokeless only 09.8 17.3
Both forms 01.2 01.1
GATS India 2009-10
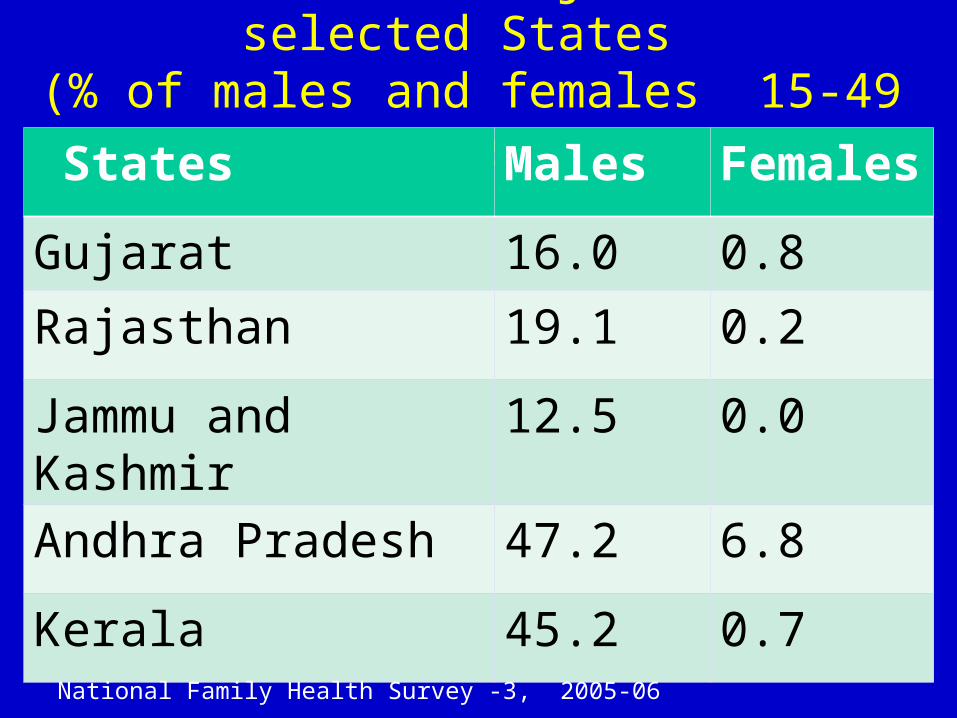
Alcohol Use: Gujarat and selected States (% of males and females 15-49 years)
States Males Females
Gujarat 16.0 0.8
Rajasthan 19.1 0.2
Jammu and Kashmir 12.5 0.0
Andhra Pradesh 47.2 6.8
Kerala 45.2 0.7
National Family Health Survey -3, 2005-06
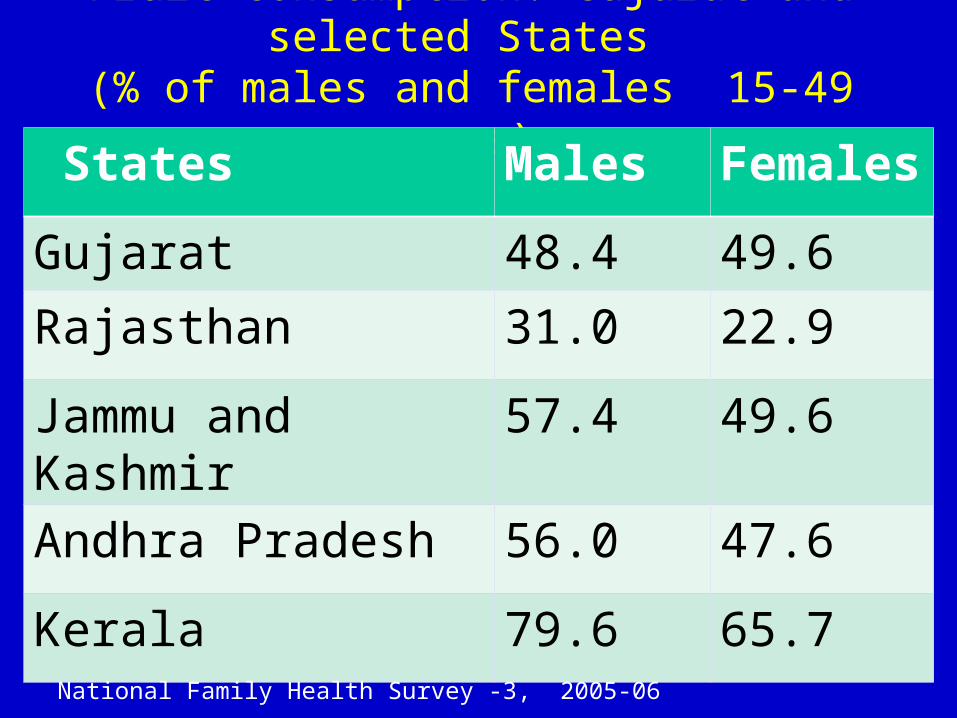
Fruit Consumption: Gujarat and selected States (% of males and females 15-49 years)
States Males Females
Gujarat 48.4 49.6
Rajasthan 31.0 22.9
Jammu and Kashmir 57.4 49.6
Andhra Pradesh 56.0 47.6
Kerala 79.6 65.7
National Family Health Survey -3, 2005-06
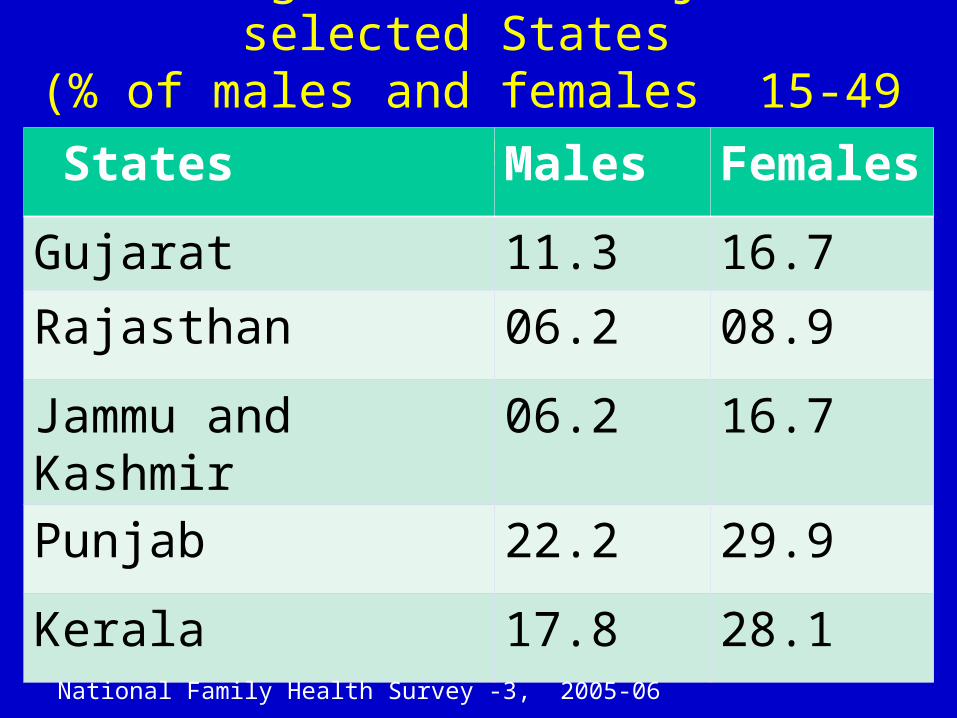
Overweight /Obese: Gujarat & selected States
(% of males and females 15-49 years) States Males Females
Gujarat 11.3 16.7
Rajasthan 06.2 08.9
Jammu and Kashmir 06.2 16.7
Punjab 22.2 29.9
Kerala 17.8 28.1
National Family Health Survey -3, 2005-06
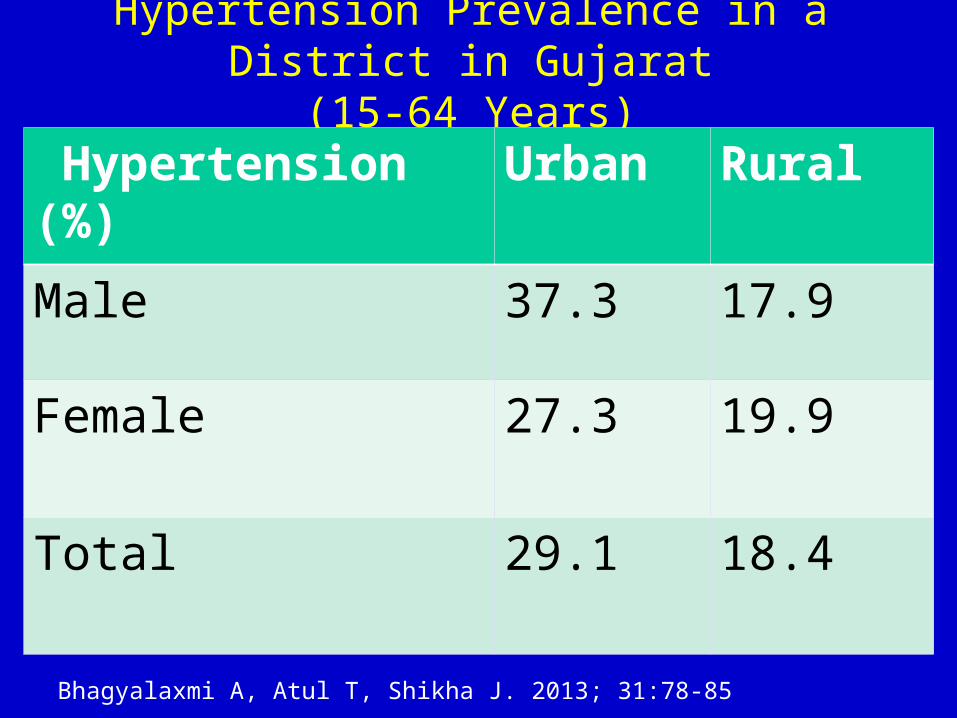
Hypertension Prevalence in a District in Gujarat(15-64 Years)
Hypertension (%) Urban Rural
Male 37.3 17.9
Female 27.3 19.9
Total 29.1 18.4
Bhagyalaxmi A, Atul T, Shikha J. 2013; 31:78-85
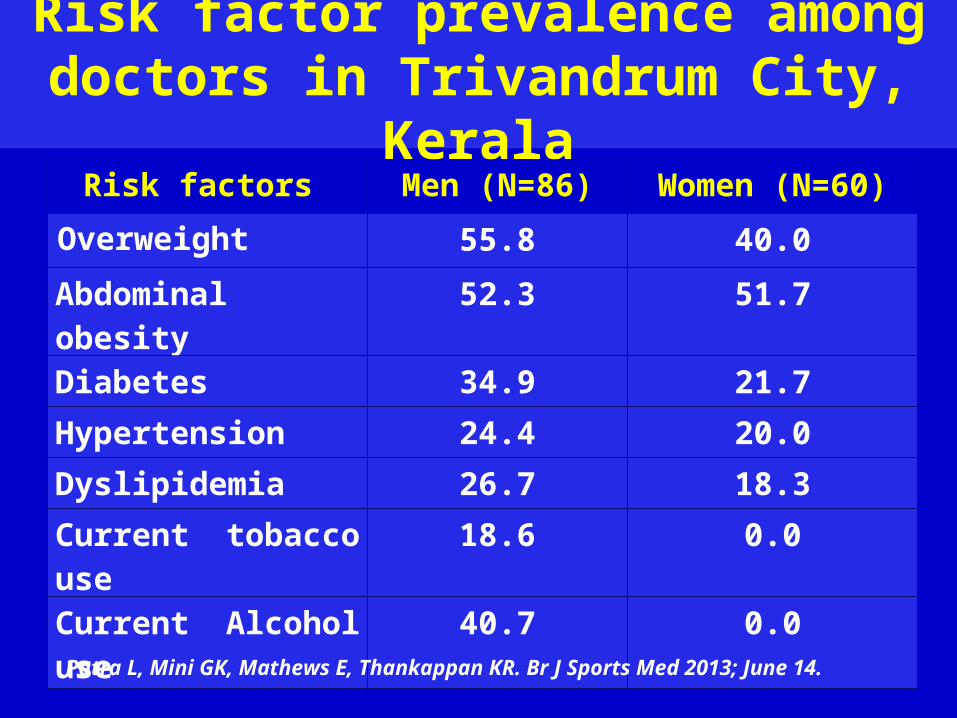
Risk factor prevalence among doctors in Trivandrum City, Kerala
Risk factors Men (N=86) Women (N=60)
Overweight 55.8 40.0
Abdominal obesity 52.3 51.7
Diabetes 34.9 21.7
Hypertension 24.4 20.0
Dyslipidemia 26.7 18.3
Current tobacco use 18.6 0.0
Current Alcohol use 40.7 0.0
Patra L, Mini GK, Mathews E, Thankappan KR. Br J Sports Med 2013; June 14.
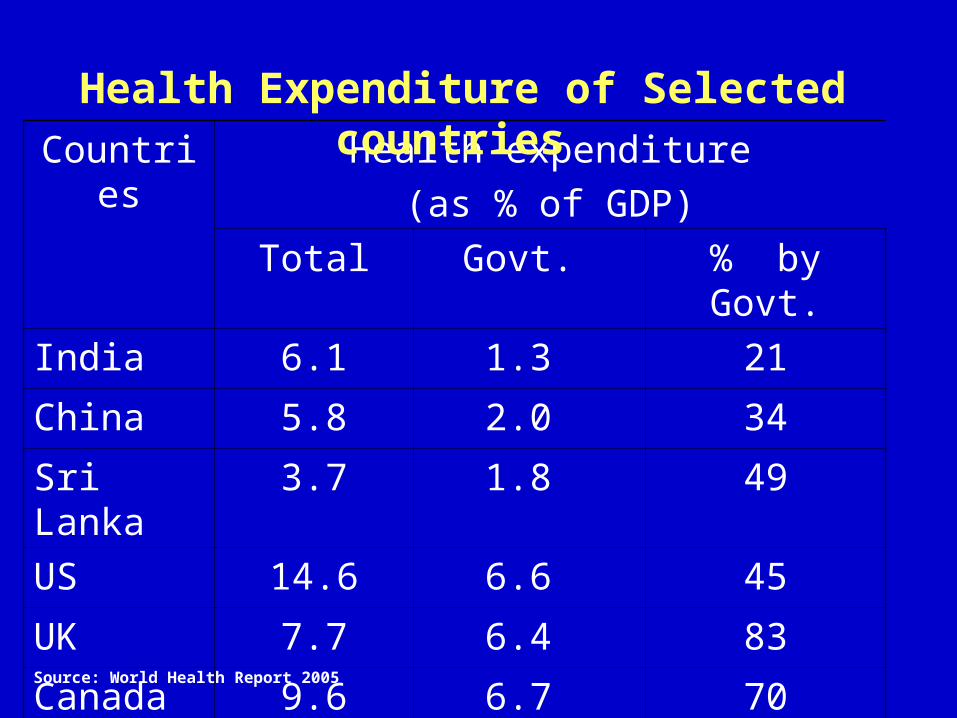
Countries Health expenditure
(as % of GDP)
Total Govt. % by Govt.
India 6.1 1.3 21
China 5.8 2.0 34
Sri Lanka 3.7 1.8 49
US 14.6 6.6 45
UK 7.7 6.4 83
Canada 9.6 6.7 70
Health Expenditure of Selected countries
Source: World Health Report 2005

States %
Kerala 90.3
Gujarat 79.2
Rajasthan 75.6
Karnataka 71.9
India 78.0
Private Health Expenditure in Selected Indian States 2004-05
Kumar AKS et al. Lancet 2011; 377: 668-79
Issues in Privatization of Health Care
High provider induced demand for procedures and drugs
One example is the increased proportion of cesarean sections
Difficult to quantify the magnitude of unnecessary care
Prevention is generally undervalued and underused-1
• The right knowledge is often not in the right hands
• Visible Sick Patients – rule of rescue
• Irrational use of invasive procedure
• Gains of prevention are illusive and often invisible

Prevention is generally undervalued and underused-2
• Powerful commercial interests obstruct policy change
• Health professionals favor treatment
• Media highlights new cures, obscure treatments
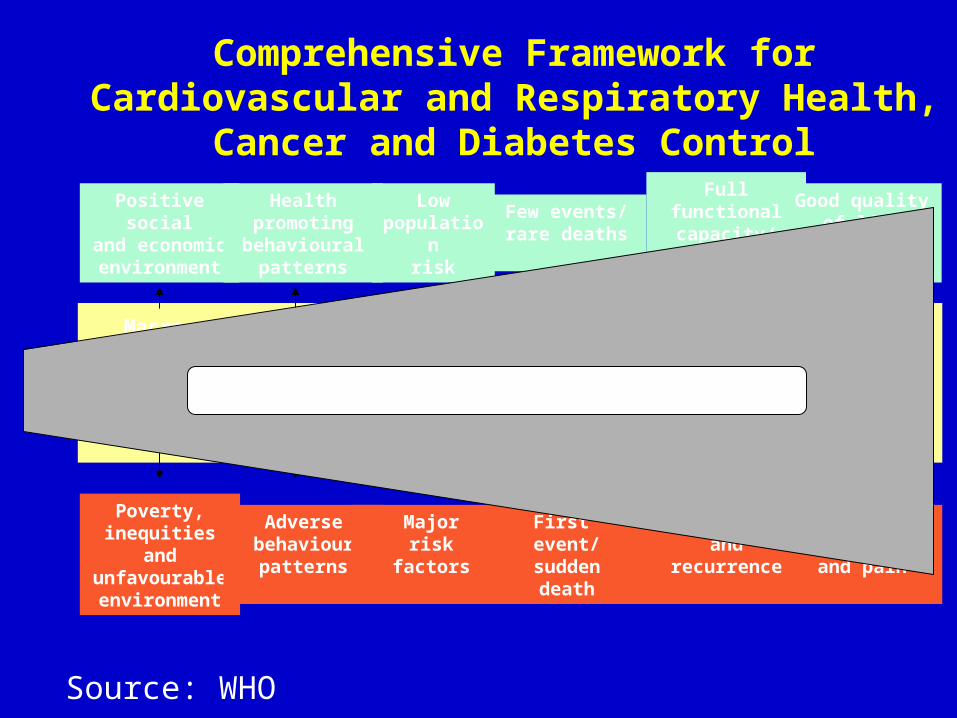
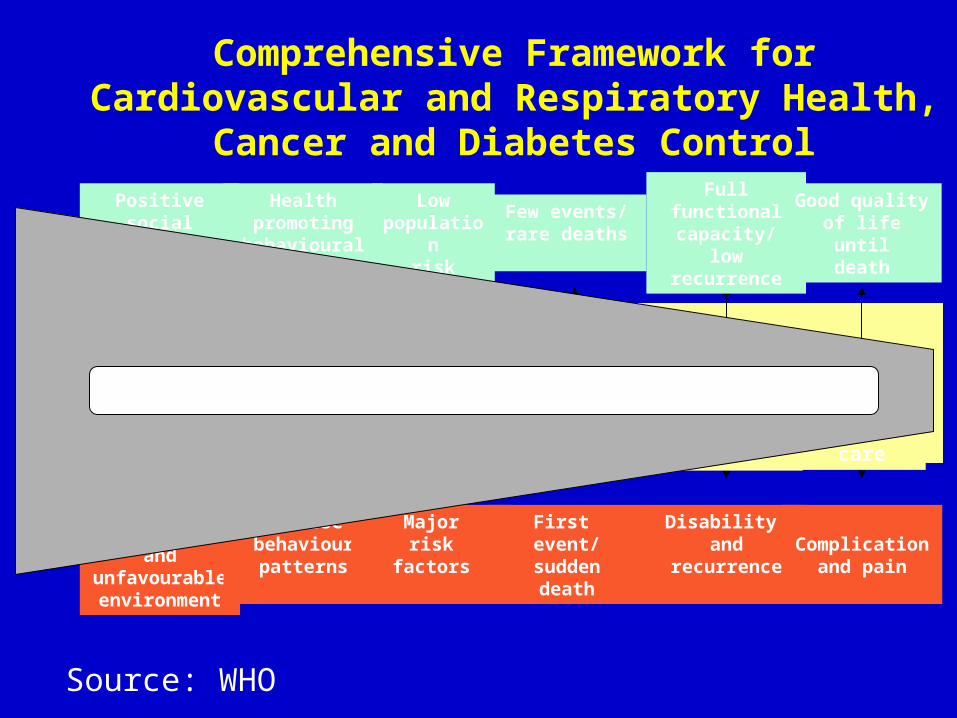
Comprehensive Framework for Cardiovascular and Respiratory Health, Cancer and Diabetes Control
Poverty, inequities and unfavourable
environment
Adversebehaviourpatterns
Majorrisk
factors
First event/
suddendeath
Disability and
recurrenceComplication
and pain
Positive socialand economicenvironment
Health promotingbehavioural
patterns
Lowpopulation
risk
Few events/rare deaths
Full functionalcapacity/ lowrecurrence
Good qualityof life until
death
Behaviourchange
Risk factor detection and
controlAcute care
management
Chronic careand
rehabilitationEnd-of-life
care
Macro-economic and
environmental change
Current deployment of resources
Source: WHO
Comprehensive Framework for Cardiovascular and Respiratory Health, Cancer and Diabetes Control
Poverty, inequities and unfavourable
environment
Adversebehaviourpatterns
Majorrisk
factors
First event/
suddendeath
Disability and
recurrenceComplication
and pain
Positive socialand economicenvironment
Health promotingbehavioural
patterns
Lowpopulation
risk
Few events/rare deaths
Full functionalcapacity/ lowrecurrence
Good qualityof life until
death
Behaviourchange
Risk factor detection and
controlAcute care
management
Chronic careand
rehabilitationEnd-of-life
care
Macro-economic and
environmental changeGiving emphasis to prevention, promotion
Source: WHO
Way forward -1• Strong leadership by heads of state and
governments needed to meet national commitments to the UN Political declaration on non-communicable diseases (NCD) and to achieve the goal of 25% reduction of premature NCD mortality by 2025
• A simple, phased national response to the political declaration needs three steps: planning, implementation and accountability.
Way forward -2
• National accountability involves monitoring and reviewing progress and appropriate response to accelerate progress with appropriate institutional mechanisms.
ConclusionsGlobal burden of disease has shifted to chronic non-communicable diseasesNCD risk factors are high in Gujarat In most developed countries except the US public sector provides most of the health careIn India and Gujarat private sector is the predominant health care provider Prevention is the keyStrong leadership is required to meet national commitments to the UN political declaration on NCDs.