Embed Size (px)
Citation preview
Data Inventory of the tIDal BasIns In the trIlateral WaDDen seaD. Kraft, E. O. fOlmEr, J. mEyErDirKs, t. stiEhl
Pho
to: c
wss
/Bro
ckm
ann
co
nsul
t

transitie van de nederlandse mosselsector
3
contents
1 summary/samenvatting 4 2 introduction 7 2.1 Background 7
2.2 Tidalbasinlevel 7
2.3 Objectives 7
2.4 Structureofthereport 7
3 methods 9 3.1 ContractorsandSteeringCommittee 9
3.2 Informationsources 9
4 Policy concerns, scientific questions and required Parameters 11 4.1 SealevelrISeandSeaflOOrSuBSIdenCe 11
4.1.1 scientific topic: what is needed to predict the impacts of sea level rise? 11
4.1.2 Parameters of morphodynamics 11
4.1.3 Methodological concerns 11
4.2 Humanuse 12
4.2.1 science topic: how is turbidity of the water column affected by human use? 12
4.2.2 science topic: what are the impacts of fisheries on ecosystem functioning? 12
4.3 Biodiversity,climatechangeandneobiota 13
4.3.1 science topic: what are the spatiotemporal distribution patterns
of biota and what are the drivers? 13
4.3.2 science topic: what promotes and what threatens biodiversity and resilience? 14
4.3.3 science topic: how does climate change affect the main ecological processes? 14
4.3.4 Parameters of biodiversity, climate change and neobiota 14
4.4 ecosystemservices 14
4.4.1 science topic: what are the values of the services provided by the ecosystem? 15
4.4.2 Parameters of ecosystem services 15
5 data 17 5.1 Overview:datademand,qualityandavailability 17
5.2 datasourcesandmeasurementmethodology 18
5.2.1 General parameters 18
5.2.1.1 Bathymetry 18
5.2.1.2 Sediment 19
5.2.1.3 Hydrology 20
5.2.1.4 Weatherandatmosphere 20
5.2.2 Physical and chemical parameters 21
5.2.2.1 Watertemperature,salinity,suspendedmatter,nutrients,turbidityandtoxins21
5.2.2.2 Wavesandcurrents 21
5.2.3 Biological parameters 21
5.2.3.1 Primaryproduction:pelagicandbenthicmicrophytes 21
5.2.3.2 Macrozoobenthosandzooplankton 22
5.2.3.3 Fish 22
5.2.3.4 Birds 23
5.2.4 habitats 24
5.2.5 human use 25
5.2.5.1 Fisheriesandshellfishculture 25
5.2.5.2 Naturalgasextraction 25
5.2.5.3 Shellandsandmining 26
5.2.5.4 Dredginganddumping 26
5.2.5.5 Recreation 26
5.3 datagapsandsolutions 27
5.3.1 General parameters 27
5.3.2 Physical parameters 27
5.3.3 chemical parameters 27
5.3.4 Biological parameters 27
5.3.5 human use 27
6 tyPology of tidal basins 29 6.1 Morphology,barrierislandsandinletwidth 29
6.2 Mudflatarea 30
6.3 averagedepth 30
7 conclusions and recommendations 33
8 literature 36
9 aPPendices 39 9.1 demarcationoftidalbasins(d.Kraft) 39
9.2 listofabbreviations 42
data inventory of the tidal basins in the trilateral Wadden sea
3
Programma naar een rijke Waddenzee
2
contents
1 summary/samenvatting 4 2 introduction 7 2.1 Background 7
2.2 Tidalbasinlevel 7
2.3 Objectives 7
2.4 Structureofthereport 7
3 methods 9 3.1 ContractorsandSteeringCommittee 9
3.2 Informationsources 9
4 Policy concerns, scientific questions and required Parameters 11 4.1 SealevelrISeandSeaflOOrSuBSIdenCe 11
4.1.1 scientific topic: what is needed to predict the impacts of sea level rise? 11
4.1.2 Parameters of morphodynamics 11
4.1.3 Methodological concerns 11
4.2 Humanuse 12
4.2.1 science topic: how is turbidity of the water column affected by human use? 12
4.2.2 science topic: what are the impacts of fisheries on ecosystem functioning? 12
4.3 Biodiversity,climatechangeandneobiota 13
4.3.1 science topic: what are the spatiotemporal distribution patterns
of biota and what are the drivers? 13
4.3.2 science topic: what promotes and what threatens biodiversity and resilience? 14
4.3.3 science topic: how does climate change affect the main ecological processes? 14
4.3.4 Parameters of biodiversity, climate change and neobiota 14
4.4 ecosystemservices 14
4.4.1 science topic: what are the values of the services provided by the ecosystem? 15
4.4.2 Parameters of ecosystem services 15
5 data 17 5.1 Overview:datademand,qualityandavailability 17
5.2 datasourcesandmeasurementmethodology 18
5.2.1 General parameters 18
5.2.1.1 Bathymetry 18
5.2.1.2 Sediment 19
5.2.1.3 Hydrology 20
5.2.1.4 Weatherandatmosphere 20
5.2.2 Physical and chemical parameters 21
5.2.2.1 Watertemperature,salinity,suspendedmatter,nutrients,turbidityandtoxins21
5.2.2.2 Wavesandcurrents 21
data inventory of the tidal basins in the trilateral Wadden sea
4
data inventory of the tidal basins in the trilateral Wadden sea
5
the Dutch programme “towards a Rich wadden sea” (PRw)
proposes to compare all tidal basins in the wadden sea on the basis
of their abiotic properties, ecological developments and the policies
and management applied in each basin. such a comparison may
provide insight into the ways natural and anthropogenic factors
influence the conditions of tidal basins. PRw has commissioned
this prestudy with the aim of investigating the relevance and
feasibility of comparing the tidal basins of the wadden sea.
the present study, carried out between November 2010 and
August 2011:
• presents an overview of the most urgent policy questions and
associated science topics,
• presents an overview of the main parameter groups needed to
describe the physical, chemical, and biological properties of tidal
basins and their use by humans,
• assesses the quality and availability of existing data collected or
compiled by the most comprehensive monitoring programmes in
the wadden sea,
• proposes methodology by which synoptic comparisons may be
made.
scientists and experts in the Netherlands, Germany, and Denmark
were interviewed in order to gain insight into the relevance and
feasibility of the proposed tidal basin approach.
the development of a tidal basin atlas was generally considered
a potentially important contribution to the field. comparison of
tidal basins on the basis of general characteristics was considered
helpful for various kinds of policy and research topics.
Additionally, the main policy questions for which this approach
could be useful, including any related scientific questions and
associated parameters, were discussed. the interviewees were
consulted and literature and databases were searched to obtain
an overview of data that were available to address the identified
policy concerns.
the main policy questions relate to:
• sea level rise
• climate change, especially changing temperature
• Biodiversity, including the impact of invasive alien species
• the impact of human use, particularly seabedimpacting activities
• conservation management in relation to ecosystem functions
and services.
Various national and international initiatives in which data
from different sources are being compiled and distributed have
been identified and are presented in this report. some trilateral
harmonization initiatives have led to very useful data (e.g. birds
and mussel beds), suitable for comparative research. there are
substantial differences in the data density between tidal basins;
smaller basins are particularly underrepresented. In addition, it
is often unclear whether some datasets carry conditions of use
which either forbid widespread publication or restrict the details
that can be disclosed in public documents. the biggest gaps exist
for human use parameters, measurements of primary production
and sediment budgets.
several recommendations on how to use the tidal basin approach
are presented. to overcome the current problem of insufficient
data coverage, it is recommended that a selected set of indicative
basins be used, that models be applied and that remote sensing
data be integrated into the approach. It is further recommended
that the data be presented via an easily accessible information
system comprising a digital atlas of the trilateral tidal basins.
het programma “Naar een rijke waddenzee” (PRw) heeft als doel de kombergingen in de Deense, Duitse en Nederlandse waddenzee te vergelijken op basis van abiotische kenmerken, ecologische ontwikkeling en historisch en vigerend beleid. Een dergelijke vergelijking kan inzichten opleveren in de effecten van natuurlijke en anthropogene factoren op de toestand van de kombergingen.
Dit rapport verkent de potentiële waarde van vergelijkend onderzoek op het niveau van kombergingen en de beschikbaarheid van data om vergelijkend onderzoek uit te kunnen voeren. Deze voorstudie, uitgevoerd tussen november 2010 en augstus 2011:• presenteert een overzicht van de meest urgente beleidsvragen en
de daarmee samenhangende wetenschappelijke onderwerpen,• geeft een overzicht van de belangrijkste variabelen die nodig
zijn om de fysische, chemische en biologische eigenschappen van de kombergingen in de waddenzee te beschrijven,
• beoordeelt de kwaliteit en beschikbaarheid van bestaande gegevens, verzameld of georganiseerd binnen de belangrijkste monitoringsprogramma’s in de waddenzee,
• stelt methodologie voor aan de hand waarvan vergelijkingen gemaakt kunnen worden.
wetenschappers en andere experts in Nederland, Duitsland en Denemarken zijn geïnterviewd om inzicht te verkrijgen in de relevantie en haalbaarheid om kombergingen onderling te vergelijken op basis van diverse kenmerken. het vergelijken van kombergingen werd als zeer nuttig beschouwd voor verschillende beleids- en wetenschappelijke vragen. Een (digitale) atlas met daarin algemene informatie over kombergingen werd als vorm voorgesteld.
De belangrijkste beleids- en wetenschappelijke vragen waarvoor de beoogde aanpak nuttig zou zijn, werden ook met de experts besproken. Naast de experts, werden de literatuur, en databases
geraadpleegd om een overzicht te verkrijgen van beschikbare data om de geïdentificeerde beleidsvragen te kunnen beantwoorden.
De belangrijkste beleidsvragen hebben betrekking op:• klimaatverandering en zeespiegelstijging,• biodiversiteit en de effecten van de aanwezigheid van exoten,• de effecten van menselijk gebruik,• ecosysteem functies en diensten.
Dit rapport presenteert verschillende nationale en internationale monitoringsprogramma’s en initiatieven die voor de samen stelling van de atlas gebruikt kunnen worden. Verschillende harmonisatie-initiatieven (o.a. met betrekking tot bathymetrie, mosselbedden, vissen en vogels) hebben dataproducten opgeleverd die zeer geschikt zijn om kombergingen onderling te vergelijken.
Er zijn substantiële verschillen in de datadichtheid tussen kom-bergingen geconstateerd. Met name kleinere kombergingen zijn onder vertegen woordigd in monitoringsprogramma’s. De belang rijkste dataleemtes betreffen menselijk gebruik, schat-tingen van primaire productie en sediment budgetten. het is vaak onduidelijk onder welke voorwaarden gegevens beschik-baar zijn voor algemeen gebruik.
In dit rapport worden verschillende kaarten met parameters op het niveau van kombergingen gepresenteerd. om in geïdentificeerde dataleemtes te voorzien, wordt voorgesteld om gebruik te maken van kombergingstypen die representatief zijn voor andere kombergingen waar weinig of geen informatie voor beschikbaar is. Verder wordt voorgesteld om gebruik te maken van gegevens verkregen via remote sensing en van modellen voor het vergelijken van kombergingen en het opvullen van de leemtes. De grootste investering in de ontwikkeling van een atlas is het verzamelen van gegevens uit verschillende bronnen en deze op vergelijkbaarheid te toetsen, en, indien nodig vergelijkbaar te maken.
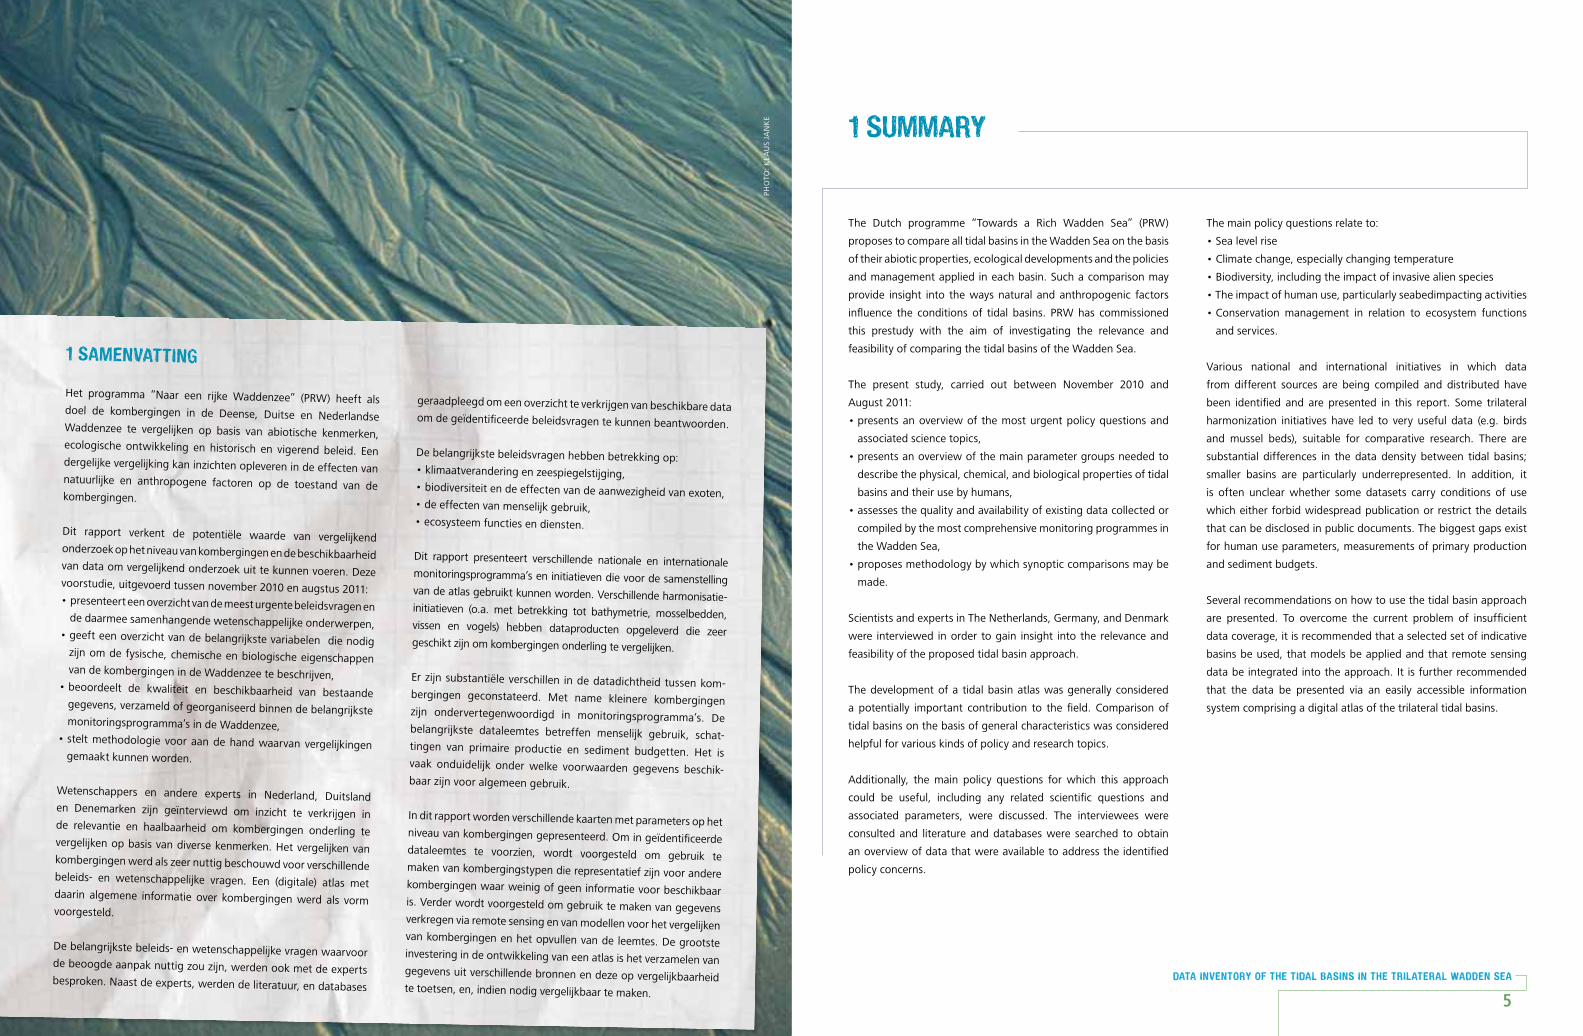
1 samenvatting
1 summary
Pho
to:
KlA
us
jAN
KE
2.1Background
starting point for this pre-study is the proposal from the Dutch
programme “towards a Rich wadden sea” (PRw) to compare all
the tidal basins in the wadden sea on the basis of their abiotic
properties, ecological development and applied policy and
management. For instance, herman et al. (2009) plead for a focus
on large-scale comparative and integrative research. A comparison
on the level of tidal basins may provide insight into how natural and
anthropogenic factors influence the wadden sea. this knowledge
may contribute to sustainable governance and management of the
wadden sea ecosystem.
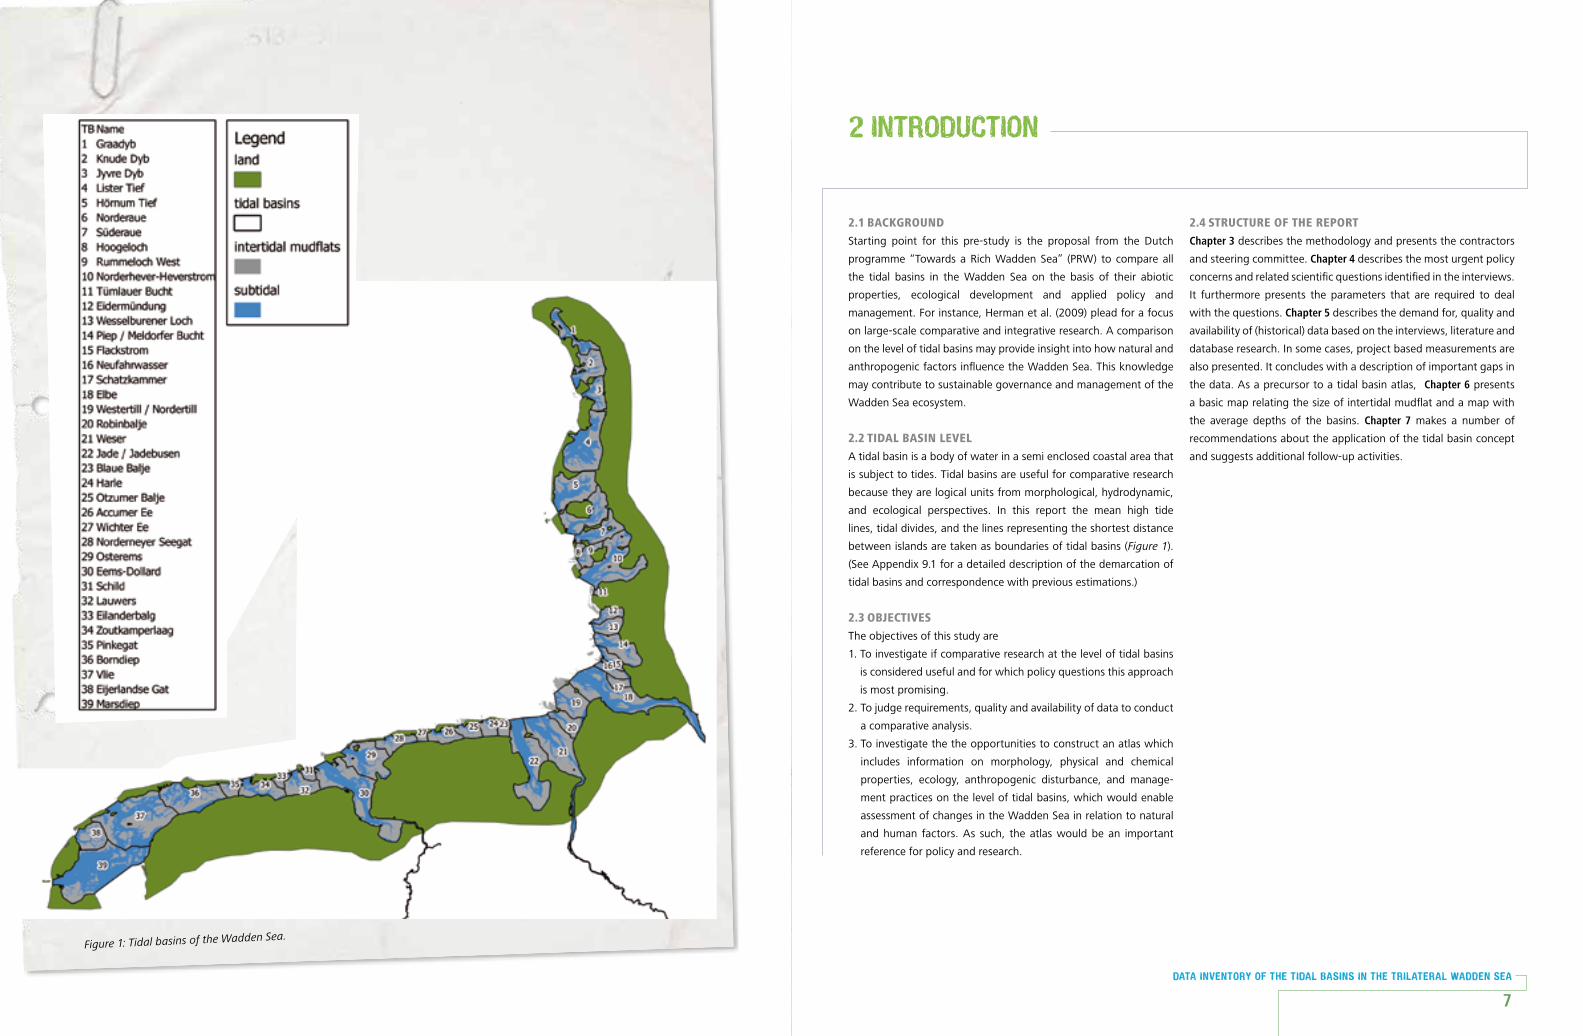
2.2TidalBasinlevel
A tidal basin is a body of water in a semi enclosed coastal area that
is subject to tides. tidal basins are useful for comparative research
because they are logical units from morphological, hydrodynamic,
and ecological perspectives. In this report the mean high tide
lines, tidal divides, and the lines representing the shortest distance
between islands are taken as boundaries of tidal basins (Figure1).
(see Appendix 9.1 for a detailed description of the demarcation of
tidal basins and correspondence with previous estimations.)
2.3oBjecTives
the objectives of this study are
1. to investigate if comparative research at the level of tidal basins
is considered useful and for which policy questions this approach
is most promising.
2. to judge requirements, quality and availability of data to conduct
a comparative analysis.
3. to investigate the the opportunities to construct an atlas which
includes information on morphology, physical and chemical
properties, ecology, anthropogenic disturbance, and manage-
ment practices on the level of tidal basins, which would enable
assessment of changes in the wadden sea in relation to natural
and human factors. As such, the atlas would be an important
reference for policy and research.
2.4sTrucTureofThereporT
Chapter 3 describes the methodology and presents the contractors
and steering committee. Chapter 4 describes the most urgent policy
concerns and related scientific questions identified in the interviews.
It furthermore presents the parameters that are required to deal
with the questions. Chapter 5 describes the demand for, quality and
availability of (historical) data based on the interviews, literature and
database research. In some cases, project based measurements are
also presented. It concludes with a description of important gaps in
the data. As a precursor to a tidal basin atlas, Chapter 6 presents
a basic map relating the size of intertidal mudflat and a map with
the average depths of the basins. Chapter 7 makes a number of
recommendations about the application of the tidal basin concept
and suggests additional follow-up activities.
2 introduction
data inventory of the tidal basins in the trilateral Wadden sea
7
Programma naar een rijke Waddenzee
6
Figure1:TidalbasinsoftheWaddenSea.

voortgangsraPPort 2010
8
3.1conTracTorsandsTeeringcommiTTee
contractors of this study were ecologists from Germany and the
Netherlands.
• Dietmar Kraft, hwK (D), wIMo
• jürgen Meyerdirks, IcBM – university of oldenburg (D)
• thorsten stiehl, IcBM – university of oldenburg (D)
• Eelke Folmer (Nl), (Ecospace and NIoZ, Royal Netherlands
Institute for sea Research)
Dietmar Kraft, jürgen Meyerdirks and thorsten stiehl interviewed
German experts and compiled the information from German and
Danish projects and databases. Eelke Folmer compiled information
from the Netherlands and interviewed Dutch experts.
the study was supervised by a steering committee consisting of:
• justus van Beusekom, AwI sylt (D)
• Norbert Dankers, IMAREs (Nl)
• Morten Pejrup, university of copenhagen (DK) with the support
of Bruno Ens (soVoN, Nl) and Katja Philippart (NIoZ, Nl).
overall coordination: Folkert de jong (PRw, cwss).
3.2informaTionsources
Various sources of information were considered and the following
steps were taken to meet the objectives (2.3):
1. Workshops and interviews were conducted with 44 academic
scientists, policy makers and one consultant from 12 different
institutes to identify the most important current and future
policy concerns, related research topics and associated
parameters. the experts were asked which data would be
required to evaluate the main questions and to comment on
methodological issues.
2. Current monitoring programmes, datasets and scientific programmes
were screened by means of literature and database research.
3. a quick scan was made of the relevant research projects and
related literature to find out whether these projects produced
data on the scale of tidal basins that could be of use for
comparative research. to curb the amount of information, the
authors limited their research to projects not older than ten
years.
3 methods
Programma naar een rijke Waddenzee
8
data inventory of the tidal basins in the trilateral Wadden sea
9

voortgangsraPPort 2010
10
this chapter presents the main policy and
management questions identified in the interviews
and from literature, together with related scientific
questions and required parameters. the chapter
furthermore provides some insight into how the tidal
basin approach might help to identify important
causes of differences and change. It should be
noted that there may be overlap between scientific
questions and required parameters between the
different policy concerns.
4.1 sea level rise and sea floor subsi dence
Policy question: Will the Wadden Sea drown with the predictedaccelerationinsealevelriseandseafloorsubsidence?
there is general concern and much uncertainty about the impact
of sea level rise and sea floor subsidence on the morphology of the
wadden sea. In particular, it is not known to what extent mudflats
and barrier islands will be able to keep up with accelerating sea-
level rise. whether or not sea level rise will become a problem
depends on the actual rates of sea level rise and the rate of
sediment accretion. In order to mitigate sea level rise and sea
floor subsidence and to prevent coastal erosion, nourishments are
carried out. the morphological and ecological consequences of
nourishments are largely unknown.
4.1.1 scienTificTopic:WhaTisneededTopredicTThe
impacTsofsealevelrise?
to gain insight into the effects of sea level rise on the wadden
sea, geological, hydrodynamical and geomorphological processes
have to be understood and models should predict sediment fluxes
correctly. current sediment transport models, however, do not
predict the fluxes of sediment in the wadden sea accurately
on short time scales. It is therefore uncertain whether natural
sediment fluxes are sufficiently high to compensate for sea level
rise and sea floor subsidence in all tidal basins. It is therefore
important to know whether and to what degree sediment
nourishments can mitigate these effects. Differences in properties
between the tidal basins are relevant in this context (louters
and Gerritsen 1994), as is the role of bio-engineers. Also of high
relevance is the influence of large-scale physical activities such as
coastal protection constructions.
4.1.2 parameTersofmorphodynamics
Bathymetry is important because it describes an essential
aspect of the geomorphology and it is a central component of
geomorphological models. sediment transport results from
moving water (hydrodynamics). hence tidal range (the tide is the
driver of currents) and wave-climate (distribution of wave heights
and directions caused by wind) are important parameters for
predicting geomorphology. As the movement of sediment also
depends on shear stress, it is also important to know grain size
distribution. It should be noted that the above parameters have
profound direct or indirect impact on the presence and abundance
of most, if not all, species of benthos.
4.1.3 meThodologicalconcerns
A number of experts stressed the importance of extreme events
that shaped the morphology of the tidal basins – with large
differences from basin to basin. It is therefore important to have
accurate maps of extreme wind events. this is a challenging task
because these are difficult to interpolate spatially.
4 Policy concerns, scientific questions and required Parameters
Programma naar een rijke Waddenzee
10
data inventory of the tidal basins in the trilateral Wadden sea
11

4.2 human use
Policy question: What are the main anthropogenic disturbances andwhataretheirimpactsontheWaddenSeaecosystem?
scientific knowledge is important for developing sustainable
human use. however, identifying the main anthropogenic
drivers and their impacts is difficult due to the complexity of
the wadden sea system. there are several types of exploitation
and anthropogenic disturbances going on in the wadden sea.
Fisheries directly affect the biota and the food-web and several
types of fishery have an impact on the seafloor. Because of the
spatial extent and regular occurrence it can be seen as a chronic
impact. Mining of sand and shells affects the morphology of
the seafloor and may lead to increased turbidity of the water.
similarly, dredging and dumping of sediment is often thought to
have a profound impact on the ecosystem in that it influences
hydrology and increases the turbidity. In addition, pollutants from
human activities enter the system via rivers and the atmosphere.
4.2.1 scienceTopic:hoWisTurBidiTyofTheWaTer
columnaffecTedByhumanuse?
From a scientific and management point of view, there is strong
interest in the turbidity of the wadden sea. An important factor
is related to the hydrodynamic regime which is affected by dikes
(causing ‘coastal squeeze’) and dredging of channels which may
have led to increased turbidity. Measurements of turbidity and
silt-content in the Dutch wadden sea are poor because there is
high spatio-temporal variability due to tides and waves. these
constantly changing variants make it difficult to detect long-
term changes. the questions of whether the wadden sea has
become more turbid (and if so, where), and what contribution
anthropogenic disturbances have made, are open.
the turbidity level of the water is considered an important factor
in the restoration of seagrass meadows because of the high light
requirement of the different seagrass species. In the past it has
been particularly difficult to establish new seagrass meadows in
the Dutch wadden sea. Also other factors, such as hydrodynamic
conditions and morphological properties of the seabed
(consolidated vs. bioturbated), affect restoration. It should be
noted that seagrass stands may interfere with local hydrodynamic
conditions and thus indirectly affect the turbidity of the water.
4.2.2 scienceTopic:WhaTareTheimpacTsof
fisheriesonecosysTemfuncTioning?
there are various kinds of fisheries in the wadden sea. shrimp
fisheries are relatively important because there are many active
ships and their activities disturb the bottom which affects the
development the biological community including ecosystem
engineers. shrimp fisheries will also affect the food-web by
altering trophic interactions.
the effects of mussel cultivation on the structure and development
of the food-web is an open question. Furthermore, the impacts of
musselseed fisheries (bottom dredging) on the ecosystem is not
well known.
hand-cockle fisheries are expanding in scale but not much is
known about their impacts on the ecosystem. the quantities
fished and the extents of the fished areas are currently unknown.
4.3 biodiversity, climate change and neobiota
Policy questions: How and to what extent will climate change andneobiotaaffecttheecologyoftheWaddenSea?
Whatarepossiblemeasuresthatcanbetakentosustainbiodiversityandwhatistheireffectiveness?
sustaining the characteristic biodiversity of the wadden sea region
is a central objective of policy. Various factors, including climate
change and invasive species, may cause basic changes in ecosystem
functioning (e.g. fluxes between different trophic stages), species
distributions and overall biodiversity. Identification of the most
effective managerial measures to maintain or improve biodiversity
and resilience in relation to (inevitable) change is important.
4.3.1 scienceTopic:WhaTareThespaTio-Temporal
disTriBuTionpaTTernsofBioTaandWhaTare
Thedrivers?
In order to study how productivity and biodiversity are related to
environ mental factors and anthropogenic disturbance, it is important
to have an overview of the distribution of species, food-webs and
eco topes. Below, fundamental food-web dynamics, impact of
neobiota on native communities and the distribution of shorebirds
are presented as examples of topics related to biodiversity in the
wadden sea:
1. understanding species richness and population dynamics requires
basic understanding of the structure and the fluxes of energy
in food-webs. Estimation of fluxes from primary to secondary
producers requires knowledge of the densities and population
dynamics of zooplankton and macrozoobenthos. It is therefore
important to understand the diets of, and competitive interactions
between, secondary producers. Better understanding is required
Programma naar een rijke Waddenzee
12
data inventory of the tidal basins in the trilateral Wadden sea
13
Photo: Roos KENtIE
to predict future population dynamics among secondary
producers in response to changing conditions. to estimate fluxes
from secondary producers to top predators, a comparative analysis
of tidal basin density and dynamic levels could provide insight into
several important determinants of population densities.
2. the wadden sea has always been exposed to invasion by exotic
species but no evidence for the exclusion of native species has
been documented. however, invasive species like the Pacific
oyster (crassostrea gigas), razor clam (Ensis americanus), and –
currently expanding in range and density - the common slipper
shell (crepidula fornicata) are bound to have an impact on the
distribution of native species. Buschbaum (at the wadden-
academie symposium, 2010) suggests that the pathways
of establishment of neobiota and the impact on the native
community in one area may be indicative for the development
of populations of neobiota and the native community in other
areas. comparative research at the level of tidal basins may allow
identification of the impacts on species native to the ecosystem
under varying environmental conditions. Furthermore, the role
of artificial structures (seaports, marinas, navigation buoys,
offshore infrastructure, hard coastal defences, roads, canals,
cultural landscapes) as corridors requires analysis.
3. Despite a long history of research on population dynamics
and the diets of shorebirds in the Dutch wadden sea (van de
Kam et al. 2004, laursen et al. 2010), regional and temporal
distributions are still poorly understood. the trends in numbers
of several species of shorebirds vary widely between the three
countries (Ens et al. 2009). Questions as to which extent
differences in bird numbers and trends are due to natural
causes and management practices remain unanswered.
4.3.2 scienceTopic:WhaTpromoTesandWhaT
ThreaTensBiodiversiTyandresilience?
to understand how biodiversity (and related ecosystem
functioning) may be protected, basic ecological issues such as
the relationship between diversity and stability would need to
be addressed. while these are challenging kinds of topics, there
are ways in which comparative research may provide insights.
In particular, the properties of rich and resilient tidal basins
may be indicative of desirable conditions for other tidal basins.
likewise, the potential impact of an activity may be assessed by
investigating patterns of biodiversity in tidal basins where similar
activities have taken place.
4.3.3 scienceTopic:hoWdoesclimaTechange
affecTThemainecologicalprocesses?
the effects of climate change on the wadden sea ecosystem will
be related to changes in water temperature, sea level, rainfall,
wind and carbon dioxide levels (and thus ph). these changes
may cause shifts in habitats and species distributions (and food-
web structure); biological rates (e.g. metabolism, reproduction);
community level phenologies (Philippart et al. 2003)and thus
in overall ecosystem functioning (nutrient recycling, primary
production) (harley et al. 2006).
A key challenge is to identify the main biological processes that
will be affected by climate change and invasive species. one way
to address this question is by considering variations in biological
processes between the tidal basins.
4.3.4 parameTersofBiodiversiTy,climaTechange
andneoBioTa
the distributions and abundances of organisms (ranging from
plankton to mammals) are required in order to define biodiversity
and to describe communities. As populations and communities
fluctuate under natural conditions, long term ecological data are
required to asses systematic ecological changes in the wadden
sea ecosystem.
As mentioned above (4.1), climate change involves changes in
various climatological and related parameters. sea level, wind
and waves are important factors for the morphology of the
wadden sea. water temperature, rainfall, co2 concentrations
and associated variables (e.g. seawater acidity and salinity) are
important to ecosystem functioning. Independent of other
factors, such as human use, changing temperature ranges may
lead to different effects in different tidal basins.
4.4 ecosystem services
Policy question: Which are the most important ecosystem servicesprovidedbytheWaddenSea?
Ecosystem services are the multitude of benefits that natural
ecosystems supply to humankind. the following categories are
distinguished by the Millenium Ecosystem Assessment (MEA):
• provisioning services (e.g. food, water, minerals energy),
• regulating services (e.g. waste decomposition, carbon
sequestration, water purification, pest control),
• supporting services (e.g. nutrient cycling, seed dispersal) and
• cultural services (e.g. recreation, artistic and intellectual
inspiration) (costanza et al. 1997, de Groot et al. 2002).
Identifying the manifold functions that the wadden sea
ecosystem fulfils, and evaluating the weight of these services for
the users of the ecosystem, is one of the biggest challenges facing
politics and management, as well as the research community.
Examples of ecosystem services in the wadden sea are the coastal
defence function of marshes and mudflats, the production of
fish for fisheries, purification of water and sediment fixation.
other important values are related to recreation and cultural and
intellectual inspiration.
4.4.1 scienceTopic:WhaTareThevaluesofTheser-
vicesprovidedByTheecosysTem?
the services and uses of the wadden sea are complex and many
interactions have to be considered. Moreover, several of the
impacts are long lasting but may show up not only until quite
some time has elapsed. Valuation of ecosystem services is difficult
as it often requires monetarisation (expressing value in currency)
of natural and cultural goods for present and future generations.
the relevance of a trans-disciplinary approach, especially in the
context of management, was highlighted several times in the
interviews.
4.4.2 parameTersofecosysTemservices
Valuation of the services of the wadden sea region requires
identification of their main functions and of their dominant users.
For instance, the value of fish requires the demand by the current
and future demand for fish. Another important service is related to
coastal defence by mudflats and marshes. the main value of this
function may be calculated by considering the cost of replacing
this natural barrier by an artificial coastal defence infrastructure.
An important value of the wadden sea region is related to tourism
and leisure. Many visitors enjoy the natural and inspirational values
which lead to jobs in the tourist sector. Determining the value of a
tidal basin requires insight into how the intrinsic resources of the
basin enable biodiversity and ecosystem functions, and also how
they influence and facilitate human activity.
Programma naar een rijke Waddenzee
14
data inventory of the tidal basins in the trilateral Wadden sea
15

voortgangsraPPort 2010
16
Based on the policy questions, the related scientific
questions and the associated parameters, identified
in chapter 4, an investigation into the demand for, the
quality and the availability of data was undertaken.
Data sources and research programs were screened
and experts were asked for advice and opinion. the
focus was on relatively large (in terms of temporal
and spatial extent) monitoring programmes and
compilations of data. this implies that several site-
specific programmes and data have not or only partly
been considered.
Research institutes are spread over the three national states
and between various European authorities. there is substantial
variation in the spatial scale of the various projects, ranging from
small pilot-site-oriented case studies up to investigations covering
the whole North sea.
A large number of programs and databases were considered.
More than 40 projects, which represent the larger part of project-
organised coastal research of recent years have been examined.
A detailed review of all programmes, databases and projects was
beyond the scope of this pre-study. For an overview of monitoring
programs in the Dutch wadden sea we refer to smit et al. (2010).
section 5.1 presents an overview and section 5.2 provides more
detailed information on the monitoring programs and data while
section 5.3 describes the gaps.
5.1 overvieW: data demand, quality and availability
the ‘Data Demand’ gives an indication of the importance of a
variable for the research and management community. It is
based on how often it was mentioned during interviews and in
the literature. the ‘quality’ of data is related to the spatial and
temporal resolution and the precision and consistency by which
it is measured. It is, however, impossible to define ‘quality’
unambiguously because it depends on the way the data are used.
Data Availability characterises the accessibility of the data. It varied
widely between parameters. Accessing data via the internet is
sometimes difficult due to dead links, off-line databases and lack
of metadata (such as the position of the stations).
the parameters are grouped as in tMAP. It is worth noting that
no single programme covers all tidal basins. table 1 presents an
overview and the sources are described in detail in 5.2.
5 data
data inventory of the tidal basins in the trilateral Wadden sea
17
<Table1:Demand,qualityandavailabilityofkeyparameters.Sourcesrepresentthedominantdata-provider;boldtypehavebeencheckedin
detail,italicsmostlikelycontaininformationabouttheparameterbuthavenotbeencheckedindetail.Spatialcoveragegivesinformation
whetherdataareprovidedthroughoutthetidalbasinsorarerestrictedtosomelocations.Section5.2presentsfurtherinformation.
Parameter Group
Parameter nl d dk nl d dk nl d dk
General
bathymetry H l H M M A A A RWS BSH DMSA
hydrologyk M M H M M A,P A A RWSLit coAstdAt coAstdAt
sea water level H H l H H H P P A LmW BSHf tMAP
sedimentl H M H M A,P A RWS BSH
weather, climate H H l H H H P,A A A knmi, Cesar DwD dMi
land cover M H l H H H A A A clc clc clc
Physical
temperature H H l M H H P P,A P,A RWS bLmPd, tmaPe madS
salinity H H l M H H P P,A P,A RWS bLmPd, tmaPe madS
currents H M l M H H A,P A A hmCn, CoaStdat CoaStdat CoaStdat
waves H M l M H H A,P A A hmCn, CoaStdat Rag,CoaStdat CoaStdat
Chemical
chlorophyll H l M H l H P P RWS madS
nutrients H M H H M H P P P RWS, tmaP blMP, tmaP madS, tmaP
turbidity H l M H P P RWS, tmaP blMP, tmaP c
organic matter H M H M H P RWS, tmaP c c
pH H l H H P P RWS, tmaP blMP, tmaP c
oxygen H l l H H H P P P RWS, tmaP blMP, tmaP madS
toxinsb l M l H H P P P RWS, tmaP blMP, tmaP tmaP, madS
biologicalo
dolphins H M H H H P P P nioz, im, tmaP tmaP tmaP, madS
seals H l H H H P P P tmaP tmaP tmaP
birdsp H M H H P P P Sovon, RWS, tmaPe tmaP tmaP
fish H l H H l P P nioz, im, tmaPe vti, tmaP
macrophytes M l H H H tmaPe tmaP tMAP
macrozoobenthos H M H M P,A P P RWS, im, nioz tmaP madS
phytoplankton H M H M H P P P RWS BlMP madSa
microphytobenthos H l P zkoq
zooplankton H l P P zko aWi-sylt
neobiota H l H H H P P P tmaP tmaP tmaP
habitath
tidal areaj H H l H H H A A A tmaP tmaP tmaP
salt marshes H H l H H H A A A tmaP tmaP tmaP
dunes M H l H H H A A A tmaP tmaP tmaP
blue mussel beds H H l H H H A A A tmaP tmaP tmaP
seagrass beds H H l H H H A A A tmaP tmaP tmaP
human use
fishing H l M H M Mscattered scatteredn
dredging H H Mn
dumping H M ln
mining
(shells and sand)
M H Hn
availability
dem
and
qual
ity
effo
rt spatial coverage sources
a in total 144 stationsb water, sediment, bird eggs, flounder, bleu musseld probably available according to obtained parameter list;
not covered tBs 8,9,15,16,17,27g regional authorities responsible, data scattered and hard to obtain
h adopted from QsR 2004 and 2009j intertidal, sublittoral; including rivers and deltask including emersion time, tidal amplitude, tidal prism, residence time
l including sediment compostition, silt concentrations, organic material
o numbers and densitiesp high tide roost counts
lit literaturec probably add-on at all contaminants stationse tMAP: no information for sh/hh (tB 30-39), Data units off-line
f 5 stations in the German Bight onlyn use restricted by lawq only since recently one location in western Dutch wadden sea
A: Real dataP: Point measurements
h= highM= mediuml= low

5.2 data sources and measurement methodology
5.2.1 generalparameTers
5.2.1.1Bathymetry
the bathymetry of the wadden sea is important from various
perspectives. Rws determines the bathymetry of the Dutch
wadden sea. the Bsh provides some basic bathymetry models
for the German wadden sea. the Danish Maritime safety
Administration holds data for the Danish wadden sea. EMoDnet
provides a compilation of the bathymetries in a resolution of
approximately 300 × 300 m of the German and Danish wadden
sea in a web-GIs1 which may be downloaded free (Figure2).
the bathymetry of the Dutch wadden sea is determined every
six years by Rws. Data are freely available and Rws distributes
the data in ‘tiles’ which are constructed by interpolation. It takes
Rws six years to determine the bathymetry of the Dutch wadden
sea. A full bathymetry, therefore, does not represent a plain
cross-section. An additional complicating factor is that the way
the data is collected has changed, and therefore bathymetries
are incomparable over longer time periods. care should be taken
when temporal variation is analysed.
5.2.1.2Sediment
sediment properties of the seafloor are determined in various
Dutch programmes. No German or Danish programmes that
monitor sediment properties were encountered.
Rws (Mwtl program) provides data on grain size properties
from several locations in the Dutch wadden sea. the following
parameters are determined from the sediment samples: grain size
distribution, mass concentrations of organic carbon (in which
particles <63 µm are distinguished), concentration of metals, hcB,
hAK, PcBs, organotin, Bromine (Brominated flame retardant),
lutum, and organic content. It is not feasible to mention all
parameters and we refer to the website from which the DoNAR
database may be freely accessed2.
Grain size distribution is also determined in the macrofauna
monitoring program (also Mwtl) on several locations in the
wadden sea where they serve as covariates. these data are also
freely available but there is no online database from which the
data may be downloaded. ‘helpdesk water’ at Rws may provide
the data. In addition to the standard monitoring of grain size
distribution, measurements are made for more specific Rws
projects of which an overview is hard to obtain.
Between 1989 and 1997 large scale measurements of grain size
have been performed by Rws throughout the Dutch wadden sea.
the data have been collected in the ‘sediment atlas’ which may be
freely downloaded3.
In the yearly synoptic Intertidal Benthic surveys wadden sea
(sIBEs) monitoring program of the NIoZ, benthos and sediment
are sampled throughout the whole Dutch wadden sea (Aarts et
al. 2010). the primary goal of sIBEs is to measure the abundance,
composition and change of macrozoobenthos in response to
natural gas extraction. sediment samples are also collected in this
program. the program has been running since 2008. the sampling
stations are located on a rectangular grid with a distance of 500m
between the stations (Figure3). In earlier years, similar sampling
1 http://gis.eucc-d.de/waddengis_mapfish/index.htm2 http://www.rijkswaterstaat.nl/water/scheepvaartberichten_waterdata/historische_waterdata/waterbase/index.aspx
Via the openDAP server in the open Earth tools (oEt) developed at Deltares these data may be obtained effeciently.3 www.waddenzee.nl/sedimentatlas.729.0.html the sediment atlas comes with a viewer.
the data may also be accessed directly via dbf files and by means of a shapefile which contains information on the locations of the sampling points.
Figure2:BathymetryoftheWaddenSeaandpartofNorthSea.DataarecompiledbyEMODnetfromvarioussources.
Figure3:SpatialdistributionofsamplingstationsintheSIBES2008monitoringprogram(reproducedwithpermissionfromAartsetal.2010).
Programma naar een rijke Waddenzee
18
data inventory of the tidal basins in the trilateral Wadden sea
19
was performed by the NIoZ, but at a smaller scale (focus on
western wadden sea) and coarser resolution (Kraan et al. 2007).
In previous years sediment samples were obtained on a 1 km grid.
5.2.1.3Hydrology
water levels: In the governmental programme lMw, water levels
are measured continuously at several locations in the Dutch wadden
sea. lMw provides constant and up-to-date information about
water levels on the Dutch coast and further inland4. In Germany,
the Federal states are responsible for collecting hydrologically
important data, e.g. water levels and wave heights. to this end
they maintain a network of measuring units. Not all tidal basins are
covered. cosYNA is a noteworthy German model- and database
project that aims to deliver real-time data on currents, waves,
salinity, temperature, chlorophyll and oxygen for the North sea.
tidal prism, tidal amplitude, residence/turnover times, and outer
deltas: Estimates of these relatively constant parameters for the
Dutch tidal basins have been found in the literature. tidal prisms
and inward flood sand transport data are presented by louters
and Gerritsen (1994), turnover times by Ridderinkhof (1988) and
channel circumferences by cleveringa and oost (1999). AwI-sylt
maintains data on the hydrography of the sylt-Rømø Bight.
5.2.1.4Weatherandatmosphere
the KNMI, DwD and DMI collect basic weather data (temperature,
irradiation, cloud and visibility, air pressure, wind force and
direction and precipitation) at high temporal frequency. the
stations in the Dutch wadden sea area are located at: De Kooy,
Vlieland, hoorn (terschelling), leeuwarden, lauwersoog. Excerpts
from the KNMI5 and DwD data are available to the public via
websites. No declarations on Danish weather data can be made.
Precipitation is measured at 325 stations by the KNMI. (see the
website for an overview of the locations6.)
For the Dutch part of the wadden sea region, atmospheric
parameters are determined at the cesar observatory. the
measurements include wind, cloud, aerosols, greenhouse gases,
surface-level and elevated fluxes, hydrology and infrasound. In
addition, higher order products derived from the observational
data are available via a data portal7.
5.2.2 physicalandchemicalparameTers
5.2.2.1Watertemperature,salinity,suspendedmatter,
nutrients,turbidityandtoxins
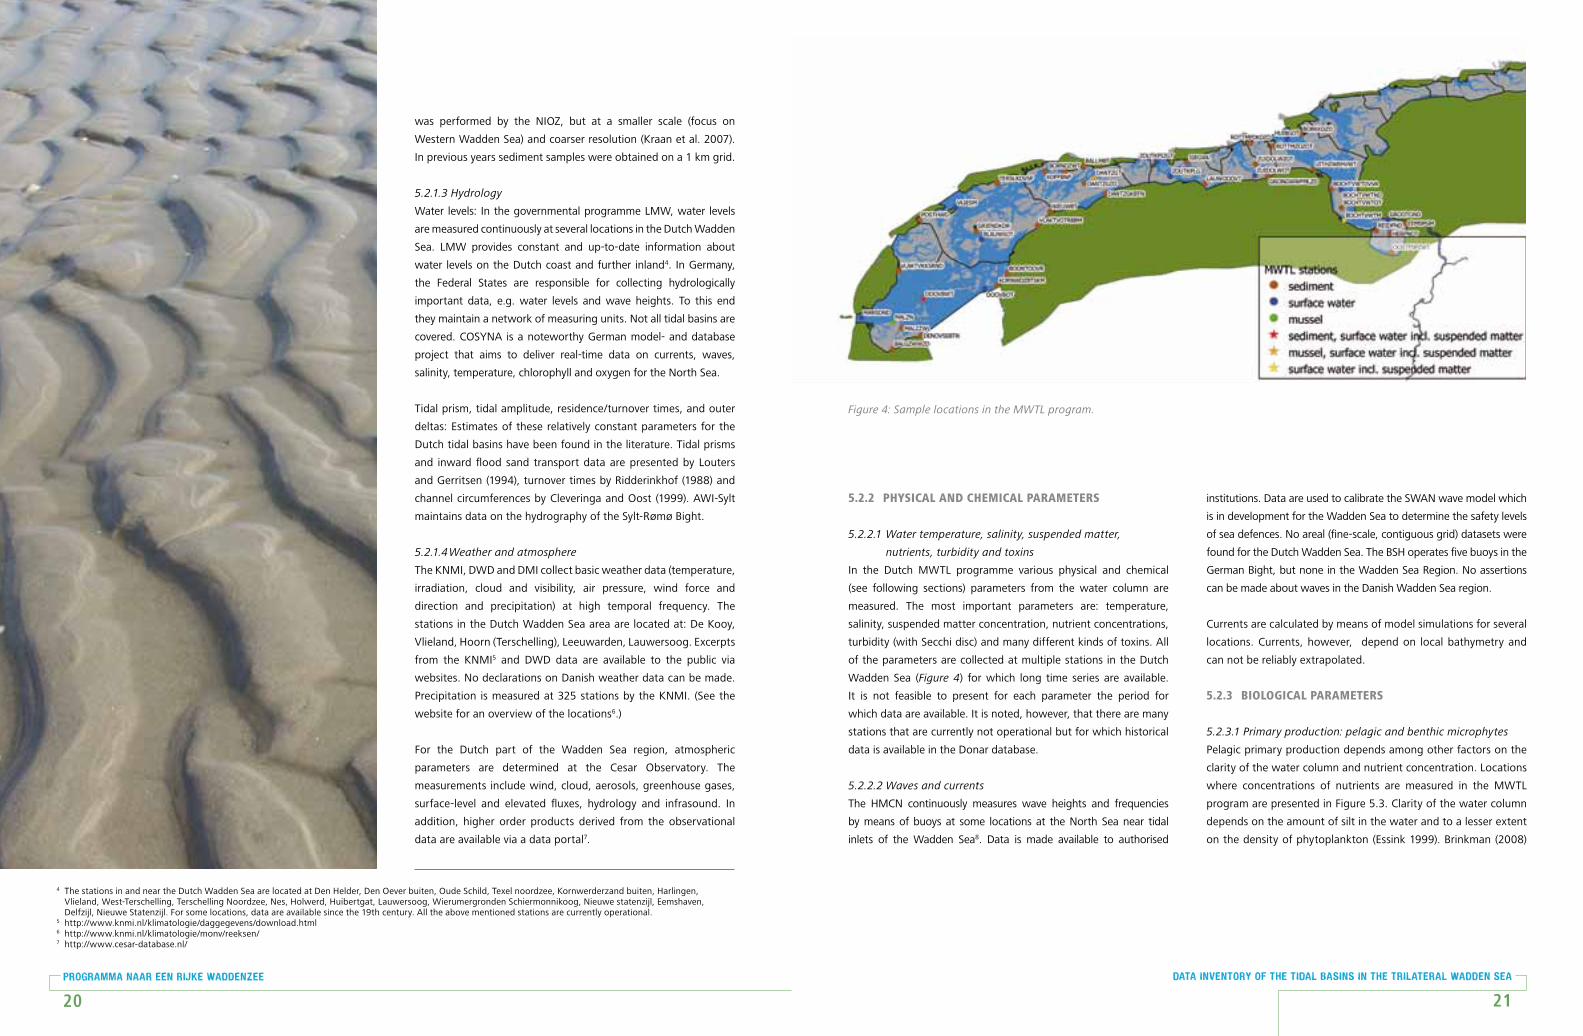
In the Dutch Mwtl programme various physical and chemical
(see following sections) parameters from the water column are
measured. the most important parameters are: temperature,
salinity, suspended matter concentration, nutrient concentrations,
turbidity (with secchi disc) and many different kinds of toxins. All
of the parameters are collected at multiple stations in the Dutch
wadden sea (Figure4) for which long time series are available.
It is not feasible to present for each parameter the period for
which data are available. It is noted, however, that there are many
stations that are currently not operational but for which historical
data is available in the Donar database.
5.2.2.2Wavesandcurrents
the hMcN continuously measures wave heights and frequencies
by means of buoys at some locations at the North sea near tidal
inlets of the wadden sea8. Data is made available to authorised
institutions. Data are used to calibrate the swAN wave model which
is in development for the wadden sea to determine the safety levels
of sea defences. No areal (fine-scale, contiguous grid) datasets were
found for the Dutch wadden sea. the Bsh operates five buoys in the
German Bight, but none in the wadden sea Region. No assertions
can be made about waves in the Danish wadden sea region.
currents are calculated by means of model simulations for several
locations. currents, however, depend on local bathymetry and
can not be reliably extrapolated.
5.2.3 BiologicalparameTers
5.2.3.1Primaryproduction:pelagicandbenthicmicrophytes
Pelagic primary production depends among other factors on the
clarity of the water column and nutrient concentration. locations
where concentrations of nutrients are measured in the Mwtl
program are presented in Figure 5.3. clarity of the water column
depends on the amount of silt in the water and to a lesser extent
on the density of phytoplankton (Essink 1999). Brinkman (2008)
4 the stations in and near the Dutch wadden sea are located at Den helder, Den oever buiten, oude schild, texel noordzee, Kornwerderzand buiten, harlingen, Vlieland, west-terschelling, terschelling Noordzee, Nes, holwerd, huibertgat, lauwersoog, wierumergronden schiermonnikoog, Nieuwe statenzijl, Eemshaven, Delfzijl, Nieuwe statenzijl. For some locations, data are available since the 19th century. All the above mentioned stations are currently operational.
5 http://www.knmi.nl/klimatologie/daggegevens/download.html6 http://www.knmi.nl/klimatologie/monv/reeksen/7 http://www.cesar-database.nl/
Figure4:SamplelocationsintheMWTLprogram.
Programma naar een rijke Waddenzee
20
data inventory of the tidal basins in the trilateral Wadden sea
21
presents an overview of nutrient and chlorophyll concentrations
for the western and the Eastern Dutch wadden sea between
1980 and 2005. salt marshes and fresh water represent sources
of nutrients and organic material. there is a lack of consistent
monitoring data of basic parameters such as nutrient and
chlorophyll concentrations and estimates of primary production
(herman et al. 2009). the ZKo programme addresses some of
these data gaps but the new measurements are currently not
planned for inclusion in standard monitoring programmes.
Phytoplankton concentrations in the Dutch wadden sea are
measured in the Mwtl programme. Additional measurements are
carried out by the NIoZ. the Marsdiep is well represented, while
data collection at other tidal basins, including the tidal basins in
the German and Danish parts of the wadden sea Region (except
tidal Basins 1, 22 and 28), are scarce or absent. AwI-sylt maintains
a high quality phytoplankton time-series.
Microphytobenthos concentration and production is not part of any
standard monitoring programme. however, in the ZKo programme
IN PlAcE, the NIoZ performs measurements at several locations in
the Marsdiep tidal basin by means of automated sensors.
5.2.3.2Macrozoobenthosandzooplankton
secondary production in the wadden sea is mainly in the
form of zooplankton and macrozoobenthos. there are several
macrozoobenthos monitoring programmes in the Dutch wadden
sea that vary in temporal and spatial scale.
long term: there are several long-term datasets in the Dutch
wadden sea: 1. Balgzand near Den helder (since 1968); 2. Groninger
wad near Noordpolderzijl (since 1969); 3. heringsplaat in the Dollard
(since 1977) and 4. Piet scheveplaat, south of Ameland (since 1978).
the series at Balgzand was initiated by the NIoZ and the other three
series were initiated by Rws. In 1989 Rws initiated a similar series
on three transects in the subtidal of the western Dutch wadden sea.
since 1991 all sampling is performed by the NIoZ except for the series
on the Groninger wad which is performed by Koeman and Bijkerk BV.
In the Mwtl program, all macrozoobenthos data are freely available.
largespatialscale: In 2008, the NIoZ (funding: NAM and Nwo
sea and coastal Research (ZKo)), initiated sIBEs (synoptic Intertidal
Benthic sampling) a benthic sampling program throughout
the whole intertidal zone of the Dutch wadden
sea (Aarts et al. 2010). NIoZ has performed similar
sampling in several years before the sIBEs program started (Kraan
et al. 2007). the spatial scale was smaller during those previous
years.
IMAREs performs shellfish surveys in the Dutch wadden sea once
a year. samples are mainly collected along transects throughout
the entire Dutch wadden sea. when high densities of cockles are
expected, the local sampling intensity may be increased.
Zooplankton: AwI-sylt maintains the only time series on
zooplankton in the wadden sea. Zooplankton is not included in
any monitoring program in the Netherlands. Recently, in the ZKo
program some work has been initiated in two tidal basins in the
western Dutch wadden sea.
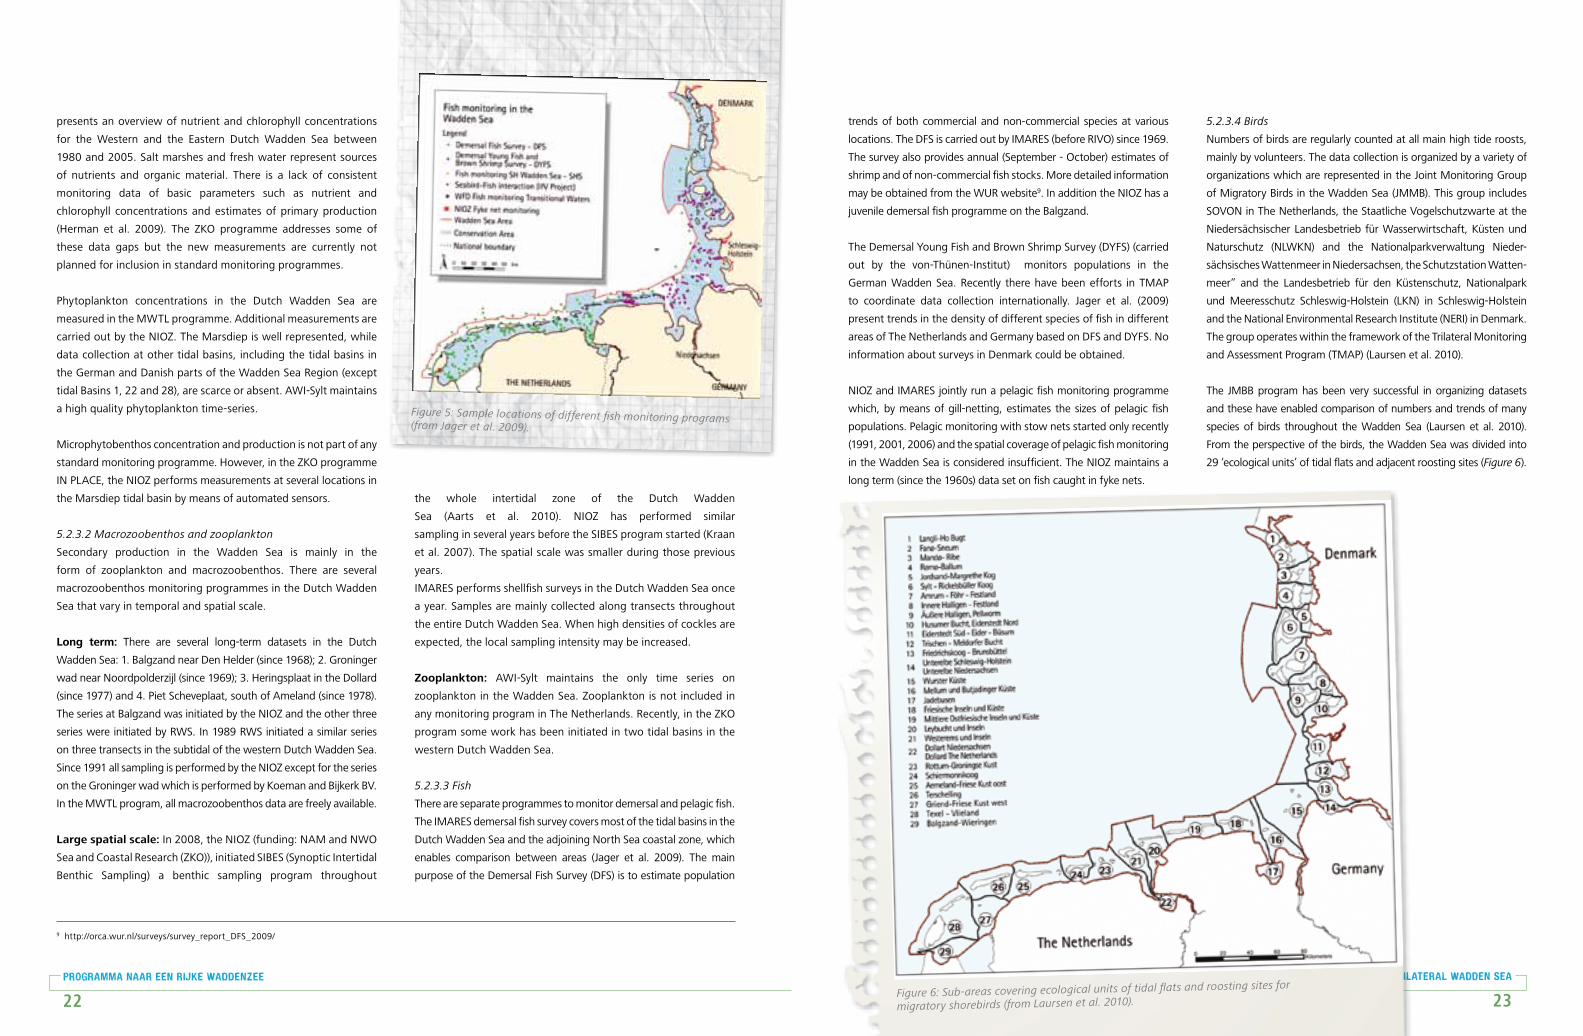
5.2.3.3Fish
there are separate programmes to monitor demersal and pelagic fish.
the IMAREs demersal fish survey covers most of the tidal basins in the
Dutch wadden sea and the adjoining North sea coastal zone, which
enables comparison between areas (jager et al. 2009). the main
purpose of the Demersal Fish survey (DFs) is to estimate population
9 http://orca.wur.nl/surveys/survey_report_DFs_2009/
Figure5:Samplelocationsofdifferentfishmonitoringprograms(fromJageretal.2009).
Programma naar een rijke Waddenzee
22
data inventory of the tidal basins in the trilateral Wadden sea
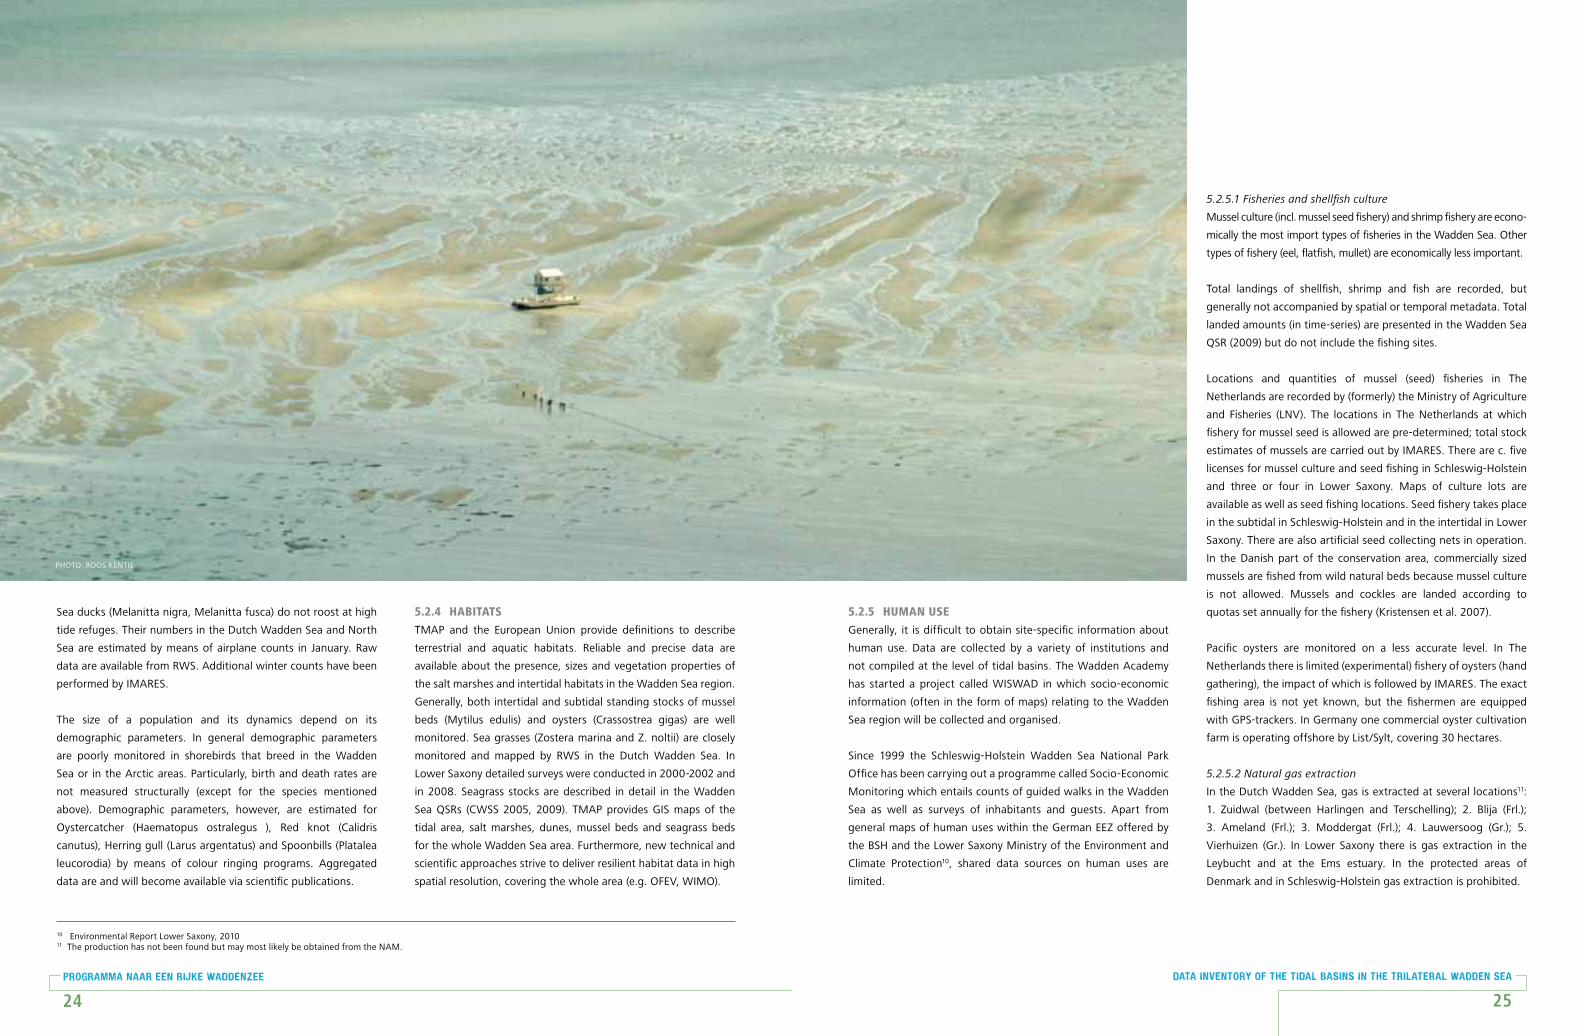
23Figure6:Sub-areascoveringecologicalunitsoftidalflatsandroostingsitesfor
migratoryshorebirds(fromLaursenetal.2010).
trends of both commercial and non-commercial species at various
locations. the DFs is carried out by IMAREs (before RIVo) since 1969.
the survey also provides annual (september - october) estimates of
shrimp and of non-commercial fish stocks. More detailed information
may be obtained from the wuR website9. In addition the NIoZ has a
juvenile demersal fish programme on the Balgzand.
the Demersal Young Fish and Brown shrimp survey (DYFs) (carried
out by the von-thünen-Institut) monitors populations in the
German wadden sea. Recently there have been efforts in tMAP
to coordinate data collection internationally. jager et al. (2009)
present trends in the density of different species of fish in different
areas of the Netherlands and Germany based on DFs and DYFs. No
information about surveys in Denmark could be obtained.
NIoZ and IMAREs jointly run a pelagic fish monitoring programme
which, by means of gill-netting, estimates the sizes of pelagic fish
populations. Pelagic monitoring with stow nets started only recently
(1991, 2001, 2006) and the spatial coverage of pelagic fish monitoring
in the wadden sea is considered insufficient. the NIoZ maintains a
long term (since the 1960s) data set on fish caught in fyke nets.
5.2.3.4Birds
Numbers of birds are regularly counted at all main high tide roosts,
mainly by volunteers. the data collection is organized by a variety of
organizations which are represented in the joint Monitoring Group
of Migratory Birds in the wadden sea (jMMB). this group includes
soVoN in the Netherlands, the staatliche Vogelschutzwarte at the
Niedersächsischer landesbetrieb für wasserwirtschaft, Küsten und
Naturschutz (NlwKN) and the Nationalparkverwaltung Nieder-
sächsisches wattenmeer in Niedersachsen, the schutzstation watten-
meer” and the landesbetrieb für den Küstenschutz, Nationalpark
und Meeresschutz schleswig-holstein (lKN) in schleswig- holstein
and the National Environmental Research Institute (NERI) in Denmark.
the group operates within the framework of the trilateral Monitoring
and Assessment Program (tMAP) (laursen et al. 2010).
the jMBB program has been very successful in organizing datasets
and these have enabled comparison of numbers and trends of many
species of birds throughout the wadden sea (laursen et al. 2010).
From the perspective of the birds, the wadden sea was divided into
29 ‘ecological units’ of tidal flats and adjacent roosting sites (Figure6).
sea ducks (Melanitta nigra, Melanitta fusca) do not roost at high
tide refuges. their numbers in the Dutch wadden sea and North
sea are estimated by means of airplane counts in january. Raw
data are available from Rws. Additional winter counts have been
performed by IMAREs.
the size of a population and its dynamics depend on its
demographic parameters. In general demographic parameters
are poorly monitored in shorebirds that breed in the wadden
sea or in the Arctic areas. Particularly, birth and death rates are
not measured structurally (except for the species mentioned
above). Demographic parameters, however, are estimated for
oystercatcher (haematopus ostralegus ), Red knot (calidris
canutus), herring gull (larus argentatus) and spoonbills (Platalea
leucorodia) by means of colour ringing programs. Aggregated
data are and will become available via scientific publications.
5.2.4 haBiTaTs
tMAP and the European union provide definitions to describe
terrestrial and aquatic habitats. Reliable and precise data are
available about the presence, sizes and vegetation properties of
the salt marshes and intertidal habitats in the wadden sea region.
Generally, both intertidal and subtidal standing stocks of mussel
beds (Mytilus edulis) and oysters (crassostrea gigas) are well
monitored. sea grasses (Zostera marina and Z. noltii) are closely
monitored and mapped by Rws in the Dutch wadden sea. In
lower saxony detailed surveys were conducted in 2000-2002 and
in 2008. seagrass stocks are described in detail in the wadden
sea QsRs (cwss 2005, 2009). tMAP provides GIs maps of the
tidal area, salt marshes, dunes, mussel beds and seagrass beds
for the whole wadden sea area. Furthermore, new technical and
scientific approaches strive to deliver resilient habitat data in high
spatial resolution, covering the whole area (e.g. oFEV, wIMo).
5.2.5 humanuse
Generally, it is difficult to obtain site-specific information about
human use. Data are collected by a variety of institutions and
not compiled at the level of tidal basins. the wadden Academy
has started a project called wIswAD in which socio-economic
information (often in the form of maps) relating to the wadden
sea region will be collected and organised.
since 1999 the schleswig-holstein wadden sea National Park
office has been carrying out a programme called socio-Economic
Monitoring which entails counts of guided walks in the wadden
sea as well as surveys of inhabitants and guests. Apart from
general maps of human uses within the German EEZ offered by
the Bsh and the lower saxony Ministry of the Environment and
climate Protection10, shared data sources on human uses are
limited.
5.2.5.1Fisheriesandshellfishculture
Mussel culture (incl. mussel seed fishery) and shrimp fishery are econo-
mically the most import types of fisheries in the wadden sea. other
types of fishery (eel, flatfish, mullet) are economically less important.
total landings of shellfish, shrimp and fish are recorded, but
generally not accompanied by spatial or temporal metadata. total
landed amounts (in time-series) are presented in the wadden sea
QsR (2009) but do not include the fishing sites.
locations and quantities of mussel (seed) fisheries in the
Netherlands are recorded by (formerly) the Ministry of Agriculture
and Fisheries (lNV). the locations in the Netherlands at which
fishery for mussel seed is allowed are pre-determined; total stock
estimates of mussels are carried out by IMAREs. there are c. five
licenses for mussel culture and seed fishing in schleswig-holstein
and three or four in lower saxony. Maps of culture lots are
available as well as seed fishing locations. seed fishery takes place
in the subtidal in schleswig-holstein and in the intertidal in lower
saxony. there are also artificial seed collecting nets in operation.
In the Danish part of the conservation area, commercially sized
mussels are fished from wild natural beds because mussel culture
is not allowed. Mussels and cockles are landed according to
quotas set annually for the fishery (Kristensen et al. 2007).
Pacific oysters are monitored on a less accurate level. In the
Netherlands there is limited (experimental) fishery of oysters (hand
gathering), the impact of which is followed by IMAREs. the exact
fishing area is not yet known, but the fishermen are equipped
with GPs-trackers. In Germany one commercial oyster cultivation
farm is operating offshore by list/sylt, covering 30 hectares.
5.2.5.2Naturalgasextraction
In the Dutch wadden sea, gas is extracted at several locations11:
1. Zuidwal (between harlingen and terschelling); 2. Blija (Frl.);
3. Ameland (Frl.); 3. Moddergat (Frl.); 4. lauwersoog (Gr.); 5.
Vierhuizen (Gr.). In lower saxony there is gas extraction in the
leybucht and at the Ems estuary. In the protected areas of
Denmark and in schleswig-holstein gas extraction is prohibited.
10 Environmental Report lower saxony, 201011 the production has not been found but may most likely be obtained from the NAM.
Programma naar een rijke Waddenzee
24
data inventory of the tidal basins in the trilateral Wadden sea
25
Photo: Roos KENtIE

10 Environmental Report lower saxony, 201011 the production has not been found but may most likely be obtained from the NAM.
5.2.5.3Shellandsandmining
A short overview about policies and practice regarding dredging and
extraction of shells and sand is given in the wadden sea QsR 2009.
total amounts of shells (max. 90.000 m3 per year) and sand extracted
in the Netherlands are published by INtERwAD (data collection by
Rws). however, shell extraction is not allowed in tidal basins 1-4, 5-29
and 32, 34, 36, 37 and 39. sand extraction in the wadden sea region
is only permitted in relation to the regular maintenance of shipping
lanes, except in the national park area of schleswig-holstein, where
sand extraction for coastal protection purposes is allowed.
5.2.5.4Dredginganddumping
Dredging and dumping of sediment is generally poorly documented.
Ports do record the amounts that are dredged but not where the
sediments are dumped. In the Netherlands, Rws may possibly
become a source of the needed data. In Germany, the Federal
Institute of hydrology (BfG) is the body responsible for maintaining
the waterways. the Koodinationsstelle Baggergut, together with
the wsA should hold the amounts dredged and the dumping
sites. In general this data is not, so far, accessible. An overview is
presented in the wadden sea QsR (2009) and the osPAR QsR 2010.
the amounts of dredged and dumped material in the wadden sea
region are included, as well as the dumping sites.
5.2.5.5Recreation
the wadden sea QsR (cwss 2009) contains an overview of
tourism and recreation, covering overnight stays, touristic
demands and mudflat hiking. the number of passengers on ferries
is well known but not easy to obtain (ferry companies generally
don’t share their information, except tEso (transport to Den
helder, published yearly). Municipalities have information on the
capacity and use of ports.
5.3 data gaPs and solutionstable 1 (page 16) shows gaps between demand and avail-
ability of data. this section briefly discusses some of the most
important gaps.
5.3.1 generalparameTers
Existing bathymetries provide cross-sections (snapshots) of a
highly dynamic system. whether the data are useful to compare
tidal basins depends strongly on the underlying question. to find
out whether mudflats grow with a rising sea level, regular high
quality measurements of depths in the gullies and of mudflats
(lIDAR) are required. Research projects like wIMo work on this
issue intensively.
hydrodynamic parameters are important for most purposes.
Areal (fine-scale, contiguous grid) estimates of waves and
currents are generally lacking because measurements are taken
at point locations. there are, however, various programmes
that will fill these gaps in the future (e.g. cosYNA).
5.3.2 physicalparameTers
Most of the physical parameters are measured at various
locations throughout the wadden sea but areal data are rare.
Point measurements are not commonly interpolated to cover
the whole region. Atmospheric data is an exception to this rule.
combinations of statistical, mechanistic modelling and remote
sensing provide a way to extend the point measurements to
obtain areal estimates. For various cases it has to be realized
that central tendencies (means, medians) may not be relevant
to describe the dynamics in the wadden sea. comparison of
multiple long-term series from different types of tidal basins
may provide insight in how long term dynamics depend on
properties of the tidal basins.
5.3.3 chemicalparameTers
oxygen, chlorophyll and nutrient concentrations of the water
column are important indicators of various biological processes.
they are currently measured at distinct point locations in many
of the tidal basins. the temporal frequency in the Mwtl
program is once a month which is too low for many important
ecological questions. salt marshes, rivers and creeks are some
of the important sources of nutrients and organic material and
estimates of fluxes cannot be made due to a lack of areal data.
the demand for areal data of these parameters is high. Despite
the shortcomings in current data, a ‘simple’ trophic categorisation
of the tidal basins based on these data would be welcomed by
all concerned.
high quality data on silt-content and turbidity of the water
are lacking. Measured values are strongly dependent on local
hydrodynamics. currently, these variables are measured at
several (few) fixed stations at different moments during the tidal
cycle. therefore these data are not suitable to detect long-term
trends in turbidity and silt-content.
5.3.4 BiologicalparameTers
when it comes to biotic presence and abundance data, ‘more is
better’. however, some gaps are considered more severe than
others.
1. Zooplankton are important secondary consumers. however,
at present no data on zooplankton (species composition
and densities) are collected such that they can be used for
comparative research of tidal basins.
2. Phytoplankton and microphytobenthos are difficult to measure
on large spatio-temporal scales which makes it difficult to
compare tidal basins. Remote sensing in combination with in
situ measurements are available and in development to estimate
chlorophyll content or biomass (and species composition) to
obtain estimates at larger scales (e.g. INPlAcE).
3. Dolphins (particularly harbour purpoise, Phocoena phocoena)
are too rarely observed so that systematic monitoring and
reliable analyses are currently not possible.
5.3.5 humanuse
the most obvious data gaps concerned various aspects of
human use.
• total catches of shrimp are recorded but not how much
was caught where. Furthermore, data are hard to obtain. In
general the data situation is better for mussels.
• Dredging of channels and related changes in erosion/
sedimen tation processes are not recorded well, so that their
effects on the system are impossible to investigate.
Programma naar een rijke Waddenzee
26
data inventory of the tidal basins in the trilateral Wadden sea
27
Pho
to:
Ro
os
KEN
tIE

voortgangsraPPort 2010
28
the previous chapter illustrates that some of the tidal
basins are intensively studied and monitored while
other basins receive considerably less attention. some
interviewees stressed that it would be useful to classify
tidal basins according to their basic characteristics.
Knowing the basic characteristics of the tidal basins
might enable identification of a number of typical
tidal basins which may be exemplars for other, less
monitored, tidal basins.
6.1 morPhology, barrier islands and inlet Width
some basic morphological characteristics are size (volume or area
(see Ridderinkhof 1988), presence of barrier islands, amount of
intertidal mudflat, width of inlets, presence of rivers and tidal
amplitude. tidal basin 10 – 22 (Figure7) for example lack barrier
islands and may be expected to function differently than more
sheltered basins.
Figure7 presents an example of how tidal basins may be classified
on the basis of their location, size and width of inlet. Four
main groups are distinguished inFigure7: 1. estuaries (large and
riverine input, relatively small proportion of intertidal mudflats),
2. large tidal basins (no riverine input), 3. medium tidal basins (high
tidal range and open inlets), 4. small tidal basins.
Various other kinds of typification are possible. the next section
provides examples of other characteristics which may be useful to
describe and classify tidal basins.
6 tyPology of tidal basins
Programma naar een rijke Waddenzee
28
Figure7:TypificationofthetidalbasinsoftheWaddenSea,accordingtosize,widthofinletandgeneralcharacter.
data inventory of the tidal basins in the trilateral Wadden sea
29
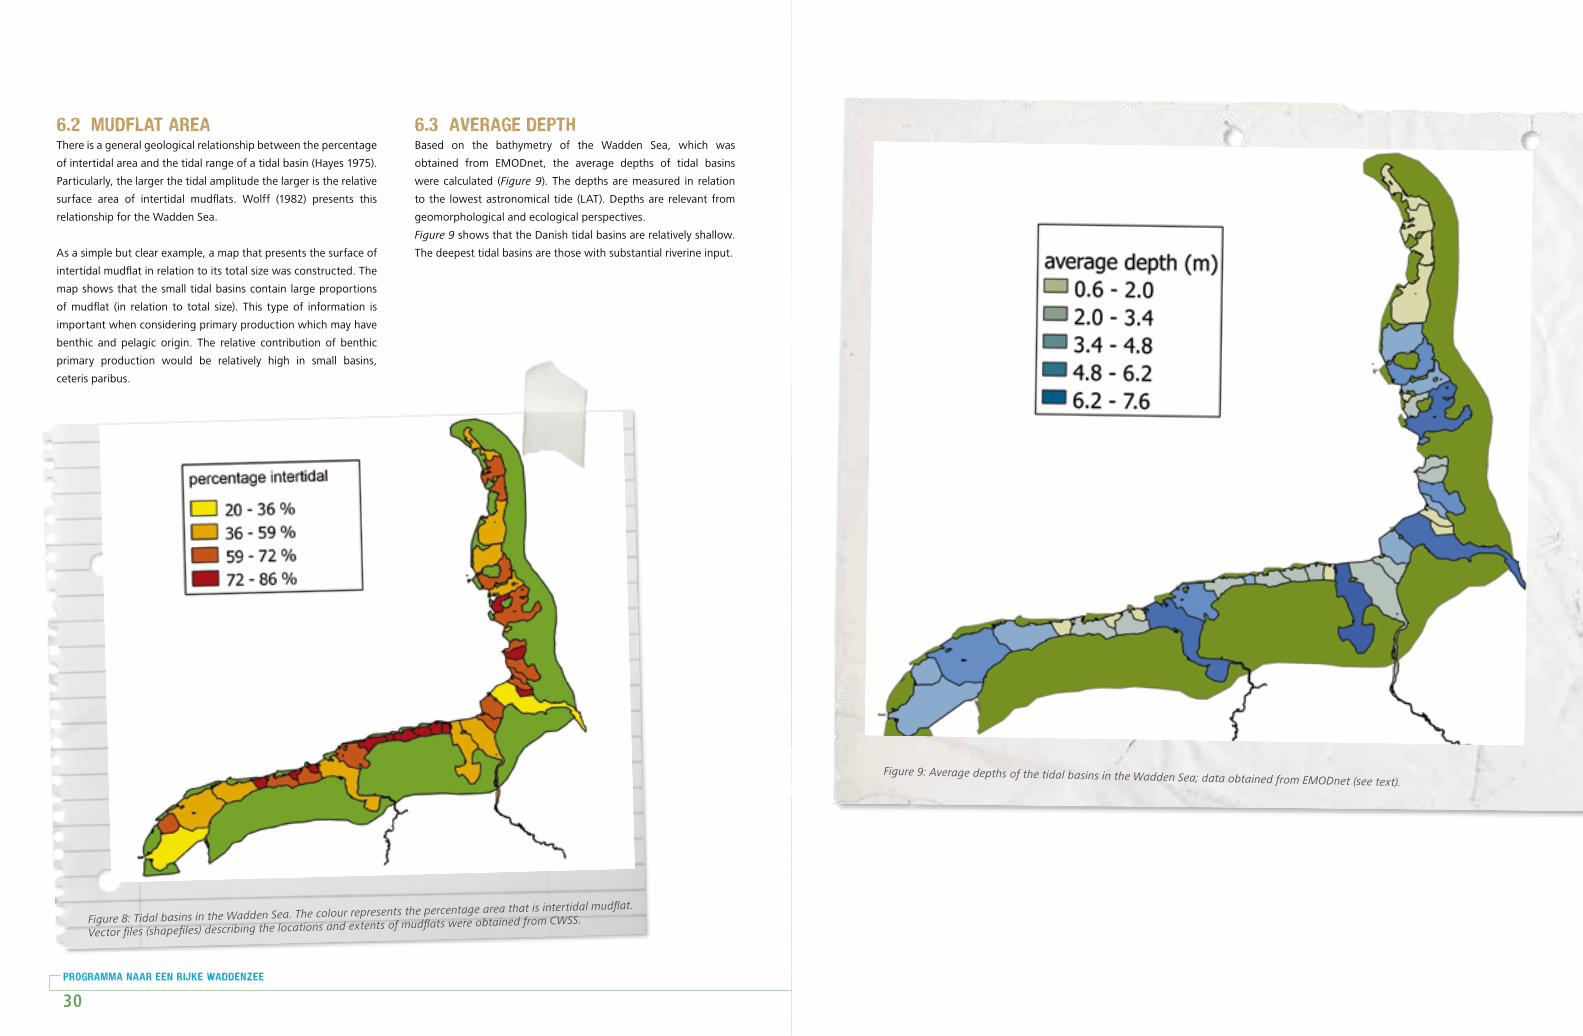
6.2 mudflat areathere is a general geological relationship between the percentage
of intertidal area and the tidal range of a tidal basin (hayes 1975).
Particularly, the larger the tidal amplitude the larger is the relative
surface area of intertidal mudflats. wolff (1982) presents this
relationship for the wadden sea.
As a simple but clear example, a map that presents the surface of
intertidal mudflat in relation to its total size was constructed. the
map shows that the small tidal basins contain large proportions
of mudflat (in relation to total size). this type of information is
important when considering primary production which may have
benthic and pelagic origin. the relative contribution of benthic
primary production would be relatively high in small basins,
ceteris paribus.
6.3 average dePthBased on the bathymetry of the wadden sea, which was
obtained from EMoDnet, the average depths of tidal basins
were calculated (Figure9). the depths are measured in relation
to the lowest astronomical tide (lAt). Depths are relevant from
geomorphological and ecological perspectives.
Figure9 shows that the Danish tidal basins are relatively shallow.
the deepest tidal basins are those with substantial riverine input.
Figure8:TidalbasinsintheWaddenSea.Thecolourrepresentsthepercentageareathatisintertidalmudflat.
Vectorfiles(shapefiles)describingthelocationsandextentsofmudflatswereobtainedfromCWSS.
Programma naar een rijke Waddenzee
30
data inventory of the tidal basins in the trilateral Wadden sea
31
Figure9:AveragedepthsofthetidalbasinsintheWaddenSea;dataobtainedfromEMODnet(seetext).
voortgangsraPPort 2010
32
the ‘tidal basin approach’ was generally considered promising
and feasible and the inventory was considered a useful
undertaking. there is large demand for GIs maps that describe
basic characteristics of the wadden sea with data summaries
(e.g. population sizes and trends). A lot of information is (digitally)
available and is suitable for a comparative approach .
the forms of data and information encountered originated from
a large variety of monitoring programs and projects. Many of the
datasets were collected using a variety of spatial and temporal
scales. the investment needed to harmonize data from various
sources to enable meaningful comparisons is large. this might
explain why comparisons at the level of tidal basins are rare. In
recent years, however, a trend towards more integrated monitoring
and trilateral collaboration is developing. Another difficulty relates
to the availability of data. collecting data from online sources
can be a frustrating task. In particular, data will often have to be
collected bit by bit, data-platforms may be off-line, metadata is
often lacking and restrictive legal rights have been encountered.
the workload related to obtaining and harmonizing data should
not be underestimated.
some harmonization efforts and data provide information that is
particularly useful. For instance, the jMBB program for migratory
birds has been extremely successful in comparing trends of many
species of birds throughout the wadden sea (laursen et al. 2010).
It has turned out to be difficult to underpin the causes of change
in populations in relation to natural variation and management.
Better investigation into the causes of change would be possible if
more information at the level of tidal basins was available.
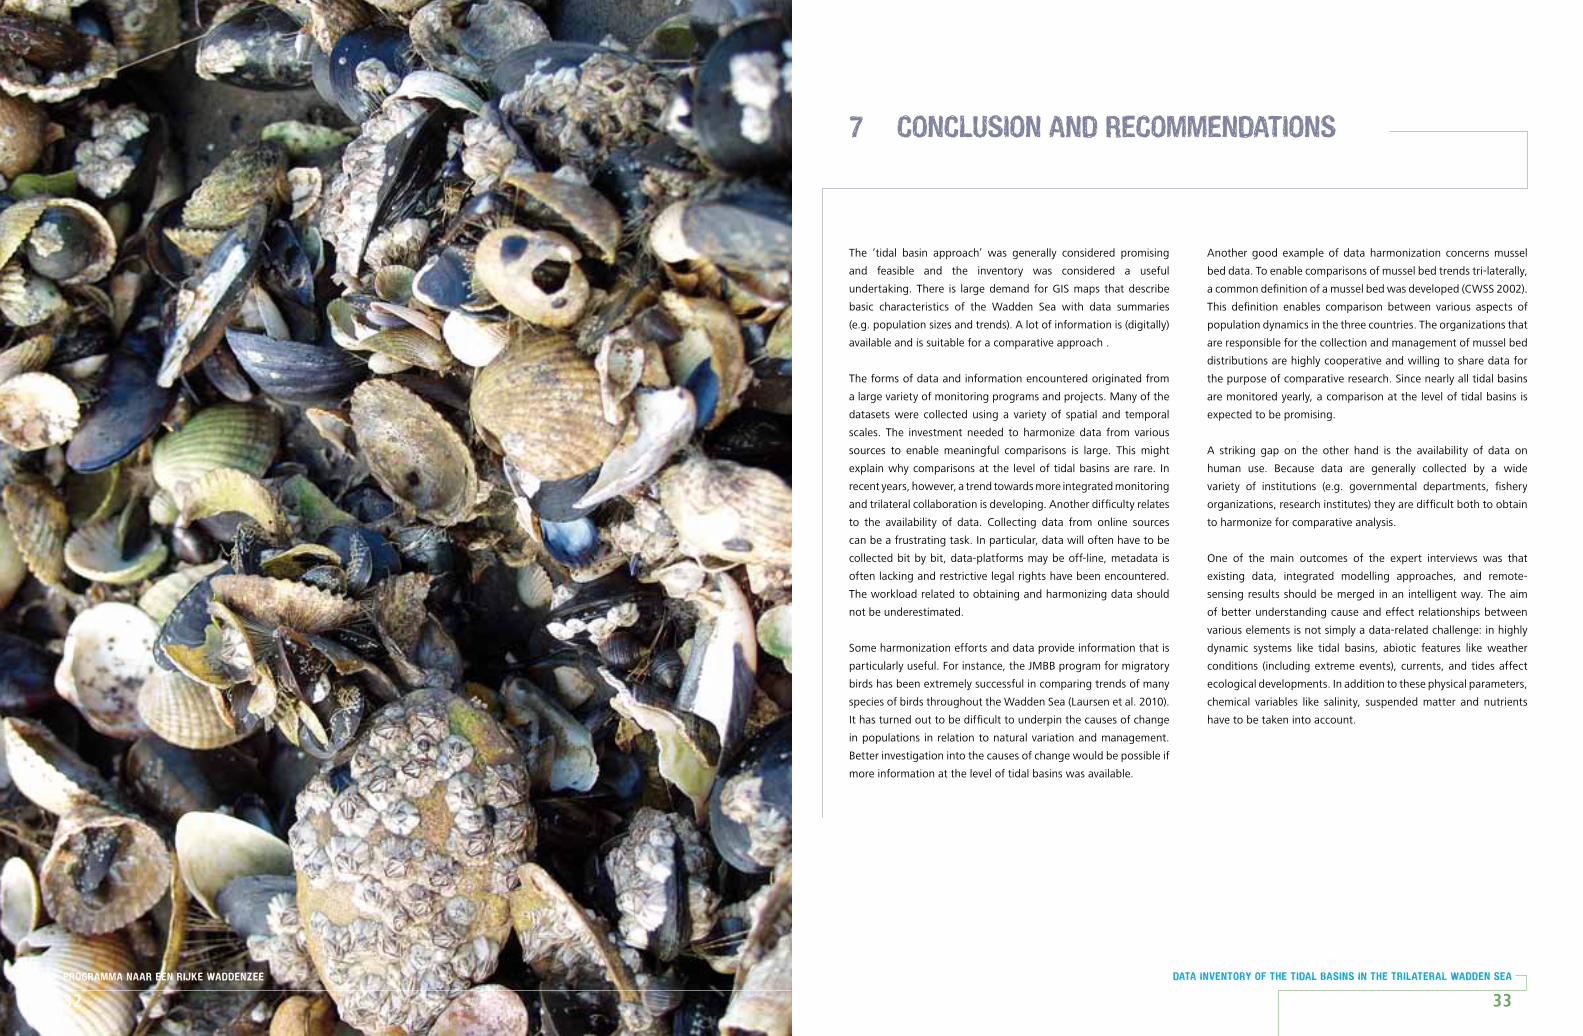
Another good example of data harmonization concerns mussel
bed data. to enable comparisons of mussel bed trends tri-laterally,
a common definition of a mussel bed was developed (cwss 2002).
this definition enables comparison between various aspects of
population dynamics in the three countries. the organizations that
are responsible for the collection and management of mussel bed
distributions are highly cooperative and willing to share data for
the purpose of comparative research. since nearly all tidal basins
are monitored yearly, a comparison at the level of tidal basins is
expected to be promising.
A striking gap on the other hand is the availability of data on
human use. Because data are generally collected by a wide
variety of institutions (e.g. governmental departments, fishery
organizations, research institutes) they are difficult both to obtain
to harmonize for comparative analysis.
one of the main outcomes of the expert interviews was that
existing data, integrated modelling approaches, and remote-
sensing results should be merged in an intelligent way. the aim
of better understanding cause and effect relationships between
various elements is not simply a data-related challenge: in highly
dynamic systems like tidal basins, abiotic features like weather
conditions (including extreme events), currents, and tides affect
ecological developments. In addition to these physical parameters,
chemical variables like salinity, suspended matter and nutrients
have to be taken into account.
7 conclusion and recommendations
Programma naar een rijke Waddenzee
32
data inventory of the tidal basins in the trilateral Wadden sea
33

Programma naar een rijke Waddenzee
35
toWards a tidal basin atlasthe largest investment to construct a tidal basin is related to the
collection and quality control of data for the purpose of tidal-
basin-level comparisons. the most efficient and safest way is by
involving experts in the process. It turned out that many of the
experts in particular fields have much knowledge about many
of the programs and data-availability and the possibilities and
limitations for comparative research.
morphologicalTypologyandhaBiTaTs
Development of basic maps which provide a description of the
main morphological characteristics of the 39 tidal basins would
be sensible. In this report, as a first step, a base-map describing
the borders of tidal-basins was constructed. the map was used
to illustrate the simple relationship between size and mudflat
area and the average depth of tidal basins. In a similar way, other
(summaries of) variables may be related to the tidal basins.
prioriTizaTionofparameTers
table 1 provides insight into the feasibility (effort, quality of data)
of constructing data products (means, trends, maps) to be included
in the atlas. From the perspective of availability of data some of
the most promising parameters are related to geomorphology
and water levels, biota (e.g. mussel beds and birds).
It was noted that areal data of chemical (chlorophyll and oxygen)
and physical (temperature) variables are hardly available and
that they are limited to point measurements. In this respect an
inventory of remotely sensed data would be important because
this type of data may be suitable for inclusion in the atlas.
meThodologicaldevelopmenTs
Geographical Information systems and computer models can
project and extrapolate point measurements into wider spatial
and temporal scales, including hind casting and forecasts. Experts
have frequently emphasised the importance of integrating data,
models (including GIs) and remote sensing. these types of
systems (e.g. cosYNA) will provide (real-time) data that are highly
relevant for tidal-basin level comparisons. these developments
are best developed for hydrological parameters such as currents
and waves, which are the main drivers of the morphodynamic
development.
Various chemical parameters can be estimated by means of
remote-sensing at the surface and gauges may be used to obtain
measurements at larger depths. Investigating the value of oxygen
as a proxy for nutrients – or, rather, for eutrophication – in
combination with sensors and models is an overarching theme
in wIMo.
Most projects, especially the recent ones, work on large scales
using remote sensing and modelling approaches (e.g. MARcoAst,
coAstcolouR). Because these types of projects are relatively
new, data are typically not available to the public.
plaTformTodisTriBuTeinformaTionandmaps
to share the maps and information among users, a sophisticated
interactive platform is needed. It would include an inventory
of existing data, facts and statistics for further reference and
analysis as well as information on management issues (plans) and
expected developments (scenarios). the platform should provide
links to metadata about the owner or provider of the data or
any information offering a direct link to the sources (o’Dea et al.
2007). the platform could provide a way to discuss the existence
and quality of data by users.
Programma naar een rijke Waddenzee
34
data inventory of the tidal basins in the trilateral Wadden sea
35

• Aarts, G., A. Dekinga, s. holthuijsen, j. ten horn, j. smith, c.
Kraan, M. Brugge, A. Bijleveld, t. Piersma, and h. van der Veer.
2010. Benthic macro fauna in relation to natural gas extraction in
the DutchWadden sea. NIoZ Royal Netherlands Institute for sea
Research, texel.
• Brinkman, A. G. 2008. Nutrient- en chlorofylgehaltes in het
westelijke en oostelijke deel van de Nederlandse Waddenzee;
waarden en trends tussen 1980 en 2005 en mogelijke oorzaken
daarvan. IMAREs. Retrieved November 30, 2010, from http://
library.wur.nl/webQuery/wurpubs/379115.
• cleveringa, j., and A. P. oost. 1999. the fractal geometry of tidal-
channel systems in the Dutch Wadden sea. Geologie en Mijnbouw
78:21–30.
• costanza, R., R. d’ Arge, R. de Groot, s. Farber, M. Grasso, B.
hannon, K. limburg, s. Naeem, R. V. o’Neill, j. Paruelo, R. G.
Raskin, P. sutton, and M. van den Belt. 1997. the value of the
world’s ecosystem services and natural capital. Nature 387:253-
260. doi: 10.1038/387253a0.
• cwss. 2002. Blue Mussel Monitoring. report of the second tmaP
Blue mussel Workshop on ameland, 8-10 April 2002. common
wadden sea secretariat, wilhelmshaven, Germany.
• cwss. 2005. Wadden sea Quality status report 2004. cwss,
wilhelmshaven, Germany.
• cwss. 2009. Wadden sea Quality status report 2009. cwss,
wilhelmshaven, Germany.
• Ens, B.j., j. Blew, M. w. j. van Roomen, and c. A. M. Van turnhout.
2009. Exploring Contrasting trends of migratory Waterbirds in
the Wadden sea. trilateral Monitoring and Assessment Group,
joint Monitoring Group of Migratory Birds in the wadden sea,
common wadden sea secretariat, wilhelmshaven, Germany.
• Essink, K. 1999. Ecological effects of dumping of dredged
sediments; options for management. journal of coastal
conservation 5:69-80. doi: 10.1007/BF02802741.
• de Groot, R. s., M. A. wilson, and R. M. j. Boumans. 2002.
a typology for the classification, description and valuation of
ecosystem functions, goods and services. Ecological Economics
41:393-408. doi: 16/s0921-8009(02)00089-7.
• harley, c. D. G., A. Randall hughes, K. M. hultgren, B. G. Miner,
c. j. B. sorte, c. s. thornber, l. F. Rodriguez, l. tomanek, and
s. l. williams. 2006. the impacts of climate change in coastal
marine systems. Ecology letters 9:228-241. doi: 10.1111/j.1461-
0248.2005.00871.x.
• herman, P., V. N. de jonge, N. Dankers, B. j. Ens, w. j. wolff, A.
G. Brinkman, M. j. Baptist, M. A. van leeuwe, j. P. Bakker, c. j.
M. Philippart, j. Kromkamp, j. van Beusekom, M. van Katwijk, t.
Piersma, h. w. Van der Veer, E. j. lammerts, A. P. oost, j. Van
Der Meer, h. lindeboom, h. olff, and G. jansen. 2009. (Natuur)
behoud in een veranderende wereld. waddenacademie.
8 literature
• jager, Z., l. j. Bolle, A. Dänhardt, B. Diederichs, t. Neudecker,
j. scholle, and R. Vorberg. 2009. fish. cwss, wilhelmshaven,
Germany.
• van de Kam, j., B. Ens, t. Piersma, and l. Zwarts. 2004.
shorebirds: an illustrated Behavioural Ecology. KNNV Publishers,
utrecht.
• Kraan, c., A. Dekinga, E. o. Folmer, h. w. Veer, and t. Piersma.
2007. macrobenthic fauna on intertidal mudflats in the Dutch
Wadden sea: species abundances, biomass and distributions in
2004 and 2006. NIoZ, texel.
• Kristensen, P. s., K. Geitner, P. sandbeck, and R. Borgstrøm.
2007. report of the Working Group on marine habitat mapping
(wgmhm): annex 6: mapping of Exploited Danish Bivalve stocks.
Page 129. IcEs, woods hole, usA.
• laursen, K., j. Blew, K. Eskildsen, K. Gunther, B. halterlein, R.
Kleefstra, G. luersen, P. Potel, and s. schrader. 2010. migratory
Waterbirds in the Wadden sea. cwss, wilhelmshaven, Germany.
• louters, t., and F. Gerritsen. 1994. het mysterie van de wadden;
hoe een getijde systeem inspeelt op de zeespiegelstijging. Page
69. Rijkswaterstaat RIKZ, lelystad.
• o’Dea, l., E. Dwyer, V. cummins, and D. j. wright. 2007.
Potentials and limitations of Coastal Web atlases: Outcomes of a
transatlantic Coastal mapping Workshop.
• Philippart, c. j. M., h. M. van Aken, j. j. Beukema, oscar G.
Bos, G. c. cadée, and R. Dekker. 2003. Climate-related Changes
in recruitment of the Bivalve macoma balthica. limnology and
oceanography 48:2171-2185. Retrieved August 22, 2011.
• Ridderinkhof, h. 1988. tidal and residual flows in the Western
Dutch Wadden sea. 1. Numerical-Model Results. Netherlands
journal of sea Research 22:1-21.
• smit, c. j., o. G Bos, and E. h. w. G. Meesters. 2010. monitoring
van biologische en abiotische parameters in zoute wateren in
Nederland. IMAREs, texel.
• wolff, w. 1982. Wadden, duinen, delta. centrum voor
landbouwpublikaties en landbouwdocumentatie, wageningen.
Programma naar een rijke Waddenzee
36
data inventory of the tidal basins in the trilateral Wadden sea
37
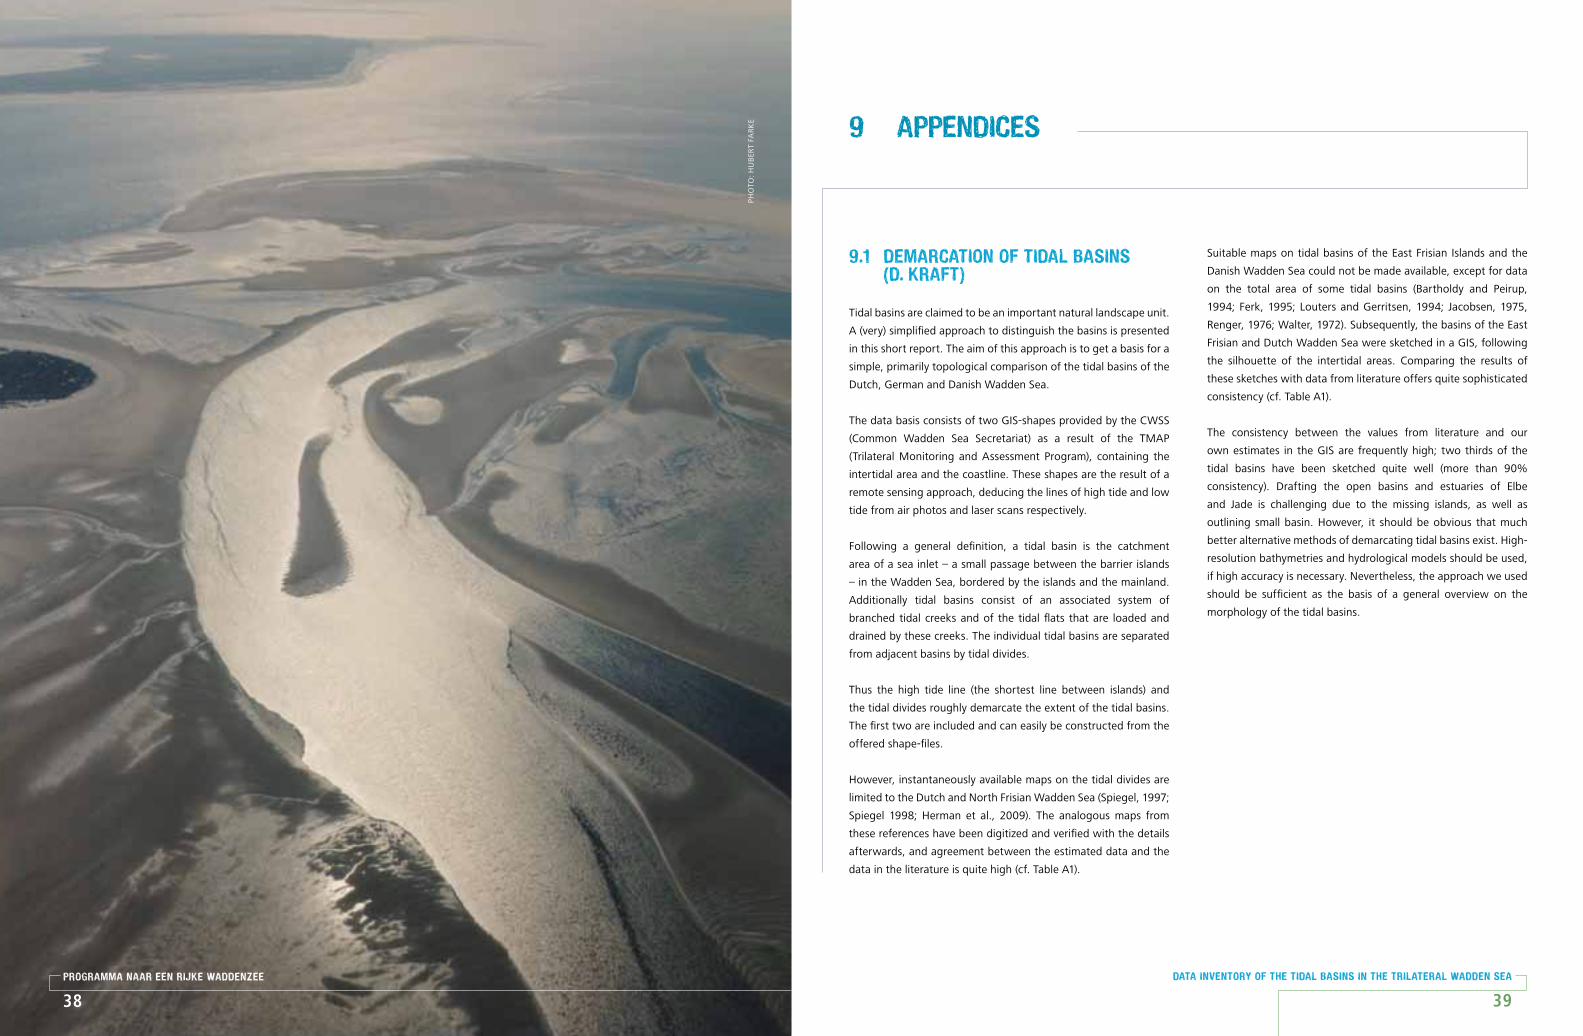
jaarraPPortage 2010
38
9.1 demarcation of tidal basins (d. kraft)
tidal basins are claimed to be an important natural landscape unit.
A (very) simplified approach to distinguish the basins is presented
in this short report. the aim of this approach is to get a basis for a
simple, primarily topological comparison of the tidal basins of the
Dutch, German and Danish wadden sea.
the data basis consists of two GIs-shapes provided by the cwss
(common wadden sea secretariat) as a result of the tMAP
(trilateral Monitoring and Assessment Program), containing the
intertidal area and the coastline. these shapes are the result of a
remote sensing approach, deducing the lines of high tide and low
tide from air photos and laser scans respectively.
Following a general definition, a tidal basin is the catchment
area of a sea inlet – a small passage between the barrier islands
– in the wadden sea, bordered by the islands and the mainland.
Additionally tidal basins consist of an associated system of
branched tidal creeks and of the tidal flats that are loaded and
drained by these creeks. the individual tidal basins are separated
from adjacent basins by tidal divides.
thus the high tide line (the shortest line between islands) and
the tidal divides roughly demarcate the extent of the tidal basins.
the first two are included and can easily be constructed from the
offered shape-files.
however, instantaneously available maps on the tidal divides are
limited to the Dutch and North Frisian wadden sea (spiegel, 1997;
spiegel 1998; herman et al., 2009). the analogous maps from
these references have been digitized and verified with the details
afterwards, and agreement between the estimated data and the
data in the literature is quite high (cf. table A1).
suitable maps on tidal basins of the East Frisian Islands and the
Danish wadden sea could not be made available, except for data
on the total area of some tidal basins (Bartholdy and Peirup,
1994; Ferk, 1995; louters and Gerritsen, 1994; jacobsen, 1975,
Renger, 1976; walter, 1972). subsequently, the basins of the East
Frisian and Dutch wadden sea were sketched in a GIs, following
the silhouette of the intertidal areas. comparing the results of
these sketches with data from literature offers quite sophisticated
consistency (cf. table A1).
the consistency between the values from literature and our
own estimates in the GIs are frequently high; two thirds of the
tidal basins have been sketched quite well (more than 90%
consistency). Drafting the open basins and estuaries of Elbe
and jade is challenging due to the missing islands, as well as
outlining small basin. however, it should be obvious that much
better alternative methods of demarcating tidal basins exist. high-
resolution bathymetries and hydrological models should be used,
if high accuracy is necessary. Nevertheless, the approach we used
should be sufficient as the basis of a general overview on the
morphology of the tidal basins.
9 aPPendices
Programma naar een rijke Waddenzee
38
data inventory of the tidal basins in the trilateral Wadden sea
39
Pho
to:
hu
BER
t FA
RK
E

Bartholdy, j & Pejrup, M (1994): holocene evolution of the
Danish Wadden sea , senchenbergina Maritima , vol 24,
no. 1/6, pp. 187-209.
Ferk, u. (1995): folgen eines beschleunigten meeresspiegelanstiegs
für die Wattengebiete der niedersächsischen Nordseeküste. - Die
Küste, 57: 136-156.
spiegel, F. (1997): Die tidebecken des schleswig-hol steinischen
Wattenmeeres: morphologische strukturen und anpassungsbedarf
bei weiter steigendem meeresspiegel.
- Ber. Forsch.- u. technol. Zentr. westküste univ. Kiel, 14: 255 s.,
Büsum.
spiegel, F. (1998): Volumina von tidebecken im
nordfriesischen Wattenmeer. In: umweltbundesamt und
Nationalparkverwaltungen Niedersächsisches wattenmeer/
schleswig-holsteinisches wattenmeer (hrsg.): umweltatlas
wattenmeer. Bd. 1: Nordfriesisches und Dithmarsches
wattenmeer. Eugen ulmer, stuttgart 1998/1999, IsBN
3800134918, s. 46–47.
herman, P., V.N. De jonge, N. Dankers, B.j. Ens, w.j. wolff, A.G.
Brinkman, M.j. Baptist, M. van leeuwe, j. Bakker, c.j. Philippart,
j. Kromkamp, j. van Beusekom, M. van Katwijk, t. Piersma,
h.w. van der Veer, E. lammerts, A. oost, j. van der Meer, h.
lindeboom, h. olff, and G. jansen (2009): (Natuur) behoud in een
veranderende wereld. Waddenacademie.
jacobsen, N. K. (1975): Zoneringsmodel for Det danske Vadehav
med henblik på etablering af en dansk naturpark tipperne -
skallingen – Vadehavet Geografisk tidsskrift, Bind 74
louters, t. & Gerritsen, F. (1994): the riddle of the sands: a tidal
system’s answer to a rising sea level. -, Rep. RIKZ. 94.040: 69 s.
Minist. transp. and Publ. works and water Management
Renger, E. (1976): Quantitative analyse der morphologie von
Watteinzugsgebieten und tidebecken, In: Mittelungen des
Franzius-Instituts für wasserbau und Küsteningenieurwesen
der universität hannover (43), 1-160.
walter, F. (1972): Zusammenhänge zwischen der Größe der
ostfriesischen seegaten mit ihren Wattgebieten sowie den Gezeiten
und strömungen, In: jber. Forschungsstelle Küste (23), 7-32. 1932
Programma naar een rijke Waddenzee
40
data inventory of the tidal basins in the trilateral Wadden sea
41
TableA1:Comparisonoftheestimatedareasizeswithvaluesfromtheliterature.
tidal Basin, total area (km2) Accordingreferenc
own estimate consistency(* >90%)
References
1. Graadyb 125,00 133,58 *94% Bartholdy & Pejrup (1994)2. Knude Dyb 165,00 181,73 *91% jacobsen (1975)3. jyvre Dyb 130,00 116,92 *90% jacobsen (1975)4. lister tief 402,30 389,73 *97% spiegel (1997)5. hörnum tief 290,20 283,63 *98% spiegel (1997)6. Norderaue 245,20 236,03 *96% spiegel (1997)7. süderaue 169,30 166,00 *98% spiegel (1997)8. hoogeloch 17,80 20,87 85% spiegel (1997)9. Rummeloch west 83,70 80,01 *96% spiegel (1997)10. Norderhever-heverstrom 441,80 407,85 *92% spiegel (1997)11. tümlauer Bucht 6,30 13,58 46% spiegel (1997)12. Eidermündung 49,90 70,38 71% spiegel (1997)13. wesselburener loch 66,10 92,84 71% spiegel (1997)14. Piep/Meldorfer Bucht 203,00 193,86 *95% spiegel (1997)15. Flackstrom 45,40 59,16 77% spiegel (1997)16. Neufahrwasser 37,30 73,96 50% spiegel (1997)17. schatzkammer 17,10 50,52 34% spiegel (1997)18. Elbe567,40
19. westertill/Nordertill 136,60 185,99 73% Ferk (1995)20. Robinbalje 99,90 114,95 87% Ferk (1995)21. weser
491,2822. jade/jadebusen 167,16 462,68 36% walter (1972)23. Blaue Balje 39,90 42,80 *93% Ferk (1995)24. harle 64,90 66,35 *98% Ferk (1995)25. otzumer Balje 74,30 74,31 *100% Ferk (1995)26. Accumer Ee 92,00 96,34 *95% Ferk (1995)27. wichter Ee 22,90 25,07 *91% Ferk (1995)28. Norderneyer seegat 101,60 112,48 *90% Ferk (1995)29. osterems
300,1130. Eems-Dollard 520,00 570,34 *91% louters & Gerritsen (1994)31. schild 31,00 35,86 86% herman et al. (2009)32. lauwers 143,00 141,97 *99% herman et al. (2009)33. Eilander Balg 40,00 36,83 *92% herman et al. (2009)34. Zoutkamperlaag 143,00 160,11 89% herman et al. (2009)35. Pinkegat 58,00 61,56 *94% herman et al. (2009)36. Amelander Zeegat 295,00 332,92 89% herman et al. (2009)37. Vlie 674,00 690,00 *98% herman et al. (2009)38. Eierlandse Gat 164,00 158,27 *97% herman et al. (2009)39. Marsdiep 675,00 678,22 *100% herman et al. (2009)
9.2 list of abbreviations
AwI the Alfred wegener Institute for Polar and
Marine Research
BfG Federal hydrology Institute
BlMP German Marine Monitoring Programme
Bsh Bundesamt für seeschifffahrt und hydrographie
cesar cabauw experimental site for atmospheric
research
clc corine land cover
coAstcolouR Developing, demonstrating, validating and
intercomparing different algorithms over a
global range of coastal water types
coAstDAt compilation of coastal analyses (i.e. hindcasts
and reconstructions) and scenarios for the
future obtained from numerical models
cosYNA coastal observing system for Northern and
Arctic seas
DFs Demersal Fish survey
DMI Danmarks Meteorologiske Institut
DMsA Danish Maritime safety Administration
DwD Deutscher wetterdienst
DYFs Demersal Young Fish survey
DYFs Brown shrimp survey by vtI
EEZ Exclusive Economic Zone
EMoDNEt European Marine observation and Data
Network
Eu European union
Eucc the coastal and Marine union
hMcN hydro Meteo centrum Nordzee
hwK hanse-wissenschafts-Kolleg – Institute for
Advanced study
IcBM Institute of chemistry and Biology of the Marine
Environment
IcEs International council for the Exploration of the
sea
IMAREs Dutch Marine Research/consultancy Institute
INPlAcE Integrated Network for Production and loss
Assessment in the coastal Environment
INtERwAD Dutch web Map service of the wadden sea
KMNI the Royal Netherlands Meteorological Institute
(Koninklijk Nederlands Meteorologisch Instituut)
lMw het landelijk Meetnet water
lNV Former Dutch Ministry of agriculture and
fisheries
MARcoAst Marine and coastal Environmental Information
services
MDI-DE Marine Data Infrastructure Germany
MsFD Marine strategy Framework Directive
Mwtl Monitoring Programme of the Dutch water
systems
NIoZ Royal Netherlands Institute for sea Research
NlwKN lower saxony water Management, coastal
Defence and Nature conservation Agency
osPAR oslo-Paris convention
PRw towards a rich wadden sea
QsR Quality status Report
RIVo Netherlands Institute for Fisheries Research
Rws Dutch National Institute for coastal and Marine
Management (Rijkswaterstaat)
sIBEs synoptic Intertidal Benthic survey (Dutch
benthos monitoring program)
tMAP trilateral Monitoring and Assessment Program
vtI von thünen Institut
web GIs web Geographical Information system
wIMo scientific Monitoring concepts for the German
Bight
wIswAD waddeninformatiesysteem (Project hosted by
the waddenacademie)
wsF wadden sea Forum
ZKo Dutch National Programme sea and coastal
Research
Programma naar een rijke Waddenzee
42
data inventory of the tidal basins in the trilateral Wadden sea
43

october 2011