Embed Size (px)
Citation preview
Banking industry between hope and fear – strong Q1 2012 performance
but market uncertainties remain
I ssue 1 | 11 Ap r i l 2012
K e y t o p i c s
/ The current economic environment is still unstable especially in Western Europe, but there are some positive signs from the US and BRICS countries (p. 2)
/ Reduction of market uncertainties as key driver for positive
performance (p. 5)
/ Market capitalisation of banks recovered significantly since the
end of 2011, especially US banks and national commercial
banks had a very good performance (p. 10)

2
Issue 1 11 April 2012
I. Global economic climate
Economic growth perspectives
In Q1 2012, the economic environment remains unstable and exhibits further divergence across the regions. Western European growth rates, including Germany’s, continued to decline with a weak outlook for the full year 2012. The US, however, continued their economic recovery showing promising GDP growth rates and a positive outlook for 2012/13. Forecasts for 2013 and economic sentiments indicate a more positive outlook for all major regions.
Fig. 1: GDP growth and forecasts (real GDP, year-over-year growth rates, in %)
Western Europe includes the euro area, Denmark, Norway, Sweden, Switzerland, United Kingdom. BRICS: Brazil, Russia, India, China, South Africa. Full
year data shown as long-term reference figures for comparative purposes. Q1 2012 data not yet available at the time of writing.
Source: Bloomberg, zeb/research
/ In Q4 2011, the recent trend of a three-speed world continued: whereas GDP growth rates in Western Europe and Germany fell for a third quarter in a row, the US economy continued their recovery and BRICS countries grow at a rate of 6.5-7.0%
/ The debt crisis will further hamper Western European economies, as forecasts see a stagnation of the GDP for 2012, which could worsen the situation for already stumbling European banks
Fig. 2: Change of GDP outlook (difference between GDP forecasts Q1 12 to Q4 11, in %p)
Source: Bloomberg, zeb/research
/ Current GDP forecasts for Western European economies for 2012 and 2013 were reduced by 0.2%p and 0.1%p compared to the forecasts from Q4 2011, underlining the current uncertainty
/ The outlook for Germany improved as GDP growth forecasts for 2012 increased by 0.3%p / Full year 2012 expectations for BRICS countries were adjusted downwards but remain on a high
level and are expected to improve in 2013 again
Forecasts for Western Europe substantially reduced
Economic downturn in Western Europe continues
0
2
4
6
8
10
12
Q1 10 Q2 10 Q3 10 Q4 10 Q1 11 Q2 11 Q3 11 Q4 11 FY11 FY12f FY13f
Germany
Western Europe
United States
BRICS
0.3
-0.2
0.1
-0.2
0.1
-0.1 -0.1
0.2
Germany Western Europe United States BRICS
∆ real GDP forecast FY12
∆ real GDP forecast FY13

3
Issue 1 11 April 2012
Fig. 3: Economic sentiments (ifo Business Climate Index – ifo Geschäftsklimaindex)
The ifo Business Climate Index is an indicator for economic activity based on a survey among companies about their current business situation and
outlook for the upcoming six months (2005 = 100). The ifo Institute only provides data for selected countries and regions. North America includes
Canada and the US, no separate data for BRICS countries available.
Source: ifo Institute for Economic Research, zeb/research
/ Western European business climate remained on a very low level, which underlines the pessimistic GDP expectations (fig. 1) for the region
/ Sentiments for Germany increased slightly, which may feed into upward adjustments to GDP forecasts in the coming months
/ North America currently shows a very promising development, which fosters the economic recovery started in 2011 and could be an early indicator of an even better GDP growth in 2012
Inflation and interest rates
Despite decreasing economic growth dynamics in Western Europe and Germany, the inflation rates are still significantly higher than in 2010. Also in the US, the inflation rate remains relatively high.
Fig. 4: Inflation rates and forecasts (annual change of average consumer prices, in %)
Q1 2012 data not yet available at the time of writing.
Source: Bloomberg, zeb/research
/ In Q4 2011, inflation rates in Western Europe and Germany continued to increase to almost 3%, but are predicted to decline especially in 2012 due to the expected economic downturn
/ In the US, the current inflation rate still exceeds 3% but it decreased slightly in Q4 2011 despite the faster US GDP growth
Global inflation outlook still positive
Sentiments exhibit positive trends
60
70
80
90
100
110
120
Q1 10 Q2 10 Q3 10 Q4 10 Q1 11 Q2 11 Q3 11 Q4 11 Q1 12
Germany
Western Europe
North America
World
0
1
2
3
4
5
6
7
8
Q1 10 Q2 10 Q3 10 Q4 10 Q1 11 Q2 11 Q3 11 Q4 11 FY11 FY12f FY13f
Germany
Western Europe
United States
BRICS
4
Issue 1 11 April 2012
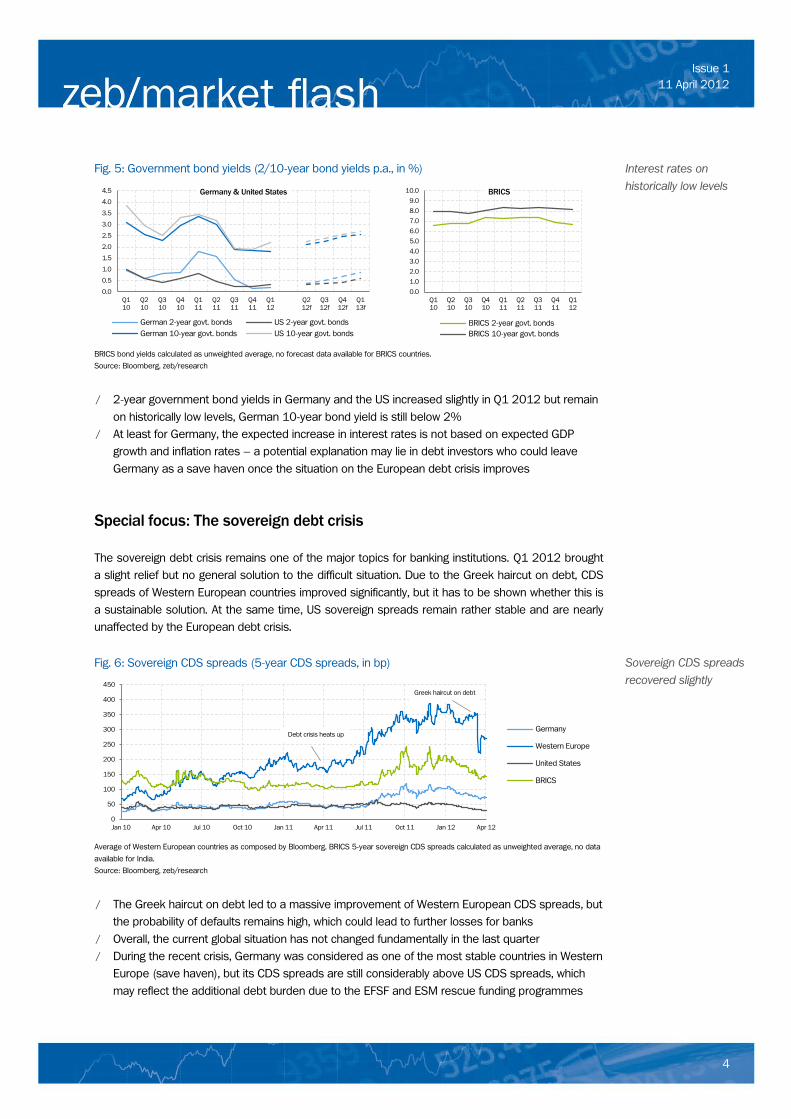
Fig. 5: Government bond yields (2/10-year bond yields p.a., in %)
BRICS bond yields calculated as unweighted average, no forecast data available for BRICS countries.
Source: Bloomberg, zeb/research
/ 2-year government bond yields in Germany and the US increased slightly in Q1 2012 but remain on historically low levels, German 10-year bond yield is still below 2%
/ At least for Germany, the expected increase in interest rates is not based on expected GDP growth and inflation rates – a potential explanation may lie in debt investors who could leave Germany as a save haven once the situation on the European debt crisis improves
Special focus: The sovereign debt crisis
The sovereign debt crisis remains one of the major topics for banking institutions. Q1 2012 brought a slight relief but no general solution to the difficult situation. Due to the Greek haircut on debt, CDS spreads of Western European countries improved significantly, but it has to be shown whether this is a sustainable solution. At the same time, US sovereign spreads remain rather stable and are nearly unaffected by the European debt crisis.
Fig. 6: Sovereign CDS spreads (5-year CDS spreads, in bp)
Average of Western European countries as composed by Bloomberg. BRICS 5-year sovereign CDS spreads calculated as unweighted average, no data
available for India.
Source: Bloomberg, zeb/research
/ The Greek haircut on debt led to a massive improvement of Western European CDS spreads, but the probability of defaults remains high, which could lead to further losses for banks
/ Overall, the current global situation has not changed fundamentally in the last quarter / During the recent crisis, Germany was considered as one of the most stable countries in Western
Europe (save haven), but its CDS spreads are still considerably above US CDS spreads, which may reflect the additional debt burden due to the EFSF and ESM rescue funding programmes
Interest rates on historically low levels
Sovereign CDS spreads recovered slightly
0
50
100
150
200
250
300
350
400
450
Jan 10 Apr 10 Jul 10 Oct 10 Jan 11 Apr 11 Jul 11 Oct 11 Jan 12 Apr 12
Germany
Western Europe
United States
BRICS
Debt crisis heats up
Greek haircut on debt
0.0
0.5
1.0
1.5
2.0
2.5
3.0
3.5
4.0
4.5
Q1 10
Q2 10
Q3 10
Q4 10
Q1 11
Q2 11
Q3 11
Q4 11
Q1 12
Q2 12f
Q3 12f
Q4 12f
Q1 13f
Germany & United States
German 2-year govt. bonds US 2-year govt. bonds German 10-year govt. bonds US 10-year govt. bonds
0.0
1.0
2.0
3.0
4.0
5.0
6.0
7.0
8.0
9.0
10.0
Q1 10
Q2 10
Q3 10
Q4 10
Q1 11
Q2 11
Q3 11
Q4 11
Q1 12
BRICS
BRICS 2-year govt. bonds BRICS 10-year govt. bonds

5
Issue 1 11 April 2012
Fig. 7: Sovereign refinancing needs (bonds and loans outstanding with maturity 2012/13, in % of nominal GDP)
Figure contains only currently outstanding bonds and loans, without net new borrowings.
Source: Bloomberg, zeb/research
/ As of 30 March 2012, the US and Italy have the highest refinancing needs among the countries considered, with refinancing needs of 16.8% of their nominal GDP in 2012
/ Average BRICS refinancing needs are well below the levels of the other countries considered
II. Key banking drivers
Selected capital market indicators
Capital markets calmed down in Q1 2012. Especially the volatilities of stock markets declined significantly. In the currency markets, the steady depreciation of the euro against the US dollar and BRICS currencies stopped.
Fig. 8: Stock market volatilities (in bp)
The BRICS volatility index is calculated as unweighted average of CBOE Brazil Volatility Index, Russian Volatility Index, India NSE Volatility Index,
AlphaShares Chinese Volatility Index, JSE Securities South African Volatility Index.
Source: Bloomberg, zeb/research
/ Current market volatilities on mature European and US capital markets returned to their Q1/Q2 2011 level, before the European debt crisis caused a significant volatility jump in mid-2011
/ The Euro Stoxx volatility has reached the average BRICS volatility especially in the second half of the sample
The US and Italy have the highest refinancing needs in 2012
Lower market volatilities
0
10
20
30
40
50
60
Jan 10 Apr 10 Jul 10 Oct 10 Jan 11 Apr 11 Jul 11 Oct 11 Jan 12 Apr 12
Mature capital markets
Euro Stoxx 50 Vola Index VIX (S&P 500) 0
10
20
30
40
50
60
Jan 10 Apr 10 Jul 10 Oct 10 Jan 11 Apr 11 Jul 11 Oct 11 Jan 12 Apr 12
BRICS
6.3
12.3
16.8
11.3
16.8
3.4
6.5 8.2
11.6
9.4 9.1
2.1
Germany Portugal Italy Spain United States BRICS
2012 2013

6
Issue 1 11 April 2012
Fig. 9: FX rates (EUR/USD, EUR/BRICS basket)
EUR/BRICS basket represents a custom index of EUR/BRL, EUR/RUB, EUR/INR, EUR/CNY and EUR/ZAR exchange rates. Individual exchange rates are
indexed by 1/1/2010. The basket is then calculated as an unweighted average of individual exchange rate indices.
Source: Bloomberg, zeb/research
/ Compared to the US dollar, the euro was able to recover in Q1 2012, after suffering a strong depreciation between April 2011 and January 2012 due to the debt crisis
/ At the end of Q1 2012, EUR/BRICS-rate increased again, reverting the depreciation of the euro which started in November 2011 – overall the impact of the debt crisis has been less severe as risk-averse investors are more likely to move their funds to the US instead of the BRICS countries
Funding costs and margins
The interbank funding situation of banks improved steadily in Q1 2012. Especially the short-term spread curve decreased noticeably. In the euro area, deposits interest rates for private customers continued to increase strongly, whereas loan interest rates declined further.
Fig. 10: Interbank market rates (interbank offered rates and overnight indexed swaps)
Source: Bloomberg, zeb/research
9M 3M
Euro able to stabilise valuation
Interbank funding situation improved
1D 6M 1Y 2Y 3Y 4Y 5Y 10Y
1.15
1.20
1.25
1.30
1.35
1.40
1.45
1.50
1.55
Jan 10 Apr 10 Jul 10 Oct 10 Jan 11 Apr 11 Jul 11 Oct 11 Jan 12 Apr 12
EUR/USD
0.85
0.90
0.95
1.00
1.05
Jan 10 Apr 10 Jul 10 Oct 10 Jan 11 Apr 11 Jul 11 Oct 11 Jan 12 Apr 12
EUR/BRICS
0.0
0.5
1.0
1.5
2.0
2.5 Money market curves (as of 30/3/2012, in %)
EUR OIS USD OIS EURIBOR (Swap) LIBOR (Swap)
0.0
0.2
0.4
0.6
0.8
1.0
1.2
Jan 10 Apr 10 Jul 10 Oct 10 Jan 11 Apr 11 Jul 11 Oct 11 Jan 12 Apr 12
Spread of interbank offered rates over OIS rates (in %p)
EURIBOR/EUR OIS spread (3M)
LIBOR/USD OIS spread (3M)

7
Issue 1 11 April 2012
/ On 30 March 2012, EURIBOR and LIBOR curves still were unusually steep and well above corresponding EUR and USD OIS curves, indicating that banks still see a high probability of defaults in the interbank market and therefore prefer interest rate swaps over interbank lending
/ Nevertheless, the 3-month spreads declined significantly in Q1 2012 (almost -0.6%p in the euro interbank system) confirming previous findings that markets calmed down after the turmoil in the second half of 2011
Fig. 11: Deposits and loans interest rates in the euro area (new business rates) and EURIBOR (in %)
Source: European Central Bank, zeb/research
/ In Q1 2012, the competition for customer deposits as a cheap and stable funding source intensified further, leading to increasing deposits interest rates for households and lower margins for banks
/ For households, mortgage loans rate almost remained on previous quarter’s level / Corporate deposit and lending margins remain stable, as corporate interest rates followed the
reference rate closely
Investment banking activities
The investment banking industry profits from an increased total market volume regarding corporate bond issuances and equity offerings, leading to increased fee pools and earnings, respectively. In contrast, financial advisory related to M&A continued the downward trend of recent quarters.
Fig. 12: Corporate bonds issuance business by home region of issuing company
Retail margins narrow
0.0
0.5
1.0
1.5
2.0
2.5
3.0
3.5
4.0
4.5
Q1 10 Q2 10 Q3 10 Q4 10 Q1 11 Q2 11 Q3 11 Q4 11 Q1 12
Households
Deposits (≤ 1Y) Mtg. loans (1Y-5Y)
EURIBOR (3M)
0.0
0.5
1.0
1.5
2.0
2.5
3.0
3.5
4.0
4.5
Q1 10 Q2 10 Q3 10 Q4 10 Q1 11 Q2 11 Q3 11 Q4 11 Q1 12
Corporates
Deposits (≤ 1Y) Loans (1Y-5Y)
EURIBOR (3M)
Significant increase in bonds issuances
275 147 188 140
257 197 103 98
317
130
85 148
127
145 131
100 103
173 49
45
66
40
56 70
49 97
85 96
89
128
115
124 108
80 107
166 551
366
531
422
582 507
331 405
741
0
100
200
300
400
500
600
700
800
900
Q1 10 Q2 10 Q3 10 Q4 10 Q1 11 Q2 11 Q3 11 Q4 11 Q1 12
Total volume of corporate bond issuances (in EUR bn)
Western Europe United States BRICS Others T

8
Issue 1 11 April 2012
Fee volume (left-hand axis) and global average fee rate (right-hand axis) are estimated based on offering volume and volume-weighted average of all
available fees.
Source: Bloomberg, zeb/research
/ In Q1 2012, the volume of global corporate bond issuances increased to EUR 741 bn, a level well above recent quarters and first quarters of 2010 (+27.4%) and 2011 (+34.5%)
/ Especially Western European companies more than tripled their funding activity regarding corporate bonds after low issuance volumes in 2011 – this reflects a growing investor appetite for European corporate bonds since European sovereign debt exhibited either low interest rates or elevated risk levels
/ The global average fee rate has been rather stable in recent quarters, therefore the growth in banks’ fee earnings is primarily driven by the business volume effect
Fig. 13: Equity offering business by home region of issuing company
Equity offering business includes initial public offerings and additional equity listings. Fee volume (left-hand axis) and global average fee rate (right-hand
axis) are estimated based on offering volume and volume-weighted average of all available fees.
Source: Bloomberg, zeb/research
/ Volume of global equity business denoted an increase of EUR 32 bn to EUR 83 bn in Q1 2012, mainly driven by US and Western European customers – but level of previous year’s quarter (Q1 2011) could not be reached
Equity offering business stops downward trend
1.3 0.7 1.0 0.7 1.0 0.9
0.4 0.5
1.4
0.8
0.6 1.0
0.8 0.8
0.8
0.6 0.6
1.1 0.2
0.2
0.4
0.2 0.2 0.3
0.2 0.5
0.4 0.5
0.4
0.7
0.6 0.5 0.5
0.4 0.5
0.8 2.8
2.0
3.0
2.3
2.6 2.5
1.6 2.1
3.7
0.35
0.40
0.45
0.50
0.55
0.60
0
1
2
3
4
5
Q1 10 Q2 10 Q3 10 Q4 10 Q1 11 Q2 11 Q3 11 Q4 11 Q1 12
Fee volume (in EUR bn) and global average fee (in %)
Western Europe United States BRICS Others T Global avg. fee (%)
15 8 6 21 20 18 9 5 14 21 25 18
55 39 39
13 18 35
24 21 60
39
23 20
18 11
10 33 27
28
67
30 23
15 16
23
93 81
111
182
111 100
55 51
83
0
50
100
150
200
250
Q1 10 Q2 10 Q3 10 Q4 10 Q1 11 Q2 11 Q3 11 Q4 11 Q1 12
Total volume of global equity offerings (in EUR bn)
Western Europe United States BRICS Others T
0.5 0.3 0.2 0.5 0.7 0.5 0.2 0.2 0.5
0.9 1.1 0.7
1.4 1.3 1.3
0.5 0.8 1.2
0.7 0.8 1.2
1.2 1.0 0.8
0.6 0.5
0.5 1.1 0.8 0.9
1.8 1.1
0.7
0.5 0.6
0.9
3.2 3.0 3.0
5.0
4.1
3.3
1.9 2.0
3.1
1.0
1.5
2.0
2.5
3.0
3.5
4.0
4.5
0
1
2
3
4
5
6
7
Q1 10 Q2 10 Q3 10 Q4 10 Q1 11 Q2 11 Q3 11 Q4 11 Q1 12
Fee volume (in EUR bn) and global average fee (in %)
Western Europe United States BRICS Others T Global avg. fee (%)

9
Issue 1 11 April 2012
/ The volume effect is damped by a slight decrease in the average fee – nevertheless the global fee volume of financial institutions grew significantly
Fig. 14: Deal volume of M&A business by home region of acquired company (in EUR bn)
Category “Others“ includes all M&A transactions with target companies from regions different than those specified and deals with targets in multiple
regions not further specified. All transactions classified by announcement date.
Source: Bloomberg, zeb/research
/ M&A activity further declined in Q1 2012 – global M&A volume dropped to EUR 277 bn, which is in line with global sentiments (fig. 3) as these typically lead M&A activity by a few months
/ The decrease in volume continues the downward trend, which first affected BRICS countries in Q1 2011 and later the Western European and US markets in Q3 2011
/ Given the recent increase of sentiments, M&A activities are likely to pick up in the next quarters
III. State of the banking industry
Market valuation
The banking sector looks back at a very good quarter in terms of market valuation. Market capitalisation is now significantly higher than in Q3 2011, when the debt crisis hit banks very hard. With regard to business models, it is remarkable that national commercial banks are still valued higher than international banks or banks with a high share of investment banking. In Q1 2012, this has not changed fundamentally.
Fig. 15: Market capitalisation of the banking sector (end of quarter, in EUR tr)
All banks include all banks worldwide according to Bloomberg classification. Global top 100 banks contain largest banks by market capitalisation.
Source: Bloomberg, zeb/research
Market valuation of banks improved further
M&A business continues to decline
54 49 56 65 78 91 50 48 54
74 91 94 89 91 106
77 73 62
31 38 58 66 41 46
38 34 34
140 132
183 221
165 156
166 150 126
299 310
391 441
374 398
331 304
277
0
100
200
300
400
500
600
Q1 10 Q2 10 Q3 10 Q4 10 Q1 11 Q2 11 Q3 11 Q4 11 Q1 12
Western Europe United States BRICS Others T
4.3 4.1
4.3 4.6 4.5
4.2
3.6 3.8
4.3
3.2 3.0 3.2
3.4 3.3 3.1
2.6 2.8
3.2
Q1 10 Q2 10 Q3 10 Q4 10 Q1 11 Q2 11 Q3 11 Q4 11 Q1 12
All banks Global top 100

10
Issue 1 11 April 2012
/ In Q1 2012, the global banking industry continued its recovery from the downturn in the second half of 2011
/ With EUR 3.2 tr (+13.7%) and EUR 4.3 tr (+13.0%), respectively, market capitalisation of global top 100 institutions and all banks reached pre-sovereign debt crisis levels again in Q1 2012
Fig. 16: Market capitalisation of global top 100 banks by region (in EUR tr)
Source: Bloomberg, zeb/research
/ On average, especially Western European banks were hit hard by the market turmoil in Q3 2011, but since the beginning of 2012, they were able to increase their valuation again despite the relatively problematic economic environment in Western Europe
/ Within the last two years the relative weights have changed: Global top 100 banks from BRICS countries as a group now have the highest market capitalisation whereas Western European and US banks are now on the same level
Fig. 17: Price-to-book ratio of global top 100 banks
Diversified banking institutions generate more than 30% of their earnings from investment banking/trading/non-classic banking activities, international
commercial banks generate more than 70% of their earnings from classic banking in culturally different types of international markets, commercial
banks from mature/growing markets generate more than 70% of their earnings from classic banking activities in their respective market type.
Source: Bloomberg, zeb/research
/ Based on the recent recovery of the capital markets, the price-to-book ratio of all banks improved across business models and regions
/ In Q1 2012, the price-to-book ratio especially of financial institutions from the US continued to improve, which can be linked to the macroeconomic development in recent quarters
/ In spite of these developments, the last quarter brought no change to the general differences between price-to-book ratios of business models, as capital markets still favour national commercial banks and their stable customer deposits funding base and less volatile business
National commercial banks have highest valuation
Regional weights in market capitalisation have shifted
0.0
0.2
0.4
0.6
0.8
1.0
1.2
Q1 10 Q2 10 Q3 10 Q4 10 Q1 11 Q2 11 Q3 11 Q4 11 Q1 12
Western Europe
United States
BRICS
0.0
0.5
1.0
1.5
2.0
2.5
Q1 10 Q2 10 Q3 10 Q4 10 Q1 11 Q2 11 Q3 11 Q4 11 Q1 12
By region
Western Europe United States BRICS
0.0
0.5
1.0
1.5
2.0
2.5
Q1 10 Q2 10 Q3 10 Q4 10 Q1 11 Q2 11 Q3 11 Q4 11 Q1 12
By business model
Div. banking inst. Int. comm. banks Comm. banks (mat. m.) Comm. banks (grow. m.)

11
Issue 1 11 April 2012
Equity performance
The equity performance of banks was very promising in the first quarter of 2012. However, on an annual basis, the average total shareholder return (TSR) of banks is still well behind other sectors. Within the banking sector, commercial banks have the best TSR performance, whereas Western European banks rank last with strongly negative TSRs.
Fig. 18: Total shareholder return of industry sectors worldwide (in %)
Total shareholder return of industry sectors based on global sector total return indices, aggregated and provided by Datastream.
Source: Datastream, zeb/research
/ In Q1 2012, the banking industry profits from the recovery of the capital markets, the Greek haircut on debt and the corresponding ECB interventions, achieving the second best total shareholder return performance among all industry sectors
/ Nevertheless, based on a one year moving average, the TSR of banking institutions is still negative with -12.9%
Fig. 19: Total shareholder return of global top 100 banks (4/2011-3/2012, in %)
Average total shareholder returns are weighted by the market capitalisation of each bank.
Source: Bloomberg, zeb/research
/ The global top 100 banks achieved a TSR of -6.2% over the last year, with -20.7% institutions from Western Europe clearly rank last (on average) among all regions
/ As seen before, banks from the US and BRICS as well as national commercial banks performed best among the global top 100 banks
-6.2
1.1
-4.5
-10.5
-23.6
Global top 100
Comm. banks (mat. m.)
Comm. banks (grow. m.)
Div. banking inst.
Int. comm. banks
By business model
Banks among top industry sectors in Q1 2012
National commercial banks lead TSR ranking
11.5
11.5
10.3
8.8
0.2
-4.8
-8.1
-8.9
-12.9
-18.6
Technology
Health care
Consumer goods
Consumer services
Telecommunications
Industrials
Utilities
Oil and gas
Banks
Basic materials
One year (4/2011-3/2012)
20.8
18.0
14.6
13.4
11.9
10.9
7.6
7.5
4.8
4.7
Technology
Banks
Industrials
Consumer goods
Consumer services
Basic materials
Oil and gas
Health care
Telecommunications
Utilities
Q1 2012 (4/2011-3/2012)
-6.2
-20.7
-2.4
-8.7
4.2
Global top 100
Western Europe
United States
BRICS
Others
By region

12
Issue 1 11 April 2012
Fig. 20: Top/low TSR performers among global top 100 banks (4/2011-3/2012, in %)
Global
Top performers Country TSR Low performers Country TSR
Siam Commercial Bank PCL Thailand 36.3
UniCredit SpA Italy -66.7
Credicorp Ltd Peru 28.2
Credit Agricole SA France -58.0
FirstRand Ltd South Africa 27.1
Societe Generale SA France -50.1
Kasikornbank PCL Thailand 23.6
Lloyds Banking Group PLC Britain -42.2
Nedbank Group Ltd South Africa 22.8
CaixaBank Spain -39.3
Western Europe
Top performers Country TSR Low performers Country TSR
Svenska Handelsbanken AB Sweden 6.7
UniCredit SpA Italy -66.7
Swedbank AB Sweden 0.0
Credit Agricole SA France -58.0
Standard Chartered PLC Britain -0.1
Societe Generale SA France -50.1
Deutsche Bank AG Germany -8.6
Lloyds Banking Group PLC Britain -42.2
HSBC Holdings PLC Britain -8.9
CaixaBank Spain -39.3
Source: Bloomberg, zeb/research
/ To no surprise, banks with the lowest TSR performance between April 2011 and March 2012 are exclusively located in Western European countries, whereas all top performers are from emerging markets
/ The list of top TSR performers in Western Europe is dominated by banks from Northern Europe – it has to be noted however, that Svenska Handelsbanken is actually the only bank that created value for its shareholders in the last twelve months
Fig. 21: RoE after taxes and yearly RoE forecast changes of global top 100 banks (in %)
Western European banks lead list of low performers
Global profitability outlook for banks revised downwards
By region
(9.2) (10.7) (11.2)
7.5
4.8 6.9
8.1
FY10 FY11f FY12f FY13f
Western Europe
(11.4) (12.4) (12.7)
10.8 10.4 10.2 10.8
FY10 FY11f FY12f FY13f
Global top 100
(17.4) (17.8) (17.7) 20.4
21.3
17.5 17.1
FY10 FY11f FY12f FY13f
BRICS
(8.4) (9.8) (10.1)
6.6 6.8 7.3 8.1
FY10 FY11f FY12f FY13f
United States Est. 31/3/2011
Est. 31/3/2012

13
Issue 1 11 April 2012
Figure compares different consensus forecasts of return on equity of global top 100 banks based on market capitalisation. Forecasts are calculated as
equity-weighted averages of analysts’ consensus forecasts as available in Bloomberg.
Source: Bloomberg, zeb/research
/ The changes in RoE forecasts overall have a downward trend but are very heterogeneous across regions and business models
/ Forecasts for BRICS countries and commercial banks in growing markets were high already and further improved
/ Forecasts especially for international commercial banks and banks in Western Europe were significantly reduced, which is in line with our previous findings
Debt perspective
Despite the recent recovery described above, the credit quality of banks themselves remains unstable. Banks’ CDS spreads have improved in Q1 2012 but are still on an elevated level and the number of rating downgrades has been abnormally high in the last two quarters.
Fig. 22: CDS spreads of global top 100 banks (avg. 5-year CDS spreads, in bp)
CDS spreads decrease but remain on high level
By business model
(8.2) (9.9) (10.7)
6.4
2.9 6.0
7.5
FY10 FY11f FY12f FY13f
International commercial banks
(16.8) (17.2) (17.3) 19.6
20.4
16.8 16.6
FY10 FY11f FY12f FY13f
Commercial banks (grow. markets)
(9.1) (10.2) (10.4)
7.4 6.5 7.2 8.0
FY10 FY11f FY12f FY13f
Diversified banking institutions
0
50
100
150
200
250
300
350
400
450
500
Jan 10 Apr 10 Jul 10 Oct 10 Jan 11 Apr 11 Jul 11 Oct 11 Jan 12 Apr 12
By region
Western Europe
United States
BRICS
(10.9) (11.9) (12.2)
9.7 10.1 10.5 11.0
FY10 FY11f FY12f FY13f
Commercial banks (mat. markets)
Est. 31/3/2011
Est. 31/3/2012

14
Issue 1 11 April 2012
5-year CDS spreads are calculated as unweighted average of CDS spreads of each bank.
Source: Bloomberg, zeb/research
/ In Q1 2012, CDS spreads of global top 100 banks decreased substantially but remain on elevated levels
/ Overall, investors have started to differentiate across business models in the last two years – whereas CDS spreads of all business models except for the banks in growing markets had almost identical spreads in January 2010 there is now a substantial differentiation with international commercial banks having even higher CDS spreads than the average commercial bank in a growing market
Fig. 23: Rating changes of global top 100 banks
Rating changes consider number of upward and downward revisions of long-term rating of global top 100 banks as provided by Standard & Poor’s,
Moody’s, Fitch Ratings. Outlook revisions are excluded. Up-to-downgrade ratio (right-hand axis) is a harmonised index calculated as (number of
upgrades – number of downgrades) / sum of upgrades and downgrades.
Source: Bloomberg, zeb/research
/ The number of rating downgrades has reached record levels in the last two quarters – taken together more than 60 downgrades occurred
/ For the entire year 2011, the up-to-downgrade ratio has been below zero, which indicates that there is substantial uncertainty in the market concerning the stability and business perspective of banks
Rating downgrades dominate
0
50
100
150
200
250
300
350
400
450
500
Jan 10 Apr 10 Jul 10 Oct 10 Jan 11 Apr 11 Jul 11 Oct 11 Jan 12 Apr 12
By business model
Div. banking inst.
Int. comm. banks
Comm.banks (mat. m.)
Comm.banks (grow. m.)
-1.0
-0.8
-0.6
-0.4
-0.2
0.0
0.2
0.4
0.6
0.8
1.0
0
5
10
15
20
25
30
35
40
45
50
Q1 10 Q2 10 Q3 10 Q4 10 Q1 11 Q2 11 Q3 11 Q4 11 Q1 12
Upgrades Downgrades Up-to-downgrade ratio

15
Issue 1 11 April 2012
About zeb/market flash
The zeb/market flash is a quarterly compilation of market data putting the total shareholder return (TSR) performance of the global banking industry, economic fundamentals and key value drivers into perspective. It is published by zeb/rolfes.schierenbeck.associates. All data and calculations of this issue are based on the due date 2 April 2012.
zeb/rolfes.schierenbeck.associates is a management consultancy specialising in the financial services sector with thirteen offices in Germany (Berlin, Frankfurt, Hamburg, Munich, Münster, Ulm), Austria (Vienna), Switzerland (Zurich), Luxembourg, Poland (Warsaw), the Czech Republic (Prague), Ukraine (Kiev) and Hungary (Budapest). With more than 750 employees and several subsidiaries, zeb/ is among the leading consulting firms for banks, insurance companies and other financial service providers.
For more information: www.zeb.de
Contact
Dr. Dirk Holländer Partner Hammer Straße 165 D-48153 Münster Phone +49.251.97128.182 Fax +49.251.97128.101 E-mail [email protected]
Volker Abel Senior Manager Taunusanlage 19 D-60325 Frankfurt am Main Phone +49.69.719153.453 Fax +49.69.719153.410 E-mail [email protected]
Oliver Rosenthal Head of Research Hammer Straße 165 D-48153 Münster Phone +49.251.97128.135 Fax +49.251.97128.101 E-mail [email protected]