Embed Size (px)
Citation preview
K. Continuous Culture & Fed-Batch Culture
Consider the following well-mixed system:
1. General Material Balances
FIN
FOUT
FIN = flowrate of fluid into system (vol/time)
FOUT = flowrate of fluid out of system (vol/time)
V = volume of fluid in system
Other key variables (a reminder):
X = concentration of cells (mass/vol)
ri = mass rate of i generation (mass/vol·time)
S = concentration of substrate (mass/vol)
P = concentration of product (mass/vol)
W = concentration of water (mass/vol)
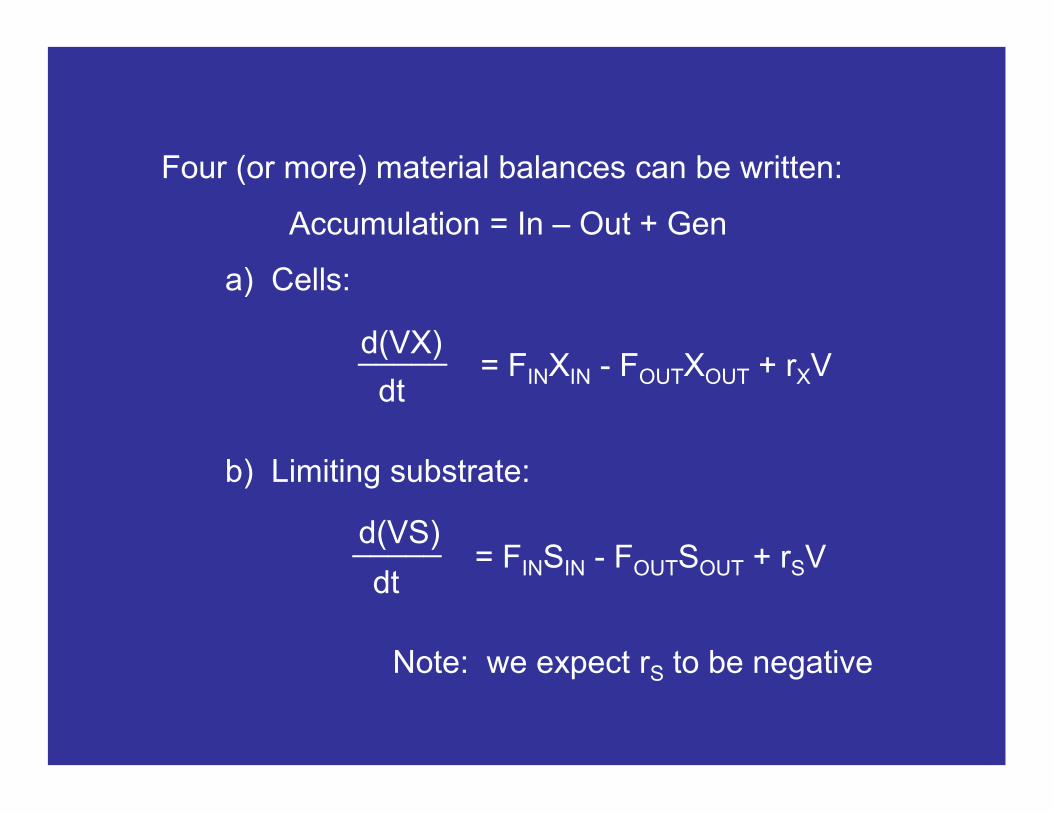
Four (or more) material balances can be written:
Accumulation = In – Out + Gen
a) Cells:
= FINXIN - FOUTXOUT + rXVd(VX)
dt
_____
b) Limiting substrate:
= FINSIN - FOUTSOUT + rSVd(VS)
dt
_____
Note: we expect rS to be negative
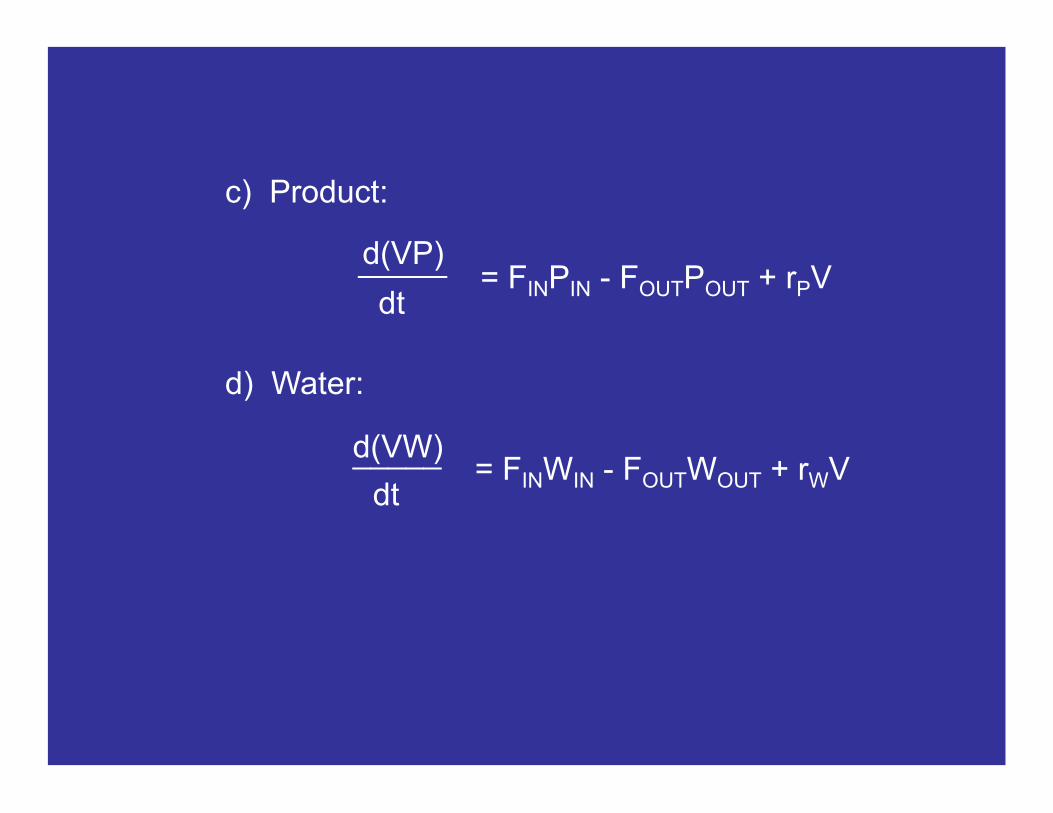
c) Product:
= FINPIN - FOUTPOUT + rPVd(VP)
dt
_____
d) Water:
= FINWIN - FOUTWOUT + rWVd(VW)
dt
_____
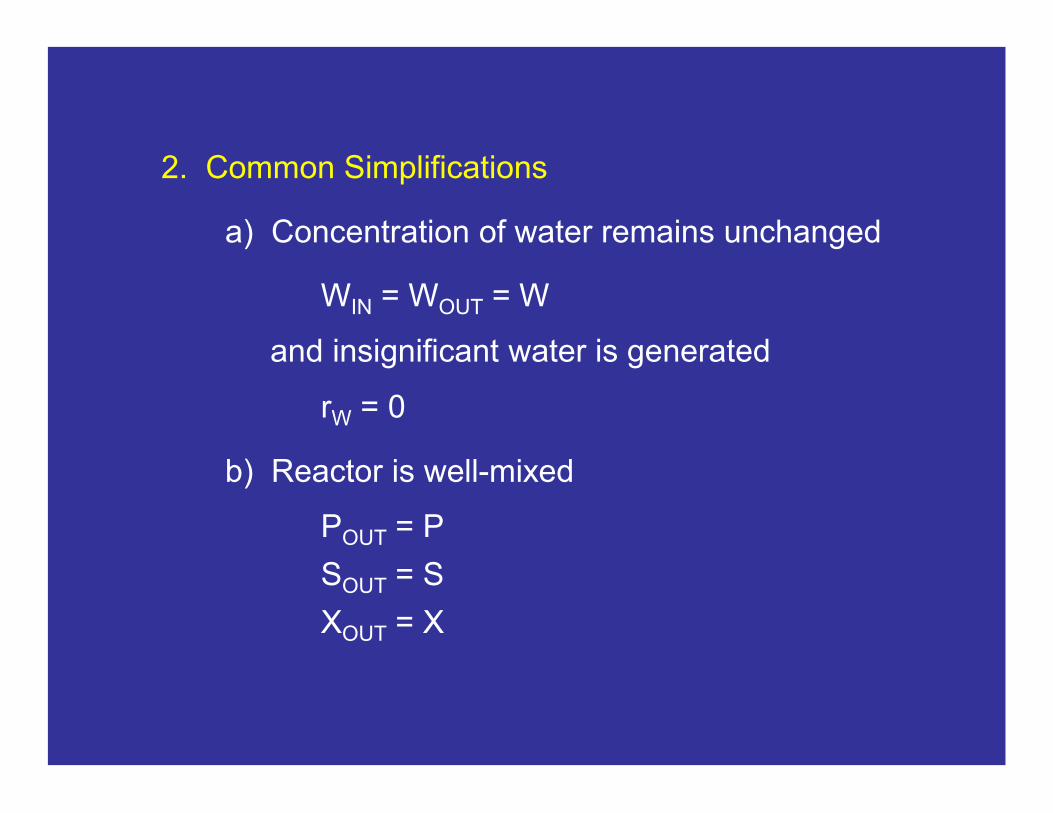
2. Common Simplifications
a) Concentration of water remains unchanged
WIN = WOUT = W
and insignificant water is generated
rW = 0
b) Reactor is well-mixed
POUT = P
SOUT = S
XOUT = X
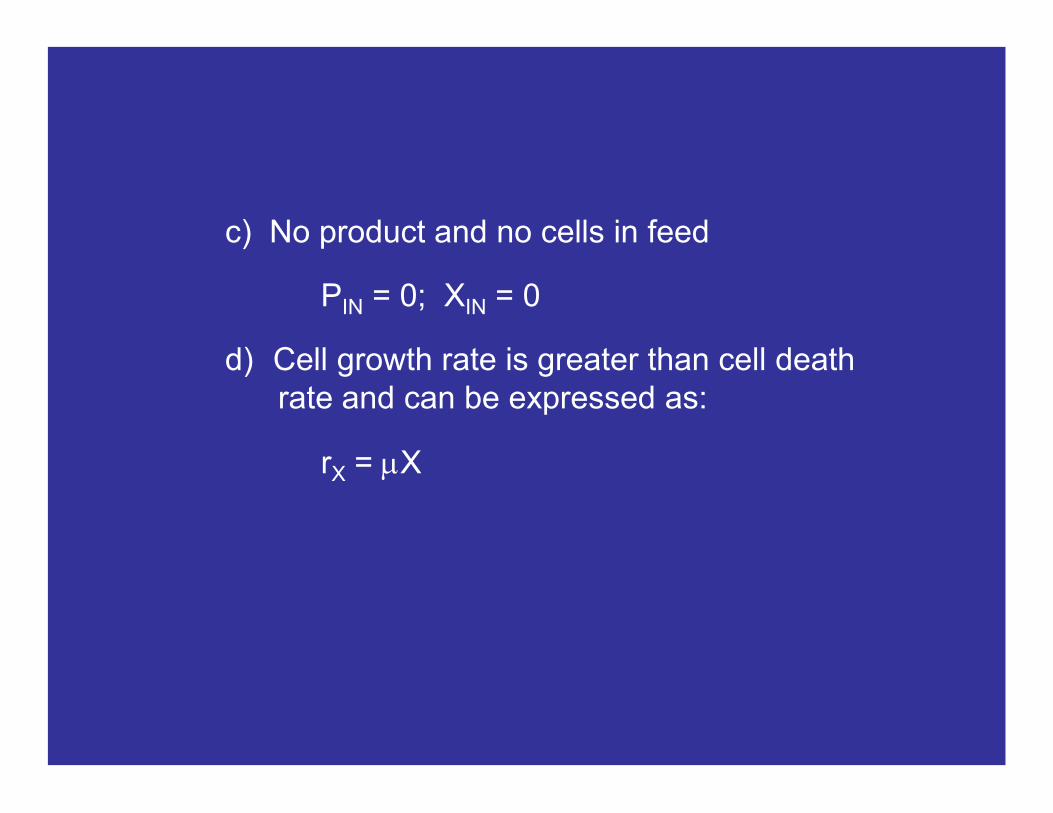
c) No product and no cells in feed
PIN = 0; XIN = 0
d) Cell growth rate is greater than cell deathrate and can be expressed as:
rX = mX
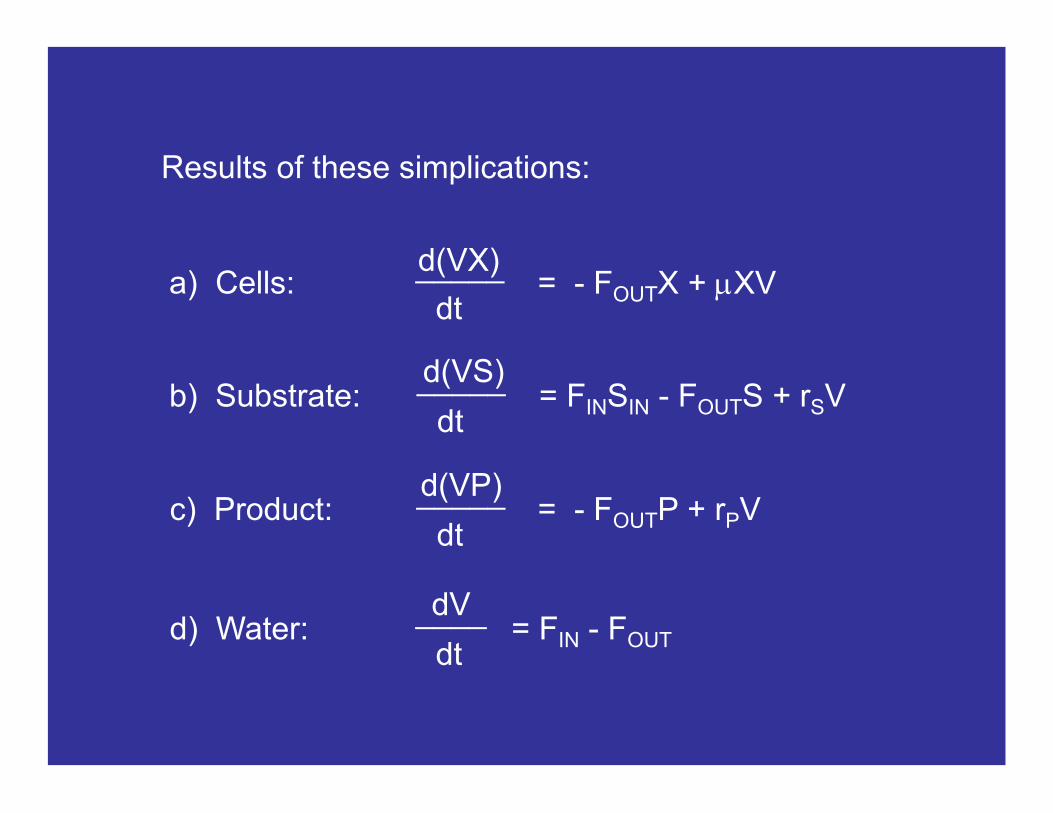
Results of these simplications:
a) Cells: = - FOUTX + mXVd(VX)
dt
_____
b) Substrate: = FINSIN - FOUTS + rSVd(VS)
dt
_____
c) Product: = - FOUTP + rPVd(VP)
dt
_____
d) Water: = FIN - FOUT
dV
dt
____
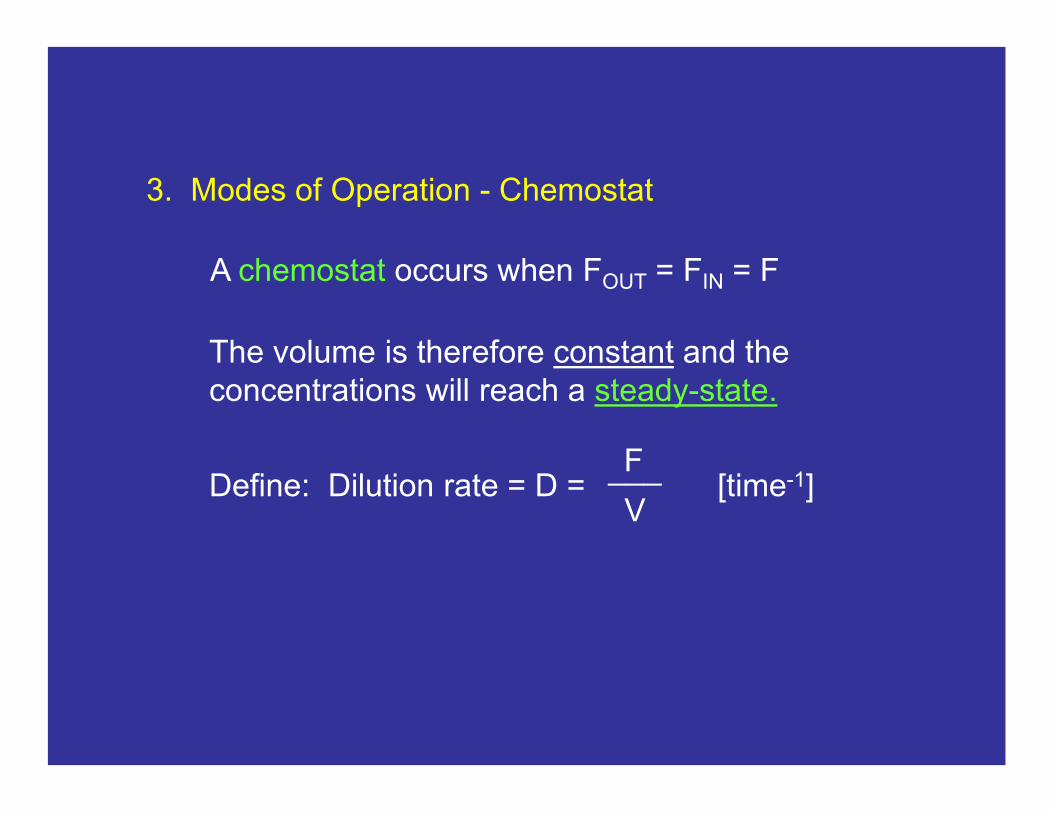
3. Modes of Operation - Chemostat
A chemostat occurs when FOUT = FIN = F
The volume is therefore constant and the concentrations will reach a steady-state.
Define: Dilution rate = D = [time-1]F
V
___
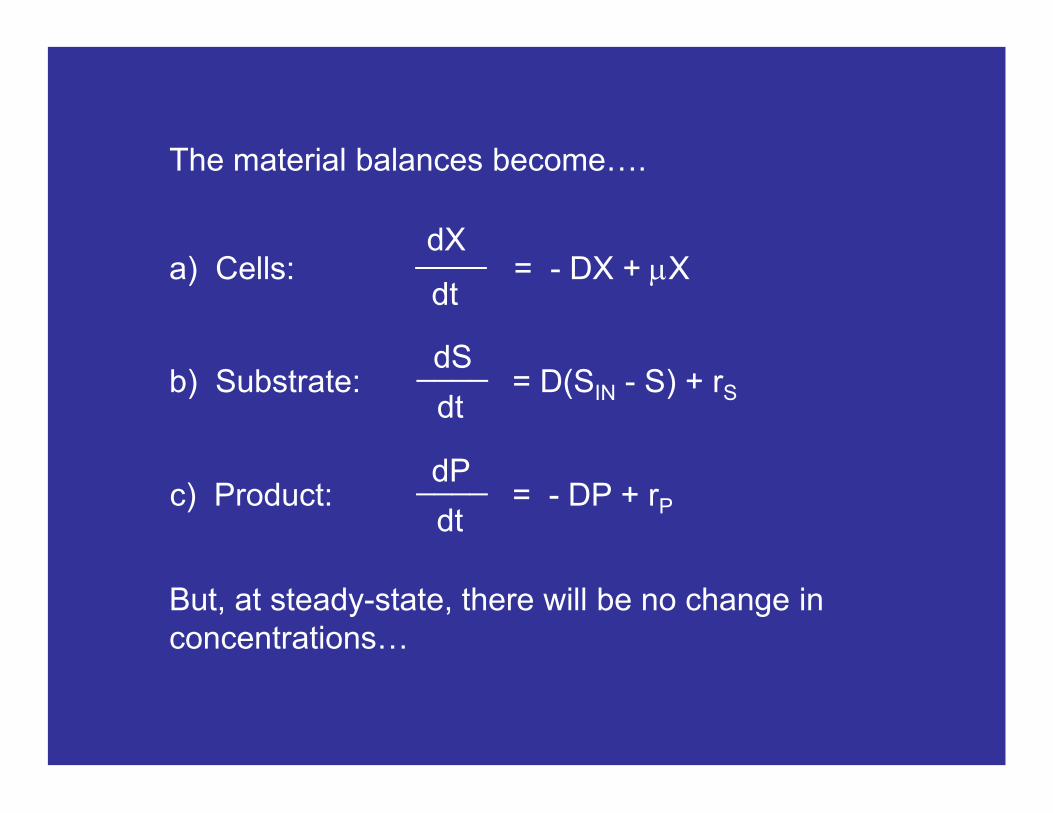
a) Cells: = - DX + mXdX
dt
____
b) Substrate: = D(SIN - S) + rS
dS
dt
____
c) Product: = - DP + rP
dP
dt
____
But, at steady-state, there will be no change in concentrations…
The material balances become….
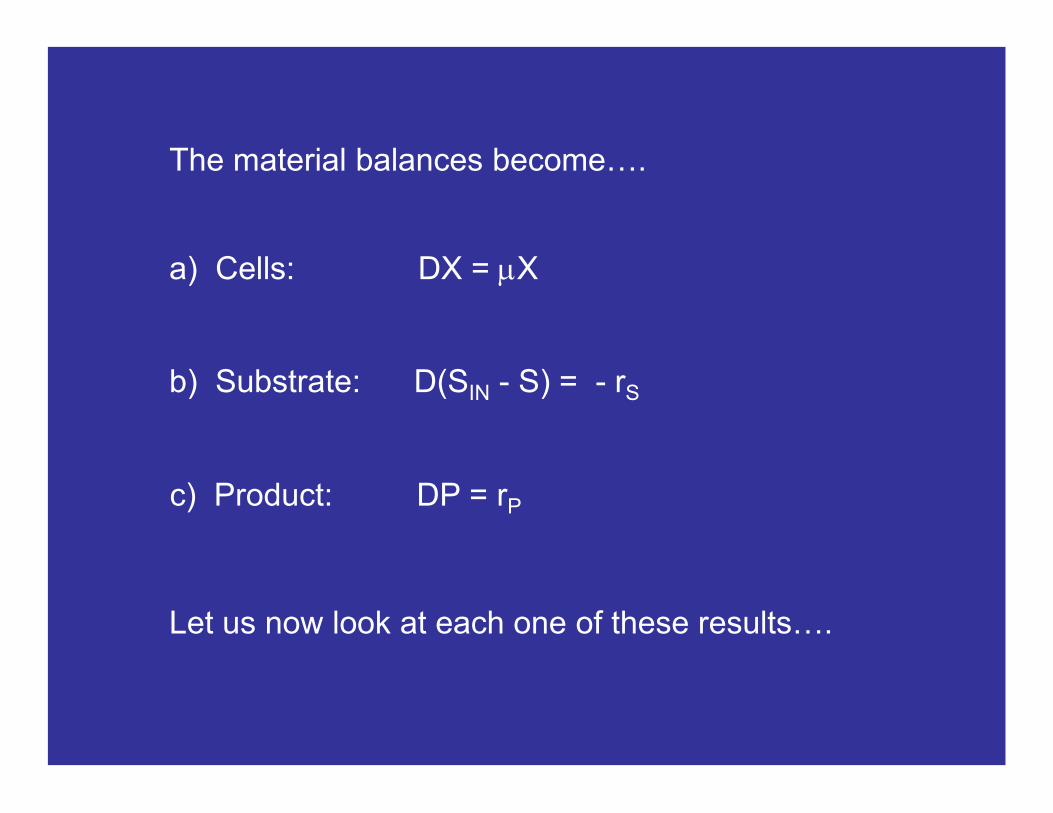
a) Cells: DX = mX
b) Substrate: D(SIN - S) = - rS
c) Product: DP = rP
The material balances become….
Let us now look at each one of these results….
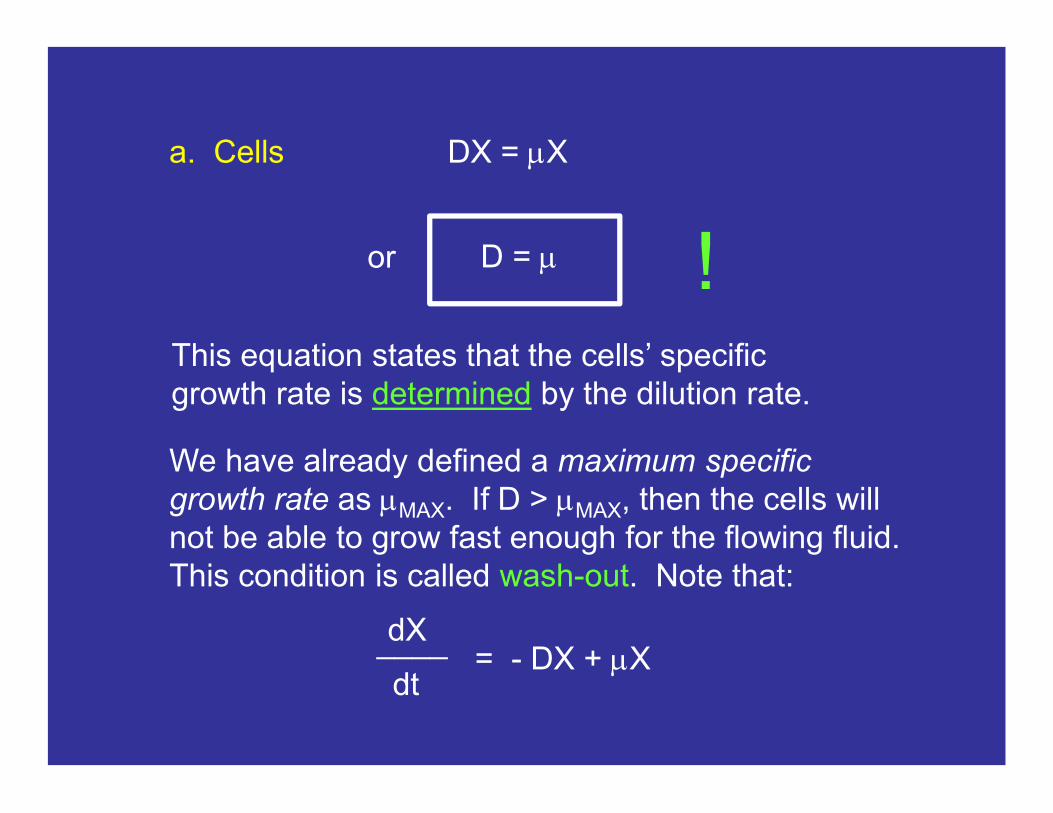
a. Cells DX = mX
D = mor !This equation states that the cells’ specific growth rate is determined by the dilution rate.
We have already defined a maximum specific growth rate as mMAX. If D > mMAX, then the cells will not be able to grow fast enough for the flowing fluid. This condition is called wash-out. Note that:
= - DX + mXdX
dt
____
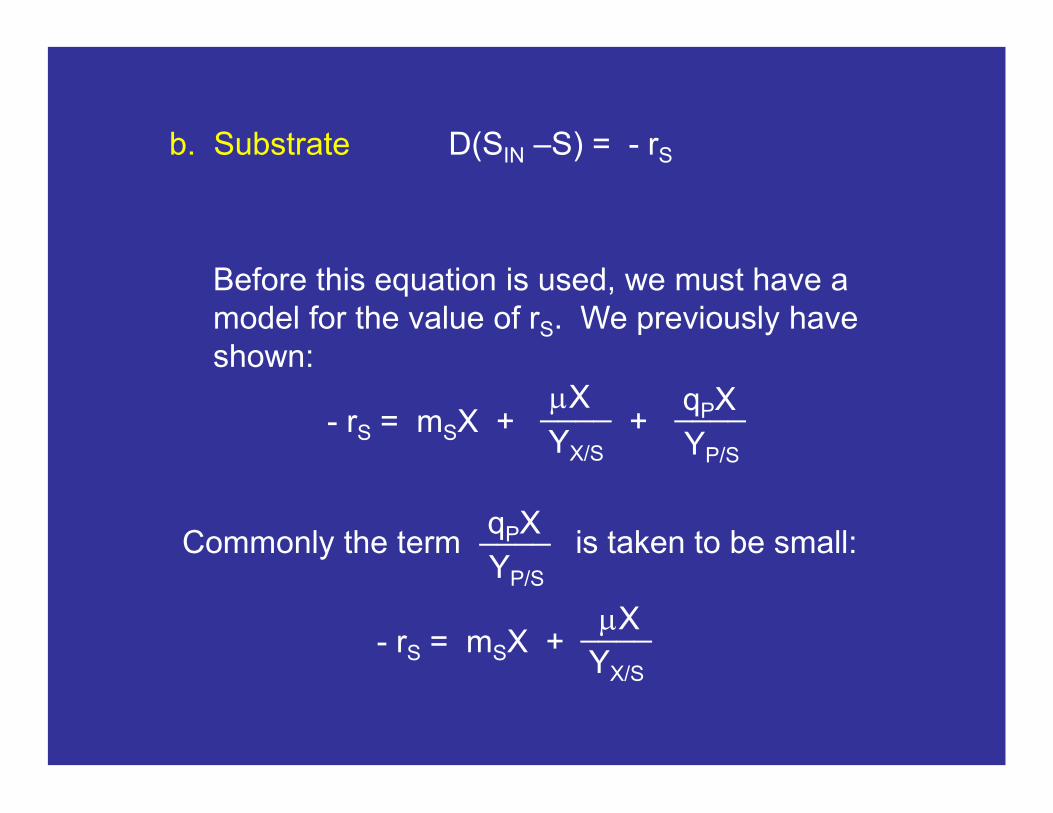
b. Substrate D(SIN –S) = - rS
Before this equation is used, we must have a model for the value of rS. We previously have shown:
- rS = mSX + + ____qPX
YP/S
mX
YX/S
____
Commonly the term is taken to be small:____qPX
YP/S
- rS = mSX + mX
YX/S
____
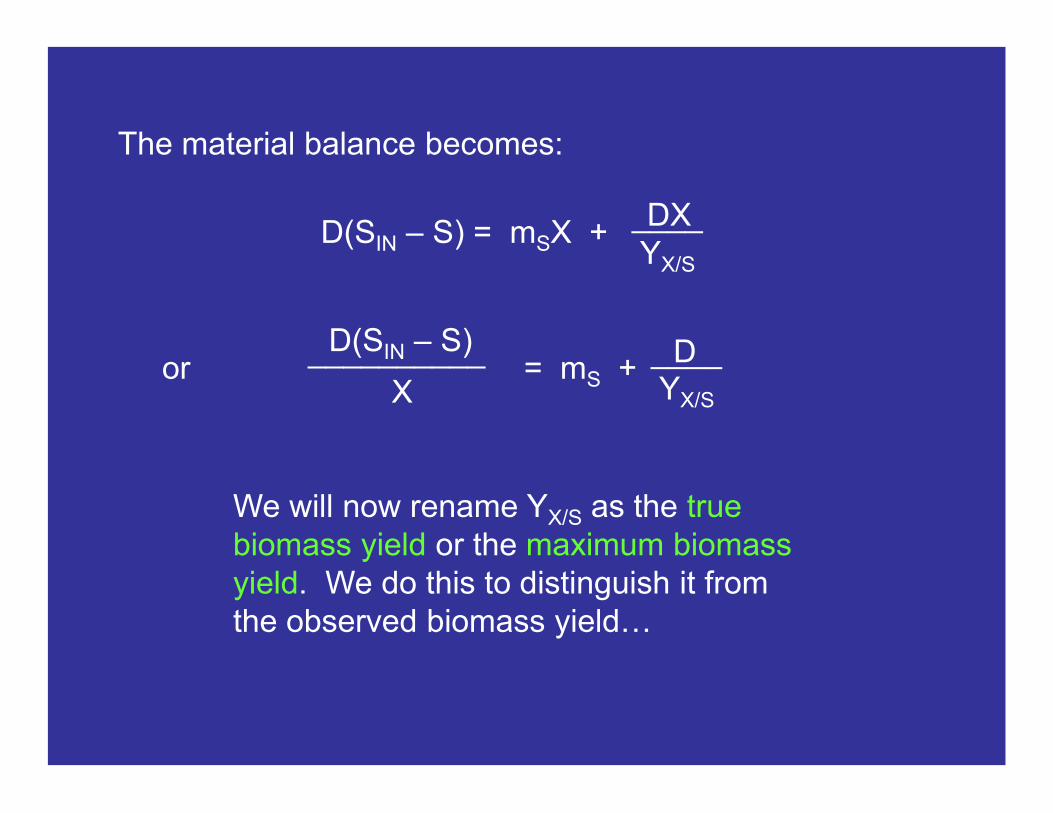
or = mS + D
YX/S
____D(SIN – S)__________
X
The material balance becomes:
D(SIN – S) = mSX + DXYX/S
____
We will now rename YX/S as the true biomass yield or the maximum biomass yield. We do this to distinguish it from the observed biomass yield…
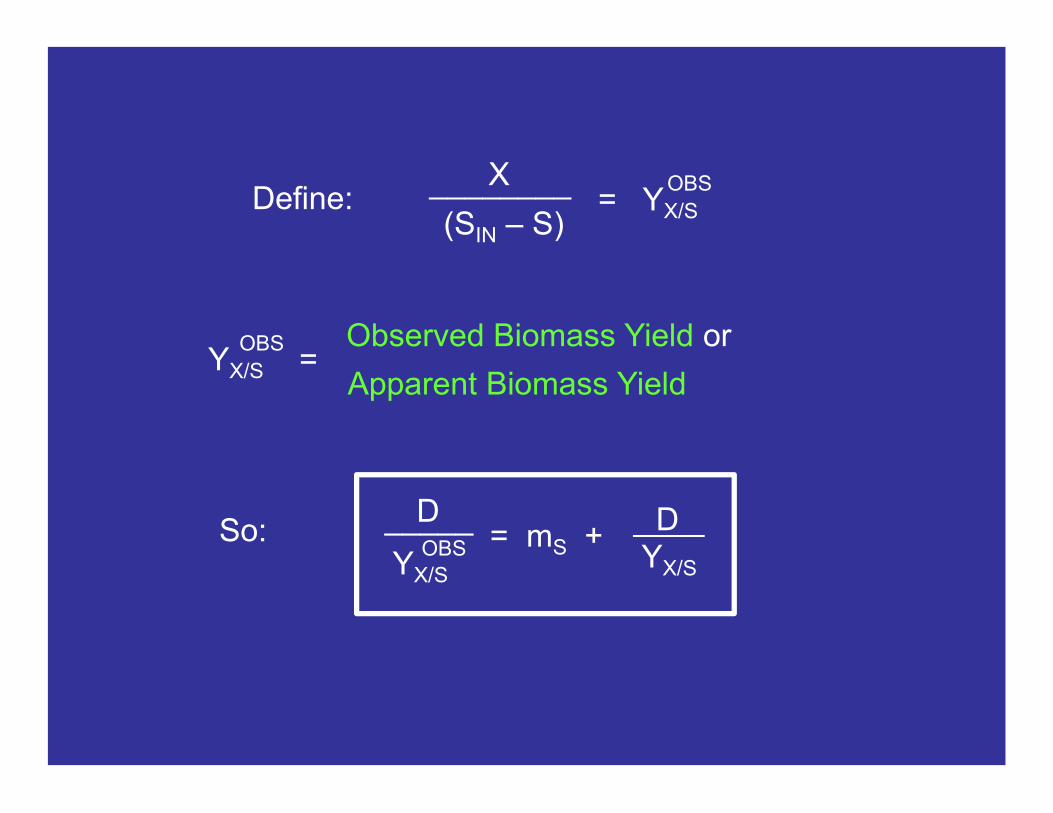
(SIN – S)
________X= YX/S
OBSDefine:
= mS + D
YX/S
____D_____
YX/S
OBSSo:
Observed Biomass Yield or
Apparent Biomass YieldYX/S =
OBS
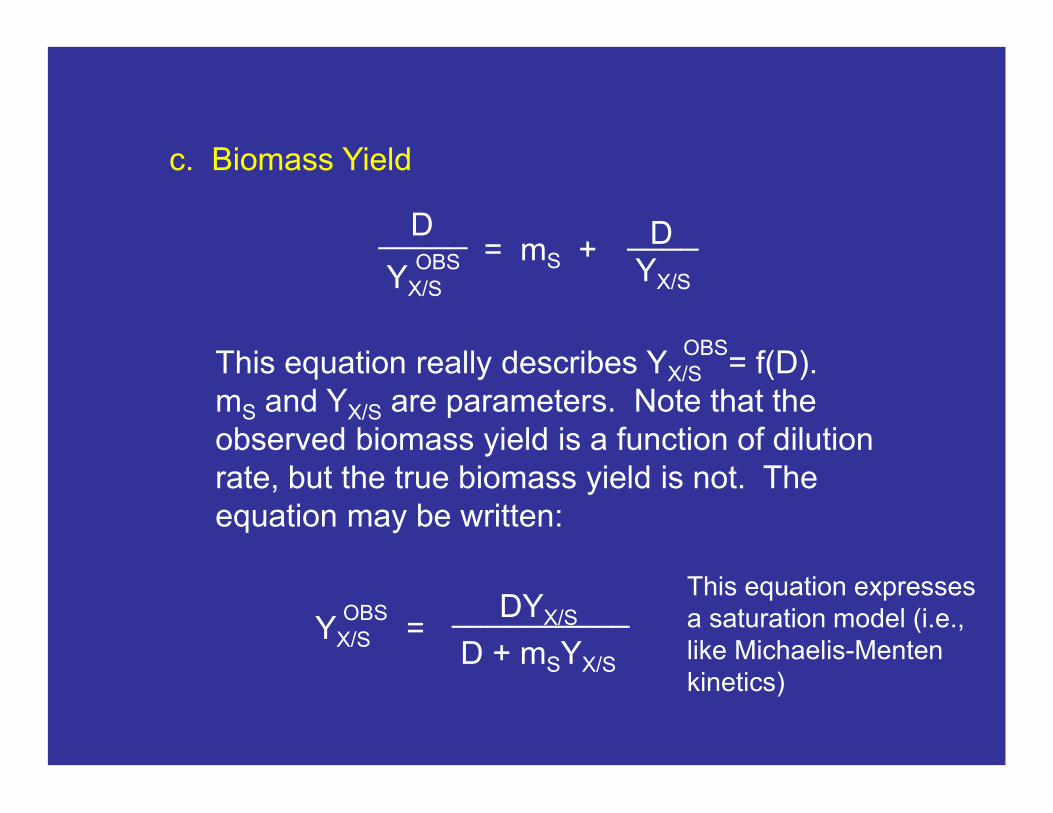
c. Biomass Yield
= mS + D
YX/S
____D_____
YX/S
OBS
DYX/S__________YX/S =
OBS
D + mSYX/S
This equation expresses a saturation model (i.e., like Michaelis-Mentenkinetics)
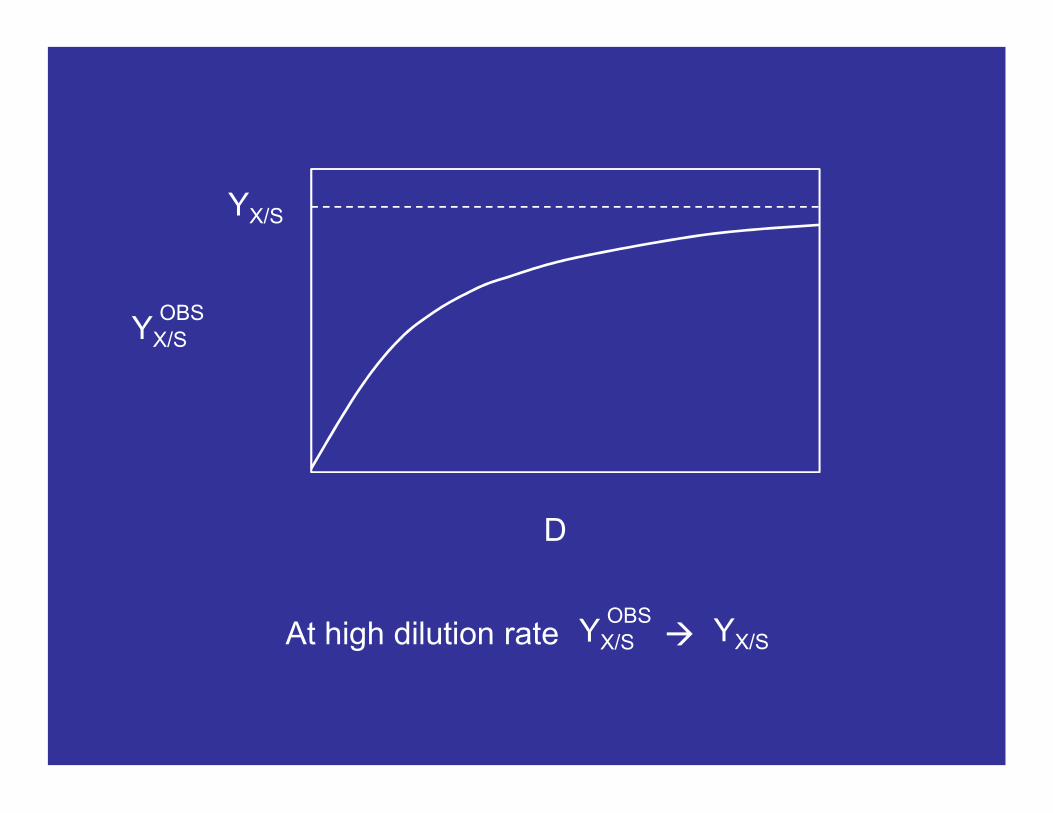
This equation really describes YX/S = f(D). mS and YX/S are parameters. Note that the observed biomass yield is a function of dilution rate, but the true biomass yield is not. The equation may be written:
OBS
YX/S
OBS
YX/S
D
YX/S
OBSAt high dilution rate YX/S
d. Calculation of Maintenance Coefficient and TrueBiomass Yield
The easiest way to determine the value of the maintenance coefficient and the true biomass yield is to conduct several chemostats at different dilution rates (D), and calculate the observed biomass yield. Then make one of three possible plots of data.
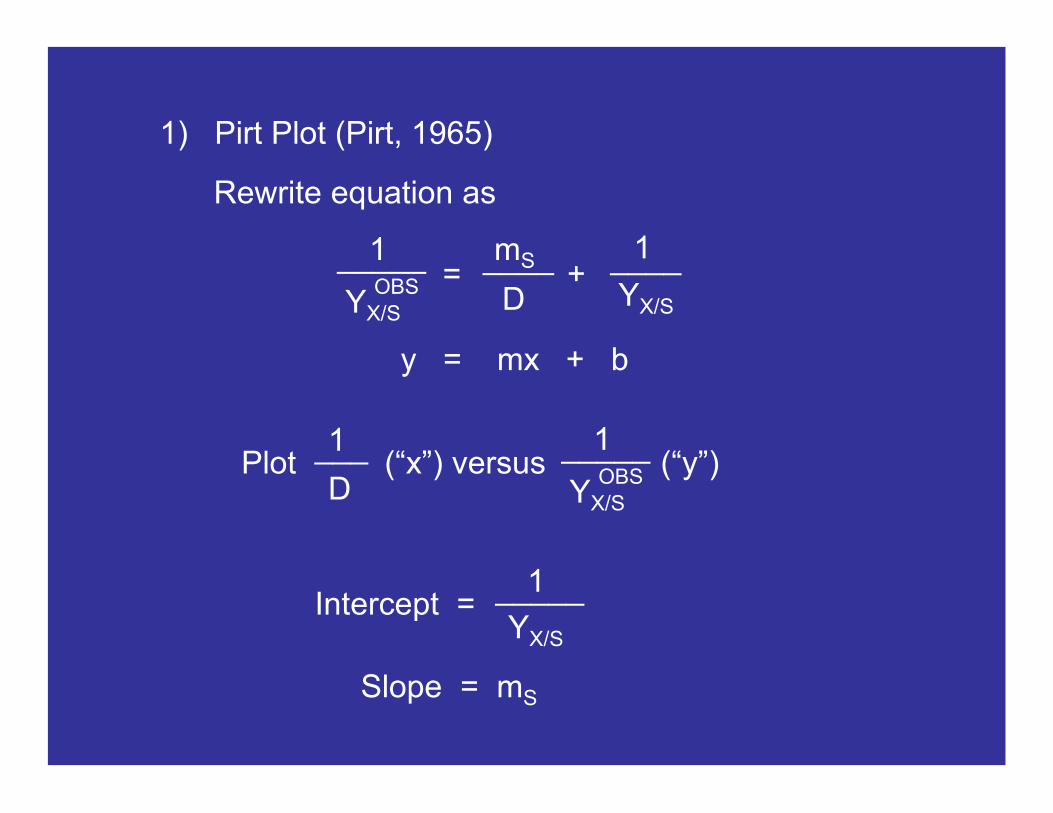
= + 1
YX/S
____1_____
YX/S
OBSD
____mS
y = mx + b
Plot (“x”) versus (“y”) 1_____
YX/S
OBS
1___
D
Intercept =
Slope = mS
1_____YX/S
1) Pirt Plot (Pirt, 1965)
Rewrite equation as
= + YX/SYX/S
OBS
y = mx + b
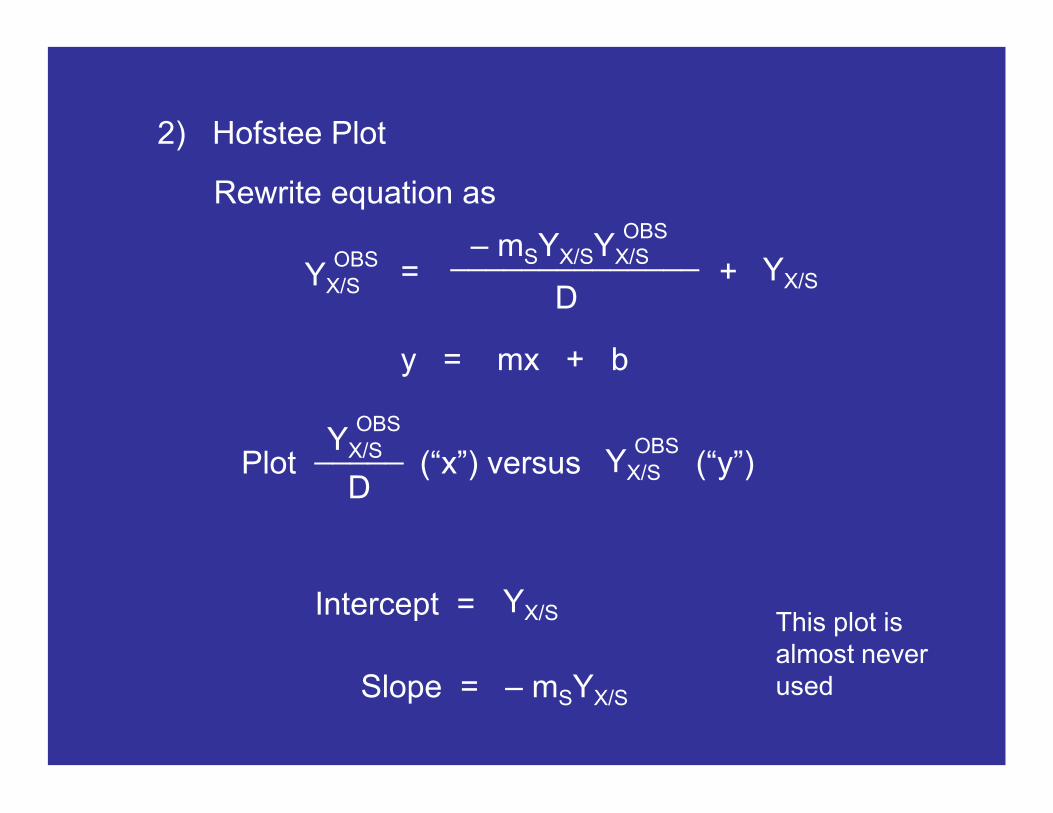
2) Hofstee Plot
Rewrite equation as
– mSYX/SYX/S
D
______________OBS
Plot (“x”) versus (“y”) YX/S
OBS_____
D
YX/S
OBS
Intercept =
Slope = – mSYX/S
YX/S This plot is almost never used
y = mx + b
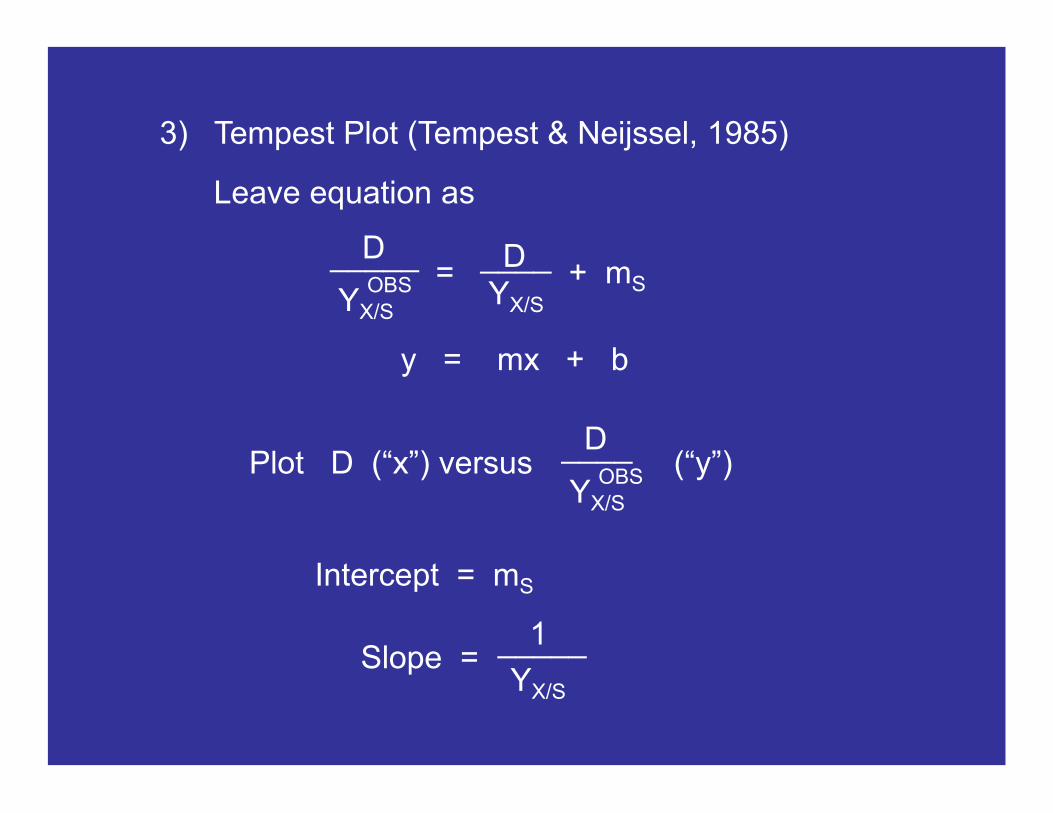
Plot D (“x”) versus (“y”) D____
YX/S
OBS
Intercept = mS
Slope =1_____
YX/S
3) Tempest Plot (Tempest & Neijssel, 1985)
Leave equation as
= + mSD
YX/S
____D_____
YX/S
OBS
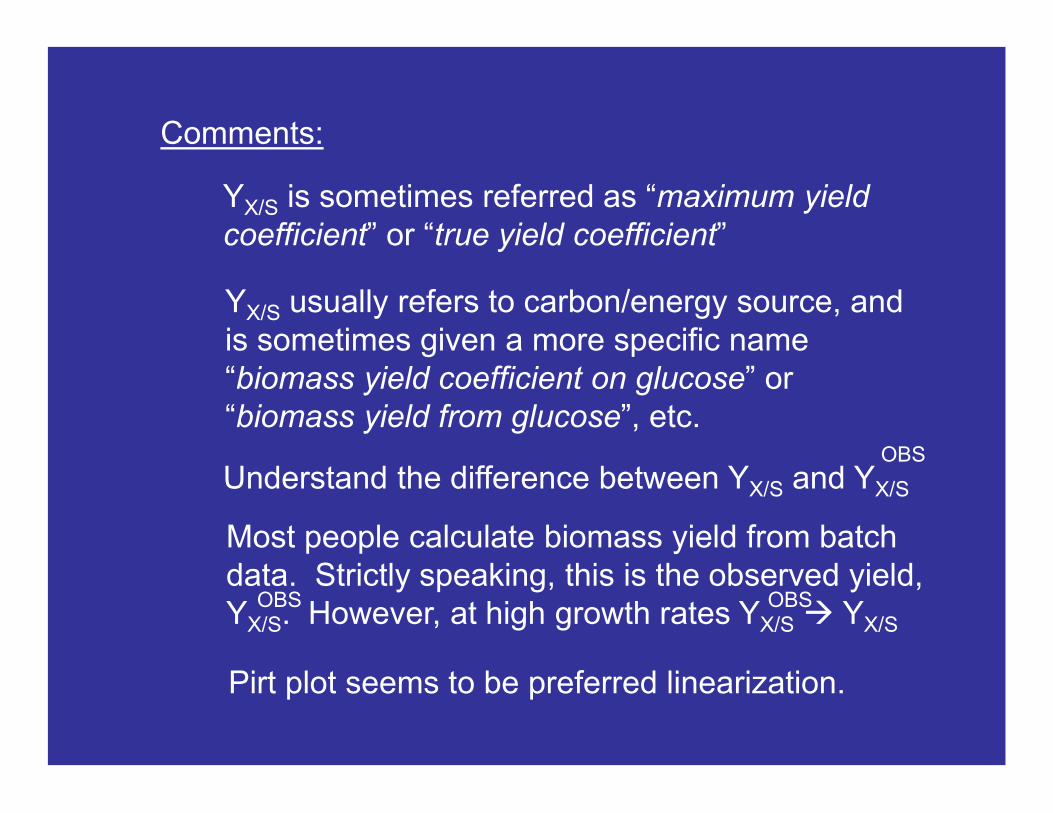
Comments:
OBS
Understand the difference between YX/S and YX/S
Most people calculate biomass yield from batch data. Strictly speaking, this is the observed yield, YX/S. However, at high growth rates YX/S YX/S
OBS OBS
YX/S is sometimes referred as “maximum yield coefficient” or “true yield coefficient”
Pirt plot seems to be preferred linearization.
YX/S usually refers to carbon/energy source, and is sometimes given a more specific name “biomass yield coefficient on glucose” or “biomass yield from glucose”, etc.
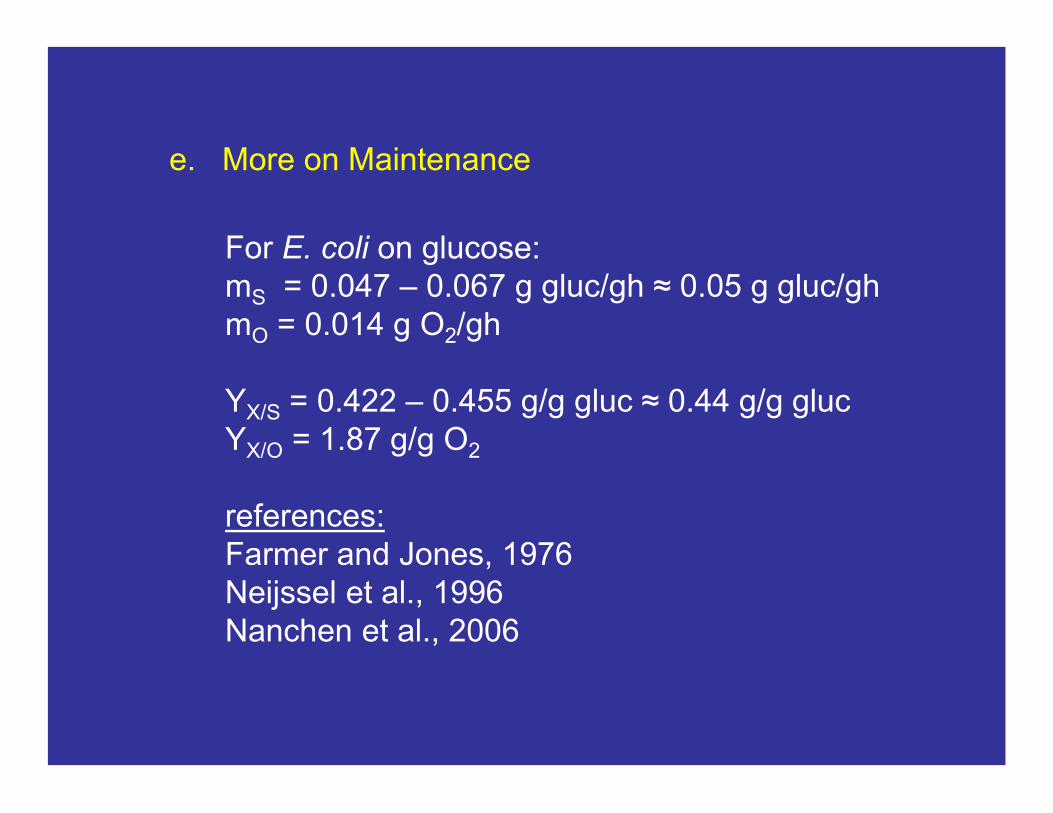
e. More on Maintenance
For E. coli on glucose:mS = 0.047 – 0.067 g gluc/gh ≈ 0.05 g gluc/ghmO = 0.014 g O2/gh
YX/S = 0.422 – 0.455 g/g gluc ≈ 0.44 g/g glucYX/O = 1.87 g/g O2
references:Farmer and Jones, 1976Neijssel et al., 1996Nanchen et al., 2006
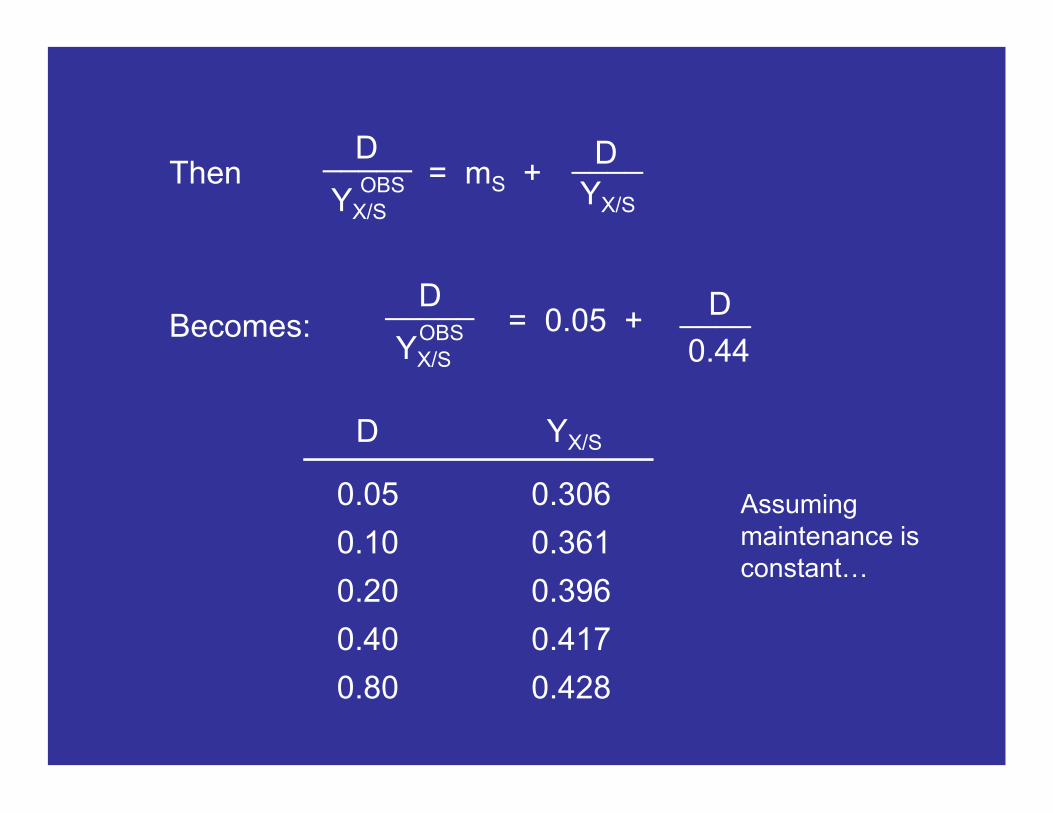
Then
Becomes:
= mS + D
YX/S
____D_____
YX/S
OBS
= 0.05 + D
0.44____D_____
YX/S
OBS
D YX/S
0.05 0.306
0.10 0.361
0.20 0.396
0.40 0.417
0.80 0.428
Assuming maintenance is constant…
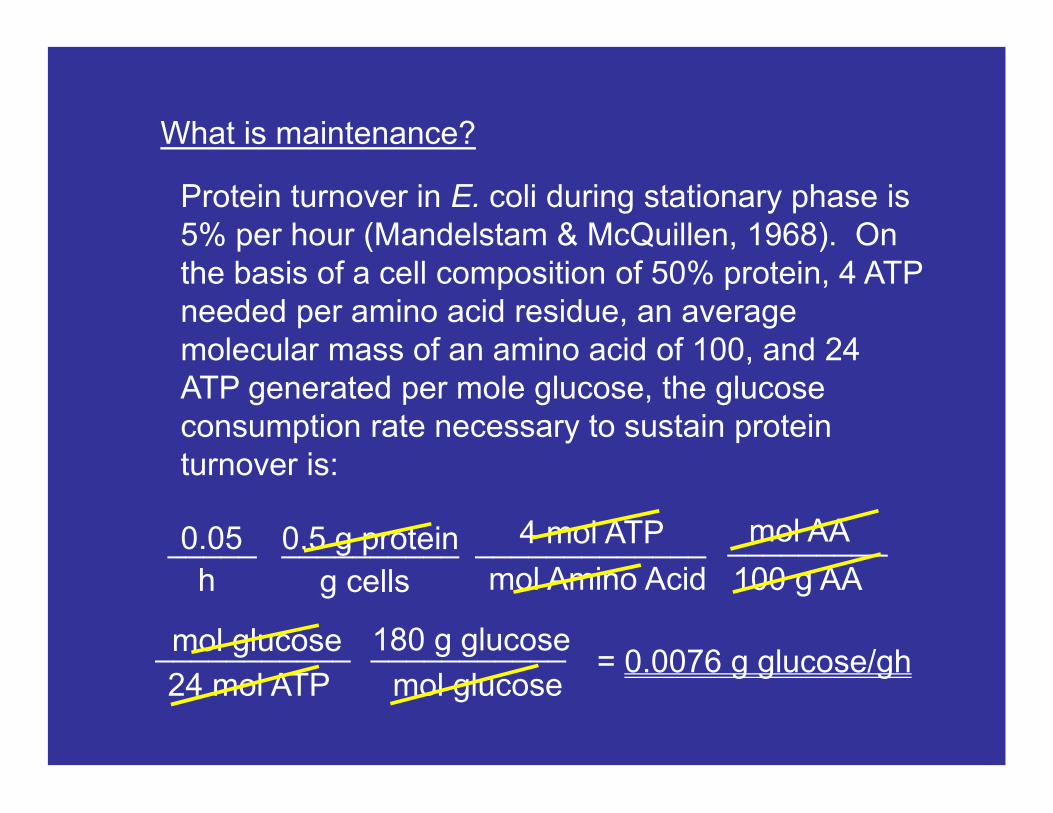
What is maintenance?
Protein turnover in E. coli during stationary phase is 5% per hour (Mandelstam & McQuillen, 1968). On the basis of a cell composition of 50% protein, 4 ATP needed per amino acid residue, an average molecular mass of an amino acid of 100, and 24 ATP generated per mole glucose, the glucose consumption rate necessary to sustain protein turnover is:
0.05_____h
0.5 g protein__________g cells
4 mol ATP_____________mol Amino Acid
mol AA_________100 g AA
mol glucose___________24 mol ATP mol glucose
___________180 g glucose= 0.0076 g glucose/gh
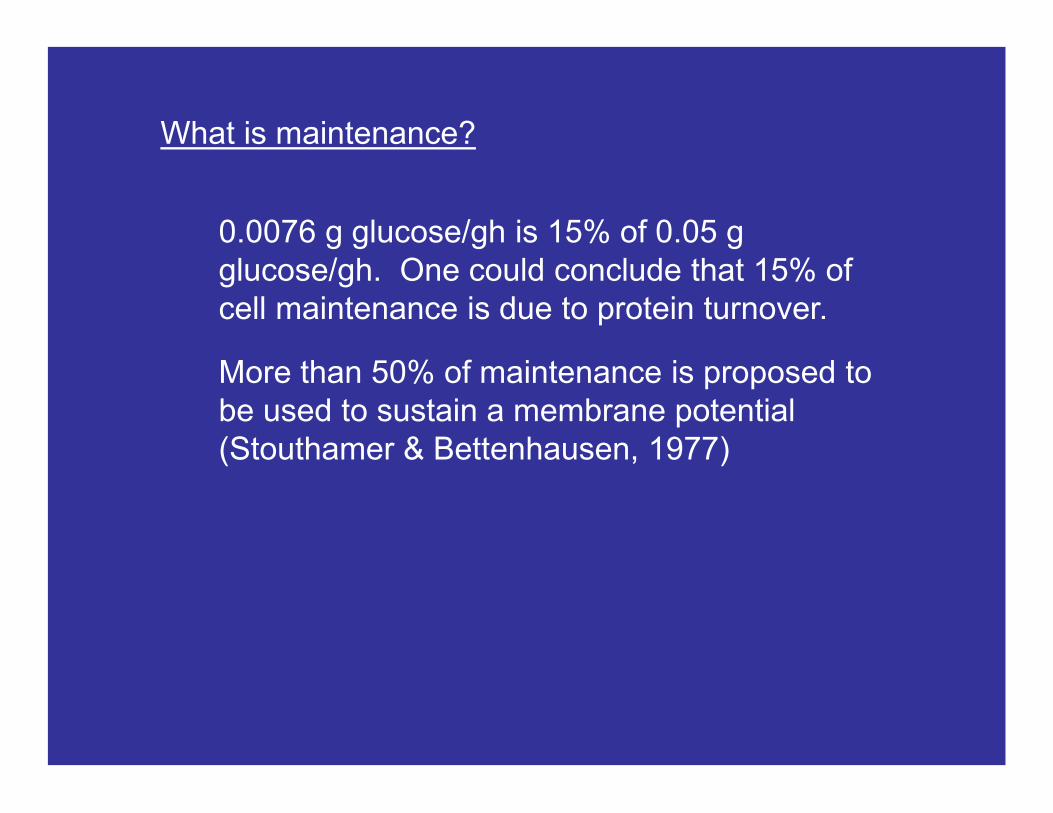
What is maintenance?
0.0076 g glucose/gh is 15% of 0.05 g glucose/gh. One could conclude that 15% of cell maintenance is due to protein turnover.
More than 50% of maintenance is proposed to be used to sustain a membrane potential (Stouthamer & Bettenhausen, 1977)
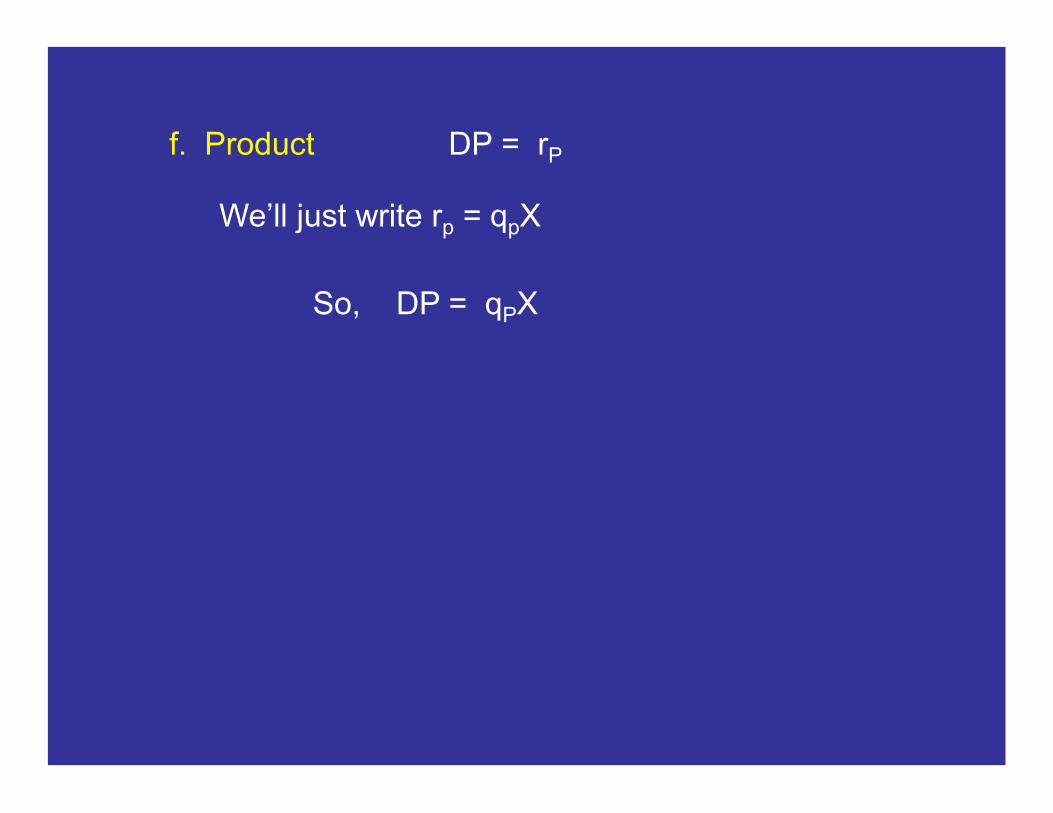
We’ll just write rp = qpX
f. Product DP = rP
So, DP = qPX
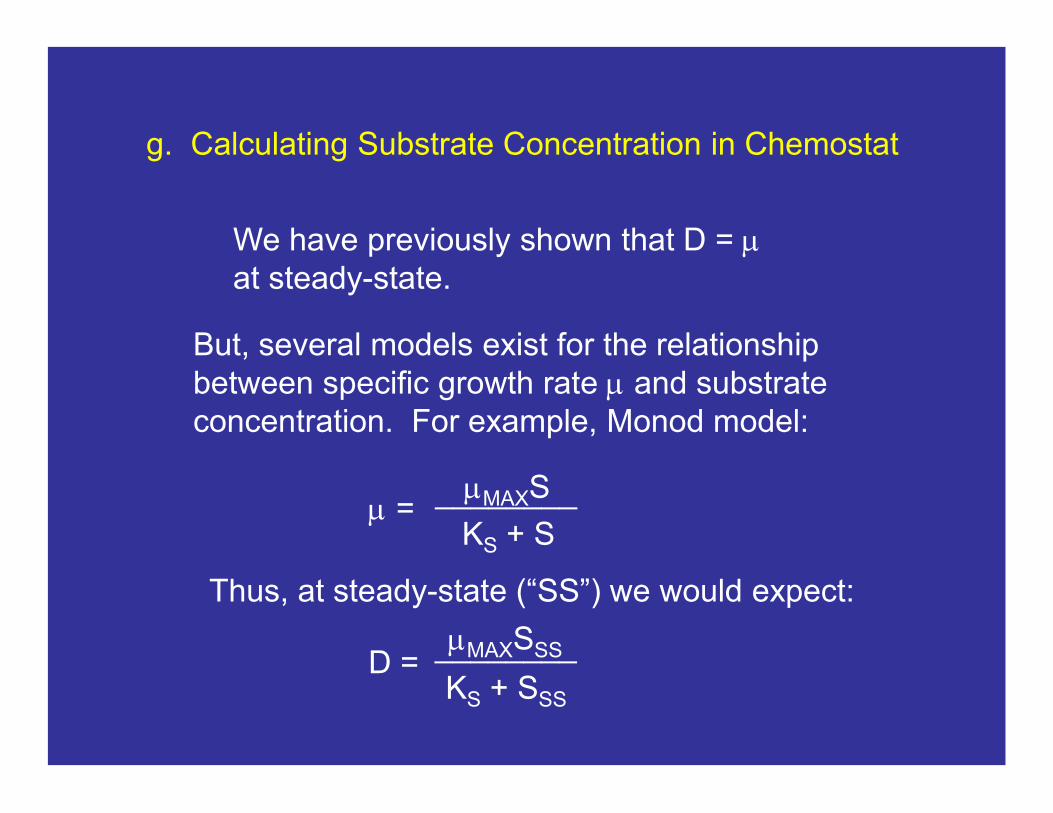
g. Calculating Substrate Concentration in Chemostat
We have previously shown that D = m at steady-state.
But, several models exist for the relationship between specific growth rate m and substrate concentration. For example, Monod model:
mMAXS________
KS + Sm =
Thus, at steady-state (“SS”) we would expect:
mMAXSSS________
KS + SSS
D =
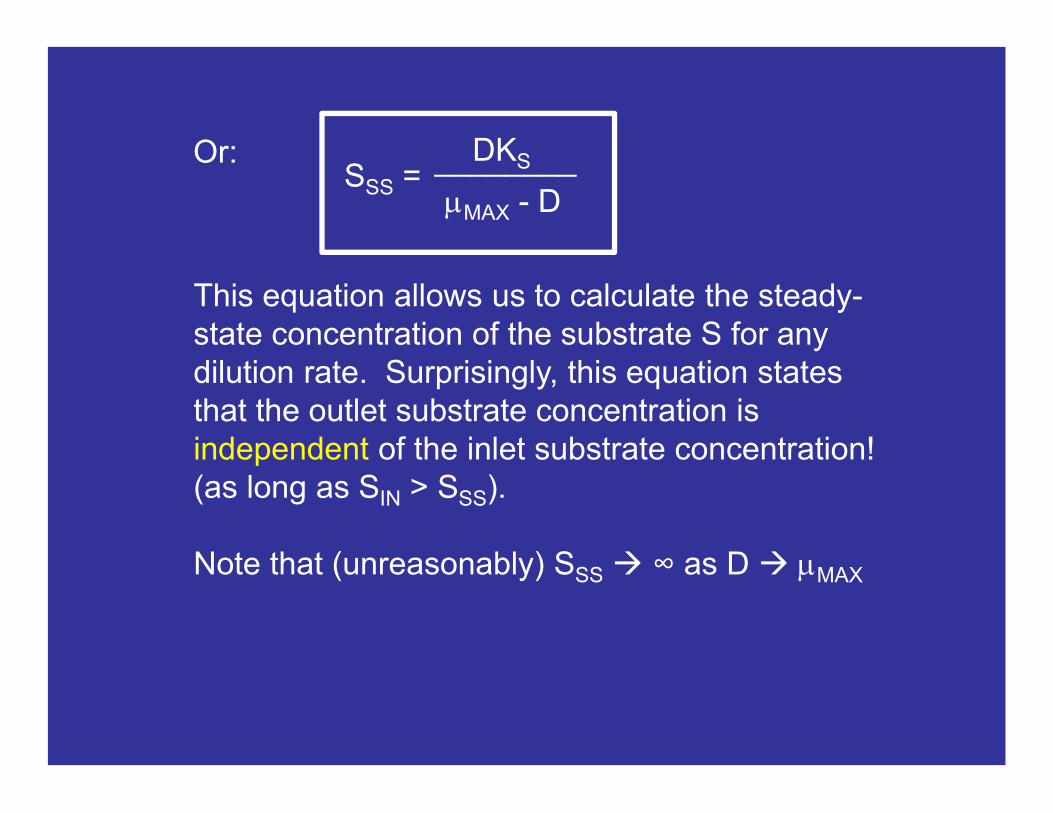
This equation allows us to calculate the steady-state concentration of the substrate S for any dilution rate. Surprisingly, this equation states that the outlet substrate concentration is independent of the inlet substrate concentration! (as long as SIN > SSS).
Note that (unreasonably) SSS ∞ as D mMAX
Or: DKS________
mMAX - DSSS =
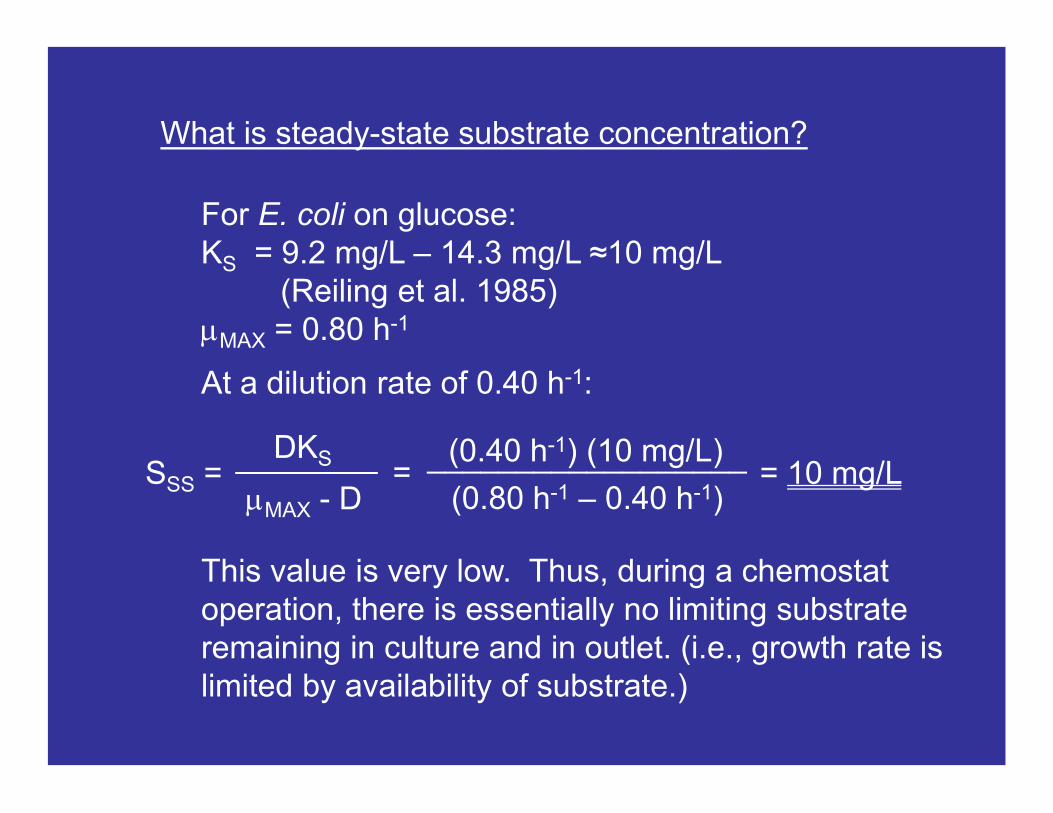
What is steady-state substrate concentration?
For E. coli on glucose:KS = 9.2 mg/L – 14.3 mg/L ≈10 mg/L
(Reiling et al. 1985)mMAX = 0.80 h-1
At a dilution rate of 0.40 h-1:
This value is very low. Thus, during a chemostatoperation, there is essentially no limiting substrate remaining in culture and in outlet. (i.e., growth rate is limited by availability of substrate.)
DKS________
mMAX - DSSS =
(0.40 h-1) (10 mg/L)__________________
(0.80 h-1 – 0.40 h-1)= = 10 mg/L
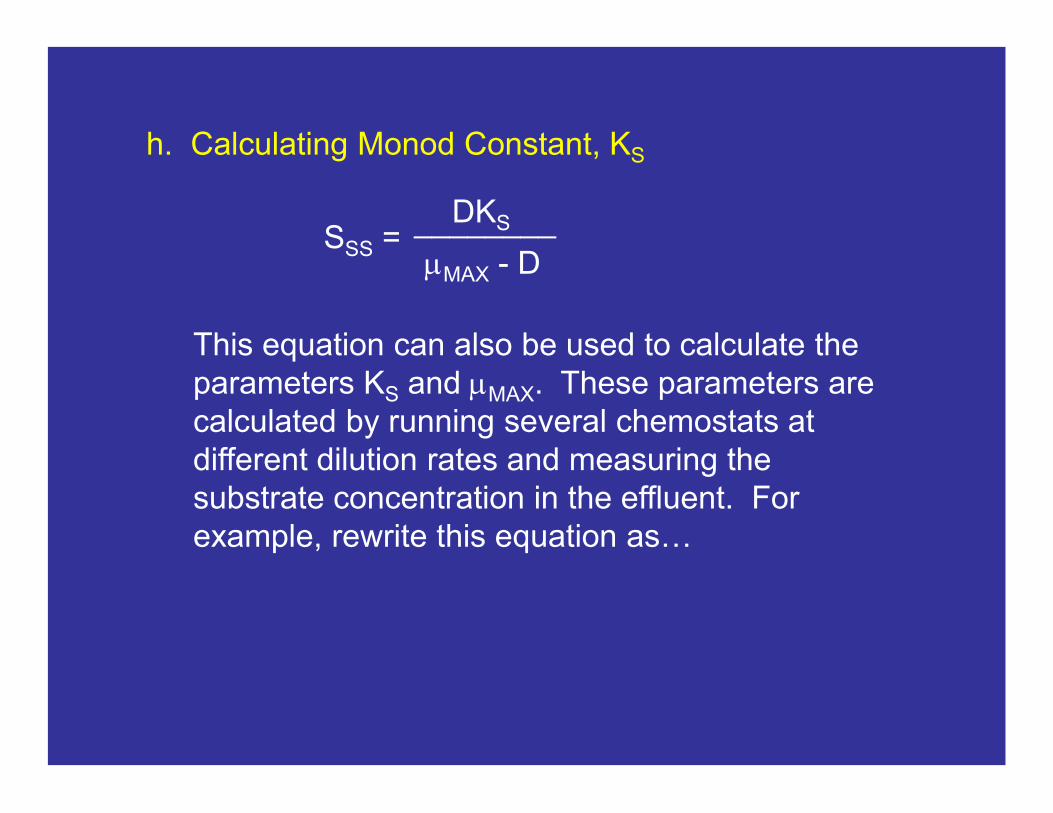
h. Calculating Monod Constant, KS
This equation can also be used to calculate the parameters KS and mMAX. These parameters are calculated by running several chemostats at different dilution rates and measuring the substrate concentration in the effluent. For example, rewrite this equation as…
DKS________
mMAX - DSSS =
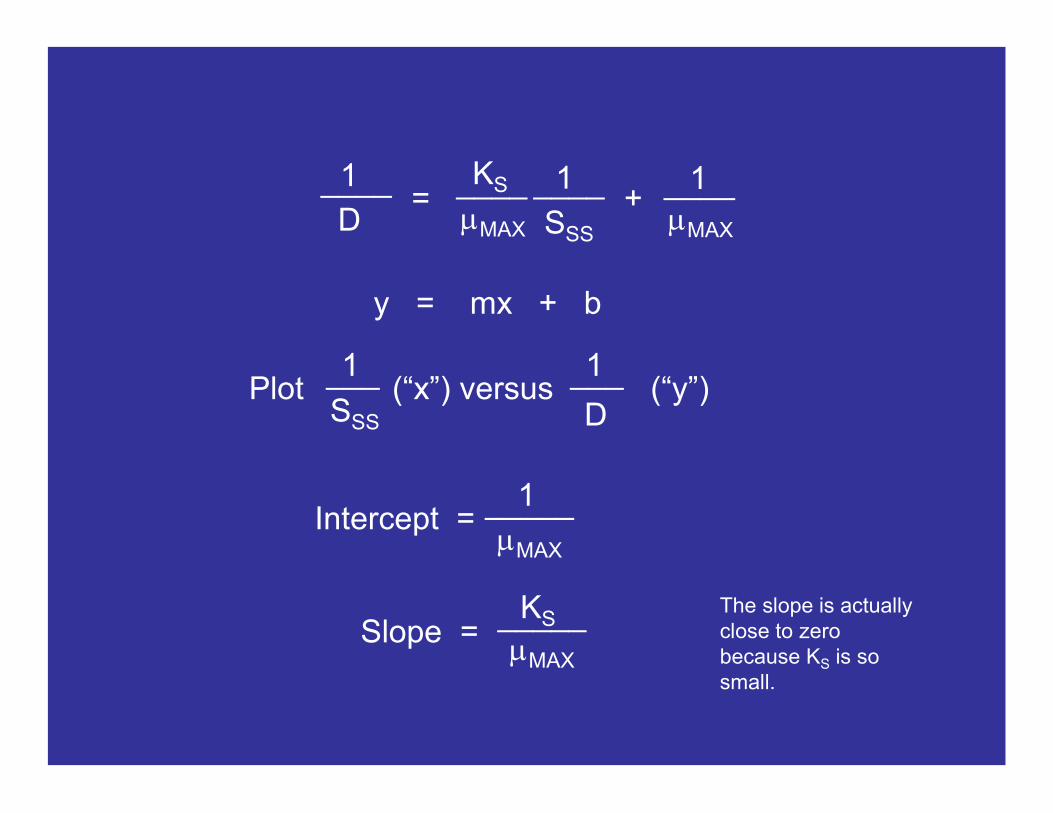
y = mx + b
= + KS
mMAX
____1____D
1
SSS
____mMAX
____
Intercept =
Slope =KS_____
mMAX
1_____mMAX
The slope is actually close to zero because KS is so small.
1
Plot (“x”) versus (“y”) 1___ 1___
DSSS
i. Industrial Use of a Chemostat
Disadvantages:
• Product is diluted by all that feed; product never gets a chance to accumulate.
• Contamination is fatal. Because system is open and longer-lasting, it is also more subject to contamination.
• Evolution. The desired characteristics of a microbe can be lost if they don’t confer an evolutionary advantage.
So, when would a chemostat be used?
• When product concentration is not relevant, or diluted product is desirable.
• When contamination is desirable.• When evolution/selection of characteristics is
desirable.
Specifically:1. Wastewater Treatment2. Biomining
j. Why conduct a laboratory chemostat experiment?
• To vary growth rate with no other change in the environment.
• To fix growth rate while changing the environment.
• To maintain substrate-limited growth with a constant growth rate.
• To determine the best growth rate to operate a fed-batch process.
j. Why conduct a laboratory chemostat experiment? (cont’d)
• To determine how product is formed relative to substrate consumption. (e.g., is product positively growth associated, negatively growth associated, etc.)
• To study evolution at a reasonable time-scale. Or, to intentionally evolve a strain for desired characteristics.
• To measure physiological fluxes.• To affect metabolism in cases where a
particular substrate limitation is advantageous.
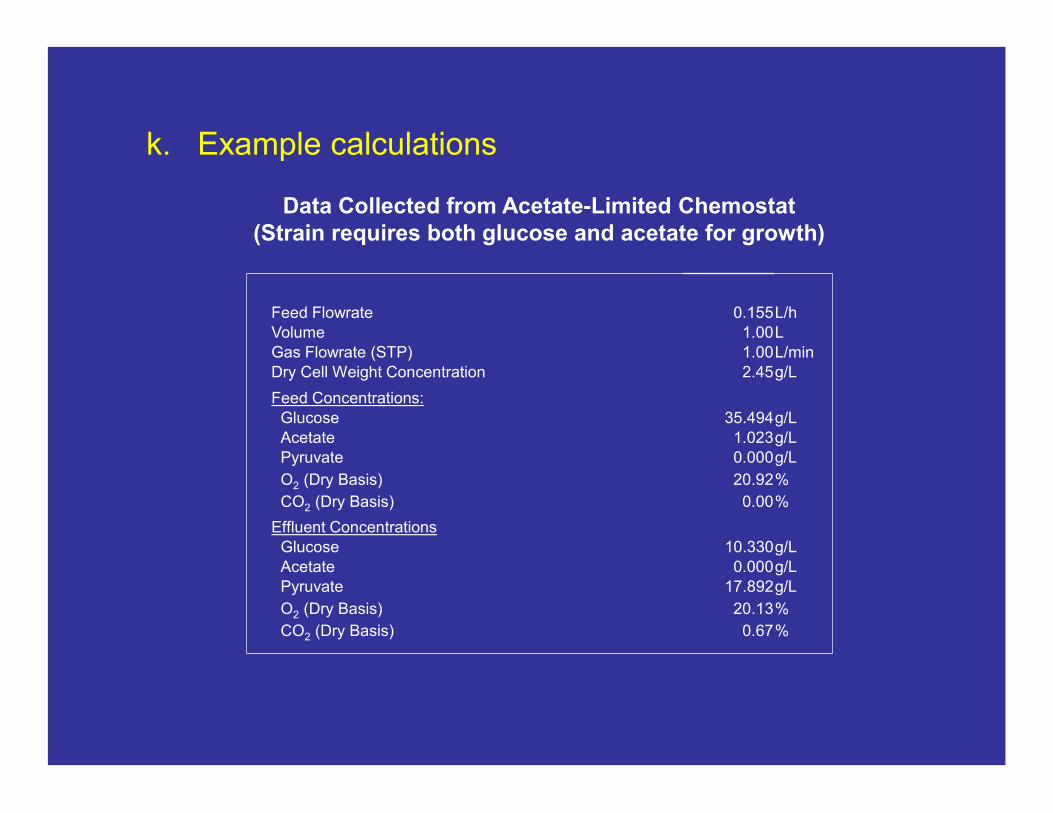
k. Example calculations
Data Collected from Acetate-Limited Chemostat(Strain requires both glucose and acetate for growth)
Feed Flowrate 0.155L/hVolume 1.00LGas Flowrate (STP) 1.00L/minDry Cell Weight Concentration 2.45g/L
Feed Concentrations:Glucose 35.494g/LAcetate 1.023g/LPyruvate 0.000g/L
O2 (Dry Basis) 20.92%
CO2 (Dry Basis) 0.00%
Effluent ConcentrationsGlucose 10.330g/LAcetate 0.000g/LPyruvate 17.892g/L
O2 (Dry Basis) 20.13%
CO2 (Dry Basis) 0.67%
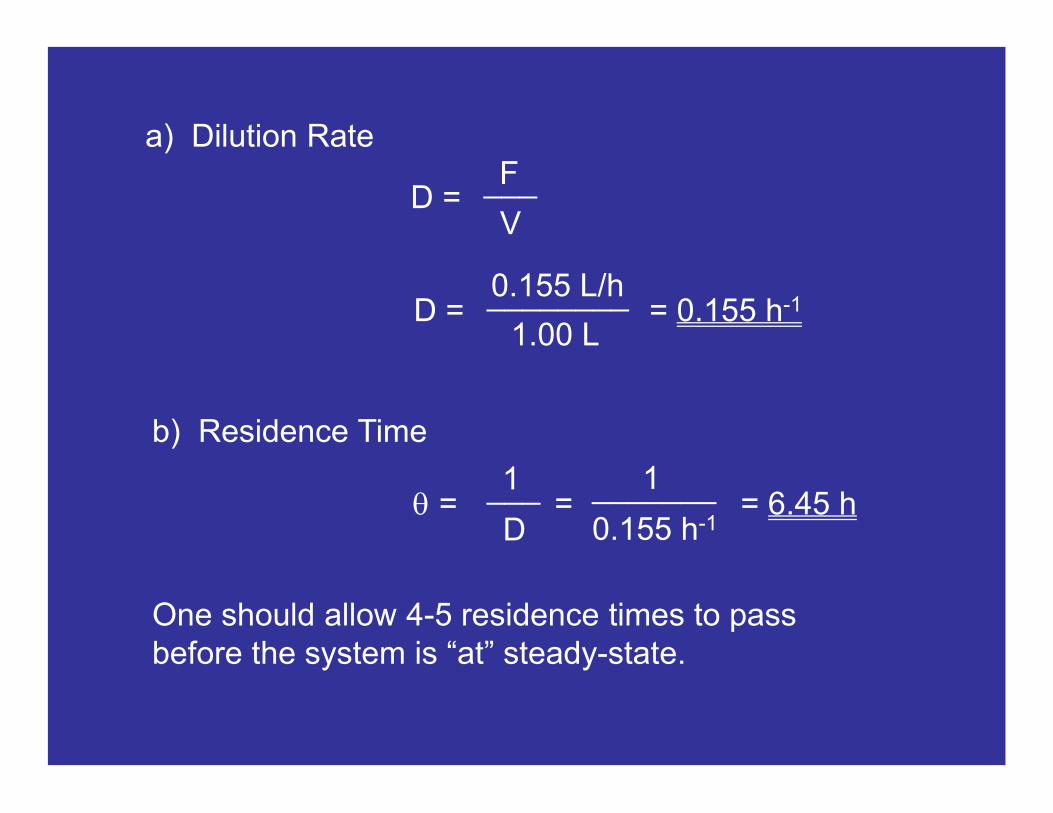
a) Dilution Rate
D =F
V
___
D = = 0.155 h-10.155 L/h
1.00 L
________
b) Residence Time
= = = 6.45 h 1
D
___ 1
0.155 h-1
_______
One should allow 4-5 residence times to pass before the system is “at” steady-state.
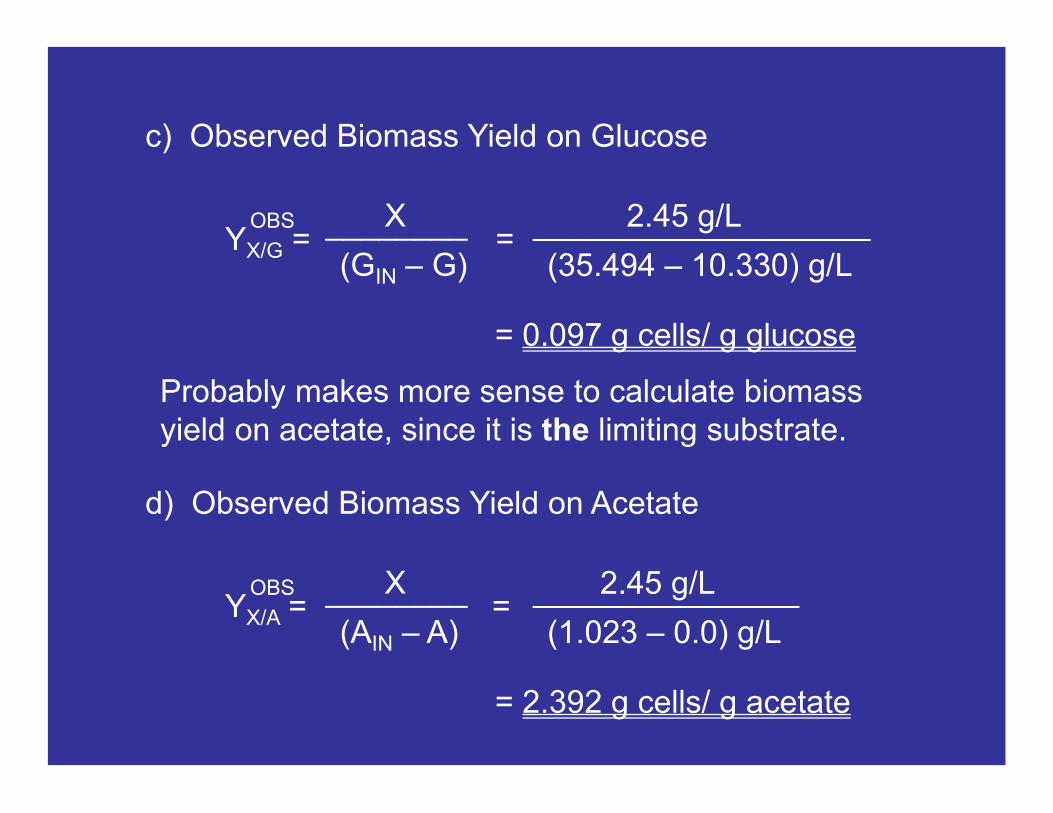
c) Observed Biomass Yield on Glucose
YX/G = =
Probably makes more sense to calculate biomass yield on acetate, since it is the limiting substrate.
OBS
(GIN – G)
________X
(35.494 – 10.330) g/L
___________________2.45 g/L
= 0.097 g cells/ g glucose
d) Observed Biomass Yield on Acetate
YX/A = =OBS
(AIN – A)
________X
(1.023 – 0.0) g/L
_______________2.45 g/L
= 2.392 g cells/ g acetate
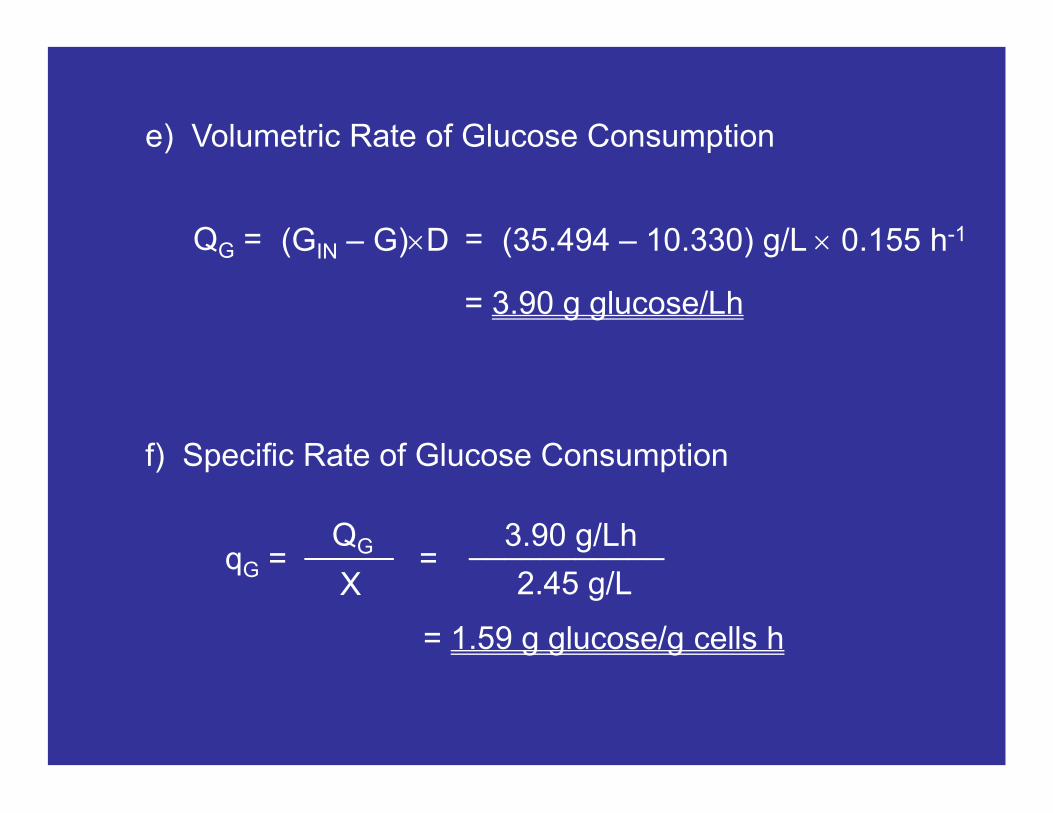
e) Volumetric Rate of Glucose Consumption
QG = =(GIN – G)D (35.494 – 10.330) g/L 0.155 h-1
= 3.90 g glucose/Lh
f) Specific Rate of Glucose Consumption
qG = =X
_____QG
2.45 g/L
___________3.90 g/Lh
= 1.59 g glucose/g cells h
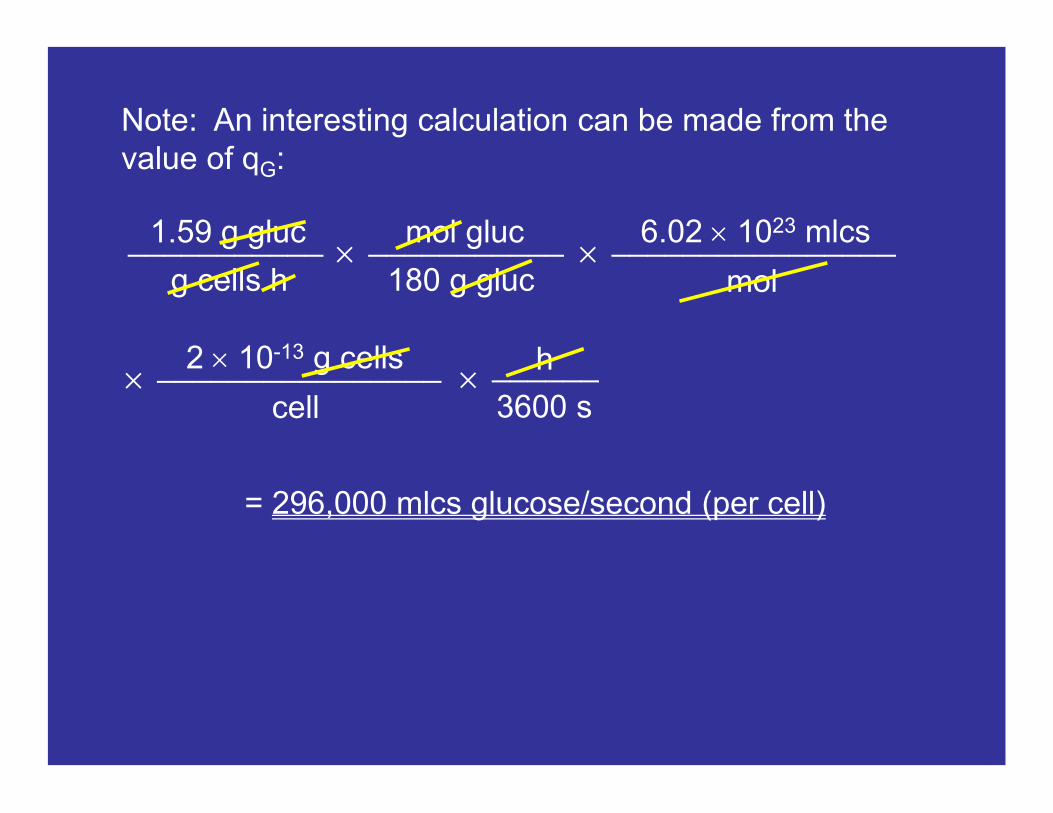
Note: An interesting calculation can be made from the value of qG:
g cells h
___________1.59 g gluc
= 296,000 mlcs glucose/second (per cell)
180 g gluc
___________mol gluc
mol
________________6.02 1023 mlcs
cell
________________2 10-13 g cells
3600 s
______h
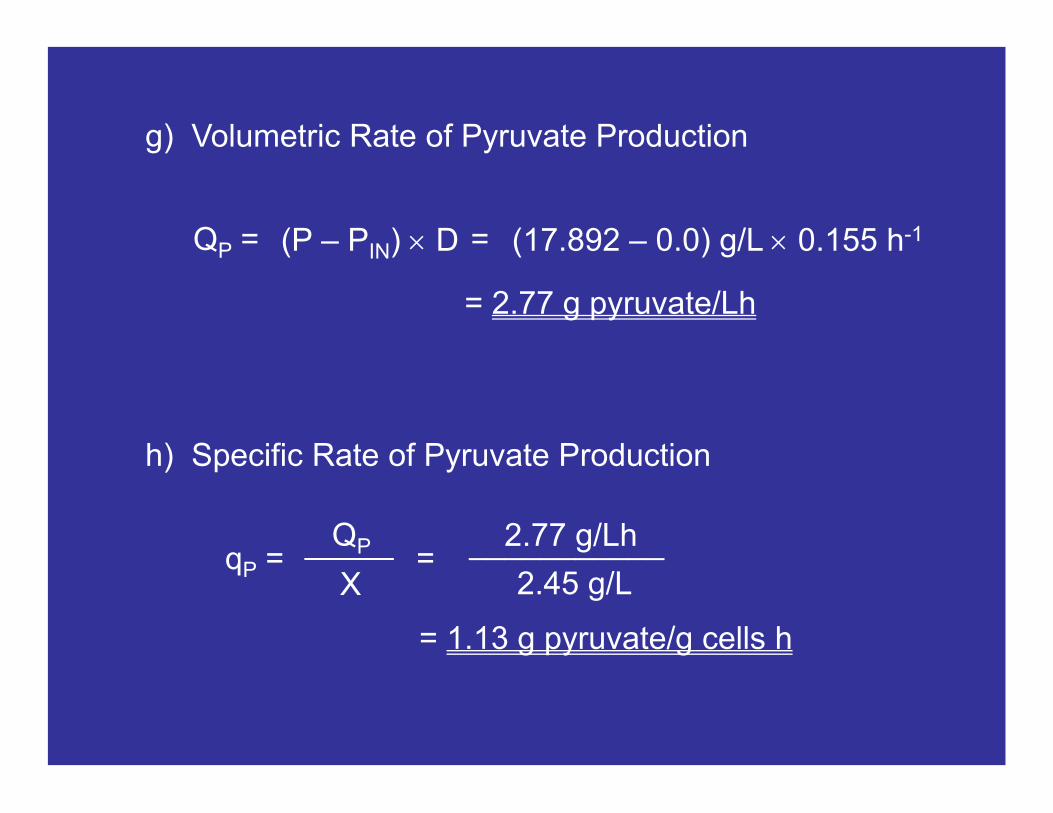
g) Volumetric Rate of Pyruvate Production
QP = =(P – PIN) D (17.892 – 0.0) g/L 0.155 h-1
= 2.77 g pyruvate/Lh
h) Specific Rate of Pyruvate Production
qP = =X
_____QP
2.45 g/L
___________2.77 g/Lh
= 1.13 g pyruvate/g cells h
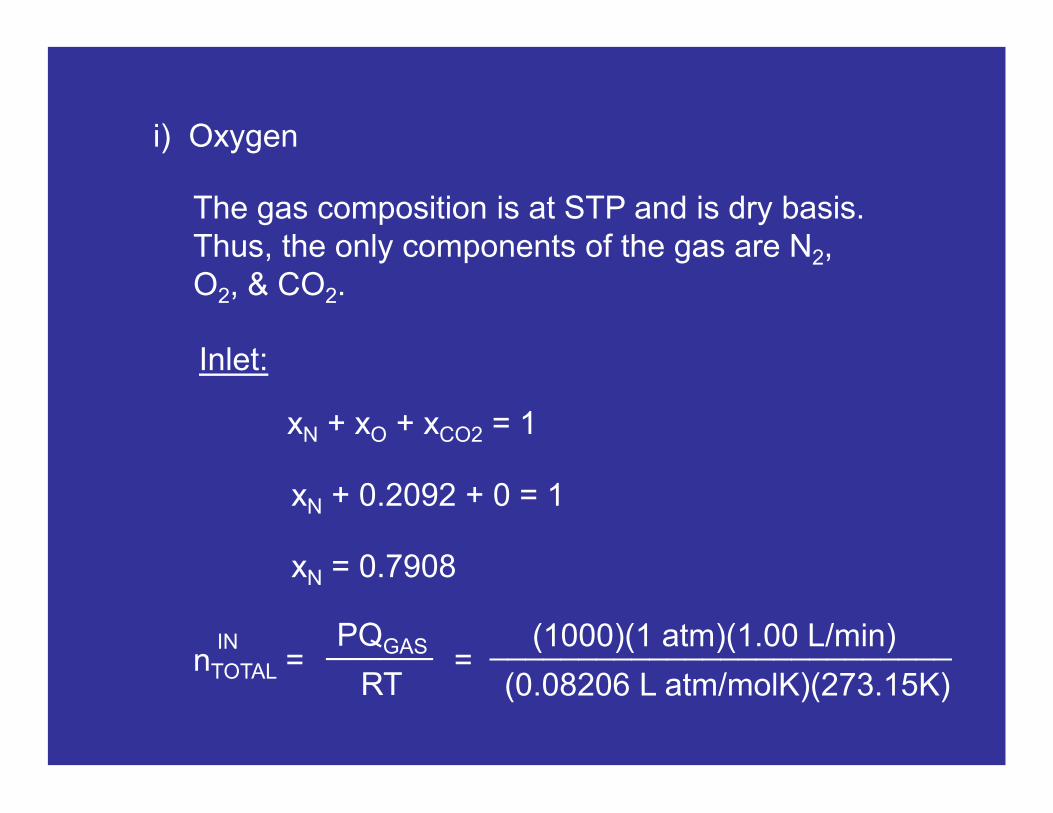
i) Oxygen
The gas composition is at STP and is dry basis. Thus, the only components of the gas are N2, O2, & CO2.
Inlet:
xN + xO + xCO2 = 1
xN + 0.2092 + 0 = 1
xN = 0.7908
RT
______PQGASnTOTAL = =
(0.08206 L atm/molK)(273.15K)
__________________________(1000)(1 atm)(1.00 L/min)IN
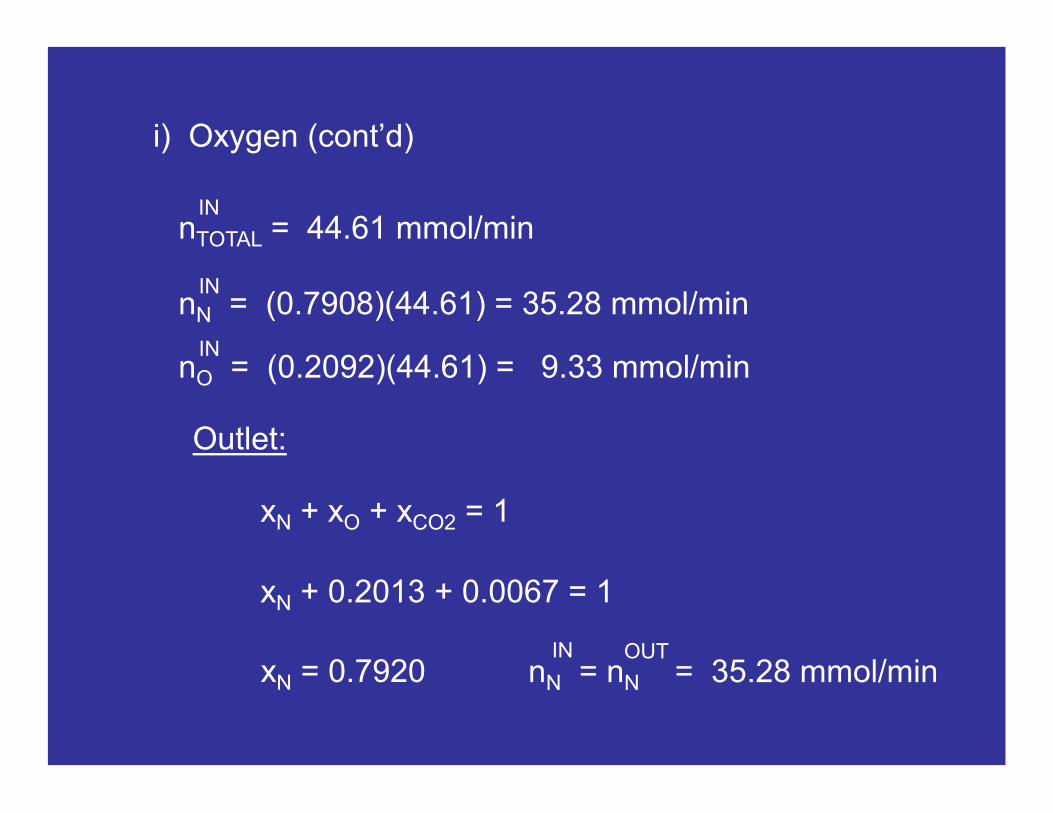
i) Oxygen (cont’d)
nTOTAL = 44.61 mmol/min
nN = (0.7908)(44.61) = 35.28 mmol/min
nO = (0.2092)(44.61) = 9.33 mmol/min
IN
IN
IN
Outlet:
xN + xO + xCO2 = 1
xN + 0.2013 + 0.0067 = 1
xN = 0.7920 nN = nN = 35.28 mmol/min OUTIN
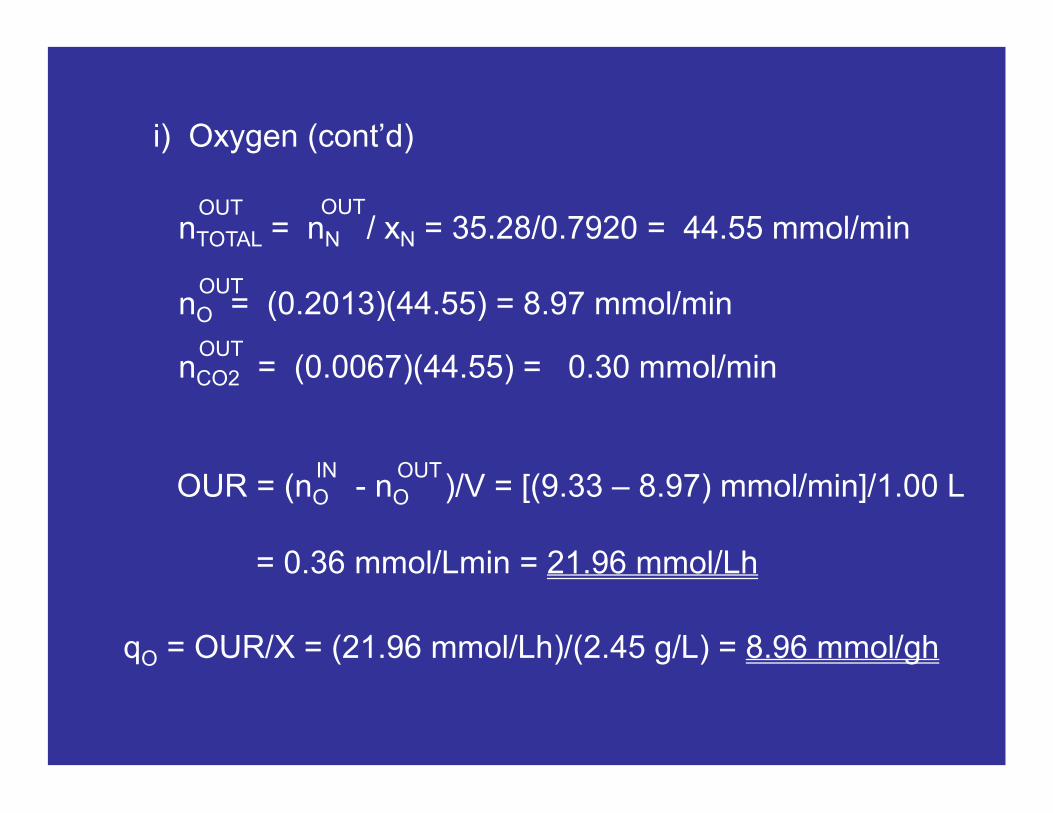
i) Oxygen (cont’d)
nTOTAL = nN / xN = 35.28/0.7920 = 44.55 mmol/min
nO = (0.2013)(44.55) = 8.97 mmol/min
nCO2 = (0.0067)(44.55) = 0.30 mmol/min
OUT
OUT
OUT
qO = OUR/X = (21.96 mmol/Lh)/(2.45 g/L) = 8.96 mmol/gh
OUT
OUR = (nO - nO )/V = [(9.33 – 8.97) mmol/min]/1.00 L
= 0.36 mmol/Lmin = 21.96 mmol/Lh
IN OUT
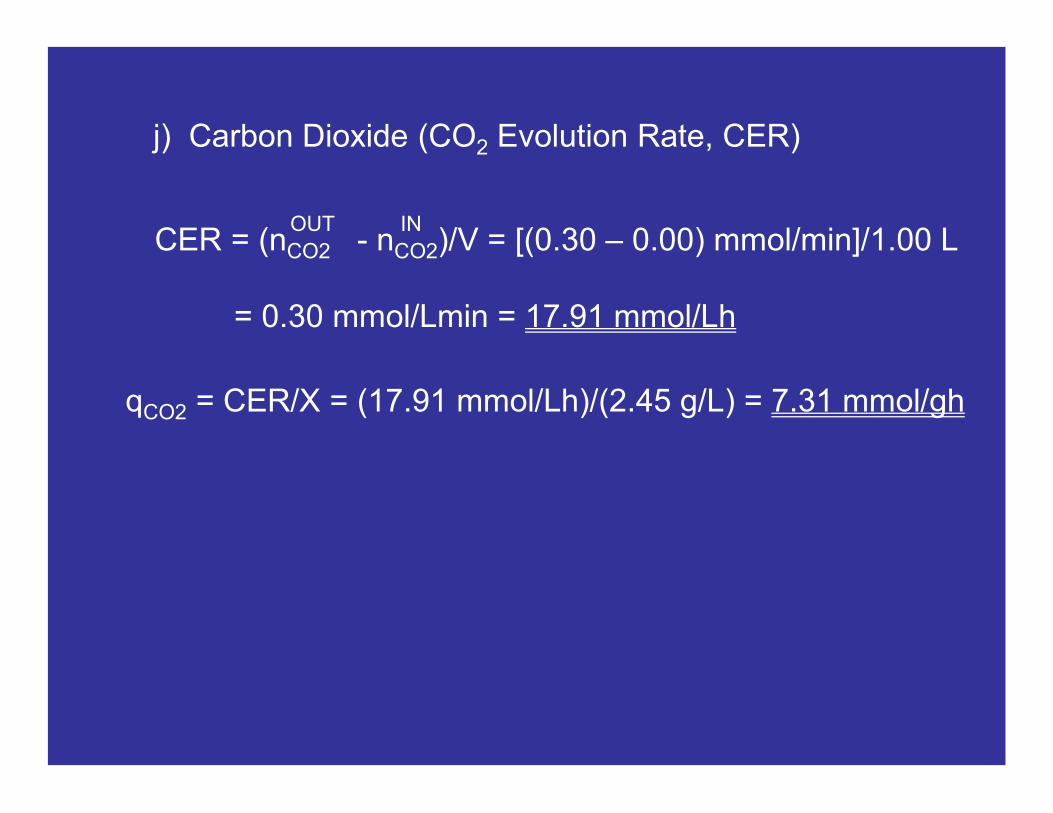
j) Carbon Dioxide (CO2 Evolution Rate, CER)
CER = (nCO2 - nCO2)/V = [(0.30 – 0.00) mmol/min]/1.00 L
= 0.30 mmol/Lmin = 17.91 mmol/Lh
qCO2 = CER/X = (17.91 mmol/Lh)/(2.45 g/L) = 7.31 mmol/gh
OUT IN
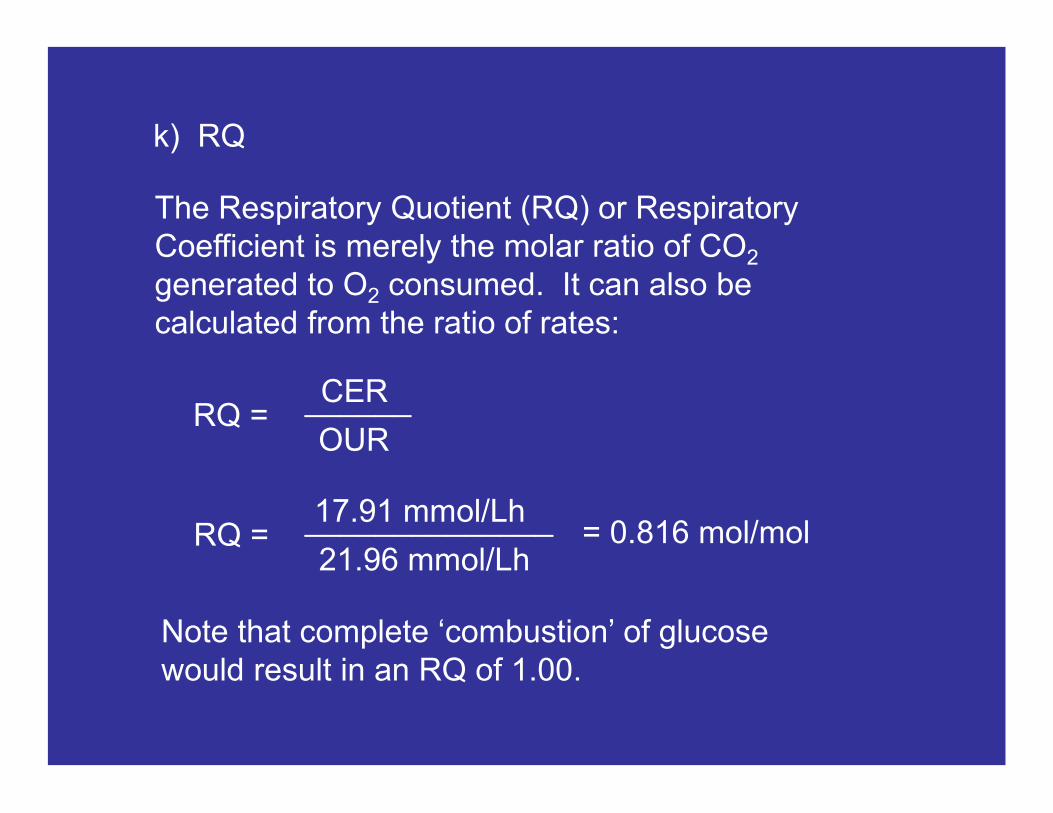
k) RQ
The Respiratory Quotient (RQ) or Respiratory Coefficient is merely the molar ratio of CO2
generated to O2 consumed. It can also be calculated from the ratio of rates:
CERRQ =
OUR______
17.91 mmol/LhRQ =
21.96 mmol/Lh
______________ = 0.816 mol/mol
Note that complete ‘combustion’ of glucose would result in an RQ of 1.00.
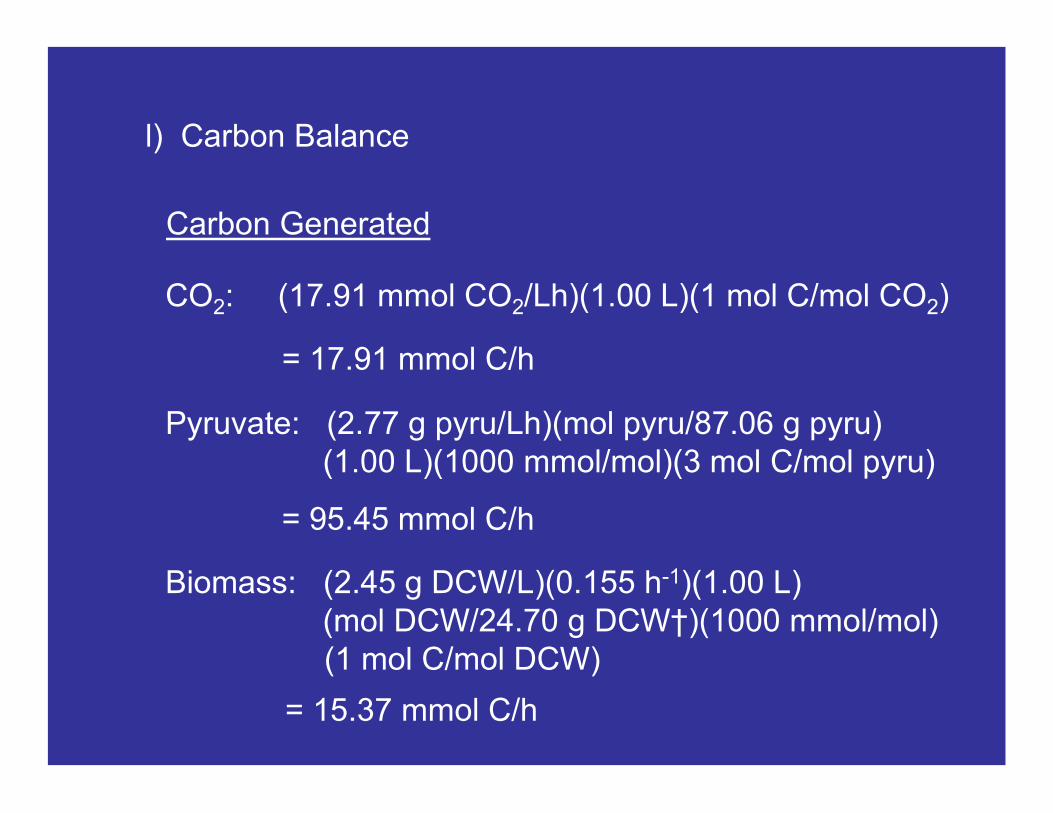
l) Carbon Balance
CO2: (17.91 mmol CO2/Lh)(1.00 L)(1 mol C/mol CO2)
= 17.91 mmol C/h
Carbon Generated
Pyruvate: (2.77 g pyru/Lh)(mol pyru/87.06 g pyru)(1.00 L)(1000 mmol/mol)(3 mol C/mol pyru)
= 95.45 mmol C/h
Biomass: (2.45 g DCW/L)(0.155 h-1)(1.00 L)(mol DCW/24.70 g DCW†)(1000 mmol/mol) (1 mol C/mol DCW)
= 15.37 mmol C/h
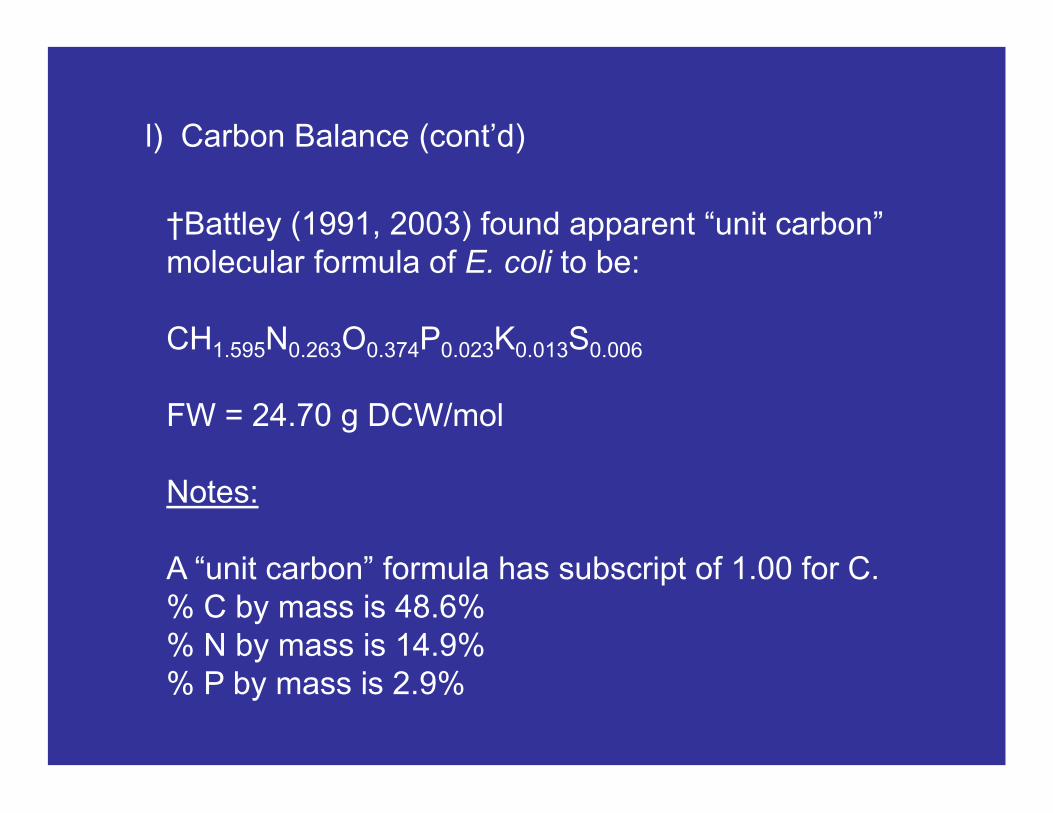
l) Carbon Balance (cont’d)
†Battley (1991, 2003) found apparent “unit carbon” molecular formula of E. coli to be:
CH1.595N0.263O0.374P0.023K0.013S0.006
FW = 24.70 g DCW/mol
Notes:
A “unit carbon” formula has subscript of 1.00 for C.% C by mass is 48.6%% N by mass is 14.9%% P by mass is 2.9%
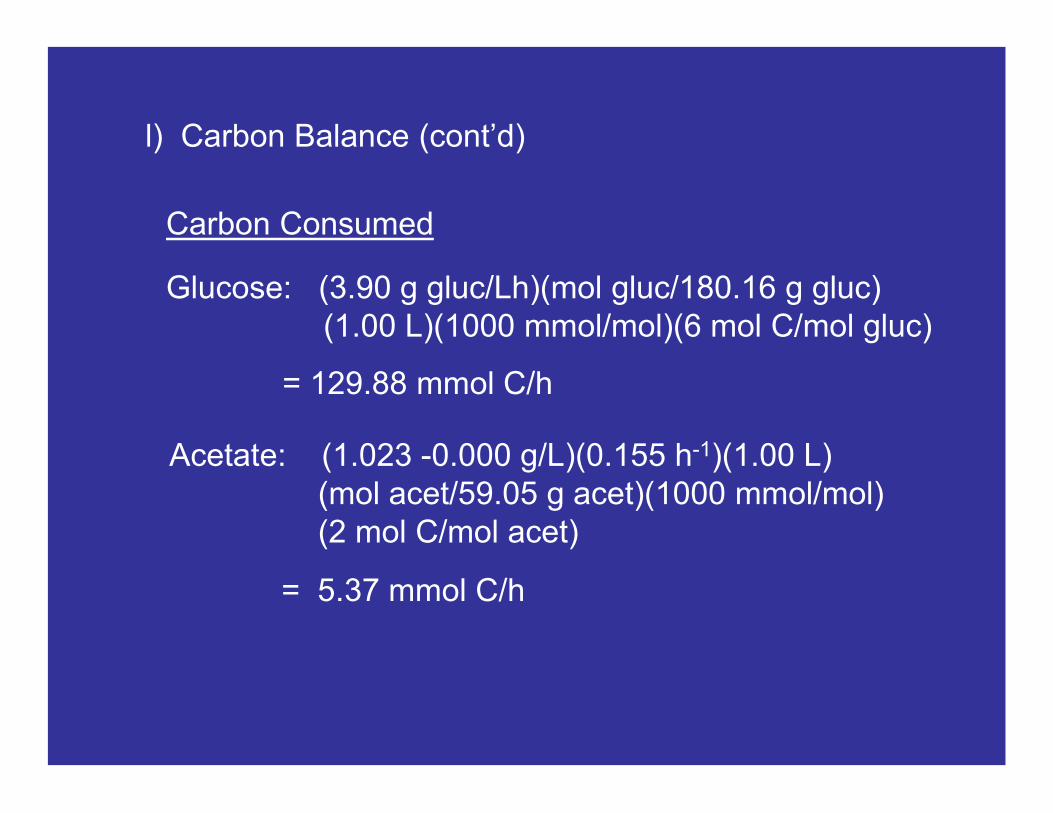
l) Carbon Balance (cont’d)
Carbon Consumed
Glucose: (3.90 g gluc/Lh)(mol gluc/180.16 g gluc)(1.00 L)(1000 mmol/mol)(6 mol C/mol gluc)
= 129.88 mmol C/h
Acetate: (1.023 -0.000 g/L)(0.155 h-1)(1.00 L)(mol acet/59.05 g acet)(1000 mmol/mol)(2 mol C/mol acet)
= 5.37 mmol C/h
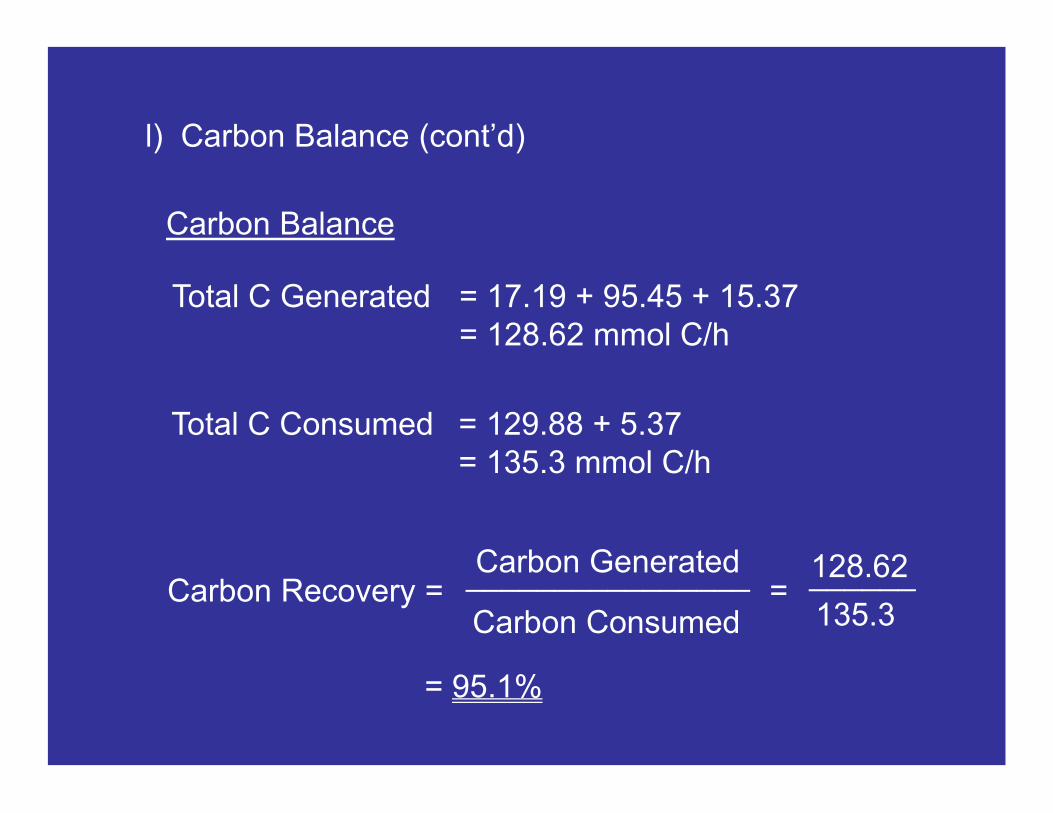
l) Carbon Balance (cont’d)
Carbon Balance
Total C Generated = 17.19 + 95.45 + 15.37= 128.62 mmol C/h
Total C Consumed = 129.88 + 5.37= 135.3 mmol C/h
Carbon Recovery = =Carbon Consumed
Carbon Generated________________
= 95.1%
135.3
128.62______
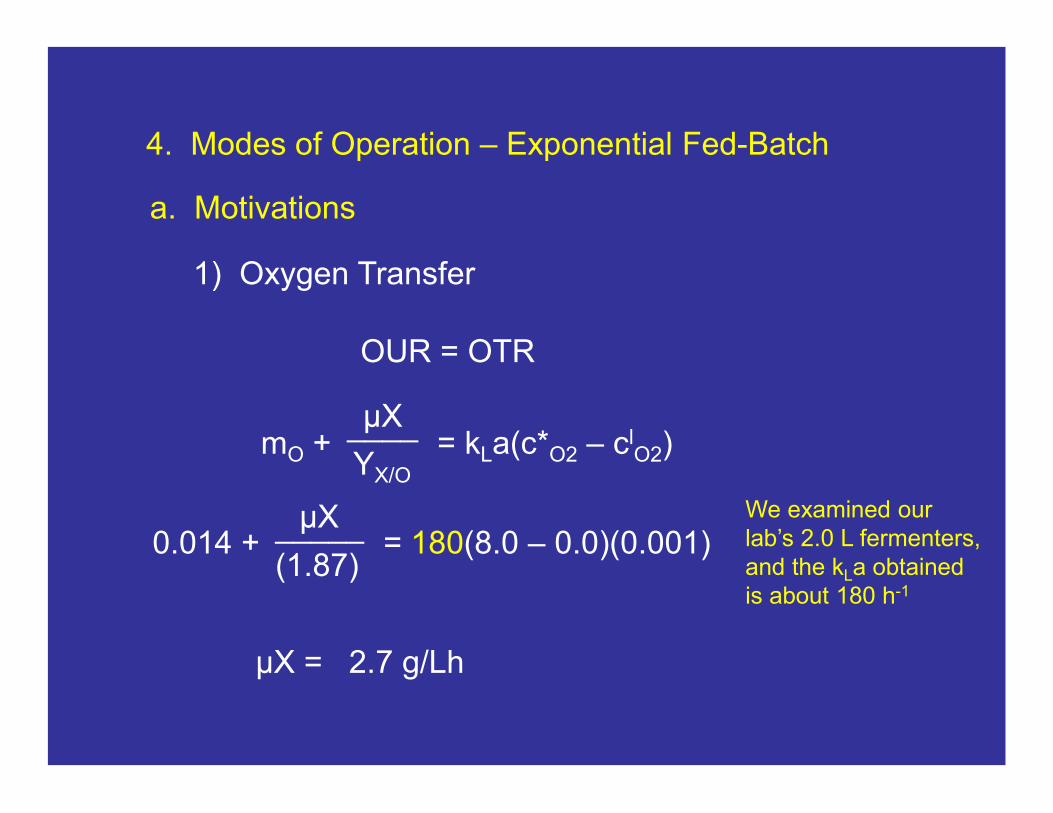
4. Modes of Operation – Exponential Fed-Batch
a. Motivations
OUR = OTR
____μX
YX/O
mO + = kLa(c*O2 – clO2)
1) Oxygen Transfer
μX = 2.7 g/Lh
_____μX
(1.87)0.014 + = 180(8.0 – 0.0)(0.001)
We examined our lab’s 2.0 L fermenters, and the kLa obtained is about 180 h-1
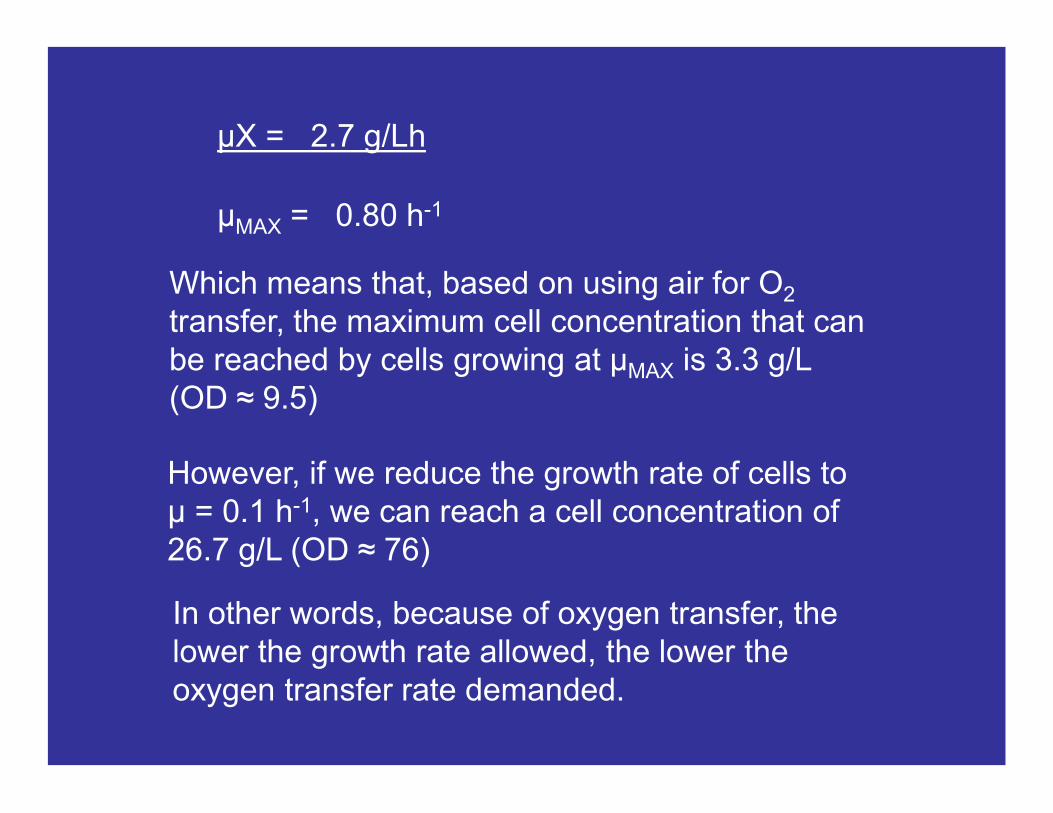
μX = 2.7 g/Lh
μMAX = 0.80 h-1
Which means that, based on using air for O2
transfer, the maximum cell concentration that can be reached by cells growing at μMAX is 3.3 g/L (OD ≈ 9.5)
However, if we reduce the growth rate of cells to μ = 0.1 h-1, we can reach a cell concentration of 26.7 g/L (OD ≈ 76)
In other words, because of oxygen transfer, the lower the growth rate allowed, the lower the oxygen transfer rate demanded.
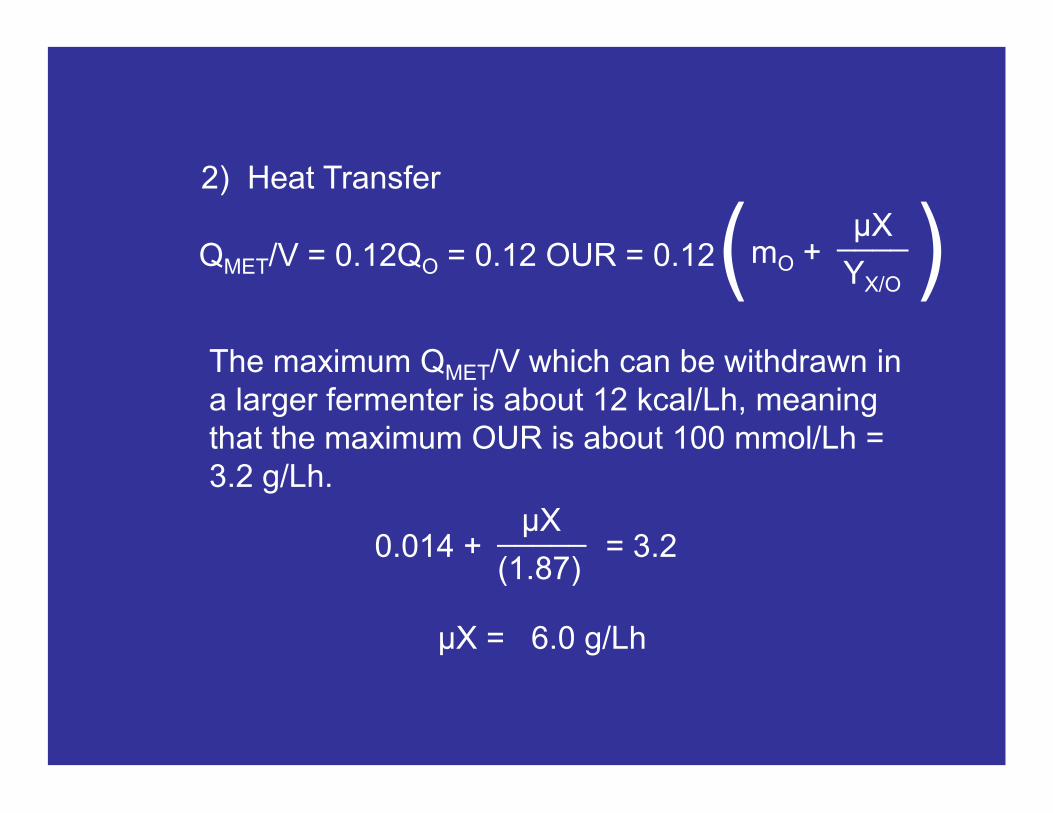
The maximum QMET/V which can be withdrawn in a larger fermenter is about 12 kcal/Lh, meaning that the maximum OUR is about 100 mmol/Lh = 3.2 g/Lh.
QMET/V = 0.12QO = 0.12 OUR = 0.12
2) Heat Transfer
____μX
YX/O
mO +( )
_____μX
(1.87)0.014 + = 3.2
μX = 6.0 g/Lh
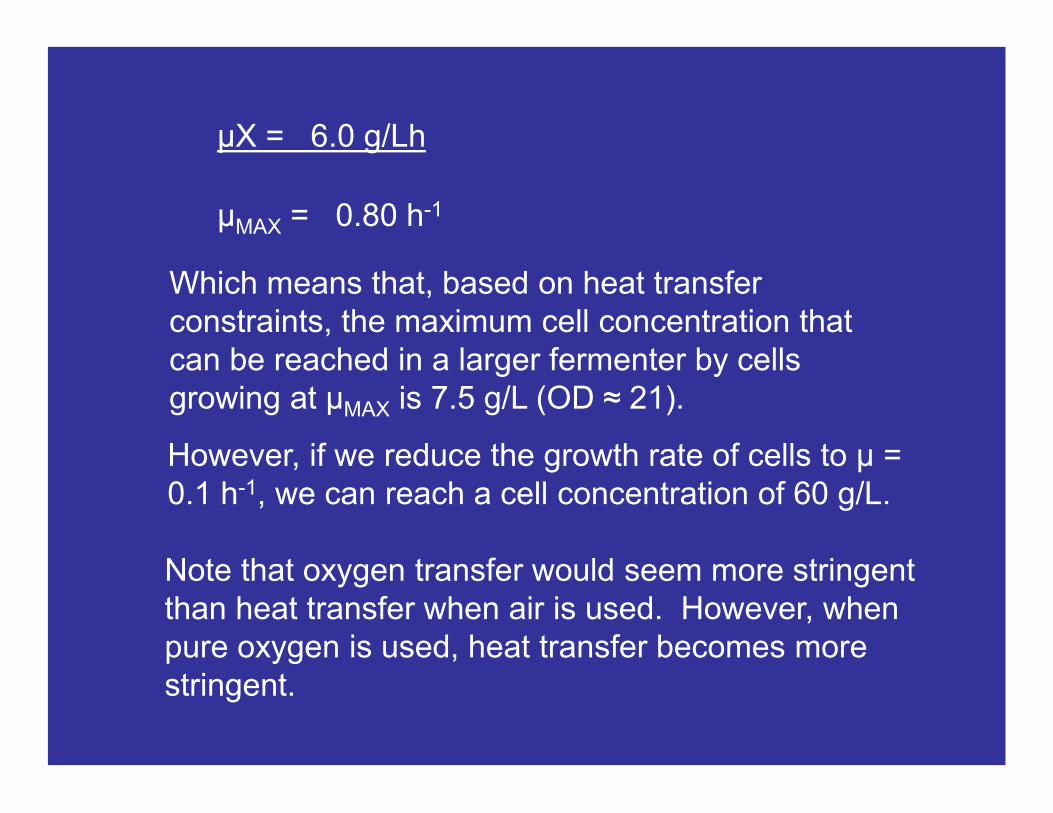
μX = 6.0 g/Lh
μMAX = 0.80 h-1
Which means that, based on heat transfer constraints, the maximum cell concentration that can be reached in a larger fermenter by cells growing at μMAX is 7.5 g/L (OD ≈ 21).
However, if we reduce the growth rate of cells to μ = 0.1 h-1, we can reach a cell concentration of 60 g/L.
Note that oxygen transfer would seem more stringent than heat transfer when air is used. However, when pure oxygen is used, heat transfer becomes more stringent.
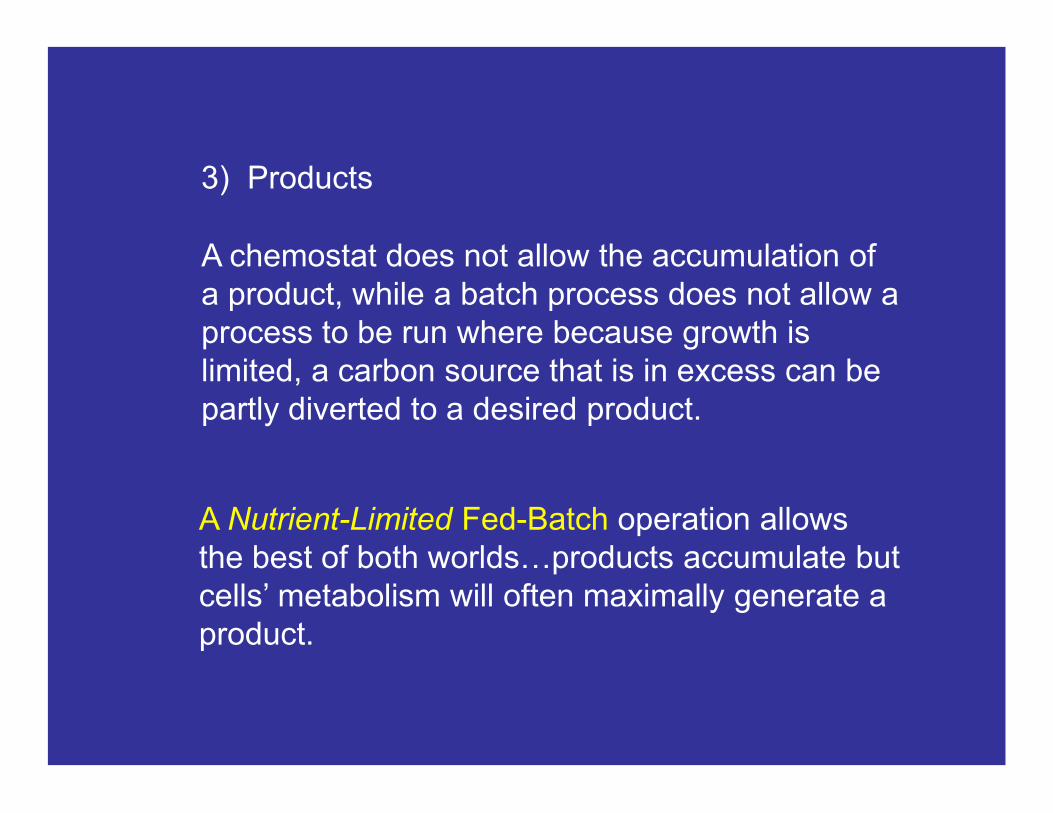
A chemostat does not allow the accumulation of a product, while a batch process does not allow a process to be run where because growth is limited, a carbon source that is in excess can be partly diverted to a desired product.
3) Products
A Nutrient-Limited Fed-Batch operation allows the best of both worlds…products accumulate but cells’ metabolism will often maximally generate a product.
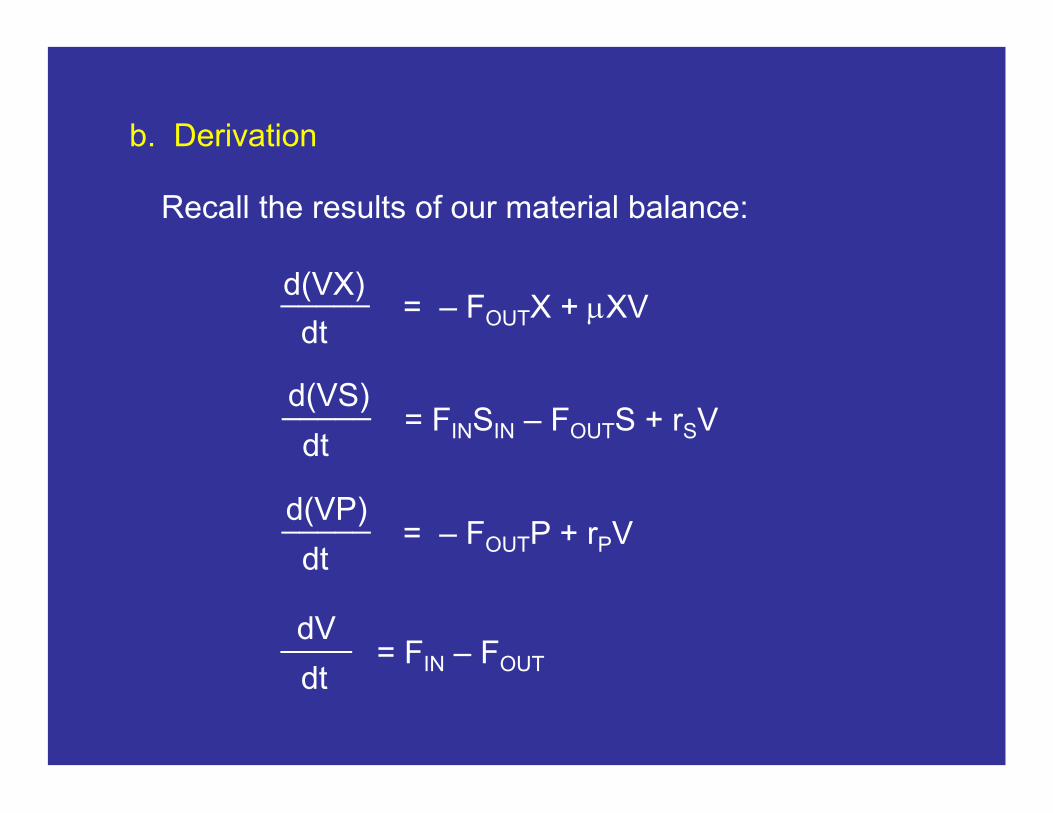
Recall the results of our material balance:
= – FOUTX + mXVd(VX)
dt
_____
= FINSIN – FOUTS + rSVd(VS)
dt
_____
= – FOUTP + rPVd(VP)
dt
_____
= FIN – FOUT
dV
dt
____
b. Derivation
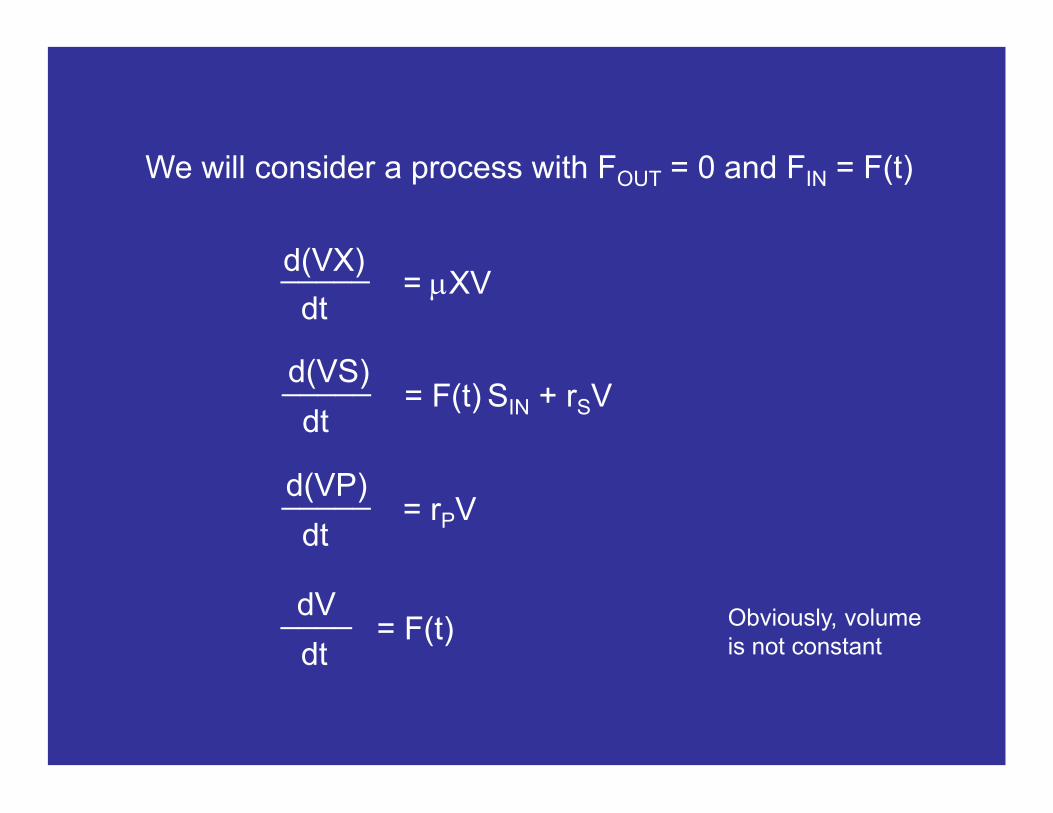
We will consider a process with FOUT = 0 and FIN = F(t)
= mXVd(VX)
dt
_____
= F(t) SIN + rSVd(VS)
dt
_____
= rPVd(VP)
dt
_____
= F(t)dV
dt
____ Obviously, volumeis not constant
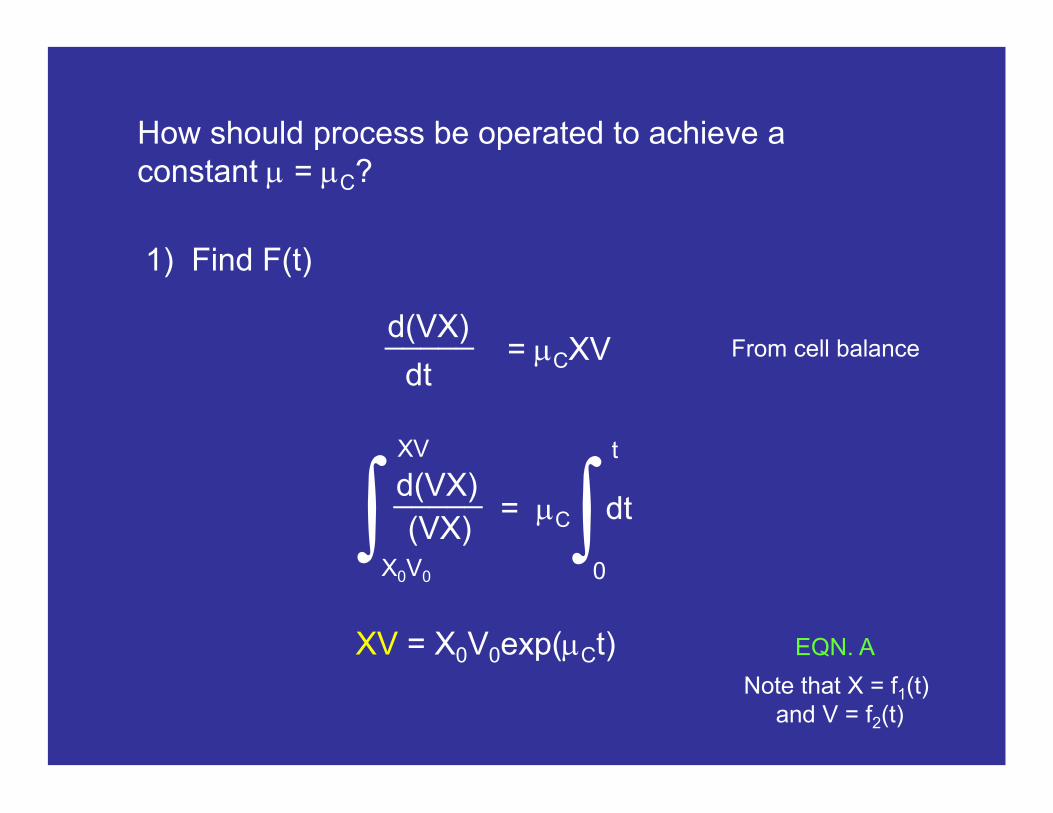
How should process be operated to achieve a constant m = mC?
1) Find F(t)
∫ ∫d(VX)
(VX)_____
= mC dt
t
X0V0
XV
0
= mCXVd(VX)
dt
_____From cell balance
Note that X = f1(t)and V = f2(t)
XV = X0V0exp(mCt) EQN. A
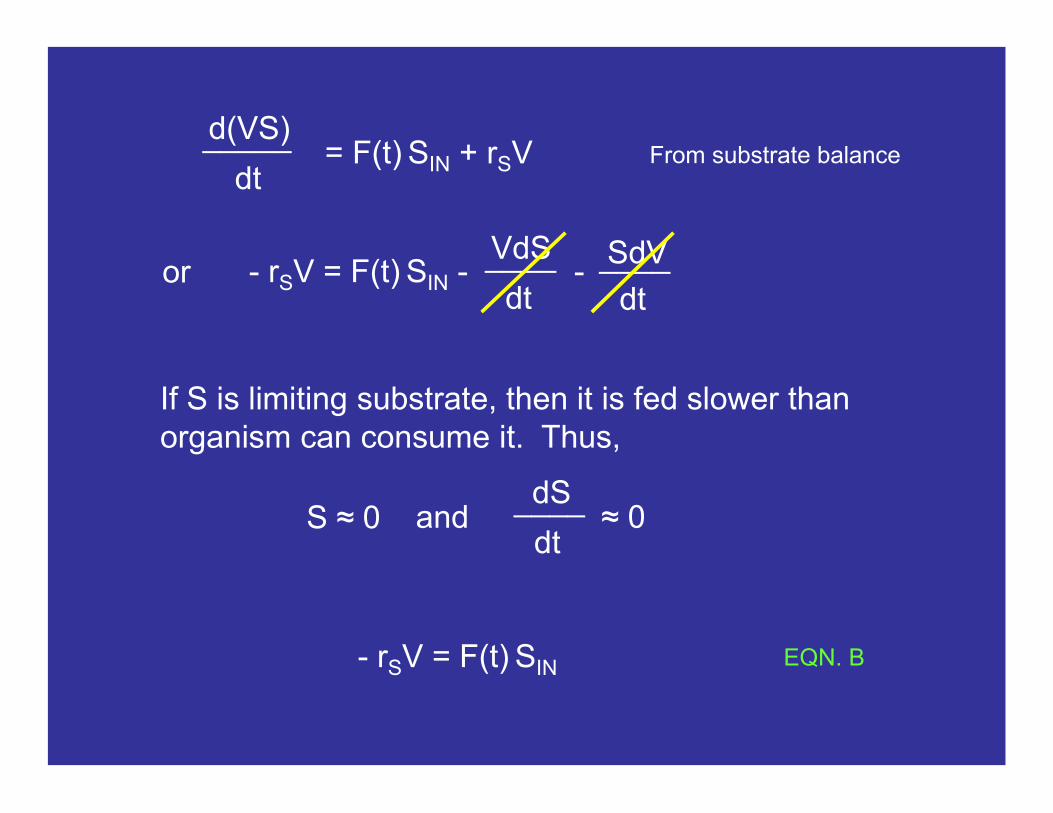
From substrate balance= F(t) SIN + rSVd(VS)
dt
_____
orSdV
dt
____- rSV = F(t) SIN - -VdS
dt
____
If S is limiting substrate, then it is fed slower than organism can consume it. Thus,
dS
dt
____S ≈ 0 ≈ 0and
- rSV = F(t) SIN EQN. B
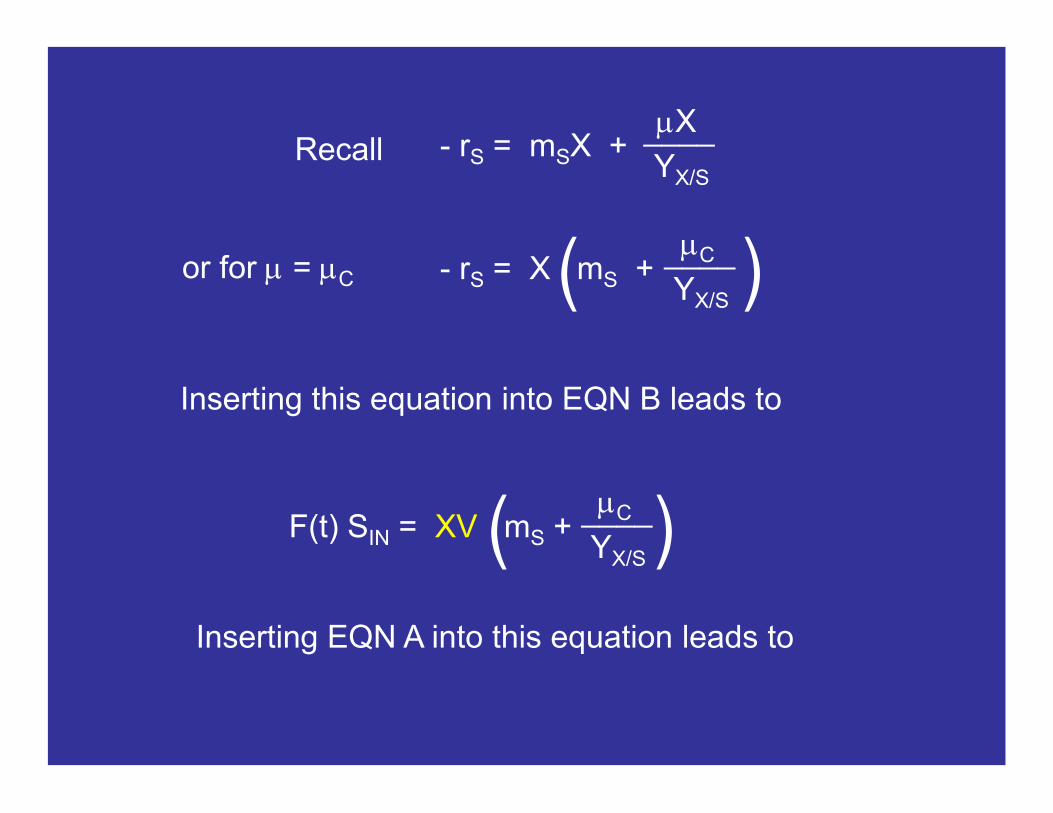
- rS = mSX +mX
YX/S
____Recall
Inserting this equation into EQN B leads to
( )F(t) SIN = XV mS +mC
YX/S
____
Inserting EQN A into this equation leads to
( )- rS = X mS +mC
YX/S
____or for m = mC
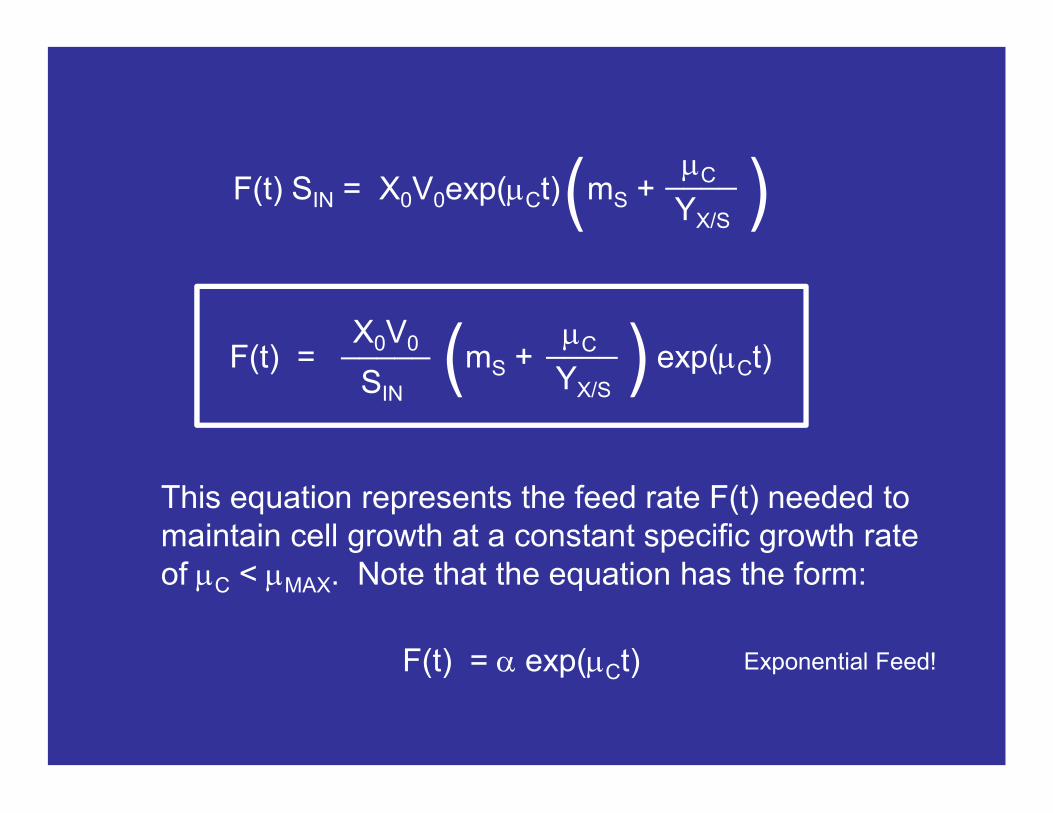
( )F(t) SIN = X0V0exp(mCt) mS +mC
YX/S
____
This equation represents the feed rate F(t) needed to maintain cell growth at a constant specific growth rate of mC < mMAX. Note that the equation has the form:
F(t) = a exp(mCt) Exponential Feed!
F(t) = mS + exp(mCt)mC
YX/S
____
SIN
X0V0_____ ( )
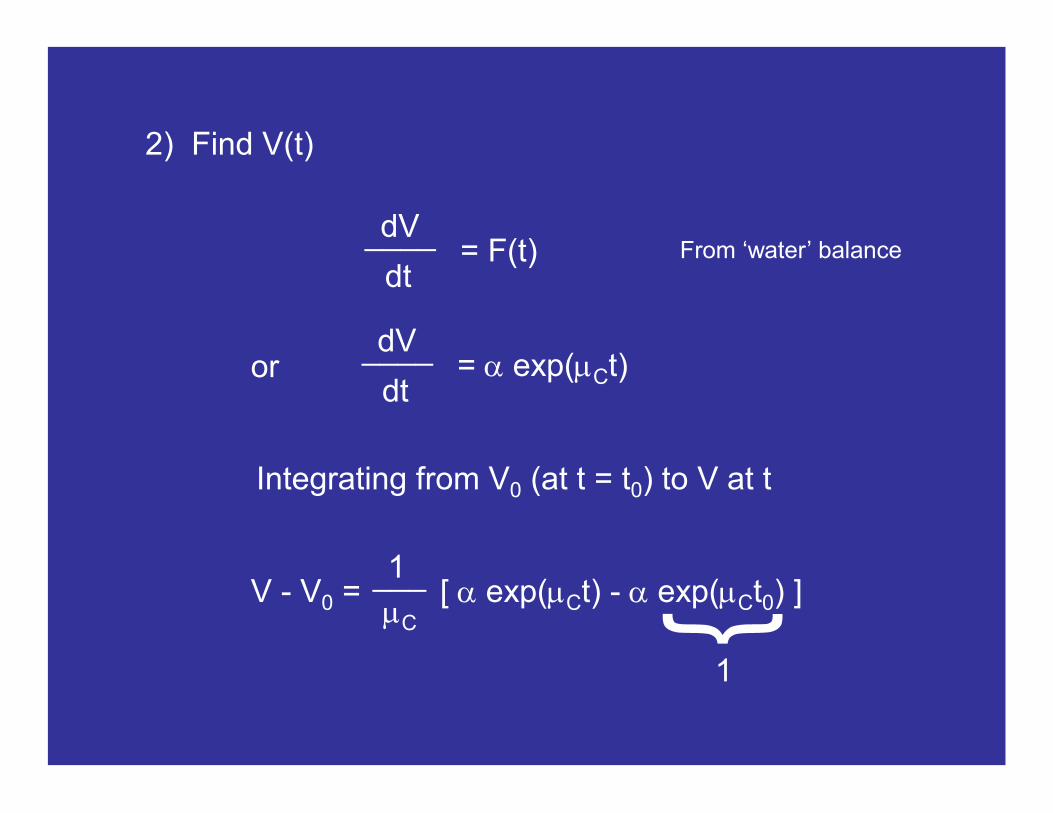
2) Find V(t)
= F(t)dV
dt
____From ‘water’ balance
= a exp(mCt)dV
dt
____or
Integrating from V0 (at t = t0) to V at t
V - V0 = [ a exp(mCt) - a exp(mCt0) ]___1
mC
}
1
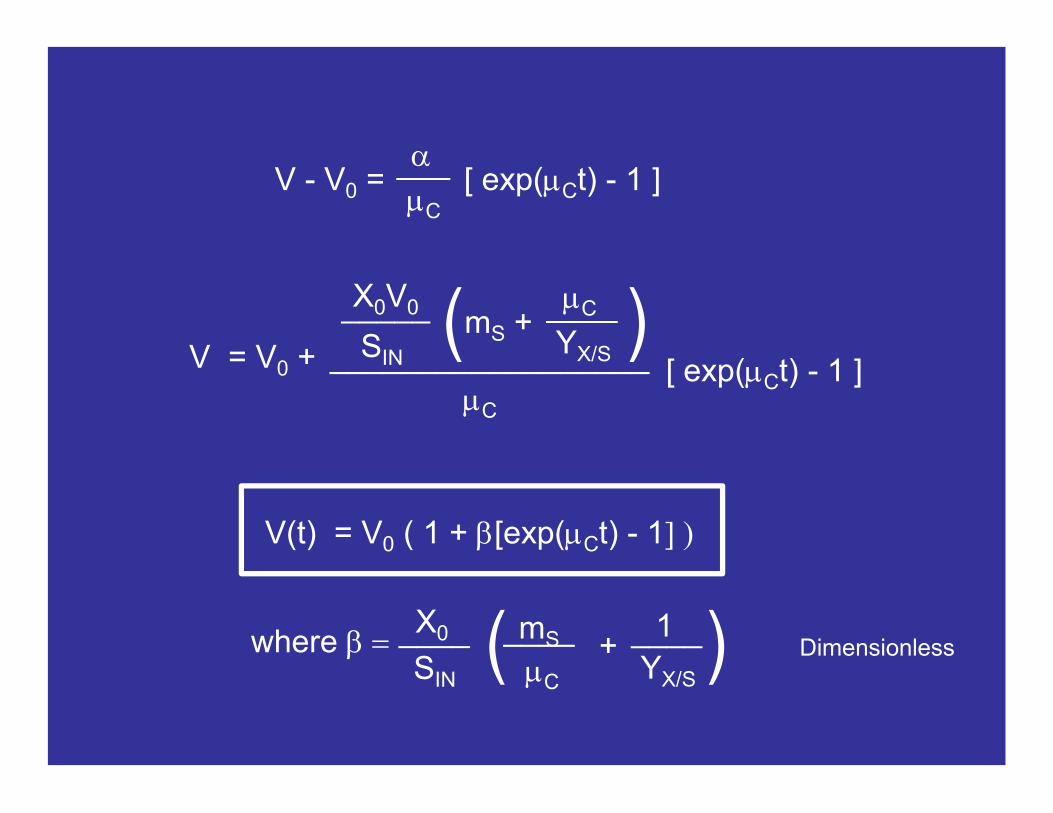
V - V0 = [ exp(mCt) - 1 ]___a
mC
mS + mC
YX/S
____
SIN
X0V0_____
V = V0 +
mC
__________________ [ exp(mCt) - 1 ]( )
V(t) = V0 ( 1 + b[exp(mCt) - 1] )
where b = mS 1
YX/S
____SIN
X0____mC
+____( ) Dimensionless
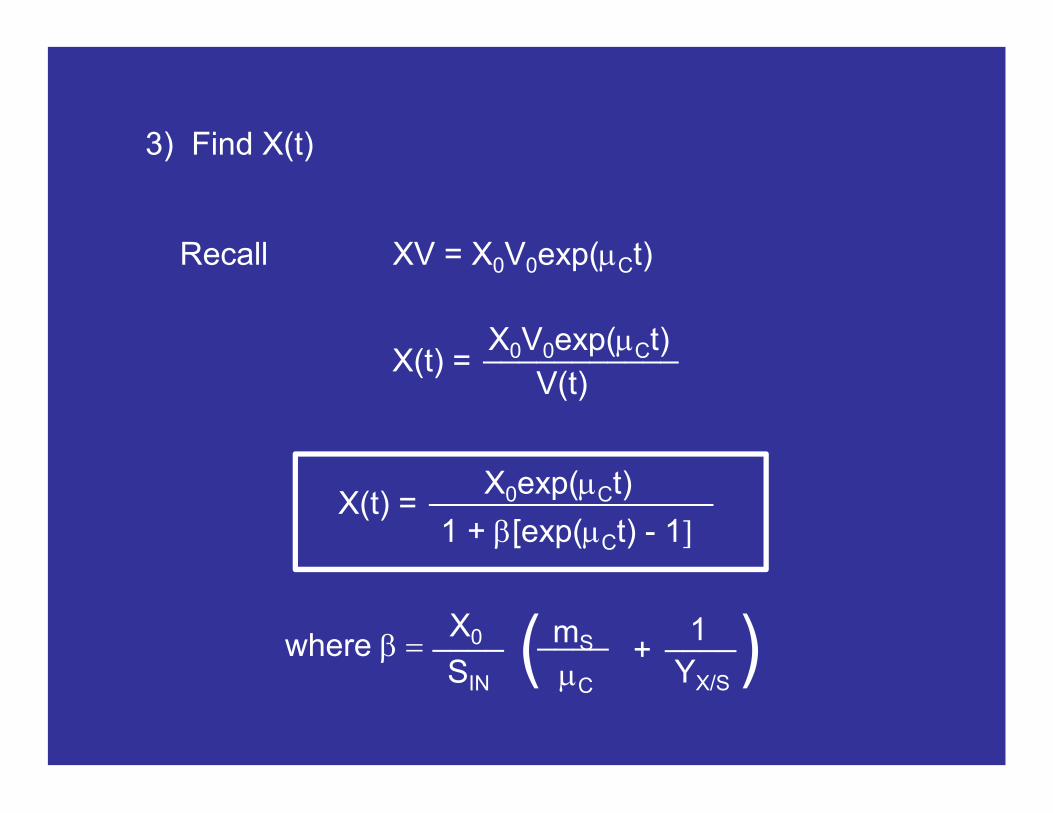
3) Find X(t)
Recall XV = X0V0exp(mCt)
X(t) =X0V0exp(mCt)___________
V(t)
X(t) =X0exp(mCt)________________
1 + b[exp(mCt) - 1]
where b = mS 1
YX/S
____SIN
X0____mC
+____( )
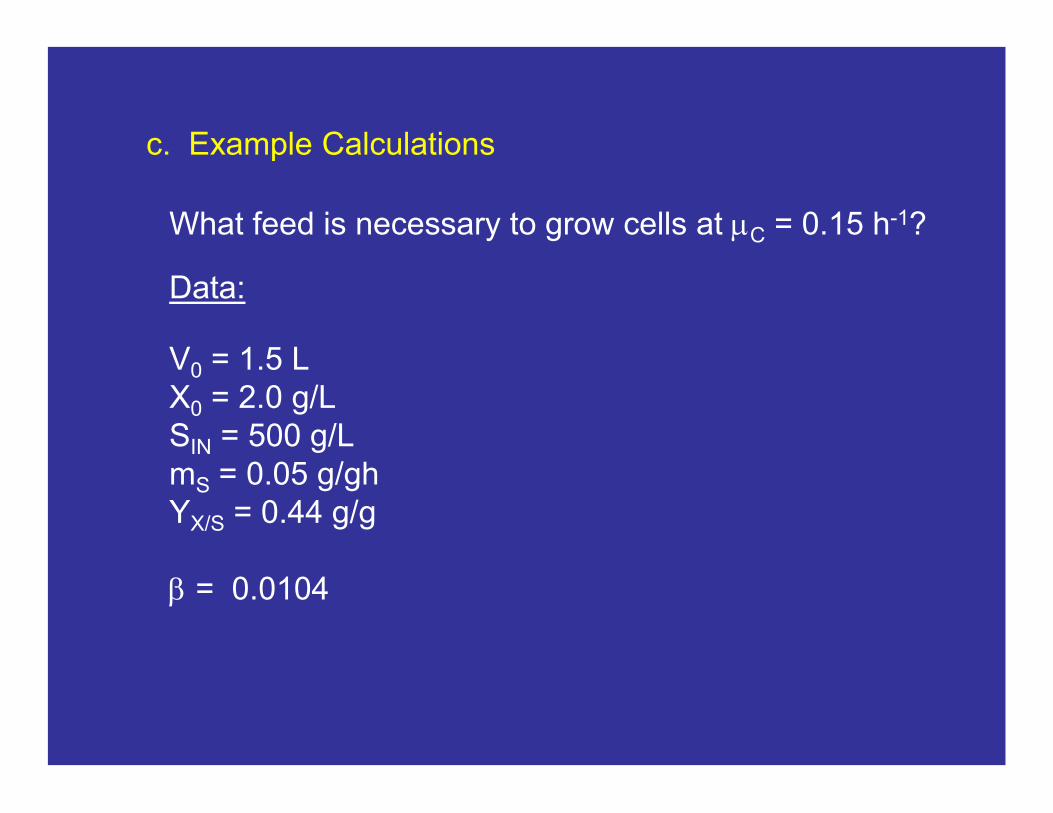
c. Example Calculations
What feed is necessary to grow cells at mC = 0.15 h-1?
Data:
V0 = 1.5 LX0 = 2.0 g/LSIN = 500 g/LmS = 0.05 g/ghYX/S = 0.44 g/g
b = 0.0104
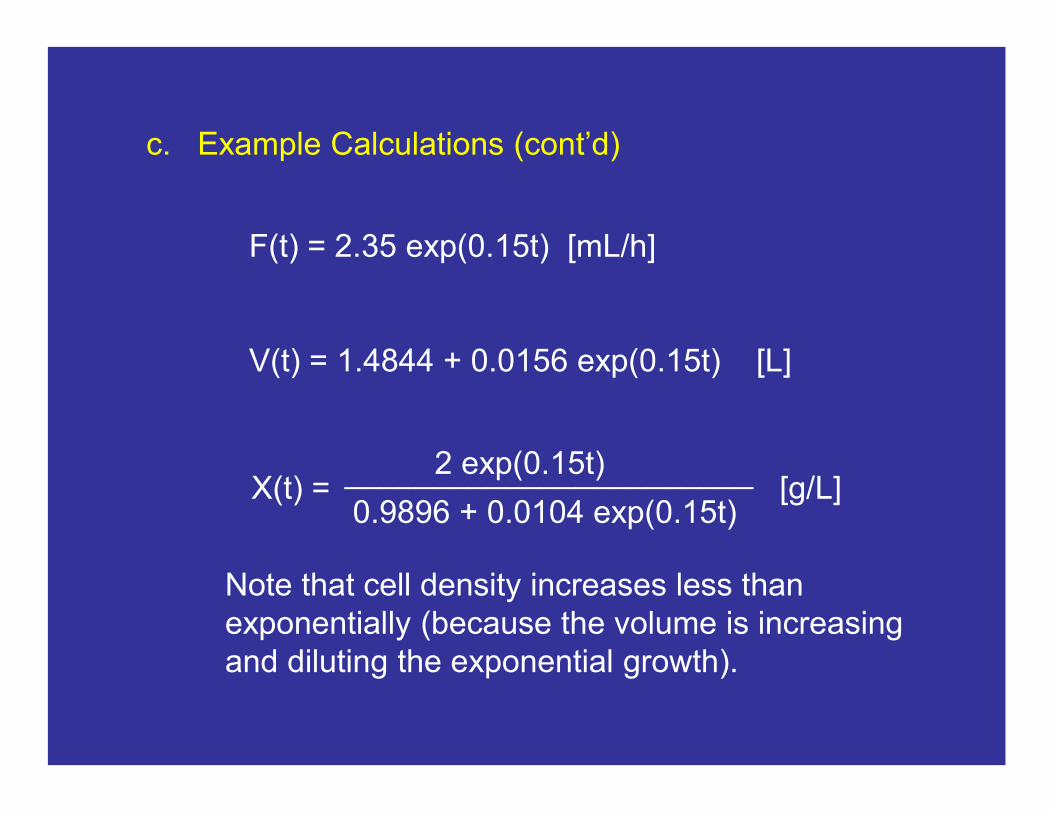
c. Example Calculations (cont’d)
F(t) = 2.35 exp(0.15t) [mL/h]
V(t) = 1.4844 + 0.0156 exp(0.15t) [L]
X(t) = [g/L]0.9896 + 0.0104 exp(0.15t)
2 exp(0.15t)_______________________
Note that cell density increases less than exponentially (because the volume is increasing and diluting the exponential growth).
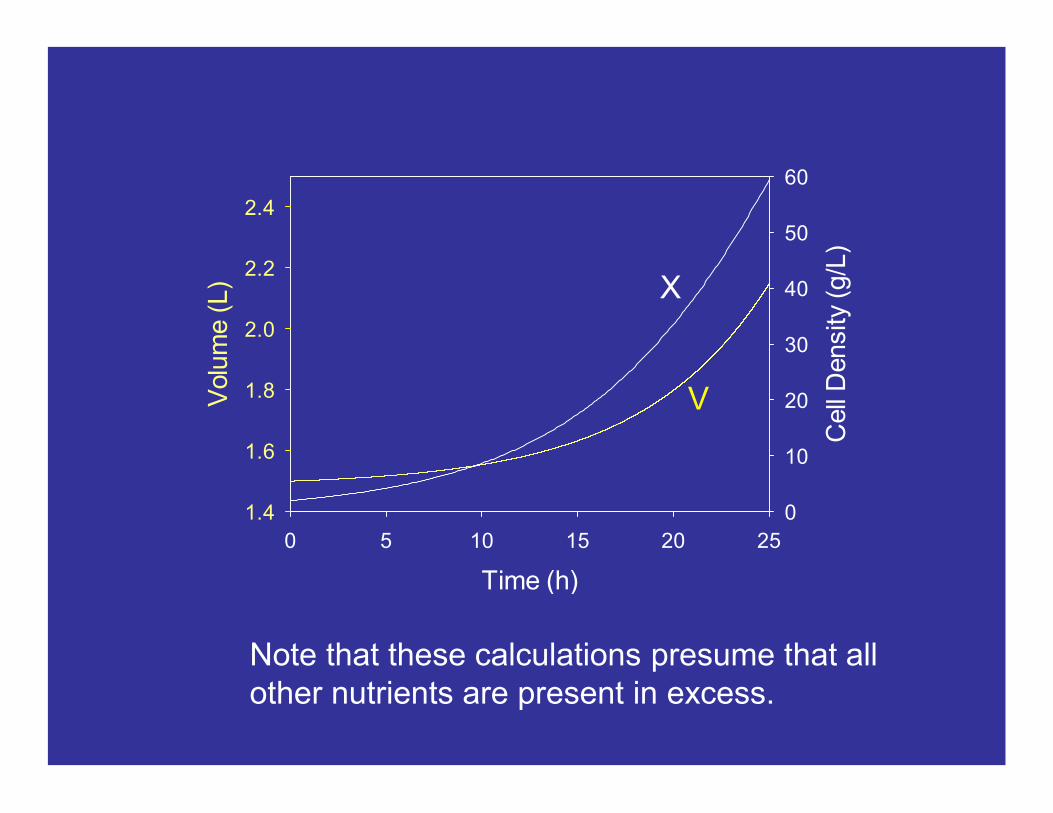
Note that these calculations presume that all other nutrients are present in excess.
Time (h)
0 5 10 15 20 25
Volu
me (
L)
1.4
1.6
1.8
2.0
2.2
2.4
Cell
Density
(g/L
)
0
10
20
30
40
50
60
V
X
References
E. H. Battley (1991) Calculation of the heat of growth of Escherichia coli K-12 cells on succinic acid. Biotechnol. Bioeng. 37:334-343.
E. H. Battley (2003) Absorbed heat and heat of formation of dried microbial biomass. J. ThermAnal Calorim 74:709-721.
I. S. Farmer, C. W. Jones (1976) The energetics of Escherichia coli during aerobic growth in continuous culture. Eur. J. Biochem. 67:115-122.
J. Mandelstam, K. McQuillen. 1968. Biochemistry of bacterial growth. 2nd ed. Blackwell Sci. Publications Ltd. Oxford.
A. G. Marr, E. H. Nilson, D. J. Clark (1963) The maintenance requirement of Escherichia coli.Ann. NY Acad. Sci. 102:536-548.
A. Nanchen, A. Schicker, U. Sauer (2006) Nonlinear dependency of intracellular fluxes on growth rate in miniaturized continuous cultures of Escherichia coli. Appl. Environ. Microbiol. 72:1164-1172.
References
O. M. Neijssel, M. J. Teixeira de Mattos, D. W. Tempest (1996) Growth yield and energy distribution. pp. 1683-1692. In: F. C. Neidhardt, R. Curtiss III, J. L. Ingraham, E. C. C. Lin, K. B. Low, B. Magasanik, W. S. Reznikoff, M. Riley, M. Schaechter, H. E. Umbarger (ed.), Escherichia coli and Salmonella cellular and molecular biology, 2nd. Ed. ASM Press, Washington DC.
S. J. Pirt (1965) The maintenance energy of bacteria in growing cultures. Proc. Royal Soc. London Ser. B. 163:224-231.
H. E. Reiling, H. Laurila, A. Fiechter (1985) Mass culture of Escherichia coli: Medium development for low and high density cultivation of Escherichia coli B/r in minimal and complex media. J. Biotechnol. 2:191-206.
A. H. Stouthamer, C. W. Bettenhaussen. 1977. A continuous culture study of an ATPase-negative mutant of Escherichia coli. Arch. Microbiol. 113:185-189.