Embed Size (px)
Citation preview
RESEARCH ARTICLE
jViz.RNA 4.0—Visualizing pseudoknots and
RNA editing employing compressed tree
graphs
Boris ShabashID☯, Kay C. WieseID
☯*
School of Computing Science, Simon Fraser University, Burnaby, British Columbia, Canada
☯ These authors contributed equally to this work.
Abstract
Previously, we have introduced an improved version of jViz.RNA which enabled faster and
more stable RNA visualization by employing compressed tree graphs. However, the new
RNA representation and visualization method required a sophisticated mechanism of pseu-
doknot visualization. In this work, we present our novel pseudoknot classification and imple-
mentation of pseudoknot visualization in the context of the new RNA graph model. We then
compare our approach with other RNA visualization software, and demonstrate jViz.RNA
4.0’s benefits compared to other software. Additionally, we introduce interactive editing
functionality into jViz.RNA and demonstrate its benefits in exploring and building RNA struc-
tures. The results presented highlight the new high degree of utility jViz.RNA 4.0 now offers.
Users are now able to visualize pseudoknotted RNA, manipulate the resulting automatic lay-
outs to suit their individual needs, and change both positioning and connectivity of the RNA
molecules examined. Care was taken to limit overlap between structural elements, particu-
larly in the case of pseudoknots to ensure an intuitive and informative layout of the final RNA
structure.
Availability: The software is freely available at: https://jviz.cs.sfu.ca/.
Introduction
RNA structure
Ribo-nucleic Acid (RNA) is a polymer chain composed, mainly, of four bases called nucleo-
tides. These are Adenine (A), Guanine (G), Cytosine (C), and Uracil (U). RNA most often
appears as a single strand.
The single RNA polymer can fold over itself to form base pairs between the complimentary
nucleotides within the same strand. This process gives rise to the secondary structure of the
RNA molecule, a sequence of paired nucleotides known as stems, and regions of unpaired bases
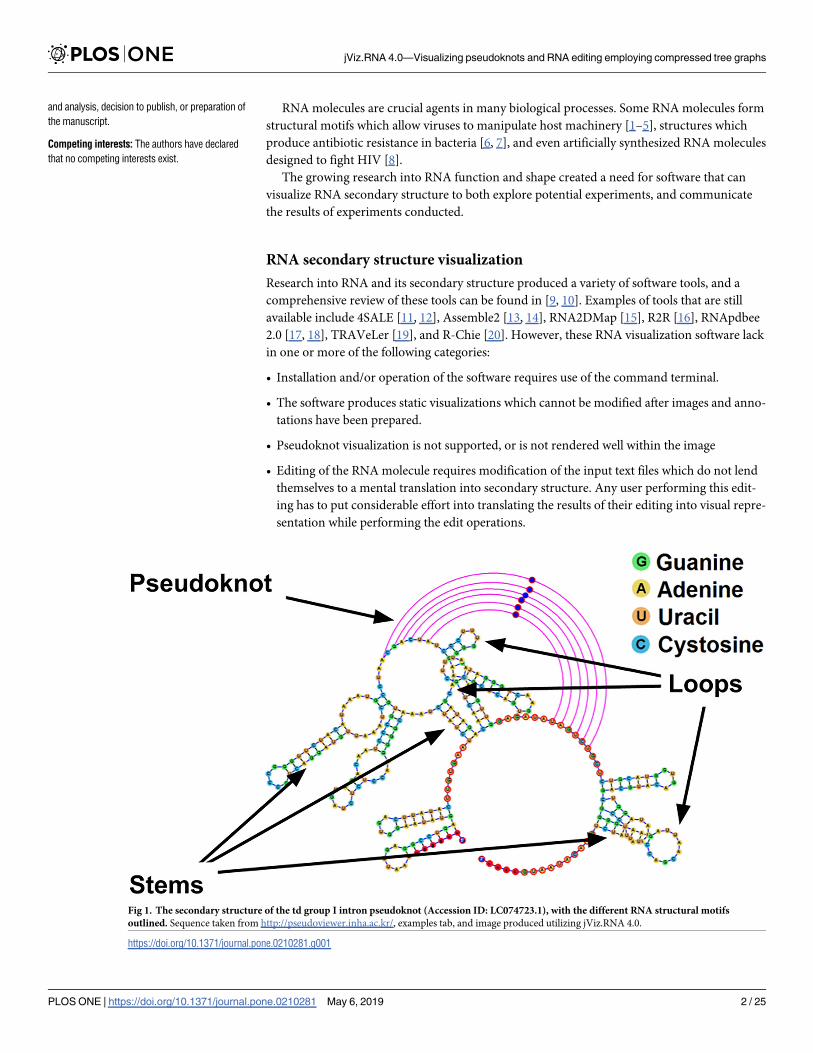
known as loops. Furthermore, a tertiary structure known as a pseudoknot can be formed when
a loop interacts with another loop or with a single stranded fragment which does not belong to
any loop, bending the structure in 3D space. Fig 1 presents the mentioned RNA motifs.
PLOS ONE | https://doi.org/10.1371/journal.pone.0210281 May 6, 2019 1 / 25
a1111111111
a1111111111
a1111111111
a1111111111
a1111111111
OPEN ACCESS
Citation: Shabash B, Wiese KC (2019) jViz.RNA 4.0
—Visualizing pseudoknots and RNA editing
employing compressed tree graphs. PLoS ONE
14(5): e0210281. https://doi.org/10.1371/journal.
pone.0210281
Editor: Alexander P. Gultiaev, Erasmus Medical
Center, NETHERLANDS
Received: August 12, 2018
Accepted: December 19, 2018
Published: May 6, 2019
Copyright: © 2019 Shabash, Wiese. This is an
open access article distributed under the terms of
the Creative Commons Attribution License, which
permits unrestricted use, distribution, and
reproduction in any medium, provided the original
author and source are credited.
Data Availability Statement: All relevant data are
within the paper and its Supporting Information
files.
Funding: This work was supported by Natural
Sciences and Engineering Council of Canada
(http://www.nserc-crsng.gc.ca/index_eng.asp),
grant number: 238298-2013-RGPIN (K. W.) and
Natural Sciences and Engineering Council of
Canada (http://www.nserc-crsng.gc.ca/index_eng.
asp), grant number: CGS-D scholarship (B. S.). The
funders had no role in study design, data collection
RNA molecules are crucial agents in many biological processes. Some RNA molecules form
structural motifs which allow viruses to manipulate host machinery [1–5], structures which
produce antibiotic resistance in bacteria [6, 7], and even artificially synthesized RNA molecules
designed to fight HIV [8].
The growing research into RNA function and shape created a need for software that can
visualize RNA secondary structure to both explore potential experiments, and communicate
the results of experiments conducted.
RNA secondary structure visualization
Research into RNA and its secondary structure produced a variety of software tools, and a
comprehensive review of these tools can be found in [9, 10]. Examples of tools that are still
available include 4SALE [11, 12], Assemble2 [13, 14], RNA2DMap [15], R2R [16], RNApdbee
2.0 [17, 18], TRAVeLer [19], and R-Chie [20]. However, these RNA visualization software lack
in one or more of the following categories:
• Installation and/or operation of the software requires use of the command terminal.
• The software produces static visualizations which cannot be modified after images and anno-
tations have been prepared.
• Pseudoknot visualization is not supported, or is not rendered well within the image
• Editing of the RNA molecule requires modification of the input text files which do not lend
themselves to a mental translation into secondary structure. Any user performing this edit-
ing has to put considerable effort into translating the results of their editing into visual repre-
sentation while performing the edit operations.
Fig 1. The secondary structure of the td group I intron pseudoknot (Accession ID: LC074723.1), with the different RNA structural motifs
outlined. Sequence taken from http://pseudoviewer.inha.ac.kr/, examples tab, and image produced utilizing jViz.RNA 4.0.
https://doi.org/10.1371/journal.pone.0210281.g001
jViz.RNA 4.0—Visualizing pseudoknots and RNA editing employing compressed tree graphs
PLOS ONE | https://doi.org/10.1371/journal.pone.0210281 May 6, 2019 2 / 25
and analysis, decision to publish, or preparation of
the manuscript.
Competing interests: The authors have declared
that no competing interests exist.
Overall, only five notable software tools provide a dynamic structure which can be manipu-
lated by the user, combined with support for pseudoknotted structures: PseudoViewer [21–
25], jViz.RNA 2.0 [26–28], VARNA [29], RiboSketch [30], and Forna [31]. Of these tools, only
RiboSketch [30] and Forna [31] allow for interactive editing of the RNA structures, while the
other three software required the editing of the input files, which we will refer to as non-inter-
active editing.
Interactive editing allows users to edit the RNA structure model directly using the software
without editing the input files, while non-interactive editing requires editing the input files
and re-loading them into the software to see a change in the RNA structure (VARNA [29]
allows for editing of the molecule using the software, but requires users to edit a string repre-
sentation of the molecule model rather than the model itself. Hence it is still classified under
non-interactive editing). The main advantage of interactive editing is the ease with which
actions such as adding and removing base-pairs can be executed, while non-interactive editing
requires users to translate the input file strings into a mental image of the RNA to introduce
changes to the molecule. This inconveniences users in two ways: First, the mental translation
from the text based input file to the secondary structure can be cumbersome, and second, the
user must be familiar with the structure of input files.
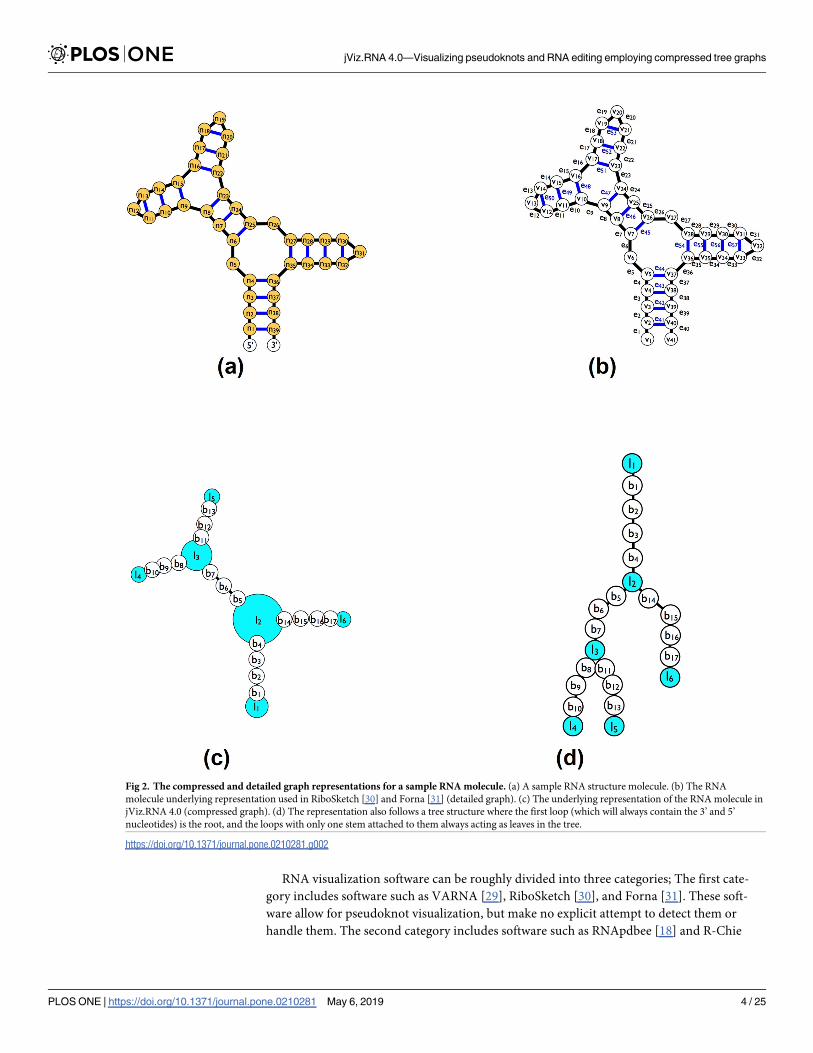
In previous work [32], we have described jViz.RNA 3.0, which employed a new underly-
ing graph model to visualize the RNA molecule. Instead of translating the RNA molecule
(Fig 2a) into a detailed graph where each nucleotide mapped to a node and each chemical
base-pair between the nucleotides in the structure (hydrogen or covalent) mapped to an edge
(Fig 2b), we introduced a compressed graph (Fig 2c) which mapped each loop or base-pair
to a node, and connected those with edges, creating a tree like structure (Fig 2d). The result-
ing software tool was able to provide aesthetically better RNA visualizations, and respond to
user interaction much faster, and with greater stability, even for large molecules. However,
it faced two main challenges still: Formulating the new and improved compressed graph
meant that removing and adding base-pairs between bases required a more sophisticated
reconstruction of the graph (while for detailed graphs, like those used by Forna [31], it
would require a simple removal or addition of an edge), and secondly, creating a responsive,
adjustable, representation of pseudoknots which would avoid obstructive overlap with the
main structure also requires a more sophisticated layout approach, and present a non-trivial
challenge.
In this manuscript, we present two important extensions to jViz.RNA 3.0 [32]. Dynamic
pseudoknotted structure visualization, and interactive RNA editing capacities which allows
users to manipulate the connectivity of the RNA structure explored. The remainder of this
paper is organized as follows: The following section demonstrates the results of the research
described in this manuscript. The subsequent section discusses the significance and novel con-
tributions of the work presented in this manuscript and the implication of this work. Finally,
the succeeding section describes the approaches and methods employed to incorporate pseu-
doknot visualization and RNA editing into jViz.RNA 4.0, while the conclusion section pro-
vides concluding remarks. The features and capabilities of the aforementioned different
software are summarized in Table 1.
Results
Pseudoknot visualization
Figs 3–7 demonstrate the visualization capacities which were added to jViz.RNA 4.0. Figs 4–7
compare jViz.RNA 4.0 to the four other dynamic RNA visualization software mentioned in
the Introduction.
jViz.RNA 4.0—Visualizing pseudoknots and RNA editing employing compressed tree graphs
PLOS ONE | https://doi.org/10.1371/journal.pone.0210281 May 6, 2019 3 / 25
RNA visualization software can be roughly divided into three categories; The first cate-
gory includes software such as VARNA [29], RiboSketch [30], and Forna [31]. These soft-
ware allow for pseudoknot visualization, but make no explicit attempt to detect them or
handle them. The second category includes software such as RNApdbee [18] and R-Chie
Fig 2. The compressed and detailed graph representations for a sample RNA molecule. (a) A sample RNA structure molecule. (b) The RNA
molecule underlying representation used in RiboSketch [30] and Forna [31] (detailed graph). (c) The underlying representation of the RNA molecule in
jViz.RNA 4.0 (compressed graph). (d) The representation also follows a tree structure where the first loop (which will always contain the 3’ and 5’
nucleotides) is the root, and the loops with only one stem attached to them always acting as leaves in the tree.
https://doi.org/10.1371/journal.pone.0210281.g002
jViz.RNA 4.0—Visualizing pseudoknots and RNA editing employing compressed tree graphs
PLOS ONE | https://doi.org/10.1371/journal.pone.0210281 May 6, 2019 4 / 25
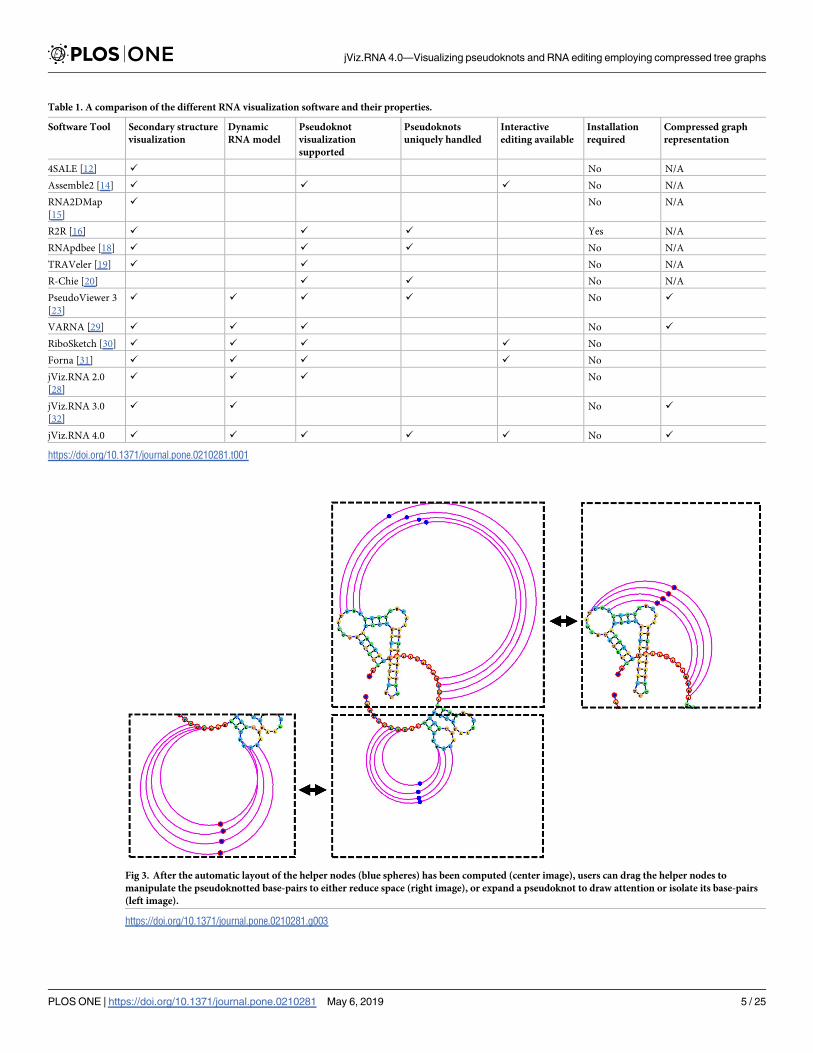
Table 1. A comparison of the different RNA visualization software and their properties.
Software Tool Secondary structure
visualization
Dynamic
RNA model
Pseudoknot
visualization
supported
Pseudoknots
uniquely handled
Interactive
editing available
Installation
required
Compressed graph
representation
4SALE [12] ✓ No N/A
Assemble2 [14] ✓ ✓ ✓ No N/A
RNA2DMap
[15]
✓ No N/A
R2R [16] ✓ ✓ ✓ Yes N/A
RNApdbee [18] ✓ ✓ ✓ No N/A
TRAVeler [19] ✓ ✓ No N/A
R-Chie [20] ✓ ✓ No N/A
PseudoViewer 3
[23]
✓ ✓ ✓ ✓ No ✓
VARNA [29] ✓ ✓ ✓ No ✓
RiboSketch [30] ✓ ✓ ✓ ✓ No
Forna [31] ✓ ✓ ✓ ✓ No
jViz.RNA 2.0
[28]
✓ ✓ ✓ No
jViz.RNA 3.0
[32]
✓ ✓ No ✓
jViz.RNA 4.0 ✓ ✓ ✓ ✓ ✓ No ✓
https://doi.org/10.1371/journal.pone.0210281.t001
Fig 3. After the automatic layout of the helper nodes (blue spheres) has been computed (center image), users can drag the helper nodes to
manipulate the pseudoknotted base-pairs to either reduce space (right image), or expand a pseudoknot to draw attention or isolate its base-pairs
(left image).
https://doi.org/10.1371/journal.pone.0210281.g003
jViz.RNA 4.0—Visualizing pseudoknots and RNA editing employing compressed tree graphs
PLOS ONE | https://doi.org/10.1371/journal.pone.0210281 May 6, 2019 5 / 25
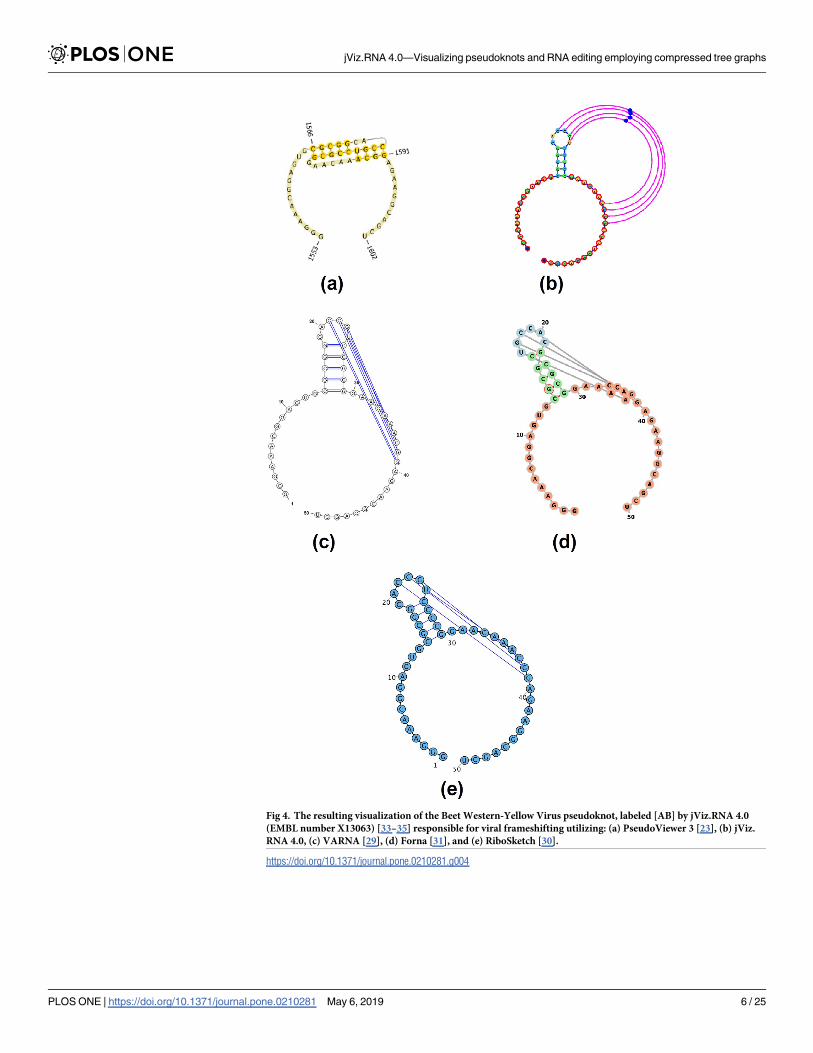
Fig 4. The resulting visualization of the Beet Western-Yellow Virus pseudoknot, labeled [AB] by jViz.RNA 4.0
(EMBL number X13063) [33–35] responsible for viral frameshifting utilizing: (a) PseudoViewer 3 [23], (b) jViz.
RNA 4.0, (c) VARNA [29], (d) Forna [31], and (e) RiboSketch [30].
https://doi.org/10.1371/journal.pone.0210281.g004
jViz.RNA 4.0—Visualizing pseudoknots and RNA editing employing compressed tree graphs
PLOS ONE | https://doi.org/10.1371/journal.pone.0210281 May 6, 2019 6 / 25
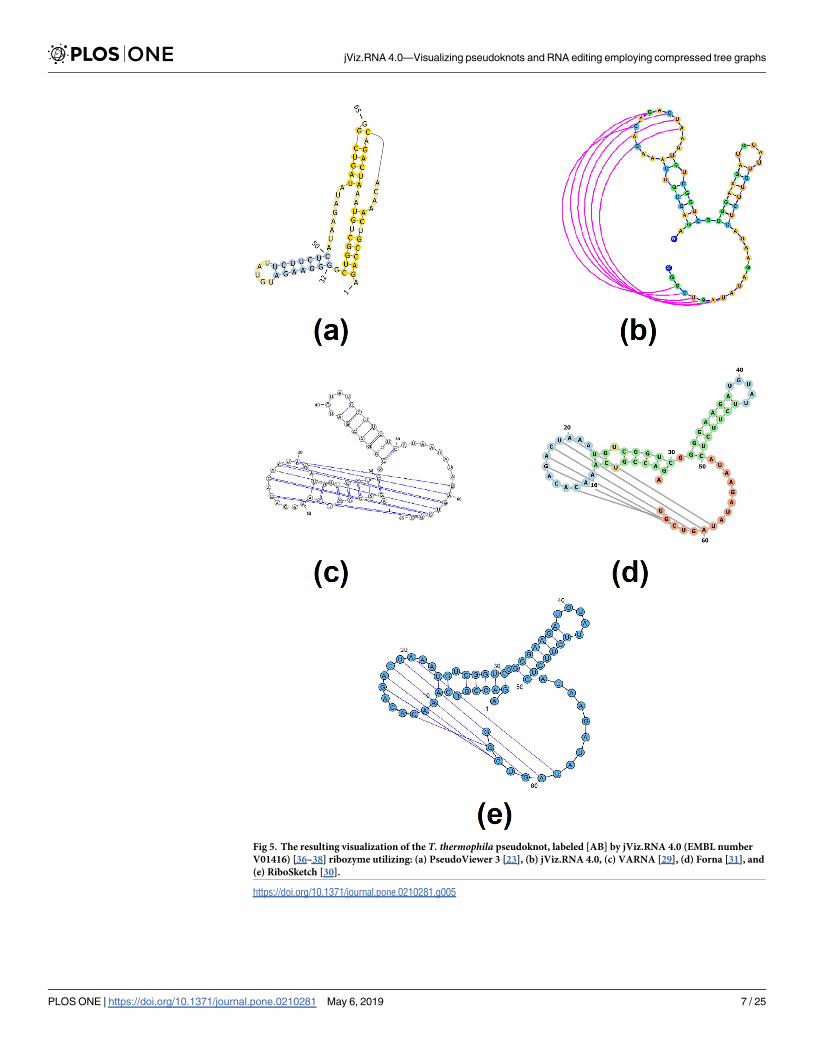
Fig 5. The resulting visualization of the T. thermophila pseudoknot, labeled [AB] by jViz.RNA 4.0 (EMBL number
V01416) [36–38] ribozyme utilizing: (a) PseudoViewer 3 [23], (b) jViz.RNA 4.0, (c) VARNA [29], (d) Forna [31], and
(e) RiboSketch [30].
https://doi.org/10.1371/journal.pone.0210281.g005
jViz.RNA 4.0—Visualizing pseudoknots and RNA editing employing compressed tree graphs
PLOS ONE | https://doi.org/10.1371/journal.pone.0210281 May 6, 2019 7 / 25
[20]. These software detect pseudoknots and provide some degree of specialized pseudoknot
visualization using colours. The final category of RNA visualization software includes jViz.
RNA 4.0 and PseudoViewer [23]. These software offer a specialized visualization of pseudo-
knots, allow for user interaction with the structure layout, and take a specialized approach
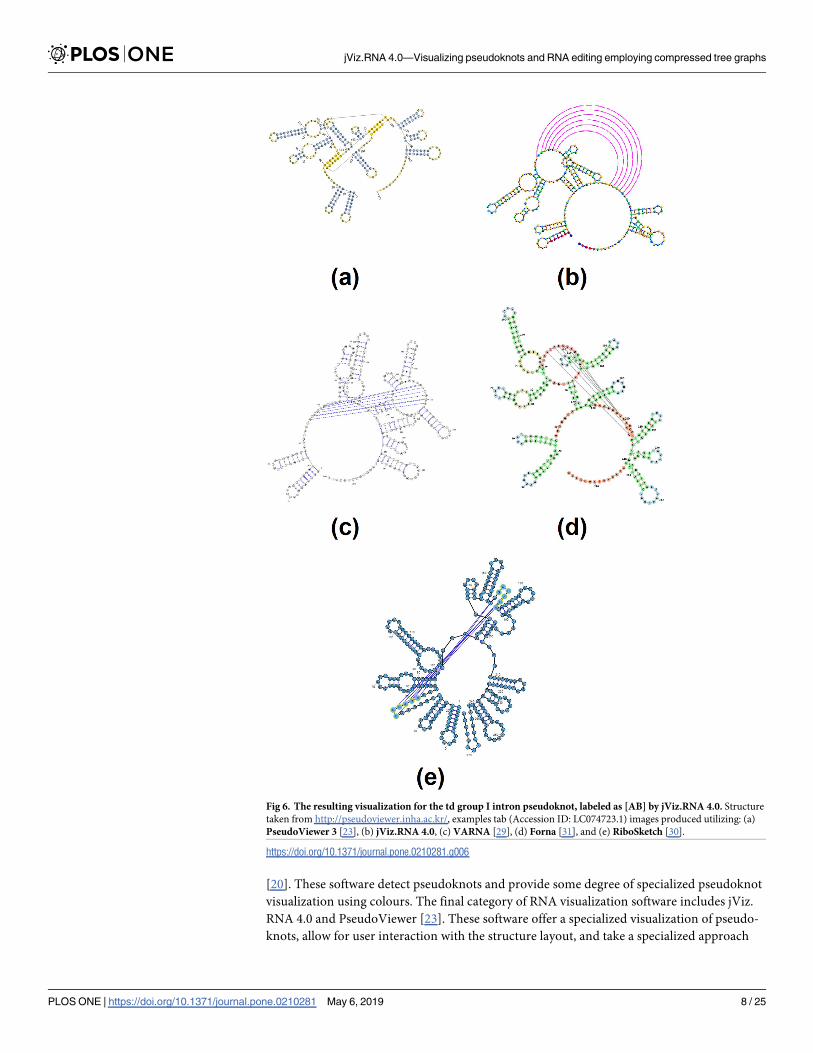
Fig 6. The resulting visualization for the td group I intron pseudoknot, labeled as [AB] by jViz.RNA 4.0. Structure
taken from http://pseudoviewer.inha.ac.kr/, examples tab (Accession ID: LC074723.1) images produced utilizing: (a)
PseudoViewer 3 [23], (b) jViz.RNA 4.0, (c) VARNA [29], (d) Forna [31], and (e) RiboSketch [30].
https://doi.org/10.1371/journal.pone.0210281.g006
jViz.RNA 4.0—Visualizing pseudoknots and RNA editing employing compressed tree graphs
PLOS ONE | https://doi.org/10.1371/journal.pone.0210281 May 6, 2019 8 / 25
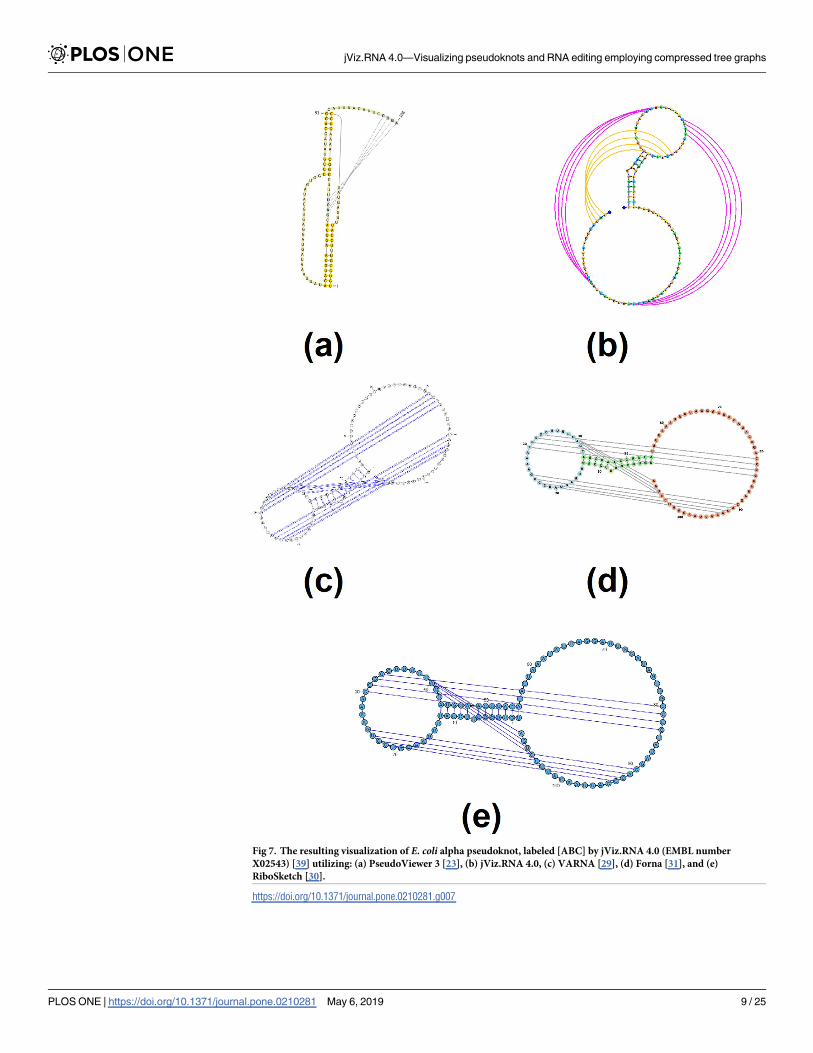
Fig 7. The resulting visualization of E. coli alpha pseudoknot, labeled [ABC] by jViz.RNA 4.0 (EMBL number
X02543) [39] utilizing: (a) PseudoViewer 3 [23], (b) jViz.RNA 4.0, (c) VARNA [29], (d) Forna [31], and (e)
RiboSketch [30].
https://doi.org/10.1371/journal.pone.0210281.g007
jViz.RNA 4.0—Visualizing pseudoknots and RNA editing employing compressed tree graphs
PLOS ONE | https://doi.org/10.1371/journal.pone.0210281 May 6, 2019 9 / 25
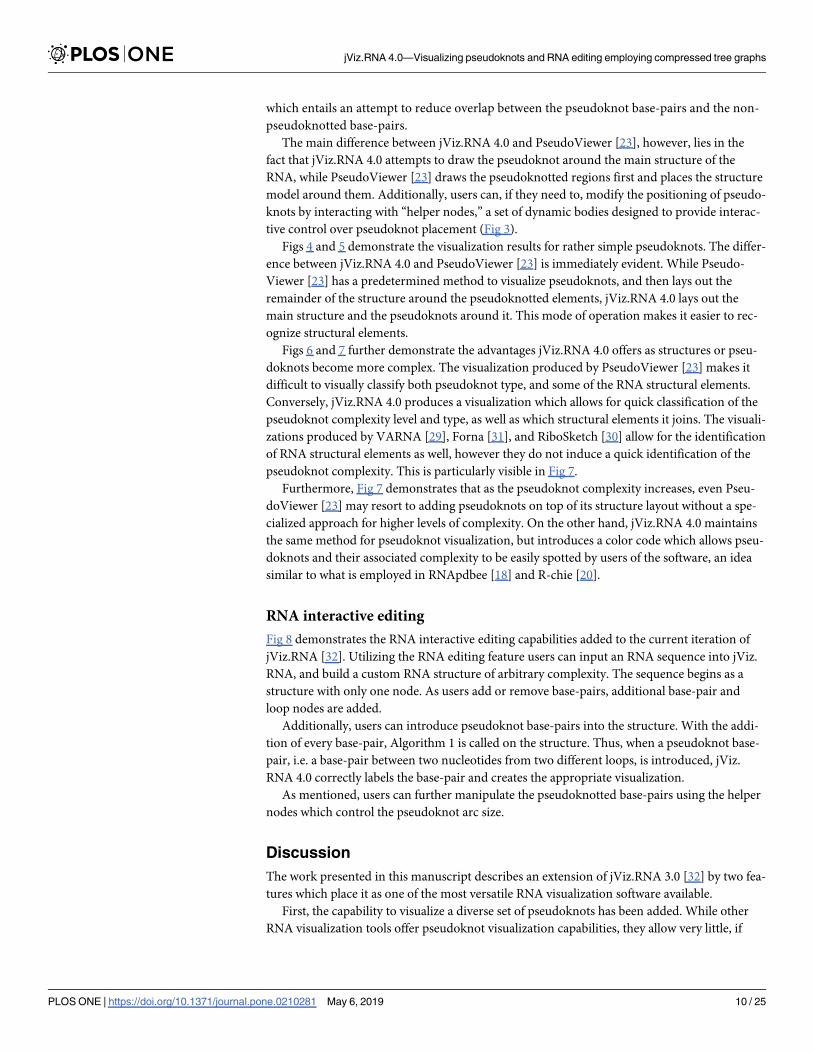
which entails an attempt to reduce overlap between the pseudoknot base-pairs and the non-
pseudoknotted base-pairs.
The main difference between jViz.RNA 4.0 and PseudoViewer [23], however, lies in the
fact that jViz.RNA 4.0 attempts to draw the pseudoknot around the main structure of the
RNA, while PseudoViewer [23] draws the pseudoknotted regions first and places the structure
model around them. Additionally, users can, if they need to, modify the positioning of pseudo-
knots by interacting with “helper nodes,” a set of dynamic bodies designed to provide interac-
tive control over pseudoknot placement (Fig 3).
Figs 4 and 5 demonstrate the visualization results for rather simple pseudoknots. The differ-
ence between jViz.RNA 4.0 and PseudoViewer [23] is immediately evident. While Pseudo-
Viewer [23] has a predetermined method to visualize pseudoknots, and then lays out the
remainder of the structure around the pseudoknotted elements, jViz.RNA 4.0 lays out the
main structure and the pseudoknots around it. This mode of operation makes it easier to rec-
ognize structural elements.
Figs 6 and 7 further demonstrate the advantages jViz.RNA 4.0 offers as structures or pseu-
doknots become more complex. The visualization produced by PseudoViewer [23] makes it
difficult to visually classify both pseudoknot type, and some of the RNA structural elements.
Conversely, jViz.RNA 4.0 produces a visualization which allows for quick classification of the
pseudoknot complexity level and type, as well as which structural elements it joins. The visuali-
zations produced by VARNA [29], Forna [31], and RiboSketch [30] allow for the identification
of RNA structural elements as well, however they do not induce a quick identification of the
pseudoknot complexity. This is particularly visible in Fig 7.
Furthermore, Fig 7 demonstrates that as the pseudoknot complexity increases, even Pseu-
doViewer [23] may resort to adding pseudoknots on top of its structure layout without a spe-
cialized approach for higher levels of complexity. On the other hand, jViz.RNA 4.0 maintains
the same method for pseudoknot visualization, but introduces a color code which allows pseu-
doknots and their associated complexity to be easily spotted by users of the software, an idea
similar to what is employed in RNApdbee [18] and R-chie [20].
RNA interactive editing
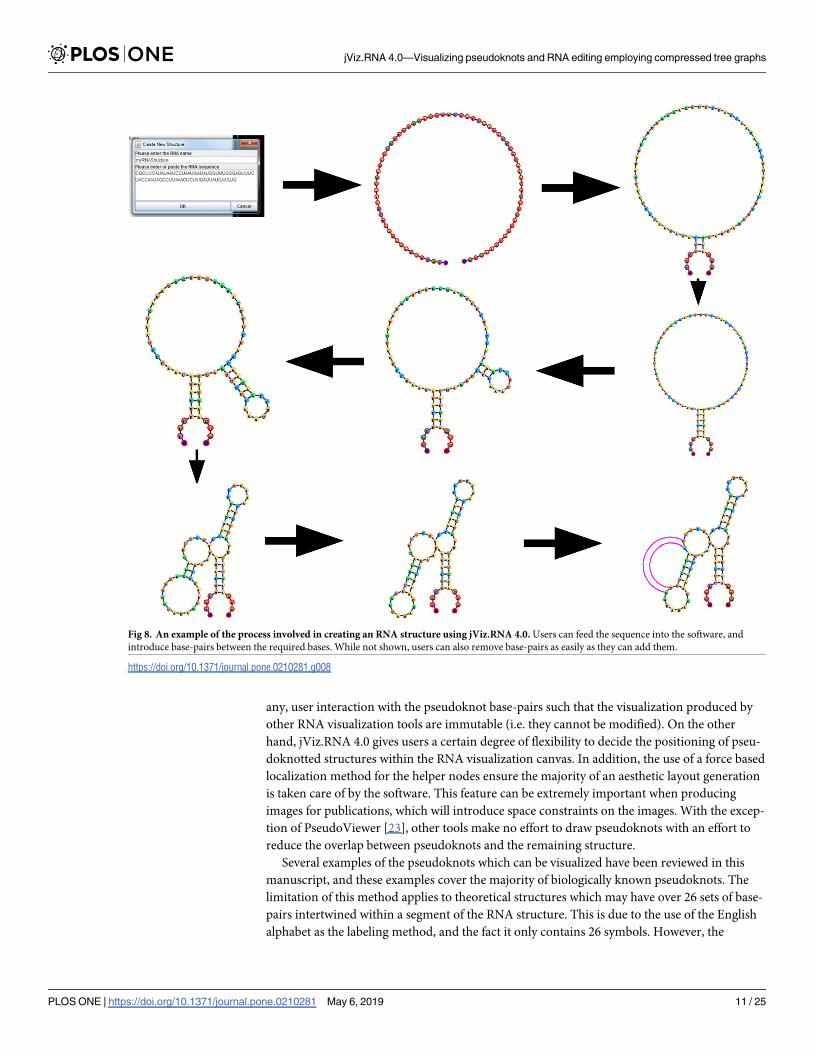
Fig 8 demonstrates the RNA interactive editing capabilities added to the current iteration of
jViz.RNA [32]. Utilizing the RNA editing feature users can input an RNA sequence into jViz.
RNA, and build a custom RNA structure of arbitrary complexity. The sequence begins as a
structure with only one node. As users add or remove base-pairs, additional base-pair and
loop nodes are added.
Additionally, users can introduce pseudoknot base-pairs into the structure. With the addi-
tion of every base-pair, Algorithm 1 is called on the structure. Thus, when a pseudoknot base-
pair, i.e. a base-pair between two nucleotides from two different loops, is introduced, jViz.
RNA 4.0 correctly labels the base-pair and creates the appropriate visualization.
As mentioned, users can further manipulate the pseudoknotted base-pairs using the helper
nodes which control the pseudoknot arc size.
Discussion
The work presented in this manuscript describes an extension of jViz.RNA 3.0 [32] by two fea-
tures which place it as one of the most versatile RNA visualization software available.
First, the capability to visualize a diverse set of pseudoknots has been added. While other
RNA visualization tools offer pseudoknot visualization capabilities, they allow very little, if
jViz.RNA 4.0—Visualizing pseudoknots and RNA editing employing compressed tree graphs
PLOS ONE | https://doi.org/10.1371/journal.pone.0210281 May 6, 2019 10 / 25
any, user interaction with the pseudoknot base-pairs such that the visualization produced by
other RNA visualization tools are immutable (i.e. they cannot be modified). On the other
hand, jViz.RNA 4.0 gives users a certain degree of flexibility to decide the positioning of pseu-
doknotted structures within the RNA visualization canvas. In addition, the use of a force based
localization method for the helper nodes ensure the majority of an aesthetic layout generation
is taken care of by the software. This feature can be extremely important when producing
images for publications, which will introduce space constraints on the images. With the excep-
tion of PseudoViewer [23], other tools make no effort to draw pseudoknots with an effort to
reduce the overlap between pseudoknots and the remaining structure.
Several examples of the pseudoknots which can be visualized have been reviewed in this
manuscript, and these examples cover the majority of biologically known pseudoknots. The
limitation of this method applies to theoretical structures which may have over 26 sets of base-
pairs intertwined within a segment of the RNA structure. This is due to the use of the English
alphabet as the labeling method, and the fact it only contains 26 symbols. However, the
Fig 8. An example of the process involved in creating an RNA structure using jViz.RNA 4.0. Users can feed the sequence into the software, and
introduce base-pairs between the required bases. While not shown, users can also remove base-pairs as easily as they can add them.
https://doi.org/10.1371/journal.pone.0210281.g008
jViz.RNA 4.0—Visualizing pseudoknots and RNA editing employing compressed tree graphs
PLOS ONE | https://doi.org/10.1371/journal.pone.0210281 May 6, 2019 11 / 25
biological feasibility of those structures does not seem likely, and the theoretical uses for the
visualization of such structures are difficult to imagine.
In addition, jViz.RNA 4.0 now offers users the ability to edit RNA structures and change
their base-pairing interactively. Rather than modify RNA text files such as FASTA or CT, users
can now introduce changes to the RNA structure and view the effect of those changes on the
structure as they are introduced. The addition of this feature allows users to input an RNA
sequence, and edit it into an arbitrary structure as they wish. This is especially useful for people
who are using jViz.RNA 4.0 for the first time, but already have RNA structures they wish to
visualize saved as image files.
The non-trivial work required to modify the underlying tree graph for the RNA structure
ensures that the compressed graph can be edited and modified. The fact these modifications
can be done on the compressed tree graph ensures that even large RNA structures very quickly
settle into a stable conformation after any number of changes, providing a much faster user
interaction with the software compared to the detailed graph which was employed by former
jViz.RNA versions [32], as well as Forna [31], which is the only other software that allows
interactive editing.
Materials and methods
RNA pseudoknot classification and visualization
The main goal in pseudoknot visualization incorporation was the creation of a system that
visualizes pseudoknots with as little overlap over the main structure as possible, and allows for
some degree of user adjustment of the visualization, since different users may require a differ-
ent layout of the structure.
The process of pseudoknot visualization is composed of two main stages, similarly to the
process in [40] and [20]. (1) pseudoknot identification and classification, and (2) pseudoknot
layout. This is done since different pseudoknots may require different visualization methods.
However, in our current iteration, jViz.RNA 4.0, pseudoknot base-pairs are drawn using a
very similar method for all pseudoknot types. The main distinction that is employed is between
main structure base-pairs and pseudoknot base-pairs.
The pseudoknot classification scheme. Pseudoknot classification becomes the first step
in pseudoknot visualization. There is extensive work regarding pseudoknot visualization, and
a detailed review of it can be found in [9]. However, two notable methods for pseudoknot clas-
sification relevant to this article are the one described in [41] and further developed in [42], as
well as the methods proposed and employed in [17].
To aid in the visualization of different types (orders) of pseudoknots we propose a pseudo-
knot classification system. In this system pseudoknots are classified based on the number of
overlapping sets of arcs each component of the RNA structure contains, similarly to the meth-
ods proposed in [40] and employed in [17, 18]. A non-pseudoknotted structure will have no
overlapping arcs. While a simple H-type pseudoknot containing only one set of overlapping
arcs will be labeled as an [AB] pseudoknot (Fig 9a and 9b), and a kissing hairpin pseudoknot
(named so for having a set of base-pairs connecting two terminal hairpin loops) will be labeled
[ABA] (Fig 9c and 9d). Each consecutive letter in the English alphabet denotes a higher level of
complexity, such that a pseudoknot labeled with a label containing the letter ‘C’ will have three
sets of overlapping arcs (Fig 9e and 9f).
RNA base-pair labeling. In the first step, the structure is considered as a graph G = {V, E}
where each nucleotide is a vertex v 2 V and each base-pair is an edge e 2 E. Given this graph,
the procedure for labeling base-pairs is shown in Algorithm 1.
jViz.RNA 4.0—Visualizing pseudoknots and RNA editing employing compressed tree graphs
PLOS ONE | https://doi.org/10.1371/journal.pone.0210281 May 6, 2019 12 / 25
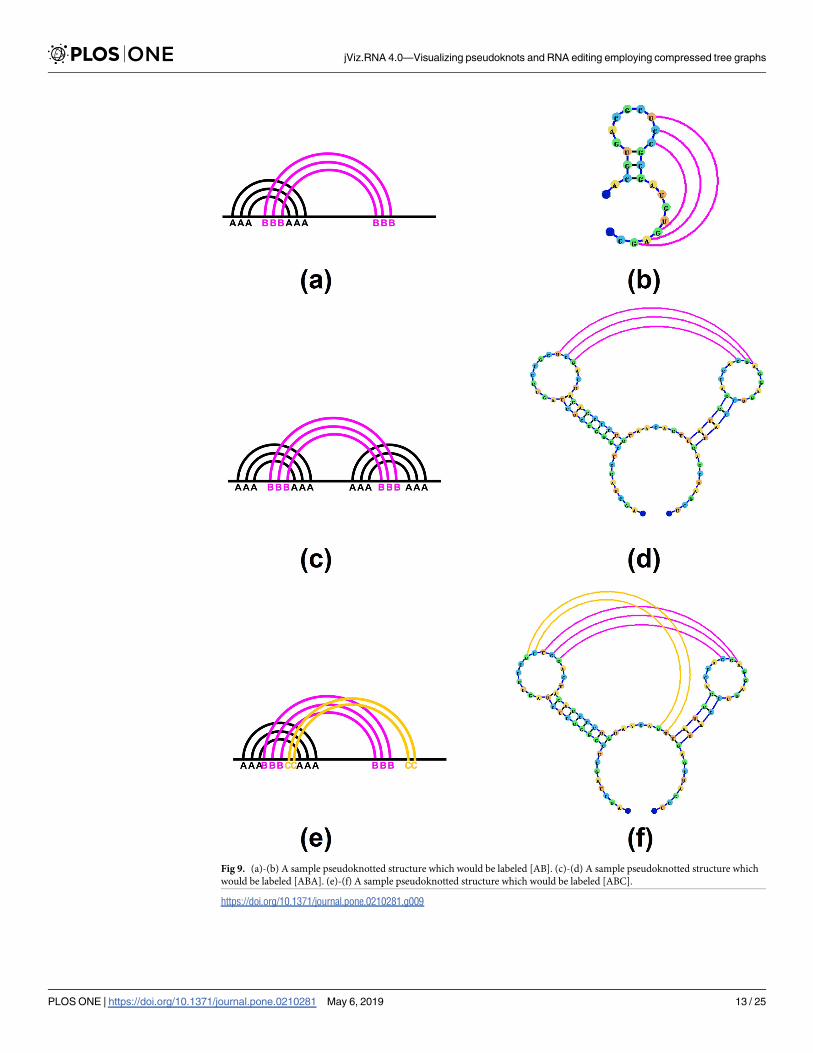
Fig 9. (a)-(b) A sample pseudoknotted structure which would be labeled [AB]. (c)-(d) A sample pseudoknotted structure which
would be labeled [ABA]. (e)-(f) A sample pseudoknotted structure which would be labeled [ABC].
https://doi.org/10.1371/journal.pone.0210281.g009
jViz.RNA 4.0—Visualizing pseudoknots and RNA editing employing compressed tree graphs
PLOS ONE | https://doi.org/10.1371/journal.pone.0210281 May 6, 2019 13 / 25
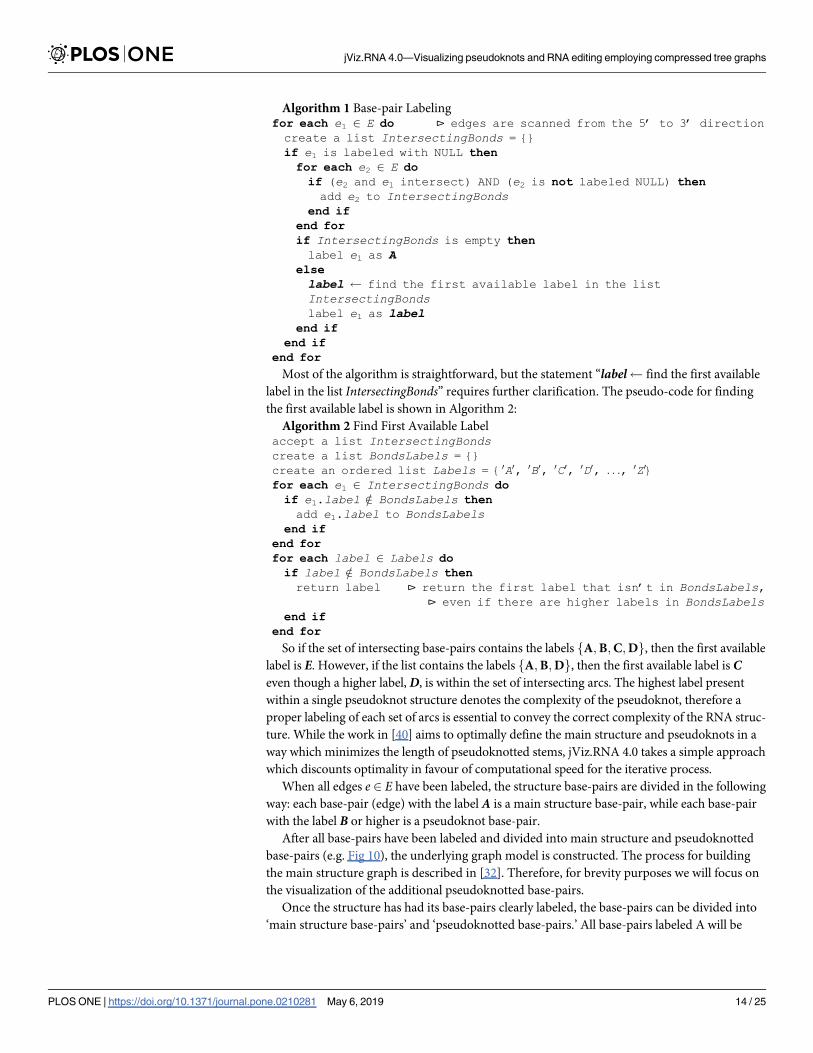
Algorithm 1 Base-pair Labelingfor each e1 2 E do ⊳ edges are scanned from the 5’ to 3’ directioncreate a list IntersectingBonds = {}if e1 is labeled with NULL thenfor each e2 2 E doif (e2 and e1 intersect) AND (e2 is not labeled NULL) thenadd e2 to IntersectingBonds
end ifend forif IntersectingBonds is empty thenlabel e1 as A
elselabel find the first available label in the listIntersectingBondslabel e1 as label
end ifend if
end forMost of the algorithm is straightforward, but the statement “label find the first available
label in the list IntersectingBonds” requires further clarification. The pseudo-code for finding
the first available label is shown in Algorithm 2:
Algorithm 2 Find First Available Labelaccept a list IntersectingBondscreate a list BondsLabels = {}create an ordered list Labels = {0A0, 0B0, 0C0, 0D0, . . ., 0Z0}for each e1 2 IntersectingBonds doif e1.label =2 BondsLabels thenadd e1.label to BondsLabels
end ifend forfor each label 2 Labels doif label =2 BondsLabels thenreturn label ⊳ return the first label that isn’t in BondsLabels,
⊳ even if there are higher labels in BondsLabelsend if
end forSo if the set of intersecting base-pairs contains the labels fA;B;C;Dg, then the first available
label is E. However, if the list contains the labels fA;B;Dg, then the first available label is Ceven though a higher label, D, is within the set of intersecting arcs. The highest label present
within a single pseudoknot structure denotes the complexity of the pseudoknot, therefore a
proper labeling of each set of arcs is essential to convey the correct complexity of the RNA struc-
ture. While the work in [40] aims to optimally define the main structure and pseudoknots in a
way which minimizes the length of pseudoknotted stems, jViz.RNA 4.0 takes a simple approach
which discounts optimality in favour of computational speed for the iterative process.
When all edges e 2 E have been labeled, the structure base-pairs are divided in the following
way: each base-pair (edge) with the label A is a main structure base-pair, while each base-pair
with the label B or higher is a pseudoknot base-pair.
After all base-pairs have been labeled and divided into main structure and pseudoknotted
base-pairs (e.g. Fig 10), the underlying graph model is constructed. The process for building
the main structure graph is described in [32]. Therefore, for brevity purposes we will focus on
the visualization of the additional pseudoknotted base-pairs.
Once the structure has had its base-pairs clearly labeled, the base-pairs can be divided into
‘main structure base-pairs’ and ‘pseudoknotted base-pairs.’ All base-pairs labeled A will be
jViz.RNA 4.0—Visualizing pseudoknots and RNA editing employing compressed tree graphs
PLOS ONE | https://doi.org/10.1371/journal.pone.0210281 May 6, 2019 14 / 25
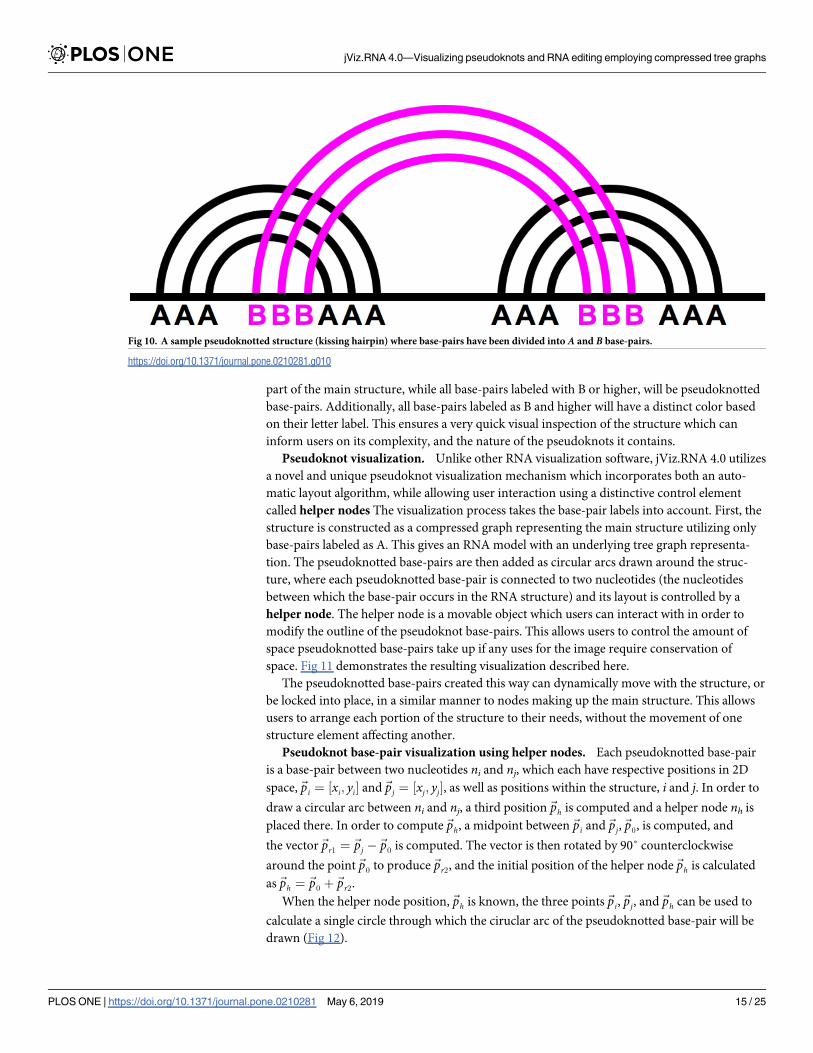
part of the main structure, while all base-pairs labeled with B or higher, will be pseudoknotted
base-pairs. Additionally, all base-pairs labeled as B and higher will have a distinct color based
on their letter label. This ensures a very quick visual inspection of the structure which can
inform users on its complexity, and the nature of the pseudoknots it contains.
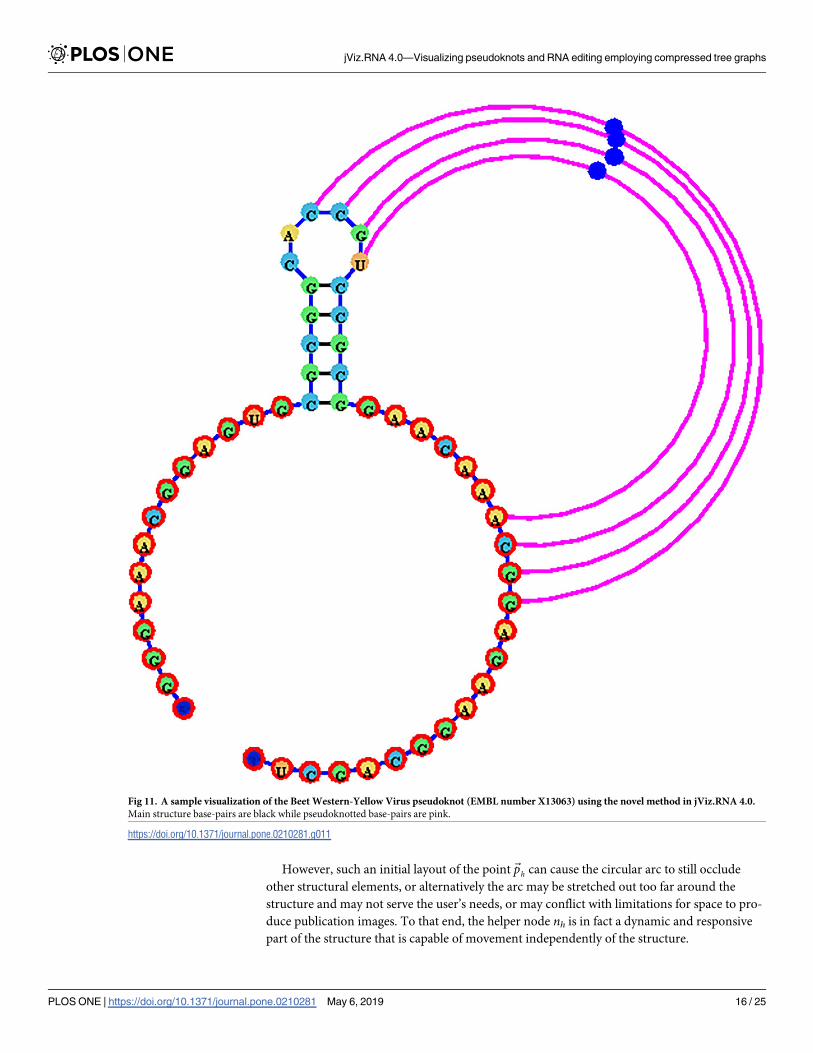
Pseudoknot visualization. Unlike other RNA visualization software, jViz.RNA 4.0 utilizes
a novel and unique pseudoknot visualization mechanism which incorporates both an auto-
matic layout algorithm, while allowing user interaction using a distinctive control element
called helper nodes The visualization process takes the base-pair labels into account. First, the
structure is constructed as a compressed graph representing the main structure utilizing only
base-pairs labeled as A. This gives an RNA model with an underlying tree graph representa-
tion. The pseudoknotted base-pairs are then added as circular arcs drawn around the struc-
ture, where each pseudoknotted base-pair is connected to two nucleotides (the nucleotides
between which the base-pair occurs in the RNA structure) and its layout is controlled by a
helper node. The helper node is a movable object which users can interact with in order to
modify the outline of the pseudoknot base-pairs. This allows users to control the amount of
space pseudoknotted base-pairs take up if any uses for the image require conservation of
space. Fig 11 demonstrates the resulting visualization described here.
The pseudoknotted base-pairs created this way can dynamically move with the structure, or
be locked into place, in a similar manner to nodes making up the main structure. This allows
users to arrange each portion of the structure to their needs, without the movement of one
structure element affecting another.
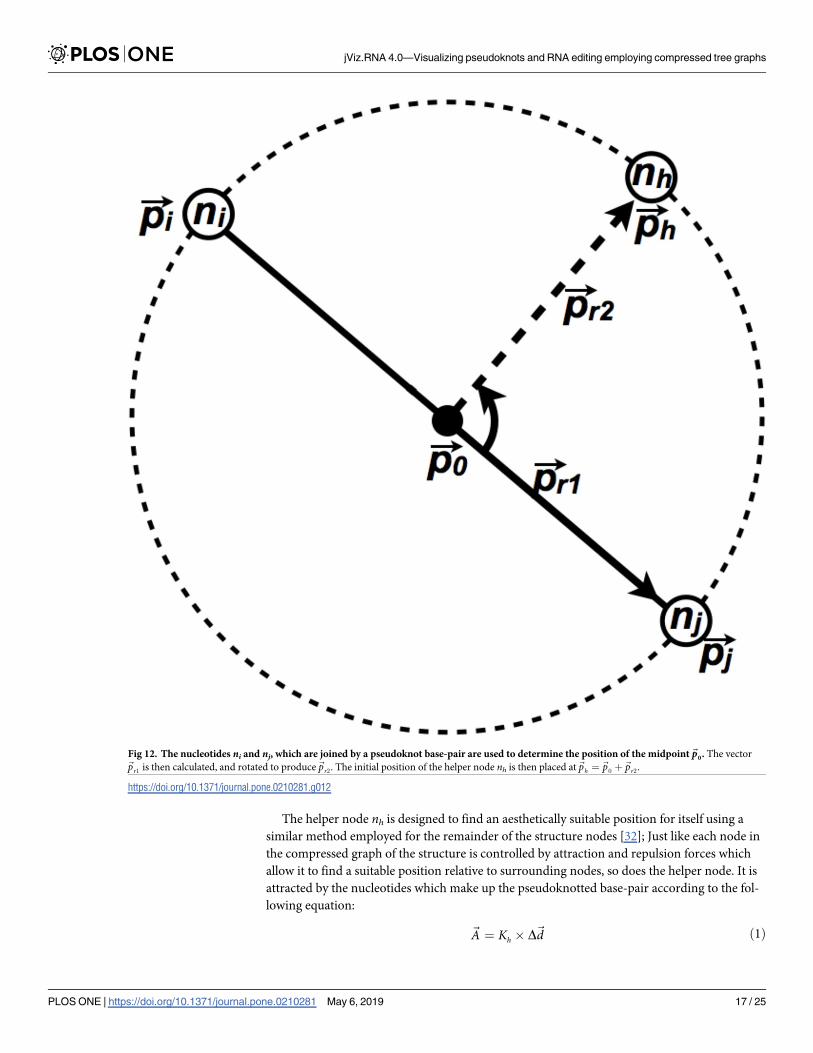
Pseudoknot base-pair visualization using helper nodes. Each pseudoknotted base-pair
is a base-pair between two nucleotides ni and nj, which each have respective positions in 2D
space,~pi ¼ ½xi; yi� and~pj ¼ ½xj; yj�, as well as positions within the structure, i and j. In order to
draw a circular arc between ni and nj, a third position~ph is computed and a helper node nh is
placed there. In order to compute~ph, a midpoint between~pi and~pj,~p0, is computed, and
the vector~pr1 ¼~pj � ~p0 is computed. The vector is then rotated by 90˚ counterclockwise
around the point~p0 to produce~pr2, and the initial position of the helper node~ph is calculated
as~ph ¼~p0 þ~pr2.
When the helper node position,~ph is known, the three points~pi,~pj, and~ph can be used to
calculate a single circle through which the ciruclar arc of the pseudoknotted base-pair will be
drawn (Fig 12).
Fig 10. A sample pseudoknotted structure (kissing hairpin) where base-pairs have been divided into A and B base-pairs.
https://doi.org/10.1371/journal.pone.0210281.g010
jViz.RNA 4.0—Visualizing pseudoknots and RNA editing employing compressed tree graphs
PLOS ONE | https://doi.org/10.1371/journal.pone.0210281 May 6, 2019 15 / 25
However, such an initial layout of the point~ph can cause the circular arc to still occlude
other structural elements, or alternatively the arc may be stretched out too far around the
structure and may not serve the user’s needs, or may conflict with limitations for space to pro-
duce publication images. To that end, the helper node nh is in fact a dynamic and responsive
part of the structure that is capable of movement independently of the structure.
Fig 11. A sample visualization of the Beet Western-Yellow Virus pseudoknot (EMBL number X13063) using the novel method in jViz.RNA 4.0.
Main structure base-pairs are black while pseudoknotted base-pairs are pink.
https://doi.org/10.1371/journal.pone.0210281.g011
jViz.RNA 4.0—Visualizing pseudoknots and RNA editing employing compressed tree graphs
PLOS ONE | https://doi.org/10.1371/journal.pone.0210281 May 6, 2019 16 / 25
The helper node nh is designed to find an aesthetically suitable position for itself using a
similar method employed for the remainder of the structure nodes [32]; Just like each node in
the compressed graph of the structure is controlled by attraction and repulsion forces which
allow it to find a suitable position relative to surrounding nodes, so does the helper node. It is
attracted by the nucleotides which make up the pseudoknotted base-pair according to the fol-
lowing equation:
~A ¼ Kh � D~d ð1Þ
Fig 12. The nucleotides ni and nj, which are joined by a pseudoknot base-pair are used to determine the position of the midpoint~p0. The vector
~pr1 is then calculated, and rotated to produce~pr2. The initial position of the helper node nh is then placed at~ph ¼~p0 þ~pr2.
https://doi.org/10.1371/journal.pone.0210281.g012
jViz.RNA 4.0—Visualizing pseudoknots and RNA editing employing compressed tree graphs
PLOS ONE | https://doi.org/10.1371/journal.pone.0210281 May 6, 2019 17 / 25
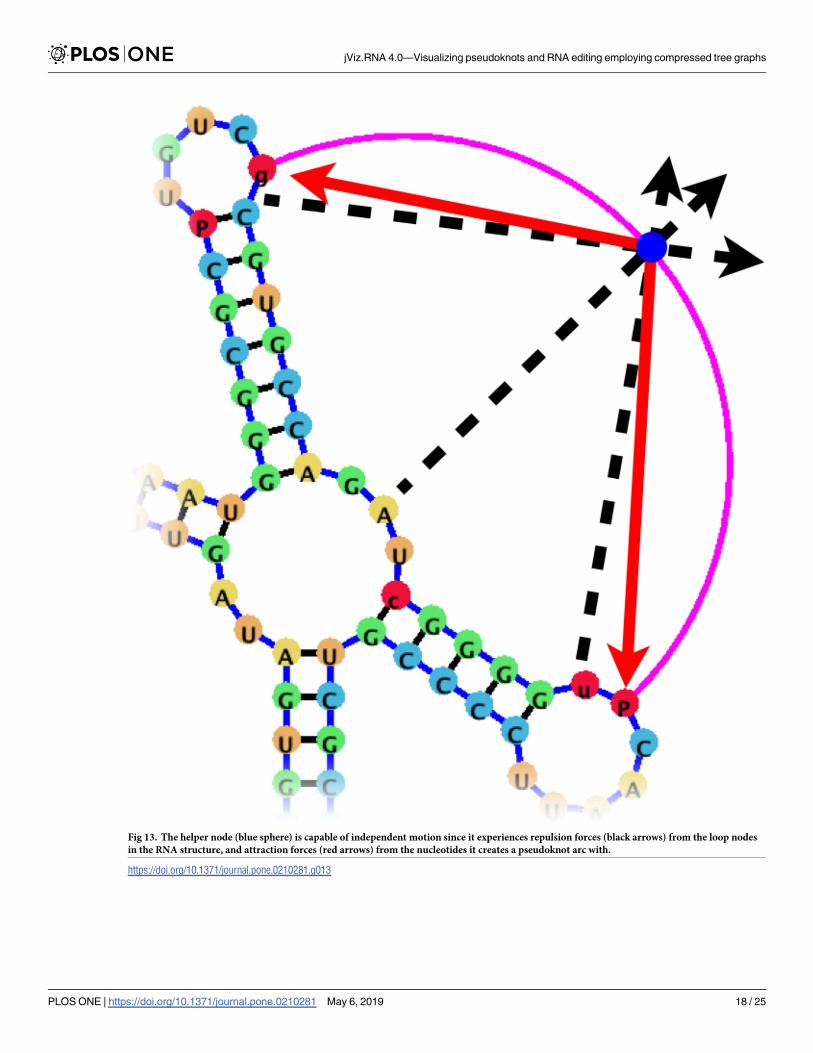
Fig 13. The helper node (blue sphere) is capable of independent motion since it experiences repulsion forces (black arrows) from the loop nodes
in the RNA structure, and attraction forces (red arrows) from the nucleotides it creates a pseudoknot arc with.
https://doi.org/10.1371/journal.pone.0210281.g013
jViz.RNA 4.0—Visualizing pseudoknots and RNA editing employing compressed tree graphs
PLOS ONE | https://doi.org/10.1371/journal.pone.0210281 May 6, 2019 18 / 25
where Kh is a coefficient controlling the magnitude of the force, and Δd is the absolute distance
between the helper node and either nucleotide (the equation is calculated for both nucleotides
i and j), and repelled by the loop nodes in the structure according to the following equation:
~R ¼GhuDd2
ð2Þ
where Gh is a repulsion coefficient controlling the magnitude of the force, u is a unit vector
pointing in the direction of the force, and Δd is the absolute distance between the helper node
and each of the loops L of the structure. In this manner, the helper node attempts to move
away from the structure, but is drawn back by the nucleotides which make up the pseudoknot
base-pair. Furthermore, the attraction coefficient Kh, used in calculating ~A, is itself governed
by the difference in structure position between the nucleotides as follows:
Kh ¼K 0hji � jj
ð3Þ
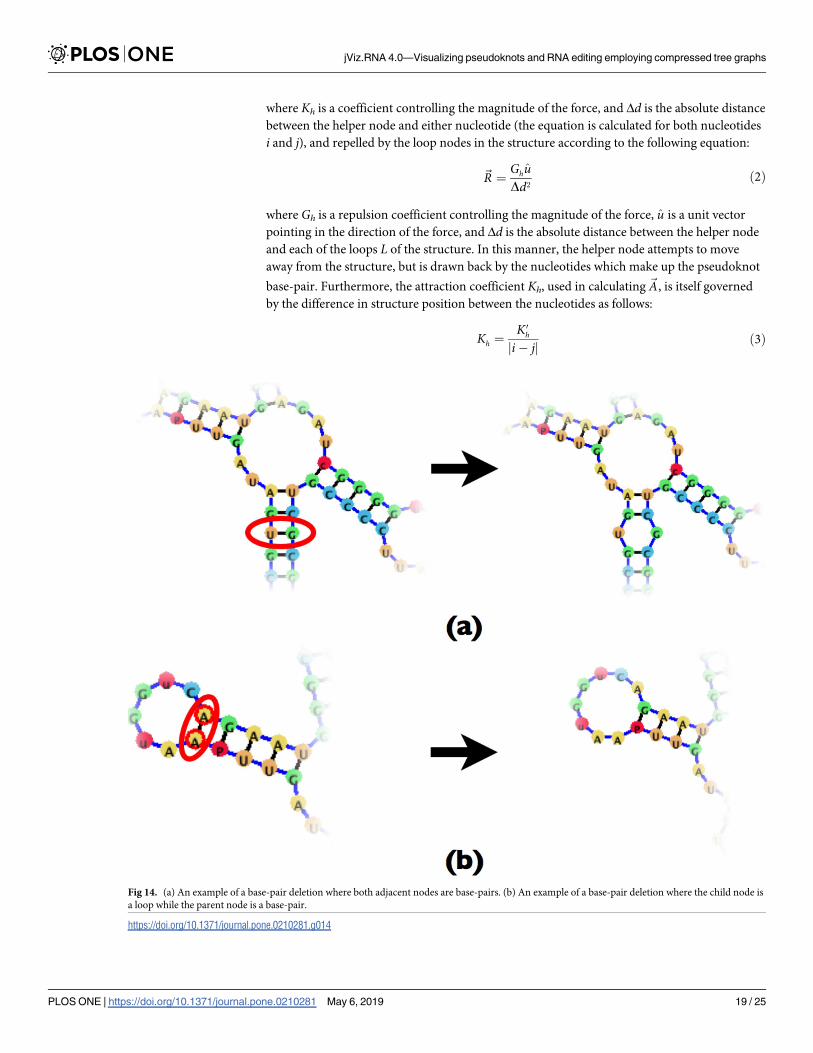
Fig 14. (a) An example of a base-pair deletion where both adjacent nodes are base-pairs. (b) An example of a base-pair deletion where the child node is
a loop while the parent node is a base-pair.
https://doi.org/10.1371/journal.pone.0210281.g014
jViz.RNA 4.0—Visualizing pseudoknots and RNA editing employing compressed tree graphs
PLOS ONE | https://doi.org/10.1371/journal.pone.0210281 May 6, 2019 19 / 25
where K 0h is the attraction coefficient all helper nodes derive their personal Kh from, and i and jare the positions of nucleotides ni and nj (between which the pseudoknot base-pair exists)
within the sequence (Nucleotides can have positions from 1 to N where N is the length of the
sequence). As a result, pseudoknots between nucleotides that are further apart (and thus have
likely more structural components between them) are allowed to move further due to weaker
attraction forces (Fig 13).
In addition to its automatic layout, the helper nodes can be controlled by the user to fit
their desired visualization. The nodes can be moved by the user and locked into place like
other structural components. This allows users to force the pseudoknot base-pairs to any posi-
tion they may require for their purposes, as can be seen in Fig 3.
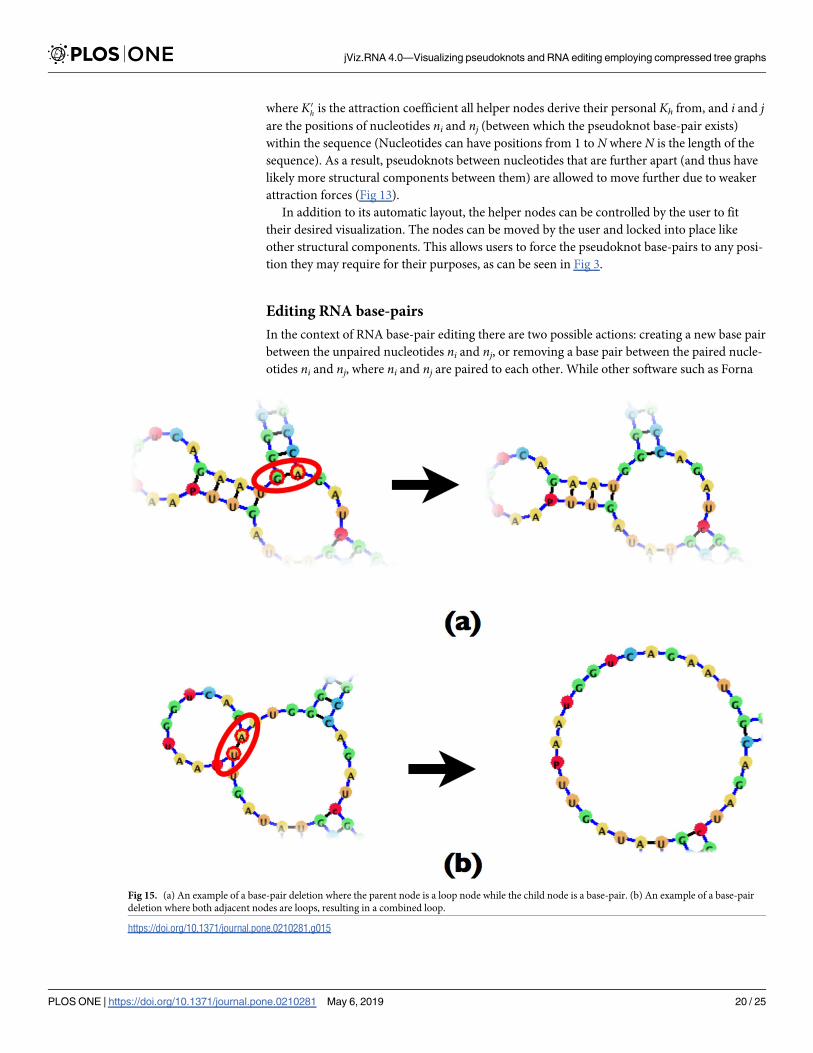
Editing RNA base-pairs
In the context of RNA base-pair editing there are two possible actions: creating a new base pair
between the unpaired nucleotides ni and nj, or removing a base pair between the paired nucle-
otides ni and nj, where ni and nj are paired to each other. While other software such as Forna
Fig 15. (a) An example of a base-pair deletion where the parent node is a loop node while the child node is a base-pair. (b) An example of a base-pair
deletion where both adjacent nodes are loops, resulting in a combined loop.
https://doi.org/10.1371/journal.pone.0210281.g015
jViz.RNA 4.0—Visualizing pseudoknots and RNA editing employing compressed tree graphs
PLOS ONE | https://doi.org/10.1371/journal.pone.0210281 May 6, 2019 20 / 25
[31] and RiboSketch [30] offer such functionality, they both utilize a detailed graph representa-
tion (Fig 2b) where nucleotides and base-pairs are mapped to vertexes and edges, respectively.
Such a setup makes it easier to edit the RNA structure, but produces slower run-times for large
RNA molecules. (A comparison of detailed and compressed graph run times can be found in
[32]). jViz.RNA 4.0 employs a compressed graph (Fig 2c) which is stored as a tree (Fig 2d),
which produces faster run times. However, introducing and removing base-pairs requires a
more sophisticated manipulation of the underlying tree graph.
Removing an existing base-pair. Removing an existing base-pair requires first removing
the base-pair node B, and replacing it with a loop node L. However, depending on the child
(C) and parent (P) node of the base-pair node further nodes may need to be removed. Since
both the parent and child nodes can be both base-pair nodes or loop nodes, there are four pos-
sible scenarios to consider, and those can be seen in Figs 14 and 15.
In essence, removing a base-pair may create a new loop, or fuse existing loops together. The
difficulty which the compressed graph representation introduces is the need to account for the
connectivity of the loops created by the removal of base-pairs.
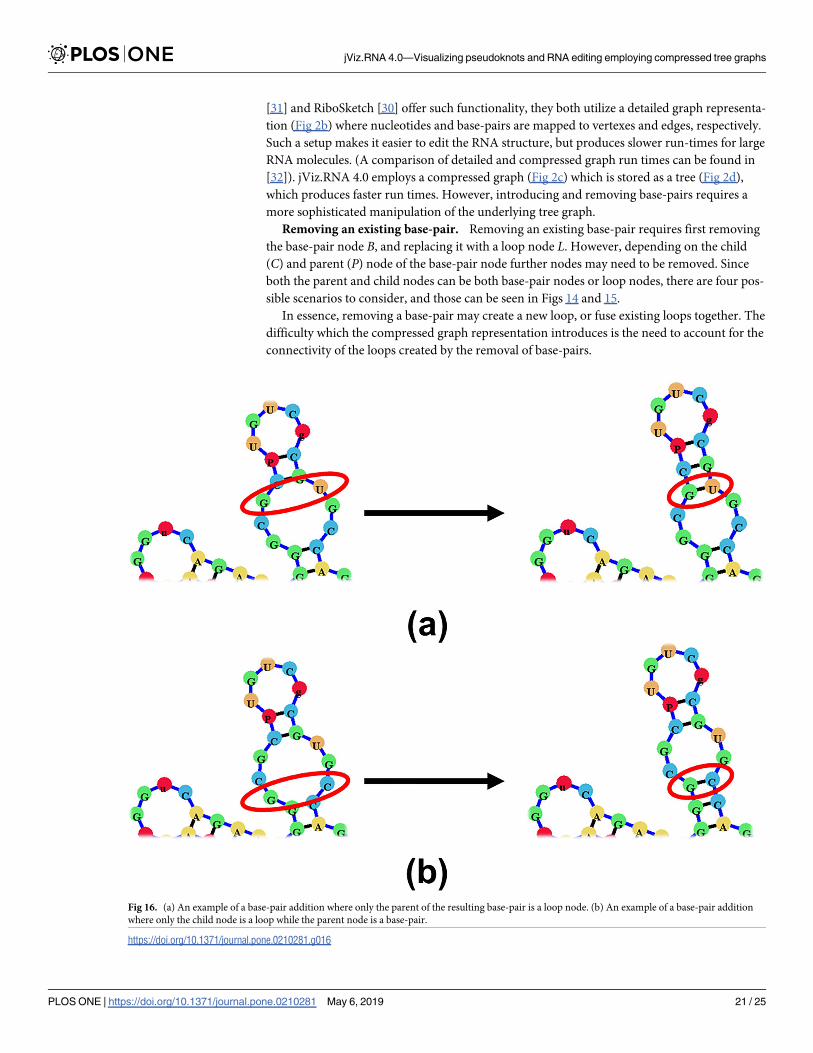
Fig 16. (a) An example of a base-pair addition where only the parent of the resulting base-pair is a loop node. (b) An example of a base-pair addition
where only the child node is a loop while the parent node is a base-pair.
https://doi.org/10.1371/journal.pone.0210281.g016
jViz.RNA 4.0—Visualizing pseudoknots and RNA editing employing compressed tree graphs
PLOS ONE | https://doi.org/10.1371/journal.pone.0210281 May 6, 2019 21 / 25
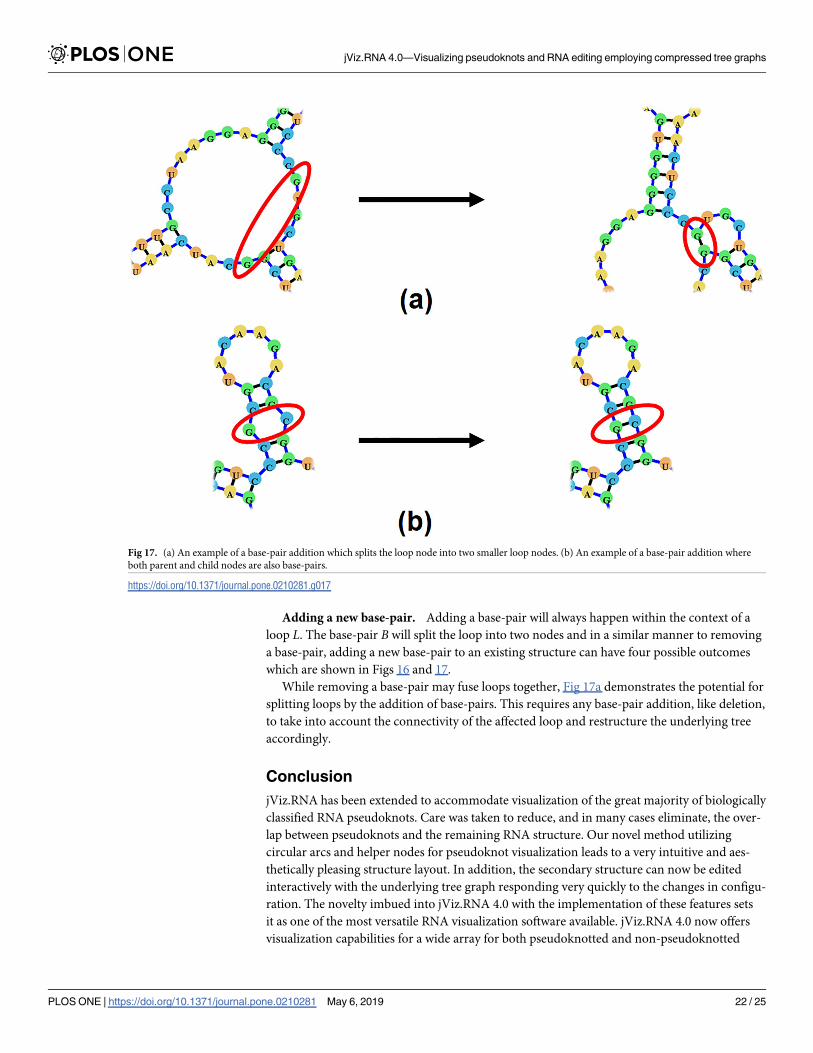
Adding a new base-pair. Adding a base-pair will always happen within the context of a
loop L. The base-pair B will split the loop into two nodes and in a similar manner to removing
a base-pair, adding a new base-pair to an existing structure can have four possible outcomes
which are shown in Figs 16 and 17.
While removing a base-pair may fuse loops together, Fig 17a demonstrates the potential for
splitting loops by the addition of base-pairs. This requires any base-pair addition, like deletion,
to take into account the connectivity of the affected loop and restructure the underlying tree
accordingly.
Conclusion
jViz.RNA has been extended to accommodate visualization of the great majority of biologically
classified RNA pseudoknots. Care was taken to reduce, and in many cases eliminate, the over-
lap between pseudoknots and the remaining RNA structure. Our novel method utilizing
circular arcs and helper nodes for pseudoknot visualization leads to a very intuitive and aes-
thetically pleasing structure layout. In addition, the secondary structure can now be edited
interactively with the underlying tree graph responding very quickly to the changes in configu-
ration. The novelty imbued into jViz.RNA 4.0 with the implementation of these features sets
it as one of the most versatile RNA visualization software available. jViz.RNA 4.0 now offers
visualization capabilities for a wide array for both pseudoknotted and non-pseudoknotted
Fig 17. (a) An example of a base-pair addition which splits the loop node into two smaller loop nodes. (b) An example of a base-pair addition where
both parent and child nodes are also base-pairs.
https://doi.org/10.1371/journal.pone.0210281.g017
jViz.RNA 4.0—Visualizing pseudoknots and RNA editing employing compressed tree graphs
PLOS ONE | https://doi.org/10.1371/journal.pone.0210281 May 6, 2019 22 / 25
RNA molecules. Furthermore, the introduction of interactive editing features allow users to
modify the main RNA structure configuration, as well as introduce or remove pseudoknots to
explore alternative structures, and even create an entirely novel structure starting only with the
RNA sequence. Similar to previous versions, jViz.RNA 4.0 remains platform independent.
In terms of significance, jViz.RNA 4.0 now allows users to entirely customize the layout of
any RNA molecule, both its structural elements and its pseudoknotted base-pairs. The work
presented in this manuscript revolved around extending the usability of jViz.RNA 4.0 while
maintaining a dynamic and responsive layout that can be manipulated by the user, and pre-
serve the fast user responsiveness introduced by the compressed graph in [32]. This degree of
flexibility, responsiveness, and ease of modification can allow users who come from mostly
natural sciences background to begin working with jViz.RNA 4.0 without a steep learning
curve.
Supporting information
S1 Fig. A striking image to be used for online publications.
(TIF)
S1 File. A package containing the jViz.RNa 4.0 executable, several RNA test files, and a
quickstart user manual.
(ZIP)
Author Contributions
Conceptualization: Boris Shabash, Kay C. Wiese.
Data curation: Boris Shabash.
Funding acquisition: Kay C. Wiese.
Investigation: Boris Shabash, Kay C. Wiese.
Methodology: Boris Shabash, Kay C. Wiese.
Resources: Kay C. Wiese.
Software: Boris Shabash.
Supervision: Kay C. Wiese.
Validation: Boris Shabash, Kay C. Wiese.
Visualization: Boris Shabash.
Writing – original draft: Boris Shabash, Kay C. Wiese.
Writing – review & editing: Boris Shabash, Kay C. Wiese.
References1. Rietveld K, Poelgeest RV, Pleij A, Boom JHV, Bosch L. The tRNA-like structure at the 3’ terminus of tur-
nip yellow mosaic virus RNA. Differences and similarities with canonical tRNA. Nucleic Acids Research.
1982; 10(6):1929–1946. https://doi.org/10.1093/nar/10.6.1929 PMID: 7079175
2. Joshi RL, Joshi S, Chapeville F, Haenni AL. tRNA-like structures of plant viral RNAs: conformational
requirements for adenylation and aminoacylation. The EMBO Journal. 1983; 2(7):1123–1127. https://
doi.org/10.1002/j.1460-2075.1983.tb01556.x PMID: 6556143
3. Rietveld K, Pleij CWA, Bosch L. Three-dimensional models of the tRNA-like 3’ termini of some plant
viral RNAs. The EMBO Journal. 1983; 2(7):1079–1085. https://doi.org/10.1002/j.1460-2075.1983.
tb01549.x PMID: 6628363
jViz.RNA 4.0—Visualizing pseudoknots and RNA editing employing compressed tree graphs
PLOS ONE | https://doi.org/10.1371/journal.pone.0210281 May 6, 2019 23 / 25
4. Rao ALN, Dreher TW, Marsh LE, Hall TC. Telomeric function of the tRNA-like structure of brome
mosaic virus RNA. In: Proceedings of the National Academy of Science of the United States of America.
vol. 86; 1989. p. 5335–5339. https://doi.org/10.1073/pnas.86.14.5335
5. Matsuda D, Dreher TW. The tRNA-like structure of Turnip yellow mosaic virus RNA is a 3’-translational
enhancer. Virology. 2003; 321:36–46. https://doi.org/10.1016/j.virol.2003.10.023
6. Powers T, Noller HF. A functional pseudoknot in 16S ribosomal RNA. The EMBO Journal. 1991; 10
(8):2203–2214. https://doi.org/10.1002/j.1460-2075.1991.tb07756.x PMID: 1712293
7. Finken M, Kirschner P, Meier A, Wrede A, Bottger EC. Molecular basis of streptomycin resistance in
Mycobacterium tuberculosis: alterations of the ribosomal protein S12 gene and point mutations within a
functional 16S ribosomal RNA pseudoknot. Molecular Microbiology. 1993; 9(6):1239–1246. https://doi.
org/10.1111/j.1365-2958.1993.tb01253.x PMID: 7934937
8. Chaloin L, Lehmann MJ, Sczakiel G, Restle T. Endogenous expression of a high-affinity pseudoknot
RNA aptamer suppresses replication of HIV-1. Nucleic Acids Research. 2002; 30(18):4001–4008.
https://doi.org/10.1093/nar/gkf522 PMID: 12235384
9. Shabash B, Wiese KC. RNA Visualization: Relevance and the Current State-of-the-art Focusing on
Pseudoknots. IEEE/ACM Transactions on Computational Biology and Bioinformatics. 2017; 14(3):696–
712. https://doi.org/10.1109/TCBB.2016.2522421 PMID: 26915129
10. Ponty Y, Leclerc F. Drawing and Editing the Secondary Structure(s) of RNA. In: Picardi E, editor. RNA
Bioinformatics. vol. 1269. Springer New York; 2015. p. 63–100.
11. Seibel PN, Muller T, Dandekar T, Schultz J, Wolf M. 4SALE—A tool for synchronous RNA sequences
and secondary structure alignment and editing. BMC Bioinformatics. 2006; 7(498).
12. Seibel PN, Muller T, Dandekar T, Wolf M. Synchronous visual analysis and editing of RNA sequences
and secondary structure alignments using 4SALE. BMC Research Notes. 2008; 1(91). https://doi.org/
10.1186/1756-0500-1-91 PMID: 18854023
13. Jossinet F, Westhof E. Sequence to Structure (S2S): display, manipulate and interconnect RNA data
from sequence to structure. Bioinformatics. 2005; 21(15):3320–3321. https://doi.org/10.1093/
bioinformatics/bti504 PMID: 15905274
14. Jossinet F, Westhof E. In: S2S-Assemble2: a Semi-Automatic Bioinformatics Framework to Study and
Model RNA 3D Architectures. Wiley-Blackwell; 2014. p. 667–686.
15. Xu W, Wongsa A, ad Lei Shang JL, Cannone JJ, Gutell RR. RNA2DMap: A Visual Exploration Tool of
the Information in RNA’s Higher-Order Structure. In: Proceedings of the 2011 IEEE International Con-
ference on Bioinformatics and Biomedicine; 2011. p. 613–617.
16. Weinberg Z, Breaker RR. R2R—software to speed the depiction of aesthetic consensus RNA sec-
ondary structures. BMC Bioinformatics. 2011;. https://doi.org/10.1186/1471-2105-12-3 PMID:
21205310
17. Antczak M, Zok T, Popenda M, Lukasiak P, Adamiak RW, Blazewicz J, et al. RNApdbee—a webserver
to derive secondary structures from pdb files of knotted and unknotted RNAs. Nucleic Acids Research.
2014; 42(W1):W368–W372. https://doi.org/10.1093/nar/gku330 PMID: 24771339
18. Zok T, Antczak M, Zurkowski M, Popenda M, Blazewicz J, Adamiak RW, et al. RNApdbee 2.0: multi-
functional tool for RNA structure annotation. Nucleic Acids Research. 2018; 46(W1):W30–W35. https://
doi.org/10.1093/nar/gky314 PMID: 29718468
19. Elias R, Hoksza D. TRAVeLer: a tool for template-based RNA secondary structure visualization. BMC
Bioinformatics. 2017; 18(1):487. https://doi.org/10.1186/s12859-017-1885-4 PMID: 29141608
20. Lai D, Proctor JR, Zhu JYA, Meyer IM. R-chie: a web server and R package for visualizing RNA second-
ary structures. Nucleic Acids Research. 2012; 40(12):e95. https://doi.org/10.1093/nar/gks241 PMID:
22434875
21. Kim W, Lee Y, Han K. Visualization of RNA Pseudoknot Structure. In: Palma JLM, Sousa AA, Dongarra
J, Hernandez V, editors. High Performance Computing for Computational Science—VECPAR 2002.
vol. 2565 of Lecture Notes in Computer Science. Springer Berlin Heidelberg; 2003. p. 181–194.
22. Han K, Byun Y. PseudoViewer2: visualization of RNA pseudoknots of any type. Nucleic Acids
Research. 2003; 31(13):3432–3440. https://doi.org/10.1093/nar/gkg539 PMID: 12824341
23. Byun Y, Han K. PseudoViewer3: generating planar drawings of large scale RNA structures with pseudo-
knots. Bioinformatics. 2009; 25(11):1435–1437. https://doi.org/10.1093/bioinformatics/btp252 PMID:
19369500
24. Byun YA, Han KS. Visualization method of RNA Pseudoknot structures; 2004. Available from: http://
www.google.com/patents/EP1482439A2?cl=en.
25. Byun Y, Han K. PseudoViewer: web application and web service for visualizing RNA pseudoknots and
secondary structure. Nucleic Acids Research. 2006; 34:416–422. https://doi.org/10.1093/nar/gkl210
jViz.RNA 4.0—Visualizing pseudoknots and RNA editing employing compressed tree graphs
PLOS ONE | https://doi.org/10.1371/journal.pone.0210281 May 6, 2019 24 / 25

26. Wiese KC, Glen E, Vasudevan A. jViz.RNA—A Java Tool for RNA Secondary Structure Visualization.
IEEE Transactions on Nanobioscience. 2005; 4(3):212–218. https://doi.org/10.1109/TNB.2005.853646
PMID: 16220684
27. Wiese KC, Glen E. jViz.RNA—An Interactive Graphical Tool for Visualizing RNA Secondary Structures
Including Pseudoknots. In: The 19th Symposium on Computer-Based Medical Systems; 2006.
28. Shabash B, Wiese KC, Glen E. Improving the Portability and Performance of jViz.RNA—A Dynamic
RNA Visualization Software. In: Shibuya T, Kashima H, Sese J, Ahmad S, editors. Pattern Recognition
in Bioinformatics. vol. 7632 of Lecture Notes in Computer Science. Springer Berlin Heidelberg; 2012.
p. 82–93.
29. Darty K, Denise A, Ponty Y. VARNA: Interactive drawing and editing of the RNA secondary structure.
Bioinformatics. 2009; 25(15):1974–1975. https://doi.org/10.1093/bioinformatics/btp250 PMID:
19398448
30. Lu J, Bindewald E. RiboSketch; 2017. https://binkley2.ncifcrf.gov/users/bindewae/ribosketch_web/
index.html.
31. Kerpedjiev P, Hammer S, Hofacker IL. Forna (force-directed RNA): Simple and effective online RNA
secondary structure diagrams. Bioinformatics. 2015; 31(20):3377. https://doi.org/10.1093/
bioinformatics/btv372 PMID: 26099263
32. Shabash B, Wiese KC. Numerical integration methods and layout improvements in the context of
dynamic RNA visualization. BMC Bioinformatics. 2017; 18(1):282. https://doi.org/10.1186/s12859-017-
1682-0 PMID: 28558664
33. Garcia A, van Duin J, Pleij CW. Differential response to frameshift signals in eukaryotic and prokaryotic
translational systems. Nucleic Acids Research. 1993; 21(3):401–406. https://doi.org/10.1093/nar/21.3.
401 PMID: 7680118
34. Veidt I, Lot H, Leiser M, D S, Guilley H, Richards K, et al. Nucleotide sequence of beet western yellows
virus RNA. Nucleic Acids Research. 1998; 16(21):9917–9932. https://doi.org/10.1093/nar/16.21.9917
35. Su L, Chen L, Egli M, Berger JM, Rich A. Minor groove RNA triplex in the crystal structure of a ribosomal
frameshifting viral pseudoknot. Nature Structural Biology. 1999; 6:285–292. https://doi.org/10.1038/
6722 PMID: 10074948
36. Golden BL, Gooding AR, Podell ER, Cech TR. A Preorganized Active Site in the Crystal Structure of the
Tetrahymena Ribozyme. Science. 1998; 282(5387):259–264. https://doi.org/10.1126/science.282.
5387.259 PMID: 9841391
37. Michel F, Westhof E. Modelling of the three-dimensional architecture of group I catalytic introns based
on comparative sequence analysis. Journal of Molecular Biology. 1990; 216(3):585–610. https://doi.
org/10.1016/0022-2836(90)90386-Z. PMID: 2258934
38. Cech TR. Self-splicing of Group I Introns. Annual Review of Biochemistry. 1990; 59:543–568. https://
doi.org/10.1146/annurev.bi.59.070190.002551 PMID: 2197983
39. Bedwell D, Davis G, Gosink M, Post L, Nomura M, Kestler H, et al. Nucleotide sequence of the alpha
ribosomal protein operon of Escherichia coli. Nucleic Acids Research. 1985; 13(11):3891–3902. https://
doi.org/10.1093/nar/13.11.3891 PMID: 2989779
40. Antczak M, Popenda M, Zok T, Zurkowski M, Adamiak RW, Szachniuk M. New algorithms to represent
complex pseudoknotted RNA structures in dot-bracket notation. Bioinformatics. 2018; 34(8):1304–
1312. https://doi.org/10.1093/bioinformatics/btx783 PMID: 29236971
41. Bon M, Vernizzi G, Orland H, Zee A. Topological Classification of RNA Structures. Journal of Molecular
Biology. 2008; 379(4):900–911. https://doi.org/10.1016/j.jmb.2008.04.033. PMID: 18485361
42. Huang FWD, Nebel ME, Reidys CM. Generation of RNA pseudoknot structures with topological genus
filtration. Mathematical biosciences. 2013; 245(2):216–225. https://doi.org/10.1016/j.mbs.2013.07.014
PMID: 23900061
jViz.RNA 4.0—Visualizing pseudoknots and RNA editing employing compressed tree graphs
PLOS ONE | https://doi.org/10.1371/journal.pone.0210281 May 6, 2019 25 / 25