Embed Size (px)
Citation preview

Juvenile Justice Encounters in an ASD Population
By
Paul Turcotte
June 2014

ACKNOWLEDGMENTS
I would first like to thank my advisor, Craig Newschaffer for the time in effort in guiding me
throughout this project in all aspects. I would also like to thank my preceptor, Lindsay Shea, for her guidance, data acquisition, and policy advice. I would also like to thank Seth Welles and the
department of Epidemiology, as well as the Drexel School of Public Health for their support throughout my project. Thanks also to the faculty and staff of the A.J. Drexel Autism Institute
for the amount of time and effort they put forward to give me a great CBMP experience. I would like to thank the Bureau of Autism Services and the Autism Services, Education,
Resources, and Training (ASERT) Collaborative for their support as well. Lastly but certainly not least, I would like to thank my family for their support throughout my entire life, and my friends
for their advice and encouragement throughout my collegiate career.

Abstract
Juvenile Justice Encounters in an ASD Population
Paul Turcotte MPH1, Craig Newschaffer PhD1,2, Lindsay Shea MS, DrPH2
1Drexel University School of Public Health, 2A.J. Drexel Autism Institute
Background: Past research has shown that individuals in the juvenile justice system have high rates of behavioral and mental diagnoses. However, there are few papers that examined rates of autism spectrum disorder (ASD) contact with the juvenile justice system.
Aims: The purpose of this study is to investigate rates of juvenile justice system contact in a population-based sample of youth with ASD, compare these rates to general population rate, examine these trends over time and describe the distribution of crimes committed by young offenders with ASD compared to the like-aged general population.
Methods: Data used to identify the population with ASD were collected through enrollment in Medical Assistance and other Public Welfare programs. Youth with an ASD diagnosis between the ages of 10 and 21 in calendar years 2005 and 2011 were identified using at least one Medicaid claim for ASD in those years, and linked by a state juvenile justice office.
Results: Negative binomial regression was used adjust rates for basic demographic characteristics and to contrast adjusted rates in the populations. Regression analysis showed that individuals in the ASD group were 6.13 times as likely to come into contact with the justice system and the risk of offending from 2005-2011 increased significantly. Should these patterns persist, the implication is that individuals with ASD in our sample are at a higher risk for juvenile justice system contact than the general population. More research is needed to identify the reasons behind these patterns as to appropriately inform potential policy and program recommendations.

Introduction
Autism Spectrum Disorders
Autism Spectrum Disorders (ASD) are an increasingly more common lifelong developmental
disability, with 1 in 68 children now being identified with an ASD diagnosis, according to the latest
estimates form the CDC’s Autism and Developmental Disabilities Monitoring Network (ADDM) (CDC,
2014). ASD are a class of disorders that include Autistic Disorder, Asperger Syndrome, Rhett Syndrome
and Pervasive Developmental Disorder-Not Otherwise Specified (PDD-NOS) (CDC, 2012). ASDs include a
broad spectrum of the disorders, but typically manifest as impairments in 3 separate developmental
areas of a child; the social, language (communication), and behavioral areas (Abrahams and Geschwind,
2008). Symptoms can include: Inattention to other people, avoiding eye contact, trouble
communicating emotion, aversion to touching, echolalia, repetition of behaviors, and unusual reactions
to stimuli (CDC, 2014). While these are some hallmark symptoms, impairments can present differently in
each separate case. ASDs also appear to affect all races, ethnicities, and socioeconomic statuses equally,
however males are almost five times as likely to develop an ASD (CDC, 2014). Currently, there is no cure
for Autism, however early intervention and treatment has been shown to reduce symptoms, and
improve quality of life (Eapen et al., 2013).
Juvenile Justice Involvement in ASD Population
Previous studies have shown that rates of mental and behavioral health issues are prevalent
among those in the juvenile justice system (Garland et al., 2001) (Bullis and Yovanoff, 2005). The
prevalence can exceed 50%, and may be an underestimation (Garland et al., 2001). This high proportion
of individuals with disabilities implies that a large number of those individuals may be on the autism
spectrum. This is further evidenced by research showing that individuals with an ID/ASD comprise 12%

of individuals in a sample of 5 service systems (mental health, serious emotional disturbance, child
welfare, juvenile justice, and alcohol/drug services) (Brookman-Frazee et al., 2009). However, most
research has been limited to hospital settings and is not a reliable estimate of general prison contact
(Cashin and Newman 2009). While there is available research examining the interplay of psychiatric
disorders and behavioral disorders, (e.g. Attention Deficit and Hyperactivity Disorder [ADHD] and
Asperger Syndrome) with the justice system, there is minimal literature investigating the prevalence of
individuals with Autism Spectrum Disorders (ASD) in the justice system (Browning & Caulfield, 2011)
(Soltis, et al., 2013). With the rate of ASD having a bias towards males, gender differences are of a
particular interest in this study because being male is also a risk factor for juvenile justice encounter
(Shader, 2001). While overall there has been a decrease in juvenile justice rates since the mid 1990’s, a
significant proportion of those in the juvenile justice population have a psychiatric, behavioral, and/or
developmental disorder (Garland, et al., 2001). A recent study has shown that people in the juvenile
justice system exhibit higher levels of symptoms/behaviors consistent with ASD as compared to the
general population (Geluk, et al., 2012). ASDs have also recently been linked to serial killers and mass
murderers in an exploratory study examining case histories of past offenders (Allely et al., 2014). While
this study found a significant proportion of the individuals studies with a probable autism diagnosis
(28%) no clinical assessment was completed, and most sources used were not peer reviewed. In
contrast to the previous studies’ implications, a Danish case control study found that people with autism
were less likely to exhibit criminal behavior, and be convicted of a crime (Mouridsen et al., 2008).
Asperger syndrome has occasionally been exclusively studied separately from autism spectrum
disorders. A study performed in Sweden examined risk factors for violence among individuals with an
ASD, and found that individuals who are male as well as those diagnosed with Asperger syndrome are
more likely to be violent offenders (Langstrom et al., 2009). Qualitative case studies and literature
reviews have hypothesized that while the rate of criminal activity may not be different in those with
Asperger syndrome, the manifestations of their symptoms were almost always involved in their justice
system contact (Browning and Caulfield, 2011)(Schwartz-Watts, 2005).
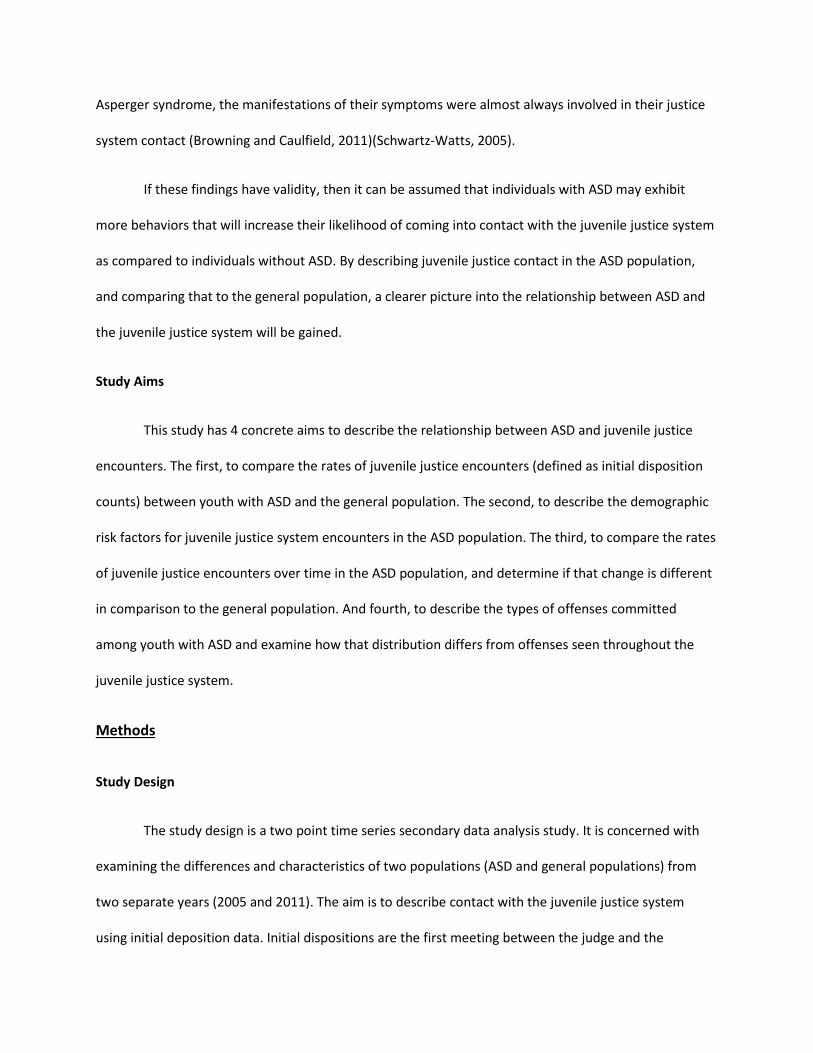
If these findings have validity, then it can be assumed that individuals with ASD may exhibit
more behaviors that will increase their likelihood of coming into contact with the juvenile justice system
as compared to individuals without ASD. By describing juvenile justice contact in the ASD population,
and comparing that to the general population, a clearer picture into the relationship between ASD and
the juvenile justice system will be gained.
Study Aims
This study has 4 concrete aims to describe the relationship between ASD and juvenile justice
encounters. The first, to compare the rates of juvenile justice encounters (defined as initial disposition
counts) between youth with ASD and the general population. The second, to describe the demographic
risk factors for juvenile justice system encounters in the ASD population. The third, to compare the rates
of juvenile justice encounters over time in the ASD population, and determine if that change is different
in comparison to the general population. And fourth, to describe the types of offenses committed
among youth with ASD and examine how that distribution differs from offenses seen throughout the
juvenile justice system.
Methods
Study Design
The study design is a two point time series secondary data analysis study. It is concerned with
examining the differences and characteristics of two populations (ASD and general populations) from
two separate years (2005 and 2011). The aim is to describe contact with the juvenile justice system
using initial deposition data. Initial dispositions are the first meeting between the judge and the
defendant, where it is decided if the assessed charges will be acted upon. “A disposition is defined as an
outcome of a written allegation received by the juvenile probation department” (JCJC, 2013). It is an
appropriate assessment of contact with the justice system, as there was some previous event with law
enforcement to cause the progression to a disposition hearing. There is a caveat to disposition counts.
The Juvenile Delinquency Data Analysis Tool specifies that a disposition may contain one or more
offenses, and that it is arbitrarily assigned the day of the hearing. However, all initial dispositions are
assumed to be treated this way, and therefore there is little reason to suspect that the ASD disposition
data are fundamentally different from the state general population records.
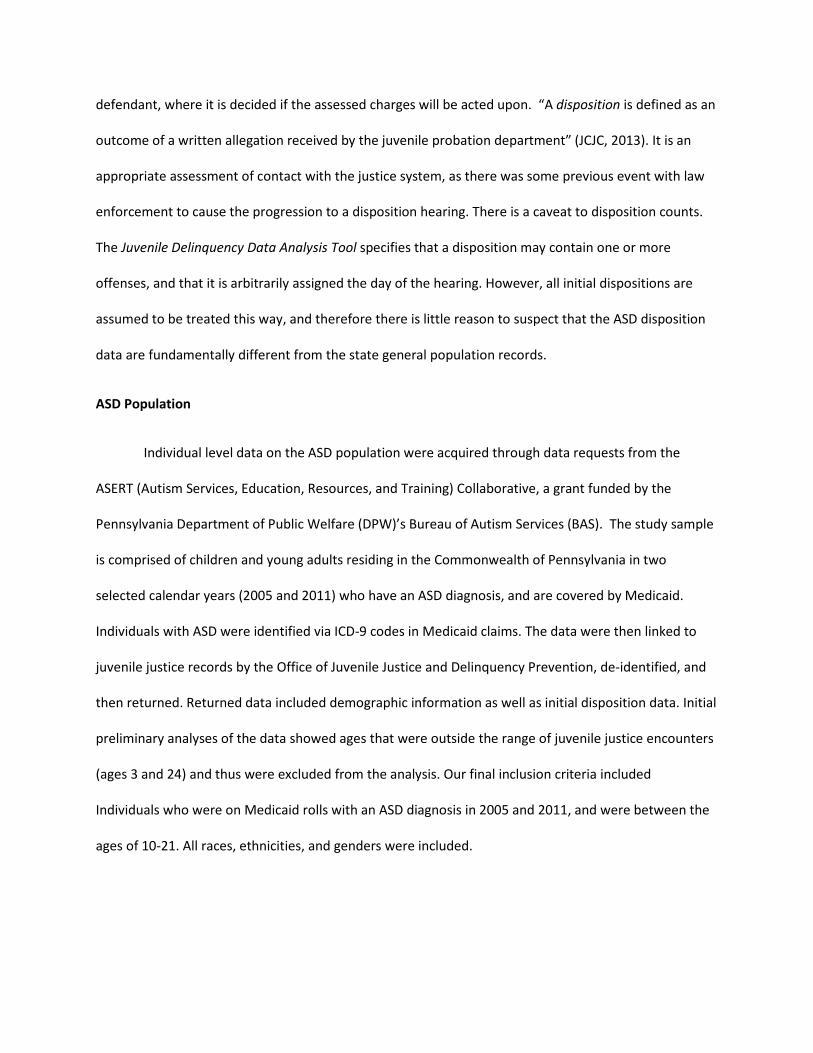
ASD Population
Individual level data on the ASD population were acquired through data requests from the
ASERT (Autism Services, Education, Resources, and Training) Collaborative, a grant funded by the
Pennsylvania Department of Public Welfare (DPW)’s Bureau of Autism Services (BAS). The study sample
is comprised of children and young adults residing in the Commonwealth of Pennsylvania in two
selected calendar years (2005 and 2011) who have an ASD diagnosis, and are covered by Medicaid.
Individuals with ASD were identified via ICD-9 codes in Medicaid claims. The data were then linked to
juvenile justice records by the Office of Juvenile Justice and Delinquency Prevention, de-identified, and
then returned. Returned data included demographic information as well as initial disposition data. Initial
preliminary analyses of the data showed ages that were outside the range of juvenile justice encounters
(ages 3 and 24) and thus were excluded from the analysis. Our final inclusion criteria included
Individuals who were on Medicaid rolls with an ASD diagnosis in 2005 and 2011, and were between the
ages of 10-21. All races, ethnicities, and genders were included.

General Population
General population data were gathered using two separate publicly available resources. For the
initial disposition data, the amount of initial dispositions was acquired using The Pennsylvania Juvenile
Delinquency Data Analysis Tool, sponsored by the Juvenile Court Judges’ Commission (JCJC), funded by
the Office of Juvenile Justice and Delinquency Prevention. This tool allows specific characteristics to be
selected, and will then supply group level disposition data on the individuals.
General population denominator data were acquired using Public Use Microdata Samples
(PUMS), a subset of the American Community Survey (ACS) samples. This information is provided in
individual level and household level form yearly and is sponsored by the Census Bureau. These data are
representative of 1% of the American population, and is estimated using a weighted formula. PUMS are
formed using geographic areas containing least 100,000 people, and span across the US and Puerto Rico.
Data sets were collected for years 2005 and 2011, and were categorized into the specified analysis
variables.
Data Analysis
Data were collapsed into 5 categories for analysis; Gender, county, age, race, and ethnicity.
While gender needed no special classification, county was categorized into three separate designations,
urban, suburban, and rural. A slight problem concerning the county designation arose when comparing
the PUMS and ASD county data. ASD county information was classified based off of a county designation
of urban, rural, or suburban, and were classified as such. As mentioned previously, PUMS data contains
geographic areas that inhabit at least 100,000 people. There was some overlap from suburban to rural
county boundaries, but they were minimal and not taken into account in this analysis. Age was
categorized into 4 separate age ranges, 10-12, 13-15, 16-17, 18+, and based off of the distribution of
offenders. Race was collapsed into three categories, White, Black, and Other, as there were low counts

of races besides White and Black. Gender and ethnicity (Hispanic, non-Hispanic) were unchanged. In the
PUMS data, those of Black race and Hispanic ethnicity, were not represented by weights. With that
population contributing minimal magnitude to the total numbers, they were excluded from the analysis.
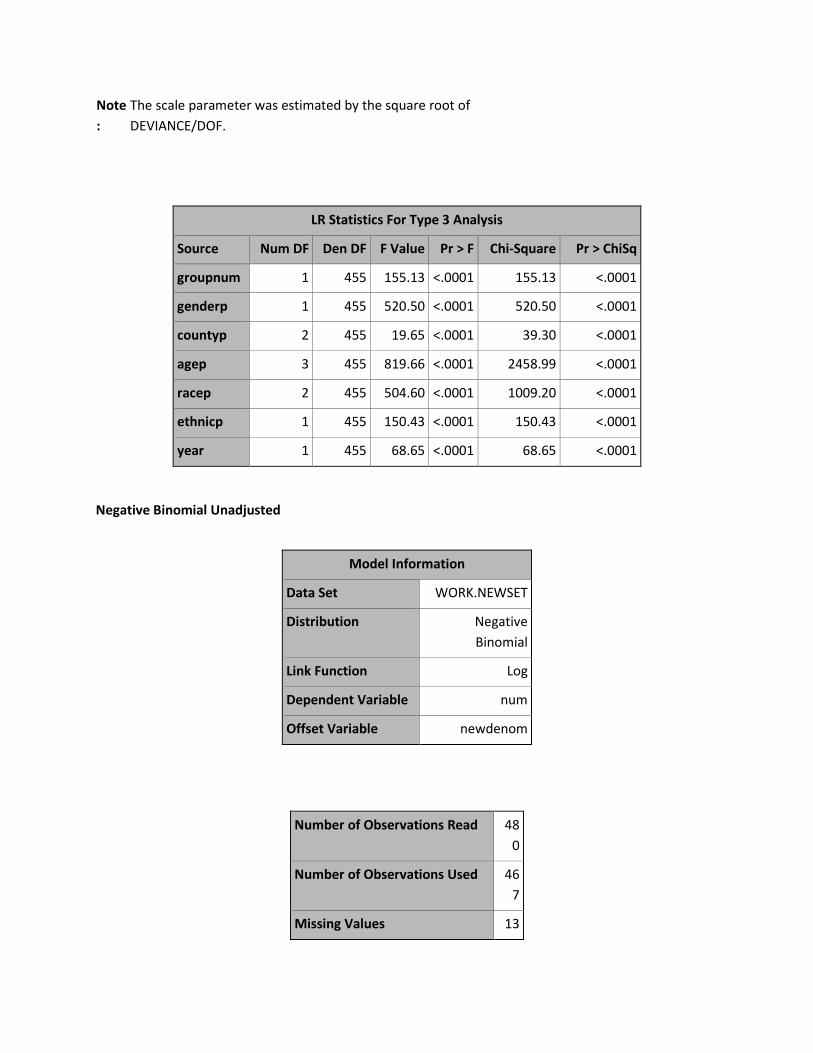
Statistical analyses included determining unadjusted and adjusted rate estimation and group-
level poisson rate regression. After the initial crude rates were attained, poisson regressions were used
to create adjusted rates. Poisson regressions were also performed to determine if there are
demographic risk factors for the ASD population, and these risk factors were compared to the general
population. However, due to overdispersion in the model, new models were creating using the negative
binomial approach. This decreased the dispersion and provided a better fit to the models, and thus was
used for all subsequent analyses. To determine power and detectable rate ratios, an Arcsign formula
was used outlined in Statistical Methods in Cancer Research to ascertain the minimum detectable Rate
Ratio that is statistically significant, contrasting the 2011 ASD vs general population (Breslow & Day,
1987). This sample has 80% power to detect a Rate Ratio of 1.22. Using the same standards, the sample
had 80% power to detect a Rate Ratio of 1.17 when contrasting the ASD 2005 Population and the ASD
2011 Population. All data management and statistical analyses was completed using Microsoft Office
Excel® and SAS® software, Version 9.2 of the SAS System for Windows (Copyright, SAS Institute Inc. SAS
and all other SAS Institute Inc. product or service names are registered trademarks or trademarks of SAS
Institute Inc., Cary, NC, USA.).
To determine the distribution difference of charges between the ASD and general populations, charges
were classified into three distinct categories. The first is “Offense against Person” entails any offenses
that involved causing harm or harassment to other individuals, ranging from assault charges to stalking
and harassment. The second “Property” consists of any charges that resulted in damage against
property including arson, trespassing, and vandalism. The third, “Other” consists of all other charges

grouped together, such as driving offenses, and non-payment of fines. Categorization was performed on
an individual level basis for the ASD group, and on a group level basis for the general population. Once
the three category counts were created, they were stratified by the demographic variables, proportions
of total charges in each variable were created, and the distribution was compared.
Results
Table 1 shows the distribution of the ASD and general population group demographic
Table 1. Demographic Characteristics of ASD and General Populations Stratified by Group and Year Populations in the Years 2005 and 2011
2005 ASD 2005 GP 2011 ASD 2011 GP N % N % N % N % Population 6,616 1,908,039 16,974 2,070,077 Gender
Male 5,330 80.6% 972,999 51.0% 13,619 80.2% 1,069,342 51.7% Female 1,286 19.4% 935,040 49.0% 3355 19.8% 1,000,735 48.3%
County
Urban 1369 20.7% 414,379 21.7% 3407 20.1% 431,111 20.8% Suburban 3118 47.1% 897,756 47.1% 8360 49.3% 997,978 48.2%
Rural 2129 32.2% 595,904 31.2% 5207 30.7% 640,988 31.0%
Age Range
10-12 2726 41.2% 479,530 25.1% 6624 39.0% 463,327 22.4% 13-15 2081 31.5% 513,277 26.9% 5103 30.1% 486,617 23.5% 16-17 936 14.1% 346,979 18.2% 2344 13.8% 340,108 16.4% >17 873 13.2% 568,253 29.8% 2903 17.1% 780,025 37.7%
Race
Black 773 11.7% 239,605 12.6% 1812 10.7% 273,800 13.2% White 5437 82.2% 1539257 80.7% 13,509 79.6% 1590212 76.8% Other 406 6.1% 129,177 6.8% 1653 9.7% 206,065 10.0%
Ethnicity
Non-Hispanic 6368 96.3% 1,807,090 94.7% 16047 94.5% 1899404 91.8% Hispanic 248 3.7% 100,949 5.3% 927 5.5% 170673 8.2%
Note: ASD-Autism Spectrum Disorder, GP- General Population

characteristics. In terms of gender, the distributions match what we would expect to see in these
populations. The ASD population has approxiamtely an 80% male composition, which matches current
findings from the ADDM (CDC, 2014). County distribution is uniform across all groups, with the majority
of individuals located in suburban counties. Another diffence was located in the age group distributions,
as the ASD groups tended to have a higher proportion of individuals in the 10-12 age range. In both the
ASD and the general population groups, an increase over time in the >17 age group was also observed,
but moreso in the general population, a 7.9% increase compared to a 3.9% in the ASD group. Race was
uniform in the populations, with the majority identifying as White or Black. Ethincity also varied little
between the groups, with most individuals identifiying as non-Hispanic, athough there was an increase
over time in both populations in the proportion identifying as Hispanic.
Calculating the crude rate of contact, the ASD group saw an increased in risk when compared to
the general population, an RR of 6.37
(95% CI 6.25-6.50), calculated using a
ratio of incidence densities formula
(Szklo and Nieto 2012). Figure 1 shows
the specific rates of observation years
2005 and 2011 for each group. Table 2
shows the unadjusted and adjusted
models predicting contact with the
juvenile justice system. In the unadjusted
negative binomial model, the ASD group are 4.86 times as likely to come into contact with the juvenile
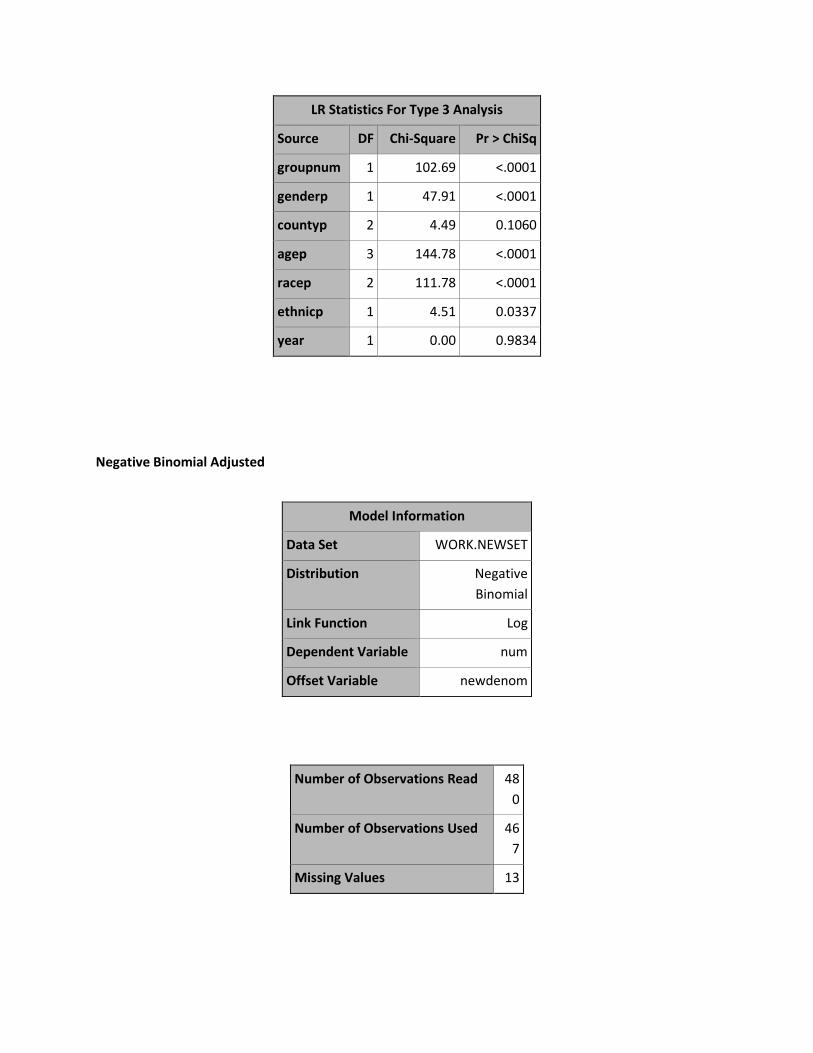
justice system when compared to the general population. After adjusting for other variables, the risk
increases to 6.13 times as likely. Using models which controlled for each predictor separately in
conjuction with group type, it was found that age had the biggest influence on increase in risk for
Figure 1. Crude rate of contact with the juvenile justice system over time comparing the ASD and general population groups. ASD saw an increase in contact while the general population saw a decrease. Note: ASD= Autism Spectrum Disorder Group, GP= General Population Group.
659.0
1423.4
233.8 155.0 0
200400600800
1000120014001600
2005 2011
Rate
per
10,
000
Indi
vidu
als
per Y
ear
Rate Of Juvenile Justice Encounters Per 10,000 Individuals per Year
ASDGP

offending. In the adjusted model, age had increased risk as individuals age when comparing older age
groups to ages 10-12. The highest risk was found in age group 16-17 with a RR of 9.92. Females were
found to have substantially lower risk to offend when compared to males, a highly protective RR of 0.37.
It was also found that those in suburban counties were found to be at higher risk of offending than
those in urban and rural environments.
Examining race, people idenfitiying as Black were 2.29 times as likely to come into contact with
the justice system, and people of
Other minority groups were
found to be at less of a risk when
compared to Whites. Being of
Hispanic ethnicity was associated
with a 47% increase in risk of
contact. In this model there
seemed to be no difference in
contact risk when comparing
2005 and 2011 overall.
Table 3 shows results of
models analyzing change in risk
for the ASD group between 2005
and 2011. In the unadjusted
model, RR values increased from
1.58 (95% CI .97-2.59) to 10.75
(95% CI 6.87-16.84) from 2005 to
Table 2. Contact Rates with the Juvenile Justice System: ASD and General Populations
Unadjusted Model Adjusted Model
RR (95%CI) p-value RR (95%CI)
p-value
Group General Population 1.00 - 1.00 -
ASD 4.86 (3.47-6.79) <.0001 6.13 (4.46-8.42) <.0001
Gender Male - - 1.00 -
Female - - 0.37 (0.29-0.49) <.0001
County Urban - - 1.00 -
Suburban - - 1.41 (1.02-1.94) 0.0335 Rural - - 1.19 (0.86-1.65) 0.2821
Age Range 10-12 - - 1.00 -
13-15 - - 7.59 (5.29-10.88) <.0001 16-17 - - 9.92 (6.94-13.71) <.0001 >17 - - 1.95 (1.26-3.02) 0.0028
Race White - - 1.00 -
Black - - 2.29 (1.51-3.46) <.0001 Other - - 0.33 (0.23-0.47) <.0001
Ethnicity Non-Hispanic - - 1.00 -
Hispanic - - 1.47 (1.03-2.10) 0.0320
Year 2005 - - 1.00 -
2011 - - 1.00 (0.76-1.32) 0.9835 Note: ASD-Autism Spectrum Disorder, GP- General Population, RR- Rate Ratio, ref-reference group. All adjusted model RR's adjusted for group type, gender, county, age range, race, ethnicity, and year

2011. After adjusting for other demographic variables, the risk increased from 2.30 (95% CI 1.50-3.53) to
13.37 (95% CI 9.05-19.75) becoming statisically significant in 2005.
Table 4 shows the distribution
of charge types by
demographic variables. When
examining county type and
charges, the general population
had relatively similar distributions between the 3 charge categories in both observation years. The ASD
groups showed little difference in urban counties between the two years, but both suburban and rural
counties saw a shift to larger proportions of crimes in the Other and Property charge categories. Gender
comparisons showed a possible imprecise shift in the ASD female proportions, due to low
representation in the population. Male ASD charges saw a shift toward larger Other and Property
charges from 2005 to 2011, similar to what was seen in the County distribution. The general population
saw no change in proportions between the two observation years in regards to Gender. Charges
regarding age groups in the general population saw similar distributions throughout both years with a
trend showing with an increase an age, an increase in proportion of Other charges, and a decrease in
Offense against Person charges. Race shows a nearly identical distribution in both observation years in
the general population. The ASD population show an increase in Other and Property charges between
2005 and 2011 in all race groups. Black race has a slightly higher proportion of Other charges compared
to White, where White maintains a higher proportion of Property charges. Those of non-Hispanic
ethnicity in the ASD population had a larger proportion of Other and Property charges over time, where
those of Hispanic ethnicity had a similar distribution in both years. In all demographic areas, the ASD
population always maintained a higher level of Offense against Person charges, but gernally saw a
Table 3. Risk of Offending Over Time in the ASD Population
Unadjusted Model Adjusted Model
RR (95%CI) p-value RR (95%CI) p-value
ASD 2005* 1.58 (0.97-2.59) 0.0661 2.30 (1.50-3.53) 0.0001
2011** 10.75 (6.87-16.84) <0.0001 13.37 (9.05-19.75) <0.0001 Note: ASD-Autism Spectrum Disorder, GP- General Population, RR- Rate Ratio, ref-reference group. Predictors: *Group Type, Year, Interaction Group and Year, **Group Type, Year, Interaction Group and Year, Gender, County, Age Range, Race, Ethnicity
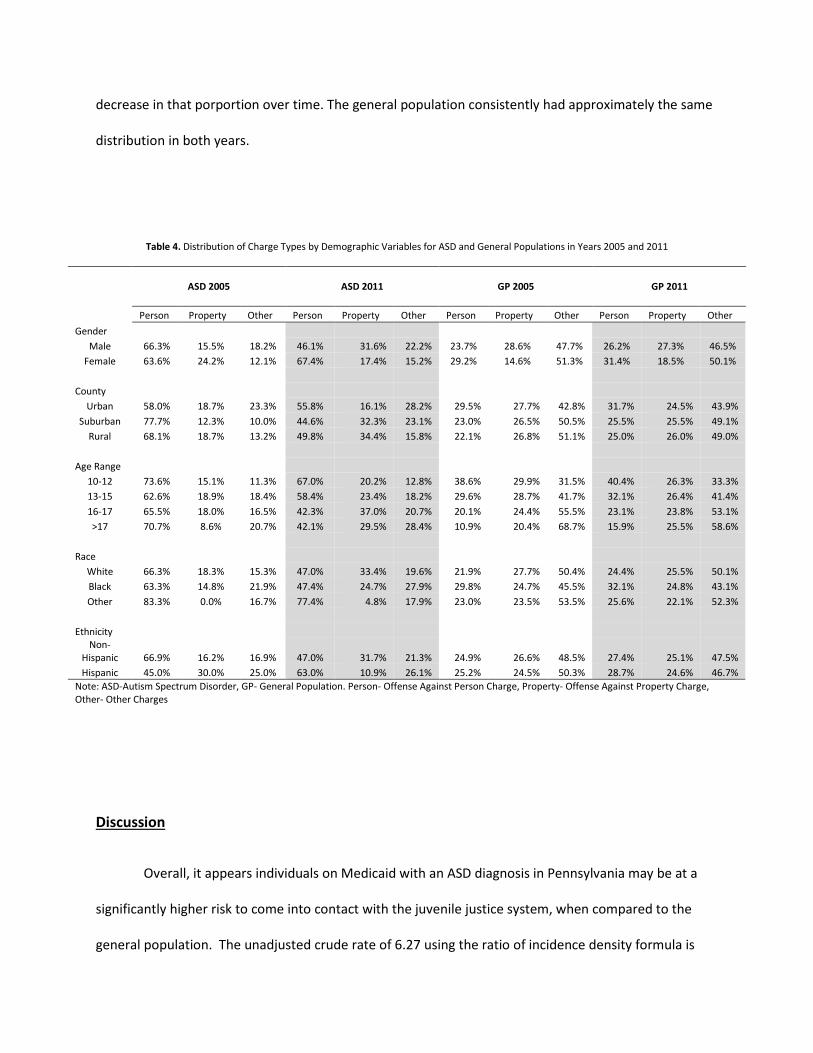
decrease in that porportion over time. The general population consistently had approximately the same
distribution in both years.
Discussion
Overall, it appears individuals on Medicaid with an ASD diagnosis in Pennsylvania may be at a
significantly higher risk to come into contact with the juvenile justice system, when compared to the
general population. The unadjusted crude rate of 6.27 using the ratio of incidence density formula is
Table 4. Distribution of Charge Types by Demographic Variables for ASD and General Populations in Years 2005 and 2011
ASD 2005 ASD 2011 GP 2005 GP 2011
Person Property Other Person Property Other Person Property Other Person Property Other
Gender Male 66.3% 15.5% 18.2% 46.1% 31.6% 22.2% 23.7% 28.6% 47.7% 26.2% 27.3% 46.5%
Female 63.6% 24.2% 12.1% 67.4% 17.4% 15.2% 29.2% 14.6% 51.3% 31.4% 18.5% 50.1%
County Urban 58.0% 18.7% 23.3% 55.8% 16.1% 28.2% 29.5% 27.7% 42.8% 31.7% 24.5% 43.9%
Suburban 77.7% 12.3% 10.0% 44.6% 32.3% 23.1% 23.0% 26.5% 50.5% 25.5% 25.5% 49.1% Rural 68.1% 18.7% 13.2% 49.8% 34.4% 15.8% 22.1% 26.8% 51.1% 25.0% 26.0% 49.0%
Age Range 10-12 73.6% 15.1% 11.3% 67.0% 20.2% 12.8% 38.6% 29.9% 31.5% 40.4% 26.3% 33.3%
13-15 62.6% 18.9% 18.4% 58.4% 23.4% 18.2% 29.6% 28.7% 41.7% 32.1% 26.4% 41.4% 16-17 65.5% 18.0% 16.5% 42.3% 37.0% 20.7% 20.1% 24.4% 55.5% 23.1% 23.8% 53.1% >17 70.7% 8.6% 20.7% 42.1% 29.5% 28.4% 10.9% 20.4% 68.7% 15.9% 25.5% 58.6%
Race White 66.3% 18.3% 15.3% 47.0% 33.4% 19.6% 21.9% 27.7% 50.4% 24.4% 25.5% 50.1%
Black 63.3% 14.8% 21.9% 47.4% 24.7% 27.9% 29.8% 24.7% 45.5% 32.1% 24.8% 43.1% Other 83.3% 0.0% 16.7% 77.4% 4.8% 17.9% 23.0% 23.5% 53.5% 25.6% 22.1% 52.3%
Ethnicity Non-
Hispanic 66.9% 16.2% 16.9% 47.0% 31.7% 21.3% 24.9% 26.6% 48.5% 27.4% 25.1% 47.5% Hispanic 45.0% 30.0% 25.0% 63.0% 10.9% 26.1% 25.2% 24.5% 50.3% 28.7% 24.6% 46.7%
Note: ASD-Autism Spectrum Disorder, GP- General Population. Person- Offense Against Person Charge, Property- Offense Against Property Charge, Other- Other Charges

highly suggestive of an increased risk. Examining the negative binomial model’s unadjusted crude rate of
4.86, a difference in risk of some magnitude is observed. Whether this is due to the assumptions of the
model, a log transformation of the denominator, or the exclusion of those of Black and Hispanic
race/ethincity, is under further analysis. Regardless, both rates show an elevated risk for the ASD
population. After adjusting for the other variables, the risk for contact increased to 6.13. By performing
further analyses, it was found that the main demographic characteristic responsible for this increase in
risk, was age. This evidence is supported in multiple ways. In the adjusted model, age constitutes the
highest RR’s by far in comparison to the other demographic variables, showing that individuals in the
age ranges of 13-15 and 16-17 had an elevated risk for contact. A second support comes from the
demographic distribution shown in Table 1. The ASD group shows a much higher proportion of
individuals in the age range of 10-12, when compared to the general population. After adjusting for age
in the models, the RR increases. This is most likely due to those in the 10-12 age range being at lower
risk, and the high proportion in the ASD group lowering the risk in the unadjusted model.
Another factor that may be increasing the risk post-adjustment is gender. Typically, males are at
a higher risk to offend and with the ASD population comprising 80% males, an increase in risk would be
assumed. During the adjustment procedures, a major increase in risk was not observed when gender
was controlled for. This suggests that gender may not have an effect on risk. An increase in risk over
time for the ASD population is supported by the findings between the unadjusted and adjusted models
found in Table 3. In the unadjusted model, the risk for year 2005 was 1.58, was not significant, with an
increase in risk to 10.75 in 2011, shifting to significance. This suggests and increase in risk, but is further
supported by the adjusted model. The risk for both years increased, and became significant. This change
from non-significance to significance supports an increase in risk in year 2011 from year 2005. Age is
also the most likely demographic variable most responsible for this shift in risk in these models.

The charge distribution between the populations is varied. Overall, the ASD population has a
higher proportion of Offense against Person crimes across the demographic variables. Throughout all
demographics, the general population had similar distributions of the charges in both years 2005 and
2011. As age was the most explanatory demographic variable in the regression models, a close
examination of the distribution of charges stratified by age group in the ASD population shows a
noteworthy trend. In year 2005, there was no discernible pattern as the ages increased from 10-17+.
However, in 2011, there was a trend that is mirrored in the general population. As time increases from
2005 to 2011, so do the proportion of Other and Property charges in comparison to Offense against
Person charges. Similarly, as the individuals increased in age, the proportion of Other and Property
charges increase in both the ASD and general populations. As the sample size of charges increased in
2011 for the ASD group, the pattern seemed to begin to match what we see in the general population.
The ASD population still maintains a higher proportion of Offense against Person charges, but still
exhibits a similar distribution to the general population. This could possibly be due to the opportunity to
commit offenses. Individuals with ASD may not have the oppurtunity to commit crimes of the Property
or Other offenses, due to the circumstances in which they live. Further analysis and data acquisiton is
necessary to address this issue.
In conclusion, age appears to be the biggest predictor regarding the likelihood of offending.
After age 13, risk for contact increases dramatically. Also, ASD population may be at a higher risk of
offending overall when compared to the general population. The risk for offending in the ASD
population has increased between 2005 and 2011, and the majority of those offenses are classified as
Offense against Person charges. The proportional distribution of charges in the ASD group may be
shifting toward what we see in the general population, though further analysis is needed to confirm this
association.

This study has several strengths. First, it is a novel look at a population level relationship
between ASD and juvenile justice system involvement. No previous study has performed an analysis
such as this, as they have been typically restricted to hospitalized or prison populations. This study also
collected valuable insight into what an individual with ASD might experience when coming into contact
with the juvenile justice system. This information can be used to inform policy programming and
possible intervention strategies. Two observation years also allowed an analysis of a limited temporal
relationship.
There were also some limitations to this study. First, errors in the PUMS denominator data
collection were not accounted for. There are error estimates associated with the weights, and these
error terms were not included in the confidence interval estimates for the risk ratios. Therefore, these
confidence intervals are most likely larger than they currently are. Also, comparing group level general
population data to this ASD specific data isn’t a direct comparison of two distinct groups, as the ASD
population account for some of the general population rates.
There also may be some selection bias when it comes to this sample population. The ASD group
was pulled from those who had a Medicaid claim with an ICD-9 ASD diagnosis. Some factors that
contribute to those individuals being on Medicaid (eg. poverty) may be contributing to an increase in
risk, and may not be representative of individuals with ASD in Pennsylvania. This situation is complicated
further due to the PH-95 “loophole” in Medical Assistance law, which allows individuals to qualify for
Medicaid based on disability status regardless of income. This may be adding more individuals with ASD
from affluent socio-economic status to this Medicaid population, possibly making them more like the
general population, and adding validity. However it is difficult to examine this relationship with the
information we have to determine the extent of this issue.

Future directions include interacting with stakeholders in the juvenile justice system to
determine areas where interventions or policy programming could be implemented. Also for further
analysis to determine the risk for the ASD population, comparison Medicaid groups need to be formed
in order to collect data on their interactions with the juvenile justice system. An MR/ID Medicaid group
as well as a random selection of non-disabled individuals will allow for a more complete and direct
comparison across groups, and will form a clearer picture of the ASD and justice interaction. Further
analysis of charges is also needed, to determine if the risk for having charges classified as Offense
against Person are more likely in the ASD population. Current analysis only allowed for an examination
of the proportions of the charges, and therefore was not controlled for demographic characteristics.

Works Cited Abrahams, B. S., & Geschwind, D. H. (2008). Advances in autism genetics: on the threshold of a new
neurobiology. Nat Rev Genet, 341-355.
Allely, C. S., Minnis, H., Thompson, L., Wilson, P., & Gillberg, C. (2014). Neurodevelopmental and psychosocial risk factors in serial killers and mass murderers. Aggression and Violent Behavior, 288-301.
Autism Society. (2013). Facts and Statistics. Retrieved April 14, 2013, from The Autism Society: www.autism-society.org
Autism Speaks. (2013). Facts about Autism. Retrieved April 14, 2013, from Autism Speaks: www.autismspeaks.org
Breslow, N., & Day, N. (1987). Statistical Methods in Cancer Research. Lyon: IARC .
Brookman-Frazee, L., Baker-Ericzén, M., Stahmer, A., Mandell, D., Haine, R. A., & Hough, R. L. (2009). Involvement of Youths with Autism Spectrum Disorders or Intellectual Disabilities in Multiple Public Service Systems. J Ment Health Res Intellect Disabil, 201-219.
Browning, A., & Caulfield, L. (2011). The prevalence and treatment of people with Asperger's Syndrome in the criminal justice system. Criminology and Criminal Justice, 165-182.
Bullis, M., & Yovanoff, P. (2005). More Alike than Different? Comparison of Formerly Incarcerated Youth with and Without Disabilities. Journal of Child and Family Studies, 127-139.
Cashin, A., & Newman, C. (2009). Autism in the criminal justice detention system: A review of the literature. Journal of Forensic Nursing, 70-75.
CDC. (2012, March 29). Autism Spectrum Disorders. Retrieved from Centers for Disease Control and Prevention: www.cdc.gov/ncbddd/autism/facts.html
Census, U. (2009). Current Population Survey. Washington DC: United States Census Bureau.
Cheely, C. A., Carpenter, L. A., Letourneau, E. J., Nicholas, J. S., Charles, J., & King, L. B. (2012). The Prevalence of Youth with Autism Spectrum Disorders in the Criminal Justice System. Journal of Autism Developmental Disorder, 1856-1862.
Eapen, V., Črnčec, R., & Walter, A. (2013). Clinical outcomes of an early intervention program for preschool children with Autism Spectrum Disorder in a community group setting. BMC Pediatrics, 13.
Garland, A., Hough, R., McCabe, K., Yeh, M., Wood, P., & Aarons, G. (2001). Prevalence of psychiatric disorders in youths across five sectors of care. Journal of the American Academy of Child and Adolescent Psychiatry, 409-418.

Geluk, C. A., Jansen, L. M., Vermeiren, R., Doreleijers, T. A., Domburgh, L. v., de Bildt, A., . . . Hartman, C. A. (2012). Autistic symptoms in childhood arrestees: longitudinal association with delinquent behavior. Journal of Child Psychology and Psychiatry, 160-167.
Griel III, L. C., & Loeb, S. (2008). Health issues faced by adolescents incarcerated in the juvenile justice system. Journal of Forensic Nursing, 162-179.
Hart-Kerkhoffs, L. A., Jansen, L. M., Doreleijers, T. A., Vermeiren, R., Minderaa, R. B., & Hartman, C. A. (2009). Autism Spectrum Disorder Symptoms in Juvenile Suspects of Sex Offenses. Journal of Clinical Psychiatry, 266-272.
Hoeve, M., McReynolds, L. S., & Wasserman, G. A. (2013). Service Referral for Juvenile Justice Youths: Associations with Psychiatric Disorder and Recidivism. Adm Policy Ment Health.
Johnson, J. E., Esposito-Smythers, C., Miranda Jr., R., Rizzo, C. J., Justus, A. N., & Clum, G. (2011). Gender, Social Support, and Depression in Criminal Justice Involved Adolescents. Int J Offender Ther Comp Criminol, 1096-1109.
Mouridsen, S. E., Rich, B., Isager, T., & Nedergaard, N. J. (2007). Pervasive Developmental Disorders and Criminal Behaviour: A Case Control Study. International Journal of Offender Therapy and Comparative Criminology, 196.
Schwartz-Watts, D. (2005). Asperger's Disorder and Murder. J Am Acad Psychiatry Law, 390-393.
Shader, M. (2001). Risk Factors for Delinquency: An Overview. Washington D.C.: U.S. Department of Justice.
Soltis, S., Probst, J., Xirasagar, S., Martin, A., & Smith, B. (2013). Diagnostic and Demographic Differences Between Incarcerated and Nonincarcerated Youth (Ages 6-15) With ADHD in South Carolina. Journal of Attention Disorders, 1-8.
Sullivan, P. M. (2009). Violence Exposure Among Children with Disabilities. Clin Child Fam Psychol Rev, 196-216.
Szklo, M., & Nieto, F. J. (2012). Epidemiology Beyond the Basics. Burlington: Jones & Bartlett Learning.
van der Put, C., Asscher, J., Stams, G., & Moonen, X. (2013). Differences between juvenile offenders with and without intellectual disabilities in the importance of static and dynamic risk factors for recidism. Journal of Intellectual Disability Research.
Zhang, D., Hsu, H.-Y., Barrett, D. E., & Ju, S. (2011). Adolescents With Disabilities in the Juvenile Justice System: Patterns of Recidivism. Council for Exceptional Children, 283-298.


Appendix I
Distribution of Charges
County: S=Suburban, U=Urban, R=Rural
ASD Group
General Population
0%
10%
20%
30%
40%
50%
60%
70%
80%
90%
100%
Other
Property
Person
S U R
2005 2011
S U R
0%
10%
20%
30%
40%
50%
60%
70%
80%
90%
100%
Other
Property
Person
S U R
2005 2011
S U R

Gender
ASD Population
General Population
0%
10%
20%
30%
40%
50%
60%
70%
80%
90%
100%
Other
Property
Person
Male
2005 2011
Female Male Female
0%
10%
20%
30%
40%
50%
60%
70%
80%
90%
100%
Other
Property
Person
2005 2011
Male Female Male Female

Age
ASD Population
General Population
0%
10%
20%
30%
40%
50%
60%
70%
80%
90%
100%
Other
Property
Person
2005 2011 10
-12
13-1
5
16-1
7
>17
10-1
2
13-1
5
16-1
7
>17
0%
10%
20%
30%
40%
50%
60%
70%
80%
90%
100%
Other
Property
Person
2005 2011
10-1
2
13-1
5
16-1
7
>17
10-1
2
13-1
5
16-1
7
>17

Race
ASD Population
General Population
0%
10%
20%
30%
40%
50%
60%
70%
80%
90%
100%
Other
Property
Person
W B O
2005 2011
W B O
0%
10%
20%
30%
40%
50%
60%
70%
80%
90%
100%
Other
Property
Person
W B O
2005 2011
W B O

Ethnicity
ASD Population
General Population
0%
10%
20%
30%
40%
50%
60%
70%
80%
90%
100%
Other
Property
Person
Hispanic
2005 2011
Non-Hispanic Hispanic Non-Hispanic
0%
10%
20%
30%
40%
50%
60%
70%
80%
90%
100%
Other
Property
Person
Hispanic
2005 2011
Non-Hispanic Hispanic Non-Hispanic

Appendix II
SAS Regression Output
Overdispersion in Poisson Model
Model Information
Data Set WORK.NEWSET
Distribution Poisson
Link Function Log
Dependent Variable num
Offset Variable newdenom
Number of Observations Read 480
Number of Observations Used 467
Missing Values 13
Class Level Information
Class Levels Values
groupnum 2 0 1
genderp 2 0 1
countyp 3 0 1 2
agep 4 0 1 2 3
racep 3 0 1 2
ethnicp 2 0 1
year 2 0 1

Criteria For Assessing Goodness Of Fit
Criterion DF Value Value/DF
Deviance 455
15084.9306
33.1537
Scaled Deviance 455
455.0000 1.0000
Pearson Chi-Square 455
29668.9666
65.2065
Scaled Pearson X2 455
894.8917 1.9668
Log Likelihood 13935.6926
Full Log Likelihood -8417.9291
AIC (smaller is better) 16859.8581
AICC (smaller is better) 16860.5454
BIC (smaller is better) 16909.6141
Algorithm converged.

Analysis Of Maximum Likelihood Parameter Estimates
Parameter DF Estimate Standard
Error
Wald 95% Confidence
Limits Wald Chi-
Square Pr > ChiSq
Intercept 1 -5.3819 0.0959 -5.5698
-5.1940
3151.88 <.0001
groupnum 0 1 1.7446 0.1106 1.5278 1.9614 248.70 <.0001
groupnum 1 0 0.0000 0.0000 0.0000 0.0000 . .
genderp 0 1 -1.0160 0.0478 -1.1096
-0.9224
452.32 <.0001
genderp 1 0 0.0000 0.0000 0.0000 0.0000 . .
countyp 0 1 0.2737 0.0640 0.1483 0.3991 18.31 <.0001
countyp 1 1 0.3290 0.0533 0.2245 0.4334 38.12 <.0001
countyp 2 0 0.0000 0.0000 0.0000 0.0000 . .
agep 0 1 -0.6981 0.1263 -0.9456
-0.4505
30.54 <.0001
agep 1 1 2.3501 0.0845 2.1845 2.5157 773.54 <.0001
agep 2 1 1.7691 0.0856 1.6014 1.9368 427.55 <.0001
agep 3 0 0.0000 0.0000 0.0000 0.0000 . .
racep 0 1 -0.7114 0.1084 -0.9238
-0.4991
43.11 <.0001
racep 1 1 1.5662 0.0493 1.4695 1.6629 1008.55 <.0001
racep 2 0 0.0000 0.0000 0.0000 0.0000 . .
ethnicp 0 1 1.0893 0.0799 0.9327 1.2458 185.92 <.0001
ethnicp 1 0 0.0000 0.0000 0.0000 0.0000 . .
year 0 1 -0.3429 0.0416 -0.4244
-0.2614
67.94 <.0001
year 1 0 0.0000 0.0000 0.0000 0.0000 . .
Scale 0 5.7579 0.0000 5.7579 5.7579
Note:
The scale parameter was estimated by the square root of DEVIANCE/DOF.
LR Statistics For Type 3 Analysis
Source Num DF Den DF F Value Pr > F Chi-Square Pr > ChiSq
groupnum 1 455 155.13 <.0001 155.13 <.0001
genderp 1 455 520.50 <.0001 520.50 <.0001
countyp 2 455 19.65 <.0001 39.30 <.0001
agep 3 455 819.66 <.0001 2458.99 <.0001
racep 2 455 504.60 <.0001 1009.20 <.0001
ethnicp 1 455 150.43 <.0001 150.43 <.0001
year 1 455 68.65 <.0001 68.65 <.0001
Negative Binomial Unadjusted
Model Information
Data Set WORK.NEWSET
Distribution Negative Binomial
Link Function Log
Dependent Variable num
Offset Variable newdenom
Number of Observations Read 480
Number of Observations Used 467
Missing Values 13

Class Level Information
Class Levels Values
groupnum 2 0 1
Criteria For Assessing Goodness Of Fit
Criterion DF Value Value/DF
Deviance 465
508.2190 1.0929
Scaled Deviance 465
508.2190 1.0929
Pearson Chi-Square 465
837.2880 1.8006
Scaled Pearson X2 465
837.2880 1.8006
Log Likelihood 468477.5778
Full Log Likelihood -1960.0336
AIC (smaller is better) 3926.0671
AICC (smaller is better) 3926.1190
BIC (smaller is better) 3938.5061
Algorithm converged.

Analysis Of Maximum Likelihood Parameter Estimates
Parameter DF Estimate Standard
Error
Wald 95% Confidence
Limits Wald Chi-
Square Pr > ChiSq
Intercept 1 -3.2682 0.1131 -3.4898
-3.0466
835.57 <.0001
groupnum 0 1 1.5802 0.1712 1.2446 1.9158 85.16 <.0001
groupnum 1 0 0.0000 0.0000 0.0000 0.0000 . .
Dispersion 1 3.0498 0.2113 2.6626 3.4934
Note:
The negative binomial dispersion parameter was estimated by maximum likelihood.
LR Statistics For Type 3 Analysis
Source DF Chi-Square Pr > ChiSq
groupnum 1 74.91 <.0001

Model Information
Data Set WORK.NEWSET
Distribution Negative Binomial
Link Function Log
Dependent Variable num
Offset Variable newdenom
Number of Observations Read 480
Number of Observations Used 467
Missing Values 13
Class Level Information
Class Levels Values
groupnum 2 0 1
Criteria For Assessing Goodness Of Fit
Criterion DF Value Value/DF
Deviance 465
508.2190 1.0929
Scaled Deviance 465
508.2190 1.0929
Pearson Chi-Square 465
837.2880 1.8006
Scaled Pearson X2 465
837.2880 1.8006
Log Likelihood 468477.5778
Full Log Likelihood -1960.0336
AIC (smaller is better) 3926.0671

Criteria For Assessing Goodness Of Fit
Criterion DF Value Value/DF
AICC (smaller is better) 3926.1190
BIC (smaller is better) 3938.5061
Algorithm converged.
Analysis Of Maximum Likelihood Parameter Estimates
Parameter DF Estimate Standard
Error
Wald 95% Confidence
Limits Wald Chi-
Square Pr > ChiSq
Intercept 1 -3.2682 0.1131 -3.4898
-3.0466
835.57 <.0001
groupnum 0 1 1.5802 0.1712 1.2446 1.9158 85.16 <.0001
groupnum 1 0 0.0000 0.0000 0.0000 0.0000 . .
Dispersion 1 3.0498 0.2113 2.6626 3.4934
Note:
The negative binomial dispersion parameter was estimated by maximum likelihood.
LR Statistics For Type 3 Analysis
Source DF Chi-Square Pr > ChiSq
groupnum 1 74.91 <.0001

Model Information
Data Set WORK.NEWSET
Distribution Negative Binomial
Link Function Log
Dependent Variable num
Offset Variable newdenom
Number of Observations Read 480
Number of Observations Used 467
Missing Values 13
Class Level Information
Class Levels Values
groupnum 2 0 1
genderp 2 0 1
countyp 3 0 1 2
agep 4 0 1 2 3
racep 3 0 1 2
ethnicp 2 0 1
year 2 0 1

Criteria For Assessing Goodness Of Fit
Criterion DF Value Value/DF
Deviance 455
511.9408 1.1251
Scaled Deviance 455
511.9408 1.1251
Pearson Chi-Square 455
1170.9933 2.5736
Scaled Pearson X2 455
1170.9933 2.5736
Log Likelihood 468607.3433
Full Log Likelihood -1830.2680
AIC (smaller is better) 3686.5360
AICC (smaller is better) 3687.3396
BIC (smaller is better) 3740.4383
Algorithm converged.
Analysis Of Maximum Likelihood Parameter Estimates
Parameter DF Estimate Standard
Error
Wald 95% Confidence
Limits Wald Chi-
Square Pr > ChiSq
Intercept 1 -4.9625 0.2386 -5.4301
-4.4948
432.60 <.0001
groupnum 0 1 1.8126 0.1623 1.4945 2.1307 124.73 <.0001
groupnum 1 0 0.0000 0.0000 0.0000 0.0000 . .
genderp 0 1 -0.9848 0.1353 -1.2500
-0.7197
53.01 <.0001

Analysis Of Maximum Likelihood Parameter Estimates
Parameter DF Estimate Standard
Error
Wald 95% Confidence
Limits Wald Chi-
Square Pr > ChiSq
genderp 1 0 0.0000 0.0000 0.0000 0.0000 . .
countyp 0 1 0.1775 0.1650 -0.1459
0.5010 1.16 0.2821
countyp 1 1 0.3459 0.1627 0.0270 0.6649 4.52 0.0335
countyp 2 0 0.0000 0.0000 0.0000 0.0000 . .
agep 0 1 0.6667 0.2229 0.2298 1.1036 8.95 0.0028
agep 1 1 2.2943 0.1824 1.9367 2.6518 158.19 <.0001
agep 2 1 2.0263 0.1838 1.6661 2.3865 121.59 <.0001
agep 3 0 0.0000 0.0000 0.0000 0.0000 . .
racep 0 1 -1.1174 0.1800 -1.4702
-0.7646
38.54 <.0001
racep 1 1 0.8286 0.2110 0.4150 1.2422 15.42 <.0001
racep 2 0 0.0000 0.0000 0.0000 0.0000 . .
ethnicp 0 1 0.3870 0.1805 0.0333 0.7407 4.60 0.0320
ethnicp 1 0 0.0000 0.0000 0.0000 0.0000 . .
year 0 1 0.0029 0.1409 -0.2733
0.2792 0.00 0.9835
year 1 0 0.0000 0.0000 0.0000 0.0000 . .
Dispersion 1 1.5611 0.1267 1.3315 1.8303
Note:
The negative binomial dispersion parameter was estimated by maximum likelihood.
LR Statistics For Type 3 Analysis
Source DF Chi-Square Pr > ChiSq
groupnum 1 102.69 <.0001
genderp 1 47.91 <.0001
countyp 2 4.49 0.1060
agep 3 144.78 <.0001
racep 2 111.78 <.0001
ethnicp 1 4.51 0.0337
year 1 0.00 0.9834
Negative Binomial Adjusted
Model Information
Data Set WORK.NEWSET
Distribution Negative Binomial
Link Function Log
Dependent Variable num
Offset Variable newdenom
Number of Observations Read 480
Number of Observations Used 467
Missing Values 13

Class Level Information
Class Levels Values
groupnum 2 0 1
genderp 2 0 1
countyp 3 0 1 2
agep 4 0 1 2 3
racep 3 0 1 2
ethnicp 2 0 1
year 2 0 1
Criteria For Assessing Goodness Of Fit
Criterion DF Value Value/DF
Deviance 455
511.9408 1.1251
Scaled Deviance 455
511.9408 1.1251
Pearson Chi-Square 455
1170.9933 2.5736
Scaled Pearson X2 455
1170.9933 2.5736
Log Likelihood 468607.3433
Full Log Likelihood -1830.2680
AIC (smaller is better) 3686.5360
AICC (smaller is better) 3687.3396
BIC (smaller is better) 3740.4383

Algorithm converged.
Analysis Of Maximum Likelihood Parameter Estimates
Parameter DF Estimate Standard
Error
Wald 95% Confidence
Limits Wald Chi-
Square Pr > ChiSq
Intercept 1 -4.9625 0.2386 -5.4301
-4.4948
432.60 <.0001
groupnum 0 1 1.8126 0.1623 1.4945 2.1307 124.73 <.0001
groupnum 1 0 0.0000 0.0000 0.0000 0.0000 . .
genderp 0 1 -0.9848 0.1353 -1.2500
-0.7197
53.01 <.0001
genderp 1 0 0.0000 0.0000 0.0000 0.0000 . .
countyp 0 1 0.1775 0.1650 -0.1459
0.5010 1.16 0.2821
countyp 1 1 0.3459 0.1627 0.0270 0.6649 4.52 0.0335
countyp 2 0 0.0000 0.0000 0.0000 0.0000 . .
agep 0 1 0.6667 0.2229 0.2298 1.1036 8.95 0.0028
agep 1 1 2.2943 0.1824 1.9367 2.6518 158.19 <.0001
agep 2 1 2.0263 0.1838 1.6661 2.3865 121.59 <.0001
agep 3 0 0.0000 0.0000 0.0000 0.0000 . .
racep 0 1 -1.1174 0.1800 -1.4702
-0.7646
38.54 <.0001
racep 1 1 0.8286 0.2110 0.4150 1.2422 15.42 <.0001
racep 2 0 0.0000 0.0000 0.0000 0.0000 . .
ethnicp 0 1 0.3870 0.1805 0.0333 0.7407 4.60 0.0320
ethnicp 1 0 0.0000 0.0000 0.0000 0.0000 . .
year 0 1 0.0029 0.1409 -0.2733
0.2792 0.00 0.9835

Analysis Of Maximum Likelihood Parameter Estimates
Parameter DF Estimate Standard
Error
Wald 95% Confidence
Limits Wald Chi-
Square Pr > ChiSq
year 1 0 0.0000 0.0000 0.0000 0.0000 . .
Dispersion 1 1.5611 0.1267 1.3315 1.8303
Note:
The negative binomial dispersion parameter was estimated by maximum likelihood.
LR Statistics For Type 3 Analysis
Source DF Chi-Square Pr > ChiSq
groupnum 1 102.69 <.0001
genderp 1 47.91 <.0001
countyp 2 4.49 0.1060
agep 3 144.78 <.0001
racep 2 111.78 <.0001
ethnicp 1 4.51 0.0337
year 1 0.00 0.9834