Embed Size (px)
Citation preview
Juvenile Justice Crime
Prevention Act
Annual Report
March 2012
California Department of Corrections and Rehabilitation
Corrections Standards Authority

Juvenile Justice
Crime Prevention Act
Annual Report to the Legislature
March 2012
Corrections Standards Authority 600 Bercut Drive
Sacramento, CA 95811 http://www.cdcr.ca.gov/Divisions_Boards/CSA/index.html

STATE OF CALIFORNIA
EDMUND G. BROWN, JR., Governor
DEPARTMENT OF CORRECTIONS AND REHABILITATION
Matthew L. Cate, Secretary
CORRECTIONS STANDARDS AUTHORITY
Members
Matthew L. Cate, Chair
Terri McDonald Manager/Administrator,
State Correctional Facility for Adult Offenders
Vacant Administrator
Local Detention Facility Sheriff’s Department
Vacant Manager/Administrator,
State Correctional Facility for Juvenile Offenders
Mimi H. Silbert, Ph.D. Administrator
Local Community-Based Correctional Program Delancey Street Foundation, San Francisco
Dean Growdon Sheriff (jail with RC of 200 inmates or less)
County of Lassen
Michelle Minor Subordinate Officer of the Secretary of the
Department of Corrections and Rehabilitation
Leroy Baca
Sheriff (jail with RC of 200 inmates or more) County of Los Angeles
Carol Biondi Public Member
County of Los Angeles
Susan Mauriello County Supervisor or Administrative Officer
County of Santa Cruz
Eleanor Andrade-Silva Subordinate Officer of the Secretary of the
Department of Corrections and Rehabilitation
Linda Penner
Chief Probation Officer (county over 200,000 pop.) County of Fresno
Jonathan Raven Public Member
Represents Interests of Crime Victims
Adele Arnold
Chief Probation Officer (county under 200,000 pop.) County of Tuolumne
Sandra McBrayer Representative
Community-Based Youth Service Organization
Cleotha Adams Rank and File Representative
Deputy Sheriff
Vacant Rank and File Representative
Juvenile Probation Officer
Vacant Rank and File Representative
State Parole Officer
Charlotte Mello Rank and File Representative
State Adult Correctional Facility
Staff
Robert J. Takeshta, Executive Director (A)
CORRECTIONS PLANNING AND PROGRAMS DIVISION STANDARDS AND TRAINING FOR CORRECTIONS DIVISION Jean L. Scott, Deputy Director Evonne Garner, Deputy Director (A)
FACILITIES STANDARDS AND OPERATIONS DIVISION COUNTY FACILITIES CONSTRUCTION DIVISION Gary Wion, Deputy Director Robert J. Takeshta, Deputy Director

Table of Contents
Executive Summary 1
An Overview of the Program 2-4
Local Planning Process Program Funding Program Evaluation Program Administration
Statewide Evaluation 5-8
Program Expenditures Mandated Outcomes Local Outcomes
County Program Highlights 9-15
Appendices 16-18
A. Statewide Expenditure Summary
B. Statewide Summary of Per Capita Program Costs
C. Change in County Arrest Rate

1
Executive Summary
he Juvenile Justice Crime Prevention Act (JJCPA) is a state funded initiative that supports juvenile probation programs with a record of reducing crime and
delinquency among at-risk youth and young offenders. In fiscal year (FY) 2010-11 the JJCPA supported 149 programs implemented by counties to address locally identified needs throughout the continuum of responses to juvenile crime. This produced significant improvements in several measures of crime and delinquency for program participants.
The Corrections Standards Authority (CSA) is responsible for administering the JJCPA and submitting annual reports to the Legislature on: 1) the local planning process; 2) program expenditures; and 3) six mandated juvenile justice outcomes (Government Code Section 30061[4]). This tenth annual report addresses each of these issues.
Local Planning Process: The JJCPA requires counties to establish and maintain a multi-agency Juvenile Justice Coordinating Council (JJCC) for the purpose of developing, reviewing, and updating a comprehensive plan that documents the condition of the local juvenile justice system and outlines proposed efforts to fill identified service gaps. Welfare & Institutions Code Section 749.22 defines the JJCC membership.
Program Expenditures: By June 30, 2011, the 56 counties participating in the JJCPA program expended or encumbered $83,690,007 of State funds in FY 2010-11 (see Appendix A: Statewide Expenditure Summary). Counties also spent $519,852 in interest earned on State funds and $14,233,825 in non-JJCPA funds to support program activities, for a combined total of $14,753,677. A total of 98,199 minors participated in the 149 JJCPA programs in 2010-11, which translates into an average per capita cost to the State of $852.25 (see Appendix B: Statewide Summary of Per Capita Program Costs).
Juvenile Justice Outcomes: The data submitted by counties for FY 2010-11 indicate that the JJCPA programs continue to have a positive impact on the reduction of juvenile crime and delinquency in communities throughout California. This is evident in the results for the mandated juvenile justice outcomes as well as education and other outcomes tracked by a number of counties, including the following statistically significant results:
Youth participating in JJCPA programs had significantly lower rates of arrests for new offenses and incarceration than youth in a comparable reference group.
JJCPA participants also successfully completed probation and community service at significantly higher rates than youth in the comparison group.
JJCPA youth achieved significantly higher school attendance rates and grade point averages than reference group youth, and were significantly less likely to receive a sustained petition for a new law violation.
In total, these results are highly consistent with those achieved in previous years, and provide ongoing evidence that the programs are continuing to have a positive effect on the juveniles they serve.
T
2
An Overview of the Program
he Juvenile Justice Crime Prevention Act (JJCPA) program was created by the Crime Prevention Act of 2000 (Chapter 353) to provide a stable funding source for
local juvenile justice programs aimed at curbing crime and delinquency among at-risk youth.
The JJCPA involves a partnership between the state of California, 561 counties, and community-based organizations to enhance public safety by reducing juvenile crime and delinquency. Local officials and stakeholders determine where to direct resources through an interagency planning process; the State appropriates funds, which the Controller’s Office distributes to counties on a per capita basis; and community-based organizations play a critical role in delivering services. It is a partnership that recognizes the need for juvenile justice resources and the value of local discretion and multi-agency collaboration in addressing the problem of juvenile crime in our communities.
Local Planning Process
State policies have increasingly recognized the need to strengthen the local juvenile justice system and its array of alternatives and graduated sanctions for juvenile offenders through a comprehensive local planning process that requires probation departments to coordinate their activities with other key stakeholders.
The programs funded by the JJCPA address a continuum of responses to at-risk youth and juvenile offenders including prevention, intervention, supervision, treatment, and incarceration; and respond to specific problems associated with these populations in each county.
To receive the initial JJCPA allocation, each county developed a comprehensive multi-agency juvenile justice plan that included an assessment of existing resources targeting at-risk youth, juvenile offenders and their families as well as a local action strategy for addressing identified gaps in the continuum of responses to juvenile crime and delinquency. Each year counties either update or modify their plan, as needed, or reapply for continuation funding for the same programs as the prior year. The application and any plan modifications must be approved by the CSA before funds can be expended.2
In an effort to ensure coordination and collaboration among the various local agencies serving at-risk youth and young offenders, the JJCPA requires Juvenile Justice Coordinating Councils (JJCCs) chaired by the county’s chief probation officer and comprised of representatives of law enforcement and criminal justice agencies, the board of supervisors, social services, education, mental health and community-based organizations to develop and modify the plan. The JJCCs typically meet monthly or quarterly to review program progress and evaluation data.
Chief probation officers and other JJCC members continue to report high levels of satisfaction with the JJCPA planning process, noting that it maximizes their ability to
1Alpine and Sierra Counties chose not to participate in this program due to the small amount of their expected allocations.
Allocations are based, in part, on county population. 2 Prior to the July 2005 reorganization of the Youth and Adult Correctional Agency, the CSA was known as the Board of Corrections.
T
3
implement or expand successful programs tailored to the specific populations and needs of local jurisdictions. In addition to pointing out that juvenile justice planning has become more strategic, integrated, and outcome-oriented, JJCC members have underscored the value of sharing information regarding youth programs across the many disciplines involved in the JJCPA programs.
Program Funding
Funding for JJCPA is set in statute as 50% of the amount annually allocated by the legislature under Government Code section 30061(b)(4). In previous years, counties received their JJCPA allocation in October for program expenditures occurring the following fiscal year (i.e., nine months in advance). Thus, counties were able to bank and earn interest on the allocation, with the earned interest used for program expenditures in the subsequent fiscal year. In FY 2005-06, as part of its budget reduction strategy, the Legislature changed this process so that counties would receive their allocation immediately prior to the period in which the funds were to be spent. The elimination of the nine month lead time allowed the State, rather than counties, to benefit from any interest earned on the funds. In FY 2005-06 only approximately one-quarter of funding was provided to counties ($25,825,000). Consequently, the program year budget for JJCPA (July 1 through June 30) is a combination of two fiscal year allocations. The program year budget is comprised of the fourth quarter allocation from the prior year and the first three quarters of the current year. Below is a summary of recent changes:
Funding for JJCPA changed again in FY 2008-09. As part of the State Budget Act (Assembly Bill (AB) X3 3), the funding source for JJCPA was changed from State General Fund (SGF) to the Vehicle License Fee (VLF). The change took effect April 1, 2009;
The allocation amount for JJCPA was reduced during the 2008-09 program year. The third quarter allocation, distributed April 17, 2009, was the last of the State General Fund dollars allocated to JJCPA and was only $8,718,749 statewide;
The Department of Finance and State Controller’s Office allowed counties, at their discretion, to use fourth quarter funding (normally reserved to fund the first quarter of the next program year) to cover both third and fourth quarter expenditures if needed;
JJCPA funding was set in statute as 21.30 percent of the Local Safety and Protection Account of the Transportation Fund, funded by the VLF;
The amount of VLF funding available is known to fluctuate. Consequently, counties no longer received a set allocation amount, as their allocations varied quarter-by-quarter;
According to the Department of Finance, funding of the Local Safety and Protection Account was a continuous appropriation without respect to fiscal years. However, the VLF fee dedicated amount of 0.15 percent that funds the account was set to sunset on June 30, 2011.
It should be noted that in the State Budget Act of FY 2011-12, the Local Revenue Fund of 2011 was created. The Local Revenue Fund has a variety of subaccounts, including the Local Law Enforcement Services Account that is the new funding source for JJCPA.
4
The Local Revenue Fund is partially funded by VLF funds and by a redirection of 1.0625 percent of the State sales tax. This change will be reflected in the FY 2011-12 report.
In addition to changes in funding cycle and source, the Department of Finance is required to annually adjust allocations to reflect changes in county populations.
Program Evaluation
The JJCPA requires funded programs to be modeled on evidence-based strategies that have proven effective in curbing juvenile delinquency. Additionally, the JJCPA requires counties to collect and report information related to annual program expenditures and juvenile justice outcomes. At the local level, these evaluation activities enable stakeholders to assess progress toward desired goals, refine their programs, and target available resources. These evaluation efforts also enable the Legislature to monitor the State’s investment in the JJCPA and assess its overall impact on juvenile crime and delinquency.
The data that counties are statutorily required to report are categorized into six categories:
Arrest rate;
Incarceration rate;
Probation violation rate;
Probation completion rate;
Restitution completion rate; and
Community service completion rate.
Counties only report on outcome measures applicable to their programs. For example, a truancy prevention program serving primarily middle-school students would not be expected to have an impact on the completion of probation rate. In this example, the program would only report data for relevant categories.
In addition to the mandated outcomes, many counties track and report on local outcomes specific to their individual programs. For example, some local outcomes relate to education and track academic progress through school attendance, grade point averages, and school behavior reports.
Program Administration
The Legislature tasked the CSA with the administration of the JJCPA, including annual legislative reports to address:
the overall effectiveness of the local planning process;
program expenditures for each county; and
data for the six statutorily mandated outcome measures.
In administering the JJCPA, CSA staff work closely with the local JJCCs in developing and updating their comprehensive juvenile justice plan. This plan must be approved by the CSA each year before JJCPA funds may be expended. At the request of counties, CSA provides extensive technical assistance to identify and document programmatic strategies that have proven effective in reducing juvenile crime, determine appropriate evaluation designs for the proposed programs, and problem-solve on issues related to program implementation and evaluation.
5
Statewide Evaluation
Program Expenditures
The counties participating in the JJCPA program expended $83,690,007 of State funds in FY 2010-11 (see Appendix A: Statewide Expenditure Summary). Counties also spent $519,852 in interest earned on State funds and $14,233,825 in non-JJCPA funds to support program activities for a combined total of $14,753,677. Although the JJCPA program does not have a local match requirement, the voluntary infusion of local resources demonstrates the counties’ commitment to the goals of the JJCPA and significantly leverages the State’s investment in deterring youth from criminal activity. A total of 98,199 minors participated in the 149 JJCPA programs in FY 2010-11, which translates into an average per capita cost to the State (JJCPA funds) of $852.25 (see Appendix B: Statewide Summary of Per Capita Program Costs). Although per capita costs rose from the previous fiscal year ($736.57), they remain far lower than was the case during the first year of the initiative ($1,201.53).
Juvenile Justice Outcomes
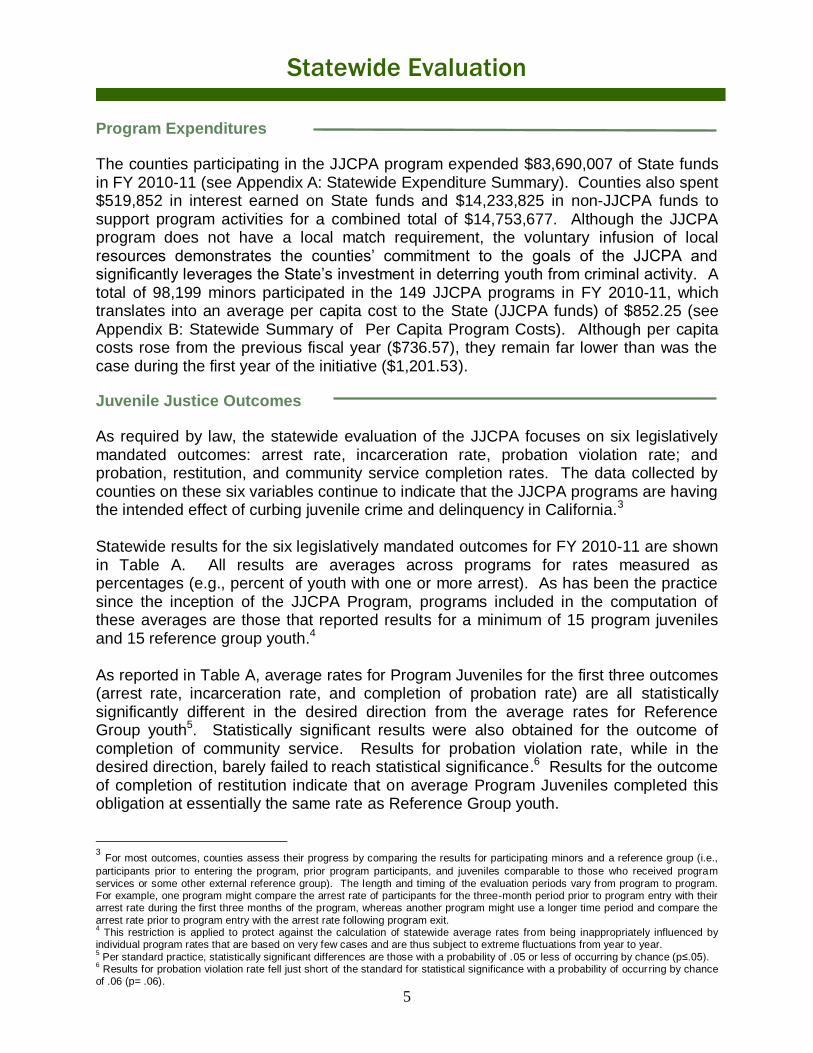
As required by law, the statewide evaluation of the JJCPA focuses on six legislatively mandated outcomes: arrest rate, incarceration rate, probation violation rate; and probation, restitution, and community service completion rates. The data collected by counties on these six variables continue to indicate that the JJCPA programs are having the intended effect of curbing juvenile crime and delinquency in California.3 Statewide results for the six legislatively mandated outcomes for FY 2010-11 are shown in Table A. All results are averages across programs for rates measured as percentages (e.g., percent of youth with one or more arrest). As has been the practice since the inception of the JJCPA Program, programs included in the computation of these averages are those that reported results for a minimum of 15 program juveniles and 15 reference group youth.4 As reported in Table A, average rates for Program Juveniles for the first three outcomes (arrest rate, incarceration rate, and completion of probation rate) are all statistically significantly different in the desired direction from the average rates for Reference Group youth5. Statistically significant results were also obtained for the outcome of completion of community service. Results for probation violation rate, while in the desired direction, barely failed to reach statistical significance.6 Results for the outcome of completion of restitution indicate that on average Program Juveniles completed this obligation at essentially the same rate as Reference Group youth. 3 For most outcomes, counties assess their progress by comparing the results for participating minors and a reference group (i.e.,
participants prior to entering the program, prior program participants, and juveniles comparable to those who received program
services or some other external reference group). The length and timing of the evaluation periods vary from program to program. For example, one program might compare the arrest rate of participants for the three-month period prior to program entry with their arrest rate during the first three months of the program, whereas another program might use a longer time period and compare the
arrest rate prior to program entry with the arrest rate following program exit. 4 This restriction is applied to protect against the calculation of statewide average rates from being inappropriately influenced by
individual program rates that are based on very few cases and are thus subject to extreme fluctuations from year to year. 5 Per standard practice, statistically significant differences are those with a probability of .05 or less of occurring by chance (p≤.05).
6 Results for probation violation rate fell just short of the standard for statistical significance with a probability of occurring by chance
of .06 (p= .06).
6
TABLE A
Results for Legislatively-Mandated Juvenile Justice Outcomes
Outcome Measure
Number of Programs
Average
Program Juveniles
Reference Group
Arrest Rate* 117 26.3% 33.4%
Incarceration Rate* 122 25.9% 30.2%
Completion of Probation* 102 27.9% 24.0%
Probation Violation Rate 94 31.1% 33.8%
Completion of Restitution 69 26.1% 26.9%
Completion of Community Service* 62 41.8% 37.8%
*Statistically significant group differences
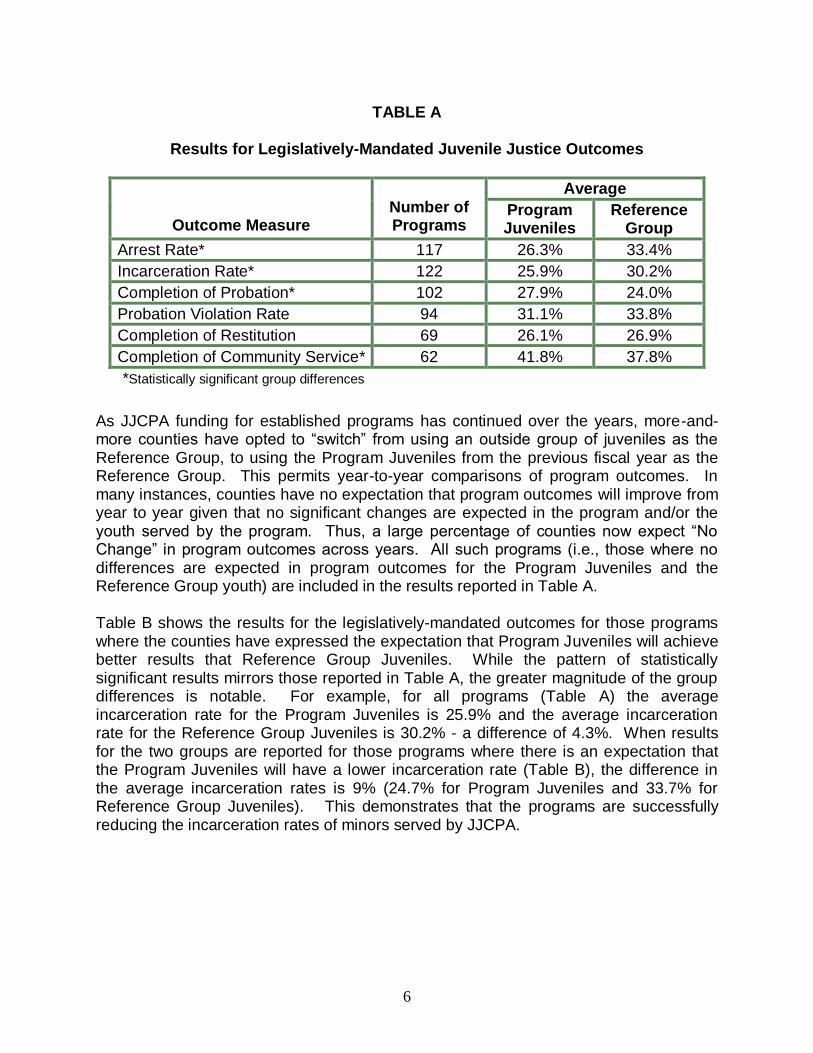
As JJCPA funding for established programs has continued over the years, more-and- more counties have opted to “switch” from using an outside group of juveniles as the Reference Group, to using the Program Juveniles from the previous fiscal year as the Reference Group. This permits year-to-year comparisons of program outcomes. In many instances, counties have no expectation that program outcomes will improve from year to year given that no significant changes are expected in the program and/or the youth served by the program. Thus, a large percentage of counties now expect “No Change” in program outcomes across years. All such programs (i.e., those where no differences are expected in program outcomes for the Program Juveniles and the Reference Group youth) are included in the results reported in Table A. Table B shows the results for the legislatively-mandated outcomes for those programs where the counties have expressed the expectation that Program Juveniles will achieve better results that Reference Group Juveniles. While the pattern of statistically significant results mirrors those reported in Table A, the greater magnitude of the group differences is notable. For example, for all programs (Table A) the average incarceration rate for the Program Juveniles is 25.9% and the average incarceration rate for the Reference Group Juveniles is 30.2% - a difference of 4.3%. When results for the two groups are reported for those programs where there is an expectation that the Program Juveniles will have a lower incarceration rate (Table B), the difference in the average incarceration rates is 9% (24.7% for Program Juveniles and 33.7% for Reference Group Juveniles). This demonstrates that the programs are successfully reducing the incarceration rates of minors served by JJCPA.
7
TABLE B
Results for Legislatively-Mandated Juvenile Justice Outcomes for Programs Where the Expectation is that Program Group Juveniles Will Achieve Superior
Results
Outcome Measure
Number of Programs
Average
Program Juveniles
Reference Group
Arrest Rate* 56 28.5% 38.6%
Incarceration Rate* 53 24.7% 33.7%
Completion of Probation* 39 32.5% 26.2%
Probation Violation Rate 39 29.6% 33.8%
Completion of Restitution 22 31.1% 28.6%
Completion of Community Service* 25 44.6% 34.9%
*Statistically significant group differences
On balance, results for the six legislatively-mandated outcomes are very similar to those obtained in previous years with Program Juveniles performing significantly better than Reference Group youth with respect to arrest rate, incarceration rate and completion of probation rate, and not distinguishing themselves from Reference Group youth with respect to completion of restitution. Contrary to last year, Program Juveniles also achieved significantly better results than Reference Group youth for the outcome of completion of community service. Probation violation rate was significantly lower for Program Juveniles for the first and only time in FY 2008-09 and just failed to achieve statistical significance in the current report year. The enabling legislation also requires that all counties specify a goal or expectation for change in the annual countywide arrest rate per 100,000 juveniles age 10 to 17. Each county also specifies a baseline year to which comparisons are made. In most cases, the baseline for this reporting period is 2009. Results for this measure are presented for the most recent reporting year (2010) in Appendix C. A total of 35 counties (62.5 percent) achieved an actual arrest rate reduction. There was a very modest relationship between predicted reductions and actual reductions, as 17 of the 24 counties that expected a decline achieved a decline (70.8 percent). However, reductions were also experienced by five of the eight counties that predicted an increase (62.5 percent) and 13 of the 24 counties that predicted no change (54.2 percent). At the individual county level, the arrest rate per 100,000 juveniles can vary significantly from year to year – especially in counties having small juvenile populations. A better indicator of arrest rate trends is the arrest rate per 100,000 juveniles based on the total population of juveniles in the state – or in the case of JJCPA, the arrest rate per 100,000 juveniles for the total population of juveniles in the 56 counties that receive JJCPA funding. As shown in Appendix C, this rate decreased from 4,511 in 2009 to
8
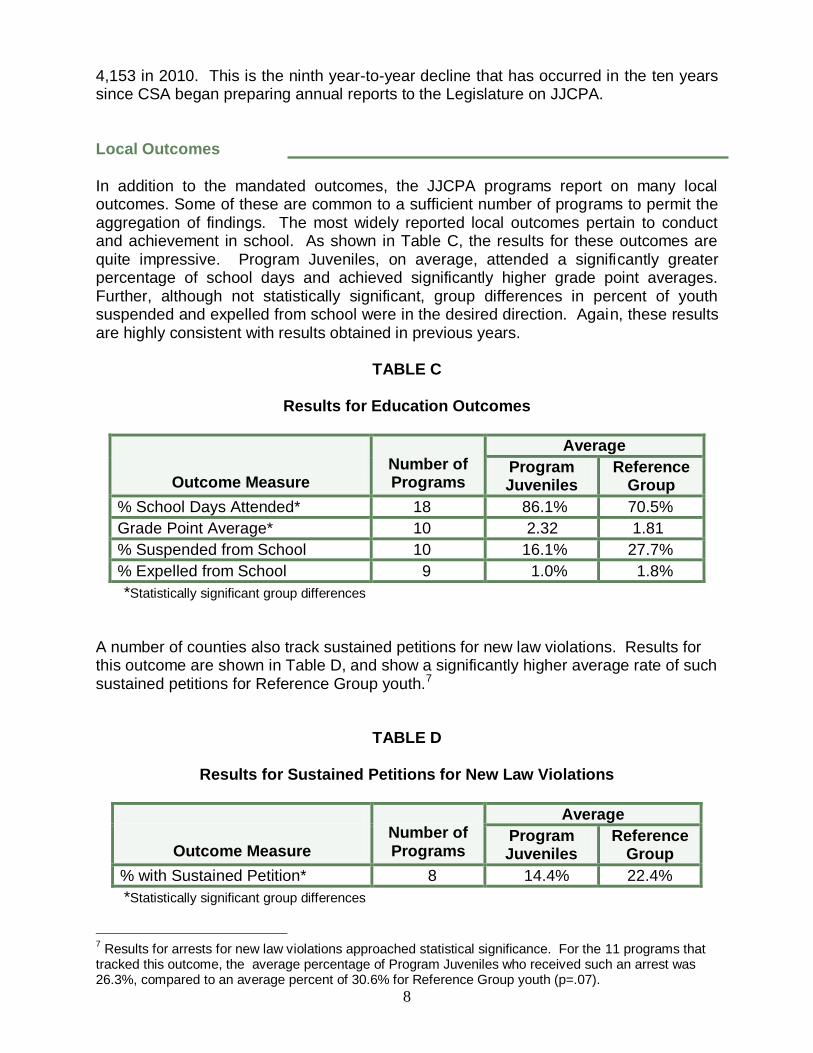
4,153 in 2010. This is the ninth year-to-year decline that has occurred in the ten years since CSA began preparing annual reports to the Legislature on JJCPA. Local Outcomes In addition to the mandated outcomes, the JJCPA programs report on many local outcomes. Some of these are common to a sufficient number of programs to permit the aggregation of findings. The most widely reported local outcomes pertain to conduct and achievement in school. As shown in Table C, the results for these outcomes are quite impressive. Program Juveniles, on average, attended a significantly greater percentage of school days and achieved significantly higher grade point averages. Further, although not statistically significant, group differences in percent of youth suspended and expelled from school were in the desired direction. Again, these results are highly consistent with results obtained in previous years.
TABLE C
Results for Education Outcomes
Outcome Measure
Number of Programs
Average
Program Juveniles
Reference Group
% School Days Attended* 18 86.1% 70.5%
Grade Point Average* 10 2.32 1.81
% Suspended from School 10 16.1% 27.7%
% Expelled from School 9 1.0% 1.8%
*Statistically significant group differences
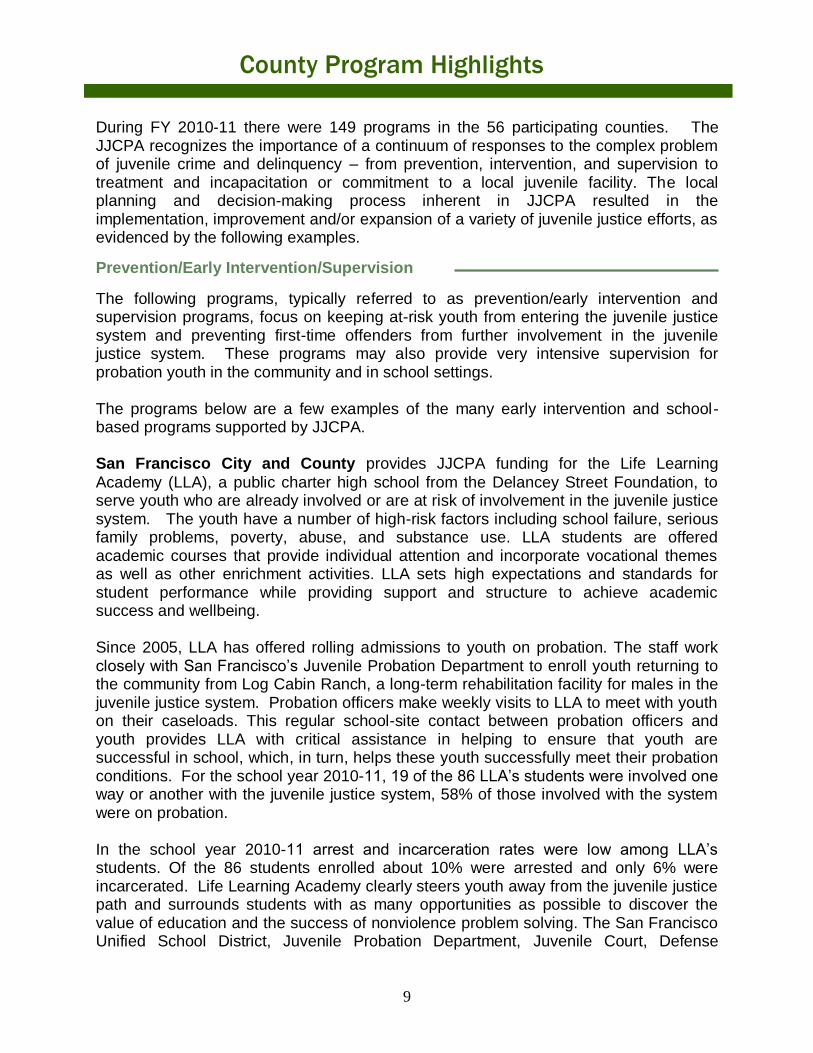
A number of counties also track sustained petitions for new law violations. Results for this outcome are shown in Table D, and show a significantly higher average rate of such sustained petitions for Reference Group youth.7
TABLE D
Results for Sustained Petitions for New Law Violations
Outcome Measure
Number of Programs
Average
Program Juveniles
Reference Group
% with Sustained Petition* 8 14.4% 22.4%
*Statistically significant group differences
7 Results for arrests for new law violations approached statistical significance. For the 11 programs that
tracked this outcome, the average percentage of Program Juveniles who received such an arrest was 26.3%, compared to an average percent of 30.6% for Reference Group youth (p=.07).
9
County Program Highlights
During FY 2010-11 there were 149 programs in the 56 participating counties. The JJCPA recognizes the importance of a continuum of responses to the complex problem of juvenile crime and delinquency – from prevention, intervention, and supervision to treatment and incapacitation or commitment to a local juvenile facility. The local planning and decision-making process inherent in JJCPA resulted in the implementation, improvement and/or expansion of a variety of juvenile justice efforts, as evidenced by the following examples.
Prevention/Early Intervention/Supervision
The following programs, typically referred to as prevention/early intervention and supervision programs, focus on keeping at-risk youth from entering the juvenile justice system and preventing first-time offenders from further involvement in the juvenile justice system. These programs may also provide very intensive supervision for probation youth in the community and in school settings. The programs below are a few examples of the many early intervention and school-based programs supported by JJCPA.
San Francisco City and County provides JJCPA funding for the Life Learning
Academy (LLA), a public charter high school from the Delancey Street Foundation, to serve youth who are already involved or are at risk of involvement in the juvenile justice system. The youth have a number of high-risk factors including school failure, serious family problems, poverty, abuse, and substance use. LLA students are offered academic courses that provide individual attention and incorporate vocational themes as well as other enrichment activities. LLA sets high expectations and standards for student performance while providing support and structure to achieve academic success and wellbeing. Since 2005, LLA has offered rolling admissions to youth on probation. The staff work closely with San Francisco’s Juvenile Probation Department to enroll youth returning to the community from Log Cabin Ranch, a long-term rehabilitation facility for males in the juvenile justice system. Probation officers make weekly visits to LLA to meet with youth on their caseloads. This regular school-site contact between probation officers and youth provides LLA with critical assistance in helping to ensure that youth are successful in school, which, in turn, helps these youth successfully meet their probation conditions. For the school year 2010-11, 19 of the 86 LLA’s students were involved one way or another with the juvenile justice system, 58% of those involved with the system were on probation. In the school year 2010-11 arrest and incarceration rates were low among LLA’s students. Of the 86 students enrolled about 10% were arrested and only 6% were incarcerated. Life Learning Academy clearly steers youth away from the juvenile justice path and surrounds students with as many opportunities as possible to discover the value of education and the success of nonviolence problem solving. The San Francisco Unified School District, Juvenile Probation Department, Juvenile Court, Defense

10
Counsel, and Community Based Organizations all refer students to LLA. Each student is individually interviewed; first by the Principal and then by student leaders, to determine eligibility for admission. Students who express a desire for transformation and commitment to the LLA model are enrolled. Each LLA student develops an Individualized Learning Plan that sets out his/her goals and career pathway, including summer placement in jobs or classes. As a public charter school operating within the San Francisco Unified School District (SFUSD), LLA offers courses that fulfill both SFUSD graduation requirements and University of California (UC) eligibility requirements. Vocational and elective courses such as organic food production, culinary arts, music, digital photography, design/multimedia, and bicycle mechanics are offered as well. Workforce development is a critical component of the school model.
All LLA administrative staff, academic teachers and vocational instructors are
credentialed and have relevant real-world experience relating to the youth attending
LLA. LLA’s Principal is a Delancey Street graduate with a Ph.D in Psychology; she sets
the school’s vision and supervises student discipline. The Vice Principal has an
Administrative Credential and supervises classroom instruction. Most staff are
designated for direct services, with the majority of time directed to educational activities.
Each teacher acts as advisor to a small group of students, and staff eat lunch daily with
students in a family-style format to provide individualized support and modeling
throughout the day.
The Life Learning Academy utilizes an innovative and evidence-based curriculum
designed to teach high-risk, diverse youth traditional academics, community leadership,
job readiness and vocational skills. Academic teachers are also required to teach
students how to exercise non-violence and how to live a non-violent life. Non-violence
is a critical theme for LLA’s students since they often live in communities highly
impacted by violent crime. In addition, LLA promotes a model of positive peer pressure
that holds students accountable for their actions, and offers the tools they need to
resolve conflict without violence - “Each One, Teach One.”
A Non-violence Coordinator oversees curricular development, classroom nonviolence projects, and Student Council activities. Throughout the school year, the Nonviolence Coordinator works with teachers and probation officers to facilitate academic and creative projects that explore the non-violence theme. LLA’s Student Council is a critical component of the school’s governance system since they meet with students who have violated LLA rules and/or policies to help them explore alternatives to violence. The Life Learning Academy annually trains 20 Student Council members in peer mediation and successful conflict de-escalation. Each Fall, all students participate in an intensive, week-long anti-violence orientation. On a daily basis, students encourage one another to maintain LLA’s culture of non-violence and readily intervene if they perceive threatening or destructive student behavior. As a result, LLA students’ and staff commitment to non-violence has maintained a 100% violence-free environment for over 12 years.

11
One of the most important achievements of LLA is the remarkable academic performance improvement experienced by youth, who not long ago were failing in mainstream schools. Students dramatically increase their school attendance while at LLA. During school year 2010-11 the average number of days absent from school was 35 days a year prior to enrollment at LLA; after six months of enrollment in the program the average number of days absent from school went down to 5. In the same way, the average student Grade Point Average (GPA) rose from .58 prior to LLA enrollment to 2.68 six months into LLA’s academic year. Ninety-seven percent of LLA’s graduates continue their education and/or participate in the workforce following completion of the program. Graduates attend a variety of higher education institutions including: San Francisco City College, Laney College, San Francisco State University, Long Beach State and the University of California-Santa Cruz. The LLA continues to provide an exceptional academic opportunity for San Francisco’s youth.
Mariposa County has used State JJCPA resources, together with local resources, to develop a School Based Truancy Program. The program is a collaborative effort between the Mariposa County Probation Department and the Mariposa County School District to coordinate and implement a working solution to truancy in the county. The collaboration facilitates the goal of identifying truants and verifying their information to implement a quick response within the county, especially for habitual offenders. The School Based Truancy Program was developed as part of the initial Comprehensive Multi-Agency Juvenile Justice Plan (CMJJP) for Mariposa County. Truancy was identified as a “gateway behavior” and portal for youth to enter into delinquency and the juvenile justice system. Mariposa County is a relatively small and rural county with only a 96-hour Special Purpose Juvenile Hall. The lack of a full service juvenile hall in the county has limited the continuum of responses and graduated sanctions available to address juvenile delinquency, necessitating a clear focus on early intervention and prevention strategies. The School Based Truancy Program helps to partially fund a Truancy Intervention Probation Officer (TIPO). The Truancy Officer functions as a liaison between the Mariposa County Probation Department and the Mariposa County School District. The officer facilitates coordination of information and services between the agencies, as well as being a resource for other county agencies, including the Sheriff’s Department, District Attorney’s Office, and Mental Health. The program originally began in just 5 school sites but has subsequently been expanded to all 12 school sites in the county. As part of the program, the School District Superintendent implemented the practice of electronically generating the “First Letter of Truancy”, utilizing Aeries, the district’s computer software program. Aeries automatically generates truancy notification letters that are submitted to the Truancy Officer when the officer arrives on campus to check on the attendance status of students. The officer responds immediately to address student truancies when a student has been truant three times during the school year, designating the minor as habitually truant. The Truant Officer then attempts to locate the truant minor by conducting a home visit, contacting known friends, and searching popular locations within the community where youth are known to congregate. After locating the minor, the officer meets with parents or guardians to explain their legal responsibility to comply with the compulsory education laws. The ultimate goal is to
12
partner with the parents to improve their child’s school attendance and performance. If the parent is resistant to the intervention provided by the Truancy Officer, the officer is often able to influence the parent’s cooperation by explaining the potential consequences that can be imposed against the parent if they fail to address their child’s truancy.
In addition to unannounced home visits, the Truancy Officer makes weekly contact at school with habitually truant youth. Additionally, the officer provides a progress report at the monthly School Attendance Review Board (SARB) regarding the performance of truant youth. If a minor’s attendance does not improve following intervention, the Truancy Officer may refer the student and parents to the District Attorney’s Office for possible Court action. During the previous school year, the Truancy Program received approximately 450 referrals; of which only 150 were legitimate truancies. The rate of absences for truants was 5.69% prior to the first truancy notification letter. The rate was reduced to 1.02% when measured at 90 days following the notification letter and subsequent home visit by the Truancy Officer. The Mariposa County School Based Truancy Program demonstrates the flexibility inherit in the JJCPA. The local Juvenile Justice Coordinating Council has leveraged State grant funds, combined with local funds, to develop a successful program tailored to the unique needs of Mariposa County. Even though the total amount of JJCPA funds allocated to Mariposa County is quite small when compared to the overall statewide expenditures, the State resources are essential to the continued implementation of this vitally necessary delinquency prevention program. San Mateo County utilizes JJCPA to fund the Court and Community School Counseling (CCSC) program. The program is operated by the Cleo Eulau Center, a community based organization in Mountain View. The mission of the Cleo Eulau Center is to help children and adolescents develop their capacity to develop resiliency and rebound from hardship and adversity as they grow to become competent adults. Throughout the academic year, the program provides onsite mental health counseling to youth attending San Mateo County Court and Community Schools. Many youth attending Court and Community Schools must participate in counseling as part of their diversion contract or formal probation terms. The programs goals include:
increasing self awareness,
increasing self-esteem,
developing tolerance and empathy for others,
preventing delinquency,
improving school attendance,
reducing recidivism, and
improving anger management skills.
13
The youth in the program participate in specialized individual and group counseling sessions on a weekly basis. Students are provided the opportunity to gain insight into self-destructive behaviors while developing techniques to cope with the various traumas and pressures in their lives. The counseling sessions are facilitated by graduate student interns majoring in clinical psychology and are supervised by experienced and licensed therapists. The program is designed to serve youth for the entire school year or approximately nine months. Due to a variety of circumstances, including youth entering the Court School midterm or returning to mainstream high school early, the average length of stay was 110 days during FY 2010-11. Results for several outcomes for the 154 program participants in FY 2010-11 exceeded those for FY 2009-10 program participants. For example, arrest rate declined from 18.7% (FY 2009-10) to 8.7% (FY 2010-11), and completion of restitution rate increased from 16.3% (FY 2009-10) to 67.9% (FY 2010-11). Additionally, the participants showed improvement in their scores on the Positive Attitudes Toward Future Goals, an assessment instrument that measures how hopeful a minor feels about their ability to become successful in key areas of their lives including: school, work, family relationships, and life satisfaction. Monterey County operates a comprehensive truancy program that is a collaboration
between the District Attorney's Truancy Abatement Program (TAP) and the Probation Department. Funding sources for this effort result from a leveraged blend of local resources from the Monterey County Office of Education (MCOE), state funding from the Juvenile Justice Crime Prevention Act (JJCPA), and federal appropriations for the Silver Star Gang Prevention and Intervention Program (SSGPI). The program focuses on redressing truancy as an identified precursor of delinquent behavior and a significant risk factor for further involvement in the juvenile justice system. Schools countywide rely on the program to increase school attendance and achieve educational goals that otherwise could not be reached. The Truancy Abatement Program (TAP) consists of a team of two full-time Deputy District Attorneys, two full-time secretaries and one investigative aide in the District Attorney's Office, in addition to four Deputy Probation Officers. These professionals promote attendance through referrals to services, accountability, supervision and prosecution. The TAP team provides assistance to school officials for minors with behavioral problems; the supervision of juveniles on school campus; and referrals to support services. Additionally, TAP staff work with the family unit to remove barriers to school attendance. TAP employs several levels of intervention in a graduated sanctions approach:
a series of three statutorily sound notices that are issued to parents,
outreach presentations,
individual truancy mediation hearings for unabated truancy, and
Truancy Court for the few cases that persist.
14
Probation Officers provide case management for approximately six months, conduct home and school visits, educate parents, and provide referrals to services for the family and the minors. Schools report that the number of truant students is reduced by 50-80% upon the issuance of the first TAP truancy notice to parents; while an average of 60 families appear in Truancy Court each week. Court sanctions, which may be imposed on juveniles, include probation, court-ordered programs, California Drivers License suspensions, and court-orders requiring parents to attend school with their truant children. Parents are referred to family strengthening programs, and may be fined, ordered to participate in parenting programs, and/or incarcerated. Recent annual program results demonstrate that the overwhelming majority of truant students return to school without prosecution. Specifically:
7,778 first declarations of truancy were issued county-wide
1,761 second declarations of truancy were issued
1,473 declarations of habitual truancy were issued, resulting in the scheduling of the same number of truancy mediation hearings
1,304 actual mediation hearings were conducted
550 Welfare & Institutions Code Section 601 juvenile petitions were filed
104 Education Code Section 48923 complaints were filed Creative solutions to truancy are always sought. For example, the Monterey County Office of Education (MCOE) established the Silver Star Independent Study Program, a school for truant students which was awarded the prestigious California Golden Apple Award, among other accolades. Silver Star has led hundreds of formerly habitually truant students back to school success. In June 2010, students entered the program with abysmal records of 20-30% attendance; after enrolling, student attendance rose to an average of 95%. Additionally, the Truancy Abatement Program is one of the partners at the Silver Star Resource Center (SSRC), a one-stop shop for gang prevention and early intervention. SSRC partners include the Probation Department, Children's Behavioral Health, Office of Employment Training, MCOE, and a variety of community-based organizations providing outreach, family support, mentoring, job placement, and drug and alcohol abuse services. SSRC is a collaborative effort to provide integrated and multi-disciplinary services to troubled youth and their families to deter gang association.
The Truancy Assistance program has previously received the “Celebrating Excellence in Education” award from the Monterey County School Boards Association in 2007 and 2010 and the “Partners in Education Excellence” award from the Association of California School Administrators Region 10 in 2008.
15
Tehama County uses JJCPA funds to operate a First Offender Program known as the Juvenile Challenge Program. The program is designed to serve first-time juvenile offenders through supervision and family involvement. The program model is based on the successes of the Challenge 1 grant program that ended in 2001. Juveniles selected for the program must participate in the following services:
face-to-face meetings with program staff,
onsite school meetings,
in-home visits with family members involved, and
referrals to other comprehensive counseling services. Minors in the program are either on informal probation or court-ordered informal probation/diversion. Under certain circumstances minors who are formal wards of the court can be admitted to the program if they have no prior record and are amenable to the program. The caseloads for the Probation Officers assigned to supervise the minors in the program are approximately 20, while regular probation caseloads in Tehama County average 60-80 minors. The average length of time in the program during FY 2010-11 was 221 days.
A case plan is developed for each minor who is admitted to the program. The Probation Officer assigned to the minor conducts a risk/needs assessment focusing on criminogenic factors, such as substance abuse, anger management issues, and family dynamics. The case plan includes specific interventions that may include referrals to:
drug and alcohol counseling,
general or specialized counseling,
anger management counseling,
pre-employment or job skills training,
tutoring assistance programs, and
comprehensive after school programs.
Depending upon the assessment of the family dynamic, the minor and family may be referred to special collaborative programs designed to meet the needs of at-risk youth and their families. The parents or guardians of the minor may be referred to substance abuse counseling, parenting education classes, and family strengthening classes.
While Tehama County is a rural county with a relatively small juvenile population, 416 youth have been served since the program’s inception. For the 2010-11 program year, the tenth year of the program’s operation, 33 minors received services (23 males and 10 females). The program serves minors between the ages of 14 to 18, with the mean age being 15.45 years.
One of the key factors in the success of this Probation Department program is the close collaboration with other Tehama County agencies. The juvenile support group, Thinking Ground, is a collaborative program between the Mental Health and Alcohol and Drug agencies. Tehama County Mental Health provides referral services to the CARE program, a voluntary 60 day residential rehabilitation program for youth. Additionally, a local non-profit organization, Alternatives to Violence, provides anger management counseling.
16
The program utilizes the Coopersmith Self-Esteem Inventory (SEI) to measure each youth’s attitude toward him/her self in social, academic, family, and personal areas. A high score on the SEI corresponds with high self-esteem. Youth complete the SEI upon entry and exit from the program. Youth demonstrated an overall increase in the mean score when the pre and post tests are compared. Youth are also assessed on a Resiliency Survey upon program entry and exit. Youth demonstrated growth in the following areas:
does at least one hour of homework every school day,
reads for pleasure three or more hours per week,
accepts personal responsibility for behavior, and
shows increased resistance to negative peer pressure.
The successful coordination of services and interagency cooperation within Tehama County has resulted in a relatively high level of service available to minors, especially considering the rural and low-income nature of this northern California county. Minors, and their families participating in the program are able to access low-cost or no-cost counseling, substance abuse education, and family skill development services. This program is an excellent example of the multi-agency coordination inherent in JJCPA. Conclusion
The 56 counties participating in the JJCPA program expended or encumbered $83,690,007 of State funds in FY 2010-11. Counties also spent $519,852 in interest earned on State funds and $14,233,825 in non-JJCPA funds to support program activities, for a combined total of $14,753,677. Although the JJCPA program does not have a local match requirement, the voluntary infusion of local resources demonstrates the counties’ commitment to the goals of the JJCPA. A total of 98,199 minors participated in the 149 JJCPA programs in 2010-11. The statistically significant positive results for the mandatory outcome measures of Arrest Rate, Incarceration Rate, and Completion of Probation demonstrate the continued effectiveness of the JJCPA.
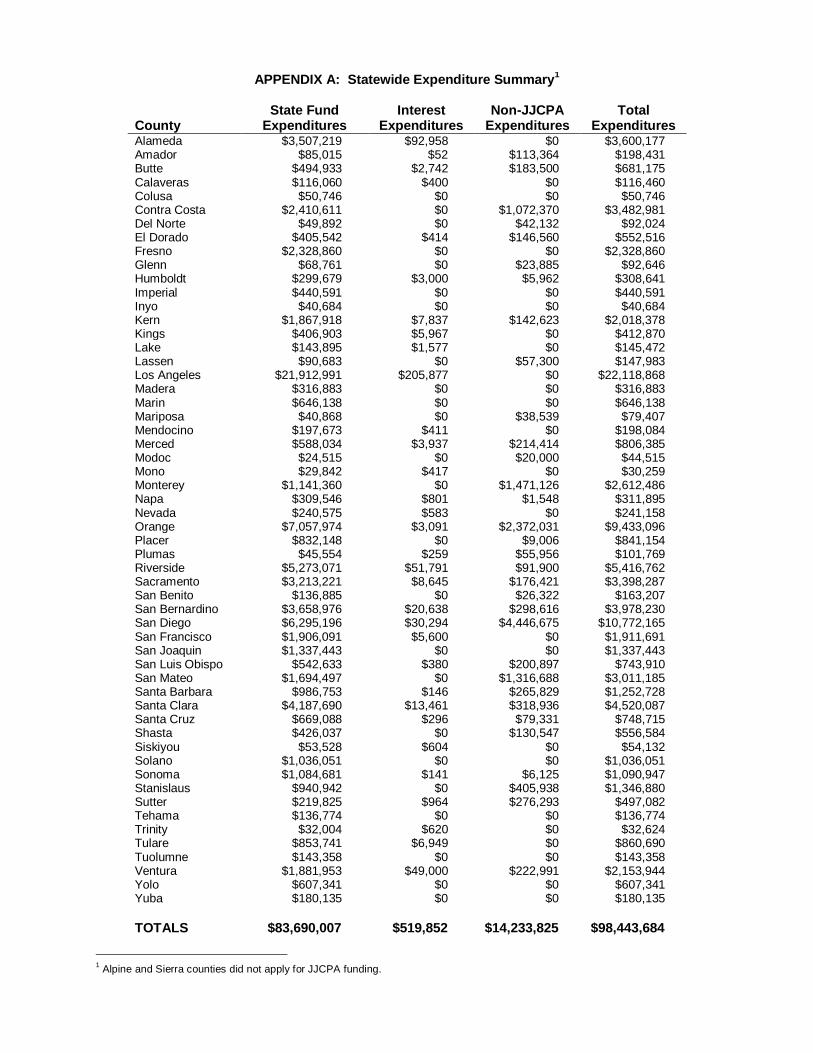
APPENDIX A: Statewide Expenditure Summary1
State Fund Interest Non-JJCPA Total County Expenditures Expenditures Expenditures Expenditures Alameda $3,507,219 $92,958 $0 $3,600,177 Amador $85,015 $52 $113,364 $198,431 Butte $494,933 $2,742 $183,500 $681,175 Calaveras $116,060 $400 $0 $116,460 Colusa $50,746 $0 $0 $50,746 Contra Costa $2,410,611 $0 $1,072,370 $3,482,981 Del Norte $49,892 $0 $42,132 $92,024 El Dorado $405,542 $414 $146,560 $552,516 Fresno $2,328,860 $0 $0 $2,328,860 Glenn $68,761 $0 $23,885 $92,646 Humboldt $299,679 $3,000 $5,962 $308,641 Imperial $440,591 $0 $0 $440,591 Inyo $40,684 $0 $0 $40,684 Kern $1,867,918 $7,837 $142,623 $2,018,378 Kings $406,903 $5,967 $0 $412,870 Lake $143,895 $1,577 $0 $145,472 Lassen $90,683 $0 $57,300 $147,983 Los Angeles $21,912,991 $205,877 $0 $22,118,868 Madera $316,883 $0 $0 $316,883 Marin $646,138 $0 $0 $646,138 Mariposa $40,868 $0 $38,539 $79,407 Mendocino $197,673 $411 $0 $198,084 Merced $588,034 $3,937 $214,414 $806,385 Modoc $24,515 $0 $20,000 $44,515 Mono $29,842 $417 $0 $30,259 Monterey $1,141,360 $0 $1,471,126 $2,612,486 Napa $309,546 $801 $1,548 $311,895 Nevada $240,575 $583 $0 $241,158 Orange $7,057,974 $3,091 $2,372,031 $9,433,096 Placer $832,148 $0 $9,006 $841,154 Plumas $45,554 $259 $55,956 $101,769 Riverside $5,273,071 $51,791 $91,900 $5,416,762 Sacramento $3,213,221 $8,645 $176,421 $3,398,287 San Benito $136,885 $0 $26,322 $163,207 San Bernardino $3,658,976 $20,638 $298,616 $3,978,230 San Diego $6,295,196 $30,294 $4,446,675 $10,772,165 San Francisco $1,906,091 $5,600 $0 $1,911,691 San Joaquin $1,337,443 $0 $0 $1,337,443 San Luis Obispo $542,633 $380 $200,897 $743,910 San Mateo $1,694,497 $0 $1,316,688 $3,011,185 Santa Barbara $986,753 $146 $265,829 $1,252,728 Santa Clara $4,187,690 $13,461 $318,936 $4,520,087 Santa Cruz $669,088 $296 $79,331 $748,715 Shasta $426,037 $0 $130,547 $556,584 Siskiyou $53,528 $604 $0 $54,132 Solano $1,036,051 $0 $0 $1,036,051 Sonoma $1,084,681 $141 $6,125 $1,090,947 Stanislaus $940,942 $0 $405,938 $1,346,880 Sutter $219,825 $964 $276,293 $497,082 Tehama $136,774 $0 $0 $136,774 Trinity $32,004 $620 $0 $32,624 Tulare $853,741 $6,949 $0 $860,690 Tuolumne $143,358 $0 $0 $143,358 Ventura $1,881,953 $49,000 $222,991 $2,153,944 Yolo $607,341 $0 $0 $607,341 Yuba $180,135 $0 $0 $180,135
TOTALS $83,690,007 $519,852 $14,233,825 $98,443,684
1 Alpine and Sierra counties did not apply for JJCPA funding.

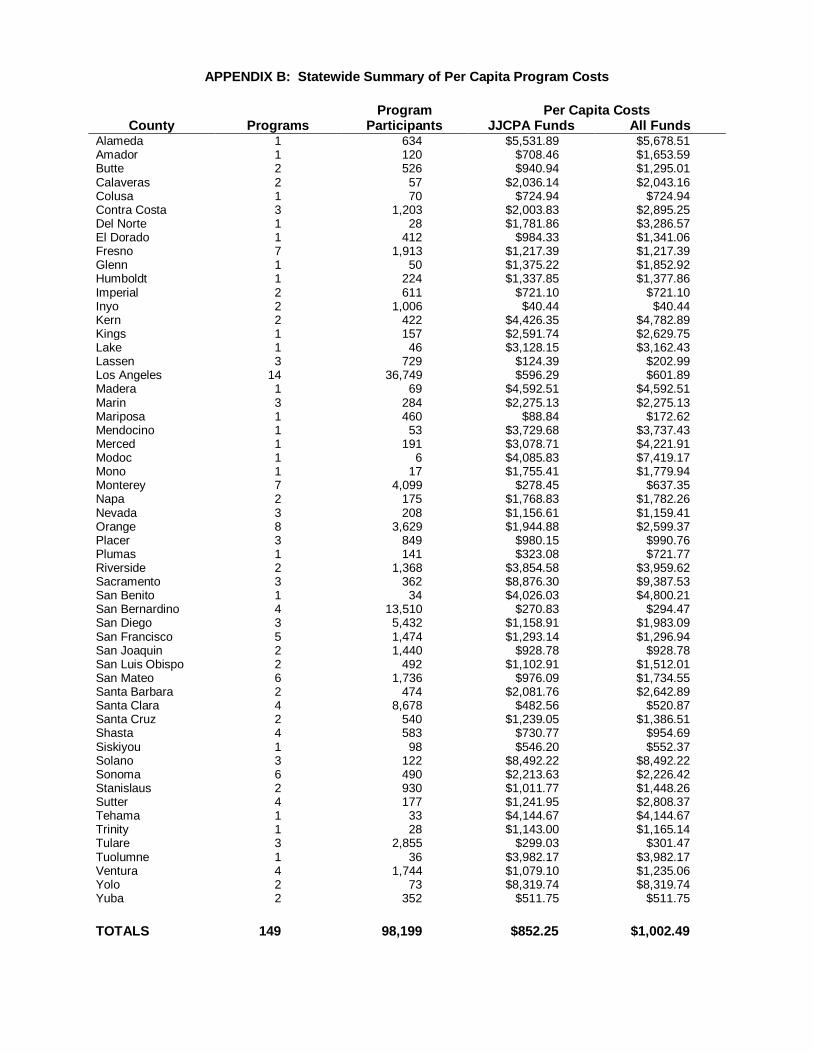
APPENDIX B: Statewide Summary of Per Capita Program Costs
Program Per Capita Costs
County Programs Participants JJCPA Funds All Funds Alameda 1 634 $5,531.89 $5,678.51 Amador 1 120 $708.46 $1,653.59 Butte 2 526 $940.94 $1,295.01 Calaveras 2 57 $2,036.14 $2,043.16 Colusa 1 70 $724.94 $724.94 Contra Costa 3 1,203 $2,003.83 $2,895.25 Del Norte 1 28 $1,781.86 $3,286.57 El Dorado 1 412 $984.33 $1,341.06 Fresno 7 1,913 $1,217.39 $1,217.39 Glenn 1 50 $1,375.22 $1,852.92 Humboldt 1 224 $1,337.85 $1,377.86 Imperial 2 611 $721.10 $721.10 Inyo 2 1,006 $40.44 $40.44 Kern 2 422 $4,426.35 $4,782.89 Kings 1 157 $2,591.74 $2,629.75 Lake 1 46 $3,128.15 $3,162.43 Lassen 3 729 $124.39 $202.99 Los Angeles 14 36,749 $596.29 $601.89 Madera 1 69 $4,592.51 $4,592.51 Marin 3 284 $2,275.13 $2,275.13 Mariposa 1 460 $88.84 $172.62 Mendocino 1 53 $3,729.68 $3,737.43 Merced 1 191 $3,078.71 $4,221.91 Modoc 1 6 $4,085.83 $7,419.17 Mono 1 17 $1,755.41 $1,779.94 Monterey 7 4,099 $278.45 $637.35 Napa 2 175 $1,768.83 $1,782.26 Nevada 3 208 $1,156.61 $1,159.41 Orange 8 3,629 $1,944.88 $2,599.37 Placer 3 849 $980.15 $990.76 Plumas 1 141 $323.08 $721.77 Riverside 2 1,368 $3,854.58 $3,959.62 Sacramento 3 362 $8,876.30 $9,387.53 San Benito 1 34 $4,026.03 $4,800.21 San Bernardino 4 13,510 $270.83 $294.47 San Diego 3 5,432 $1,158.91 $1,983.09 San Francisco 5 1,474 $1,293.14 $1,296.94 San Joaquin 2 1,440 $928.78 $928.78 San Luis Obispo 2 492 $1,102.91 $1,512.01 San Mateo 6 1,736 $976.09 $1,734.55 Santa Barbara 2 474 $2,081.76 $2,642.89 Santa Clara 4 8,678 $482.56 $520.87 Santa Cruz 2 540 $1,239.05 $1,386.51 Shasta 4 583 $730.77 $954.69 Siskiyou 1 98 $546.20 $552.37 Solano 3 122 $8,492.22 $8,492.22 Sonoma 6 490 $2,213.63 $2,226.42 Stanislaus 2 930 $1,011.77 $1,448.26 Sutter 4 177 $1,241.95 $2,808.37 Tehama 1 33 $4,144.67 $4,144.67 Trinity 1 28 $1,143.00 $1,165.14 Tulare 3 2,855 $299.03 $301.47 Tuolumne 1 36 $3,982.17 $3,982.17 Ventura 4 1,744 $1,079.10 $1,235.06 Yolo 2 73 $8,319.74 $8,319.74 Yuba 2 352 $511.75 $511.75
TOTALS 149 98,199 $852.25 $1,002.49

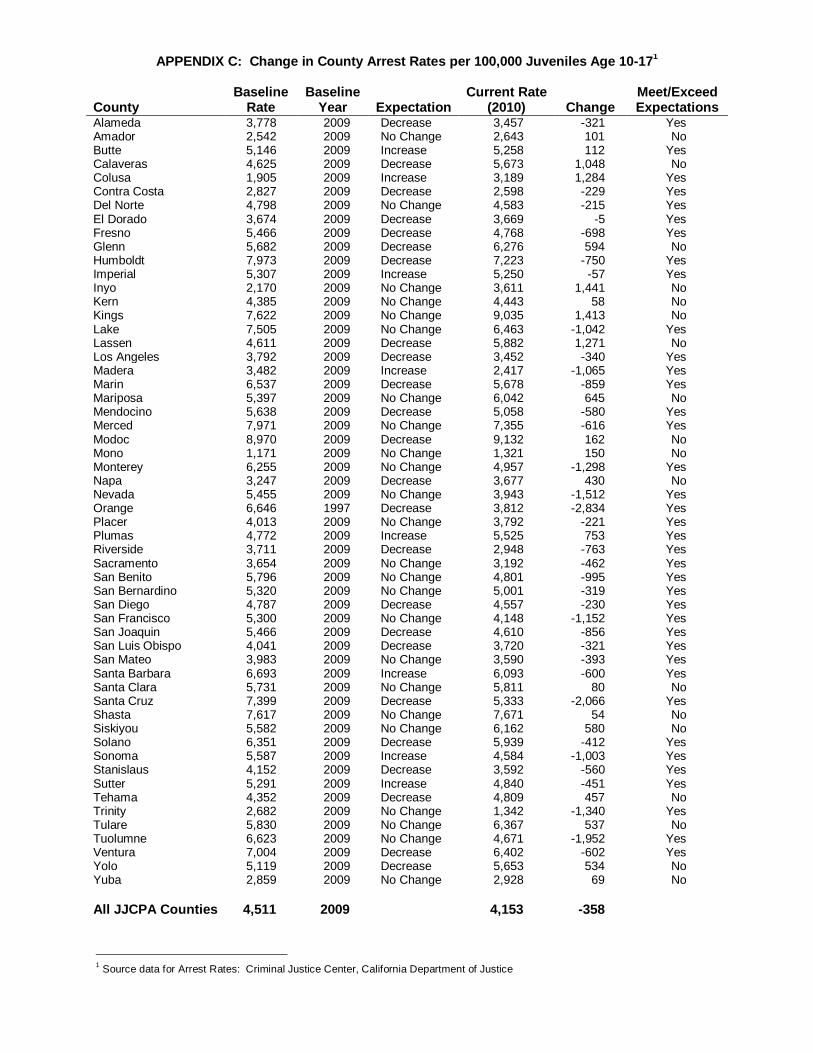
APPENDIX C: Change in County Arrest Rates per 100,000 Juveniles Age 10-17
1
Baseline Baseline Current Rate Meet/Exceed County Rate Year Expectation (2010) Change Expectations Alameda 3,778 2009 Decrease 3,457 -321 Yes Amador 2,542 2009 No Change 2,643 101 No Butte 5,146 2009 Increase 5,258 112 Yes Calaveras 4,625 2009 Decrease 5,673 1,048 No Colusa 1,905 2009 Increase 3,189 1,284 Yes Contra Costa 2,827 2009 Decrease 2,598 -229 Yes Del Norte 4,798 2009 No Change 4,583 -215 Yes El Dorado 3,674 2009 Decrease 3,669 -5 Yes Fresno 5,466 2009 Decrease 4,768 -698 Yes Glenn 5,682 2009 Decrease 6,276 594 No Humboldt 7,973 2009 Decrease 7,223 -750 Yes Imperial 5,307 2009 Increase 5,250 -57 Yes Inyo 2,170 2009 No Change 3,611 1,441 No Kern 4,385 2009 No Change 4,443 58 No Kings 7,622 2009 No Change 9,035 1,413 No Lake 7,505 2009 No Change 6,463 -1,042 Yes Lassen 4,611 2009 Decrease 5,882 1,271 No Los Angeles 3,792 2009 Decrease 3,452 -340 Yes Madera 3,482 2009 Increase 2,417 -1,065 Yes Marin 6,537 2009 Decrease 5,678 -859 Yes Mariposa 5,397 2009 No Change 6,042 645 No Mendocino 5,638 2009 Decrease 5,058 -580 Yes Merced 7,971 2009 No Change 7,355 -616 Yes Modoc 8,970 2009 Decrease 9,132 162 No Mono 1,171 2009 No Change 1,321 150 No Monterey 6,255 2009 No Change 4,957 -1,298 Yes Napa 3,247 2009 Decrease 3,677 430 No Nevada 5,455 2009 No Change 3,943 -1,512 Yes Orange 6,646 1997 Decrease 3,812 -2,834 Yes Placer 4,013 2009 No Change 3,792 -221 Yes Plumas 4,772 2009 Increase 5,525 753 Yes Riverside 3,711 2009 Decrease 2,948 -763 Yes Sacramento 3,654 2009 No Change 3,192 -462 Yes San Benito 5,796 2009 No Change 4,801 -995 Yes San Bernardino 5,320 2009 No Change 5,001 -319 Yes San Diego 4,787 2009 Decrease 4,557 -230 Yes San Francisco 5,300 2009 No Change 4,148 -1,152 Yes San Joaquin 5,466 2009 Decrease 4,610 -856 Yes San Luis Obispo 4,041 2009 Decrease 3,720 -321 Yes San Mateo 3,983 2009 No Change 3,590 -393 Yes Santa Barbara 6,693 2009 Increase 6,093 -600 Yes Santa Clara 5,731 2009 No Change 5,811 80 No Santa Cruz 7,399 2009 Decrease 5,333 -2,066 Yes Shasta 7,617 2009 No Change 7,671 54 No Siskiyou 5,582 2009 No Change 6,162 580 No Solano 6,351 2009 Decrease 5,939 -412 Yes Sonoma 5,587 2009 Increase 4,584 -1,003 Yes Stanislaus 4,152 2009 Decrease 3,592 -560 Yes Sutter 5,291 2009 Increase 4,840 -451 Yes Tehama 4,352 2009 Decrease 4,809 457 No Trinity 2,682 2009 No Change 1,342 -1,340 Yes Tulare 5,830 2009 No Change 6,367 537 No Tuolumne 6,623 2009 No Change 4,671 -1,952 Yes Ventura 7,004 2009 Decrease 6,402 -602 Yes Yolo 5,119 2009 Decrease 5,653 534 No Yuba 2,859 2009 No Change 2,928 69 No
All JJCPA Counties 4,511 2009 4,153 -358
1 Source data for Arrest Rates: Criminal Justice Center, California Department of Justice


![PREVENTION OF ORGANISED CRIME ACT - Pages · PREVENTION OF ORGANISED CRIME ACT NO. 121 OF 1998 [View Regulation] [ASSENTED TO 24 NOVEMBER, 1998] [DATE OF COMMENCEMENT: 21 JANUARY,](https://img.pdfslide.us/doc/110x75/5adb31077f8b9a53618d94e8/prevention-of-organised-crime-act-pages-of-organised-crime-act-no-121-of-1998.jpg)