Embed Size (px)
Citation preview
2017 JUVENILE COURT ANNUAL REPORT

2017 PENNSYLVANIA
Juvenile Court Annual Report
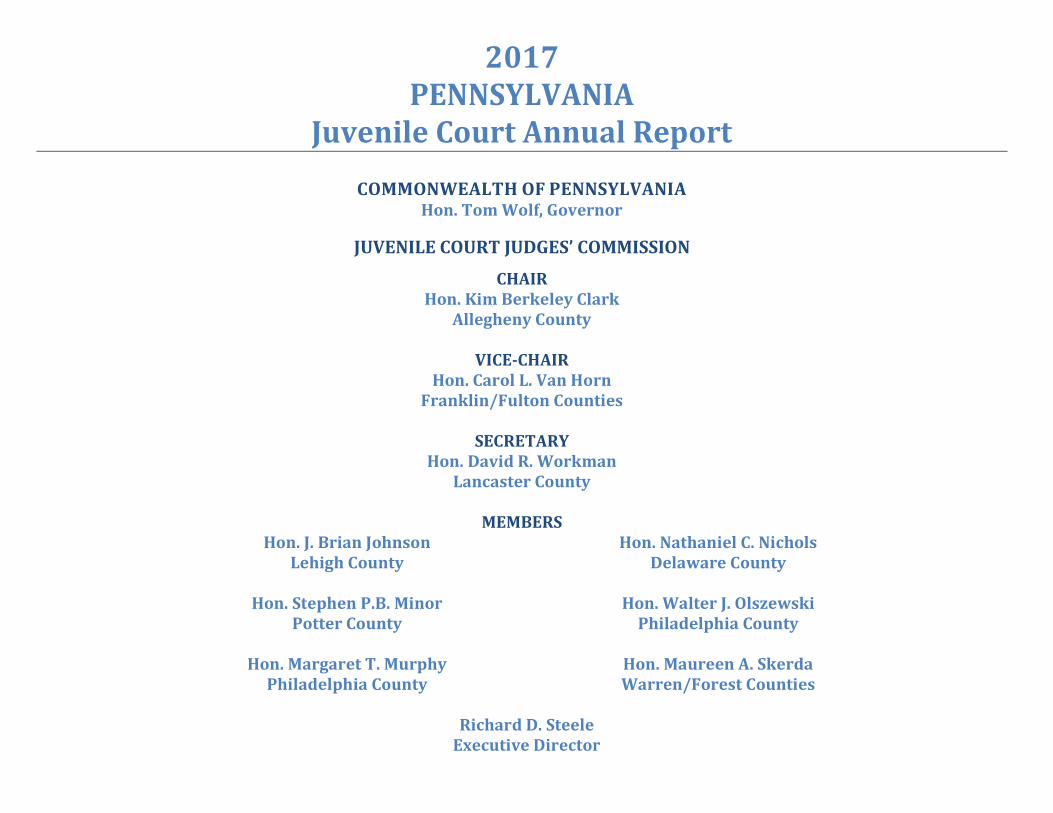
COMMONWEALTH OF PENNSYLVANIA Hon. Tom Wolf, Governor
JUVENILE COURT JUDGES’ COMMISSION
CHAIR Hon. Kim Berkeley Clark
Allegheny County
VICE-CHAIR Hon. Carol L. Van Horn
Franklin/Fulton Counties
SECRETARY Hon. David R. Workman
Lancaster County
MEMBERS Hon. J. Brian Johnson
Lehigh County
Hon. Stephen P.B. Minor Potter County
Hon. Margaret T. Murphy
Philadelphia County
Hon. Nathaniel C. Nichols Delaware County
Hon. Walter J. Olszewski
Philadelphia County
Hon. Maureen A. Skerda Warren/Forest Counties
Richard D. Steele Richard D. Steele
Executive Director
2017 PENNSYLVANIA
Juvenile Court Annual Report
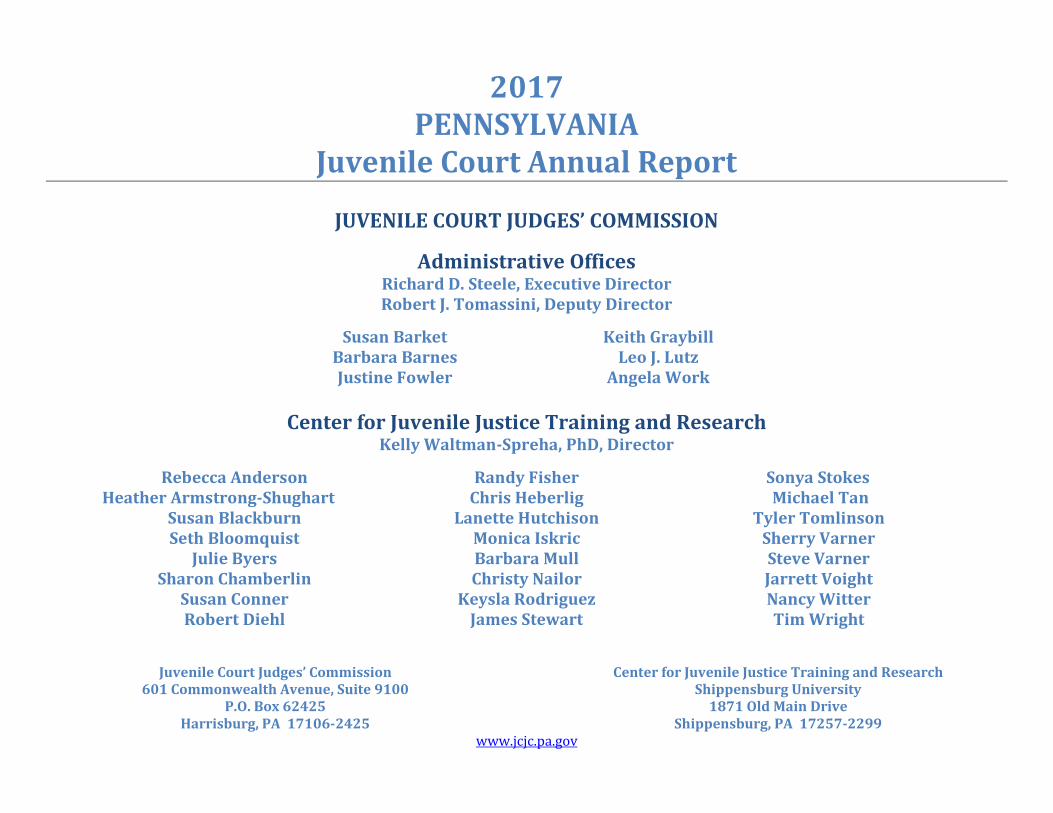
JUVENILE COURT JUDGES’ COMMISSION
Administrative Offices Richard D. Steele, Executive Director Robert J. Tomassini, Deputy Director
Susan Barket Barbara Barnes Justine Fowler
Keith Graybill Leo J. Lutz
Angela Work
Center for Juvenile Justice Training and Research Kelly Waltman-Spreha, PhD, Director
Rebecca Anderson Heather Armstrong-Shughart
Susan Blackburn Seth Bloomquist
Julie Byers Sharon Chamberlin
Susan Conner Robert Diehl
Randy Fisher Chris Heberlig
Lanette Hutchison Monica Iskric Barbara Mull Christy Nailor
Keysla Rodriguez James Stewart
Sonya Stokes Michael Tan
Tyler Tomlinson Sherry Varner Steve Varner Jarrett Voight Nancy Witter Tim Wright
Juvenile Court Judges’ Commission
601 Commonwealth Avenue, Suite 9100 P.O. Box 62425
Harrisburg, PA 17106-2425
Center for Juvenile Justice Training and Research
Shippensburg University 1871 Old Main Drive
Shippensburg, PA 17257-2299 www.jcjc.pa.gov
Foreword
The format and presentation of the data in this report are intended to help summarize various juvenile court trends within the Commonwealth. In addition to the
graphs and charts, narrative is included to help readers more quickly recognize various statewide trends, as well as highlight information not reflected in the
visual displays.
The data within this year’s report are generally organized in a manner that reflect the chronological processing of juvenile court delinquency cases, from
allegation through disposition.
Some of the data are organized and presented in graphs by county class to help readers make comparisons across counties of similar size and demographic
composition.
Raw data for each of Pennsylvania’s 67 counties are available within the appendices.
The Juvenile Court Judges’ Commission (JCJC) is pleased to present the first edition of its Juvenile Court Annual Report. Prior to the publication of this
report, Pennsylvania juvenile court statistics were presented in a yearly series entitled Pennsylvania Juvenile Court Dispositions. The series, which ran
from 1972 to 2016, focused primarily on juvenile court dispositions. While the report was a valuable resource for juvenile probation departments, juvenile
court judges, and other agency stakeholders, it did not include several key indicators necessary to gauge the total workload of the juvenile courts or
juvenile probation departments.
This year, the annual report has been enhanced to include additional juvenile court statistics to better measure and quantify work across the state by
juvenile justice professionals. Specifically, information related to delinquency allegations received by each juvenile probation department is included. Key
indicators including the volume of allegations received, allegation sources, and the most serious alleged offense by youth are presented. This information
is critical to understanding who is coming through the “front door” of Pennsylvania’s juvenile justice system. It is anticipated this report will continue to
evolve over time, and will eventually include additional measures of juvenile justice workflow in Pennsylvania. Juvenile delinquency dispositions continue
to be summarized in this report, as in the past.
The JCJC would like to extend its deepest appreciation to the juvenile courts and juvenile probation departments across the Commonwealth. Without their
support, this report would not be possible. It is with great pleasure that we dedicate this report to the judges, probation officers, victim advocates, district
attorneys, defenders, service providers, and other professionals who work on a daily basis in the Pennsylvania juvenile court system.
Respectfully submitted,
Richard D. Steele Honorable Kim Berkeley Clark
Executive Director Chair
Table of Contents 2017 Statistical Highlights ................................................................................................................................................................................................................................. 1
Chapter 1 – Incoming Cases
Section 1: Delinquency Allegations ....................................................................................................................................................................................................................... 2
2017 Delinquency Allegations (Map) ............................................................................................................................................................................................................ 3
2017 Delinquency Allegations by County Class (Map) .......................................................................................................................................................................... 4
Delinquency Allegations, 2013-2017 ............................................................................................................................................................................................................ 5
Allegation Rate per Juvenile Population, 2013-2017 ............................................................................................................................................................................. 5
Delinquency Allegations and Juvenile Totals ............................................................................................................................................................................................. 6
Delinquency Allegations by Gender ............................................................................................................................................................................................................... 7
Delinquency Allegations by Race and Ethnicity ........................................................................................................................................................................................ 7
Source of Allegation .............................................................................................................................................................................................................................................. 8
Delinquency Allegations by Age at Offense ................................................................................................................................................................................................. 9
Delinquency Allegations by Offense Type, 2013-2017 ....................................................................................................................................................................... 10
Delinquency Allegations Most Frequent Alleged Offense Categories ........................................................................................................................................... 11
Section 2: Secure Detention ................................................................................................................................................................................................................................... 12
Codes Related to JCJC Standards Governing the Use of Secure Detention Under the Juvenile Act ................................................................................... 12
Secure Detention Admissions, 2013-2017 ............................................................................................................................................................................................... 13
Length of Stay in Secure Detention ............................................................................................................................................................................................................. 14
Secure Detention Admissions by Standard Section Codes ................................................................................................................................................................ 15
Secure Detention Admissions by Standard Section Codes, 2013-2017 ....................................................................................................................................... 16
Utilization Rates for Pennsylvania Juvenile Detention Centers ...................................................................................................................................................... 17
Chapter 2 – Juvenile Court Processing
Section 1: Delinquency Dispositions .................................................................................................................................................................................................................. 18
2017 Delinquency Dispositions (Map) ...................................................................................................................................................................................................... 19
2017 Delinquency Dispositions by County Class (Map) ..................................................................................................................................................................... 20
Delinquency Dispositions, 2013-2017 ....................................................................................................................................................................................................... 21
Delinquency Disposition Rate per Juvenile Population, 2013-2017 ............................................................................................................................................. 22
Delinquency Dispositions and Delinquent Juvenile Totals ............................................................................................................................................................... 22
Frequencies of Statewide Delinquency Dispositions ........................................................................................................................................................................... 23
Delinquency Dispositions by Source of Allegation ............................................................................................................................................................................... 24
Attorney Representation in Formal Delinquency Proceedings ....................................................................................................................................................... 24
Most Serious Alleged Offenses by Type ..................................................................................................................................................................................................... 25
Most Serious Substantiated Offenses by Type ........................................................................................................................................................................................ 25
Most Frequent Alleged Offense Categories .............................................................................................................................................................................................. 26
Section 2: Demographics......................................................................................................................................................................................................................................... 27
Selected Dispositions by Gender .................................................................................................................................................................................................................. 27
Delinquency Dispositions by Age at Disposition ................................................................................................................................................................................... 28
Delinquency Dispositions by Educational Status .................................................................................................................................................................................. 29
Delinquency Dispositions by Family Status ............................................................................................................................................................................................. 30
Section 3: Race and Ethnicity ................................................................................................................................................................................................................................ 31
Total Delinquency Dispositions by Race and Ethnicity ...................................................................................................................................................................... 32
Selected Delinquency Dispositions by Race and Ethnicity ................................................................................................................................................................ 33
Secure Detention by Race and Ethnicity ................................................................................................................................................................................................... 35
Transferred to Criminal Proceedings by Race and Ethnicity ........................................................................................................................................................... 35
Section 4: Delinquency Placements .................................................................................................................................................................................................................. 36
Delinquency Placements, 2013-2017 ......................................................................................................................................................................................................... 36
Delinquency Placements as a Percent of Dispositions, 2013-2017 ............................................................................................................................................... 37
2017 Delinquency Placements as a Percent of Dispositions (Map) ............................................................................................................................................... 38
New Allegation Placements vs. Disposition Review Placements .................................................................................................................................................... 39
Total Delinquency Placements by Type .................................................................................................................................................................................................... 41
Section 5: Delinquency Disposition and Placement Reviews ................................................................................................................................................................ 42
Outcomes of Delinquency Disposition Reviews ..................................................................................................................................................................................... 42
Outcomes of Delinquency Placement Reviews ....................................................................................................................................................................................... 43
Section 6: Dependency Dispositions .................................................................................................................................................................................................................. 44
Dependency Dispositions ................................................................................................................................................................................................................................ 44
Dependency Dispositions by Age ................................................................................................................................................................................................................. 45
Appendices
Appendix 1: County Class and Population ....................................................................................................................................................................................................... 46
Appendix 2: Delinquency Allegations, 2013-2017 ....................................................................................................................................................................................... 47
Appendix 3: Delinquency Allegations as a Percent of Juvenile Population ........................................................................................................................................ 49
Appendix 4: Delinquency Allegations by Gender, Race, and Ethnicity ................................................................................................................................................ 51
Appendix 5: Delinquency Allegations by Source of Allegation ................................................................................................................................................................ 53
Appendix 6: Delinquency Allegations by Age at Offense ........................................................................................................................................................................... 55
Appendix 7: Delinquency Allegations by Offense Type .............................................................................................................................................................................. 59
Appendix 8: Number of Admissions and Length of Stay in Secure Detention .................................................................................................................................. 61
Appendix 9: Secure Detention Admissions by Standard Section Codes .............................................................................................................................................. 63
Appendix 10: Secure Detention Admissions by Section Code 206 and County Class ...................................................................................................................... 65
Appendix 11: Secure Detention Admissions by Section Code 701 and County Class ...................................................................................................................... 68
Appendix 12: Secure Detention Admissions by Unreported Code and County Class ...................................................................................................................... 70
Appendix 13: Delinquency Dispositions, 2013-2017 .................................................................................................................................................................................... 73
Appendix 14: Delinquency Dispositions as a Percent of Juvenile Population ..................................................................................................................................... 75
Appendix 15: Delinquency Dispositions by Type ........................................................................................................................................................................................... 77
Appendix 16: Delinquency Dispositions by Source of Allegation ............................................................................................................................................................ 81
Appendix 17: Type of Attorney Representation in Delinquency Proceedings ................................................................................................................................... 83
Appendix 18: Most Serious Alleged Offenses by Type .................................................................................................................................................................................. 85
Appendix 19: Most Serious Substantiated Offenses by Type ..................................................................................................................................................................... 87
Appendix 20: Delinquency Dispositions by Age at Disposition ................................................................................................................................................................ 89
Appendix 21: Delinquency Dispositions by School Status .......................................................................................................................................................................... 93
Appendix 22: Delinquency Dispositions by Highest Grade Completed ................................................................................................................................................. 95
Appendix 23: Delinquency Dispositions by Family Status .......................................................................................................................................................................... 97
Appendix 24: Delinquency Dispositions by Living Arrangement of Youth .......................................................................................................................................... 99
Appendix 25: Delinquency Dispositions by Race and Ethnicity ............................................................................................................................................................ 101
Appendix 26: Secure Detention Admissions by Race and Ethnicity..................................................................................................................................................... 103
Appendix 27: Delinquency Placements Including Disposition Reviews, 2013-2017 ................................................................................................................... 105
Appendix 28: Delinquency Placements by Type .......................................................................................................................................................................................... 107
Appendix 29: Outcomes of Delinquency Disposition Reviews ............................................................................................................................................................... 111
Appendix 30: Outcomes of Delinquency Placement Reviews ................................................................................................................................................................. 113
Appendix 31: Delinquency Placement Review Transfers by Type of Placement ........................................................................................................................... 115
Appendix 32: Summary of All Delinquency and Dependency Dispositions ...................................................................................................................................... 119
2 2017 Juvenile Court Annual Report
Chapter 1 - Incoming Cases
Section 1: Delinquency Allegations
1. The unit of count for this section is a written allegation. A written allegation is the document submitted by a law enforcement officer or other person to allege a juvenile has committed an act of delinquency. Multiple allegations may result in a single disposition. Allegations are synonymous with the term ‘case’ in the Pennsylvania Juvenile Case Management System (PaJCMS).
2. Written allegations in this section were filed with a juvenile probation department between January 1, 2017 and December 31, 2017.
3. In Pennsylvania, juvenile court jurisdiction extends over individuals who have been alleged to have committed a delinquent act, as defined by 42. Pa. C. S. § 6301 et seq., on or after their tenth birthday and prior to reaching eighteen years of age. Juvenile court supervision can extend until the individual is twenty-one years of age if the individual is currently under supervision. Age for purposes of this section was calculated from the juvenile’s date of birth to the date of the offense in the written allegation.
4. Data for this report were compiled from PaJCMS on April 6, 2018. The numbers published in this report, therefore, may not reflect current numbers
within the system.
3 2017 Juvenile Court Annual Report
2017 Delinquency Allegations
4 2017 Juvenile Court Annual Report
2017 Delinquency Allegations by County Class
Note: 2017 County Class data retrieved from County Commissioners Association of Pennsylvania at http://www.pacounties.org/PAsCounties/Pages/Counties-by-Class.aspx.
5 2017 Juvenile Court Annual Report
Delinquency Allegations, 2013-2017
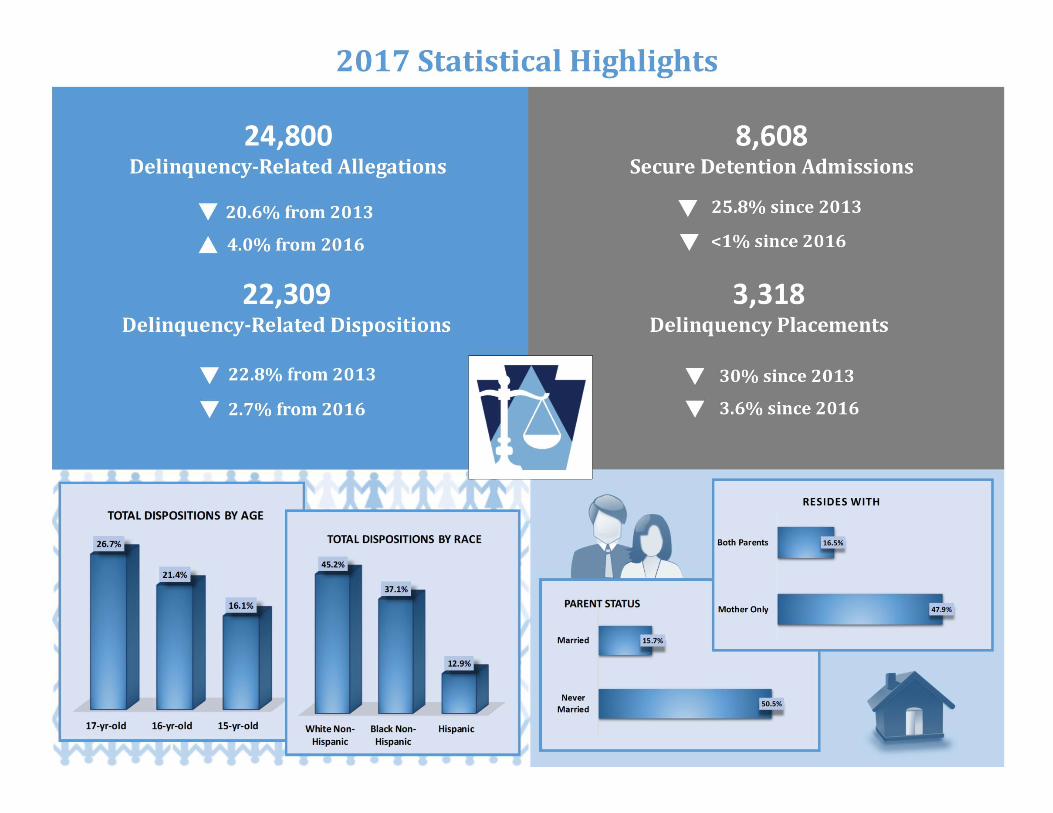
There were 24,800 delinquency-related allegations in Pennsylvania
during 2017. This represents a 20.6% decrease from 2013, but a 4.0%
increase from 2016.
Nearly half (48%) of the total allegations received in 2017 across
Pennsylvania occurred in seven jurisdictions (see map on page 3).
These jurisdictions include: Allegheny, Philadelphia, York, Montgomery,
Delaware, Lancaster, and Dauphin. Each of these seven counties
reported over 1,000 allegations each.
Allegation Rate per Juvenile Population, 2013-2017
Between 2013 and 2017, the rate of juvenile delinquency allegations as a
percent of the Pennsylvania juvenile population declined by 20.0%, from
2.5% to 2.0%.
31,215
28,286
25,66223,852
24,800
15,000
20,000
25,000
30,000
35,000
2013 2014 2015 2016 2017
Delinquency Allegations, 2013 - 2017
2.5%
2.3%
2.1%1.9%
2.0%
1.0%
1.5%
2.0%
2.5%
3.0%
2013 2014 2015 2016 2017
Allegation Rate per Juvenile Population, 2013 - 2017
6 2017 Juvenile Court Annual Report
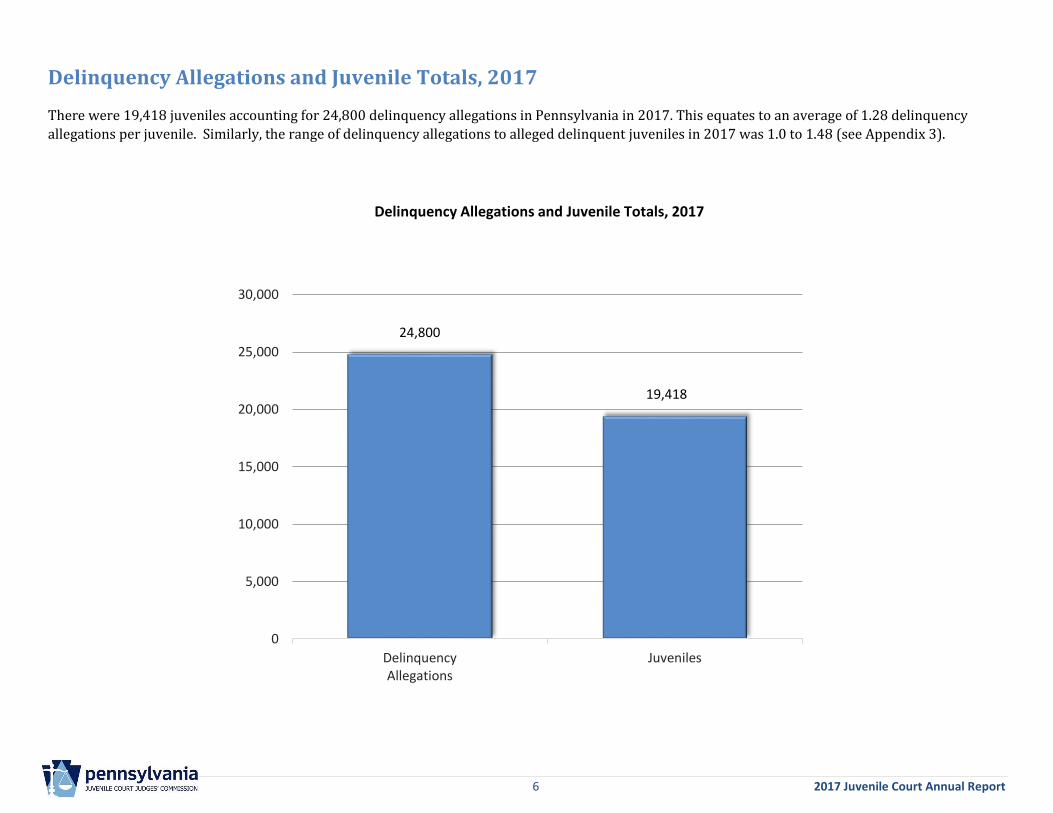
Delinquency Allegations and Juvenile Totals, 2017 There were 19,418 juveniles accounting for 24,800 delinquency allegations in Pennsylvania in 2017. This equates to an average of 1.28 delinquency
allegations per juvenile. Similarly, the range of delinquency allegations to alleged delinquent juveniles in 2017 was 1.0 to 1.48 (see Appendix 3).
24,800
19,418
0
5,000
10,000
15,000
20,000
25,000
30,000
DelinquencyAllegations
Juveniles
Delinquency Allegations and Juvenile Totals, 2017
7 2017 Juvenile Court Annual Report
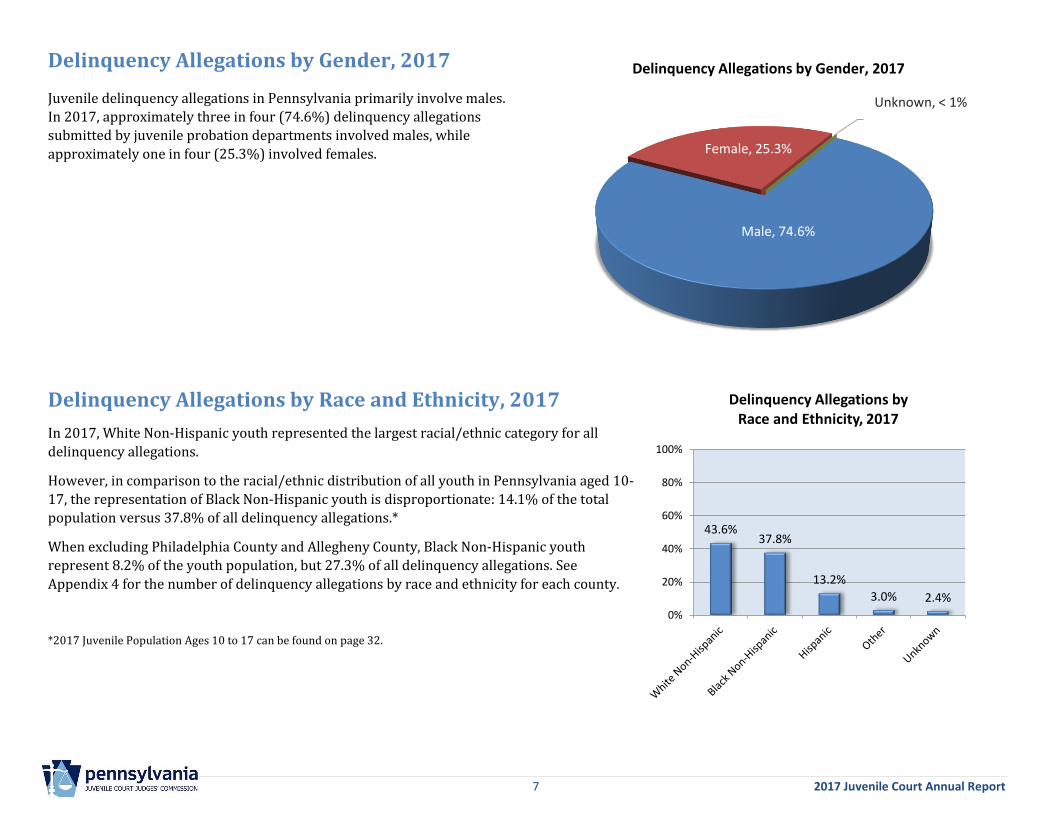
Delinquency Allegations by Gender, 2017 Juvenile delinquency allegations in Pennsylvania primarily involve males.
In 2017, approximately three in four (74.6%) delinquency allegations
submitted by juvenile probation departments involved males, while
approximately one in four (25.3%) involved females.
Delinquency Allegations by Race and Ethnicity, 2017
In 2017, White Non-Hispanic youth represented the largest racial/ethnic category for all
delinquency allegations.
However, in comparison to the racial/ethnic distribution of all youth in Pennsylvania aged 10-
17, the representation of Black Non-Hispanic youth is disproportionate: 14.1% of the total
population versus 37.8% of all delinquency allegations.*
When excluding Philadelphia County and Allegheny County, Black Non-Hispanic youth
represent 8.2% of the youth population, but 27.3% of all delinquency allegations. See
Appendix 4 for the number of delinquency allegations by race and ethnicity for each county.
*2017 Juvenile Population Ages 10 to 17 can be found on page 32.
Male, 74.6%
Female, 25.3%
Unknown, < 1%
Delinquency Allegations by Gender, 2017
43.6%37.8%
13.2%
3.0% 2.4%
0%
20%
40%
60%
80%
100%
Delinquency Allegations byRace and Ethnicity, 2017
8 2017 Juvenile Court Annual Report
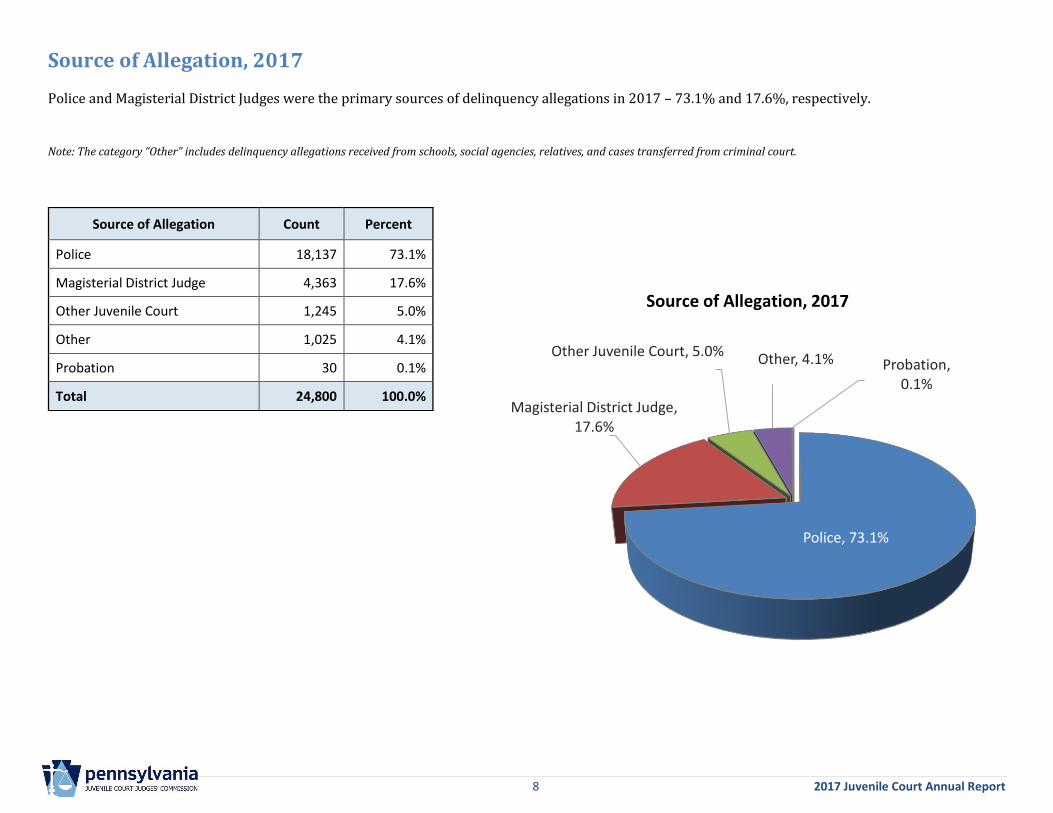
Source of Allegation, 2017 Police and Magisterial District Judges were the primary sources of delinquency allegations in 2017 – 73.1% and 17.6%, respectively.
Note: The category “Other” includes delinquency allegations received from schools, social agencies, relatives, and cases transferred from criminal court.
Source of Allegation Count Percent
Police 18,137 73.1%
Magisterial District Judge 4,363 17.6%
Other Juvenile Court 1,245 5.0%
Other 1,025 4.1%
Probation 30 0.1%
Total 24,800 100.0%
Police, 73.1%
Magisterial District Judge, 17.6%
Other Juvenile Court, 5.0% Other, 4.1% Probation, 0.1%
Source of Allegation, 2017
9 2017 Juvenile Court Annual Report
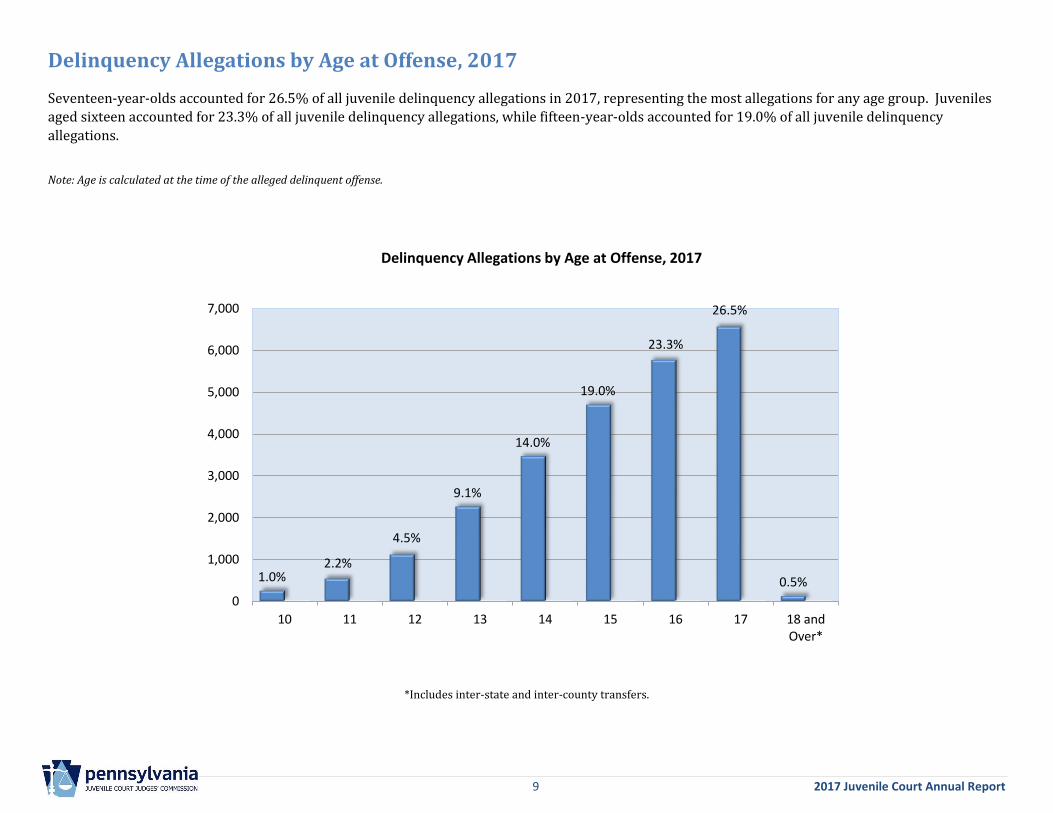
Delinquency Allegations by Age at Offense, 2017 Seventeen-year-olds accounted for 26.5% of all juvenile delinquency allegations in 2017, representing the most allegations for any age group. Juveniles
aged sixteen accounted for 23.3% of all juvenile delinquency allegations, while fifteen-year-olds accounted for 19.0% of all juvenile delinquency
allegations.
Note: Age is calculated at the time of the alleged delinquent offense.
*Includes inter-state and inter-county transfers.
1.0%2.2%
4.5%
9.1%
14.0%
19.0%
23.3%
26.5%
0.5%
0
1,000
2,000
3,000
4,000
5,000
6,000
7,000
10 11 12 13 14 15 16 17 18 andOver*
Delinquency Allegations by Age at Offense, 2017
10 2017 Juvenile Court Annual Report
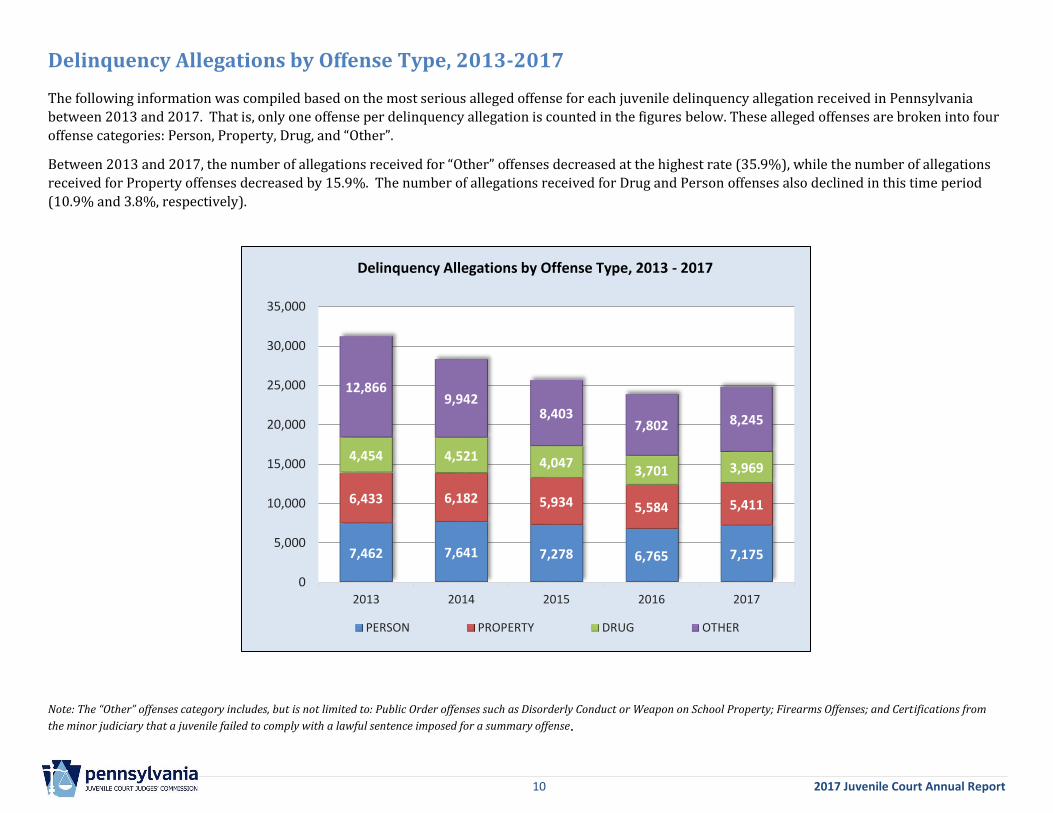
Delinquency Allegations by Offense Type, 2013-2017 The following information was compiled based on the most serious alleged offense for each juvenile delinquency allegation received in Pennsylvania
between 2013 and 2017. That is, only one offense per delinquency allegation is counted in the figures below. These alleged offenses are broken into four
offense categories: Person, Property, Drug, and “Other”.
Between 2013 and 2017, the number of allegations received for “Other” offenses decreased at the highest rate (35.9%), while the number of allegations
received for Property offenses decreased by 15.9%. The number of allegations received for Drug and Person offenses also declined in this time period
(10.9% and 3.8%, respectively).
Note: The “Other” offenses category includes, but is not limited to: Public Order offenses such as Disorderly Conduct or Weapon on School Property; Firearms Offenses; and Certifications from
the minor judiciary that a juvenile failed to comply with a lawful sentence imposed for a summary offense.
7,462 7,641 7,278 6,765 7,175
6,433 6,182 5,934 5,584 5,411
4,454 4,521 4,0473,701 3,969
12,8669,942
8,4037,802 8,245
0
5,000
10,000
15,000
20,000
25,000
30,000
35,000
2013 2014 2015 2016 2017
PERSON PROPERTY DRUG OTHER
Delinquency Allegations by Offense Type, 2013 - 2017
11 2017 Juvenile Court Annual Report
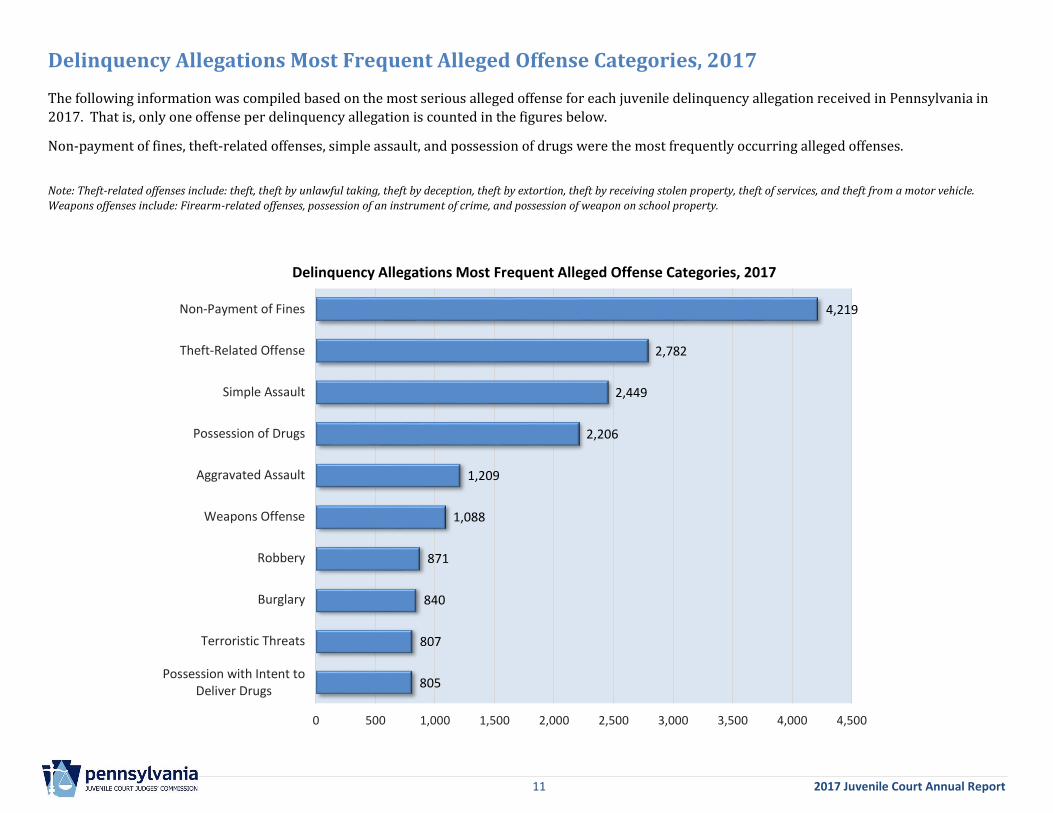
Delinquency Allegations Most Frequent Alleged Offense Categories, 2017 The following information was compiled based on the most serious alleged offense for each juvenile delinquency allegation received in Pennsylvania in
2017. That is, only one offense per delinquency allegation is counted in the figures below.
Non-payment of fines, theft-related offenses, simple assault, and possession of drugs were the most frequently occurring alleged offenses.
Note: Theft-related offenses include: theft, theft by unlawful taking, theft by deception, theft by extortion, theft by receiving stolen property, theft of services, and theft from a motor vehicle.
Weapons offenses include: Firearm-related offenses, possession of an instrument of crime, and possession of weapon on school property.
805
807
840
871
1,088
1,209
2,206
2,449
2,782
4,219
0 500 1,000 1,500 2,000 2,500 3,000 3,500 4,000 4,500
Possession with Intent toDeliver Drugs
Terroristic Threats
Burglary
Robbery
Weapons Offense
Aggravated Assault
Possession of Drugs
Simple Assault
Theft-Related Offense
Non-Payment of Fines
Delinquency Allegations Most Frequent Alleged Offense Categories, 2017
12 2017 Juvenile Court Annual Report
Section 2: Secure Detention
In accordance with the Juvenile Court Judges’ Commission’s Standards Governing Secure Detention, all counties report their secure detention admissions
to the Commission. Detention information was extracted from the secure detention database at the Center for Juvenile Justice Training and Research,
which is populated with data reported directly from juvenile detention centers each month.
When interpreting the data contained in these tables, the reader should note the following:
1) The unit of count is the admission of a juvenile to a secure detention center.
2) A juvenile who is admitted to a secure detention center and subsequently transferred to another secure detention center without release is
counted as two admissions.
Codes Related to JCJC Standards Governing the Use of Secure Detention Under the Juvenile Act
Each month, all juvenile detention centers report a Statement of Facts and Reasons that must accompany every probation-authorized admission to secure detention. Below are the Section Codes related to this process.
100 Codes Circumstances under which secure detention may be authorized on the basis of an alleged offense or on the basis of an alleged
offense and the child’s current status with the court or prior record.
200 Codes Circumstances under which secure detention may be authorized on the basis of a child’s status as an absconder or fugitive; on the basis of a child’s record of failing to appear at previous juvenile proceedings; or because of extraordinary circumstances which require secure detention to prevent a child from absconding.
300 Codes Circumstances under which secure detention may be authorized on the written request of the child or child’s attorney.
400 Codes Circumstances under which secure detention may be ordered pending disposition, subsequent to a finding that a child
committed a delinquent act or is a delinquent child.
500 Codes Circumstances under which secure detention may be ordered following disposition pending transfer to placement.
600 Codes Circumstances under which secure detention may be authorized on the basis of the child’s status, pending or subsequent to a disposition review proceeding.
Code 701 Circumstances under which secure detention may be authorized on the basis of extraordinary and exceptional circumstances.
13 2017 Juvenile Court Annual Report
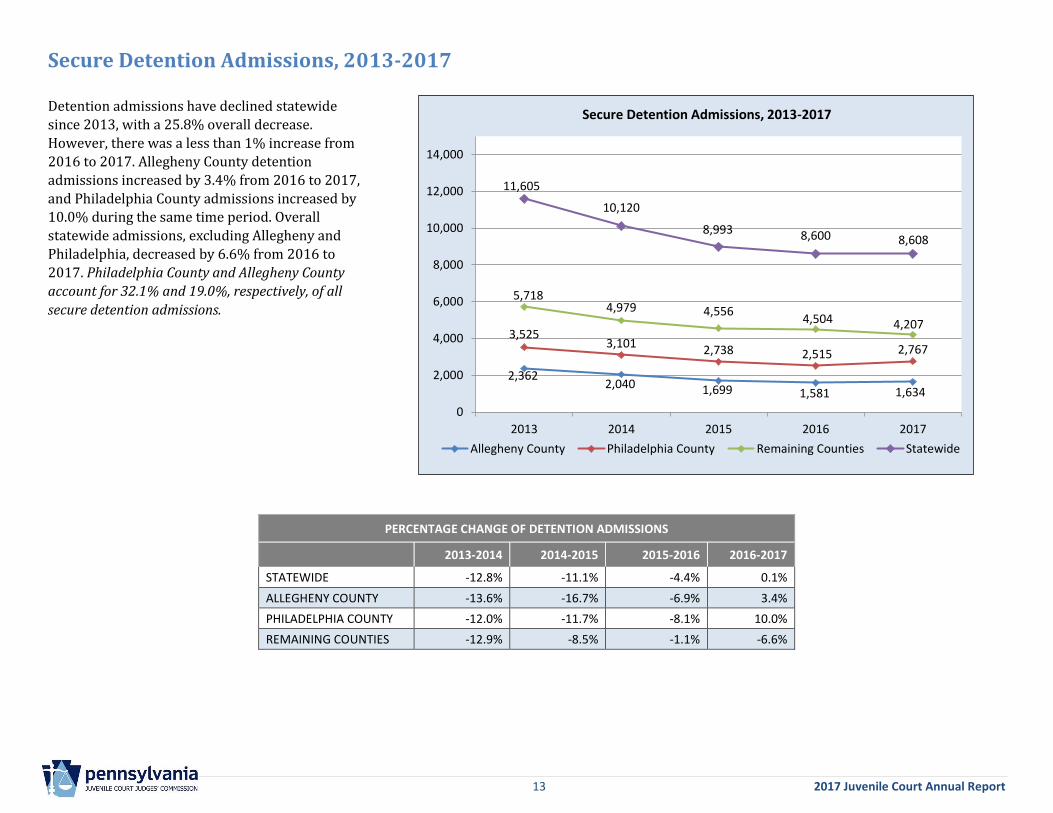
Secure Detention Admissions, 2013-2017
Detention admissions have declined statewide
since 2013, with a 25.8% overall decrease.
However, there was a less than 1% increase from
2016 to 2017. Allegheny County detention
admissions increased by 3.4% from 2016 to 2017,
and Philadelphia County admissions increased by
10.0% during the same time period. Overall
statewide admissions, excluding Allegheny and
Philadelphia, decreased by 6.6% from 2016 to
2017. Philadelphia County and Allegheny County
account for 32.1% and 19.0%, respectively, of all
secure detention admissions.
PERCENTAGE CHANGE OF DETENTION ADMISSIONS
2013-2014 2014-2015 2015-2016 2016-2017
STATEWIDE -12.8% -11.1% -4.4% 0.1%
ALLEGHENY COUNTY -13.6% -16.7% -6.9% 3.4%
PHILADELPHIA COUNTY -12.0% -11.7% -8.1% 10.0%
REMAINING COUNTIES -12.9% -8.5% -1.1% -6.6%
2,3622,040 1,699 1,581 1,634
3,5253,101
2,738 2,515 2,767
5,7184,979 4,556
4,504 4,207
11,605
10,120
8,993 8,600 8,608
0
2,000
4,000
6,000
8,000
10,000
12,000
14,000
2013 2014 2015 2016 2017
Allegheny County Philadelphia County Remaining Counties Statewide
Secure Detention Admissions, 2013-2017
14 2017 Juvenile Court Annual Report
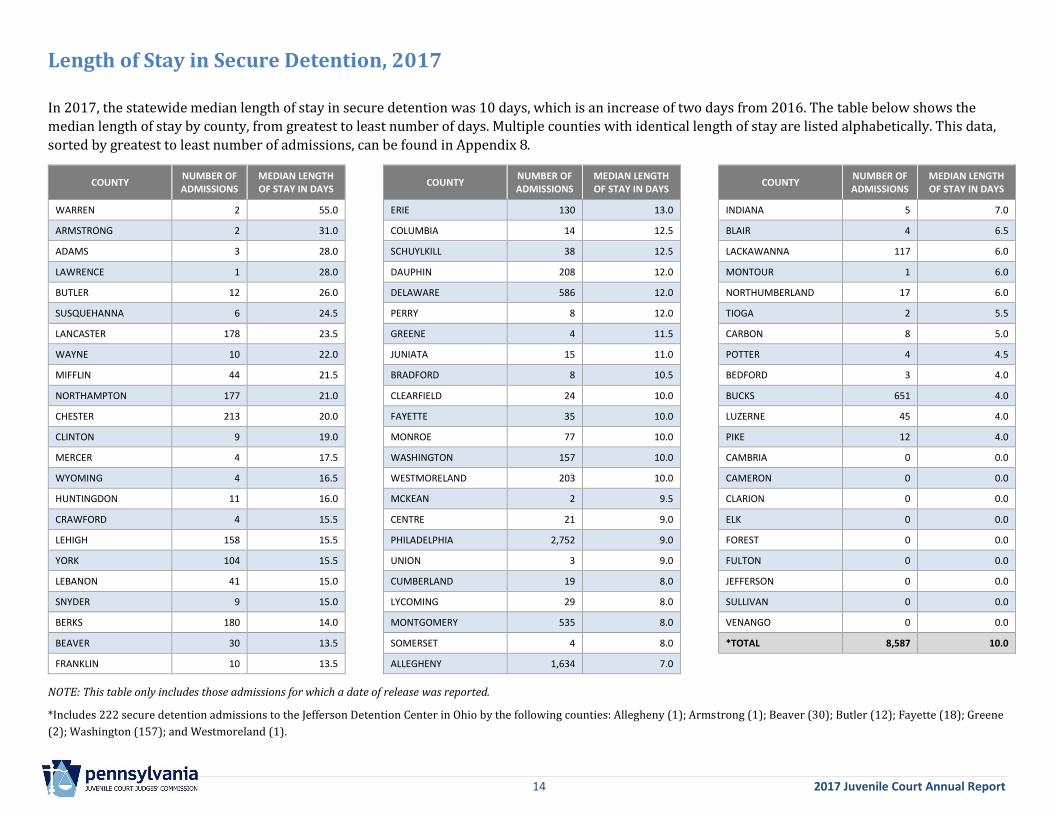
Length of Stay in Secure Detention, 2017
In 2017, the statewide median length of stay in secure detention was 10 days, which is an increase of two days from 2016. The table below shows the
median length of stay by county, from greatest to least number of days. Multiple counties with identical length of stay are listed alphabetically. This data,
sorted by greatest to least number of admissions, can be found in Appendix 8.
COUNTY NUMBER OF ADMISSIONS
MEDIAN LENGTH OF STAY IN DAYS
WARREN 2 55.0
ARMSTRONG 2 31.0
ADAMS 3 28.0
LAWRENCE 1 28.0
BUTLER 12 26.0
SUSQUEHANNA 6 24.5
LANCASTER 178 23.5
WAYNE 10 22.0
MIFFLIN 44 21.5
NORTHAMPTON 177 21.0
CHESTER 213 20.0
CLINTON 9 19.0
MERCER 4 17.5
WYOMING 4 16.5
HUNTINGDON 11 16.0
CRAWFORD 4 15.5
LEHIGH 158 15.5
YORK 104 15.5
LEBANON 41 15.0
SNYDER 9 15.0
BERKS 180 14.0
BEAVER 30 13.5
FRANKLIN 10 13.5
COUNTY NUMBER OF ADMISSIONS
MEDIAN LENGTH OF STAY IN DAYS
ERIE 130 13.0
COLUMBIA 14 12.5
SCHUYLKILL 38 12.5
DAUPHIN 208 12.0
DELAWARE 586 12.0
PERRY 8 12.0
GREENE 4 11.5
JUNIATA 15 11.0
BRADFORD 8 10.5
CLEARFIELD 24 10.0
FAYETTE 35 10.0
MONROE 77 10.0
WASHINGTON 157 10.0
WESTMORELAND 203 10.0
MCKEAN 2 9.5
CENTRE 21 9.0
PHILADELPHIA 2,752 9.0
UNION 3 9.0
CUMBERLAND 19 8.0
LYCOMING 29 8.0
MONTGOMERY 535 8.0
SOMERSET 4 8.0
ALLEGHENY 1,634 7.0
COUNTY NUMBER OF ADMISSIONS
MEDIAN LENGTH OF STAY IN DAYS
INDIANA 5 7.0
BLAIR 4 6.5
LACKAWANNA 117 6.0
MONTOUR 1 6.0
NORTHUMBERLAND 17 6.0
TIOGA 2 5.5
CARBON 8 5.0
POTTER 4 4.5
BEDFORD 3 4.0
BUCKS 651 4.0
LUZERNE 45 4.0
PIKE 12 4.0
CAMBRIA 0 0.0
CAMERON 0 0.0
CLARION 0 0.0
ELK 0 0.0
FOREST 0 0.0
FULTON 0 0.0
JEFFERSON 0 0.0
SULLIVAN 0 0.0
VENANGO 0 0.0
*TOTAL 8,587 10.0
NOTE: This table only includes those admissions for which a date of release was reported.
*Includes 222 secure detention admissions to the Jefferson Detention Center in Ohio by the following counties: Allegheny (1); Armstrong (1); Beaver (30); Butler (12); Fayette (18); Greene
(2); Washington (157); and Westmoreland (1).
15 2017 Juvenile Court Annual Report
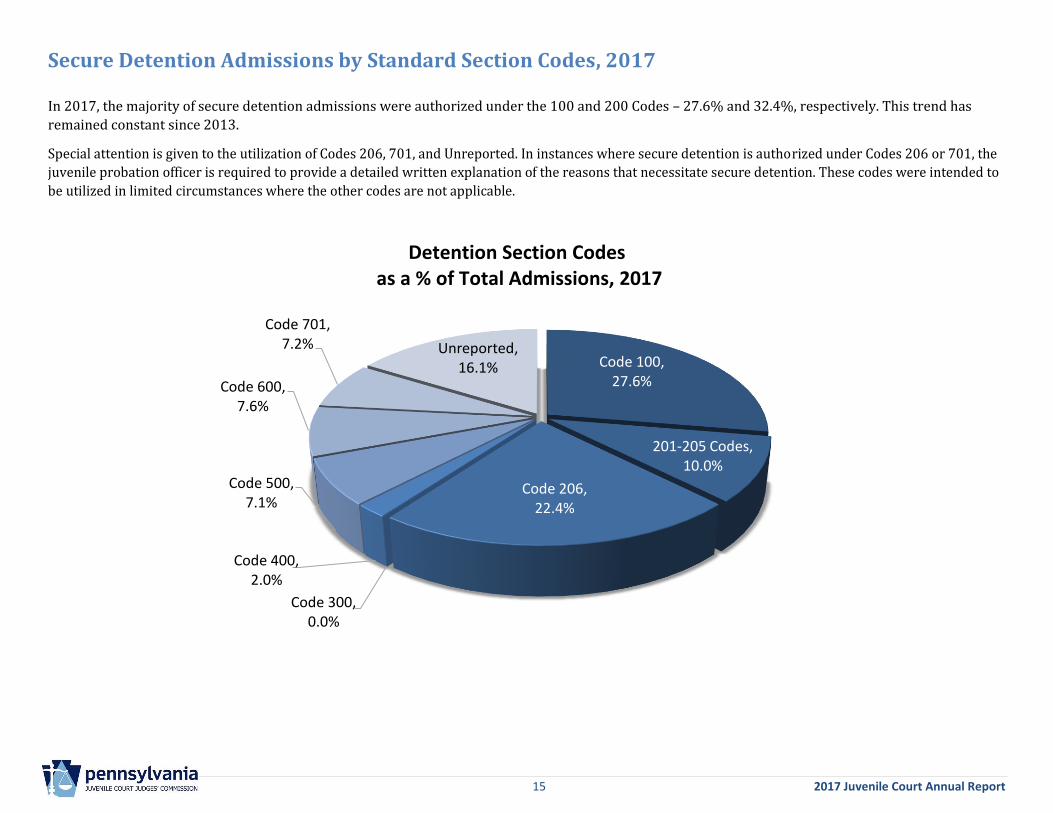
Secure Detention Admissions by Standard Section Codes, 2017
In 2017, the majority of secure detention admissions were authorized under the 100 and 200 Codes – 27.6% and 32.4%, respectively. This trend has
remained constant since 2013.
Special attention is given to the utilization of Codes 206, 701, and Unreported. In instances where secure detention is authorized under Codes 206 or 701, the
juvenile probation officer is required to provide a detailed written explanation of the reasons that necessitate secure detention. These codes were intended to
be utilized in limited circumstances where the other codes are not applicable.
Code 100,27.6%
201-205 Codes,10.0%
Code 206,22.4%
Code 300,0.0%
Code 400,2.0%
Code 500,7.1%
Code 600,7.6%
Code 701,7.2% Unreported,
16.1%
Detention Section Codesas a % of Total Admissions, 2017
16 2017 Juvenile Court Annual Report
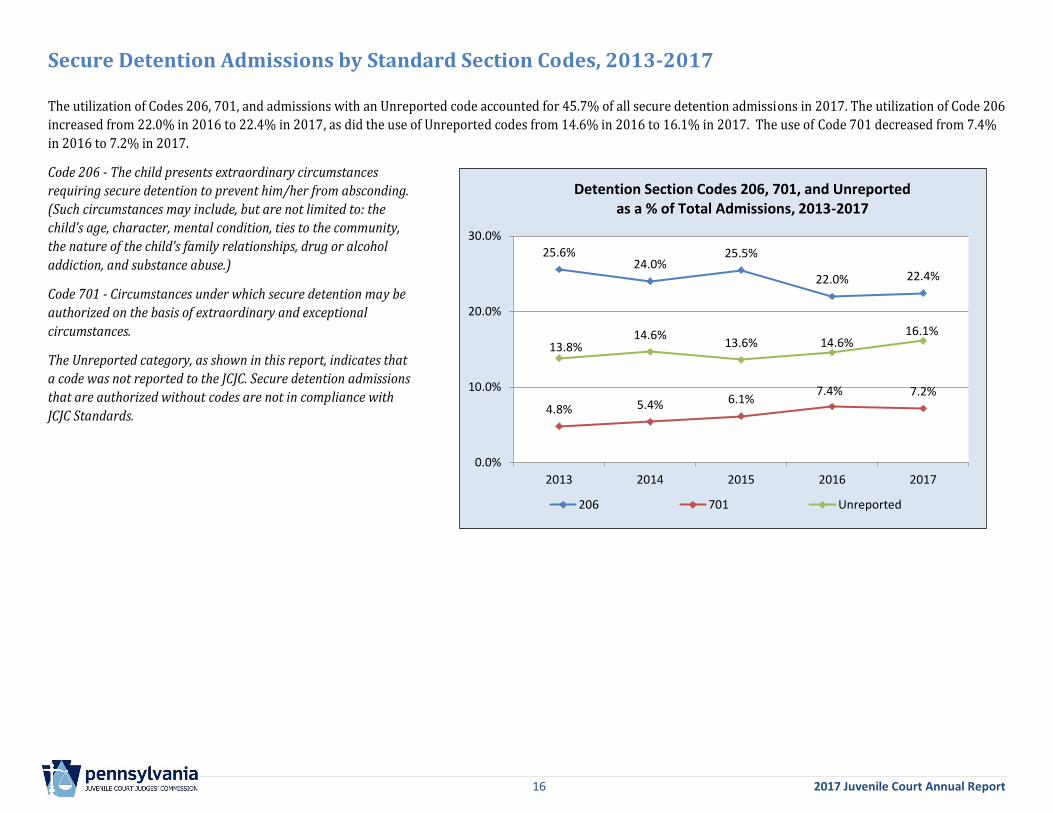
Secure Detention Admissions by Standard Section Codes, 2013-2017 The utilization of Codes 206, 701, and admissions with an Unreported code accounted for 45.7% of all secure detention admissions in 2017. The utilization of Code 206
increased from 22.0% in 2016 to 22.4% in 2017, as did the use of Unreported codes from 14.6% in 2016 to 16.1% in 2017. The use of Code 701 decreased from 7.4%
in 2016 to 7.2% in 2017.
Code 206 - The child presents extraordinary circumstances
requiring secure detention to prevent him/her from absconding.
(Such circumstances may include, but are not limited to: the
child’s age, character, mental condition, ties to the community,
the nature of the child’s family relationships, drug or alcohol
addiction, and substance abuse.)
Code 701 - Circumstances under which secure detention may be
authorized on the basis of extraordinary and exceptional
circumstances.
The Unreported category, as shown in this report, indicates that
a code was not reported to the JCJC. Secure detention admissions
that are authorized without codes are not in compliance with
JCJC Standards.
25.6%24.0%
25.5%
22.0% 22.4%
4.8% 5.4% 6.1%7.4% 7.2%
13.8%14.6%
13.6% 14.6%16.1%
0.0%
10.0%
20.0%
30.0%
2013 2014 2015 2016 2017
206 701 Unreported
Detention Section Codes 206, 701, and Unreported as a % of Total Admissions, 2013-2017
17 2017 Juvenile Court Annual Report
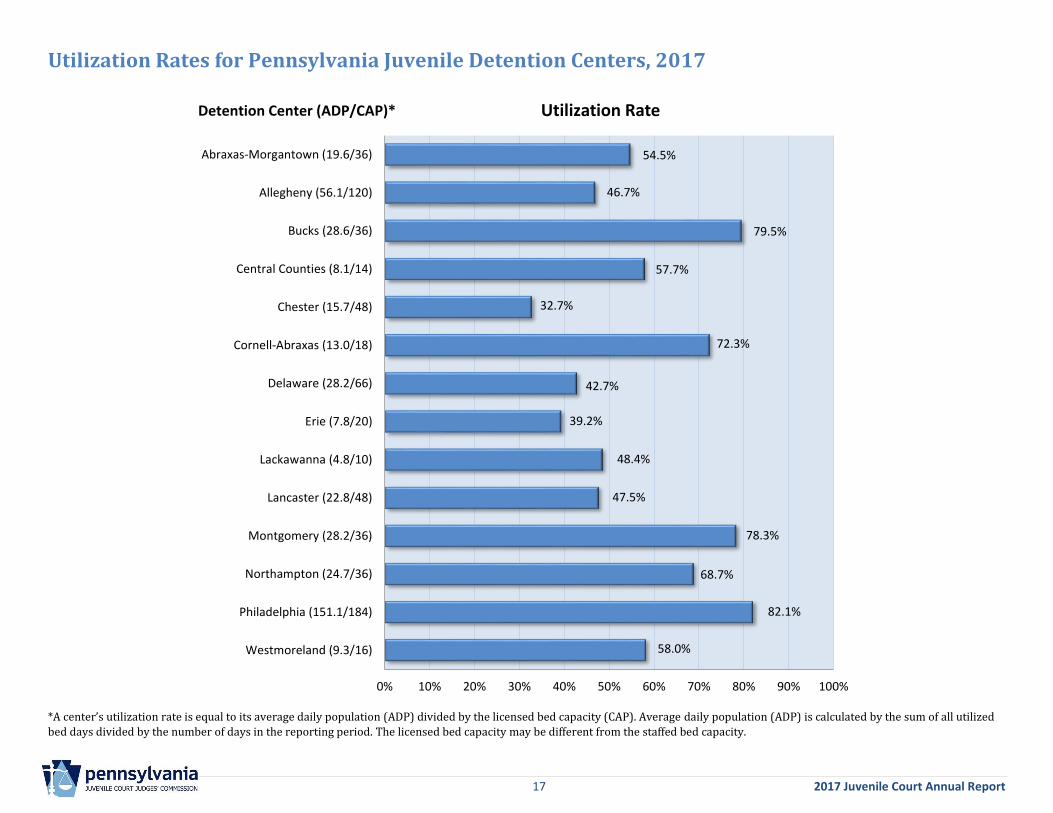
Utilization Rates for Pennsylvania Juvenile Detention Centers, 2017
*A center’s utilization rate is equal to its average daily population (ADP) divided by the licensed bed capacity (CAP). Average daily population (ADP) is calculated by the sum of all utilized
bed days divided by the number of days in the reporting period. The licensed bed capacity may be different from the staffed bed capacity.
58.0%
82.1%
68.7%
78.3%
47.5%
48.4%
39.2%
42.7%
72.3%
32.7%
57.7%
79.5%
46.7%
54.5%
0% 10% 20% 30% 40% 50% 60% 70% 80% 90% 100%
Westmoreland (9.3/16)
Philadelphia (151.1/184)
Northampton (24.7/36)
Montgomery (28.2/36)
Lancaster (22.8/48)
Lackawanna (4.8/10)
Erie (7.8/20)
Delaware (28.2/66)
Cornell-Abraxas (13.0/18)
Chester (15.7/48)
Central Counties (8.1/14)
Bucks (28.6/36)
Allegheny (56.1/120)
Abraxas-Morgantown (19.6/36)
Utilization Rate Detention Center (ADP/CAP)*
18 2017 Juvenile Court Annual Report
Chapter 2: Juvenile Court Processing
Section 1: Delinquency Dispositions
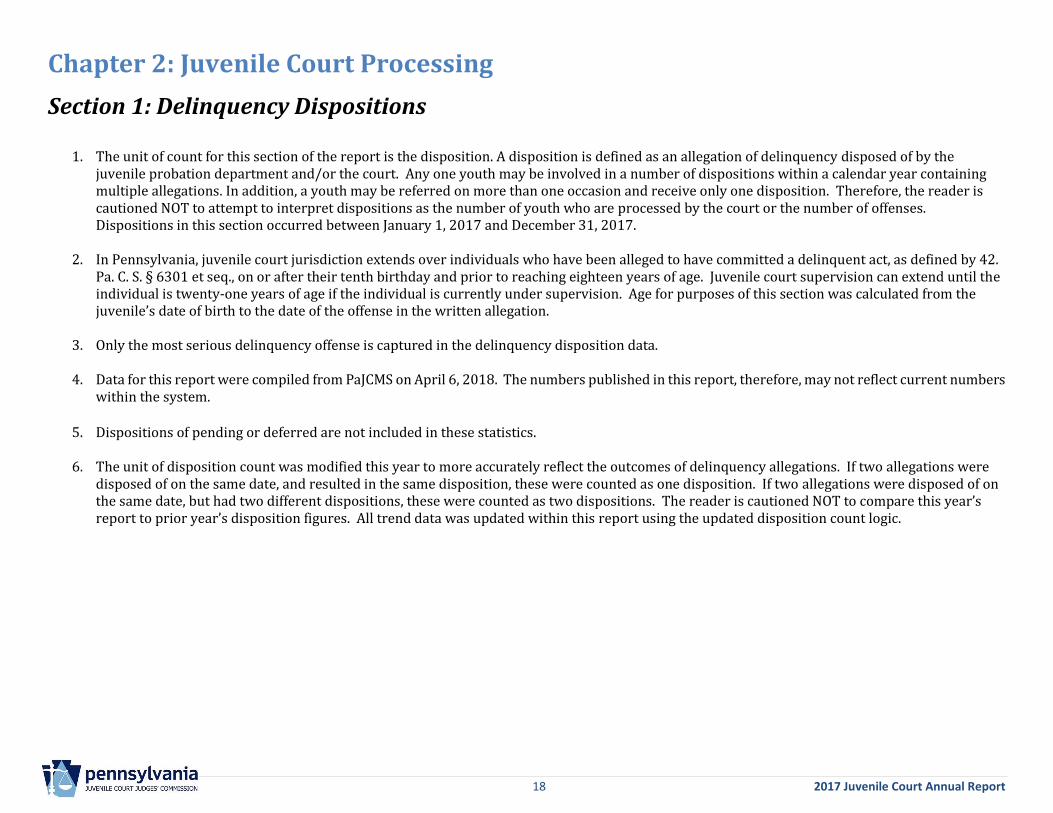
1. The unit of count for this section of the report is the disposition. A disposition is defined as an allegation of delinquency disposed of by the juvenile probation department and/or the court. Any one youth may be involved in a number of dispositions within a calendar year containing multiple allegations. In addition, a youth may be referred on more than one occasion and receive only one disposition. Therefore, the reader is cautioned NOT to attempt to interpret dispositions as the number of youth who are processed by the court or the number of offenses. Dispositions in this section occurred between January 1, 2017 and December 31, 2017.
2. In Pennsylvania, juvenile court jurisdiction extends over individuals who have been alleged to have committed a delinquent act, as defined by 42. Pa. C. S. § 6301 et seq., on or after their tenth birthday and prior to reaching eighteen years of age. Juvenile court supervision can extend until the individual is twenty-one years of age if the individual is currently under supervision. Age for purposes of this section was calculated from the juvenile’s date of birth to the date of the offense in the written allegation.
3. Only the most serious delinquency offense is captured in the delinquency disposition data.
4. Data for this report were compiled from PaJCMS on April 6, 2018. The numbers published in this report, therefore, may not reflect current numbers within the system.
5. Dispositions of pending or deferred are not included in these statistics.
6. The unit of disposition count was modified this year to more accurately reflect the outcomes of delinquency allegations. If two allegations were disposed of on the same date, and resulted in the same disposition, these were counted as one disposition. If two allegations were disposed of on the same date, but had two different dispositions, these were counted as two dispositions. The reader is cautioned NOT to compare this year’s report to prior year’s disposition figures. All trend data was updated within this report using the updated disposition count logic.
19 2017 Juvenile Court Annual Report
2017 Delinquency Dispositions
20 2017 Juvenile Court Annual Report
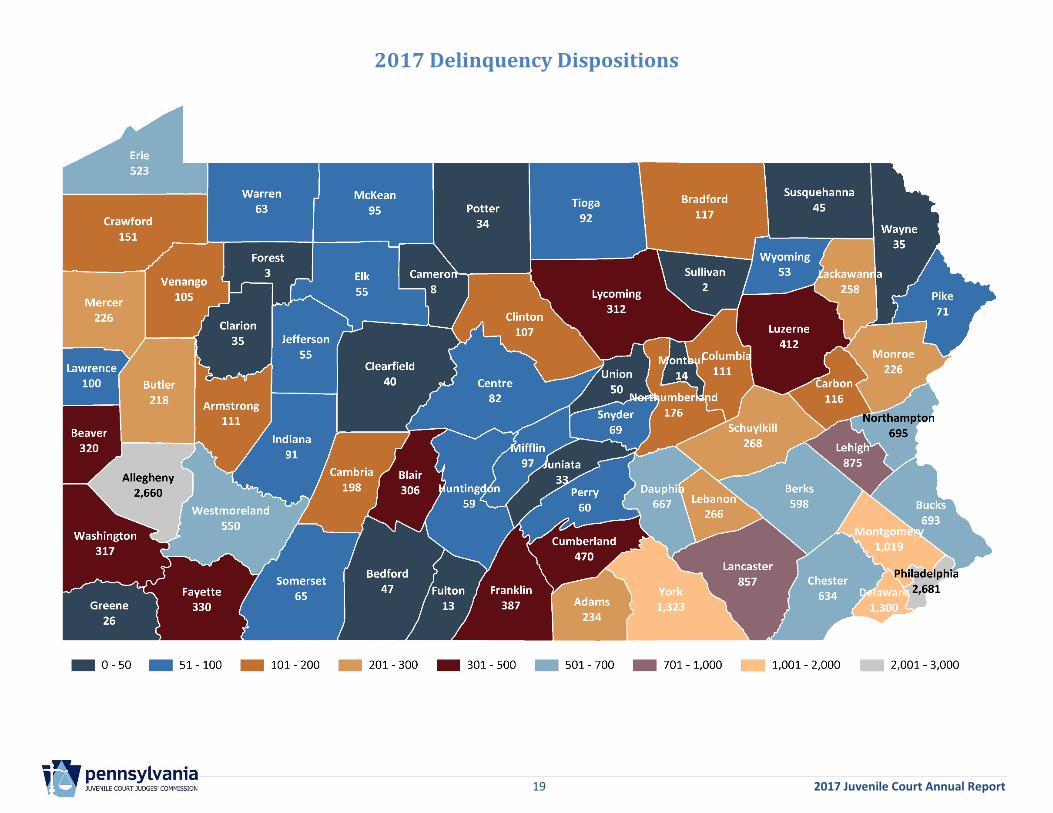
2017 Delinquency Dispositions by County Class
Note: 2017 County Class data retrieved from County Commissioners Association of Pennsylvania at http://www.pacounties.org/PAsCounties/Pages/Counties-by-Class.aspx.
21 2017 Juvenile Court Annual Report
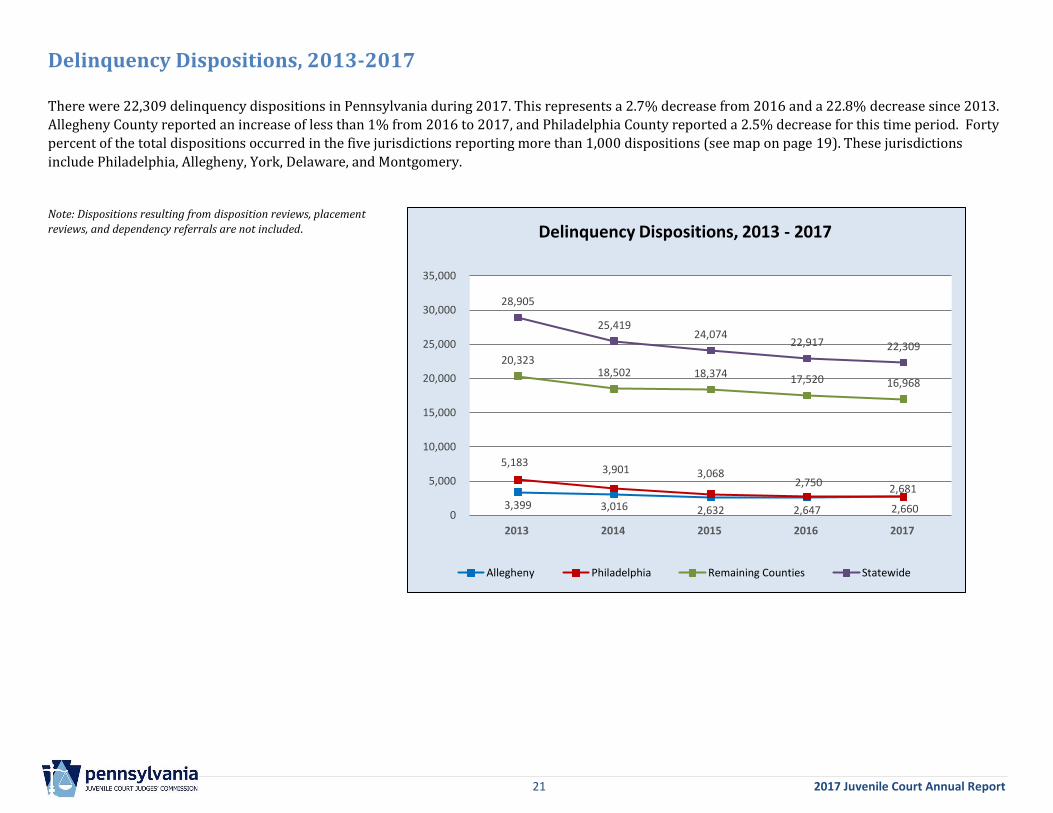
Delinquency Dispositions, 2013-2017
There were 22,309 delinquency dispositions in Pennsylvania during 2017. This represents a 2.7% decrease from 2016 and a 22.8% decrease since 2013.
Allegheny County reported an increase of less than 1% from 2016 to 2017, and Philadelphia County reported a 2.5% decrease for this time period. Forty
percent of the total dispositions occurred in the five jurisdictions reporting more than 1,000 dispositions (see map on page 19). These jurisdictions
include Philadelphia, Allegheny, York, Delaware, and Montgomery.
Note: Dispositions resulting from disposition reviews, placement
reviews, and dependency referrals are not included.
3,399 3,016 2,632 2,647 2,660
5,183 3,901 3,068
2,750 2,681
20,323 18,502 18,374 17,520 16,968
28,905
25,419 24,074
22,917 22,309
0
5,000
10,000
15,000
20,000
25,000
30,000
35,000
2013 2014 2015 2016 2017
Allegheny Philadelphia Remaining Counties Statewide
Delinquency Dispositions, 2013 - 2017
22 2017 Juvenile Court Annual Report
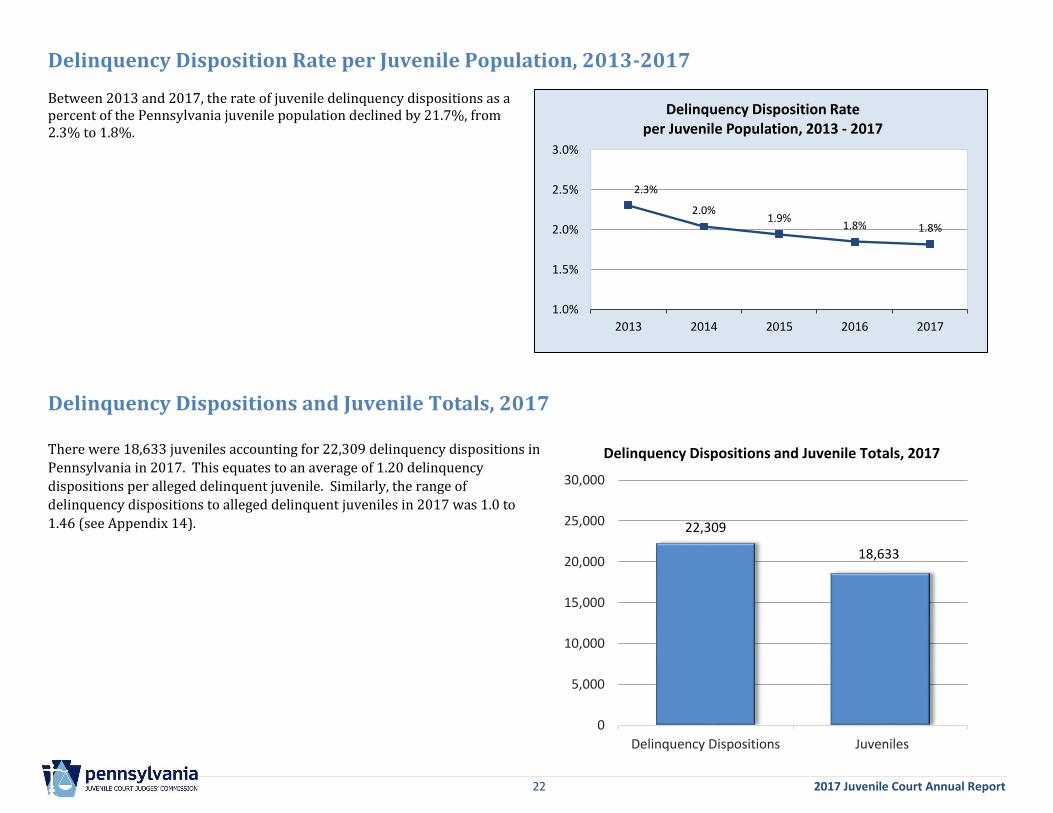
Delinquency Disposition Rate per Juvenile Population, 2013-2017 Between 2013 and 2017, the rate of juvenile delinquency dispositions as a percent of the Pennsylvania juvenile population declined by 21.7%, from 2.3% to 1.8%.
Delinquency Dispositions and Juvenile Totals, 2017
There were 18,633 juveniles accounting for 22,309 delinquency dispositions in
Pennsylvania in 2017. This equates to an average of 1.20 delinquency
dispositions per alleged delinquent juvenile. Similarly, the range of
delinquency dispositions to alleged delinquent juveniles in 2017 was 1.0 to
1.46 (see Appendix 14).
2.3%
2.0%1.9%
1.8% 1.8%
1.0%
1.5%
2.0%
2.5%
3.0%
2013 2014 2015 2016 2017
Delinquency Disposition Rateper Juvenile Population, 2013 - 2017
22,309
18,633
0
5,000
10,000
15,000
20,000
25,000
30,000
Delinquency Dispositions Juveniles
Delinquency Dispositions and Juvenile Totals, 2017
23 2017 Juvenile Court Annual Report
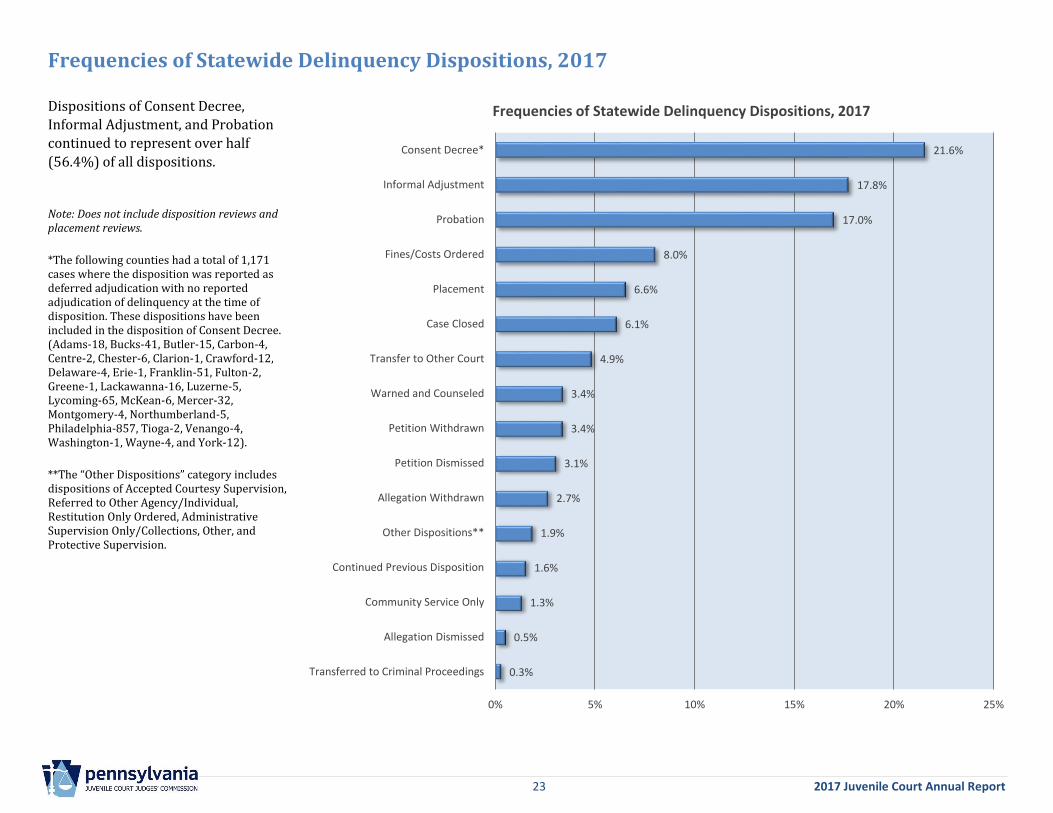
Frequencies of Statewide Delinquency Dispositions, 2017
Dispositions of Consent Decree,
Informal Adjustment, and Probation
continued to represent over half
(56.4%) of all dispositions.
Note: Does not include disposition reviews and placement reviews.
*The following counties had a total of 1,171 cases where the disposition was reported as deferred adjudication with no reported adjudication of delinquency at the time of disposition. These dispositions have been included in the disposition of Consent Decree. (Adams-18, Bucks-41, Butler-15, Carbon-4, Centre-2, Chester-6, Clarion-1, Crawford-12, Delaware-4, Erie-1, Franklin-51, Fulton-2, Greene-1, Lackawanna-16, Luzerne-5, Lycoming-65, McKean-6, Mercer-32, Montgomery-4, Northumberland-5, Philadelphia-857, Tioga-2, Venango-4, Washington-1, Wayne-4, and York-12).
**The “Other Dispositions” category includes dispositions of Accepted Courtesy Supervision, Referred to Other Agency/Individual, Restitution Only Ordered, Administrative Supervision Only/Collections, Other, and Protective Supervision.
0.3%
0.5%
1.3%
1.6%
1.9%
2.7%
3.1%
3.4%
3.4%
4.9%
6.1%
6.6%
8.0%
17.0%
17.8%
21.6%
0% 5% 10% 15% 20% 25%
Transferred to Criminal Proceedings
Allegation Dismissed
Community Service Only
Continued Previous Disposition
Other Dispositions**
Allegation Withdrawn
Petition Dismissed
Petition Withdrawn
Warned and Counseled
Transfer to Other Court
Case Closed
Placement
Fines/Costs Ordered
Probation
Informal Adjustment
Consent Decree*
Frequencies of Statewide Delinquency Dispositions, 2017
24 2017 Juvenile Court Annual Report
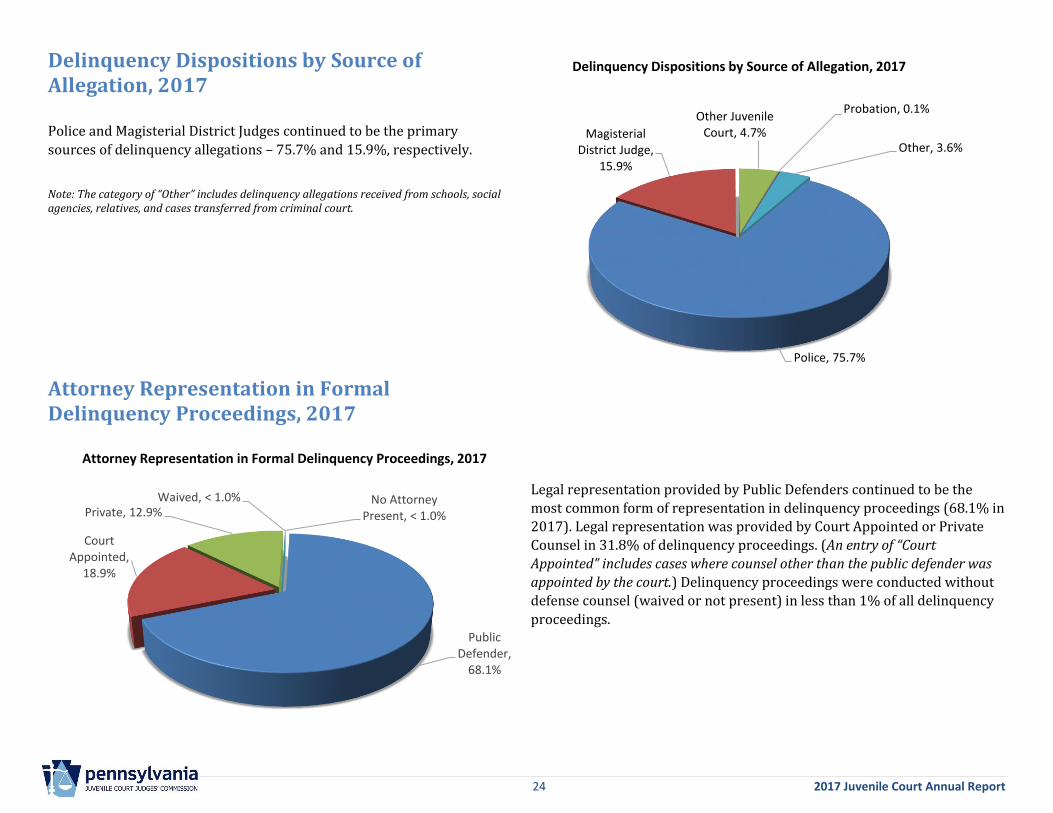
Delinquency Dispositions by Source of Allegation, 2017
Police and Magisterial District Judges continued to be the primary
sources of delinquency allegations – 75.7% and 15.9%, respectively.
Note: The category of “Other” includes delinquency allegations received from schools, social agencies, relatives, and cases transferred from criminal court.
Attorney Representation in Formal Delinquency Proceedings, 2017
Legal representation provided by Public Defenders continued to be the
most common form of representation in delinquency proceedings (68.1% in
2017). Legal representation was provided by Court Appointed or Private
Counsel in 31.8% of delinquency proceedings. (An entry of “Court
Appointed” includes cases where counsel other than the public defender was
appointed by the court.) Delinquency proceedings were conducted without
defense counsel (waived or not present) in less than 1% of all delinquency
proceedings.
Police, 75.7%
Magisterial District Judge,
15.9%
Other Juvenile Court, 4.7%
Probation, 0.1%
Other, 3.6%
Delinquency Dispositions by Source of Allegation, 2017
Public Defender,
68.1%
Court Appointed,
18.9%
Private, 12.9%Waived, < 1.0% No Attorney
Present, < 1.0%
Attorney Representation in Formal Delinquency Proceedings, 2017
25 2017 Juvenile Court Annual Report
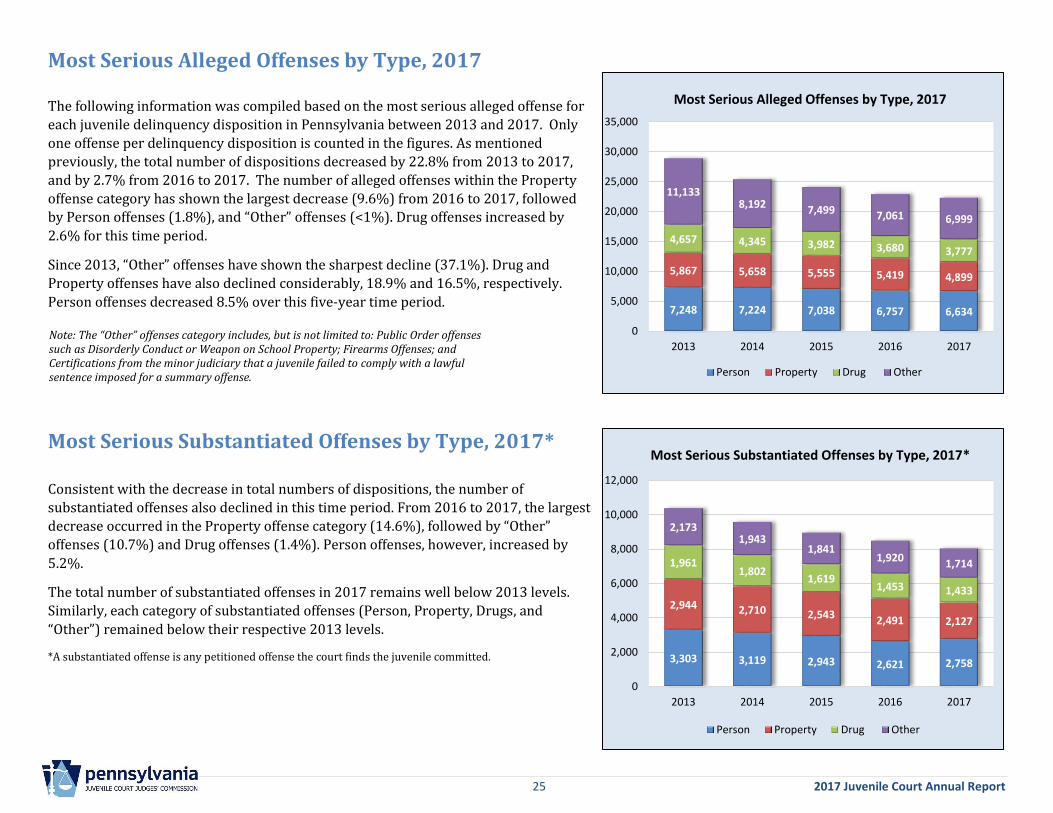
Most Serious Alleged Offenses by Type, 2017
The following information was compiled based on the most serious alleged offense for
each juvenile delinquency disposition in Pennsylvania between 2013 and 2017. Only
one offense per delinquency disposition is counted in the figures. As mentioned
previously, the total number of dispositions decreased by 22.8% from 2013 to 2017,
and by 2.7% from 2016 to 2017. The number of alleged offenses within the Property
offense category has shown the largest decrease (9.6%) from 2016 to 2017, followed
by Person offenses (1.8%), and “Other” offenses (<1%). Drug offenses increased by
2.6% for this time period.
Since 2013, “Other” offenses have shown the sharpest decline (37.1%). Drug and
Property offenses have also declined considerably, 18.9% and 16.5%, respectively.
Person offenses decreased 8.5% over this five-year time period.
Most Serious Substantiated Offenses by Type, 2017*
Consistent with the decrease in total numbers of dispositions, the number of
substantiated offenses also declined in this time period. From 2016 to 2017, the largest
decrease occurred in the Property offense category (14.6%), followed by “Other”
offenses (10.7%) and Drug offenses (1.4%). Person offenses, however, increased by
5.2%.
The total number of substantiated offenses in 2017 remains well below 2013 levels.
Similarly, each category of substantiated offenses (Person, Property, Drugs, and
“Other”) remained below their respective 2013 levels.
*A substantiated offense is any petitioned offense the court finds the juvenile committed.
Note: The “Other” offenses category includes, but is not limited to: Public Order offenses such as Disorderly Conduct or Weapon on School Property; Firearms Offenses; and Certifications from the minor judiciary that a juvenile failed to comply with a lawful sentence imposed for a summary offense.
7,248 7,224 7,038 6,757 6,634
5,867 5,658 5,555 5,419 4,899
4,657 4,345 3,982 3,680 3,777
11,1338,192 7,499 7,061 6,999
0
5,000
10,000
15,000
20,000
25,000
30,000
35,000
2013 2014 2015 2016 2017
Person Property Drug Other
Most Serious Alleged Offenses by Type, 2017
3,303 3,119 2,943 2,621 2,758
2,944 2,710 2,543 2,491 2,127
1,9611,802
1,6191,453 1,433
2,1731,943
1,8411,920
1,714
0
2,000
4,000
6,000
8,000
10,000
12,000
2013 2014 2015 2016 2017
Person Property Drug Other
Most Serious Substantiated Offenses by Type, 2017*
26 2017 Juvenile Court Annual Report
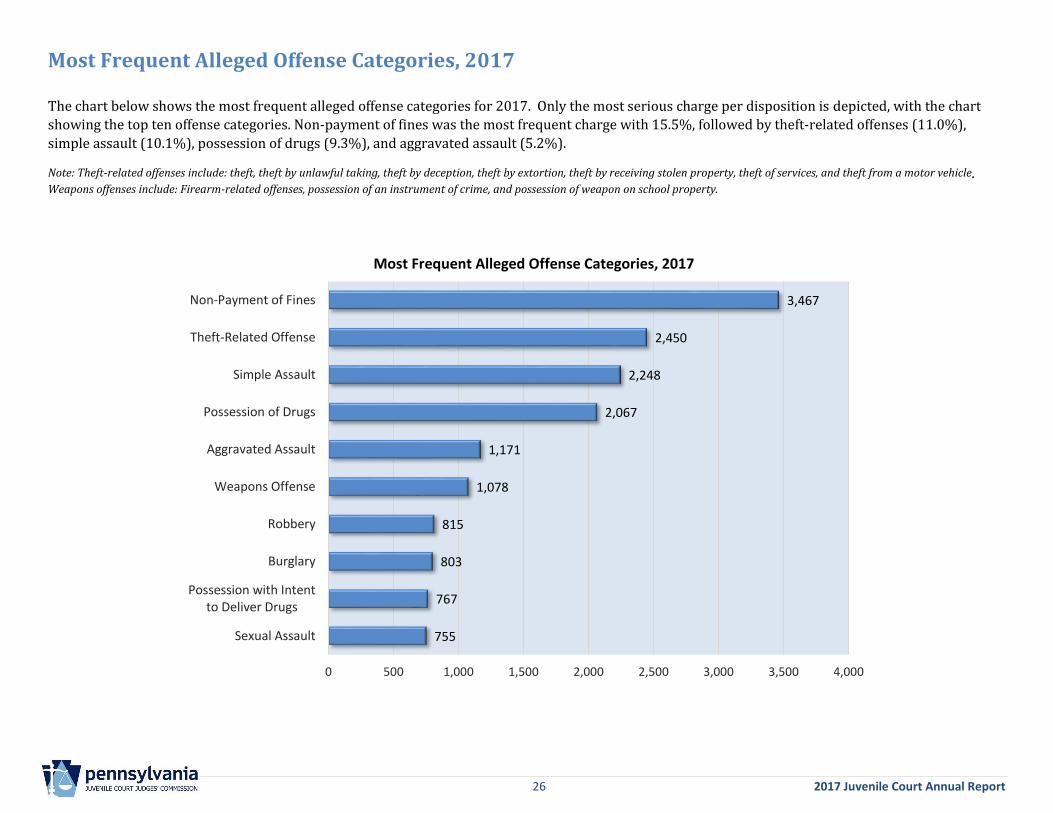
Most Frequent Alleged Offense Categories, 2017
The chart below shows the most frequent alleged offense categories for 2017. Only the most serious charge per disposition is depicted, with the chart
showing the top ten offense categories. Non-payment of fines was the most frequent charge with 15.5%, followed by theft-related offenses (11.0%),
simple assault (10.1%), possession of drugs (9.3%), and aggravated assault (5.2%).
Note: Theft-related offenses include: theft, theft by unlawful taking, theft by deception, theft by extortion, theft by receiving stolen property, theft of services, and theft from a motor vehicle. Weapons offenses include: Firearm-related offenses, possession of an instrument of crime, and possession of weapon on school property.
755
767
803
815
1,078
1,171
2,067
2,248
2,450
3,467
0 500 1,000 1,500 2,000 2,500 3,000 3,500 4,000
Sexual Assault
Possession with Intentto Deliver Drugs
Burglary
Robbery
Weapons Offense
Aggravated Assault
Possession of Drugs
Simple Assault
Theft-Related Offense
Non-Payment of Fines
Most Frequent Alleged Offense Categories, 2017
27 2017 Juvenile Court Annual Report
Section 2: Demographics
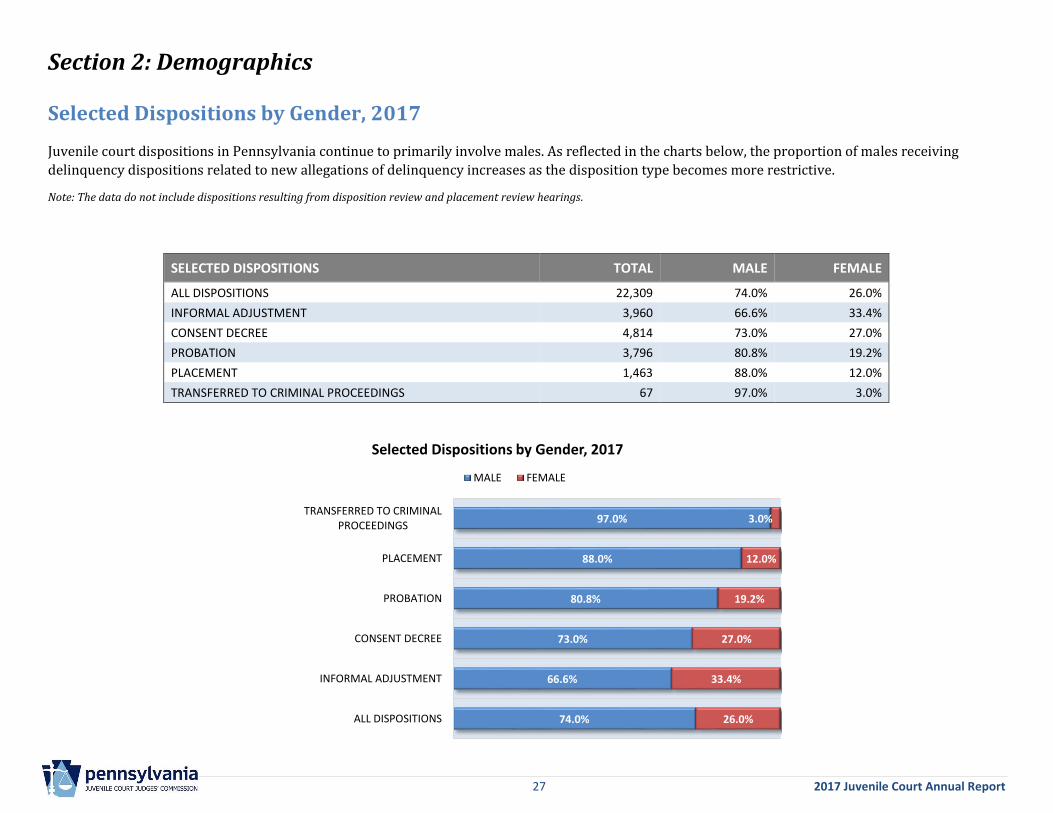
Selected Dispositions by Gender, 2017 Juvenile court dispositions in Pennsylvania continue to primarily involve males. As reflected in the charts below, the proportion of males receiving
delinquency dispositions related to new allegations of delinquency increases as the disposition type becomes more restrictive.
Note: The data do not include dispositions resulting from disposition review and placement review hearings.
SELECTED DISPOSITIONS TOTAL MALE FEMALE
ALL DISPOSITIONS 22,309 74.0% 26.0%
INFORMAL ADJUSTMENT 3,960 66.6% 33.4%
CONSENT DECREE 4,814 73.0% 27.0%
PROBATION 3,796 80.8% 19.2%
PLACEMENT 1,463 88.0% 12.0%
TRANSFERRED TO CRIMINAL PROCEEDINGS 67 97.0% 3.0%
74.0%
66.6%
73.0%
80.8%
88.0%
97.0%
26.0%
33.4%
27.0%
19.2%
12.0%
3.0%
ALL DISPOSITIONS
INFORMAL ADJUSTMENT
CONSENT DECREE
PROBATION
PLACEMENT
TRANSFERRED TO CRIMINAL PROCEEDINGS
Selected Dispositions by Gender, 2017
MALE FEMALE
28 2017 Juvenile Court Annual Report
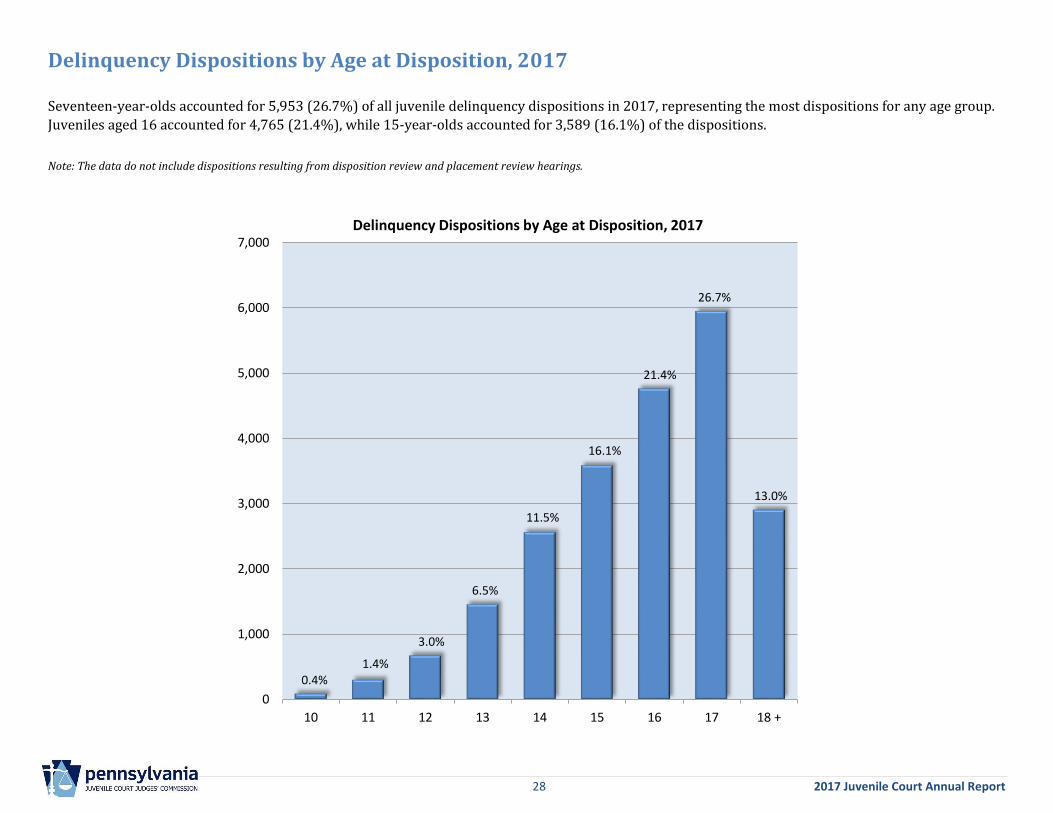
Delinquency Dispositions by Age at Disposition, 2017
Seventeen-year-olds accounted for 5,953 (26.7%) of all juvenile delinquency dispositions in 2017, representing the most dispositions for any age group.
Juveniles aged 16 accounted for 4,765 (21.4%), while 15-year-olds accounted for 3,589 (16.1%) of the dispositions.
Note: The data do not include dispositions resulting from disposition review and placement review hearings.
0.4%1.4%
3.0%
6.5%
11.5%
16.1%
21.4%
26.7%
13.0%
0
1,000
2,000
3,000
4,000
5,000
6,000
7,000
10 11 12 13 14 15 16 17 18 +
Delinquency Dispositions by Age at Disposition, 2017
29 2017 Juvenile Court Annual Report
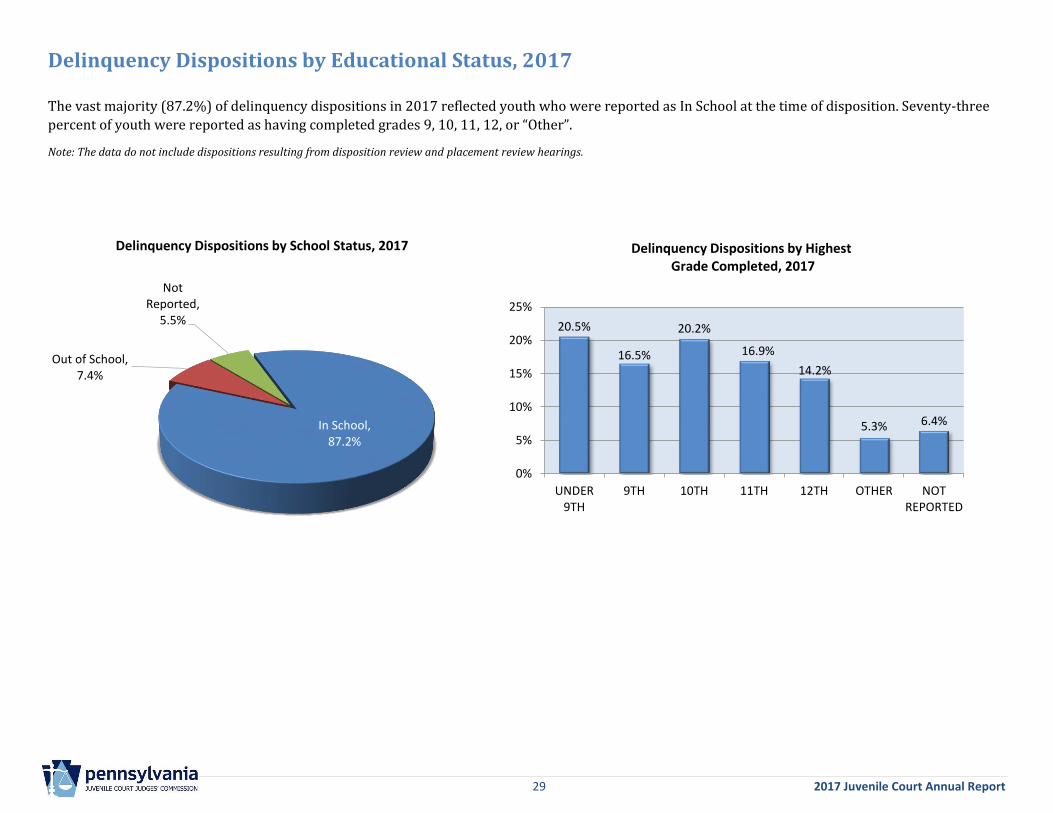
Delinquency Dispositions by Educational Status, 2017
The vast majority (87.2%) of delinquency dispositions in 2017 reflected youth who were reported as In School at the time of disposition. Seventy-three
percent of youth were reported as having completed grades 9, 10, 11, 12, or “Other”.
Note: The data do not include dispositions resulting from disposition review and placement review hearings.
In School,87.2%
Out of School,7.4%
Not Reported,
5.5%
Delinquency Dispositions by School Status, 2017
20.5%
16.5%
20.2%
16.9%
14.2%
5.3% 6.4%
0%
5%
10%
15%
20%
25%
UNDER9TH
9TH 10TH 11TH 12TH OTHER NOTREPORTED
Delinquency Dispositions by Highest Grade Completed, 2017
30 2017 Juvenile Court Annual Report
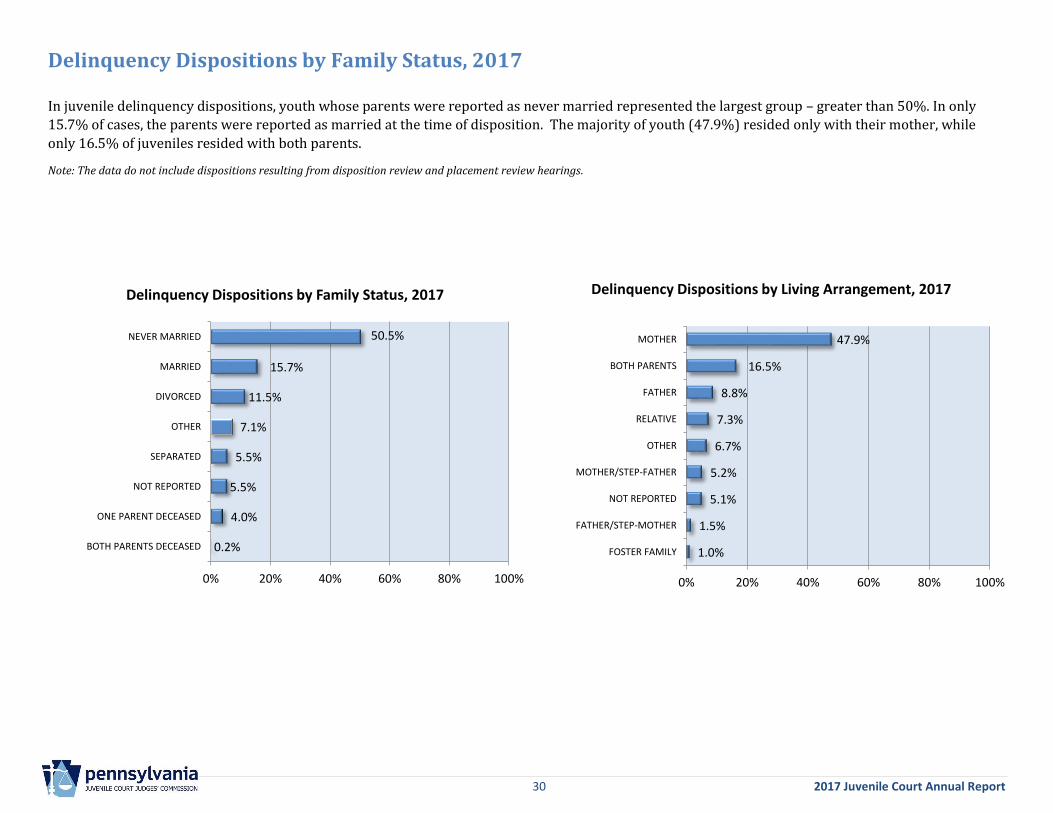
Delinquency Dispositions by Family Status, 2017
In juvenile delinquency dispositions, youth whose parents were reported as never married represented the largest group – greater than 50%. In only
15.7% of cases, the parents were reported as married at the time of disposition. The majority of youth (47.9%) resided only with their mother, while
only 16.5% of juveniles resided with both parents.
Note: The data do not include dispositions resulting from disposition review and placement review hearings.
0.2%
4.0%
5.5%
5.5%
7.1%
11.5%
15.7%
50.5%
0% 20% 40% 60% 80% 100%
BOTH PARENTS DECEASED
ONE PARENT DECEASED
NOT REPORTED
SEPARATED
OTHER
DIVORCED
MARRIED
NEVER MARRIED
Delinquency Dispositions by Family Status, 2017
1.0%
1.5%
5.1%
5.2%
6.7%
7.3%
8.8%
16.5%
47.9%
0% 20% 40% 60% 80% 100%
FOSTER FAMILY
FATHER/STEP-MOTHER
NOT REPORTED
MOTHER/STEP-FATHER
OTHER
RELATIVE
FATHER
BOTH PARENTS
MOTHER
Delinquency Dispositions by Living Arrangement, 2017
31 2017 Juvenile Court Annual Report
Section 3: Race and Ethnicity
On the following pages, data on race and ethnicity trends related to juvenile court dispositions are provided. A few points of clarification regarding the
reading and interpretation of this data should be noted.
The Juvenile Court Judges’ Commission’s Center for Juvenile Justice Training and Research collects data on race and ethnicity from each of Pennsylvania’s
67 counties. The collection of this data is done in concert with the protocols outlined in Guidelines for Collecting & Recording the Race and Ethnicity of
Juveniles in Conjunction with Juvenile Delinquency Disposition Reporting to the Juvenile Court Judges’ Commission (National Center for Juvenile Justice,
2006). As such, race and ethnicity are collected and recorded as two separate and distinct sets of data.
Trends related to both race and ethnicity are presented within the following charts, graphs, and tables. References to racial or ethnic groups are defined
as follows:
White Non-Hispanic reported as Non-Hispanic for ethnicity and White for race
Black Non-Hispanic reported as Non-Hispanic for ethnicity and Black for race
Hispanic reported as Hispanic for ethnicity regardless of reported race
Other and Unknown reported as Non-Hispanic for ethnicity and one of the following races: Asian, Pacific Islander, Native Hawaiian, Native Alaskan, Native American or Multi-Racial; or race and ethnicity was reported as unknown
32 2017 Juvenile Court Annual Report
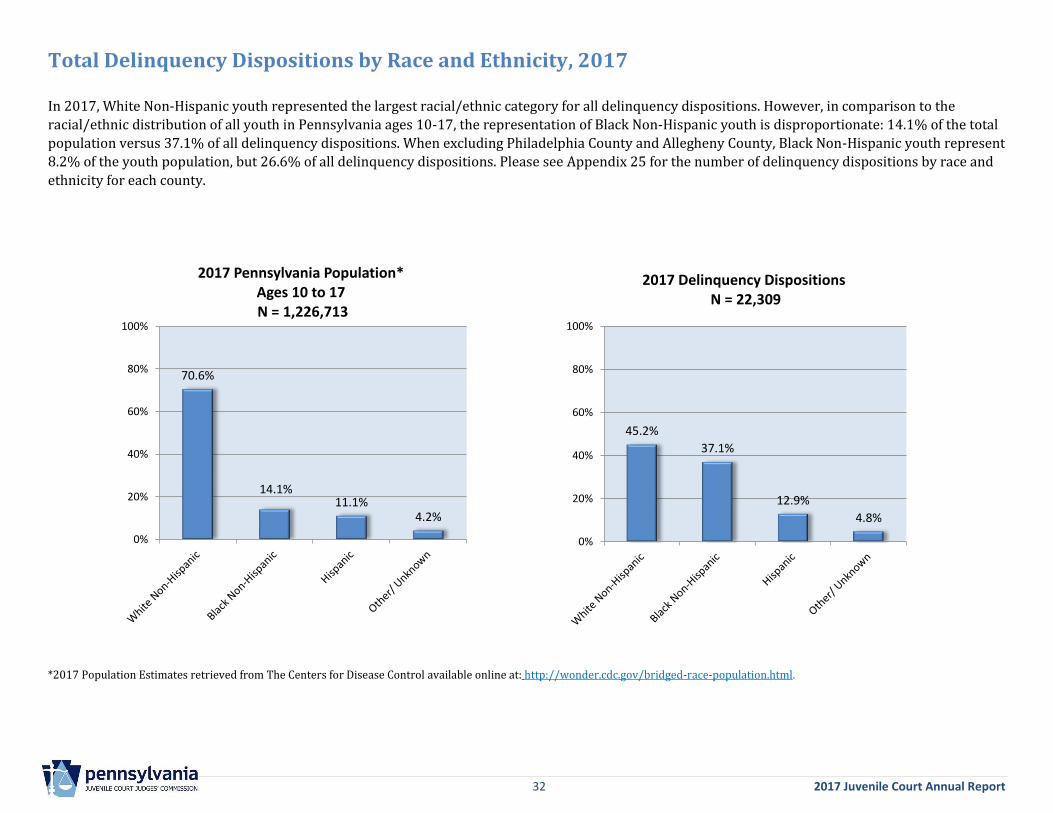
Total Delinquency Dispositions by Race and Ethnicity, 2017
In 2017, White Non-Hispanic youth represented the largest racial/ethnic category for all delinquency dispositions. However, in comparison to the
racial/ethnic distribution of all youth in Pennsylvania ages 10-17, the representation of Black Non-Hispanic youth is disproportionate: 14.1% of the total
population versus 37.1% of all delinquency dispositions. When excluding Philadelphia County and Allegheny County, Black Non-Hispanic youth represent
8.2% of the youth population, but 26.6% of all delinquency dispositions. Please see Appendix 25 for the number of delinquency dispositions by race and
ethnicity for each county.
*2017 Population Estimates retrieved from The Centers for Disease Control available online at: http://wonder.cdc.gov/bridged-race-population.html.
70.6%
14.1%11.1%
4.2%
0%
20%
40%
60%
80%
100%
2017 Pennsylvania Population* Ages 10 to 17N = 1,226,713
45.2%
37.1%
12.9%
4.8%
0%
20%
40%
60%
80%
100%
2017 Delinquency DispositionsN = 22,309
33 2017 Juvenile Court Annual Report
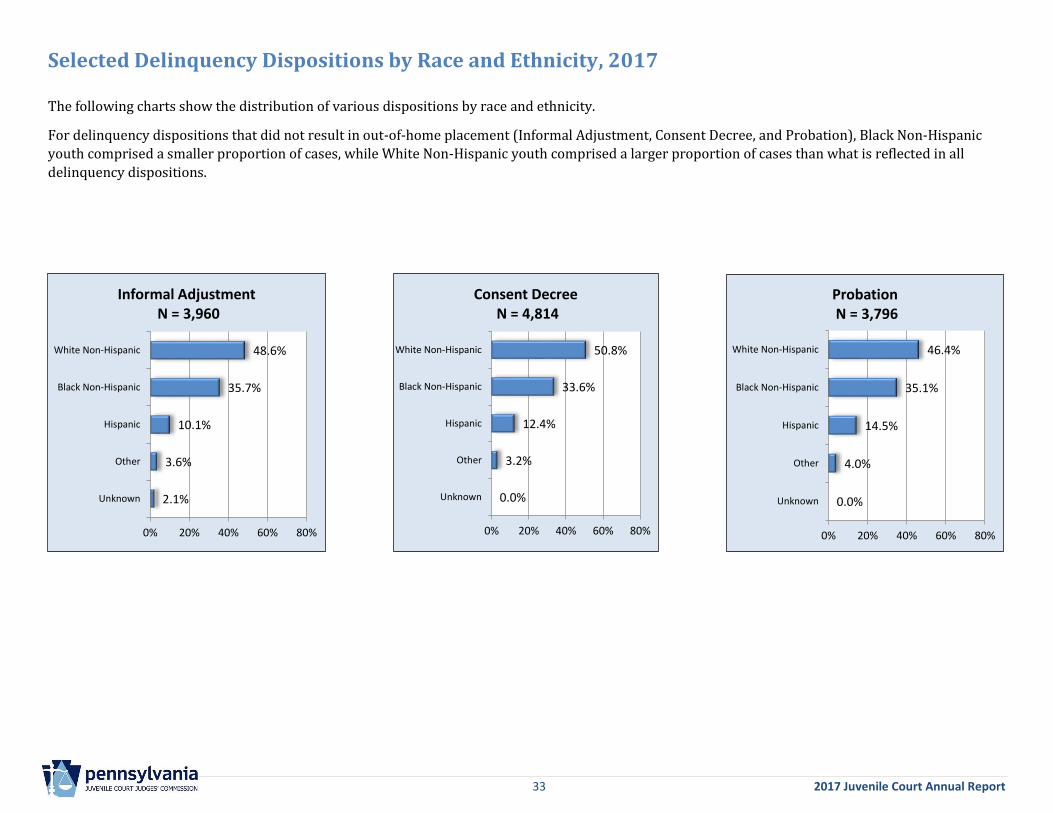
Selected Delinquency Dispositions by Race and Ethnicity, 2017
The following charts show the distribution of various dispositions by race and ethnicity.
For delinquency dispositions that did not result in out-of-home placement (Informal Adjustment, Consent Decree, and Probation), Black Non-Hispanic
youth comprised a smaller proportion of cases, while White Non-Hispanic youth comprised a larger proportion of cases than what is reflected in all
delinquency dispositions.
2.1%
3.6%
10.1%
35.7%
48.6%
0% 20% 40% 60% 80%
Unknown
Other
Hispanic
Black Non-Hispanic
White Non-Hispanic
Informal AdjustmentN = 3,960
0.0%
3.2%
12.4%
33.6%
50.8%
0% 20% 40% 60% 80%
Unknown
Other
Hispanic
Black Non-Hispanic
White Non-Hispanic
Consent DecreeN = 4,814
0.0%
4.0%
14.5%
35.1%
46.4%
0% 20% 40% 60% 80%
Unknown
Other
Hispanic
Black Non-Hispanic
White Non-Hispanic
ProbationN = 3,796
34 2017 Juvenile Court Annual Report
Selected Delinquency Dispositions by Race and Ethnicity, 2017 (continued)
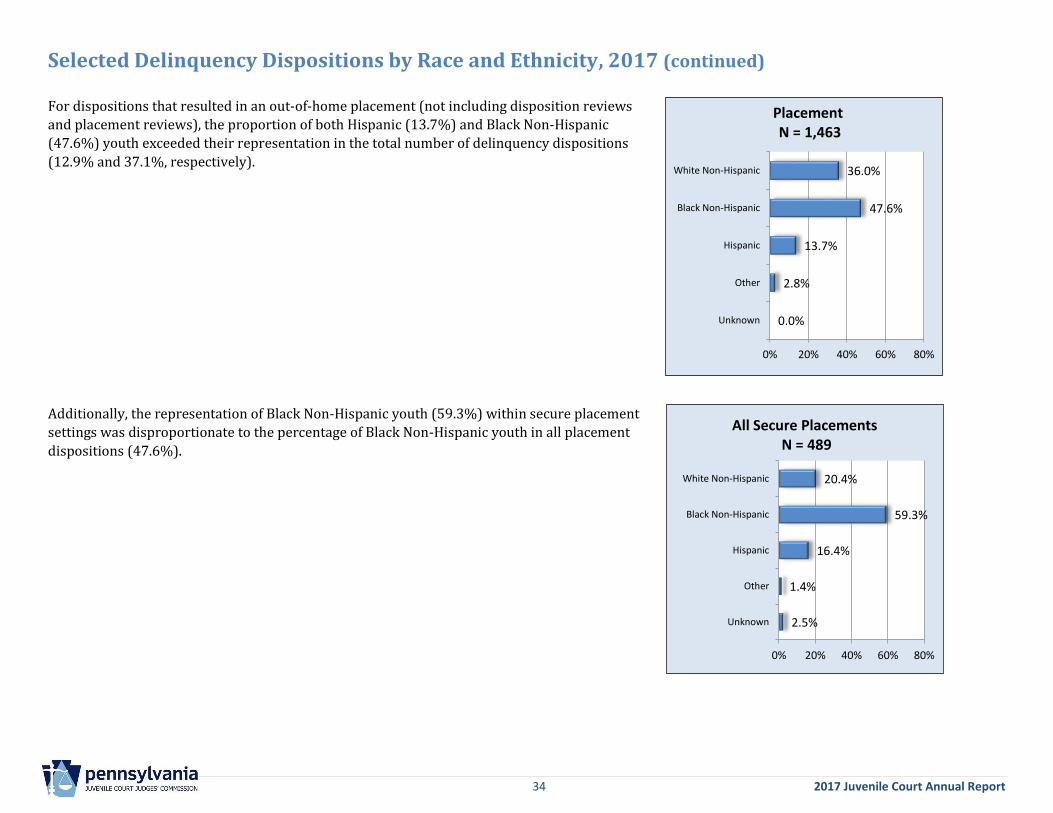
For dispositions that resulted in an out-of-home placement (not including disposition reviews
and placement reviews), the proportion of both Hispanic (13.7%) and Black Non-Hispanic
(47.6%) youth exceeded their representation in the total number of delinquency dispositions
(12.9% and 37.1%, respectively).
Additionally, the representation of Black Non-Hispanic youth (59.3%) within secure placement
settings was disproportionate to the percentage of Black Non-Hispanic youth in all placement
dispositions (47.6%).
2.5%
1.4%
16.4%
59.3%
20.4%
0% 20% 40% 60% 80%
Unknown
Other
Hispanic
Black Non-Hispanic
White Non-Hispanic
All Secure PlacementsN = 489
0.0%
2.8%
13.7%
47.6%
36.0%
0% 20% 40% 60% 80%
Unknown
Other
Hispanic
Black Non-Hispanic
White Non-Hispanic
PlacementN = 1,463
35 2017 Juvenile Court Annual Report
Secure Detention by Race and Ethnicity, 2017
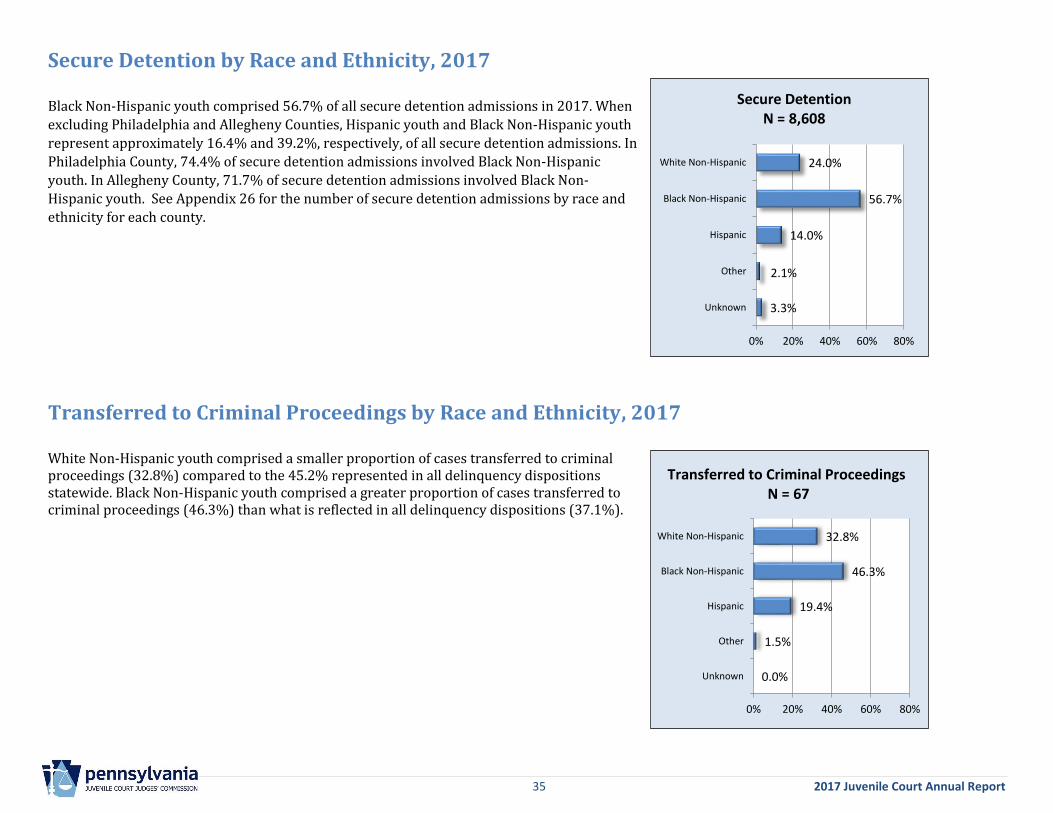
Black Non-Hispanic youth comprised 56.7% of all secure detention admissions in 2017. When
excluding Philadelphia and Allegheny Counties, Hispanic youth and Black Non-Hispanic youth
represent approximately 16.4% and 39.2%, respectively, of all secure detention admissions. In
Philadelphia County, 74.4% of secure detention admissions involved Black Non-Hispanic
youth. In Allegheny County, 71.7% of secure detention admissions involved Black Non-
Hispanic youth. See Appendix 26 for the number of secure detention admissions by race and
ethnicity for each county.
Transferred to Criminal Proceedings by Race and Ethnicity, 2017 White Non-Hispanic youth comprised a smaller proportion of cases transferred to criminal proceedings (32.8%) compared to the 45.2% represented in all delinquency dispositions statewide. Black Non-Hispanic youth comprised a greater proportion of cases transferred to criminal proceedings (46.3%) than what is reflected in all delinquency dispositions (37.1%).
0.0%
1.5%
19.4%
46.3%
32.8%
0% 20% 40% 60% 80%
Unknown
Other
Hispanic
Black Non-Hispanic
White Non-Hispanic
Transferred to Criminal ProceedingsN = 67
3.3%
2.1%
14.0%
56.7%
24.0%
0% 20% 40% 60% 80%
Unknown
Other
Hispanic
Black Non-Hispanic
White Non-Hispanic
Secure DetentionN = 8,608
36 2017 Juvenile Court Annual Report
Section 4: Delinquency Placements
Delinquency Placements Including Disposition Reviews, 2013-2017
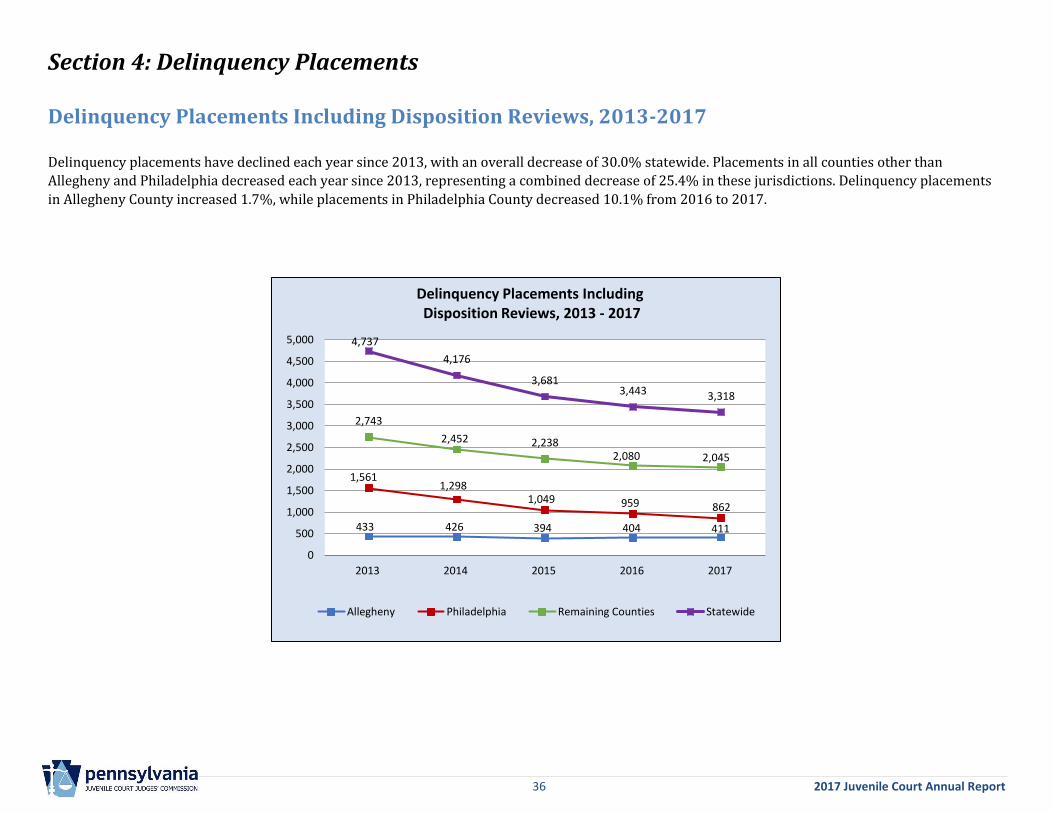
Delinquency placements have declined each year since 2013, with an overall decrease of 30.0% statewide. Placements in all counties other than
Allegheny and Philadelphia decreased each year since 2013, representing a combined decrease of 25.4% in these jurisdictions. Delinquency placements
in Allegheny County increased 1.7%, while placements in Philadelphia County decreased 10.1% from 2016 to 2017.
433 426 394 404 411
1,5611,298
1,049 959 862
2,743
2,452 2,2382,080 2,045
4,737
4,176
3,6813,443 3,318
0
500
1,000
1,500
2,000
2,500
3,000
3,500
4,000
4,500
5,000
2013 2014 2015 2016 2017
Allegheny Philadelphia Remaining Counties Statewide
Delinquency Placements IncludingDisposition Reviews, 2013 - 2017
37 2017 Juvenile Court Annual Report
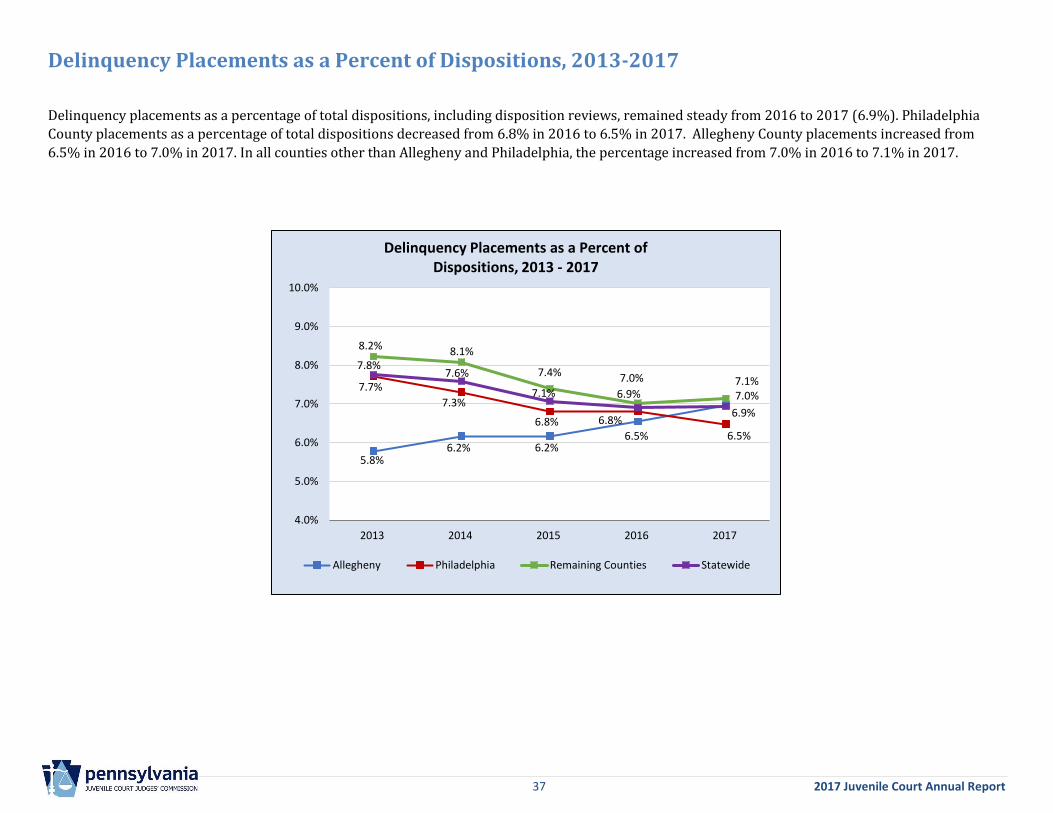
Delinquency Placements as a Percent of Dispositions, 2013-2017 Delinquency placements as a percentage of total dispositions, including disposition reviews, remained steady from 2016 to 2017 (6.9%). Philadelphia
County placements as a percentage of total dispositions decreased from 6.8% in 2016 to 6.5% in 2017. Allegheny County placements increased from
6.5% in 2016 to 7.0% in 2017. In all counties other than Allegheny and Philadelphia, the percentage increased from 7.0% in 2016 to 7.1% in 2017.
5.8%6.2% 6.2%
6.5%
7.0%7.7%
7.3%
6.8% 6.8%
6.5%
8.2% 8.1%
7.4% 7.0% 7.1%
7.8%7.6%
7.1% 6.9%
6.9%
4.0%
5.0%
6.0%
7.0%
8.0%
9.0%
10.0%
2013 2014 2015 2016 2017
Allegheny Philadelphia Remaining Counties Statewide
Delinquency Placements as a Percent of Dispositions, 2013 - 2017
38 2017 Juvenile Court Annual Report
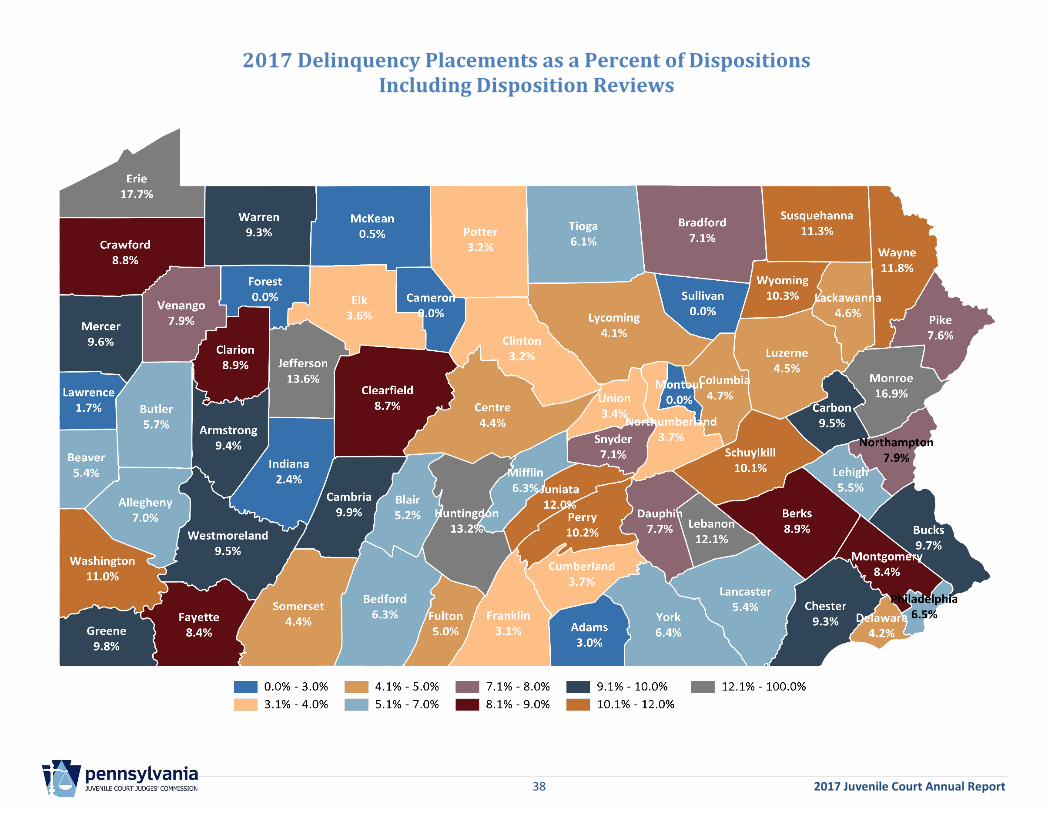
2017 Delinquency Placements as a Percent of Dispositions Including Disposition Reviews
39 2017 Juvenile Court Annual Report
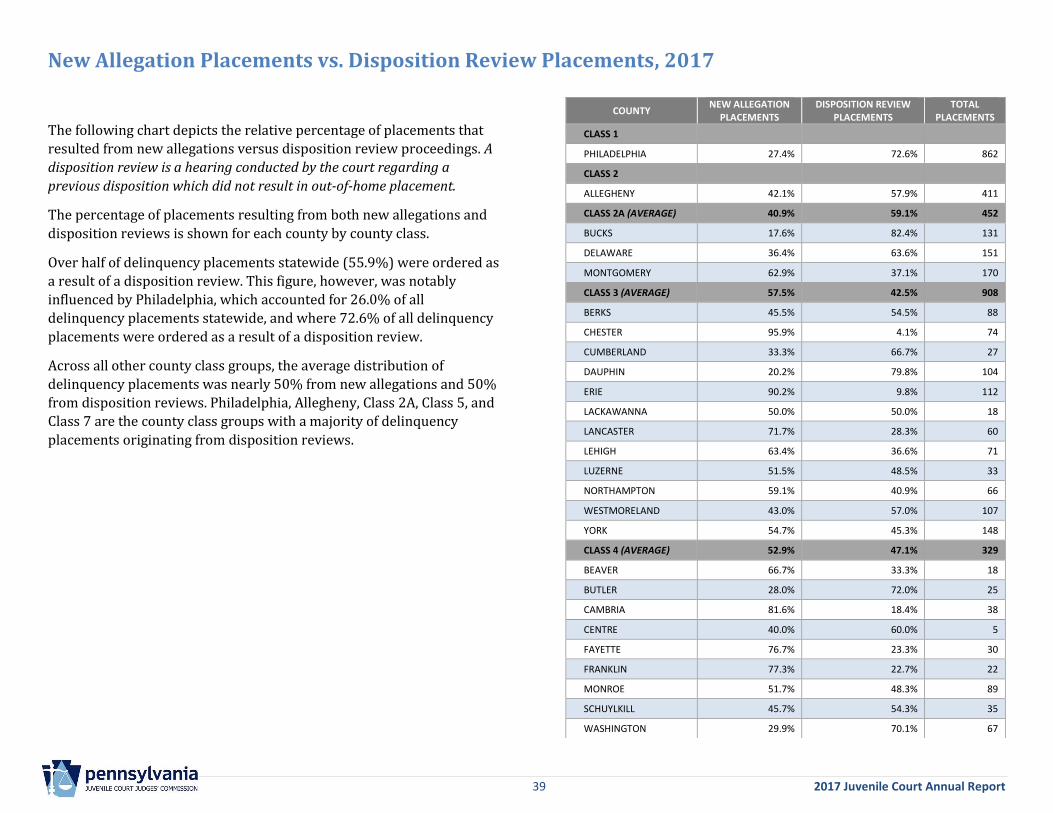
New Allegation Placements vs. Disposition Review Placements, 2017
The following chart depicts the relative percentage of placements that
resulted from new allegations versus disposition review proceedings. A
disposition review is a hearing conducted by the court regarding a
previous disposition which did not result in out-of-home placement.
The percentage of placements resulting from both new allegations and
disposition reviews is shown for each county by county class.
Over half of delinquency placements statewide (55.9%) were ordered as
a result of a disposition review. This figure, however, was notably
influenced by Philadelphia, which accounted for 26.0% of all
delinquency placements statewide, and where 72.6% of all delinquency
placements were ordered as a result of a disposition review.
Across all other county class groups, the average distribution of
delinquency placements was nearly 50% from new allegations and 50%
from disposition reviews. Philadelphia, Allegheny, Class 2A, Class 5, and
Class 7 are the county class groups with a majority of delinquency
placements originating from disposition reviews.
COUNTY NEW ALLEGATION
PLACEMENTS DISPOSITION REVIEW
PLACEMENTS TOTAL
PLACEMENTS
CLASS 1
PHILADELPHIA 27.4% 72.6% 862
CLASS 2
ALLEGHENY 42.1% 57.9% 411
CLASS 2A (AVERAGE) 40.9% 59.1% 452
BUCKS 17.6% 82.4% 131
DELAWARE 36.4% 63.6% 151
MONTGOMERY 62.9% 37.1% 170
CLASS 3 (AVERAGE) 57.5% 42.5% 908
BERKS 45.5% 54.5% 88
CHESTER 95.9% 4.1% 74
CUMBERLAND 33.3% 66.7% 27
DAUPHIN 20.2% 79.8% 104
ERIE 90.2% 9.8% 112
LACKAWANNA 50.0% 50.0% 18
LANCASTER 71.7% 28.3% 60
LEHIGH 63.4% 36.6% 71
LUZERNE 51.5% 48.5% 33
NORTHAMPTON 59.1% 40.9% 66
WESTMORELAND 43.0% 57.0% 107
YORK 54.7% 45.3% 148
CLASS 4 (AVERAGE) 52.9% 47.1% 329
BEAVER 66.7% 33.3% 18
BUTLER 28.0% 72.0% 25
CAMBRIA 81.6% 18.4% 38
CENTRE 40.0% 60.0% 5
FAYETTE 76.7% 23.3% 30
FRANKLIN 77.3% 22.7% 22
MONROE 51.7% 48.3% 89
SCHUYLKILL 45.7% 54.3% 35
WASHINGTON 29.9% 70.1% 67
40 2017 Juvenile Court Annual Report
New Allegation Placements vs. Disposition Review Placements, 2017 (continued)
COUNTY NEW ALLEGATION
PLACEMENTS DISPOSITION REVIEW
PLACEMENTS TOTAL
PLACEMENTS
CLASS 5 (AVERAGE) 47.1% 52.9% 138
ADAMS 23.1% 76.9% 13
BLAIR 50.0% 50.0% 20
LAWRENCE 66.7% 33.3% 3
LEBANON 62.2% 37.8% 37
LYCOMING 18.5% 81.5% 27
MERCER 58.1% 41.9% 31
NORTHUMBERLAND 57.1% 42.9% 7
CLASS 6 (AVERAGE) 50.5% 49.5% 192
ARMSTRONG 61.5% 38.5% 13
BEDFORD 25.0% 75.0% 4
BRADFORD 55.6% 44.4% 9
CARBON 46.7% 53.3% 15
CLARION 25.0% 75.0% 8
CLEARFIELD 75.0% 25.0% 4
CLINTON 75.0% 25.0% 4
COLUMBIA 0.0% 100.0% 8
CRAWFORD 65.0% 35.0% 20
ELK 50.0% 50.0% 2
GREENE 50.0% 50.0% 4
HUNTINGDON 100.0% 0.0% 9
INDIANA 66.7% 33.3% 3
COUNTY NEW ALLEGATION
PLACEMENTS DISPOSITION REVIEW
PLACEMENTS TOTAL
PLACEMENTS
JEFFERSON 66.7% 33.3% 9
MCKEAN 0.0% 100.0% 1
MIFFLIN 38.5% 61.5% 13
PERRY 33.3% 66.7% 9
PIKE 88.9% 11.1% 9
SOMERSET 50.0% 50.0% 4
SUSQUEHANNA 83.3% 16.7% 6
TIOGA 42.9% 57.1% 7
VENANGO 13.3% 86.7% 15
WARREN 62.5% 37.5% 8
WAYNE 25.0% 75.0% 8
CLASS 7 (AVERAGE) 39.1% 60.9% 23
JUNIATA 33.3% 66.7% 6
SNYDER 50.0% 50.0% 6
UNION 50.0% 50.0% 2
WYOMING 33.3% 66.7% 9
CLASS 8 (AVERAGE) 66.7% 33.3% 3
CAMERON 0.0% 0.0% 0
FOREST 0.0% 0.0% 0
FULTON 0.0% 100.0% 1
MONTOUR 0.0% 0.0% 0
POTTER 100.0% 0.0% 2
SULLIVAN 0.0% 0.0% 0
STATEWIDE 44.1% 55.9% 3,318
41 2017 Juvenile Court Annual Report
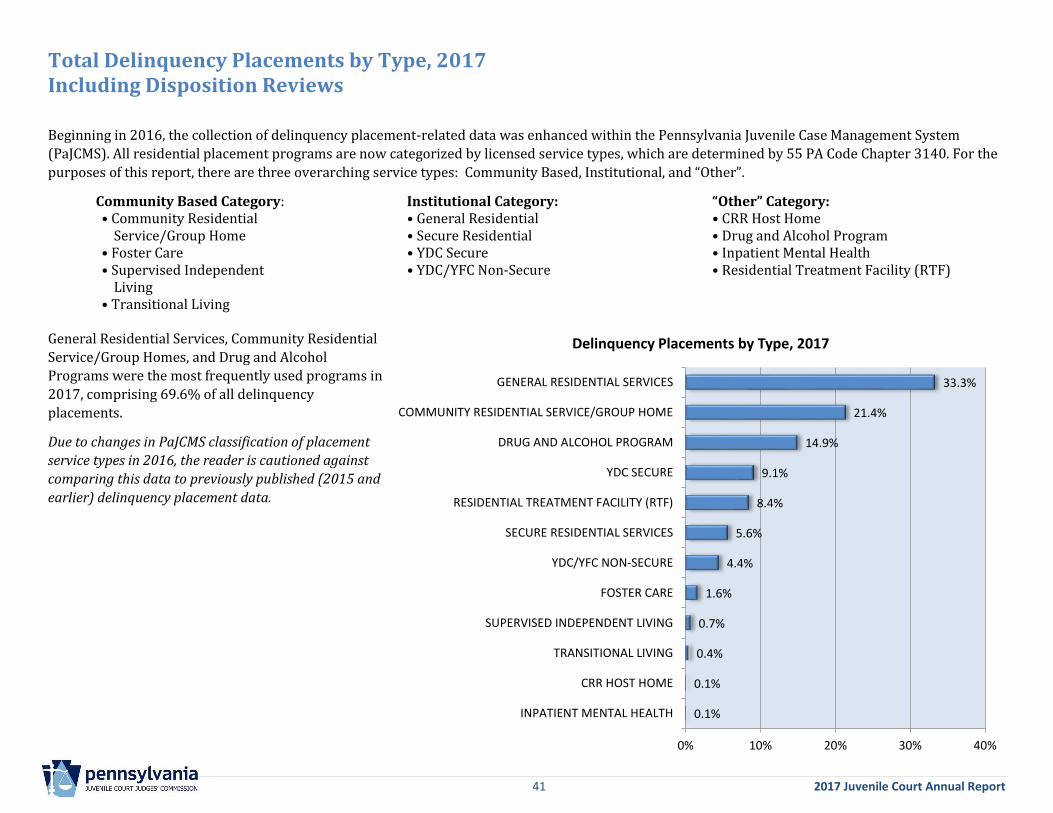
Total Delinquency Placements by Type, 2017 Including Disposition Reviews
Beginning in 2016, the collection of delinquency placement-related data was enhanced within the Pennsylvania Juvenile Case Management System
(PaJCMS). All residential placement programs are now categorized by licensed service types, which are determined by 55 PA Code Chapter 3140. For the
purposes of this report, there are three overarching service types: Community Based, Institutional, and “Other”.
Community Based Category: • Community Residential
Service/Group Home • Foster Care • Supervised Independent
Living • Transitional Living
Institutional Category: • General Residential • Secure Residential • YDC Secure • YDC/YFC Non-Secure
“Other” Category: • CRR Host Home • Drug and Alcohol Program • Inpatient Mental Health • Residential Treatment Facility (RTF)
General Residential Services, Community Residential
Service/Group Homes, and Drug and Alcohol
Programs were the most frequently used programs in
2017, comprising 69.6% of all delinquency
placements.
Due to changes in PaJCMS classification of placement
service types in 2016, the reader is cautioned against
comparing this data to previously published (2015 and
earlier) delinquency placement data.
0.1%
0.1%
0.4%
0.7%
1.6%
4.4%
5.6%
8.4%
9.1%
14.9%
21.4%
33.3%
0% 10% 20% 30% 40%
INPATIENT MENTAL HEALTH
CRR HOST HOME
TRANSITIONAL LIVING
SUPERVISED INDEPENDENT LIVING
FOSTER CARE
YDC/YFC NON-SECURE
SECURE RESIDENTIAL SERVICES
RESIDENTIAL TREATMENT FACILITY (RTF)
YDC SECURE
DRUG AND ALCOHOL PROGRAM
COMMUNITY RESIDENTIAL SERVICE/GROUP HOME
GENERAL RESIDENTIAL SERVICES
Delinquency Placements by Type, 2017
42 2017 Juvenile Court Annual Report
0.1%
0.2%
0.8%
2.5%
6.5%
7.3%
19.4%
63.2%
0% 10% 20% 30% 40% 50% 60% 70%
WITHDRAWN
DISMISSED
OTHER**
PROBATION
CONSENT DECREE*
PLACEMENT
CASE CLOSED
CONTINUED ON PREVIOUS DISPOSITION
Outcomes of Delinquency Disposition Reviews as a % of Total, 2017
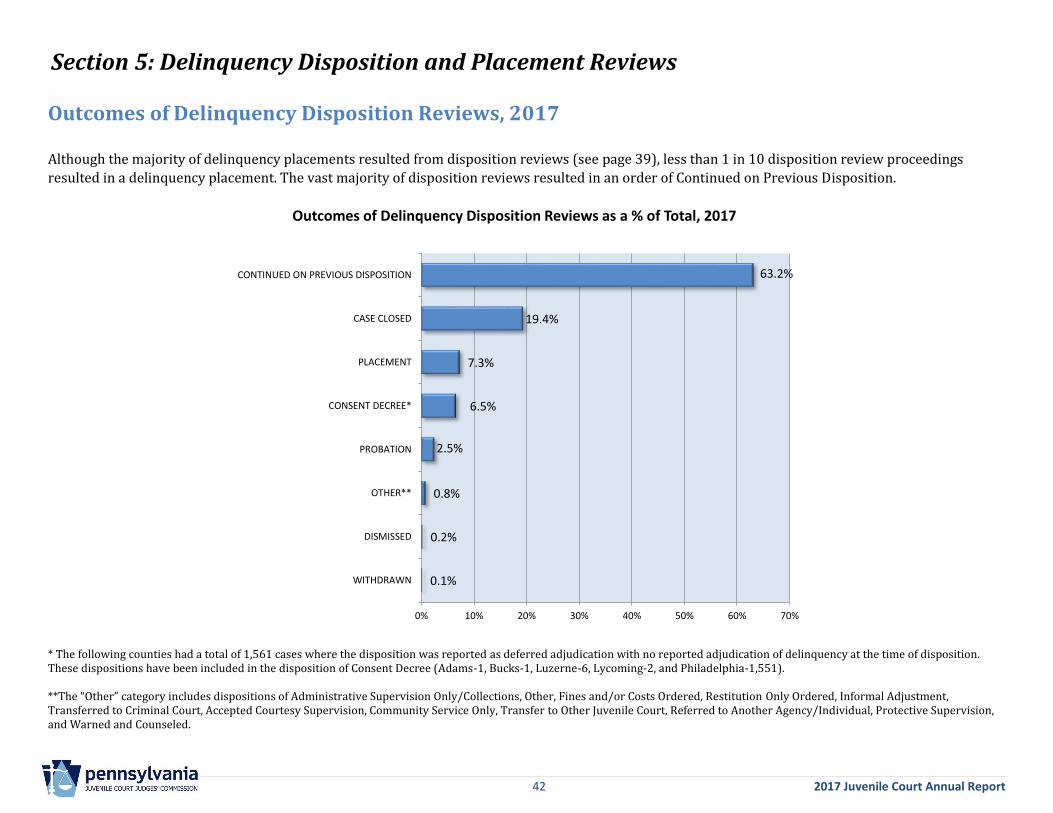
Section 5: Delinquency Disposition and Placement Reviews
Outcomes of Delinquency Disposition Reviews, 2017
Although the majority of delinquency placements resulted from disposition reviews (see page 39), less than 1 in 10 disposition review proceedings
resulted in a delinquency placement. The vast majority of disposition reviews resulted in an order of Continued on Previous Disposition.
* The following counties had a total of 1,561 cases where the disposition was reported as deferred adjudication with no reported adjudication of delinquency at the time of disposition. These dispositions have been included in the disposition of Consent Decree (Adams-1, Bucks-1, Luzerne-6, Lycoming-2, and Philadelphia-1,551). **The “Other” category includes dispositions of Administrative Supervision Only/Collections, Other, Fines and/or Costs Ordered, Restitution Only Ordered, Informal Adjustment, Transferred to Criminal Court, Accepted Courtesy Supervision, Community Service Only, Transfer to Other Juvenile Court, Referred to Another Agency/Individual, Protective Supervision, and Warned and Counseled.
43 2017 Juvenile Court Annual Report
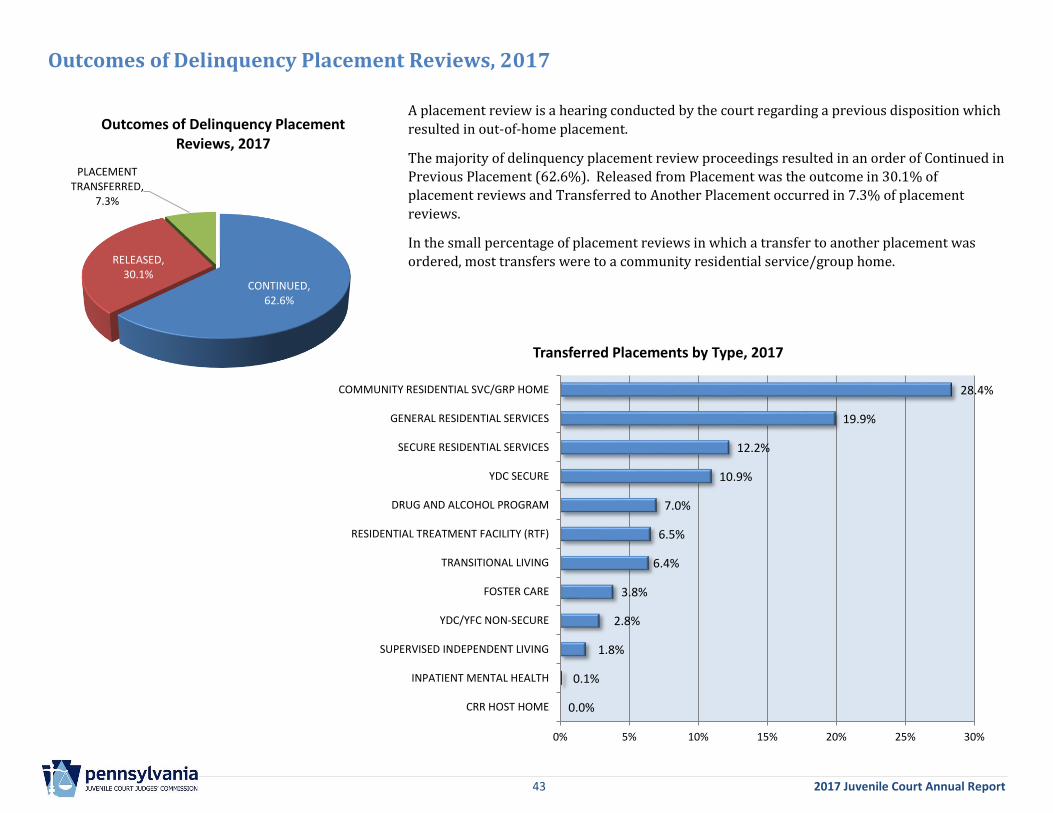
Outcomes of Delinquency Placement Reviews, 2017
A placement review is a hearing conducted by the court regarding a previous disposition which
resulted in out-of-home placement.
The majority of delinquency placement review proceedings resulted in an order of Continued in
Previous Placement (62.6%). Released from Placement was the outcome in 30.1% of
placement reviews and Transferred to Another Placement occurred in 7.3% of placement
reviews.
In the small percentage of placement reviews in which a transfer to another placement was
ordered, most transfers were to a community residential service/group home.
CONTINUED, 62.6%
RELEASED, 30.1%
PLACEMENT TRANSFERRED,
7.3%
Outcomes of Delinquency Placement Reviews, 2017
0.0%
0.1%
1.8%
2.8%
3.8%
6.4%
6.5%
7.0%
10.9%
12.2%
19.9%
28.4%
0% 5% 10% 15% 20% 25% 30%
CRR HOST HOME
INPATIENT MENTAL HEALTH
SUPERVISED INDEPENDENT LIVING
YDC/YFC NON-SECURE
FOSTER CARE
TRANSITIONAL LIVING
RESIDENTIAL TREATMENT FACILITY (RTF)
DRUG AND ALCOHOL PROGRAM
YDC SECURE
SECURE RESIDENTIAL SERVICES
GENERAL RESIDENTIAL SERVICES
COMMUNITY RESIDENTIAL SVC/GRP HOME
Transferred Placements by Type, 2017
44 2017 Juvenile Court Annual Report
Section 6: Dependency Dispositions
Dependency Dispositions, 2017
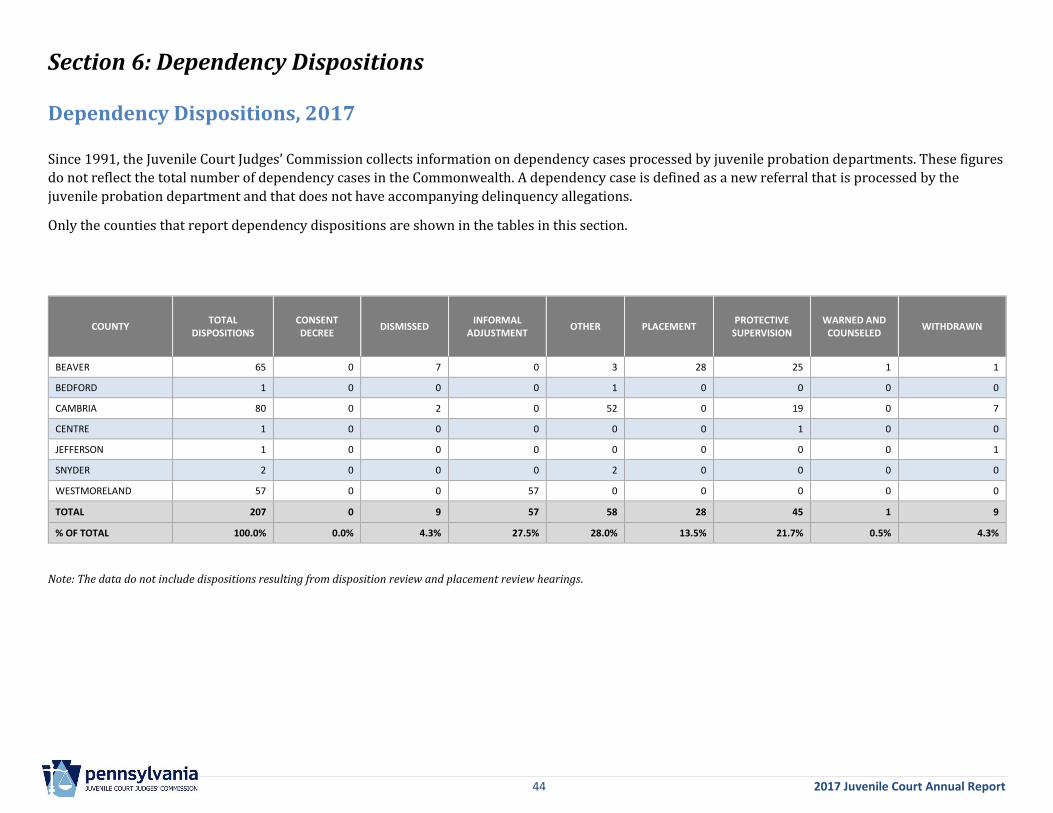
Since 1991, the Juvenile Court Judges’ Commission collects information on dependency cases processed by juvenile probation departments. These figures
do not reflect the total number of dependency cases in the Commonwealth. A dependency case is defined as a new referral that is processed by the
juvenile probation department and that does not have accompanying delinquency allegations.
Only the counties that report dependency dispositions are shown in the tables in this section.
COUNTY TOTAL
DISPOSITIONS CONSENT DECREE
DISMISSED INFORMAL
ADJUSTMENT OTHER PLACEMENT
PROTECTIVE SUPERVISION
WARNED AND COUNSELED
WITHDRAWN
BEAVER 65 0 7 0 3 28 25 1 1
BEDFORD 1 0 0 0 1 0 0 0 0
CAMBRIA 80 0 2 0 52 0 19 0 7
CENTRE 1 0 0 0 0 0 1 0 0
JEFFERSON 1 0 0 0 0 0 0 0 1
SNYDER 2 0 0 0 2 0 0 0 0
WESTMORELAND 57 0 0 57 0 0 0 0 0
TOTAL 207 0 9 57 58 28 45 1 9
% OF TOTAL 100.0% 0.0% 4.3% 27.5% 28.0% 13.5% 21.7% 0.5% 4.3%
Note: The data do not include dispositions resulting from disposition review and placement review hearings.
45 2017 Juvenile Court Annual Report
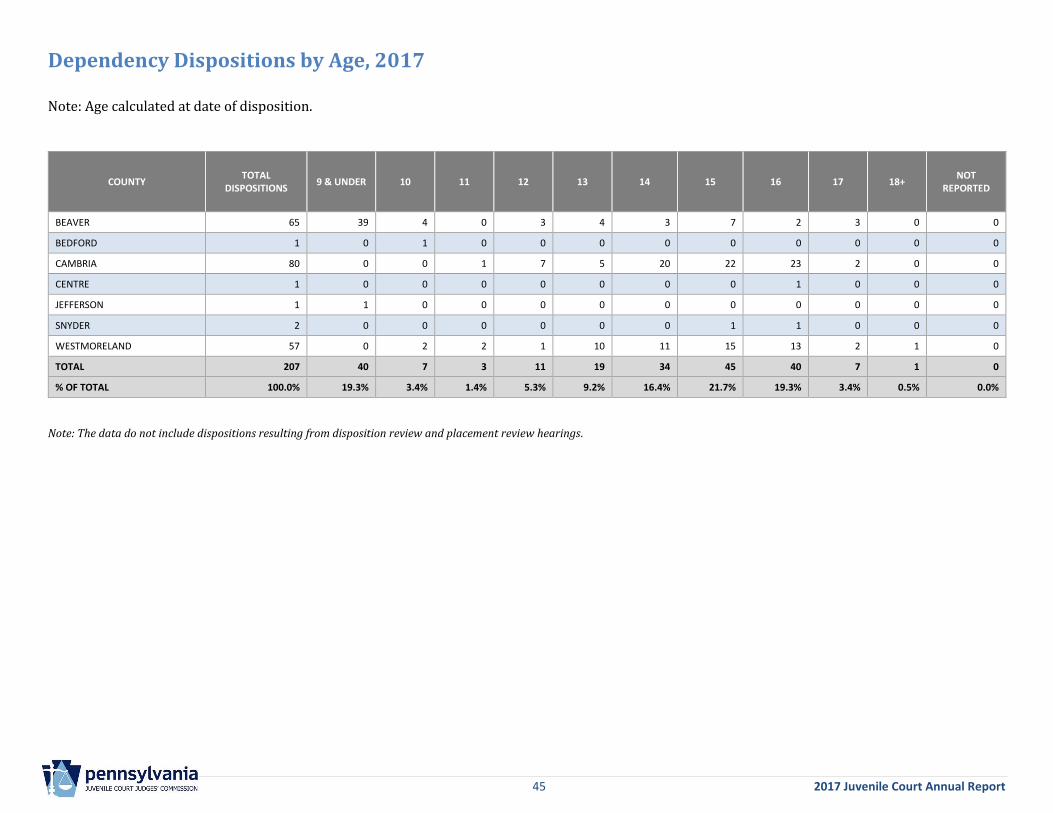
Dependency Dispositions by Age, 2017
Note: Age calculated at date of disposition.
COUNTY TOTAL
DISPOSITIONS 9 & UNDER 10 11 12 13 14 15 16 17 18+
NOT REPORTED
BEAVER 65 39 4 0 3 4 3 7 2 3 0 0
BEDFORD 1 0 1 0 0 0 0 0 0 0 0 0
CAMBRIA 80 0 0 1 7 5 20 22 23 2 0 0
CENTRE 1 0 0 0 0 0 0 0 1 0 0 0
JEFFERSON 1 1 0 0 0 0 0 0 0 0 0 0
SNYDER 2 0 0 0 0 0 0 1 1 0 0 0
WESTMORELAND 57 0 2 2 1 10 11 15 13 2 1 0
TOTAL 207 40 7 3 11 19 34 45 40 7 1 0
% OF TOTAL 100.0% 19.3% 3.4% 1.4% 5.3% 9.2% 16.4% 21.7% 19.3% 3.4% 0.5% 0.0%
Note: The data do not include dispositions resulting from disposition review and placement review hearings.
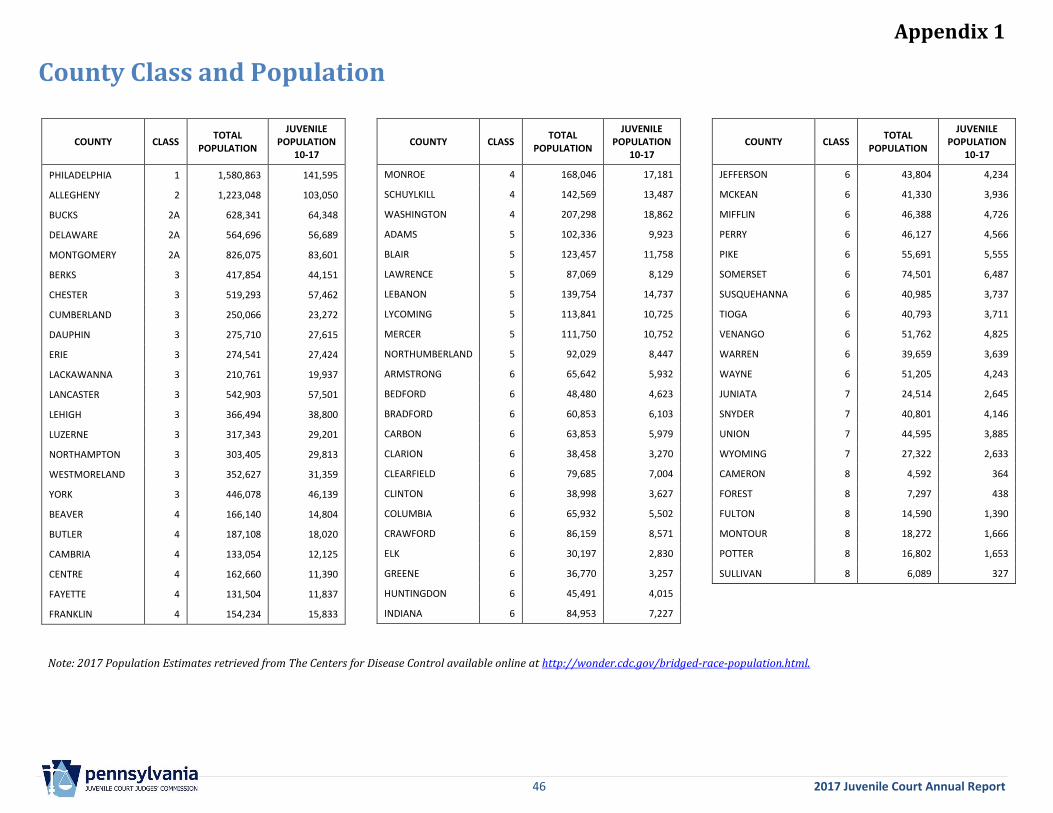
Appendix 1
46 2017 Juvenile Court Annual Report
County Class and Population
COUNTY CLASS TOTAL
POPULATION
JUVENILE POPULATION
10-17
PHILADELPHIA 1 1,580,863 141,595
ALLEGHENY 2 1,223,048 103,050
BUCKS 2A 628,341 64,348
DELAWARE 2A 564,696 56,689
MONTGOMERY 2A 826,075 83,601
BERKS 3 417,854 44,151
CHESTER 3 519,293 57,462
CUMBERLAND 3 250,066 23,272
DAUPHIN 3 275,710 27,615
ERIE 3 274,541 27,424
LACKAWANNA 3 210,761 19,937
LANCASTER 3 542,903 57,501
LEHIGH 3 366,494 38,800
LUZERNE 3 317,343 29,201
NORTHAMPTON 3 303,405 29,813
WESTMORELAND 3 352,627 31,359
YORK 3 446,078 46,139
BEAVER 4 166,140 14,804
BUTLER 4 187,108 18,020
CAMBRIA 4 133,054 12,125
CENTRE 4 162,660 11,390
FAYETTE 4 131,504 11,837
FRANKLIN 4 154,234 15,833
COUNTY CLASS TOTAL
POPULATION
JUVENILE POPULATION
10-17
MONROE 4 168,046 17,181
SCHUYLKILL 4 142,569 13,487
WASHINGTON 4 207,298 18,862
ADAMS 5 102,336 9,923
BLAIR 5 123,457 11,758
LAWRENCE 5 87,069 8,129
LEBANON 5 139,754 14,737
LYCOMING 5 113,841 10,725
MERCER 5 111,750 10,752
NORTHUMBERLAND 5 92,029 8,447
ARMSTRONG 6 65,642 5,932
BEDFORD 6 48,480 4,623
BRADFORD 6 60,853 6,103
CARBON 6 63,853 5,979
CLARION 6 38,458 3,270
CLEARFIELD 6 79,685 7,004
CLINTON 6 38,998 3,627
COLUMBIA 6 65,932 5,502
CRAWFORD 6 86,159 8,571
ELK 6 30,197 2,830
GREENE 6 36,770 3,257
HUNTINGDON 6 45,491 4,015
INDIANA 6 84,953 7,227
COUNTY CLASS TOTAL
POPULATION
JUVENILE POPULATION
10-17
JEFFERSON 6 43,804 4,234
MCKEAN 6 41,330 3,936
MIFFLIN 6 46,388 4,726
PERRY 6 46,127 4,566
PIKE 6 55,691 5,555
SOMERSET 6 74,501 6,487
SUSQUEHANNA 6 40,985 3,737
TIOGA 6 40,793 3,711
VENANGO 6 51,762 4,825
WARREN 6 39,659 3,639
WAYNE 6 51,205 4,243
JUNIATA 7 24,514 2,645
SNYDER 7 40,801 4,146
UNION 7 44,595 3,885
WYOMING 7 27,322 2,633
CAMERON 8 4,592 364
FOREST 8 7,297 438
FULTON 8 14,590 1,390
MONTOUR 8 18,272 1,666
POTTER 8 16,802 1,653
SULLIVAN 8 6,089 327
Note: 2017 Population Estimates retrieved from The Centers for Disease Control available online at http://wonder.cdc.gov/bridged-race-population.html.
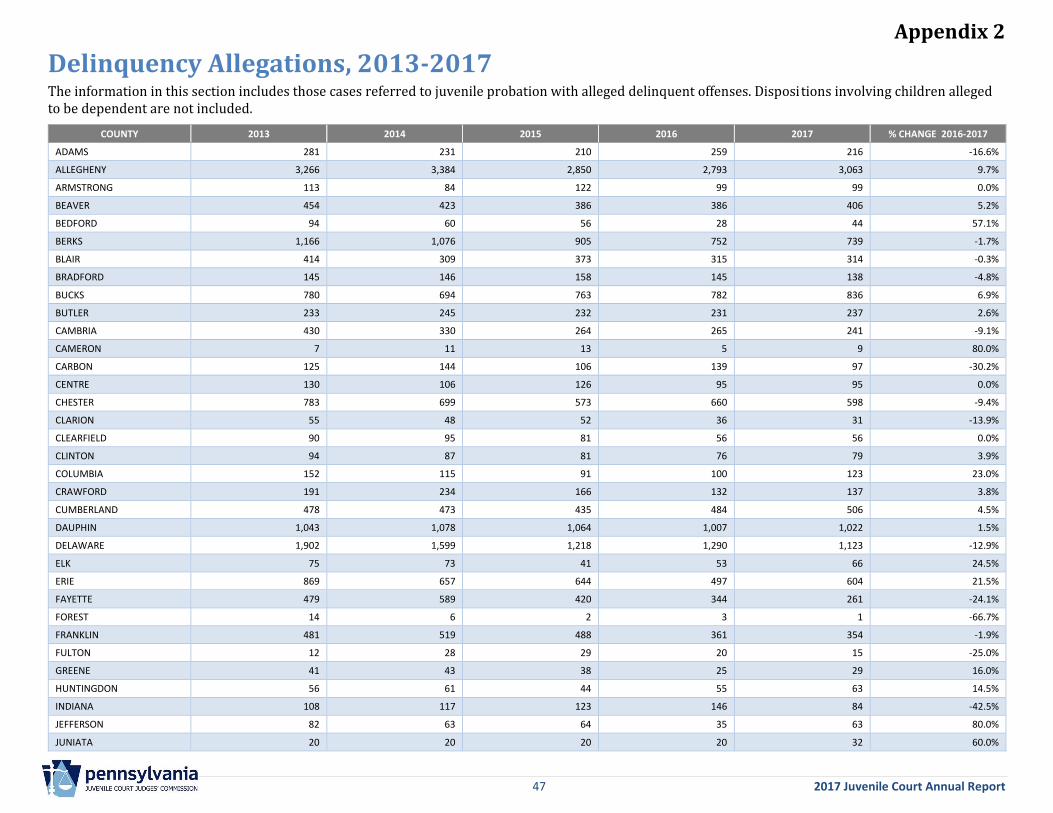
Appendix 2
47 2017 Juvenile Court Annual Report
Delinquency Allegations, 2013-2017 The information in this section includes those cases referred to juvenile probation with alleged delinquent offenses. Dispositions involving children alleged to be dependent are not included.
COUNTY 2013 2014 2015 2016 2017 % CHANGE 2016-2017
ADAMS 281 231 210 259 216 -16.6%
ALLEGHENY 3,266 3,384 2,850 2,793 3,063 9.7%
ARMSTRONG 113 84 122 99 99 0.0%
BEAVER 454 423 386 386 406 5.2%
BEDFORD 94 60 56 28 44 57.1%
BERKS 1,166 1,076 905 752 739 -1.7%
BLAIR 414 309 373 315 314 -0.3%
BRADFORD 145 146 158 145 138 -4.8%
BUCKS 780 694 763 782 836 6.9%
BUTLER 233 245 232 231 237 2.6%
CAMBRIA 430 330 264 265 241 -9.1%
CAMERON 7 11 13 5 9 80.0%
CARBON 125 144 106 139 97 -30.2%
CENTRE 130 106 126 95 95 0.0%
CHESTER 783 699 573 660 598 -9.4%
CLARION 55 48 52 36 31 -13.9%
CLEARFIELD 90 95 81 56 56 0.0%
CLINTON 94 87 81 76 79 3.9%
COLUMBIA 152 115 91 100 123 23.0%
CRAWFORD 191 234 166 132 137 3.8%
CUMBERLAND 478 473 435 484 506 4.5%
DAUPHIN 1,043 1,078 1,064 1,007 1,022 1.5%
DELAWARE 1,902 1,599 1,218 1,290 1,123 -12.9%
ELK 75 73 41 53 66 24.5%
ERIE 869 657 644 497 604 21.5%
FAYETTE 479 589 420 344 261 -24.1%
FOREST 14 6 2 3 1 -66.7%
FRANKLIN 481 519 488 361 354 -1.9%
FULTON 12 28 29 20 15 -25.0%
GREENE 41 43 38 25 29 16.0%
HUNTINGDON 56 61 44 55 63 14.5%
INDIANA 108 117 123 146 84 -42.5%
JEFFERSON 82 63 64 35 63 80.0%
JUNIATA 20 20 20 20 32 60.0%
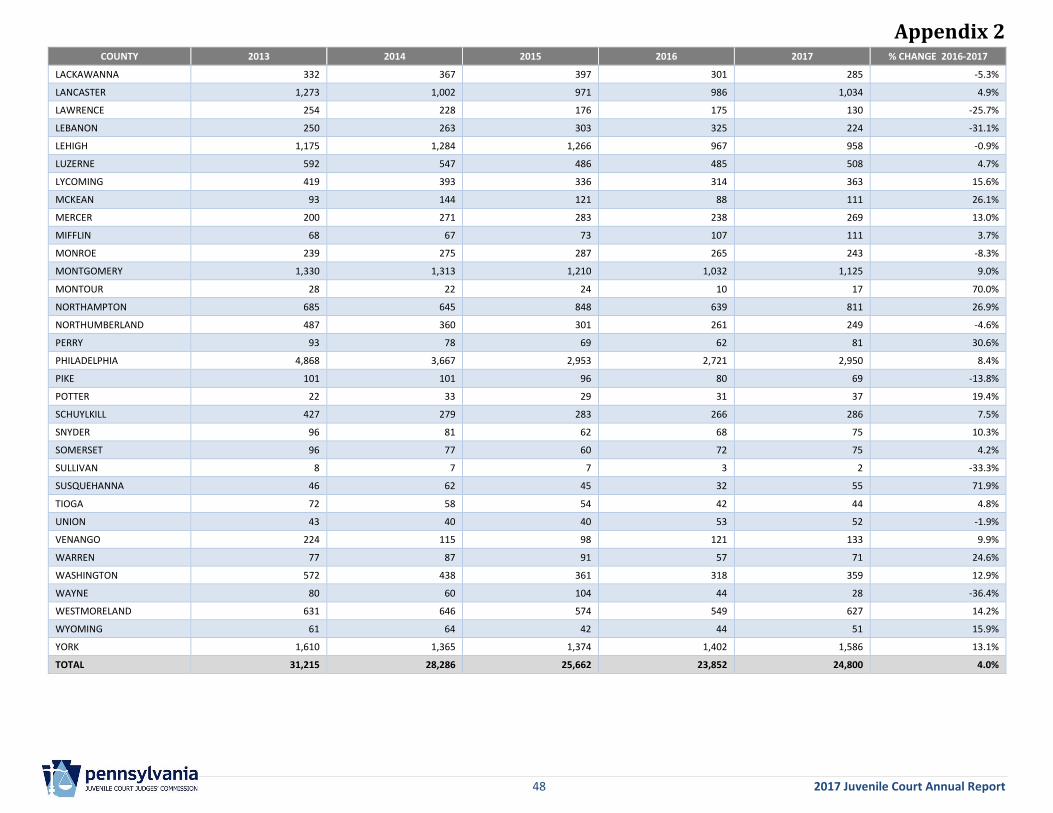
Appendix 2
48 2017 Juvenile Court Annual Report
COUNTY 2013 2014 2015 2016 2017 % CHANGE 2016-2017
LACKAWANNA 332 367 397 301 285 -5.3%
LANCASTER 1,273 1,002 971 986 1,034 4.9%
LAWRENCE 254 228 176 175 130 -25.7%
LEBANON 250 263 303 325 224 -31.1%
LEHIGH 1,175 1,284 1,266 967 958 -0.9%
LUZERNE 592 547 486 485 508 4.7%
LYCOMING 419 393 336 314 363 15.6%
MCKEAN 93 144 121 88 111 26.1%
MERCER 200 271 283 238 269 13.0%
MIFFLIN 68 67 73 107 111 3.7%
MONROE 239 275 287 265 243 -8.3%
MONTGOMERY 1,330 1,313 1,210 1,032 1,125 9.0%
MONTOUR 28 22 24 10 17 70.0%
NORTHAMPTON 685 645 848 639 811 26.9%
NORTHUMBERLAND 487 360 301 261 249 -4.6%
PERRY 93 78 69 62 81 30.6%
PHILADELPHIA 4,868 3,667 2,953 2,721 2,950 8.4%
PIKE 101 101 96 80 69 -13.8%
POTTER 22 33 29 31 37 19.4%
SCHUYLKILL 427 279 283 266 286 7.5%
SNYDER 96 81 62 68 75 10.3%
SOMERSET 96 77 60 72 75 4.2%
SULLIVAN 8 7 7 3 2 -33.3%
SUSQUEHANNA 46 62 45 32 55 71.9%
TIOGA 72 58 54 42 44 4.8%
UNION 43 40 40 53 52 -1.9%
VENANGO 224 115 98 121 133 9.9%
WARREN 77 87 91 57 71 24.6%
WASHINGTON 572 438 361 318 359 12.9%
WAYNE 80 60 104 44 28 -36.4%
WESTMORELAND 631 646 574 549 627 14.2%
WYOMING 61 64 42 44 51 15.9%
YORK 1,610 1,365 1,374 1,402 1,586 13.1%
TOTAL 31,215 28,286 25,662 23,852 24,800 4.0%

Appendix 3
49 2017 Juvenile Court Annual Report
Delinquency Allegations as a Percent of Juvenile Population, 2017
COUNTY DELINQUENCY ALLEGATIONS
DELINQUENT JUVENILES ALLEGATIONS PER
JUVENILE RATE PERCENTAGE OF
STATEWIDE ALLEGATIONS AGE 10-17 POPULATION
ALLEGATIONS AS A PERCENTAGE OF JUV. POP.
ADAMS 216 169 1.28 0.9% 9,923 2.2%
ALLEGHENY 3,063 2,194 1.40 12.4% 103,050 3.0%
ARMSTRONG 99 86 1.15 0.4% 5,932 1.7%
BEAVER 406 349 1.16 1.6% 14,804 2.7%
BEDFORD 44 38 1.16 0.2% 4,623 1.0%
BERKS 739 567 1.30 3.0% 44,151 1.7%
BLAIR 314 240 1.31 1.3% 11,758 2.7%
BRADFORD 138 107 1.29 0.6% 6,103 2.3%
BUCKS 836 686 1.22 3.4% 64,348 1.3%
BUTLER 237 210 1.13 1.0% 18,020 1.3%
CAMBRIA 241 241 1.00 1.0% 12,125 2.0%
CAMERON 9 7 1.29 0.0% 364 2.5%
CARBON 97 88 1.10 0.4% 5,979 1.6%
CENTRE 95 88 1.08 0.4% 11,390 0.8%
CHESTER 598 516 1.16 2.4% 57,462 1.0%
CLARION 31 28 1.11 0.1% 3,270 0.9%
CLEARFIELD 56 52 1.08 0.2% 7,004 0.8%
CLINTON 79 72 1.10 0.3% 3,627 2.2%
COLUMBIA 123 100 1.23 0.5% 5,502 2.2%
CRAWFORD 137 109 1.26 0.6% 8,571 1.6%
CUMBERLAND 506 425 1.19 2.0% 23,272 2.2%
DAUPHIN 1,022 754 1.36 4.1% 27,615 3.7%
DELAWARE 1,123 889 1.26 4.5% 56,689 2.0%
ELK 66 51 1.29 0.3% 2,830 2.3%
ERIE 604 506 1.19 2.4% 27,424 2.2%
FAYETTE 261 190 1.37 1.1% 11,837 2.2%
FOREST 1 1 1.00 0.0% 438 0.2%
FRANKLIN 354 276 1.28 1.4% 15,833 2.2%
FULTON 15 14 1.07 0.1% 1,390 1.1%
GREENE 29 25 1.16 0.1% 3,257 0.9%
HUNTINGDON 63 58 1.09 0.3% 4,015 1.6%
INDIANA 84 72 1.17 0.3% 7,227 1.2%
JEFFERSON 63 57 1.11 0.3% 4,234 1.5%
JUNIATA 32 28 1.14 0.1% 2,645 1.2%
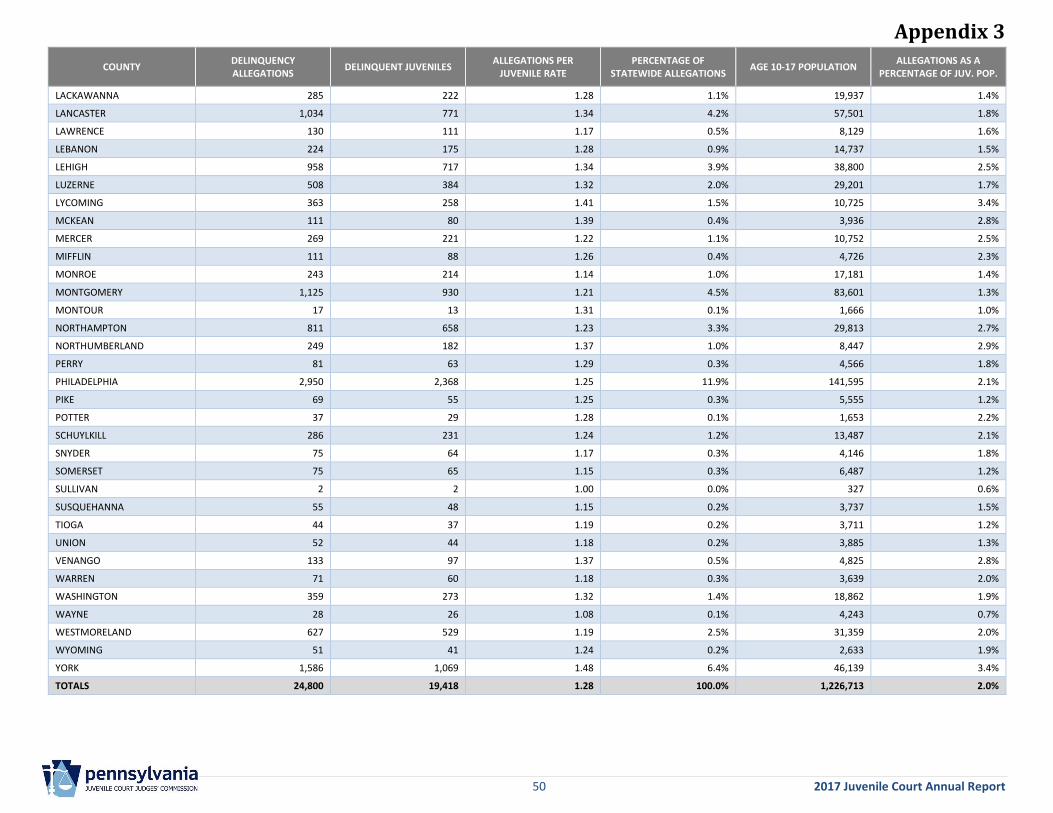
Appendix 3
50 2017 Juvenile Court Annual Report
COUNTY DELINQUENCY ALLEGATIONS
DELINQUENT JUVENILES ALLEGATIONS PER
JUVENILE RATE PERCENTAGE OF
STATEWIDE ALLEGATIONS AGE 10-17 POPULATION
ALLEGATIONS AS A PERCENTAGE OF JUV. POP.
LACKAWANNA 285 222 1.28 1.1% 19,937 1.4%
LANCASTER 1,034 771 1.34 4.2% 57,501 1.8%
LAWRENCE 130 111 1.17 0.5% 8,129 1.6%
LEBANON 224 175 1.28 0.9% 14,737 1.5%
LEHIGH 958 717 1.34 3.9% 38,800 2.5%
LUZERNE 508 384 1.32 2.0% 29,201 1.7%
LYCOMING 363 258 1.41 1.5% 10,725 3.4%
MCKEAN 111 80 1.39 0.4% 3,936 2.8%
MERCER 269 221 1.22 1.1% 10,752 2.5%
MIFFLIN 111 88 1.26 0.4% 4,726 2.3%
MONROE 243 214 1.14 1.0% 17,181 1.4%
MONTGOMERY 1,125 930 1.21 4.5% 83,601 1.3%
MONTOUR 17 13 1.31 0.1% 1,666 1.0%
NORTHAMPTON 811 658 1.23 3.3% 29,813 2.7%
NORTHUMBERLAND 249 182 1.37 1.0% 8,447 2.9%
PERRY 81 63 1.29 0.3% 4,566 1.8%
PHILADELPHIA 2,950 2,368 1.25 11.9% 141,595 2.1%
PIKE 69 55 1.25 0.3% 5,555 1.2%
POTTER 37 29 1.28 0.1% 1,653 2.2%
SCHUYLKILL 286 231 1.24 1.2% 13,487 2.1%
SNYDER 75 64 1.17 0.3% 4,146 1.8%
SOMERSET 75 65 1.15 0.3% 6,487 1.2%
SULLIVAN 2 2 1.00 0.0% 327 0.6%
SUSQUEHANNA 55 48 1.15 0.2% 3,737 1.5%
TIOGA 44 37 1.19 0.2% 3,711 1.2%
UNION 52 44 1.18 0.2% 3,885 1.3%
VENANGO 133 97 1.37 0.5% 4,825 2.8%
WARREN 71 60 1.18 0.3% 3,639 2.0%
WASHINGTON 359 273 1.32 1.4% 18,862 1.9%
WAYNE 28 26 1.08 0.1% 4,243 0.7%
WESTMORELAND 627 529 1.19 2.5% 31,359 2.0%
WYOMING 51 41 1.24 0.2% 2,633 1.9%
YORK 1,586 1,069 1.48 6.4% 46,139 3.4%
TOTALS 24,800 19,418 1.28 100.0% 1,226,713 2.0%
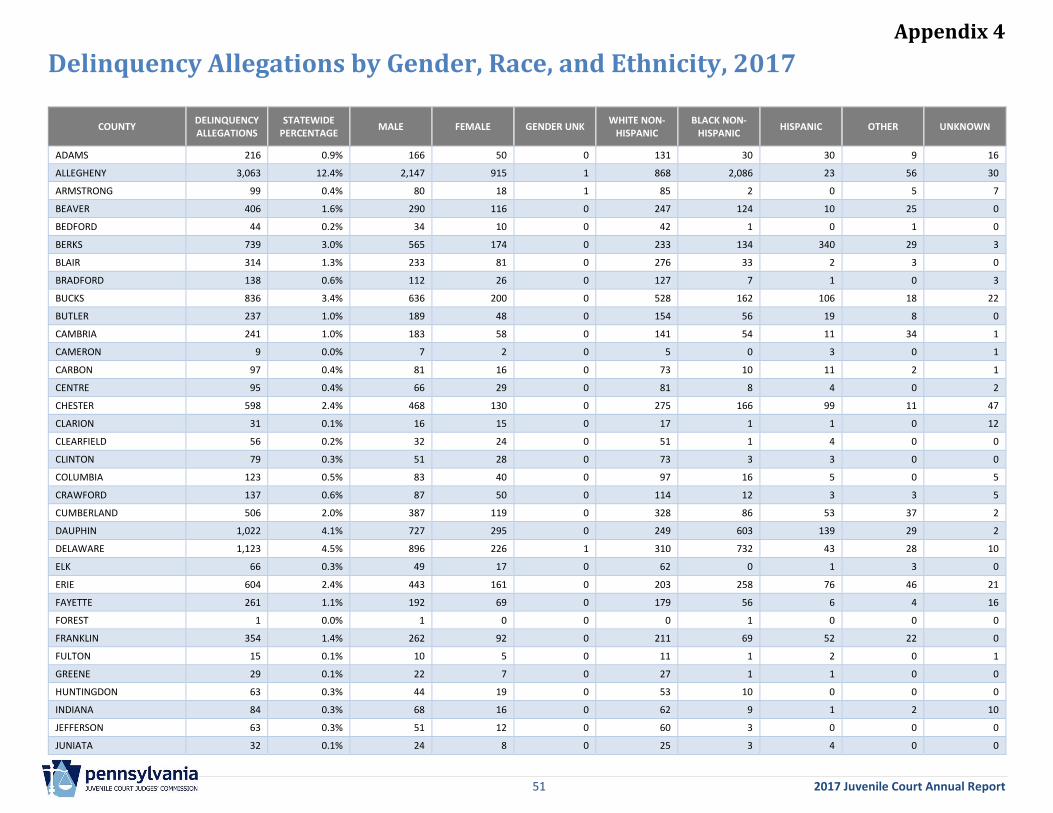
Appendix 4
51 2017 Juvenile Court Annual Report
Delinquency Allegations by Gender, Race, and Ethnicity, 2017
COUNTY DELINQUENCY ALLEGATIONS
STATEWIDE PERCENTAGE
MALE FEMALE GENDER UNK WHITE NON-
HISPANIC BLACK NON-
HISPANIC HISPANIC OTHER UNKNOWN
ADAMS 216 0.9% 166 50 0 131 30 30 9 16
ALLEGHENY 3,063 12.4% 2,147 915 1 868 2,086 23 56 30
ARMSTRONG 99 0.4% 80 18 1 85 2 0 5 7
BEAVER 406 1.6% 290 116 0 247 124 10 25 0
BEDFORD 44 0.2% 34 10 0 42 1 0 1 0
BERKS 739 3.0% 565 174 0 233 134 340 29 3
BLAIR 314 1.3% 233 81 0 276 33 2 3 0
BRADFORD 138 0.6% 112 26 0 127 7 1 0 3
BUCKS 836 3.4% 636 200 0 528 162 106 18 22
BUTLER 237 1.0% 189 48 0 154 56 19 8 0
CAMBRIA 241 1.0% 183 58 0 141 54 11 34 1
CAMERON 9 0.0% 7 2 0 5 0 3 0 1
CARBON 97 0.4% 81 16 0 73 10 11 2 1
CENTRE 95 0.4% 66 29 0 81 8 4 0 2
CHESTER 598 2.4% 468 130 0 275 166 99 11 47
CLARION 31 0.1% 16 15 0 17 1 1 0 12
CLEARFIELD 56 0.2% 32 24 0 51 1 4 0 0
CLINTON 79 0.3% 51 28 0 73 3 3 0 0
COLUMBIA 123 0.5% 83 40 0 97 16 5 0 5
CRAWFORD 137 0.6% 87 50 0 114 12 3 3 5
CUMBERLAND 506 2.0% 387 119 0 328 86 53 37 2
DAUPHIN 1,022 4.1% 727 295 0 249 603 139 29 2
DELAWARE 1,123 4.5% 896 226 1 310 732 43 28 10
ELK 66 0.3% 49 17 0 62 0 1 3 0
ERIE 604 2.4% 443 161 0 203 258 76 46 21
FAYETTE 261 1.1% 192 69 0 179 56 6 4 16
FOREST 1 0.0% 1 0 0 0 1 0 0 0
FRANKLIN 354 1.4% 262 92 0 211 69 52 22 0
FULTON 15 0.1% 10 5 0 11 1 2 0 1
GREENE 29 0.1% 22 7 0 27 1 1 0 0
HUNTINGDON 63 0.3% 44 19 0 53 10 0 0 0
INDIANA 84 0.3% 68 16 0 62 9 1 2 10
JEFFERSON 63 0.3% 51 12 0 60 3 0 0 0
JUNIATA 32 0.1% 24 8 0 25 3 4 0 0
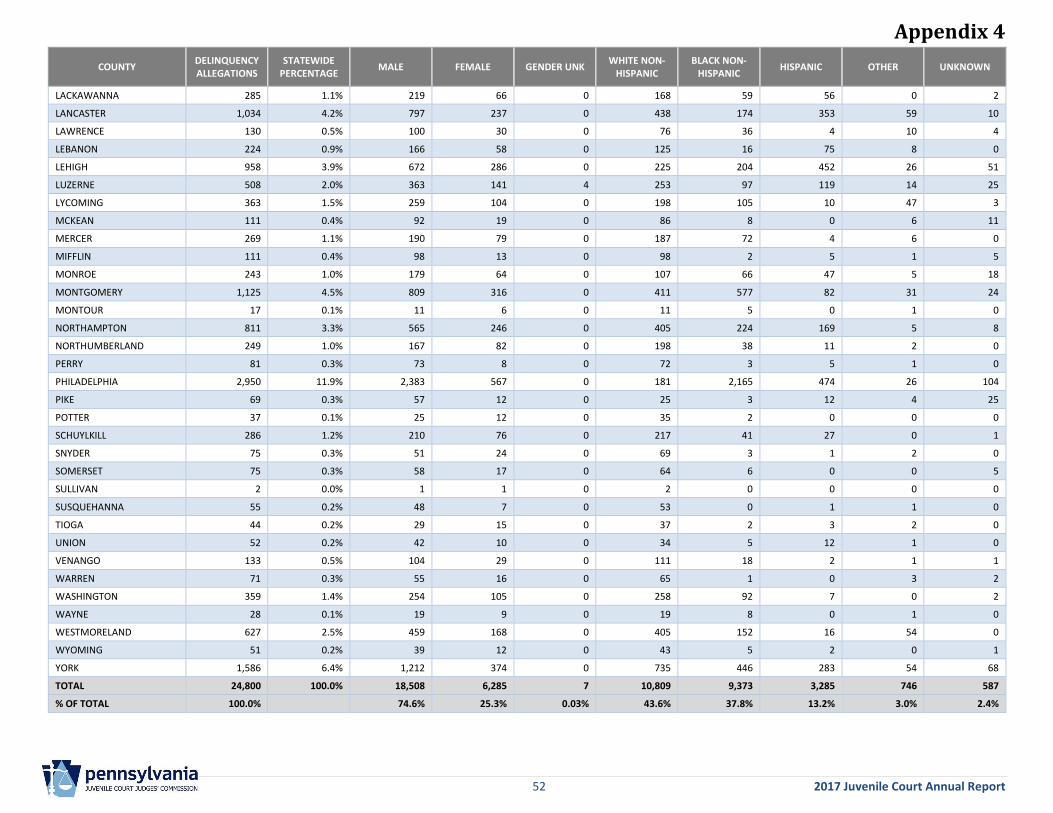
Appendix 4
52 2017 Juvenile Court Annual Report
COUNTY DELINQUENCY ALLEGATIONS
STATEWIDE PERCENTAGE
MALE FEMALE GENDER UNK WHITE NON-
HISPANIC BLACK NON-
HISPANIC HISPANIC OTHER UNKNOWN
LACKAWANNA 285 1.1% 219 66 0 168 59 56 0 2
LANCASTER 1,034 4.2% 797 237 0 438 174 353 59 10
LAWRENCE 130 0.5% 100 30 0 76 36 4 10 4
LEBANON 224 0.9% 166 58 0 125 16 75 8 0
LEHIGH 958 3.9% 672 286 0 225 204 452 26 51
LUZERNE 508 2.0% 363 141 4 253 97 119 14 25
LYCOMING 363 1.5% 259 104 0 198 105 10 47 3
MCKEAN 111 0.4% 92 19 0 86 8 0 6 11
MERCER 269 1.1% 190 79 0 187 72 4 6 0
MIFFLIN 111 0.4% 98 13 0 98 2 5 1 5
MONROE 243 1.0% 179 64 0 107 66 47 5 18
MONTGOMERY 1,125 4.5% 809 316 0 411 577 82 31 24
MONTOUR 17 0.1% 11 6 0 11 5 0 1 0
NORTHAMPTON 811 3.3% 565 246 0 405 224 169 5 8
NORTHUMBERLAND 249 1.0% 167 82 0 198 38 11 2 0
PERRY 81 0.3% 73 8 0 72 3 5 1 0
PHILADELPHIA 2,950 11.9% 2,383 567 0 181 2,165 474 26 104
PIKE 69 0.3% 57 12 0 25 3 12 4 25
POTTER 37 0.1% 25 12 0 35 2 0 0 0
SCHUYLKILL 286 1.2% 210 76 0 217 41 27 0 1
SNYDER 75 0.3% 51 24 0 69 3 1 2 0
SOMERSET 75 0.3% 58 17 0 64 6 0 0 5
SULLIVAN 2 0.0% 1 1 0 2 0 0 0 0
SUSQUEHANNA 55 0.2% 48 7 0 53 0 1 1 0
TIOGA 44 0.2% 29 15 0 37 2 3 2 0
UNION 52 0.2% 42 10 0 34 5 12 1 0
VENANGO 133 0.5% 104 29 0 111 18 2 1 1
WARREN 71 0.3% 55 16 0 65 1 0 3 2
WASHINGTON 359 1.4% 254 105 0 258 92 7 0 2
WAYNE 28 0.1% 19 9 0 19 8 0 1 0
WESTMORELAND 627 2.5% 459 168 0 405 152 16 54 0
WYOMING 51 0.2% 39 12 0 43 5 2 0 1
YORK 1,586 6.4% 1,212 374 0 735 446 283 54 68
TOTAL 24,800 100.0% 18,508 6,285 7 10,809 9,373 3,285 746 587
% OF TOTAL 100.0% 74.6% 25.3% 0.03% 43.6% 37.8% 13.2% 3.0% 2.4%
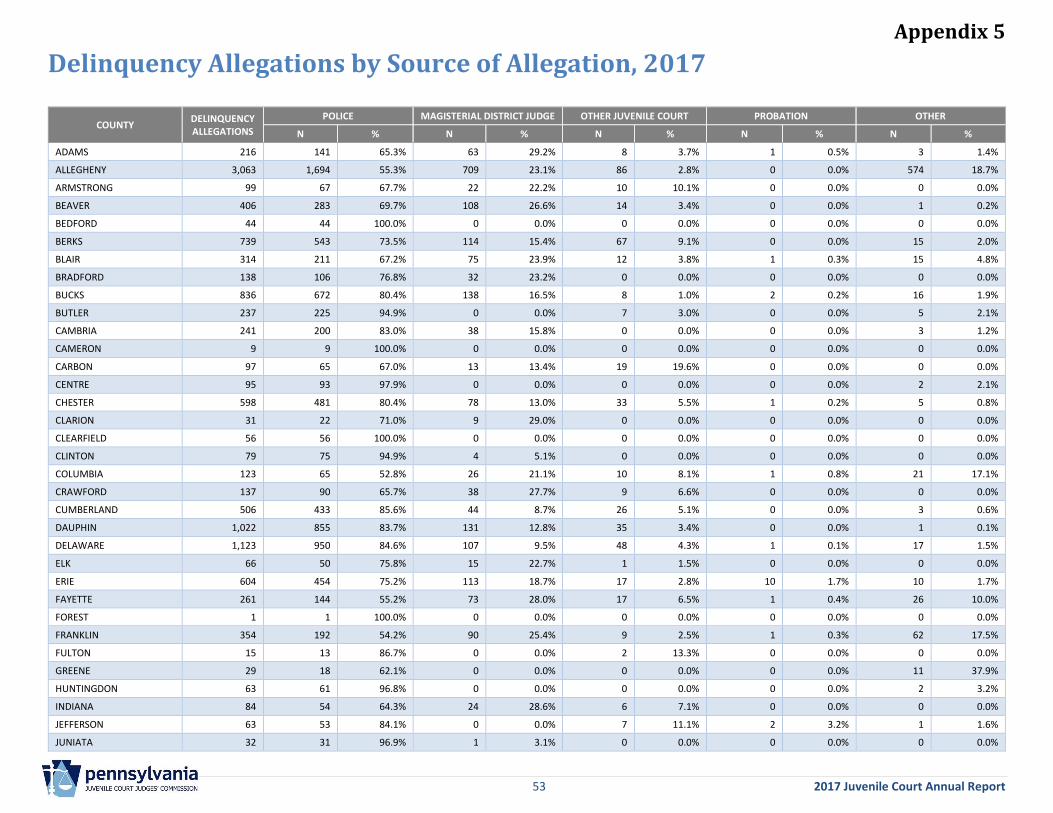
Appendix 5
53 2017 Juvenile Court Annual Report
Delinquency Allegations by Source of Allegation, 2017
COUNTY DELINQUENCY ALLEGATIONS
POLICE MAGISTERIAL DISTRICT JUDGE OTHER JUVENILE COURT PROBATION OTHER
N % N % N % N % N %
ADAMS 216 141 65.3% 63 29.2% 8 3.7% 1 0.5% 3 1.4%
ALLEGHENY 3,063 1,694 55.3% 709 23.1% 86 2.8% 0 0.0% 574 18.7%
ARMSTRONG 99 67 67.7% 22 22.2% 10 10.1% 0 0.0% 0 0.0%
BEAVER 406 283 69.7% 108 26.6% 14 3.4% 0 0.0% 1 0.2%
BEDFORD 44 44 100.0% 0 0.0% 0 0.0% 0 0.0% 0 0.0%
BERKS 739 543 73.5% 114 15.4% 67 9.1% 0 0.0% 15 2.0%
BLAIR 314 211 67.2% 75 23.9% 12 3.8% 1 0.3% 15 4.8%
BRADFORD 138 106 76.8% 32 23.2% 0 0.0% 0 0.0% 0 0.0%
BUCKS 836 672 80.4% 138 16.5% 8 1.0% 2 0.2% 16 1.9%
BUTLER 237 225 94.9% 0 0.0% 7 3.0% 0 0.0% 5 2.1%
CAMBRIA 241 200 83.0% 38 15.8% 0 0.0% 0 0.0% 3 1.2%
CAMERON 9 9 100.0% 0 0.0% 0 0.0% 0 0.0% 0 0.0%
CARBON 97 65 67.0% 13 13.4% 19 19.6% 0 0.0% 0 0.0%
CENTRE 95 93 97.9% 0 0.0% 0 0.0% 0 0.0% 2 2.1%
CHESTER 598 481 80.4% 78 13.0% 33 5.5% 1 0.2% 5 0.8%
CLARION 31 22 71.0% 9 29.0% 0 0.0% 0 0.0% 0 0.0%
CLEARFIELD 56 56 100.0% 0 0.0% 0 0.0% 0 0.0% 0 0.0%
CLINTON 79 75 94.9% 4 5.1% 0 0.0% 0 0.0% 0 0.0%
COLUMBIA 123 65 52.8% 26 21.1% 10 8.1% 1 0.8% 21 17.1%
CRAWFORD 137 90 65.7% 38 27.7% 9 6.6% 0 0.0% 0 0.0%
CUMBERLAND 506 433 85.6% 44 8.7% 26 5.1% 0 0.0% 3 0.6%
DAUPHIN 1,022 855 83.7% 131 12.8% 35 3.4% 0 0.0% 1 0.1%
DELAWARE 1,123 950 84.6% 107 9.5% 48 4.3% 1 0.1% 17 1.5%
ELK 66 50 75.8% 15 22.7% 1 1.5% 0 0.0% 0 0.0%
ERIE 604 454 75.2% 113 18.7% 17 2.8% 10 1.7% 10 1.7%
FAYETTE 261 144 55.2% 73 28.0% 17 6.5% 1 0.4% 26 10.0%
FOREST 1 1 100.0% 0 0.0% 0 0.0% 0 0.0% 0 0.0%
FRANKLIN 354 192 54.2% 90 25.4% 9 2.5% 1 0.3% 62 17.5%
FULTON 15 13 86.7% 0 0.0% 2 13.3% 0 0.0% 0 0.0%
GREENE 29 18 62.1% 0 0.0% 0 0.0% 0 0.0% 11 37.9%
HUNTINGDON 63 61 96.8% 0 0.0% 0 0.0% 0 0.0% 2 3.2%
INDIANA 84 54 64.3% 24 28.6% 6 7.1% 0 0.0% 0 0.0%
JEFFERSON 63 53 84.1% 0 0.0% 7 11.1% 2 3.2% 1 1.6%
JUNIATA 32 31 96.9% 1 3.1% 0 0.0% 0 0.0% 0 0.0%
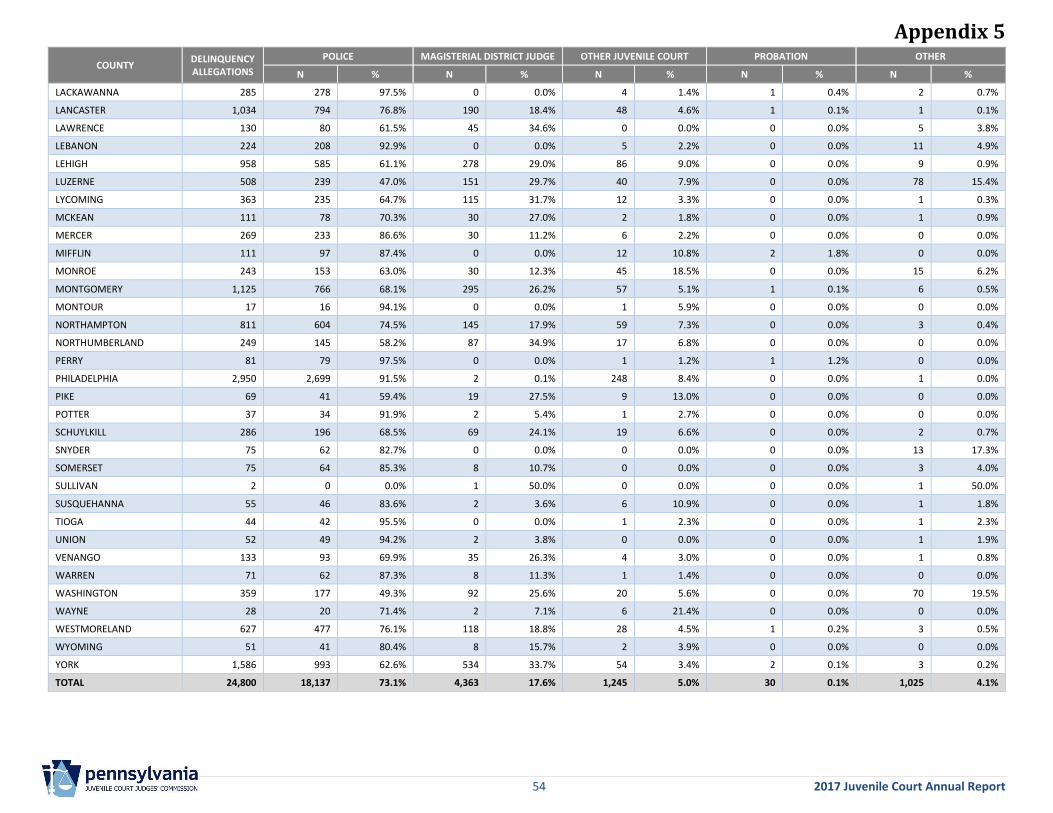
Appendix 5
54 2017 Juvenile Court Annual Report
COUNTY DELINQUENCY ALLEGATIONS
POLICE MAGISTERIAL DISTRICT JUDGE OTHER JUVENILE COURT PROBATION OTHER
N % N % N % N % N %
LACKAWANNA 285 278 97.5% 0 0.0% 4 1.4% 1 0.4% 2 0.7%
LANCASTER 1,034 794 76.8% 190 18.4% 48 4.6% 1 0.1% 1 0.1%
LAWRENCE 130 80 61.5% 45 34.6% 0 0.0% 0 0.0% 5 3.8%
LEBANON 224 208 92.9% 0 0.0% 5 2.2% 0 0.0% 11 4.9%
LEHIGH 958 585 61.1% 278 29.0% 86 9.0% 0 0.0% 9 0.9%
LUZERNE 508 239 47.0% 151 29.7% 40 7.9% 0 0.0% 78 15.4%
LYCOMING 363 235 64.7% 115 31.7% 12 3.3% 0 0.0% 1 0.3%
MCKEAN 111 78 70.3% 30 27.0% 2 1.8% 0 0.0% 1 0.9%
MERCER 269 233 86.6% 30 11.2% 6 2.2% 0 0.0% 0 0.0%
MIFFLIN 111 97 87.4% 0 0.0% 12 10.8% 2 1.8% 0 0.0%
MONROE 243 153 63.0% 30 12.3% 45 18.5% 0 0.0% 15 6.2%
MONTGOMERY 1,125 766 68.1% 295 26.2% 57 5.1% 1 0.1% 6 0.5%
MONTOUR 17 16 94.1% 0 0.0% 1 5.9% 0 0.0% 0 0.0%
NORTHAMPTON 811 604 74.5% 145 17.9% 59 7.3% 0 0.0% 3 0.4%
NORTHUMBERLAND 249 145 58.2% 87 34.9% 17 6.8% 0 0.0% 0 0.0%
PERRY 81 79 97.5% 0 0.0% 1 1.2% 1 1.2% 0 0.0%
PHILADELPHIA 2,950 2,699 91.5% 2 0.1% 248 8.4% 0 0.0% 1 0.0%
PIKE 69 41 59.4% 19 27.5% 9 13.0% 0 0.0% 0 0.0%
POTTER 37 34 91.9% 2 5.4% 1 2.7% 0 0.0% 0 0.0%
SCHUYLKILL 286 196 68.5% 69 24.1% 19 6.6% 0 0.0% 2 0.7%
SNYDER 75 62 82.7% 0 0.0% 0 0.0% 0 0.0% 13 17.3%
SOMERSET 75 64 85.3% 8 10.7% 0 0.0% 0 0.0% 3 4.0%
SULLIVAN 2 0 0.0% 1 50.0% 0 0.0% 0 0.0% 1 50.0%
SUSQUEHANNA 55 46 83.6% 2 3.6% 6 10.9% 0 0.0% 1 1.8%
TIOGA 44 42 95.5% 0 0.0% 1 2.3% 0 0.0% 1 2.3%
UNION 52 49 94.2% 2 3.8% 0 0.0% 0 0.0% 1 1.9%
VENANGO 133 93 69.9% 35 26.3% 4 3.0% 0 0.0% 1 0.8%
WARREN 71 62 87.3% 8 11.3% 1 1.4% 0 0.0% 0 0.0%
WASHINGTON 359 177 49.3% 92 25.6% 20 5.6% 0 0.0% 70 19.5%
WAYNE 28 20 71.4% 2 7.1% 6 21.4% 0 0.0% 0 0.0%
WESTMORELAND 627 477 76.1% 118 18.8% 28 4.5% 1 0.2% 3 0.5%
WYOMING 51 41 80.4% 8 15.7% 2 3.9% 0 0.0% 0 0.0%
YORK 1,586 993 62.6% 534 33.7% 54 3.4% 2 0.1% 3 0.2%
TOTAL 24,800 18,137 73.1% 4,363 17.6% 1,245 5.0% 30 0.1% 1,025 4.1%
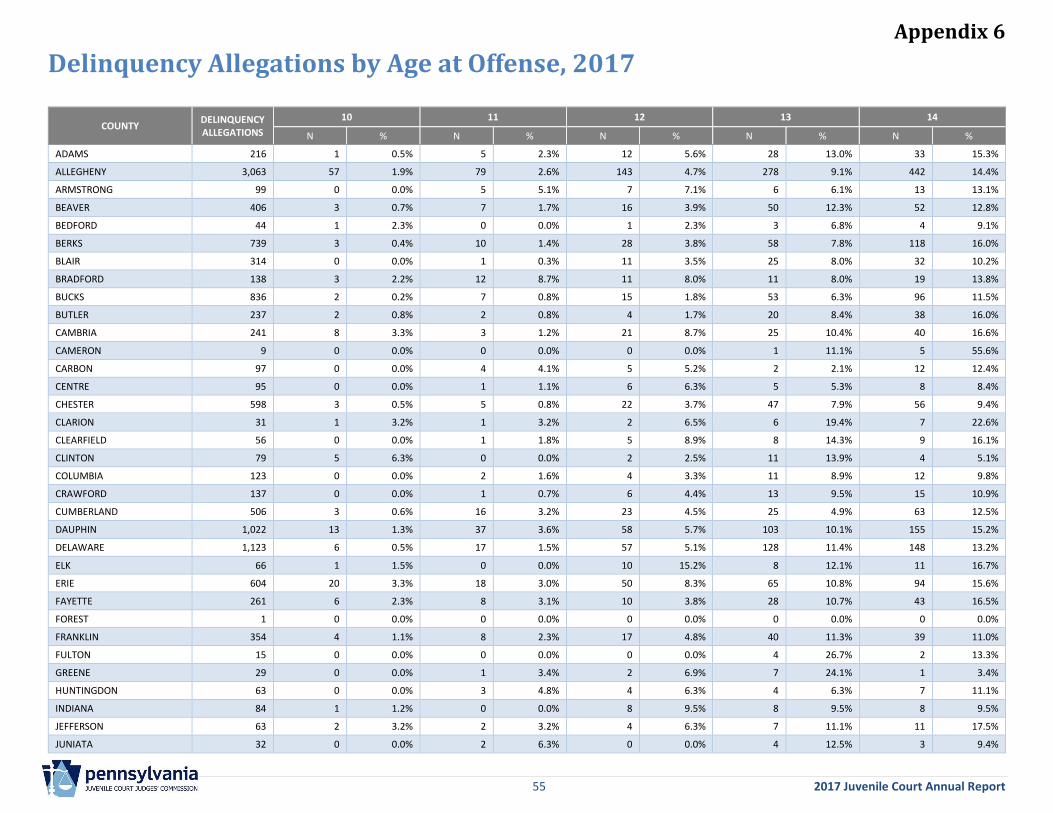
Appendix 6
55 2017 Juvenile Court Annual Report
Delinquency Allegations by Age at Offense, 2017
COUNTY DELINQUENCY ALLEGATIONS
10 11 12 13 14
N % N % N % N % N %
ADAMS 216 1 0.5% 5 2.3% 12 5.6% 28 13.0% 33 15.3%
ALLEGHENY 3,063 57 1.9% 79 2.6% 143 4.7% 278 9.1% 442 14.4%
ARMSTRONG 99 0 0.0% 5 5.1% 7 7.1% 6 6.1% 13 13.1%
BEAVER 406 3 0.7% 7 1.7% 16 3.9% 50 12.3% 52 12.8%
BEDFORD 44 1 2.3% 0 0.0% 1 2.3% 3 6.8% 4 9.1%
BERKS 739 3 0.4% 10 1.4% 28 3.8% 58 7.8% 118 16.0%
BLAIR 314 0 0.0% 1 0.3% 11 3.5% 25 8.0% 32 10.2%
BRADFORD 138 3 2.2% 12 8.7% 11 8.0% 11 8.0% 19 13.8%
BUCKS 836 2 0.2% 7 0.8% 15 1.8% 53 6.3% 96 11.5%
BUTLER 237 2 0.8% 2 0.8% 4 1.7% 20 8.4% 38 16.0%
CAMBRIA 241 8 3.3% 3 1.2% 21 8.7% 25 10.4% 40 16.6%
CAMERON 9 0 0.0% 0 0.0% 0 0.0% 1 11.1% 5 55.6%
CARBON 97 0 0.0% 4 4.1% 5 5.2% 2 2.1% 12 12.4%
CENTRE 95 0 0.0% 1 1.1% 6 6.3% 5 5.3% 8 8.4%
CHESTER 598 3 0.5% 5 0.8% 22 3.7% 47 7.9% 56 9.4%
CLARION 31 1 3.2% 1 3.2% 2 6.5% 6 19.4% 7 22.6%
CLEARFIELD 56 0 0.0% 1 1.8% 5 8.9% 8 14.3% 9 16.1%
CLINTON 79 5 6.3% 0 0.0% 2 2.5% 11 13.9% 4 5.1%
COLUMBIA 123 0 0.0% 2 1.6% 4 3.3% 11 8.9% 12 9.8%
CRAWFORD 137 0 0.0% 1 0.7% 6 4.4% 13 9.5% 15 10.9%
CUMBERLAND 506 3 0.6% 16 3.2% 23 4.5% 25 4.9% 63 12.5%
DAUPHIN 1,022 13 1.3% 37 3.6% 58 5.7% 103 10.1% 155 15.2%
DELAWARE 1,123 6 0.5% 17 1.5% 57 5.1% 128 11.4% 148 13.2%
ELK 66 1 1.5% 0 0.0% 10 15.2% 8 12.1% 11 16.7%
ERIE 604 20 3.3% 18 3.0% 50 8.3% 65 10.8% 94 15.6%
FAYETTE 261 6 2.3% 8 3.1% 10 3.8% 28 10.7% 43 16.5%
FOREST 1 0 0.0% 0 0.0% 0 0.0% 0 0.0% 0 0.0%
FRANKLIN 354 4 1.1% 8 2.3% 17 4.8% 40 11.3% 39 11.0%
FULTON 15 0 0.0% 0 0.0% 0 0.0% 4 26.7% 2 13.3%
GREENE 29 0 0.0% 1 3.4% 2 6.9% 7 24.1% 1 3.4%
HUNTINGDON 63 0 0.0% 3 4.8% 4 6.3% 4 6.3% 7 11.1%
INDIANA 84 1 1.2% 0 0.0% 8 9.5% 8 9.5% 8 9.5%
JEFFERSON 63 2 3.2% 2 3.2% 4 6.3% 7 11.1% 11 17.5%
JUNIATA 32 0 0.0% 2 6.3% 0 0.0% 4 12.5% 3 9.4%
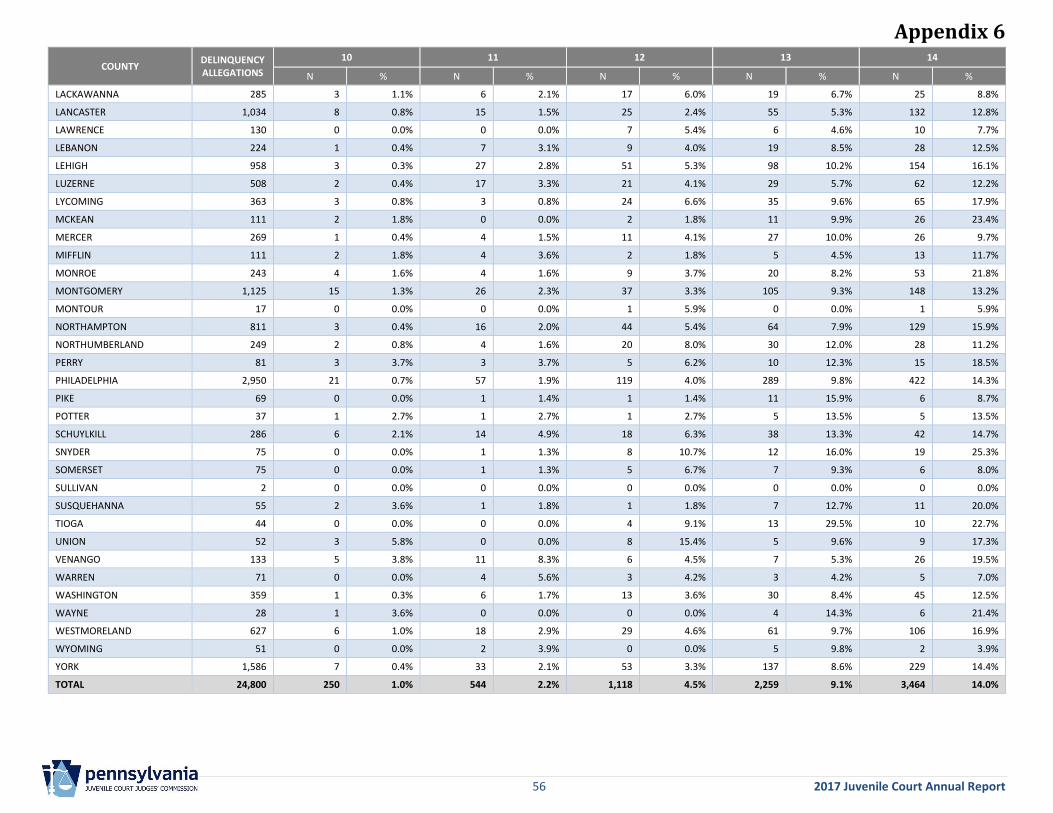
Appendix 6
56 2017 Juvenile Court Annual Report
COUNTY DELINQUENCY ALLEGATIONS
10 11 12 13 14
N % N % N % N % N %
LACKAWANNA 285 3 1.1% 6 2.1% 17 6.0% 19 6.7% 25 8.8%
LANCASTER 1,034 8 0.8% 15 1.5% 25 2.4% 55 5.3% 132 12.8%
LAWRENCE 130 0 0.0% 0 0.0% 7 5.4% 6 4.6% 10 7.7%
LEBANON 224 1 0.4% 7 3.1% 9 4.0% 19 8.5% 28 12.5%
LEHIGH 958 3 0.3% 27 2.8% 51 5.3% 98 10.2% 154 16.1%
LUZERNE 508 2 0.4% 17 3.3% 21 4.1% 29 5.7% 62 12.2%
LYCOMING 363 3 0.8% 3 0.8% 24 6.6% 35 9.6% 65 17.9%
MCKEAN 111 2 1.8% 0 0.0% 2 1.8% 11 9.9% 26 23.4%
MERCER 269 1 0.4% 4 1.5% 11 4.1% 27 10.0% 26 9.7%
MIFFLIN 111 2 1.8% 4 3.6% 2 1.8% 5 4.5% 13 11.7%
MONROE 243 4 1.6% 4 1.6% 9 3.7% 20 8.2% 53 21.8%
MONTGOMERY 1,125 15 1.3% 26 2.3% 37 3.3% 105 9.3% 148 13.2%
MONTOUR 17 0 0.0% 0 0.0% 1 5.9% 0 0.0% 1 5.9%
NORTHAMPTON 811 3 0.4% 16 2.0% 44 5.4% 64 7.9% 129 15.9%
NORTHUMBERLAND 249 2 0.8% 4 1.6% 20 8.0% 30 12.0% 28 11.2%
PERRY 81 3 3.7% 3 3.7% 5 6.2% 10 12.3% 15 18.5%
PHILADELPHIA 2,950 21 0.7% 57 1.9% 119 4.0% 289 9.8% 422 14.3%
PIKE 69 0 0.0% 1 1.4% 1 1.4% 11 15.9% 6 8.7%
POTTER 37 1 2.7% 1 2.7% 1 2.7% 5 13.5% 5 13.5%
SCHUYLKILL 286 6 2.1% 14 4.9% 18 6.3% 38 13.3% 42 14.7%
SNYDER 75 0 0.0% 1 1.3% 8 10.7% 12 16.0% 19 25.3%
SOMERSET 75 0 0.0% 1 1.3% 5 6.7% 7 9.3% 6 8.0%
SULLIVAN 2 0 0.0% 0 0.0% 0 0.0% 0 0.0% 0 0.0%
SUSQUEHANNA 55 2 3.6% 1 1.8% 1 1.8% 7 12.7% 11 20.0%
TIOGA 44 0 0.0% 0 0.0% 4 9.1% 13 29.5% 10 22.7%
UNION 52 3 5.8% 0 0.0% 8 15.4% 5 9.6% 9 17.3%
VENANGO 133 5 3.8% 11 8.3% 6 4.5% 7 5.3% 26 19.5%
WARREN 71 0 0.0% 4 5.6% 3 4.2% 3 4.2% 5 7.0%
WASHINGTON 359 1 0.3% 6 1.7% 13 3.6% 30 8.4% 45 12.5%
WAYNE 28 1 3.6% 0 0.0% 0 0.0% 4 14.3% 6 21.4%
WESTMORELAND 627 6 1.0% 18 2.9% 29 4.6% 61 9.7% 106 16.9%
WYOMING 51 0 0.0% 2 3.9% 0 0.0% 5 9.8% 2 3.9%
YORK 1,586 7 0.4% 33 2.1% 53 3.3% 137 8.6% 229 14.4%
TOTAL 24,800 250 1.0% 544 2.2% 1,118 4.5% 2,259 9.1% 3,464 14.0%
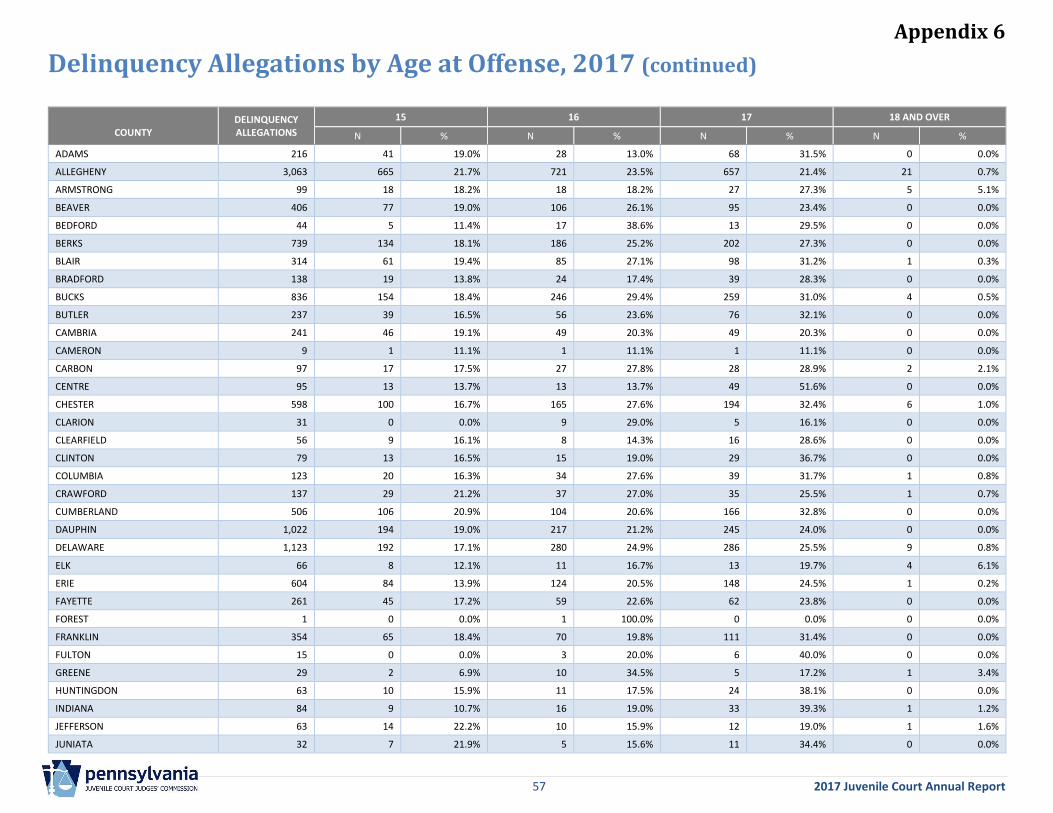
Appendix 6
57 2017 Juvenile Court Annual Report
Delinquency Allegations by Age at Offense, 2017 (continued)
COUNTY
DELINQUENCY ALLEGATIONS
15 16 17 18 AND OVER
N % N % N % N %
ADAMS 216 41 19.0% 28 13.0% 68 31.5% 0 0.0%
ALLEGHENY 3,063 665 21.7% 721 23.5% 657 21.4% 21 0.7%
ARMSTRONG 99 18 18.2% 18 18.2% 27 27.3% 5 5.1%
BEAVER 406 77 19.0% 106 26.1% 95 23.4% 0 0.0%
BEDFORD 44 5 11.4% 17 38.6% 13 29.5% 0 0.0%
BERKS 739 134 18.1% 186 25.2% 202 27.3% 0 0.0%
BLAIR 314 61 19.4% 85 27.1% 98 31.2% 1 0.3%
BRADFORD 138 19 13.8% 24 17.4% 39 28.3% 0 0.0%
BUCKS 836 154 18.4% 246 29.4% 259 31.0% 4 0.5%
BUTLER 237 39 16.5% 56 23.6% 76 32.1% 0 0.0%
CAMBRIA 241 46 19.1% 49 20.3% 49 20.3% 0 0.0%
CAMERON 9 1 11.1% 1 11.1% 1 11.1% 0 0.0%
CARBON 97 17 17.5% 27 27.8% 28 28.9% 2 2.1%
CENTRE 95 13 13.7% 13 13.7% 49 51.6% 0 0.0%
CHESTER 598 100 16.7% 165 27.6% 194 32.4% 6 1.0%
CLARION 31 0 0.0% 9 29.0% 5 16.1% 0 0.0%
CLEARFIELD 56 9 16.1% 8 14.3% 16 28.6% 0 0.0%
CLINTON 79 13 16.5% 15 19.0% 29 36.7% 0 0.0%
COLUMBIA 123 20 16.3% 34 27.6% 39 31.7% 1 0.8%
CRAWFORD 137 29 21.2% 37 27.0% 35 25.5% 1 0.7%
CUMBERLAND 506 106 20.9% 104 20.6% 166 32.8% 0 0.0%
DAUPHIN 1,022 194 19.0% 217 21.2% 245 24.0% 0 0.0%
DELAWARE 1,123 192 17.1% 280 24.9% 286 25.5% 9 0.8%
ELK 66 8 12.1% 11 16.7% 13 19.7% 4 6.1%
ERIE 604 84 13.9% 124 20.5% 148 24.5% 1 0.2%
FAYETTE 261 45 17.2% 59 22.6% 62 23.8% 0 0.0%
FOREST 1 0 0.0% 1 100.0% 0 0.0% 0 0.0%
FRANKLIN 354 65 18.4% 70 19.8% 111 31.4% 0 0.0%
FULTON 15 0 0.0% 3 20.0% 6 40.0% 0 0.0%
GREENE 29 2 6.9% 10 34.5% 5 17.2% 1 3.4%
HUNTINGDON 63 10 15.9% 11 17.5% 24 38.1% 0 0.0%
INDIANA 84 9 10.7% 16 19.0% 33 39.3% 1 1.2%
JEFFERSON 63 14 22.2% 10 15.9% 12 19.0% 1 1.6%
JUNIATA 32 7 21.9% 5 15.6% 11 34.4% 0 0.0%
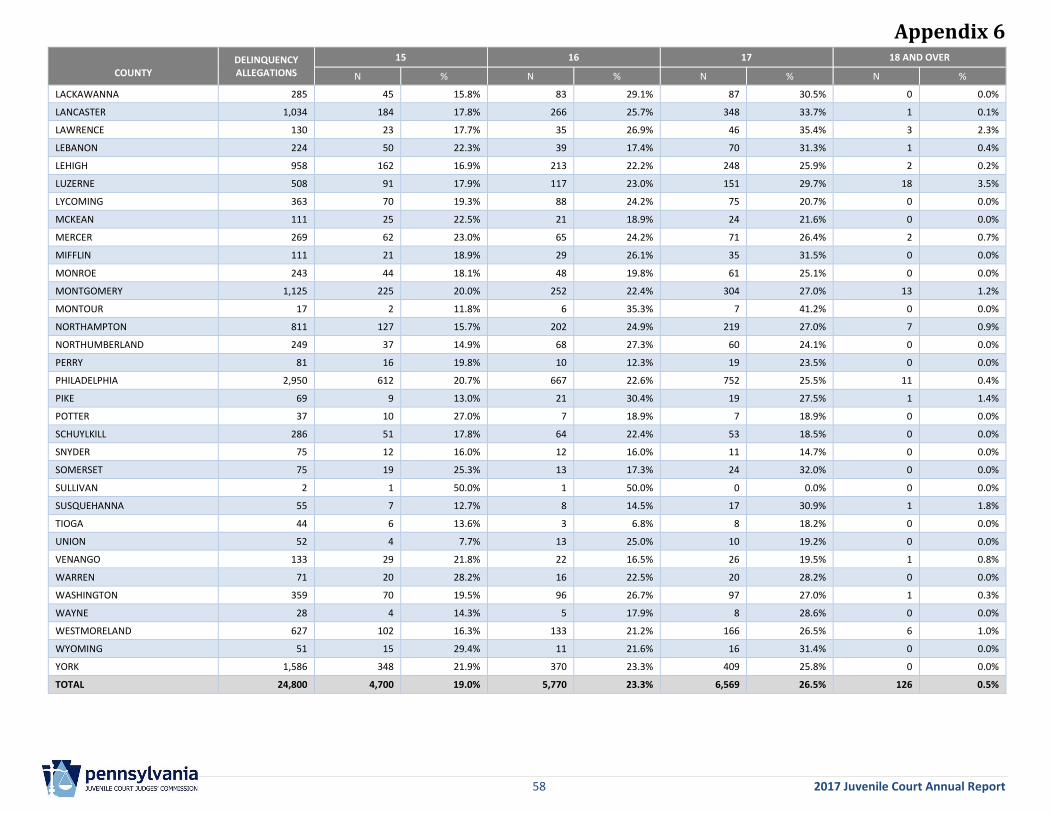
Appendix 6
58 2017 Juvenile Court Annual Report
COUNTY
DELINQUENCY ALLEGATIONS
15 16 17 18 AND OVER
N % N % N % N %
LACKAWANNA 285 45 15.8% 83 29.1% 87 30.5% 0 0.0%
LANCASTER 1,034 184 17.8% 266 25.7% 348 33.7% 1 0.1%
LAWRENCE 130 23 17.7% 35 26.9% 46 35.4% 3 2.3%
LEBANON 224 50 22.3% 39 17.4% 70 31.3% 1 0.4%
LEHIGH 958 162 16.9% 213 22.2% 248 25.9% 2 0.2%
LUZERNE 508 91 17.9% 117 23.0% 151 29.7% 18 3.5%
LYCOMING 363 70 19.3% 88 24.2% 75 20.7% 0 0.0%
MCKEAN 111 25 22.5% 21 18.9% 24 21.6% 0 0.0%
MERCER 269 62 23.0% 65 24.2% 71 26.4% 2 0.7%
MIFFLIN 111 21 18.9% 29 26.1% 35 31.5% 0 0.0%
MONROE 243 44 18.1% 48 19.8% 61 25.1% 0 0.0%
MONTGOMERY 1,125 225 20.0% 252 22.4% 304 27.0% 13 1.2%
MONTOUR 17 2 11.8% 6 35.3% 7 41.2% 0 0.0%
NORTHAMPTON 811 127 15.7% 202 24.9% 219 27.0% 7 0.9%
NORTHUMBERLAND 249 37 14.9% 68 27.3% 60 24.1% 0 0.0%
PERRY 81 16 19.8% 10 12.3% 19 23.5% 0 0.0%
PHILADELPHIA 2,950 612 20.7% 667 22.6% 752 25.5% 11 0.4%
PIKE 69 9 13.0% 21 30.4% 19 27.5% 1 1.4%
POTTER 37 10 27.0% 7 18.9% 7 18.9% 0 0.0%
SCHUYLKILL 286 51 17.8% 64 22.4% 53 18.5% 0 0.0%
SNYDER 75 12 16.0% 12 16.0% 11 14.7% 0 0.0%
SOMERSET 75 19 25.3% 13 17.3% 24 32.0% 0 0.0%
SULLIVAN 2 1 50.0% 1 50.0% 0 0.0% 0 0.0%
SUSQUEHANNA 55 7 12.7% 8 14.5% 17 30.9% 1 1.8%
TIOGA 44 6 13.6% 3 6.8% 8 18.2% 0 0.0%
UNION 52 4 7.7% 13 25.0% 10 19.2% 0 0.0%
VENANGO 133 29 21.8% 22 16.5% 26 19.5% 1 0.8%
WARREN 71 20 28.2% 16 22.5% 20 28.2% 0 0.0%
WASHINGTON 359 70 19.5% 96 26.7% 97 27.0% 1 0.3%
WAYNE 28 4 14.3% 5 17.9% 8 28.6% 0 0.0%
WESTMORELAND 627 102 16.3% 133 21.2% 166 26.5% 6 1.0%
WYOMING 51 15 29.4% 11 21.6% 16 31.4% 0 0.0%
YORK 1,586 348 21.9% 370 23.3% 409 25.8% 0 0.0%
TOTAL 24,800 4,700 19.0% 5,770 23.3% 6,569 26.5% 126 0.5%
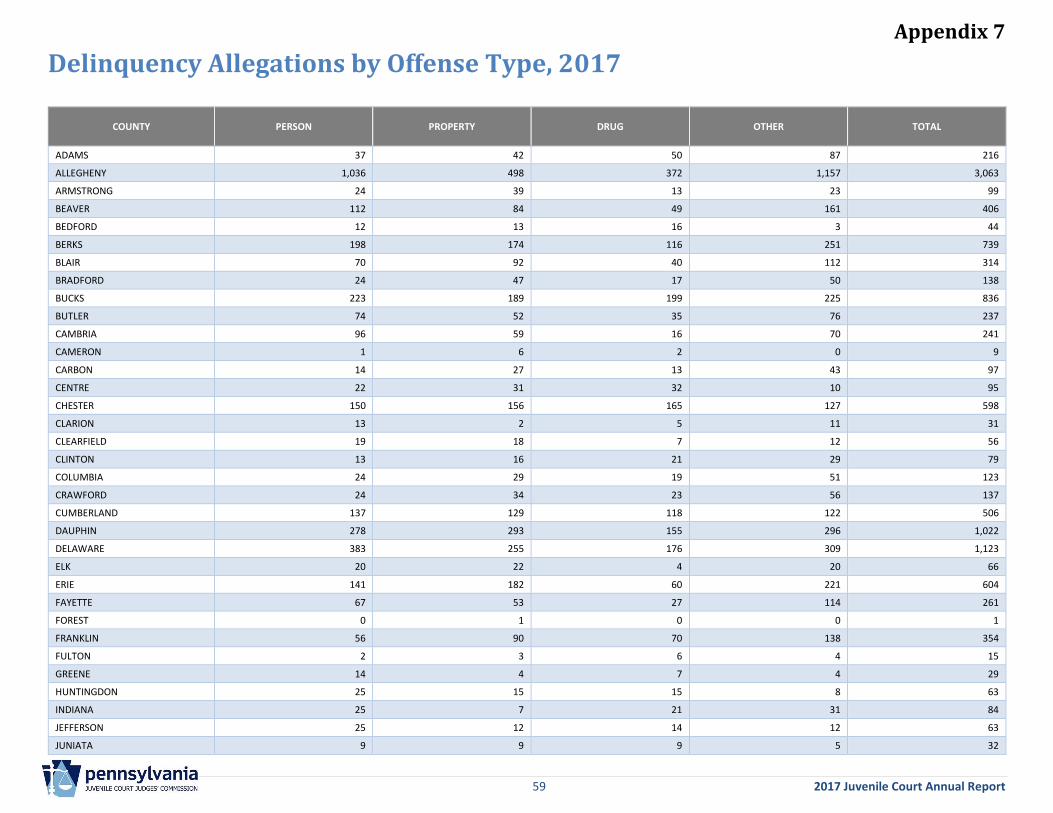
Appendix 7
59 2017 Juvenile Court Annual Report
Delinquency Allegations by Offense Type, 2017
COUNTY PERSON PROPERTY DRUG OTHER TOTAL
ADAMS 37 42 50 87 216
ALLEGHENY 1,036 498 372 1,157 3,063
ARMSTRONG 24 39 13 23 99
BEAVER 112 84 49 161 406
BEDFORD 12 13 16 3 44
BERKS 198 174 116 251 739
BLAIR 70 92 40 112 314
BRADFORD 24 47 17 50 138
BUCKS 223 189 199 225 836
BUTLER 74 52 35 76 237
CAMBRIA 96 59 16 70 241
CAMERON 1 6 2 0 9
CARBON 14 27 13 43 97
CENTRE 22 31 32 10 95
CHESTER 150 156 165 127 598
CLARION 13 2 5 11 31
CLEARFIELD 19 18 7 12 56
CLINTON 13 16 21 29 79
COLUMBIA 24 29 19 51 123
CRAWFORD 24 34 23 56 137
CUMBERLAND 137 129 118 122 506
DAUPHIN 278 293 155 296 1,022
DELAWARE 383 255 176 309 1,123
ELK 20 22 4 20 66
ERIE 141 182 60 221 604
FAYETTE 67 53 27 114 261
FOREST 0 1 0 0 1
FRANKLIN 56 90 70 138 354
FULTON 2 3 6 4 15
GREENE 14 4 7 4 29
HUNTINGDON 25 15 15 8 63
INDIANA 25 7 21 31 84
JEFFERSON 25 12 14 12 63
JUNIATA 9 9 9 5 32
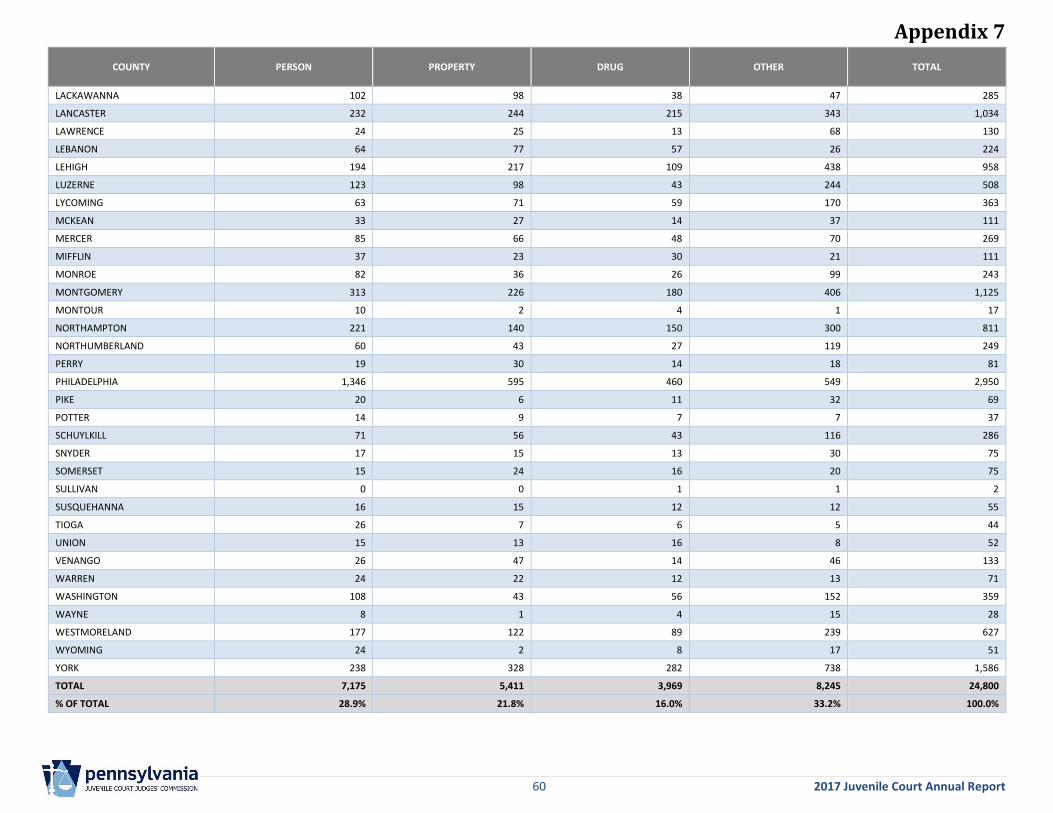
Appendix 7
60 2017 Juvenile Court Annual Report
COUNTY PERSON PROPERTY DRUG OTHER TOTAL
LACKAWANNA 102 98 38 47 285
LANCASTER 232 244 215 343 1,034
LAWRENCE 24 25 13 68 130
LEBANON 64 77 57 26 224
LEHIGH 194 217 109 438 958
LUZERNE 123 98 43 244 508
LYCOMING 63 71 59 170 363
MCKEAN 33 27 14 37 111
MERCER 85 66 48 70 269
MIFFLIN 37 23 30 21 111
MONROE 82 36 26 99 243
MONTGOMERY 313 226 180 406 1,125
MONTOUR 10 2 4 1 17
NORTHAMPTON 221 140 150 300 811
NORTHUMBERLAND 60 43 27 119 249
PERRY 19 30 14 18 81
PHILADELPHIA 1,346 595 460 549 2,950
PIKE 20 6 11 32 69
POTTER 14 9 7 7 37
SCHUYLKILL 71 56 43 116 286
SNYDER 17 15 13 30 75
SOMERSET 15 24 16 20 75
SULLIVAN 0 0 1 1 2
SUSQUEHANNA 16 15 12 12 55
TIOGA 26 7 6 5 44
UNION 15 13 16 8 52
VENANGO 26 47 14 46 133
WARREN 24 22 12 13 71
WASHINGTON 108 43 56 152 359
WAYNE 8 1 4 15 28
WESTMORELAND 177 122 89 239 627
WYOMING 24 2 8 17 51
YORK 238 328 282 738 1,586
TOTAL 7,175 5,411 3,969 8,245 24,800
% OF TOTAL 28.9% 21.8% 16.0% 33.2% 100.0%
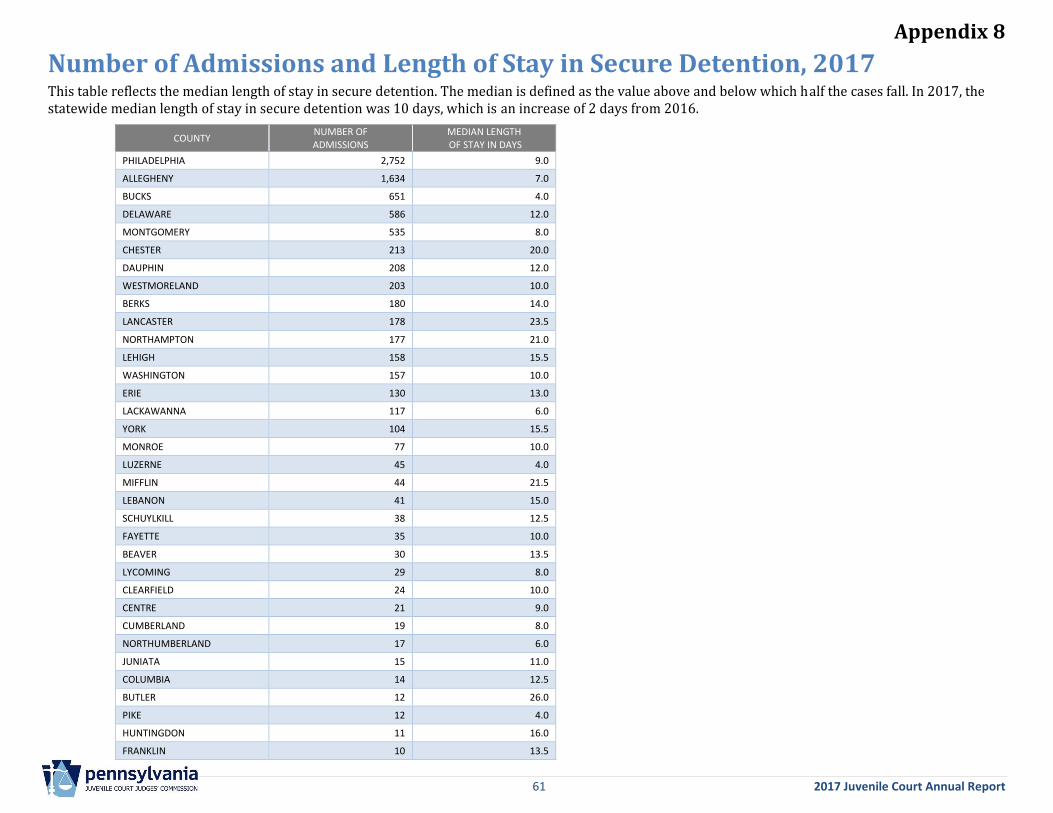
Appendix 8
61 2017 Juvenile Court Annual Report
Number of Admissions and Length of Stay in Secure Detention, 2017 This table reflects the median length of stay in secure detention. The median is defined as the value above and below which half the cases fall. In 2017, the statewide median length of stay in secure detention was 10 days, which is an increase of 2 days from 2016.
COUNTY NUMBER OF ADMISSIONS
MEDIAN LENGTH OF STAY IN DAYS
PHILADELPHIA 2,752 9.0
ALLEGHENY 1,634 7.0
BUCKS 651 4.0
DELAWARE 586 12.0
MONTGOMERY 535 8.0
CHESTER 213 20.0
DAUPHIN 208 12.0
WESTMORELAND 203 10.0
BERKS 180 14.0
LANCASTER 178 23.5
NORTHAMPTON 177 21.0
LEHIGH 158 15.5
WASHINGTON 157 10.0
ERIE 130 13.0
LACKAWANNA 117 6.0
YORK 104 15.5
MONROE 77 10.0
LUZERNE 45 4.0
MIFFLIN 44 21.5
LEBANON 41 15.0
SCHUYLKILL 38 12.5
FAYETTE 35 10.0
BEAVER 30 13.5
LYCOMING 29 8.0
CLEARFIELD 24 10.0
CENTRE 21 9.0
CUMBERLAND 19 8.0
NORTHUMBERLAND 17 6.0
JUNIATA 15 11.0
COLUMBIA 14 12.5
BUTLER 12 26.0
PIKE 12 4.0
HUNTINGDON 11 16.0
FRANKLIN 10 13.5
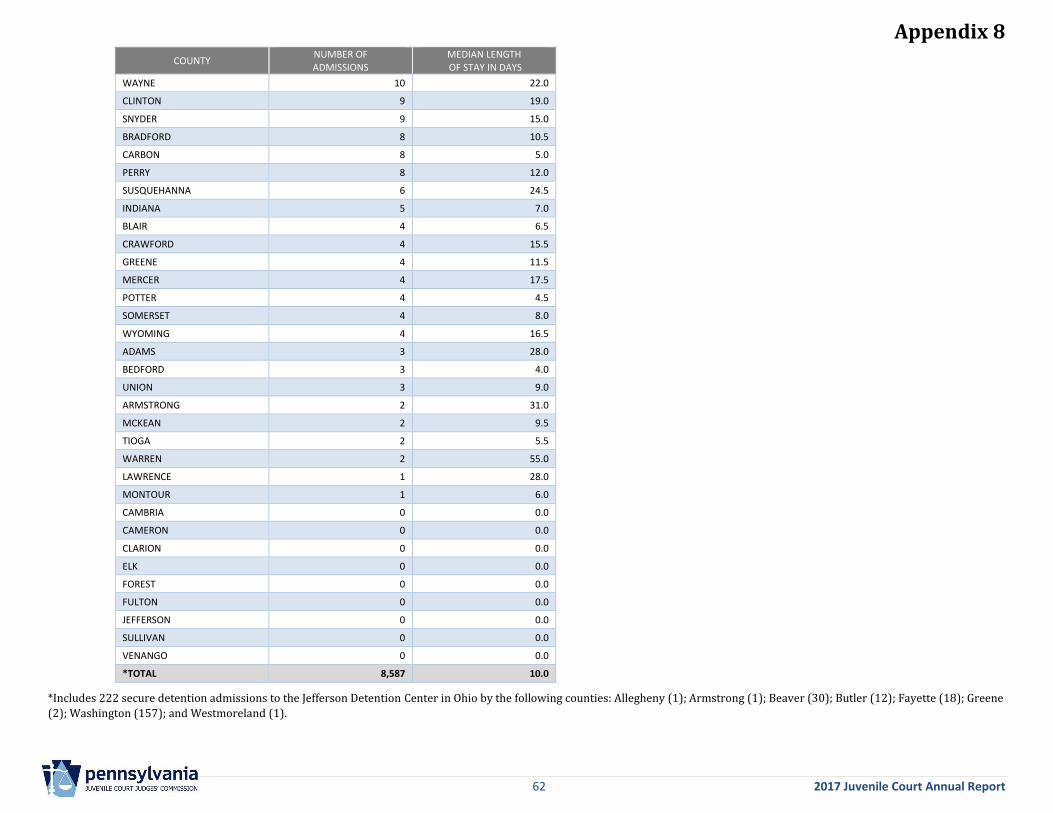
Appendix 8
62 2017 Juvenile Court Annual Report
COUNTY NUMBER OF ADMISSIONS
MEDIAN LENGTH OF STAY IN DAYS
WAYNE 10 22.0
CLINTON 9 19.0
SNYDER 9 15.0
BRADFORD 8 10.5
CARBON 8 5.0
PERRY 8 12.0
SUSQUEHANNA 6 24.5
INDIANA 5 7.0
BLAIR 4 6.5
CRAWFORD 4 15.5
GREENE 4 11.5
MERCER 4 17.5
POTTER 4 4.5
SOMERSET 4 8.0
WYOMING 4 16.5
ADAMS 3 28.0
BEDFORD 3 4.0
UNION 3 9.0
ARMSTRONG 2 31.0
MCKEAN 2 9.5
TIOGA 2 5.5
WARREN 2 55.0
LAWRENCE 1 28.0
MONTOUR 1 6.0
CAMBRIA 0 0.0
CAMERON 0 0.0
CLARION 0 0.0
ELK 0 0.0
FOREST 0 0.0
FULTON 0 0.0
JEFFERSON 0 0.0
SULLIVAN 0 0.0
VENANGO 0 0.0
*TOTAL 8,587 10.0
*Includes 222 secure detention admissions to the Jefferson Detention Center in Ohio by the following counties: Allegheny (1); Armstrong (1); Beaver (30); Butler (12); Fayette (18); Greene
(2); Washington (157); and Westmoreland (1).
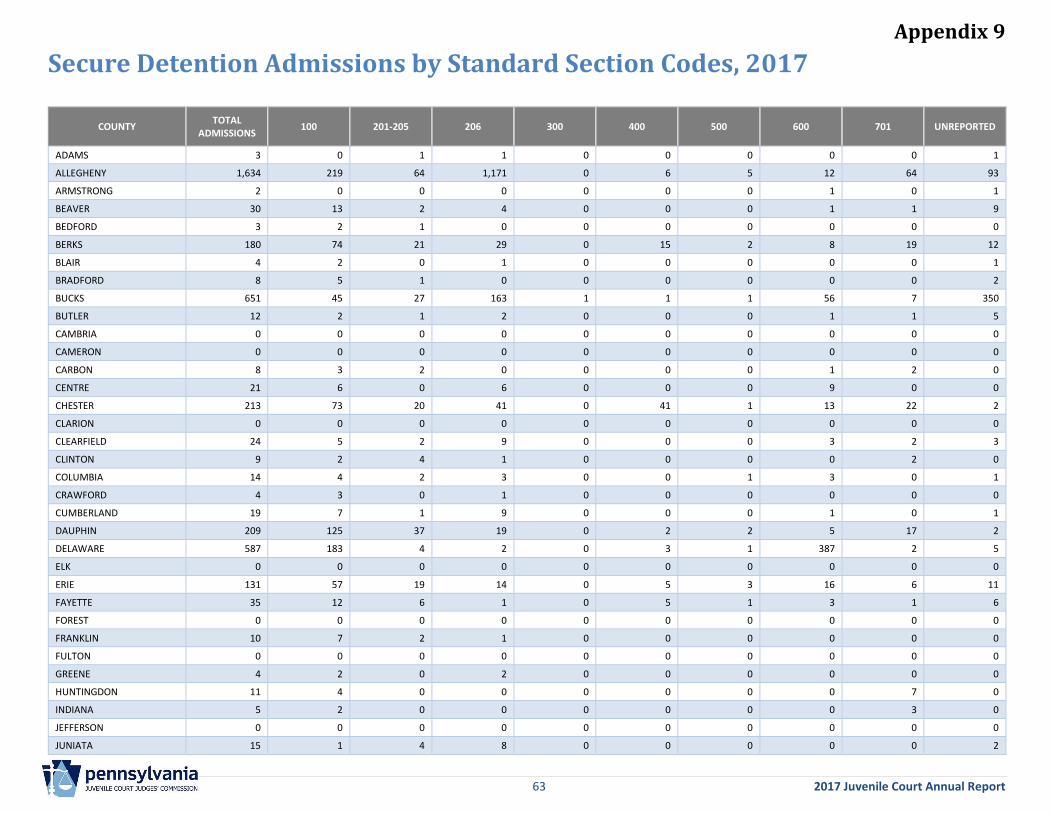
Appendix 9
63 2017 Juvenile Court Annual Report
Secure Detention Admissions by Standard Section Codes, 2017
COUNTY TOTAL
ADMISSIONS 100 201-205 206 300 400 500 600 701 UNREPORTED
ADAMS 3 0 1 1 0 0 0 0 0 1
ALLEGHENY 1,634 219 64 1,171 0 6 5 12 64 93
ARMSTRONG 2 0 0 0 0 0 0 1 0 1
BEAVER 30 13 2 4 0 0 0 1 1 9
BEDFORD 3 2 1 0 0 0 0 0 0 0
BERKS 180 74 21 29 0 15 2 8 19 12
BLAIR 4 2 0 1 0 0 0 0 0 1
BRADFORD 8 5 1 0 0 0 0 0 0 2
BUCKS 651 45 27 163 1 1 1 56 7 350
BUTLER 12 2 1 2 0 0 0 1 1 5
CAMBRIA 0 0 0 0 0 0 0 0 0 0
CAMERON 0 0 0 0 0 0 0 0 0 0
CARBON 8 3 2 0 0 0 0 1 2 0
CENTRE 21 6 0 6 0 0 0 9 0 0
CHESTER 213 73 20 41 0 41 1 13 22 2
CLARION 0 0 0 0 0 0 0 0 0 0
CLEARFIELD 24 5 2 9 0 0 0 3 2 3
CLINTON 9 2 4 1 0 0 0 0 2 0
COLUMBIA 14 4 2 3 0 0 1 3 0 1
CRAWFORD 4 3 0 1 0 0 0 0 0 0
CUMBERLAND 19 7 1 9 0 0 0 1 0 1
DAUPHIN 209 125 37 19 0 2 2 5 17 2
DELAWARE 587 183 4 2 0 3 1 387 2 5
ELK 0 0 0 0 0 0 0 0 0 0
ERIE 131 57 19 14 0 5 3 16 6 11
FAYETTE 35 12 6 1 0 5 1 3 1 6
FOREST 0 0 0 0 0 0 0 0 0 0
FRANKLIN 10 7 2 1 0 0 0 0 0 0
FULTON 0 0 0 0 0 0 0 0 0 0
GREENE 4 2 0 2 0 0 0 0 0 0
HUNTINGDON 11 4 0 0 0 0 0 0 7 0
INDIANA 5 2 0 0 0 0 0 0 3 0
JEFFERSON 0 0 0 0 0 0 0 0 0 0
JUNIATA 15 1 4 8 0 0 0 0 0 2
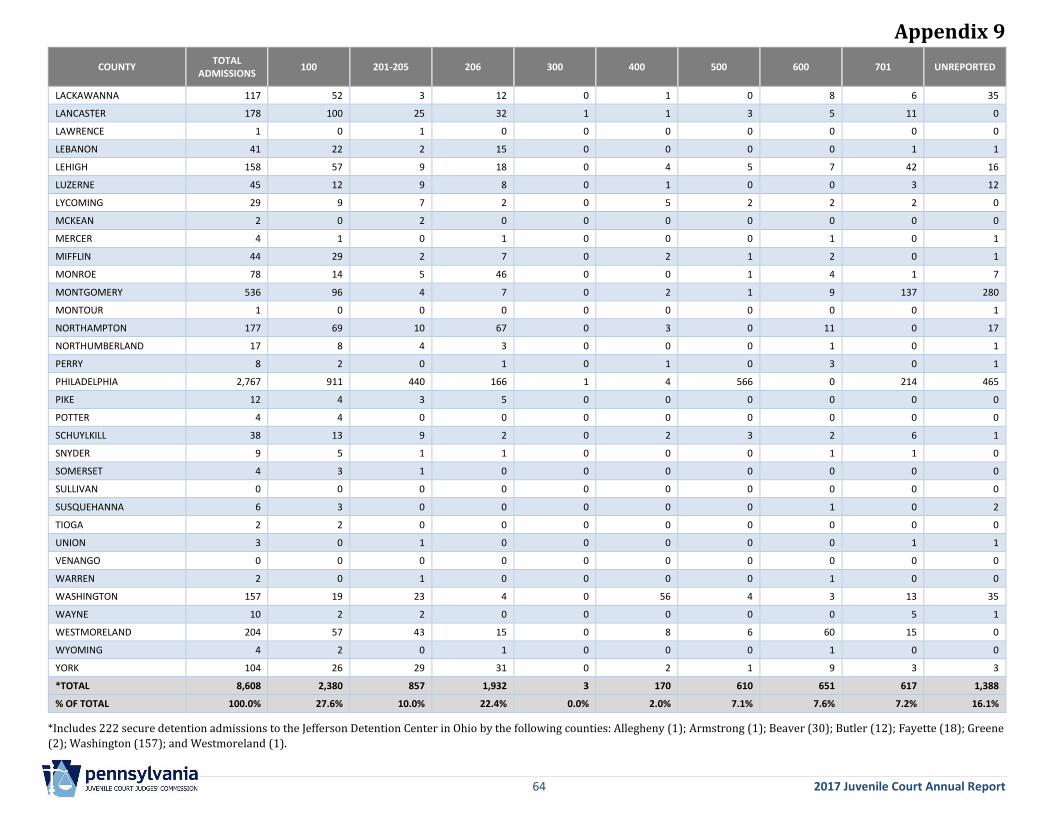
Appendix 9
64 2017 Juvenile Court Annual Report
COUNTY TOTAL
ADMISSIONS 100 201-205 206 300 400 500 600 701 UNREPORTED
LACKAWANNA 117 52 3 12 0 1 0 8 6 35
LANCASTER 178 100 25 32 1 1 3 5 11 0
LAWRENCE 1 0 1 0 0 0 0 0 0 0
LEBANON 41 22 2 15 0 0 0 0 1 1
LEHIGH 158 57 9 18 0 4 5 7 42 16
LUZERNE 45 12 9 8 0 1 0 0 3 12
LYCOMING 29 9 7 2 0 5 2 2 2 0
MCKEAN 2 0 2 0 0 0 0 0 0 0
MERCER 4 1 0 1 0 0 0 1 0 1
MIFFLIN 44 29 2 7 0 2 1 2 0 1
MONROE 78 14 5 46 0 0 1 4 1 7
MONTGOMERY 536 96 4 7 0 2 1 9 137 280
MONTOUR 1 0 0 0 0 0 0 0 0 1
NORTHAMPTON 177 69 10 67 0 3 0 11 0 17
NORTHUMBERLAND 17 8 4 3 0 0 0 1 0 1
PERRY 8 2 0 1 0 1 0 3 0 1
PHILADELPHIA 2,767 911 440 166 1 4 566 0 214 465
PIKE 12 4 3 5 0 0 0 0 0 0
POTTER 4 4 0 0 0 0 0 0 0 0
SCHUYLKILL 38 13 9 2 0 2 3 2 6 1
SNYDER 9 5 1 1 0 0 0 1 1 0
SOMERSET 4 3 1 0 0 0 0 0 0 0
SULLIVAN 0 0 0 0 0 0 0 0 0 0
SUSQUEHANNA 6 3 0 0 0 0 0 1 0 2
TIOGA 2 2 0 0 0 0 0 0 0 0
UNION 3 0 1 0 0 0 0 0 1 1
VENANGO 0 0 0 0 0 0 0 0 0 0
WARREN 2 0 1 0 0 0 0 1 0 0
WASHINGTON 157 19 23 4 0 56 4 3 13 35
WAYNE 10 2 2 0 0 0 0 0 5 1
WESTMORELAND 204 57 43 15 0 8 6 60 15 0
WYOMING 4 2 0 1 0 0 0 1 0 0
YORK 104 26 29 31 0 2 1 9 3 3
*TOTAL 8,608 2,380 857 1,932 3 170 610 651 617 1,388
% OF TOTAL 100.0% 27.6% 10.0% 22.4% 0.0% 2.0% 7.1% 7.6% 7.2% 16.1%
*Includes 222 secure detention admissions to the Jefferson Detention Center in Ohio by the following counties: Allegheny (1); Armstrong (1); Beaver (30); Butler (12); Fayette (18); Greene
(2); Washington (157); and Westmoreland (1).
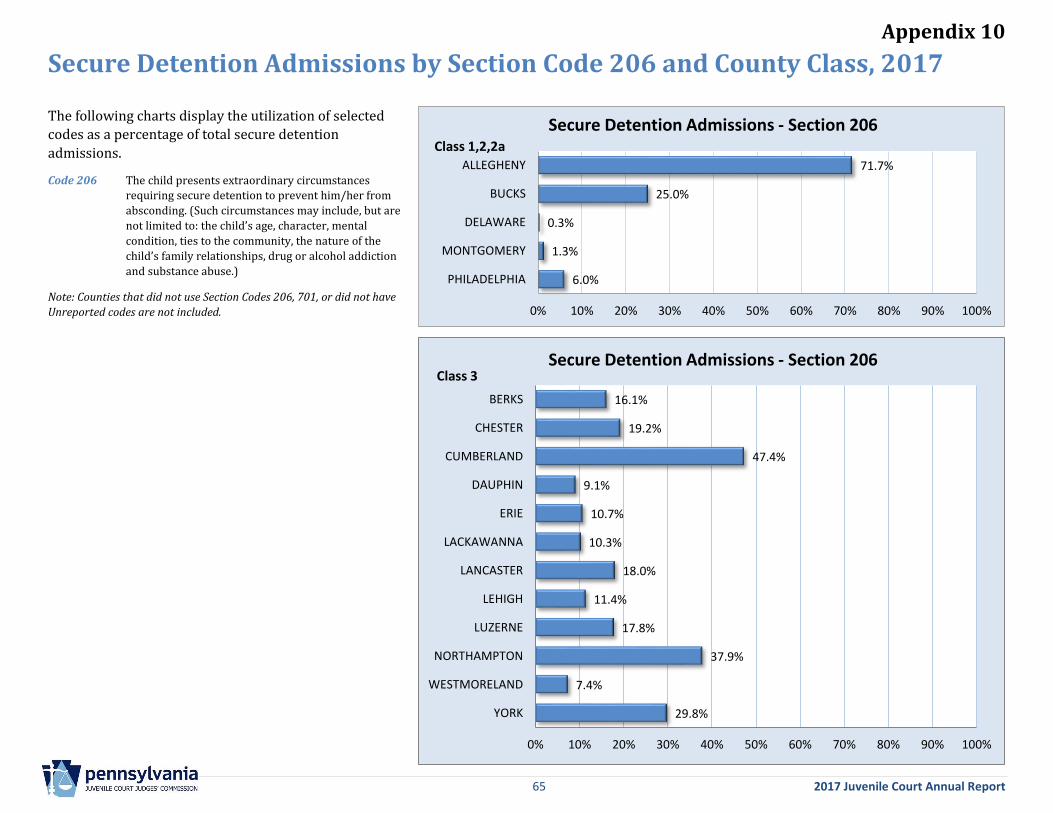
Appendix 10
65 2017 Juvenile Court Annual Report
Secure Detention Admissions by Section Code 206 and County Class, 2017
The following charts display the utilization of selected
codes as a percentage of total secure detention
admissions.
Code 206 The child presents extraordinary circumstances
requiring secure detention to prevent him/her from
absconding. (Such circumstances may include, but are
not limited to: the child’s age, character, mental
condition, ties to the community, the nature of the
child’s family relationships, drug or alcohol addiction
and substance abuse.)
Note: Counties that did not use Section Codes 206, 701, or did not have
Unreported codes are not included.
71.7%
25.0%
0.3%
1.3%
6.0%
0% 10% 20% 30% 40% 50% 60% 70% 80% 90% 100%
ALLEGHENY
BUCKS
DELAWARE
MONTGOMERY
PHILADELPHIA
Secure Detention Admissions - Section 206Class 1,2,2a
16.1%
19.2%
47.4%
9.1%
10.7%
10.3%
18.0%
11.4%
17.8%
37.9%
7.4%
29.8%
0% 10% 20% 30% 40% 50% 60% 70% 80% 90% 100%
BERKS
CHESTER
CUMBERLAND
DAUPHIN
ERIE
LACKAWANNA
LANCASTER
LEHIGH
LUZERNE
NORTHAMPTON
WESTMORELAND
YORK
Secure Detention Admissions - Section 206Class 3
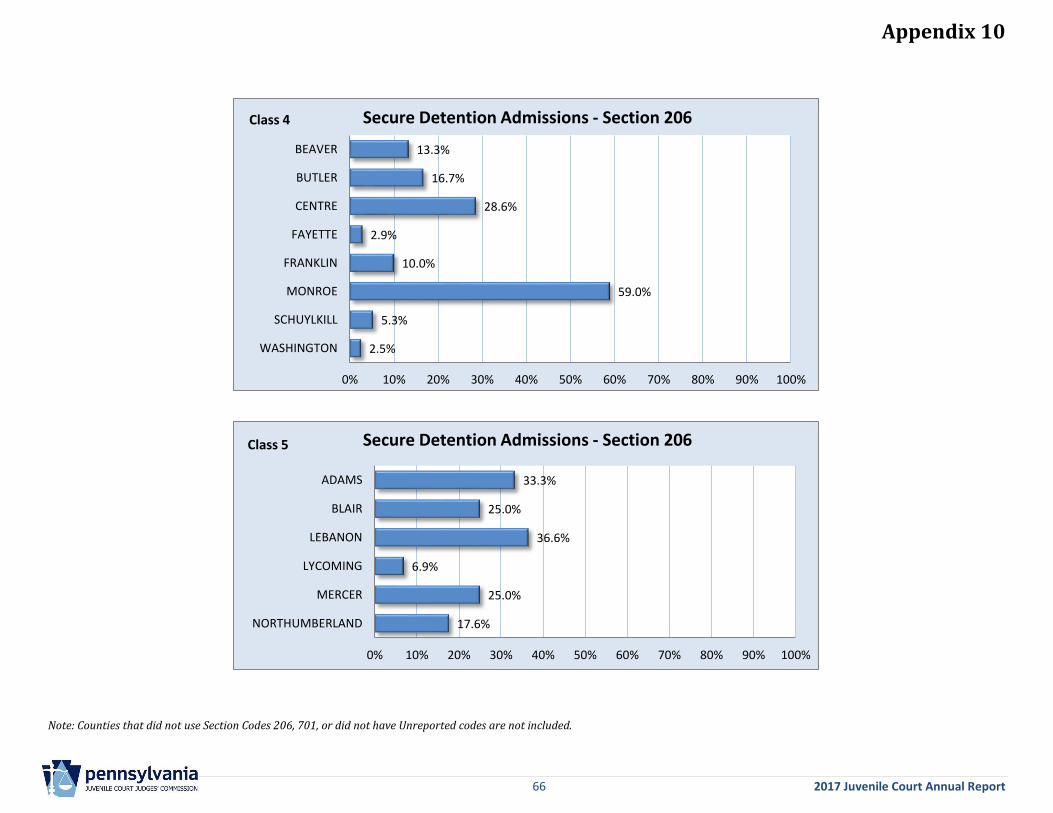
Appendix 10
66 2017 Juvenile Court Annual Report
Note: Counties that did not use Section Codes 206, 701, or did not have Unreported codes are not included.
13.3%
16.7%
28.6%
2.9%
10.0%
59.0%
5.3%
2.5%
0% 10% 20% 30% 40% 50% 60% 70% 80% 90% 100%
BEAVER
BUTLER
CENTRE
FAYETTE
FRANKLIN
MONROE
SCHUYLKILL
WASHINGTON
Secure Detention Admissions - Section 206Class 4
33.3%
25.0%
36.6%
6.9%
25.0%
17.6%
0% 10% 20% 30% 40% 50% 60% 70% 80% 90% 100%
ADAMS
BLAIR
LEBANON
LYCOMING
MERCER
NORTHUMBERLAND
Secure Detention Admissions - Section 206Class 5
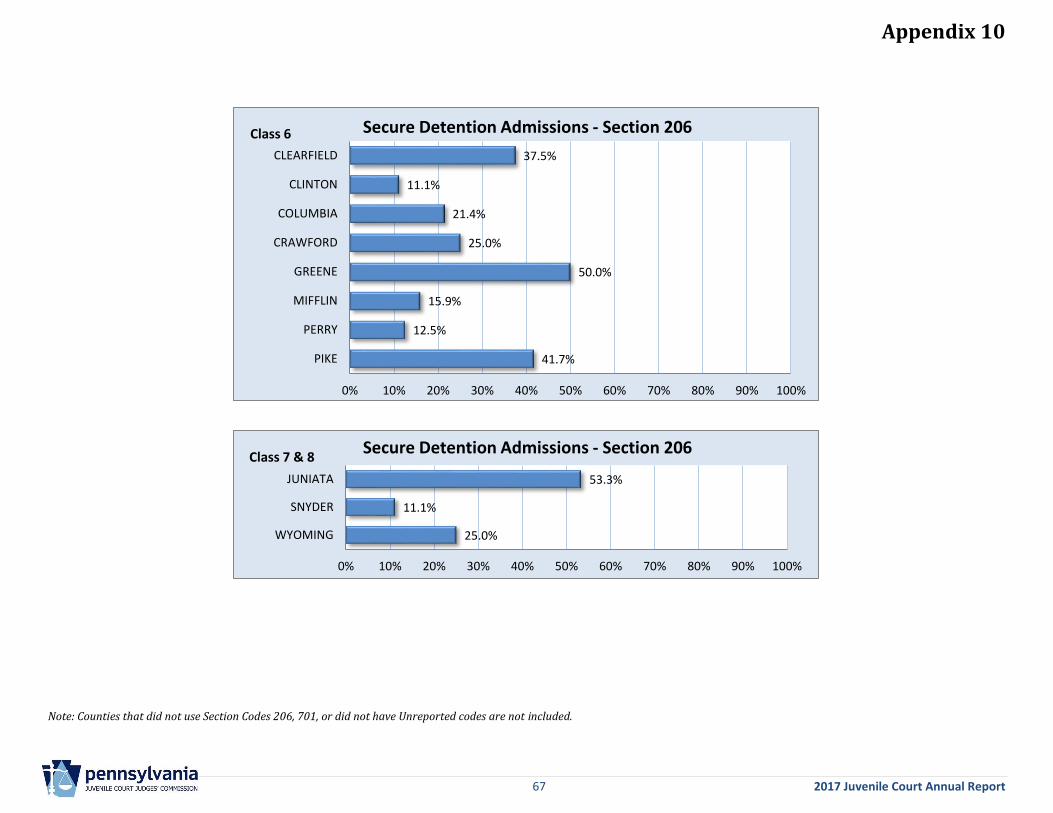
Appendix 10
67 2017 Juvenile Court Annual Report
Note: Counties that did not use Section Codes 206, 701, or did not have Unreported codes are not included.
37.5%
11.1%
21.4%
25.0%
50.0%
15.9%
12.5%
41.7%
0% 10% 20% 30% 40% 50% 60% 70% 80% 90% 100%
CLEARFIELD
CLINTON
COLUMBIA
CRAWFORD
GREENE
MIFFLIN
PERRY
PIKE
Secure Detention Admissions - Section 206Class 6
53.3%
11.1%
25.0%
0% 10% 20% 30% 40% 50% 60% 70% 80% 90% 100%
JUNIATA
SNYDER
WYOMING
Secure Detention Admissions - Section 206Class 7 & 8
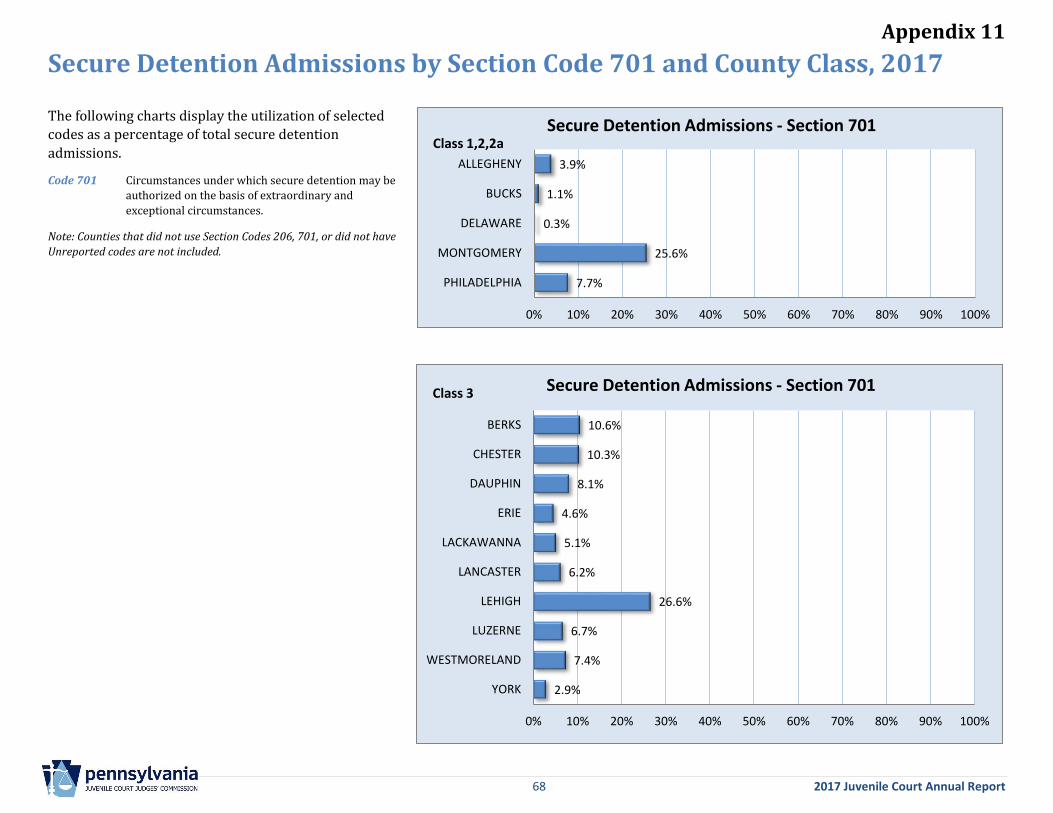
Appendix 11
68 2017 Juvenile Court Annual Report
Secure Detention Admissions by Section Code 701 and County Class, 2017
The following charts display the utilization of selected
codes as a percentage of total secure detention
admissions.
Code 701 Circumstances under which secure detention may be
authorized on the basis of extraordinary and
exceptional circumstances.
Note: Counties that did not use Section Codes 206, 701, or did not have
Unreported codes are not included.
3.9%
1.1%
0.3%
25.6%
7.7%
0% 10% 20% 30% 40% 50% 60% 70% 80% 90% 100%
ALLEGHENY
BUCKS
DELAWARE
MONTGOMERY
PHILADELPHIA
Secure Detention Admissions - Section 701Class 1,2,2a
10.6%
10.3%
8.1%
4.6%
5.1%
6.2%
26.6%
6.7%
7.4%
2.9%
0% 10% 20% 30% 40% 50% 60% 70% 80% 90% 100%
BERKS
CHESTER
DAUPHIN
ERIE
LACKAWANNA
LANCASTER
LEHIGH
LUZERNE
WESTMORELAND
YORK
Secure Detention Admissions - Section 701Class 3
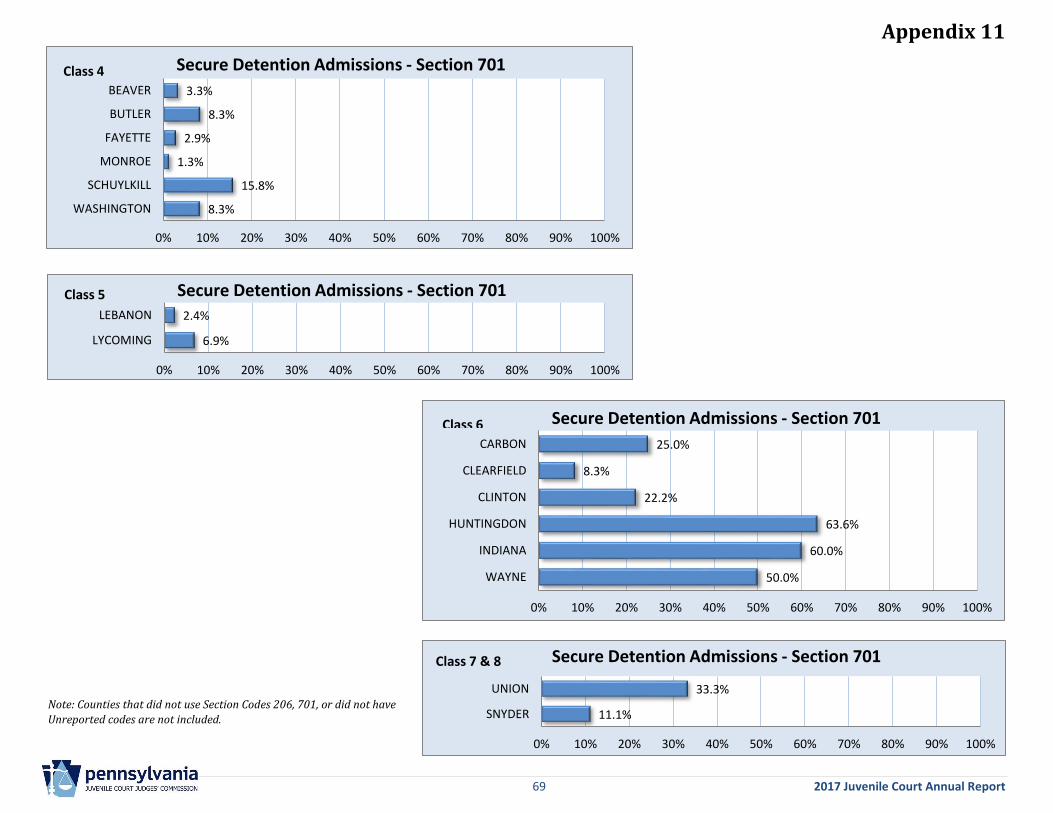
Appendix 11
69 2017 Juvenile Court Annual Report
Note: Counties that did not use Section Codes 206, 701, or did not have
Unreported codes are not included.
2.4%
6.9%
0% 10% 20% 30% 40% 50% 60% 70% 80% 90% 100%
LEBANON
LYCOMING
Secure Detention Admissions - Section 701Class 5
25.0%
8.3%
22.2%
63.6%
60.0%
50.0%
0% 10% 20% 30% 40% 50% 60% 70% 80% 90% 100%
CARBON
CLEARFIELD
CLINTON
HUNTINGDON
INDIANA
WAYNE
Secure Detention Admissions - Section 701Class 6
33.3%
11.1%
0% 10% 20% 30% 40% 50% 60% 70% 80% 90% 100%
UNION
SNYDER
Secure Detention Admissions - Section 701Class 7 & 8
3.3%
8.3%
2.9%
1.3%
15.8%
8.3%
0% 10% 20% 30% 40% 50% 60% 70% 80% 90% 100%
BEAVER
BUTLER
FAYETTE
MONROE
SCHUYLKILL
WASHINGTON
Secure Detention Admissions - Section 701Class 4
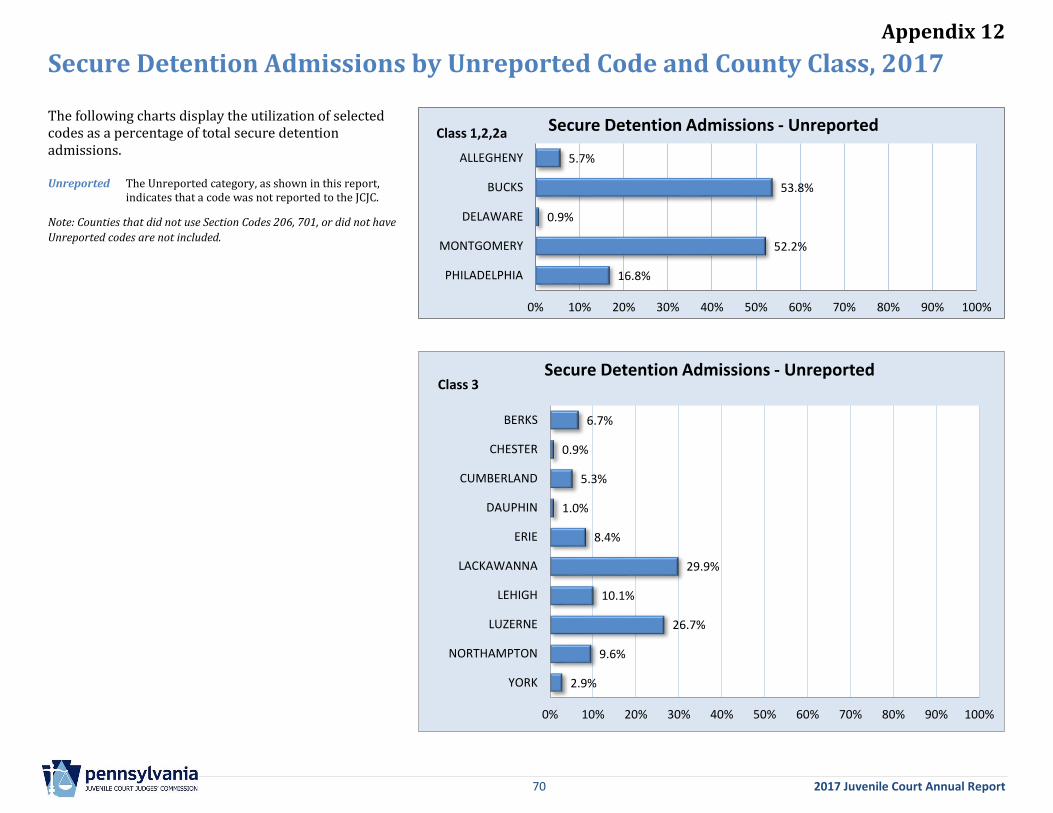
Appendix 12
70 2017 Juvenile Court Annual Report
Secure Detention Admissions by Unreported Code and County Class, 2017
The following charts display the utilization of selected codes as a percentage of total secure detention admissions. Unreported The Unreported category, as shown in this report,
indicates that a code was not reported to the JCJC.
Note: Counties that did not use Section Codes 206, 701, or did not have
Unreported codes are not included.
5.7%
53.8%
0.9%
52.2%
16.8%
0% 10% 20% 30% 40% 50% 60% 70% 80% 90% 100%
ALLEGHENY
BUCKS
DELAWARE
MONTGOMERY
PHILADELPHIA
Secure Detention Admissions - UnreportedClass 1,2,2a
6.7%
0.9%
5.3%
1.0%
8.4%
29.9%
10.1%
26.7%
9.6%
2.9%
0% 10% 20% 30% 40% 50% 60% 70% 80% 90% 100%
BERKS
CHESTER
CUMBERLAND
DAUPHIN
ERIE
LACKAWANNA
LEHIGH
LUZERNE
NORTHAMPTON
YORK
Secure Detention Admissions - UnreportedClass 3
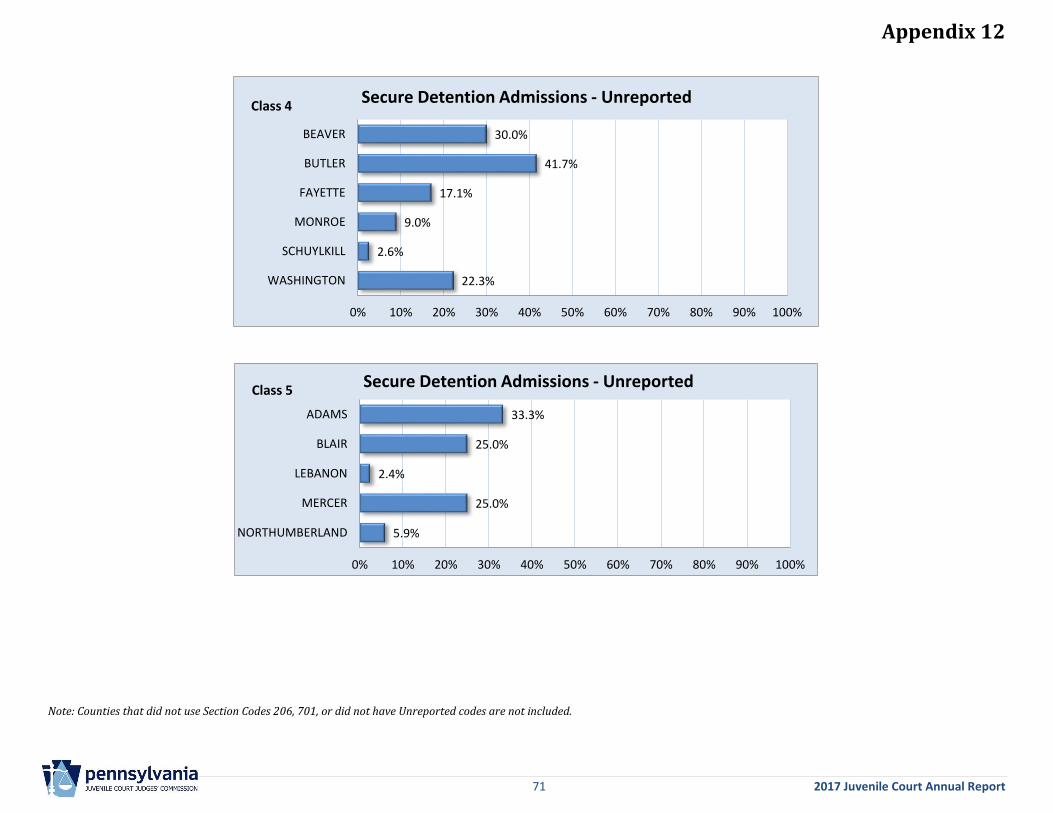
Appendix 12
71 2017 Juvenile Court Annual Report
Note: Counties that did not use Section Codes 206, 701, or did not have Unreported codes are not included.
30.0%
41.7%
17.1%
9.0%
2.6%
22.3%
0% 10% 20% 30% 40% 50% 60% 70% 80% 90% 100%
BEAVER
BUTLER
FAYETTE
MONROE
SCHUYLKILL
WASHINGTON
Secure Detention Admissions - UnreportedClass 4
33.3%
25.0%
2.4%
25.0%
5.9%
0% 10% 20% 30% 40% 50% 60% 70% 80% 90% 100%
ADAMS
BLAIR
LEBANON
MERCER
NORTHUMBERLAND
Secure Detention Admissions - UnreportedClass 5
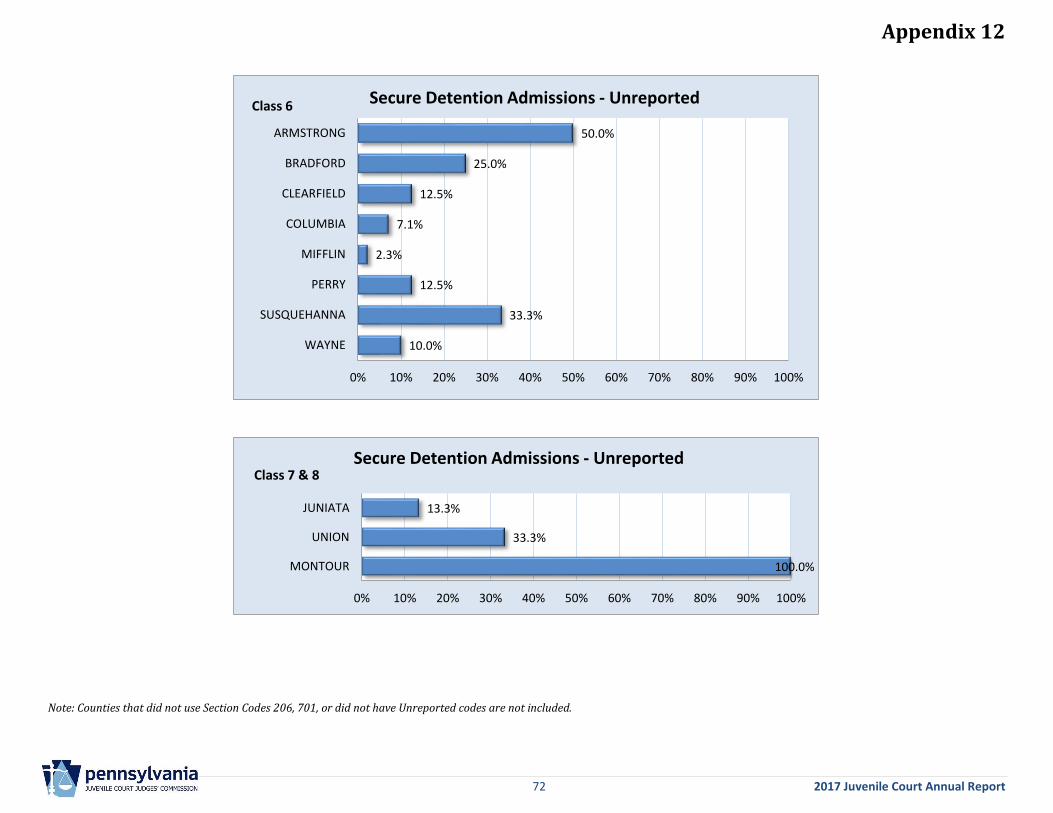
Appendix 12
72 2017 Juvenile Court Annual Report
Note: Counties that did not use Section Codes 206, 701, or did not have Unreported codes are not included.
50.0%
25.0%
12.5%
7.1%
2.3%
12.5%
33.3%
10.0%
0% 10% 20% 30% 40% 50% 60% 70% 80% 90% 100%
ARMSTRONG
BRADFORD
CLEARFIELD
COLUMBIA
MIFFLIN
PERRY
SUSQUEHANNA
WAYNE
Secure Detention Admissions - UnreportedClass 6
13.3%
33.3%
100.0%
0% 10% 20% 30% 40% 50% 60% 70% 80% 90% 100%
JUNIATA
UNION
MONTOUR
Secure Detention Admissions - UnreportedClass 7 & 8
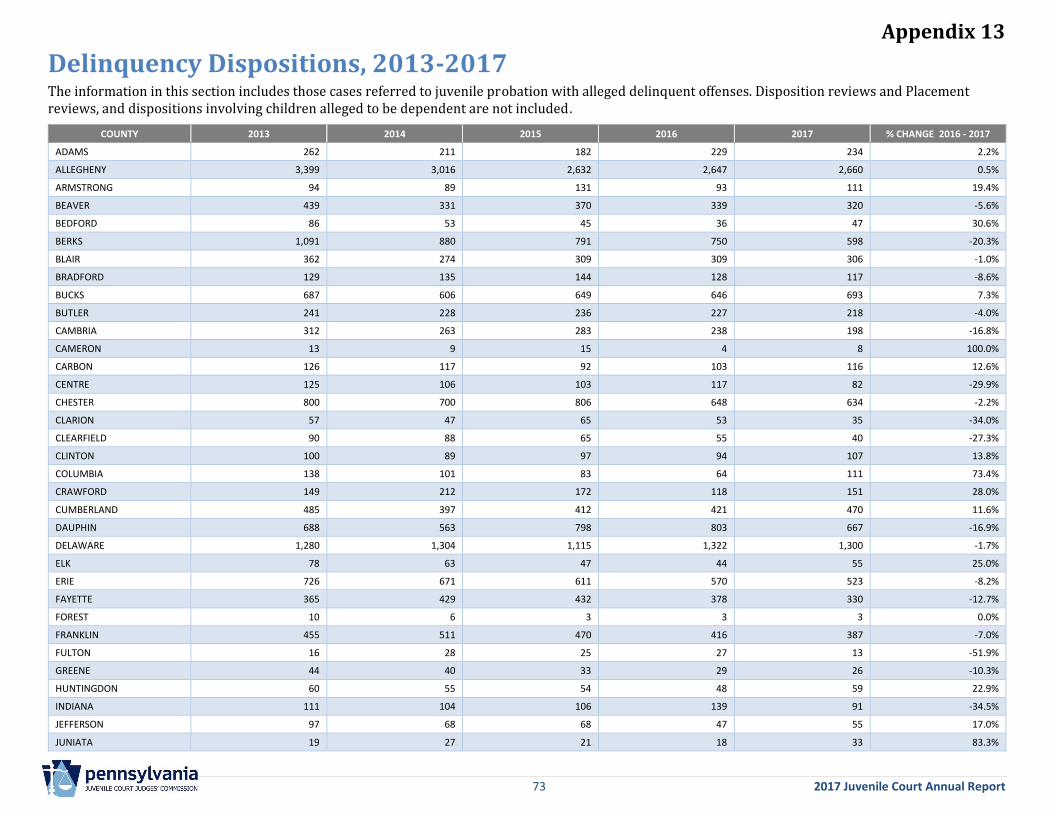
Appendix 13
73 2017 Juvenile Court Annual Report
Delinquency Dispositions, 2013-2017 The information in this section includes those cases referred to juvenile probation with alleged delinquent offenses. Disposition reviews and Placement reviews, and dispositions involving children alleged to be dependent are not included.
COUNTY 2013 2014 2015 2016 2017 % CHANGE 2016 - 2017
ADAMS 262 211 182 229 234 2.2%
ALLEGHENY 3,399 3,016 2,632 2,647 2,660 0.5%
ARMSTRONG 94 89 131 93 111 19.4%
BEAVER 439 331 370 339 320 -5.6%
BEDFORD 86 53 45 36 47 30.6%
BERKS 1,091 880 791 750 598 -20.3%
BLAIR 362 274 309 309 306 -1.0%
BRADFORD 129 135 144 128 117 -8.6%
BUCKS 687 606 649 646 693 7.3%
BUTLER 241 228 236 227 218 -4.0%
CAMBRIA 312 263 283 238 198 -16.8%
CAMERON 13 9 15 4 8 100.0%
CARBON 126 117 92 103 116 12.6%
CENTRE 125 106 103 117 82 -29.9%
CHESTER 800 700 806 648 634 -2.2%
CLARION 57 47 65 53 35 -34.0%
CLEARFIELD 90 88 65 55 40 -27.3%
CLINTON 100 89 97 94 107 13.8%
COLUMBIA 138 101 83 64 111 73.4%
CRAWFORD 149 212 172 118 151 28.0%
CUMBERLAND 485 397 412 421 470 11.6%
DAUPHIN 688 563 798 803 667 -16.9%
DELAWARE 1,280 1,304 1,115 1,322 1,300 -1.7%
ELK 78 63 47 44 55 25.0%
ERIE 726 671 611 570 523 -8.2%
FAYETTE 365 429 432 378 330 -12.7%
FOREST 10 6 3 3 3 0.0%
FRANKLIN 455 511 470 416 387 -7.0%
FULTON 16 28 25 27 13 -51.9%
GREENE 44 40 33 29 26 -10.3%
HUNTINGDON 60 55 54 48 59 22.9%
INDIANA 111 104 106 139 91 -34.5%
JEFFERSON 97 68 68 47 55 17.0%
JUNIATA 19 27 21 18 33 83.3%
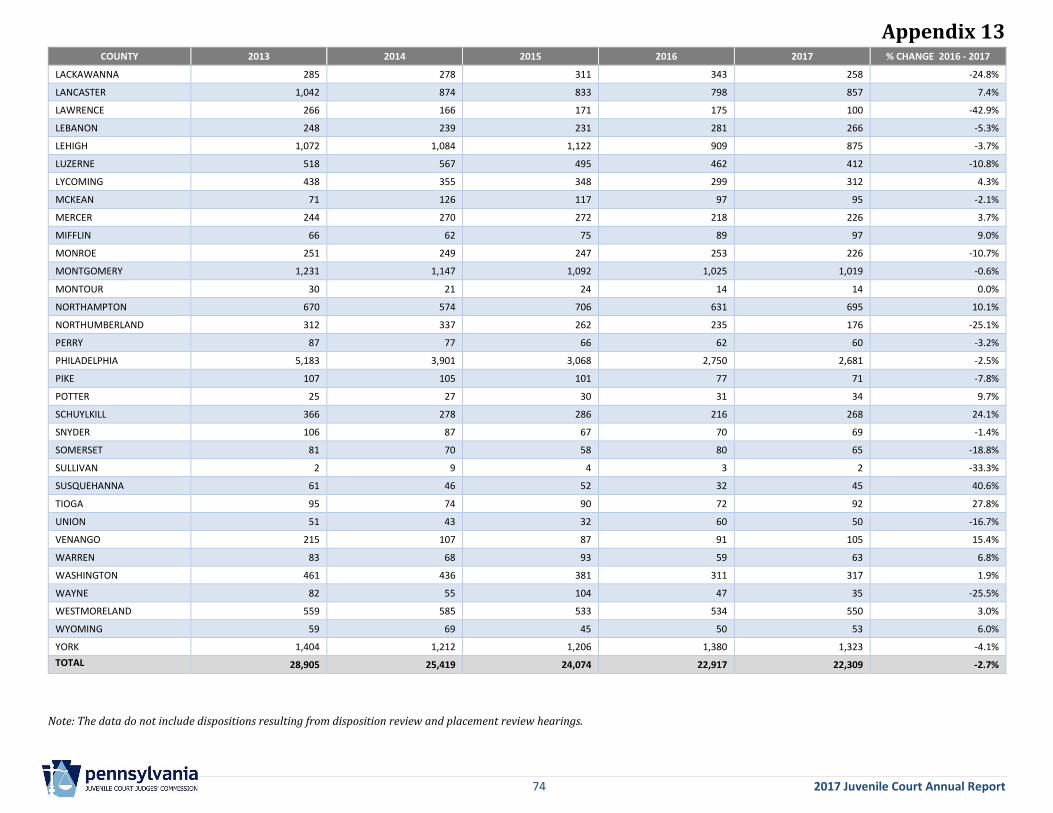
Appendix 13
74 2017 Juvenile Court Annual Report
COUNTY 2013 2014 2015 2016 2017 % CHANGE 2016 - 2017
LACKAWANNA 285 278 311 343 258 -24.8%
LANCASTER 1,042 874 833 798 857 7.4%
LAWRENCE 266 166 171 175 100 -42.9%
LEBANON 248 239 231 281 266 -5.3%
LEHIGH 1,072 1,084 1,122 909 875 -3.7%
LUZERNE 518 567 495 462 412 -10.8%
LYCOMING 438 355 348 299 312 4.3%
MCKEAN 71 126 117 97 95 -2.1%
MERCER 244 270 272 218 226 3.7%
MIFFLIN 66 62 75 89 97 9.0%
MONROE 251 249 247 253 226 -10.7%
MONTGOMERY 1,231 1,147 1,092 1,025 1,019 -0.6%
MONTOUR 30 21 24 14 14 0.0%
NORTHAMPTON 670 574 706 631 695 10.1%
NORTHUMBERLAND 312 337 262 235 176 -25.1%
PERRY 87 77 66 62 60 -3.2%
PHILADELPHIA 5,183 3,901 3,068 2,750 2,681 -2.5%
PIKE 107 105 101 77 71 -7.8%
POTTER 25 27 30 31 34 9.7%
SCHUYLKILL 366 278 286 216 268 24.1%
SNYDER 106 87 67 70 69 -1.4%
SOMERSET 81 70 58 80 65 -18.8%
SULLIVAN 2 9 4 3 2 -33.3%
SUSQUEHANNA 61 46 52 32 45 40.6%
TIOGA 95 74 90 72 92 27.8%
UNION 51 43 32 60 50 -16.7%
VENANGO 215 107 87 91 105 15.4%
WARREN 83 68 93 59 63 6.8%
WASHINGTON 461 436 381 311 317 1.9%
WAYNE 82 55 104 47 35 -25.5%
WESTMORELAND 559 585 533 534 550 3.0%
WYOMING 59 69 45 50 53 6.0%
YORK 1,404 1,212 1,206 1,380 1,323 -4.1%
TOTAL 28,905 25,419 24,074 22,917 22,309 -2.7%
Note: The data do not include dispositions resulting from disposition review and placement review hearings.
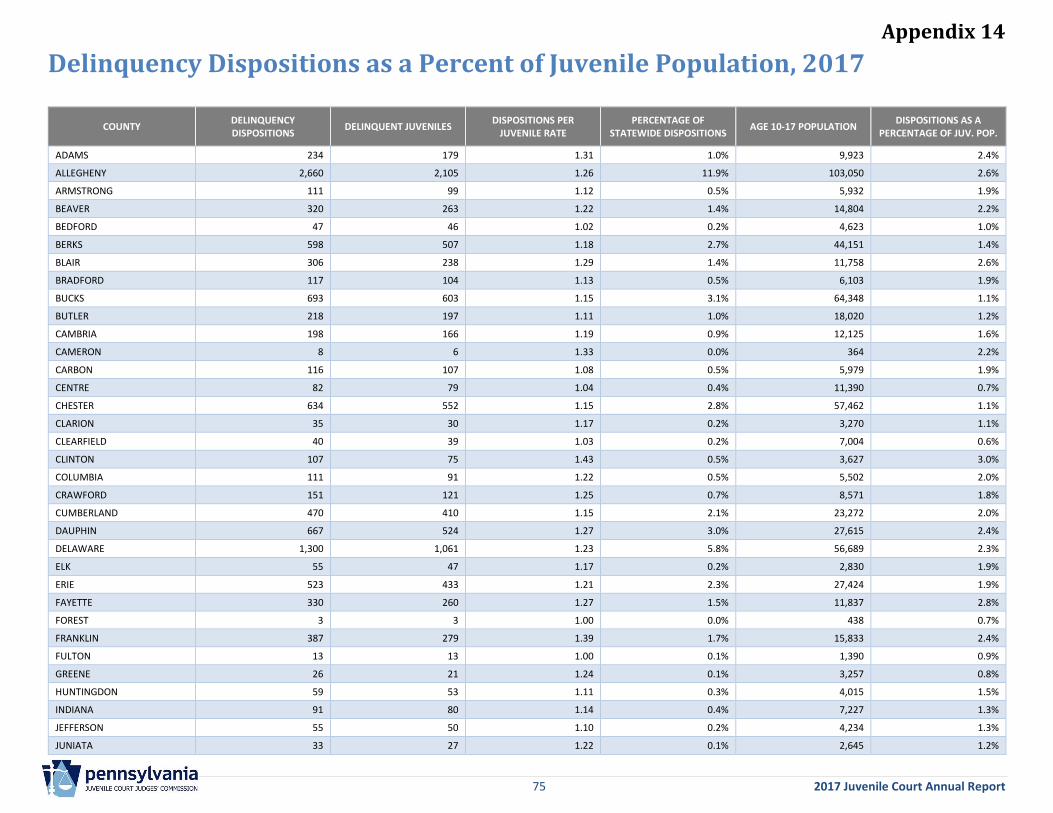
Appendix 14
75 2017 Juvenile Court Annual Report
Delinquency Dispositions as a Percent of Juvenile Population, 2017
COUNTY DELINQUENCY DISPOSITIONS
DELINQUENT JUVENILES DISPOSITIONS PER
JUVENILE RATE PERCENTAGE OF
STATEWIDE DISPOSITIONS AGE 10-17 POPULATION
DISPOSITIONS AS A PERCENTAGE OF JUV. POP.
ADAMS 234 179 1.31 1.0% 9,923 2.4%
ALLEGHENY 2,660 2,105 1.26 11.9% 103,050 2.6%
ARMSTRONG 111 99 1.12 0.5% 5,932 1.9%
BEAVER 320 263 1.22 1.4% 14,804 2.2%
BEDFORD 47 46 1.02 0.2% 4,623 1.0%
BERKS 598 507 1.18 2.7% 44,151 1.4%
BLAIR 306 238 1.29 1.4% 11,758 2.6%
BRADFORD 117 104 1.13 0.5% 6,103 1.9%
BUCKS 693 603 1.15 3.1% 64,348 1.1%
BUTLER 218 197 1.11 1.0% 18,020 1.2%
CAMBRIA 198 166 1.19 0.9% 12,125 1.6%
CAMERON 8 6 1.33 0.0% 364 2.2%
CARBON 116 107 1.08 0.5% 5,979 1.9%
CENTRE 82 79 1.04 0.4% 11,390 0.7%
CHESTER 634 552 1.15 2.8% 57,462 1.1%
CLARION 35 30 1.17 0.2% 3,270 1.1%
CLEARFIELD 40 39 1.03 0.2% 7,004 0.6%
CLINTON 107 75 1.43 0.5% 3,627 3.0%
COLUMBIA 111 91 1.22 0.5% 5,502 2.0%
CRAWFORD 151 121 1.25 0.7% 8,571 1.8%
CUMBERLAND 470 410 1.15 2.1% 23,272 2.0%
DAUPHIN 667 524 1.27 3.0% 27,615 2.4%
DELAWARE 1,300 1,061 1.23 5.8% 56,689 2.3%
ELK 55 47 1.17 0.2% 2,830 1.9%
ERIE 523 433 1.21 2.3% 27,424 1.9%
FAYETTE 330 260 1.27 1.5% 11,837 2.8%
FOREST 3 3 1.00 0.0% 438 0.7%
FRANKLIN 387 279 1.39 1.7% 15,833 2.4%
FULTON 13 13 1.00 0.1% 1,390 0.9%
GREENE 26 21 1.24 0.1% 3,257 0.8%
HUNTINGDON 59 53 1.11 0.3% 4,015 1.5%
INDIANA 91 80 1.14 0.4% 7,227 1.3%
JEFFERSON 55 50 1.10 0.2% 4,234 1.3%
JUNIATA 33 27 1.22 0.1% 2,645 1.2%
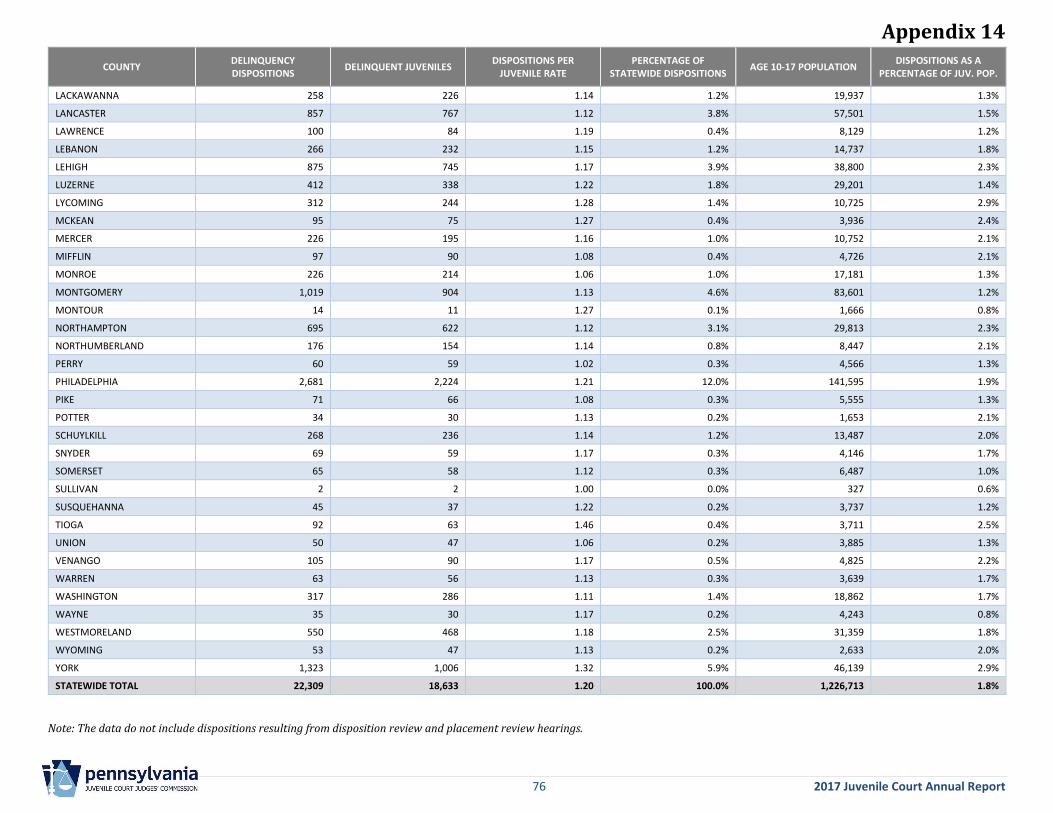
Appendix 14
76 2017 Juvenile Court Annual Report
COUNTY DELINQUENCY DISPOSITIONS
DELINQUENT JUVENILES DISPOSITIONS PER
JUVENILE RATE PERCENTAGE OF
STATEWIDE DISPOSITIONS AGE 10-17 POPULATION
DISPOSITIONS AS A PERCENTAGE OF JUV. POP.
LACKAWANNA 258 226 1.14 1.2% 19,937 1.3%
LANCASTER 857 767 1.12 3.8% 57,501 1.5%
LAWRENCE 100 84 1.19 0.4% 8,129 1.2%
LEBANON 266 232 1.15 1.2% 14,737 1.8%
LEHIGH 875 745 1.17 3.9% 38,800 2.3%
LUZERNE 412 338 1.22 1.8% 29,201 1.4%
LYCOMING 312 244 1.28 1.4% 10,725 2.9%
MCKEAN 95 75 1.27 0.4% 3,936 2.4%
MERCER 226 195 1.16 1.0% 10,752 2.1%
MIFFLIN 97 90 1.08 0.4% 4,726 2.1%
MONROE 226 214 1.06 1.0% 17,181 1.3%
MONTGOMERY 1,019 904 1.13 4.6% 83,601 1.2%
MONTOUR 14 11 1.27 0.1% 1,666 0.8%
NORTHAMPTON 695 622 1.12 3.1% 29,813 2.3%
NORTHUMBERLAND 176 154 1.14 0.8% 8,447 2.1%
PERRY 60 59 1.02 0.3% 4,566 1.3%
PHILADELPHIA 2,681 2,224 1.21 12.0% 141,595 1.9%
PIKE 71 66 1.08 0.3% 5,555 1.3%
POTTER 34 30 1.13 0.2% 1,653 2.1%
SCHUYLKILL 268 236 1.14 1.2% 13,487 2.0%
SNYDER 69 59 1.17 0.3% 4,146 1.7%
SOMERSET 65 58 1.12 0.3% 6,487 1.0%
SULLIVAN 2 2 1.00 0.0% 327 0.6%
SUSQUEHANNA 45 37 1.22 0.2% 3,737 1.2%
TIOGA 92 63 1.46 0.4% 3,711 2.5%
UNION 50 47 1.06 0.2% 3,885 1.3%
VENANGO 105 90 1.17 0.5% 4,825 2.2%
WARREN 63 56 1.13 0.3% 3,639 1.7%
WASHINGTON 317 286 1.11 1.4% 18,862 1.7%
WAYNE 35 30 1.17 0.2% 4,243 0.8%
WESTMORELAND 550 468 1.18 2.5% 31,359 1.8%
WYOMING 53 47 1.13 0.2% 2,633 2.0%
YORK 1,323 1,006 1.32 5.9% 46,139 2.9%
STATEWIDE TOTAL 22,309 18,633 1.20 100.0% 1,226,713 1.8%
Note: The data do not include dispositions resulting from disposition review and placement review hearings.
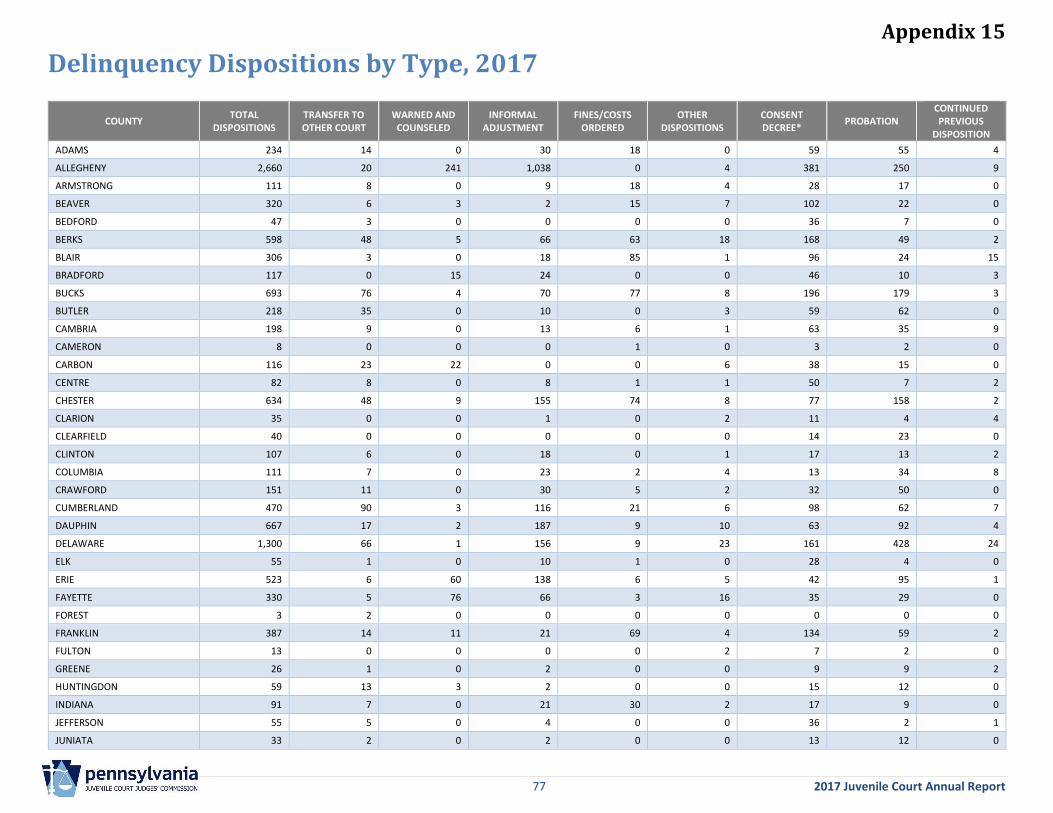
Appendix 15
77 2017 Juvenile Court Annual Report
Delinquency Dispositions by Type, 2017
COUNTY TOTAL
DISPOSITIONS TRANSFER TO OTHER COURT
WARNED AND COUNSELED
INFORMAL ADJUSTMENT
FINES/COSTS ORDERED
OTHER DISPOSITIONS
CONSENT DECREE*
PROBATION CONTINUED PREVIOUS
DISPOSITION
ADAMS 234 14 0 30 18 0 59 55 4
ALLEGHENY 2,660 20 241 1,038 0 4 381 250 9
ARMSTRONG 111 8 0 9 18 4 28 17 0
BEAVER 320 6 3 2 15 7 102 22 0
BEDFORD 47 3 0 0 0 0 36 7 0
BERKS 598 48 5 66 63 18 168 49 2
BLAIR 306 3 0 18 85 1 96 24 15
BRADFORD 117 0 15 24 0 0 46 10 3
BUCKS 693 76 4 70 77 8 196 179 3
BUTLER 218 35 0 10 0 3 59 62 0
CAMBRIA 198 9 0 13 6 1 63 35 9
CAMERON 8 0 0 0 1 0 3 2 0
CARBON 116 23 22 0 0 6 38 15 0
CENTRE 82 8 0 8 1 1 50 7 2
CHESTER 634 48 9 155 74 8 77 158 2
CLARION 35 0 0 1 0 2 11 4 4
CLEARFIELD 40 0 0 0 0 0 14 23 0
CLINTON 107 6 0 18 0 1 17 13 2
COLUMBIA 111 7 0 23 2 4 13 34 8
CRAWFORD 151 11 0 30 5 2 32 50 0
CUMBERLAND 470 90 3 116 21 6 98 62 7
DAUPHIN 667 17 2 187 9 10 63 92 4
DELAWARE 1,300 66 1 156 9 23 161 428 24
ELK 55 1 0 10 1 0 28 4 0
ERIE 523 6 60 138 6 5 42 95 1
FAYETTE 330 5 76 66 3 16 35 29 0
FOREST 3 2 0 0 0 0 0 0 0
FRANKLIN 387 14 11 21 69 4 134 59 2
FULTON 13 0 0 0 0 2 7 2 0
GREENE 26 1 0 2 0 0 9 9 2
HUNTINGDON 59 13 3 2 0 0 15 12 0
INDIANA 91 7 0 21 30 2 17 9 0
JEFFERSON 55 5 0 4 0 0 36 2 1
JUNIATA 33 2 0 2 0 0 13 12 0
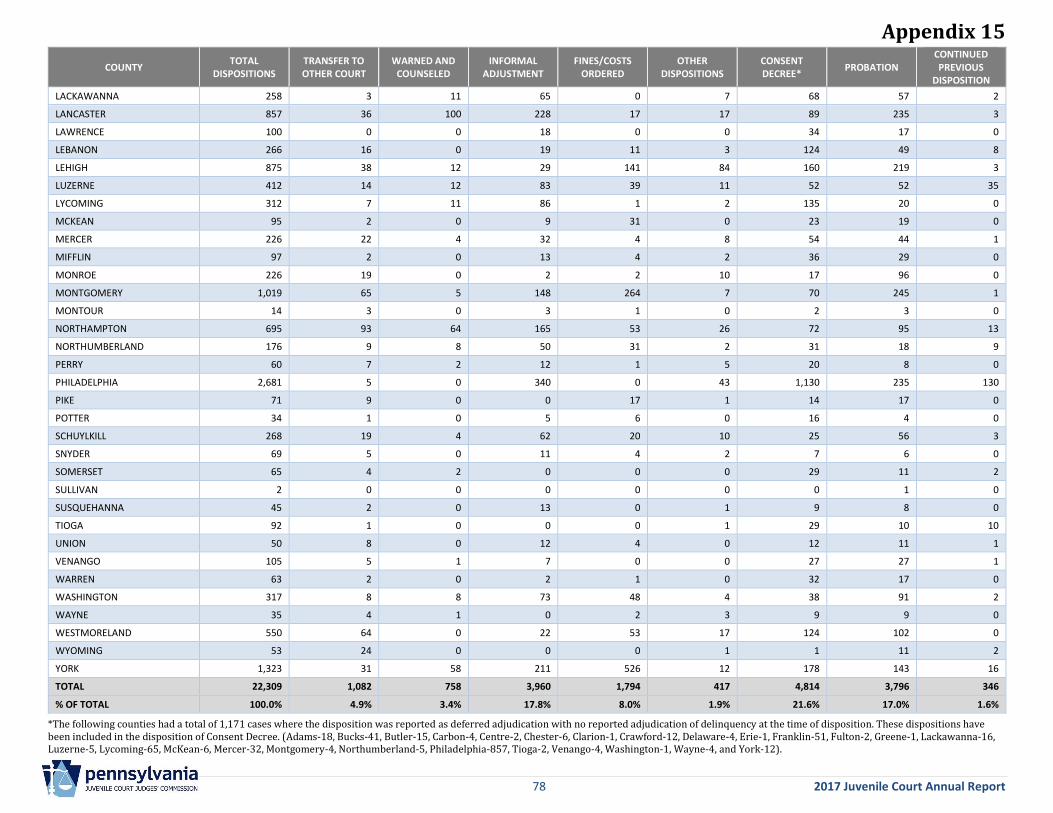
Appendix 15
78 2017 Juvenile Court Annual Report
COUNTY TOTAL
DISPOSITIONS TRANSFER TO OTHER COURT
WARNED AND COUNSELED
INFORMAL ADJUSTMENT
FINES/COSTS ORDERED
OTHER DISPOSITIONS
CONSENT DECREE*
PROBATION CONTINUED PREVIOUS
DISPOSITION
LACKAWANNA 258 3 11 65 0 7 68 57 2
LANCASTER 857 36 100 228 17 17 89 235 3
LAWRENCE 100 0 0 18 0 0 34 17 0
LEBANON 266 16 0 19 11 3 124 49 8
LEHIGH 875 38 12 29 141 84 160 219 3
LUZERNE 412 14 12 83 39 11 52 52 35
LYCOMING 312 7 11 86 1 2 135 20 0
MCKEAN 95 2 0 9 31 0 23 19 0
MERCER 226 22 4 32 4 8 54 44 1
MIFFLIN 97 2 0 13 4 2 36 29 0
MONROE 226 19 0 2 2 10 17 96 0
MONTGOMERY 1,019 65 5 148 264 7 70 245 1
MONTOUR 14 3 0 3 1 0 2 3 0
NORTHAMPTON 695 93 64 165 53 26 72 95 13
NORTHUMBERLAND 176 9 8 50 31 2 31 18 9
PERRY 60 7 2 12 1 5 20 8 0
PHILADELPHIA 2,681 5 0 340 0 43 1,130 235 130
PIKE 71 9 0 0 17 1 14 17 0
POTTER 34 1 0 5 6 0 16 4 0
SCHUYLKILL 268 19 4 62 20 10 25 56 3
SNYDER 69 5 0 11 4 2 7 6 0
SOMERSET 65 4 2 0 0 0 29 11 2
SULLIVAN 2 0 0 0 0 0 0 1 0
SUSQUEHANNA 45 2 0 13 0 1 9 8 0
TIOGA 92 1 0 0 0 1 29 10 10
UNION 50 8 0 12 4 0 12 11 1
VENANGO 105 5 1 7 0 0 27 27 1
WARREN 63 2 0 2 1 0 32 17 0
WASHINGTON 317 8 8 73 48 4 38 91 2
WAYNE 35 4 1 0 2 3 9 9 0
WESTMORELAND 550 64 0 22 53 17 124 102 0
WYOMING 53 24 0 0 0 1 1 11 2
YORK 1,323 31 58 211 526 12 178 143 16
TOTAL 22,309 1,082 758 3,960 1,794 417 4,814 3,796 346
% OF TOTAL 100.0% 4.9% 3.4% 17.8% 8.0% 1.9% 21.6% 17.0% 1.6%
*The following counties had a total of 1,171 cases where the disposition was reported as deferred adjudication with no reported adjudication of delinquency at the time of disposition. These dispositions have been included in the disposition of Consent Decree. (Adams-18, Bucks-41, Butler-15, Carbon-4, Centre-2, Chester-6, Clarion-1, Crawford-12, Delaware-4, Erie-1, Franklin-51, Fulton-2, Greene-1, Lackawanna-16, Luzerne-5, Lycoming-65, McKean-6, Mercer-32, Montgomery-4, Northumberland-5, Philadelphia-857, Tioga-2, Venango-4, Washington-1, Wayne-4, and York-12).

Appendix 15
79 2017 Juvenile Court Annual Report
Delinquency Dispositions by Type, 2017 (continued)
COUNTY TOTAL
DISPOSITIONS
TRANSFERRED TO CRIMINAL PROCEEDINGS
PLACEMENT PETITION
WITHDRAWN PETITION
DISMISSED ALLEGATION WITHDRAWN
ALLEGATION DISMISSED
CASE CLOSED COMMUNITY SERVICE ONLY
ADAMS 234 0 3 2 14 7 4 24 0
ALLEGHENY 2,660 5 173 270 86 177 0 6 0
ARMSTRONG 111 0 8 6 0 8 1 4 0
BEAVER 320 0 12 10 50 19 17 14 41
BEDFORD 47 0 1 0 0 0 0 0 0
BERKS 598 0 40 35 13 14 12 27 38
BLAIR 306 0 10 16 11 1 1 25 0
BRADFORD 117 1 5 4 1 5 3 0 0
BUCKS 693 1 23 34 7 5 1 4 5
BUTLER 218 3 7 33 1 0 1 4 0
CAMBRIA 198 1 31 1 25 0 0 4 0
CAMERON 8 0 0 2 0 0 0 0 0
CARBON 116 0 7 0 0 5 0 0 0
CENTRE 82 1 2 0 0 1 0 1 0
CHESTER 634 1 71 17 5 3 1 5 0
CLARION 35 0 2 2 0 2 1 6 0
CLEARFIELD 40 0 3 0 0 0 0 0 0
CLINTON 107 0 3 2 0 2 2 41 0
COLUMBIA 111 0 0 2 2 0 0 16 0
CRAWFORD 151 1 13 0 6 0 0 1 0
CUMBERLAND 470 0 9 21 1 10 1 7 18
DAUPHIN 667 15 21 0 0 10 0 236 1
DELAWARE 1,300 6 55 29 33 9 0 223 77
ELK 55 1 1 7 0 1 0 1 0
ERIE 523 0 101 27 2 0 0 3 37
FAYETTE 330 0 23 1 12 16 0 45 3
FOREST 3 0 0 0 0 0 0 1 0
FRANKLIN 387 0 17 6 2 26 8 14 0
FULTON 13 0 0 0 0 2 0 0 0
GREENE 26 0 2 0 0 1 0 0 0
HUNTINGDON 59 1 9 0 2 0 2 0 0
INDIANA 91 0 2 0 0 0 1 2 0
JEFFERSON 55 0 6 1 0 0 0 0 0
JUNIATA 33 0 2 1 0 0 1 0 0
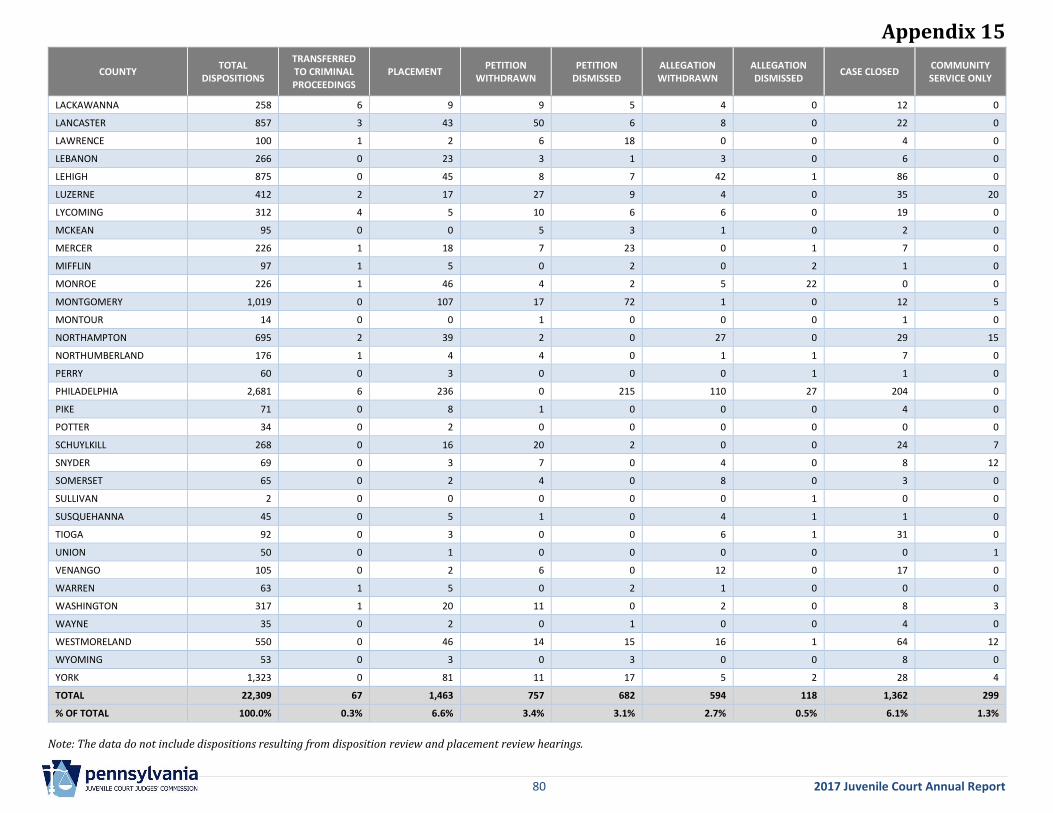
Appendix 15
80 2017 Juvenile Court Annual Report
COUNTY TOTAL
DISPOSITIONS
TRANSFERRED TO CRIMINAL PROCEEDINGS
PLACEMENT PETITION
WITHDRAWN PETITION
DISMISSED ALLEGATION WITHDRAWN
ALLEGATION DISMISSED
CASE CLOSED COMMUNITY SERVICE ONLY
LACKAWANNA 258 6 9 9 5 4 0 12 0
LANCASTER 857 3 43 50 6 8 0 22 0
LAWRENCE 100 1 2 6 18 0 0 4 0
LEBANON 266 0 23 3 1 3 0 6 0
LEHIGH 875 0 45 8 7 42 1 86 0
LUZERNE 412 2 17 27 9 4 0 35 20
LYCOMING 312 4 5 10 6 6 0 19 0
MCKEAN 95 0 0 5 3 1 0 2 0
MERCER 226 1 18 7 23 0 1 7 0
MIFFLIN 97 1 5 0 2 0 2 1 0
MONROE 226 1 46 4 2 5 22 0 0
MONTGOMERY 1,019 0 107 17 72 1 0 12 5
MONTOUR 14 0 0 1 0 0 0 1 0
NORTHAMPTON 695 2 39 2 0 27 0 29 15
NORTHUMBERLAND 176 1 4 4 0 1 1 7 0
PERRY 60 0 3 0 0 0 1 1 0
PHILADELPHIA 2,681 6 236 0 215 110 27 204 0
PIKE 71 0 8 1 0 0 0 4 0
POTTER 34 0 2 0 0 0 0 0 0
SCHUYLKILL 268 0 16 20 2 0 0 24 7
SNYDER 69 0 3 7 0 4 0 8 12
SOMERSET 65 0 2 4 0 8 0 3 0
SULLIVAN 2 0 0 0 0 0 1 0 0
SUSQUEHANNA 45 0 5 1 0 4 1 1 0
TIOGA 92 0 3 0 0 6 1 31 0
UNION 50 0 1 0 0 0 0 0 1
VENANGO 105 0 2 6 0 12 0 17 0
WARREN 63 1 5 0 2 1 0 0 0
WASHINGTON 317 1 20 11 0 2 0 8 3
WAYNE 35 0 2 0 1 0 0 4 0
WESTMORELAND 550 0 46 14 15 16 1 64 12
WYOMING 53 0 3 0 3 0 0 8 0
YORK 1,323 0 81 11 17 5 2 28 4
TOTAL 22,309 67 1,463 757 682 594 118 1,362 299
% OF TOTAL 100.0% 0.3% 6.6% 3.4% 3.1% 2.7% 0.5% 6.1% 1.3%
Note: The data do not include dispositions resulting from disposition review and placement review hearings.
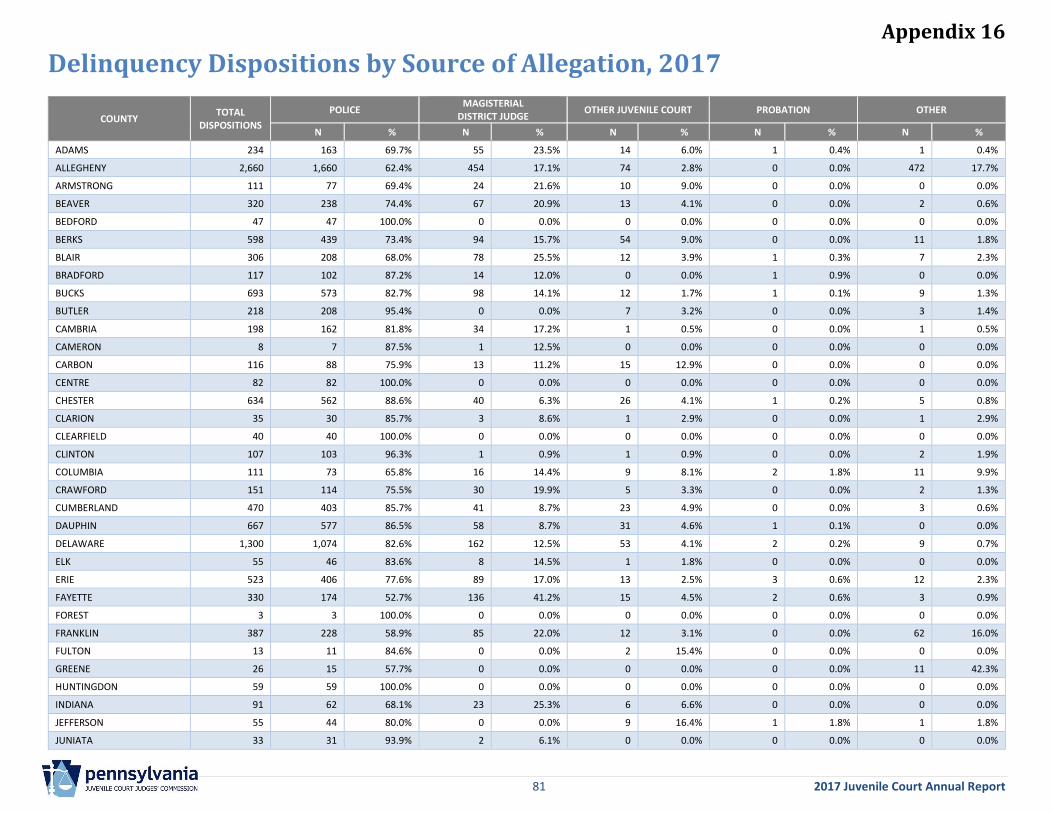
Appendix 16
81 2017 Juvenile Court Annual Report
Delinquency Dispositions by Source of Allegation, 2017
COUNTY TOTAL
DISPOSITIONS
POLICE MAGISTERIAL
DISTRICT JUDGE OTHER JUVENILE COURT PROBATION OTHER
N % N % N % N % N %
ADAMS 234 163 69.7% 55 23.5% 14 6.0% 1 0.4% 1 0.4%
ALLEGHENY 2,660 1,660 62.4% 454 17.1% 74 2.8% 0 0.0% 472 17.7%
ARMSTRONG 111 77 69.4% 24 21.6% 10 9.0% 0 0.0% 0 0.0%
BEAVER 320 238 74.4% 67 20.9% 13 4.1% 0 0.0% 2 0.6%
BEDFORD 47 47 100.0% 0 0.0% 0 0.0% 0 0.0% 0 0.0%
BERKS 598 439 73.4% 94 15.7% 54 9.0% 0 0.0% 11 1.8%
BLAIR 306 208 68.0% 78 25.5% 12 3.9% 1 0.3% 7 2.3%
BRADFORD 117 102 87.2% 14 12.0% 0 0.0% 1 0.9% 0 0.0%
BUCKS 693 573 82.7% 98 14.1% 12 1.7% 1 0.1% 9 1.3%
BUTLER 218 208 95.4% 0 0.0% 7 3.2% 0 0.0% 3 1.4%
CAMBRIA 198 162 81.8% 34 17.2% 1 0.5% 0 0.0% 1 0.5%
CAMERON 8 7 87.5% 1 12.5% 0 0.0% 0 0.0% 0 0.0%
CARBON 116 88 75.9% 13 11.2% 15 12.9% 0 0.0% 0 0.0%
CENTRE 82 82 100.0% 0 0.0% 0 0.0% 0 0.0% 0 0.0%
CHESTER 634 562 88.6% 40 6.3% 26 4.1% 1 0.2% 5 0.8%
CLARION 35 30 85.7% 3 8.6% 1 2.9% 0 0.0% 1 2.9%
CLEARFIELD 40 40 100.0% 0 0.0% 0 0.0% 0 0.0% 0 0.0%
CLINTON 107 103 96.3% 1 0.9% 1 0.9% 0 0.0% 2 1.9%
COLUMBIA 111 73 65.8% 16 14.4% 9 8.1% 2 1.8% 11 9.9%
CRAWFORD 151 114 75.5% 30 19.9% 5 3.3% 0 0.0% 2 1.3%
CUMBERLAND 470 403 85.7% 41 8.7% 23 4.9% 0 0.0% 3 0.6%
DAUPHIN 667 577 86.5% 58 8.7% 31 4.6% 1 0.1% 0 0.0%
DELAWARE 1,300 1,074 82.6% 162 12.5% 53 4.1% 2 0.2% 9 0.7%
ELK 55 46 83.6% 8 14.5% 1 1.8% 0 0.0% 0 0.0%
ERIE 523 406 77.6% 89 17.0% 13 2.5% 3 0.6% 12 2.3%
FAYETTE 330 174 52.7% 136 41.2% 15 4.5% 2 0.6% 3 0.9%
FOREST 3 3 100.0% 0 0.0% 0 0.0% 0 0.0% 0 0.0%
FRANKLIN 387 228 58.9% 85 22.0% 12 3.1% 0 0.0% 62 16.0%
FULTON 13 11 84.6% 0 0.0% 2 15.4% 0 0.0% 0 0.0%
GREENE 26 15 57.7% 0 0.0% 0 0.0% 0 0.0% 11 42.3%
HUNTINGDON 59 59 100.0% 0 0.0% 0 0.0% 0 0.0% 0 0.0%
INDIANA 91 62 68.1% 23 25.3% 6 6.6% 0 0.0% 0 0.0%
JEFFERSON 55 44 80.0% 0 0.0% 9 16.4% 1 1.8% 1 1.8%
JUNIATA 33 31 93.9% 2 6.1% 0 0.0% 0 0.0% 0 0.0%
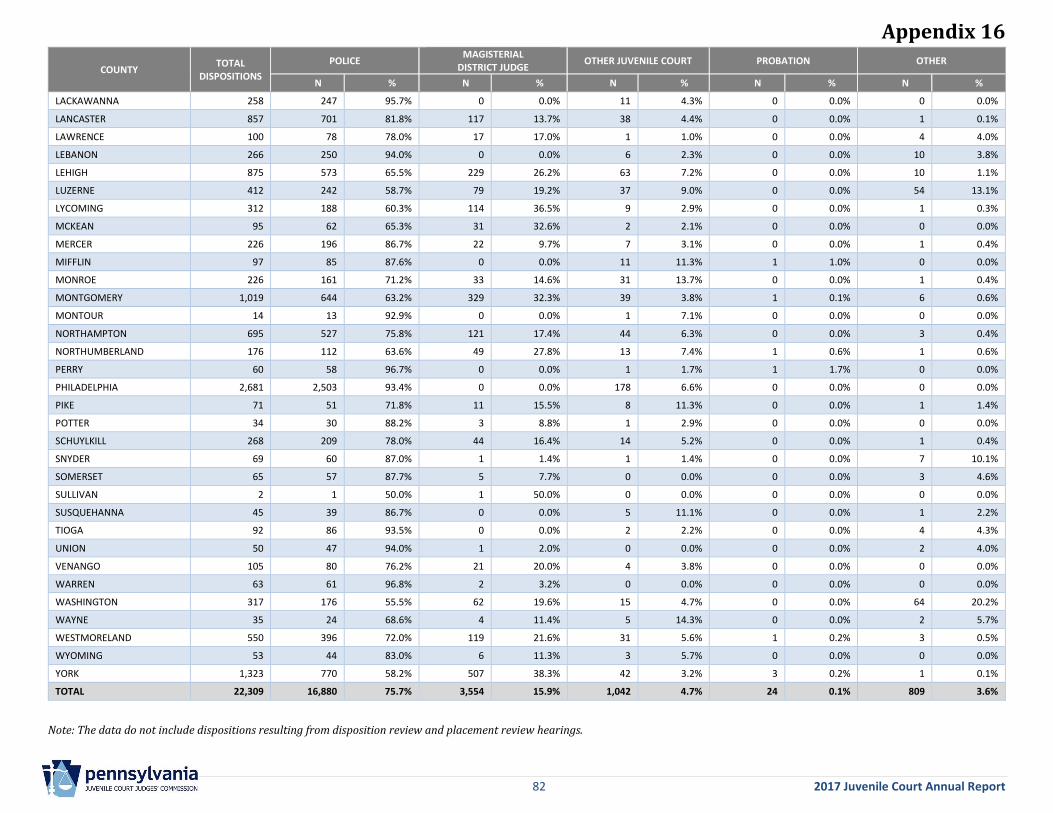
Appendix 16
82 2017 Juvenile Court Annual Report
COUNTY TOTAL
DISPOSITIONS
POLICE MAGISTERIAL
DISTRICT JUDGE OTHER JUVENILE COURT PROBATION OTHER
N % N % N % N % N %
LACKAWANNA 258 247 95.7% 0 0.0% 11 4.3% 0 0.0% 0 0.0%
LANCASTER 857 701 81.8% 117 13.7% 38 4.4% 0 0.0% 1 0.1%
LAWRENCE 100 78 78.0% 17 17.0% 1 1.0% 0 0.0% 4 4.0%
LEBANON 266 250 94.0% 0 0.0% 6 2.3% 0 0.0% 10 3.8%
LEHIGH 875 573 65.5% 229 26.2% 63 7.2% 0 0.0% 10 1.1%
LUZERNE 412 242 58.7% 79 19.2% 37 9.0% 0 0.0% 54 13.1%
LYCOMING 312 188 60.3% 114 36.5% 9 2.9% 0 0.0% 1 0.3%
MCKEAN 95 62 65.3% 31 32.6% 2 2.1% 0 0.0% 0 0.0%
MERCER 226 196 86.7% 22 9.7% 7 3.1% 0 0.0% 1 0.4%
MIFFLIN 97 85 87.6% 0 0.0% 11 11.3% 1 1.0% 0 0.0%
MONROE 226 161 71.2% 33 14.6% 31 13.7% 0 0.0% 1 0.4%
MONTGOMERY 1,019 644 63.2% 329 32.3% 39 3.8% 1 0.1% 6 0.6%
MONTOUR 14 13 92.9% 0 0.0% 1 7.1% 0 0.0% 0 0.0%
NORTHAMPTON 695 527 75.8% 121 17.4% 44 6.3% 0 0.0% 3 0.4%
NORTHUMBERLAND 176 112 63.6% 49 27.8% 13 7.4% 1 0.6% 1 0.6%
PERRY 60 58 96.7% 0 0.0% 1 1.7% 1 1.7% 0 0.0%
PHILADELPHIA 2,681 2,503 93.4% 0 0.0% 178 6.6% 0 0.0% 0 0.0%
PIKE 71 51 71.8% 11 15.5% 8 11.3% 0 0.0% 1 1.4%
POTTER 34 30 88.2% 3 8.8% 1 2.9% 0 0.0% 0 0.0%
SCHUYLKILL 268 209 78.0% 44 16.4% 14 5.2% 0 0.0% 1 0.4%
SNYDER 69 60 87.0% 1 1.4% 1 1.4% 0 0.0% 7 10.1%
SOMERSET 65 57 87.7% 5 7.7% 0 0.0% 0 0.0% 3 4.6%
SULLIVAN 2 1 50.0% 1 50.0% 0 0.0% 0 0.0% 0 0.0%
SUSQUEHANNA 45 39 86.7% 0 0.0% 5 11.1% 0 0.0% 1 2.2%
TIOGA 92 86 93.5% 0 0.0% 2 2.2% 0 0.0% 4 4.3%
UNION 50 47 94.0% 1 2.0% 0 0.0% 0 0.0% 2 4.0%
VENANGO 105 80 76.2% 21 20.0% 4 3.8% 0 0.0% 0 0.0%
WARREN 63 61 96.8% 2 3.2% 0 0.0% 0 0.0% 0 0.0%
WASHINGTON 317 176 55.5% 62 19.6% 15 4.7% 0 0.0% 64 20.2%
WAYNE 35 24 68.6% 4 11.4% 5 14.3% 0 0.0% 2 5.7%
WESTMORELAND 550 396 72.0% 119 21.6% 31 5.6% 1 0.2% 3 0.5%
WYOMING 53 44 83.0% 6 11.3% 3 5.7% 0 0.0% 0 0.0%
YORK 1,323 770 58.2% 507 38.3% 42 3.2% 3 0.2% 1 0.1%
TOTAL 22,309 16,880 75.7% 3,554 15.9% 1,042 4.7% 24 0.1% 809 3.6%
Note: The data do not include dispositions resulting from disposition review and placement review hearings.
Appendix 17
83 2017 Juvenile Court Annual Report
Type of Attorney Representation in Delinquency Proceedings, 2017
COUNTY NUMBER OF
PROCEEDINGS PUBLIC
DEFENDER %
COURT APPOINTED
% PRIVATE % WAIVED % NO
ATTORNEY PRESENT
%
ADAMS 172 123 71.5% 32 18.6% 17 9.9% 0 0.0% 0 0.0%
ALLEGHENY 1,301 780 60.0% 184 14.1% 337 25.9% 0 0.0% 0 0.0%
ARMSTRONG 62 42 67.7% 13 21.0% 7 11.3% 0 0.0% 0 0.0%
BEAVER 125 109 87.2% 1 0.8% 15 12.0% 0 0.0% 0 0.0%
BEDFORD 47 41 87.2% 1 2.1% 5 10.6% 0 0.0% 0 0.0%
BERKS 394 256 65.0% 103 26.1% 35 8.9% 0 0.0% 0 0.0%
BLAIR 178 98 55.1% 71 39.9% 9 5.1% 0 0.0% 0 0.0%
BRADFORD 35 25 71.4% 8 22.9% 2 5.7% 0 0.0% 0 0.0%
BUCKS 516 360 69.8% 64 12.4% 92 17.8% 0 0.0% 0 0.0%
BUTLER 187 128 68.4% 43 23.0% 16 8.6% 0 0.0% 0 0.0%
CAMBRIA 142 104 73.2% 30 21.1% 8 5.6% 0 0.0% 0 0.0%
CAMERON 5 4 80.0% 0 0.0% 1 20.0% 0 0.0% 0 0.0%
CARBON 44 31 70.5% 10 22.7% 3 6.8% 0 0.0% 0 0.0%
CENTRE 70 46 65.7% 1 1.4% 23 32.9% 0 0.0% 0 0.0%
CHESTER 394 268 68.0% 63 16.0% 63 16.0% 0 0.0% 0 0.0%
CLARION 26 25 96.2% 1 3.8% 0 0.0% 0 0.0% 0 0.0%
CLEARFIELD 31 24 77.4% 2 6.5% 5 16.1% 0 0.0% 0 0.0%
CLINTON 44 44 100.0% 0 0.0% 0 0.0% 0 0.0% 0 0.0%
COLUMBIA 64 45 70.3% 6 9.4% 13 20.3% 0 0.0% 0 0.0%
CRAWFORD 115 71 61.7% 34 29.6% 10 8.7% 0 0.0% 0 0.0%
CUMBERLAND 225 156 69.3% 53 23.6% 16 7.1% 0 0.0% 0 0.0%
DAUPHIN 262 200 76.3% 0 0.0% 62 23.7% 0 0.0% 0 0.0%
DELAWARE 866 611 70.6% 100 11.5% 150 17.3% 3 0.3% 2 0.2%
ELK 14 9 64.3% 5 35.7% 0 0.0% 0 0.0% 0 0.0%
ERIE 254 177 69.7% 74 29.1% 3 1.2% 0 0.0% 0 0.0%
FAYETTE 77 66 85.7% 2 2.6% 9 11.7% 0 0.0% 0 0.0%
FOREST 2 1 50.0% 1 50.0% 0 0.0% 0 0.0% 0 0.0%
FRANKLIN 155 115 74.2% 24 15.5% 16 10.3% 0 0.0% 0 0.0%
FULTON 4 1 25.0% 3 75.0% 0 0.0% 0 0.0% 0 0.0%
GREENE 17 12 70.6% 3 17.6% 2 11.8% 0 0.0% 0 0.0%
HUNTINGDON 51 40 78.4% 9 17.6% 2 3.9% 0 0.0% 0 0.0%
INDIANA 41 36 87.8% 0 0.0% 5 12.2% 0 0.0% 0 0.0%
JEFFERSON 50 46 92.0% 0 0.0% 4 8.0% 0 0.0% 0 0.0%
JUNIATA 30 28 93.3% 0 0.0% 2 6.7% 0 0.0% 0 0.0%
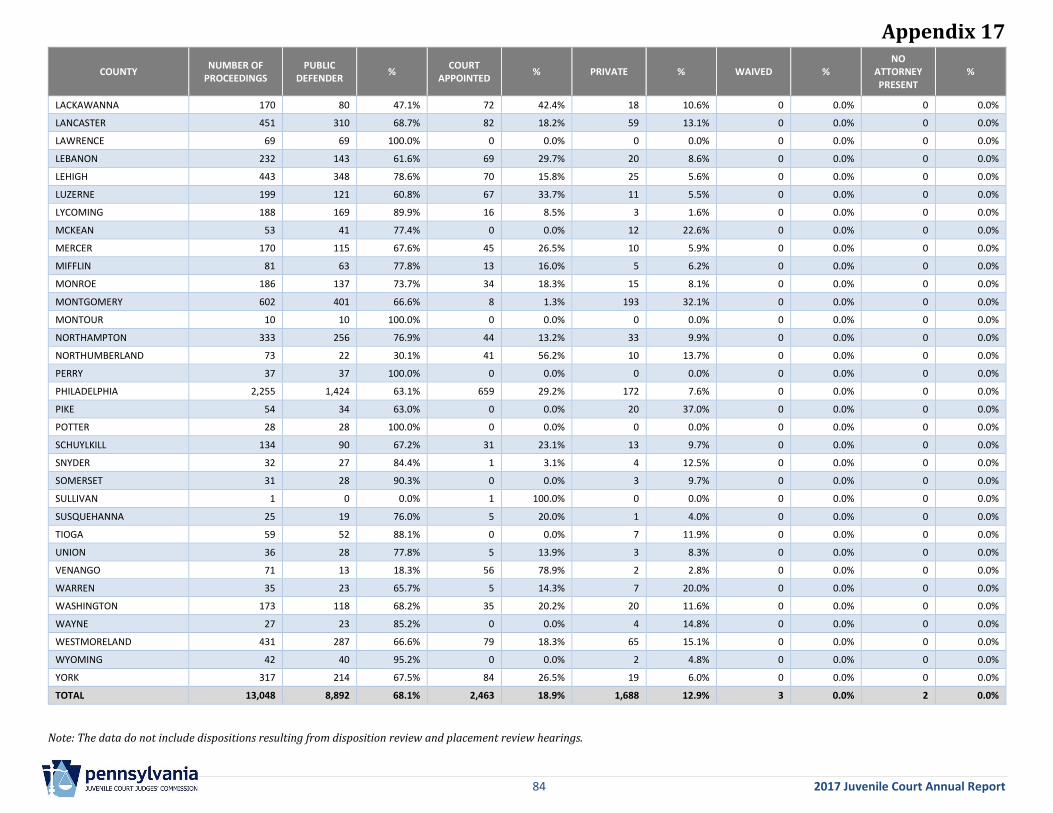
Appendix 17
84 2017 Juvenile Court Annual Report
COUNTY NUMBER OF
PROCEEDINGS PUBLIC
DEFENDER %
COURT APPOINTED
% PRIVATE % WAIVED % NO
ATTORNEY PRESENT
%
LACKAWANNA 170 80 47.1% 72 42.4% 18 10.6% 0 0.0% 0 0.0%
LANCASTER 451 310 68.7% 82 18.2% 59 13.1% 0 0.0% 0 0.0%
LAWRENCE 69 69 100.0% 0 0.0% 0 0.0% 0 0.0% 0 0.0%
LEBANON 232 143 61.6% 69 29.7% 20 8.6% 0 0.0% 0 0.0%
LEHIGH 443 348 78.6% 70 15.8% 25 5.6% 0 0.0% 0 0.0%
LUZERNE 199 121 60.8% 67 33.7% 11 5.5% 0 0.0% 0 0.0%
LYCOMING 188 169 89.9% 16 8.5% 3 1.6% 0 0.0% 0 0.0%
MCKEAN 53 41 77.4% 0 0.0% 12 22.6% 0 0.0% 0 0.0%
MERCER 170 115 67.6% 45 26.5% 10 5.9% 0 0.0% 0 0.0%
MIFFLIN 81 63 77.8% 13 16.0% 5 6.2% 0 0.0% 0 0.0%
MONROE 186 137 73.7% 34 18.3% 15 8.1% 0 0.0% 0 0.0%
MONTGOMERY 602 401 66.6% 8 1.3% 193 32.1% 0 0.0% 0 0.0%
MONTOUR 10 10 100.0% 0 0.0% 0 0.0% 0 0.0% 0 0.0%
NORTHAMPTON 333 256 76.9% 44 13.2% 33 9.9% 0 0.0% 0 0.0%
NORTHUMBERLAND 73 22 30.1% 41 56.2% 10 13.7% 0 0.0% 0 0.0%
PERRY 37 37 100.0% 0 0.0% 0 0.0% 0 0.0% 0 0.0%
PHILADELPHIA 2,255 1,424 63.1% 659 29.2% 172 7.6% 0 0.0% 0 0.0%
PIKE 54 34 63.0% 0 0.0% 20 37.0% 0 0.0% 0 0.0%
POTTER 28 28 100.0% 0 0.0% 0 0.0% 0 0.0% 0 0.0%
SCHUYLKILL 134 90 67.2% 31 23.1% 13 9.7% 0 0.0% 0 0.0%
SNYDER 32 27 84.4% 1 3.1% 4 12.5% 0 0.0% 0 0.0%
SOMERSET 31 28 90.3% 0 0.0% 3 9.7% 0 0.0% 0 0.0%
SULLIVAN 1 0 0.0% 1 100.0% 0 0.0% 0 0.0% 0 0.0%
SUSQUEHANNA 25 19 76.0% 5 20.0% 1 4.0% 0 0.0% 0 0.0%
TIOGA 59 52 88.1% 0 0.0% 7 11.9% 0 0.0% 0 0.0%
UNION 36 28 77.8% 5 13.9% 3 8.3% 0 0.0% 0 0.0%
VENANGO 71 13 18.3% 56 78.9% 2 2.8% 0 0.0% 0 0.0%
WARREN 35 23 65.7% 5 14.3% 7 20.0% 0 0.0% 0 0.0%
WASHINGTON 173 118 68.2% 35 20.2% 20 11.6% 0 0.0% 0 0.0%
WAYNE 27 23 85.2% 0 0.0% 4 14.8% 0 0.0% 0 0.0%
WESTMORELAND 431 287 66.6% 79 18.3% 65 15.1% 0 0.0% 0 0.0%
WYOMING 42 40 95.2% 0 0.0% 2 4.8% 0 0.0% 0 0.0%
YORK 317 214 67.5% 84 26.5% 19 6.0% 0 0.0% 0 0.0%
TOTAL 13,048 8,892 68.1% 2,463 18.9% 1,688 12.9% 3 0.0% 2 0.0%
Note: The data do not include dispositions resulting from disposition review and placement review hearings.
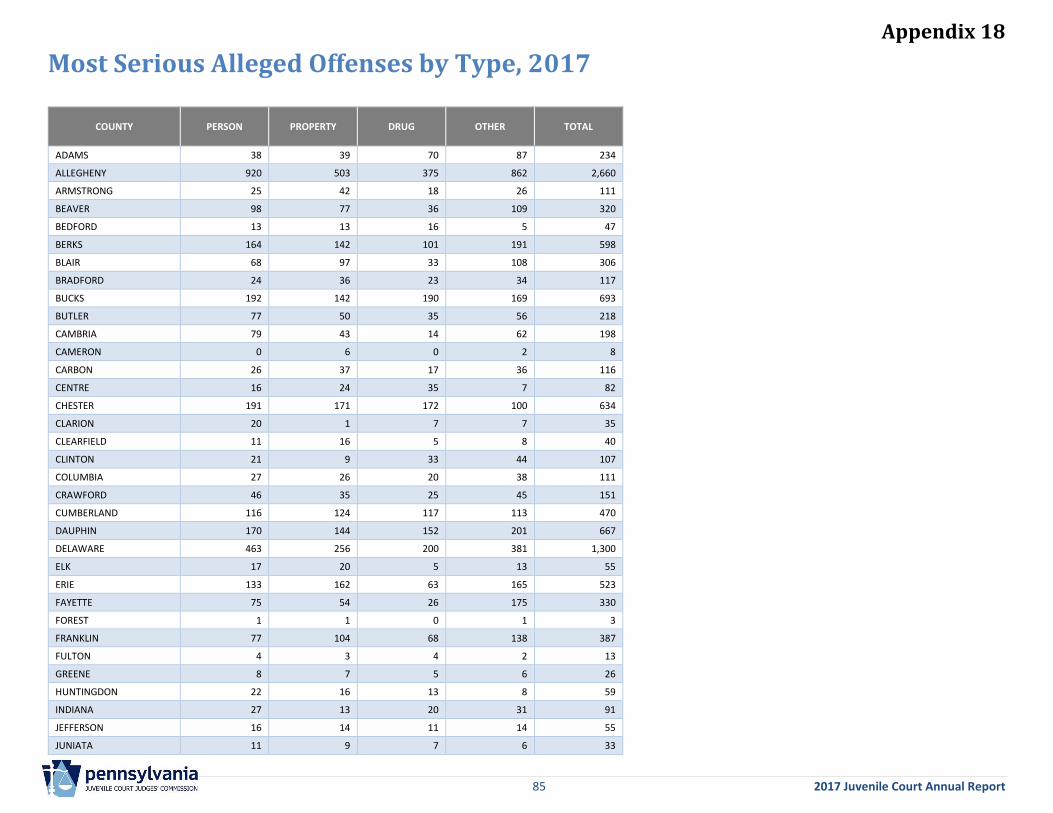
Appendix 18
85 2017 Juvenile Court Annual Report
Most Serious Alleged Offenses by Type, 2017
COUNTY PERSON PROPERTY DRUG OTHER TOTAL
ADAMS 38 39 70 87 234
ALLEGHENY 920 503 375 862 2,660
ARMSTRONG 25 42 18 26 111
BEAVER 98 77 36 109 320
BEDFORD 13 13 16 5 47
BERKS 164 142 101 191 598
BLAIR 68 97 33 108 306
BRADFORD 24 36 23 34 117
BUCKS 192 142 190 169 693
BUTLER 77 50 35 56 218
CAMBRIA 79 43 14 62 198
CAMERON 0 6 0 2 8
CARBON 26 37 17 36 116
CENTRE 16 24 35 7 82
CHESTER 191 171 172 100 634
CLARION 20 1 7 7 35
CLEARFIELD 11 16 5 8 40
CLINTON 21 9 33 44 107
COLUMBIA 27 26 20 38 111
CRAWFORD 46 35 25 45 151
CUMBERLAND 116 124 117 113 470
DAUPHIN 170 144 152 201 667
DELAWARE 463 256 200 381 1,300
ELK 17 20 5 13 55
ERIE 133 162 63 165 523
FAYETTE 75 54 26 175 330
FOREST 1 1 0 1 3
FRANKLIN 77 104 68 138 387
FULTON 4 3 4 2 13
GREENE 8 7 5 6 26
HUNTINGDON 22 16 13 8 59
INDIANA 27 13 20 31 91
JEFFERSON 16 14 11 14 55
JUNIATA 11 9 7 6 33
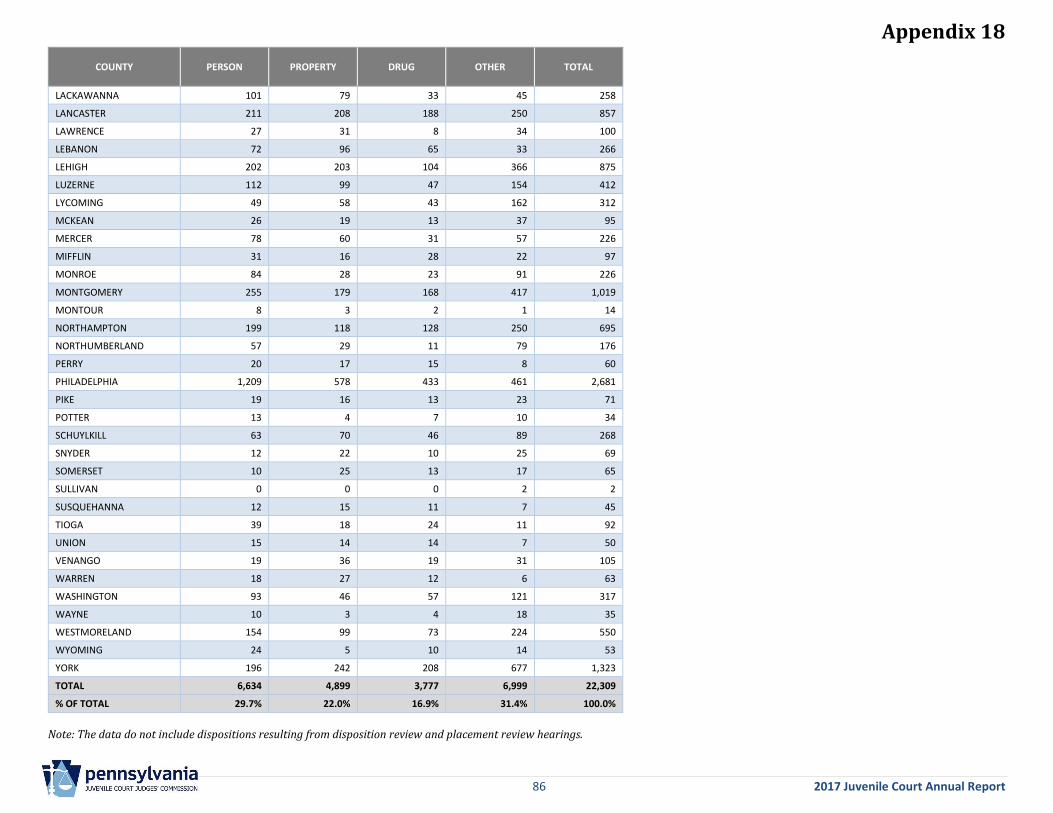
Appendix 18
86 2017 Juvenile Court Annual Report
COUNTY PERSON PROPERTY DRUG OTHER TOTAL
LACKAWANNA 101 79 33 45 258
LANCASTER 211 208 188 250 857
LAWRENCE 27 31 8 34 100
LEBANON 72 96 65 33 266
LEHIGH 202 203 104 366 875
LUZERNE 112 99 47 154 412
LYCOMING 49 58 43 162 312
MCKEAN 26 19 13 37 95
MERCER 78 60 31 57 226
MIFFLIN 31 16 28 22 97
MONROE 84 28 23 91 226
MONTGOMERY 255 179 168 417 1,019
MONTOUR 8 3 2 1 14
NORTHAMPTON 199 118 128 250 695
NORTHUMBERLAND 57 29 11 79 176
PERRY 20 17 15 8 60
PHILADELPHIA 1,209 578 433 461 2,681
PIKE 19 16 13 23 71
POTTER 13 4 7 10 34
SCHUYLKILL 63 70 46 89 268
SNYDER 12 22 10 25 69
SOMERSET 10 25 13 17 65
SULLIVAN 0 0 0 2 2
SUSQUEHANNA 12 15 11 7 45
TIOGA 39 18 24 11 92
UNION 15 14 14 7 50
VENANGO 19 36 19 31 105
WARREN 18 27 12 6 63
WASHINGTON 93 46 57 121 317
WAYNE 10 3 4 18 35
WESTMORELAND 154 99 73 224 550
WYOMING 24 5 10 14 53
YORK 196 242 208 677 1,323
TOTAL 6,634 4,899 3,777 6,999 22,309
% OF TOTAL 29.7% 22.0% 16.9% 31.4% 100.0%
Note: The data do not include dispositions resulting from disposition review and placement review hearings.
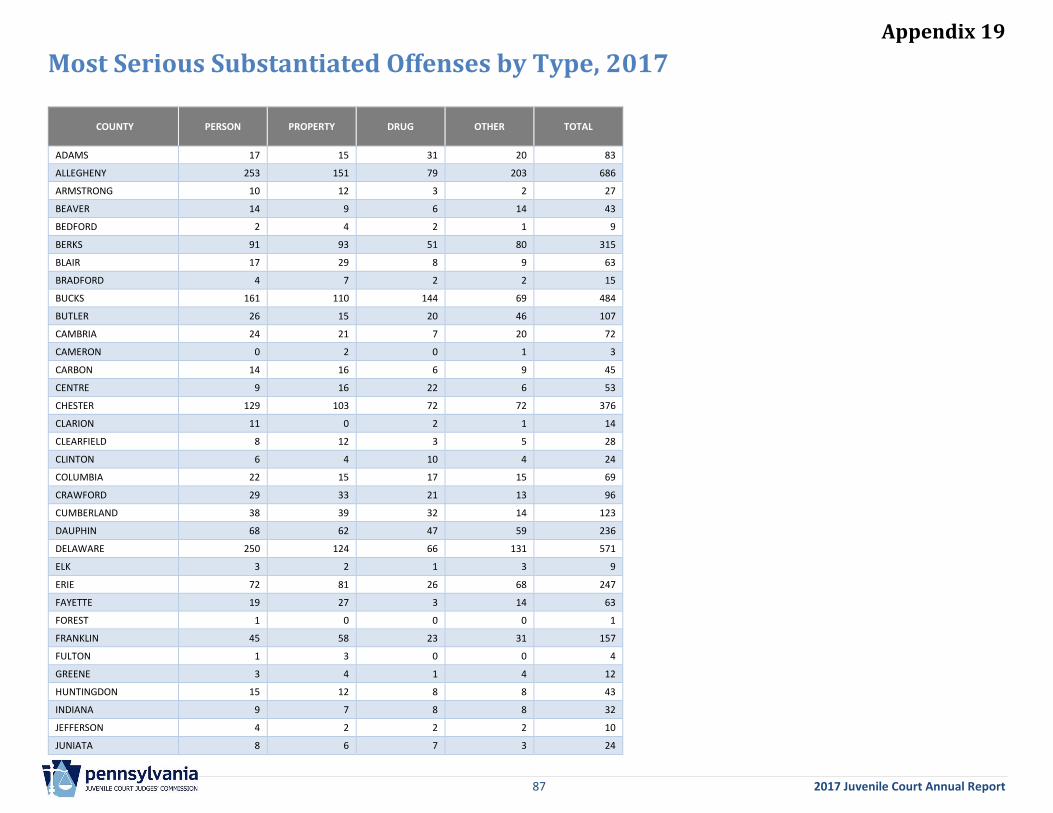
Appendix 19
87 2017 Juvenile Court Annual Report
Most Serious Substantiated Offenses by Type, 2017
COUNTY PERSON PROPERTY DRUG OTHER TOTAL
ADAMS 17 15 31 20 83
ALLEGHENY 253 151 79 203 686
ARMSTRONG 10 12 3 2 27
BEAVER 14 9 6 14 43
BEDFORD 2 4 2 1 9
BERKS 91 93 51 80 315
BLAIR 17 29 8 9 63
BRADFORD 4 7 2 2 15
BUCKS 161 110 144 69 484
BUTLER 26 15 20 46 107
CAMBRIA 24 21 7 20 72
CAMERON 0 2 0 1 3
CARBON 14 16 6 9 45
CENTRE 9 16 22 6 53
CHESTER 129 103 72 72 376
CLARION 11 0 2 1 14
CLEARFIELD 8 12 3 5 28
CLINTON 6 4 10 4 24
COLUMBIA 22 15 17 15 69
CRAWFORD 29 33 21 13 96
CUMBERLAND 38 39 32 14 123
DAUPHIN 68 62 47 59 236
DELAWARE 250 124 66 131 571
ELK 3 2 1 3 9
ERIE 72 81 26 68 247
FAYETTE 19 27 3 14 63
FOREST 1 0 0 0 1
FRANKLIN 45 58 23 31 157
FULTON 1 3 0 0 4
GREENE 3 4 1 4 12
HUNTINGDON 15 12 8 8 43
INDIANA 9 7 8 8 32
JEFFERSON 4 2 2 2 10
JUNIATA 8 6 7 3 24
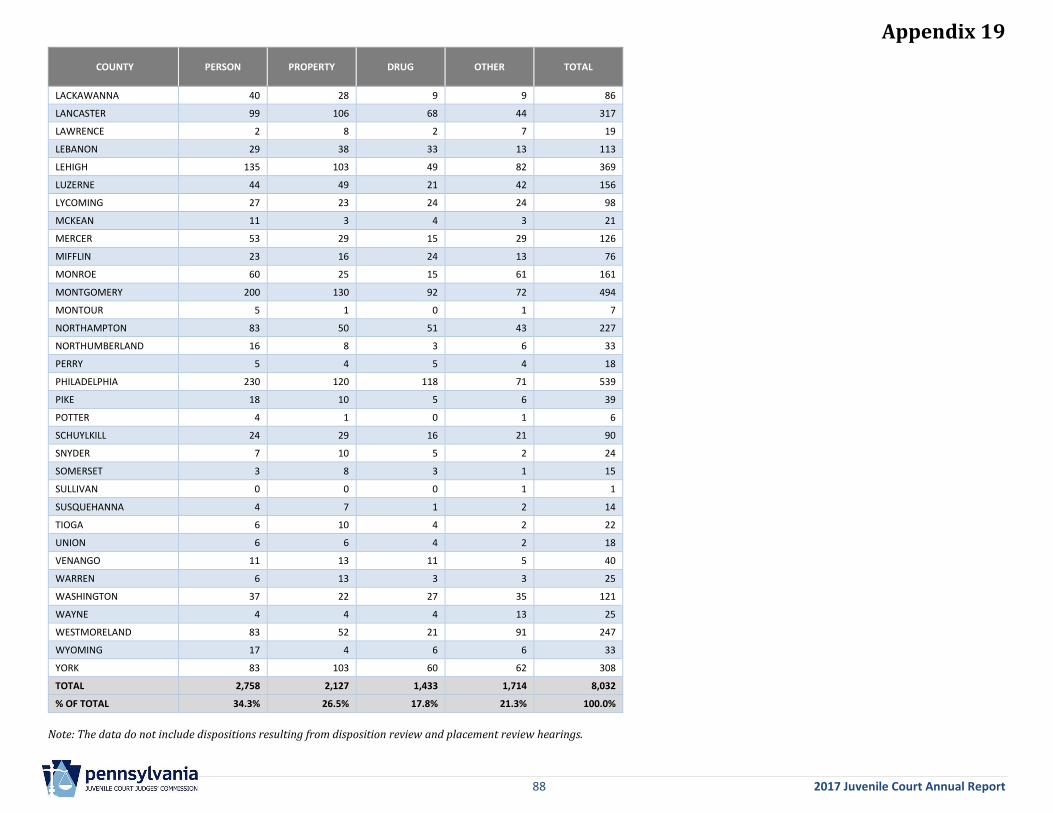
Appendix 19
88 2017 Juvenile Court Annual Report
COUNTY PERSON PROPERTY DRUG OTHER TOTAL
LACKAWANNA 40 28 9 9 86
LANCASTER 99 106 68 44 317
LAWRENCE 2 8 2 7 19
LEBANON 29 38 33 13 113
LEHIGH 135 103 49 82 369
LUZERNE 44 49 21 42 156
LYCOMING 27 23 24 24 98
MCKEAN 11 3 4 3 21
MERCER 53 29 15 29 126
MIFFLIN 23 16 24 13 76
MONROE 60 25 15 61 161
MONTGOMERY 200 130 92 72 494
MONTOUR 5 1 0 1 7
NORTHAMPTON 83 50 51 43 227
NORTHUMBERLAND 16 8 3 6 33
PERRY 5 4 5 4 18
PHILADELPHIA 230 120 118 71 539
PIKE 18 10 5 6 39
POTTER 4 1 0 1 6
SCHUYLKILL 24 29 16 21 90
SNYDER 7 10 5 2 24
SOMERSET 3 8 3 1 15
SULLIVAN 0 0 0 1 1
SUSQUEHANNA 4 7 1 2 14
TIOGA 6 10 4 2 22
UNION 6 6 4 2 18
VENANGO 11 13 11 5 40
WARREN 6 13 3 3 25
WASHINGTON 37 22 27 35 121
WAYNE 4 4 4 13 25
WESTMORELAND 83 52 21 91 247
WYOMING 17 4 6 6 33
YORK 83 103 60 62 308
TOTAL 2,758 2,127 1,433 1,714 8,032
% OF TOTAL 34.3% 26.5% 17.8% 21.3% 100.0%
Note: The data do not include dispositions resulting from disposition review and placement review hearings.
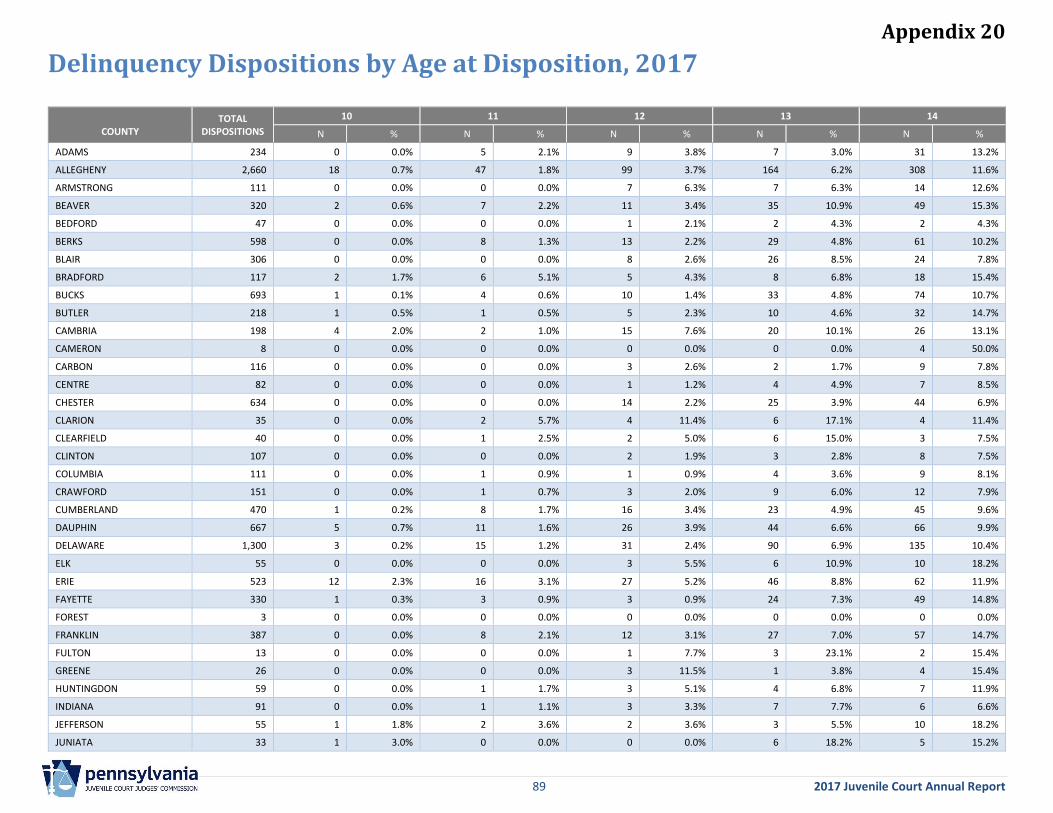
Appendix 20
89 2017 Juvenile Court Annual Report
Delinquency Dispositions by Age at Disposition, 2017
COUNTY
TOTAL DISPOSITIONS
10 11 12 13 14
N % N % N % N % N %
ADAMS 234 0 0.0% 5 2.1% 9 3.8% 7 3.0% 31 13.2%
ALLEGHENY 2,660 18 0.7% 47 1.8% 99 3.7% 164 6.2% 308 11.6%
ARMSTRONG 111 0 0.0% 0 0.0% 7 6.3% 7 6.3% 14 12.6%
BEAVER 320 2 0.6% 7 2.2% 11 3.4% 35 10.9% 49 15.3%
BEDFORD 47 0 0.0% 0 0.0% 1 2.1% 2 4.3% 2 4.3%
BERKS 598 0 0.0% 8 1.3% 13 2.2% 29 4.8% 61 10.2%
BLAIR 306 0 0.0% 0 0.0% 8 2.6% 26 8.5% 24 7.8%
BRADFORD 117 2 1.7% 6 5.1% 5 4.3% 8 6.8% 18 15.4%
BUCKS 693 1 0.1% 4 0.6% 10 1.4% 33 4.8% 74 10.7%
BUTLER 218 1 0.5% 1 0.5% 5 2.3% 10 4.6% 32 14.7%
CAMBRIA 198 4 2.0% 2 1.0% 15 7.6% 20 10.1% 26 13.1%
CAMERON 8 0 0.0% 0 0.0% 0 0.0% 0 0.0% 4 50.0%
CARBON 116 0 0.0% 0 0.0% 3 2.6% 2 1.7% 9 7.8%
CENTRE 82 0 0.0% 0 0.0% 1 1.2% 4 4.9% 7 8.5%
CHESTER 634 0 0.0% 0 0.0% 14 2.2% 25 3.9% 44 6.9%
CLARION 35 0 0.0% 2 5.7% 4 11.4% 6 17.1% 4 11.4%
CLEARFIELD 40 0 0.0% 1 2.5% 2 5.0% 6 15.0% 3 7.5%
CLINTON 107 0 0.0% 0 0.0% 2 1.9% 3 2.8% 8 7.5%
COLUMBIA 111 0 0.0% 1 0.9% 1 0.9% 4 3.6% 9 8.1%
CRAWFORD 151 0 0.0% 1 0.7% 3 2.0% 9 6.0% 12 7.9%
CUMBERLAND 470 1 0.2% 8 1.7% 16 3.4% 23 4.9% 45 9.6%
DAUPHIN 667 5 0.7% 11 1.6% 26 3.9% 44 6.6% 66 9.9%
DELAWARE 1,300 3 0.2% 15 1.2% 31 2.4% 90 6.9% 135 10.4%
ELK 55 0 0.0% 0 0.0% 3 5.5% 6 10.9% 10 18.2%
ERIE 523 12 2.3% 16 3.1% 27 5.2% 46 8.8% 62 11.9%
FAYETTE 330 1 0.3% 3 0.9% 3 0.9% 24 7.3% 49 14.8%
FOREST 3 0 0.0% 0 0.0% 0 0.0% 0 0.0% 0 0.0%
FRANKLIN 387 0 0.0% 8 2.1% 12 3.1% 27 7.0% 57 14.7%
FULTON 13 0 0.0% 0 0.0% 1 7.7% 3 23.1% 2 15.4%
GREENE 26 0 0.0% 0 0.0% 3 11.5% 1 3.8% 4 15.4%
HUNTINGDON 59 0 0.0% 1 1.7% 3 5.1% 4 6.8% 7 11.9%
INDIANA 91 0 0.0% 1 1.1% 3 3.3% 7 7.7% 6 6.6%
JEFFERSON 55 1 1.8% 2 3.6% 2 3.6% 3 5.5% 10 18.2%
JUNIATA 33 1 3.0% 0 0.0% 0 0.0% 6 18.2% 5 15.2%
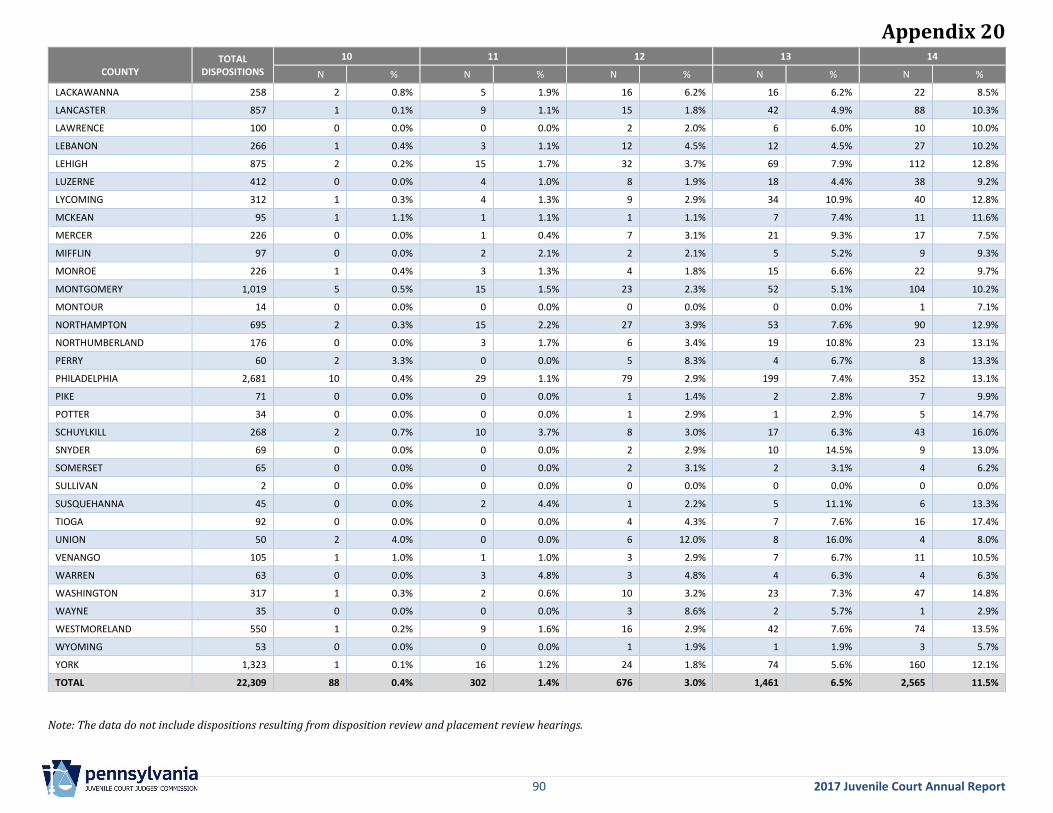
Appendix 20
90 2017 Juvenile Court Annual Report
COUNTY
TOTAL DISPOSITIONS
10 11 12 13 14
N % N % N % N % N %
LACKAWANNA 258 2 0.8% 5 1.9% 16 6.2% 16 6.2% 22 8.5%
LANCASTER 857 1 0.1% 9 1.1% 15 1.8% 42 4.9% 88 10.3%
LAWRENCE 100 0 0.0% 0 0.0% 2 2.0% 6 6.0% 10 10.0%
LEBANON 266 1 0.4% 3 1.1% 12 4.5% 12 4.5% 27 10.2%
LEHIGH 875 2 0.2% 15 1.7% 32 3.7% 69 7.9% 112 12.8%
LUZERNE 412 0 0.0% 4 1.0% 8 1.9% 18 4.4% 38 9.2%
LYCOMING 312 1 0.3% 4 1.3% 9 2.9% 34 10.9% 40 12.8%
MCKEAN 95 1 1.1% 1 1.1% 1 1.1% 7 7.4% 11 11.6%
MERCER 226 0 0.0% 1 0.4% 7 3.1% 21 9.3% 17 7.5%
MIFFLIN 97 0 0.0% 2 2.1% 2 2.1% 5 5.2% 9 9.3%
MONROE 226 1 0.4% 3 1.3% 4 1.8% 15 6.6% 22 9.7%
MONTGOMERY 1,019 5 0.5% 15 1.5% 23 2.3% 52 5.1% 104 10.2%
MONTOUR 14 0 0.0% 0 0.0% 0 0.0% 0 0.0% 1 7.1%
NORTHAMPTON 695 2 0.3% 15 2.2% 27 3.9% 53 7.6% 90 12.9%
NORTHUMBERLAND 176 0 0.0% 3 1.7% 6 3.4% 19 10.8% 23 13.1%
PERRY 60 2 3.3% 0 0.0% 5 8.3% 4 6.7% 8 13.3%
PHILADELPHIA 2,681 10 0.4% 29 1.1% 79 2.9% 199 7.4% 352 13.1%
PIKE 71 0 0.0% 0 0.0% 1 1.4% 2 2.8% 7 9.9%
POTTER 34 0 0.0% 0 0.0% 1 2.9% 1 2.9% 5 14.7%
SCHUYLKILL 268 2 0.7% 10 3.7% 8 3.0% 17 6.3% 43 16.0%
SNYDER 69 0 0.0% 0 0.0% 2 2.9% 10 14.5% 9 13.0%
SOMERSET 65 0 0.0% 0 0.0% 2 3.1% 2 3.1% 4 6.2%
SULLIVAN 2 0 0.0% 0 0.0% 0 0.0% 0 0.0% 0 0.0%
SUSQUEHANNA 45 0 0.0% 2 4.4% 1 2.2% 5 11.1% 6 13.3%
TIOGA 92 0 0.0% 0 0.0% 4 4.3% 7 7.6% 16 17.4%
UNION 50 2 4.0% 0 0.0% 6 12.0% 8 16.0% 4 8.0%
VENANGO 105 1 1.0% 1 1.0% 3 2.9% 7 6.7% 11 10.5%
WARREN 63 0 0.0% 3 4.8% 3 4.8% 4 6.3% 4 6.3%
WASHINGTON 317 1 0.3% 2 0.6% 10 3.2% 23 7.3% 47 14.8%
WAYNE 35 0 0.0% 0 0.0% 3 8.6% 2 5.7% 1 2.9%
WESTMORELAND 550 1 0.2% 9 1.6% 16 2.9% 42 7.6% 74 13.5%
WYOMING 53 0 0.0% 0 0.0% 1 1.9% 1 1.9% 3 5.7%
YORK 1,323 1 0.1% 16 1.2% 24 1.8% 74 5.6% 160 12.1%
TOTAL 22,309 88 0.4% 302 1.4% 676 3.0% 1,461 6.5% 2,565 11.5%
Note: The data do not include dispositions resulting from disposition review and placement review hearings.
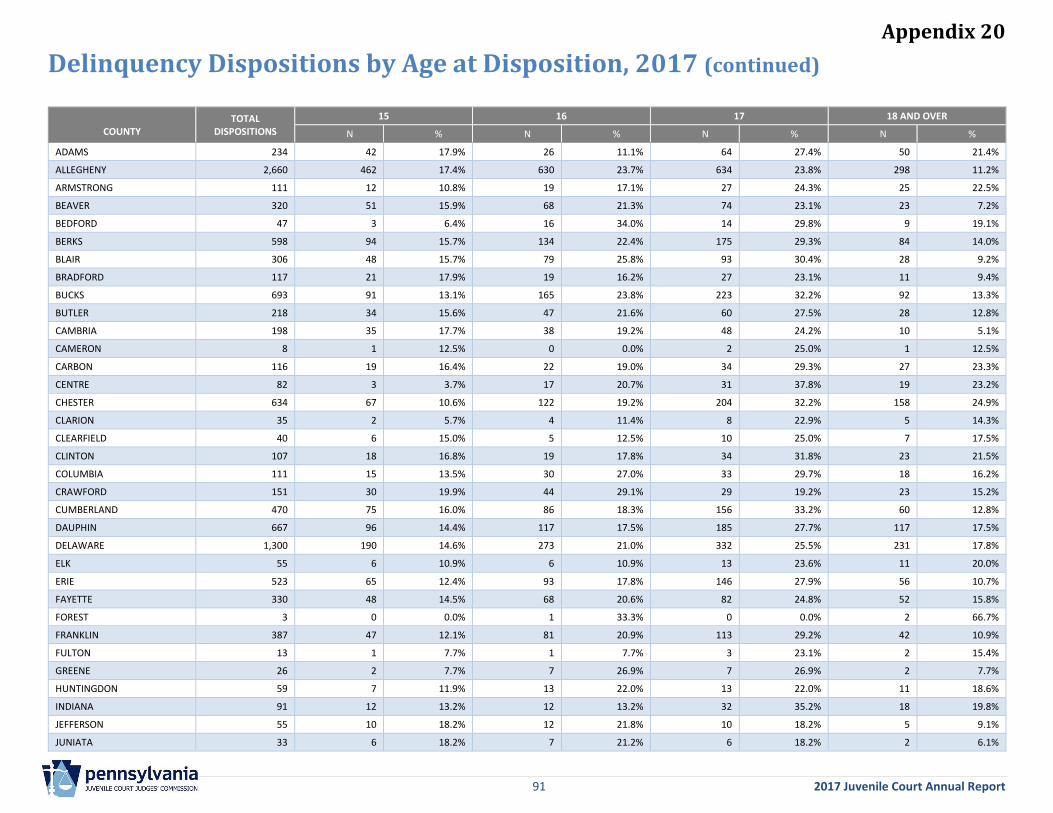
Appendix 20
91 2017 Juvenile Court Annual Report
Delinquency Dispositions by Age at Disposition, 2017 (continued)
COUNTY
TOTAL DISPOSITIONS
15 16 17 18 AND OVER
N % N % N % N %
ADAMS 234 42 17.9% 26 11.1% 64 27.4% 50 21.4%
ALLEGHENY 2,660 462 17.4% 630 23.7% 634 23.8% 298 11.2%
ARMSTRONG 111 12 10.8% 19 17.1% 27 24.3% 25 22.5%
BEAVER 320 51 15.9% 68 21.3% 74 23.1% 23 7.2%
BEDFORD 47 3 6.4% 16 34.0% 14 29.8% 9 19.1%
BERKS 598 94 15.7% 134 22.4% 175 29.3% 84 14.0%
BLAIR 306 48 15.7% 79 25.8% 93 30.4% 28 9.2%
BRADFORD 117 21 17.9% 19 16.2% 27 23.1% 11 9.4%
BUCKS 693 91 13.1% 165 23.8% 223 32.2% 92 13.3%
BUTLER 218 34 15.6% 47 21.6% 60 27.5% 28 12.8%
CAMBRIA 198 35 17.7% 38 19.2% 48 24.2% 10 5.1%
CAMERON 8 1 12.5% 0 0.0% 2 25.0% 1 12.5%
CARBON 116 19 16.4% 22 19.0% 34 29.3% 27 23.3%
CENTRE 82 3 3.7% 17 20.7% 31 37.8% 19 23.2%
CHESTER 634 67 10.6% 122 19.2% 204 32.2% 158 24.9%
CLARION 35 2 5.7% 4 11.4% 8 22.9% 5 14.3%
CLEARFIELD 40 6 15.0% 5 12.5% 10 25.0% 7 17.5%
CLINTON 107 18 16.8% 19 17.8% 34 31.8% 23 21.5%
COLUMBIA 111 15 13.5% 30 27.0% 33 29.7% 18 16.2%
CRAWFORD 151 30 19.9% 44 29.1% 29 19.2% 23 15.2%
CUMBERLAND 470 75 16.0% 86 18.3% 156 33.2% 60 12.8%
DAUPHIN 667 96 14.4% 117 17.5% 185 27.7% 117 17.5%
DELAWARE 1,300 190 14.6% 273 21.0% 332 25.5% 231 17.8%
ELK 55 6 10.9% 6 10.9% 13 23.6% 11 20.0%
ERIE 523 65 12.4% 93 17.8% 146 27.9% 56 10.7%
FAYETTE 330 48 14.5% 68 20.6% 82 24.8% 52 15.8%
FOREST 3 0 0.0% 1 33.3% 0 0.0% 2 66.7%
FRANKLIN 387 47 12.1% 81 20.9% 113 29.2% 42 10.9%
FULTON 13 1 7.7% 1 7.7% 3 23.1% 2 15.4%
GREENE 26 2 7.7% 7 26.9% 7 26.9% 2 7.7%
HUNTINGDON 59 7 11.9% 13 22.0% 13 22.0% 11 18.6%
INDIANA 91 12 13.2% 12 13.2% 32 35.2% 18 19.8%
JEFFERSON 55 10 18.2% 12 21.8% 10 18.2% 5 9.1%
JUNIATA 33 6 18.2% 7 21.2% 6 18.2% 2 6.1%
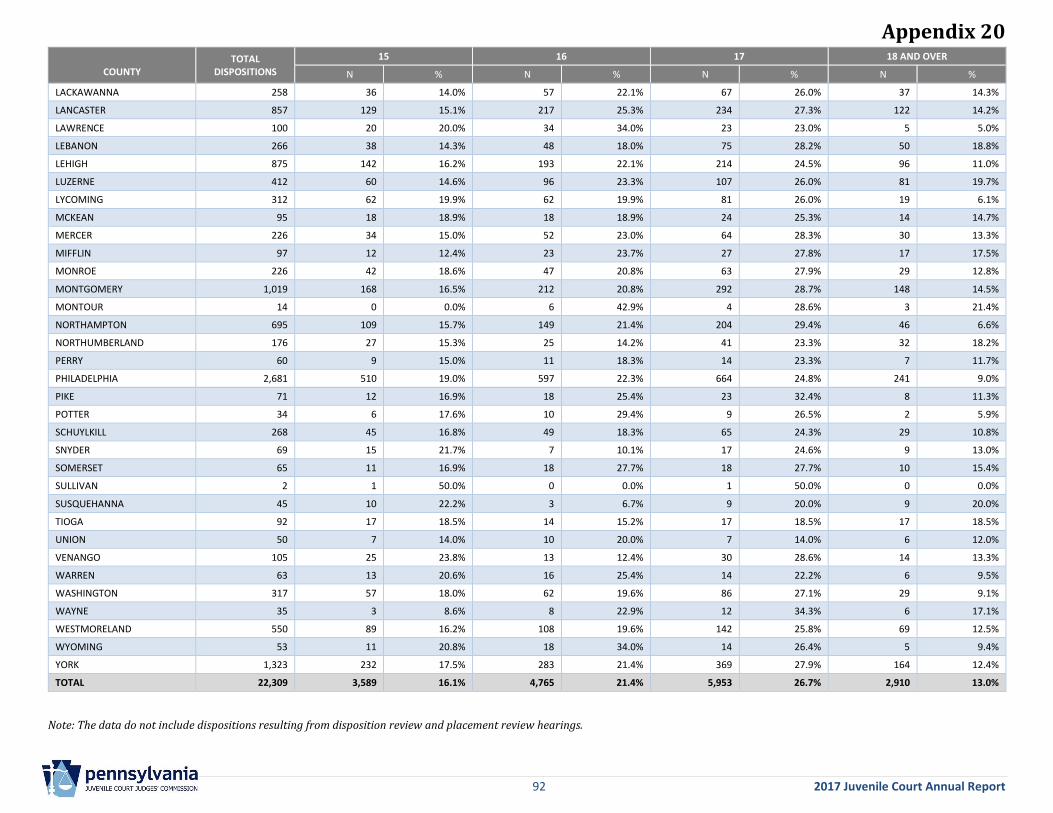
Appendix 20
92 2017 Juvenile Court Annual Report
COUNTY
TOTAL DISPOSITIONS
15 16 17 18 AND OVER
N % N % N % N %
LACKAWANNA 258 36 14.0% 57 22.1% 67 26.0% 37 14.3%
LANCASTER 857 129 15.1% 217 25.3% 234 27.3% 122 14.2%
LAWRENCE 100 20 20.0% 34 34.0% 23 23.0% 5 5.0%
LEBANON 266 38 14.3% 48 18.0% 75 28.2% 50 18.8%
LEHIGH 875 142 16.2% 193 22.1% 214 24.5% 96 11.0%
LUZERNE 412 60 14.6% 96 23.3% 107 26.0% 81 19.7%
LYCOMING 312 62 19.9% 62 19.9% 81 26.0% 19 6.1%
MCKEAN 95 18 18.9% 18 18.9% 24 25.3% 14 14.7%
MERCER 226 34 15.0% 52 23.0% 64 28.3% 30 13.3%
MIFFLIN 97 12 12.4% 23 23.7% 27 27.8% 17 17.5%
MONROE 226 42 18.6% 47 20.8% 63 27.9% 29 12.8%
MONTGOMERY 1,019 168 16.5% 212 20.8% 292 28.7% 148 14.5%
MONTOUR 14 0 0.0% 6 42.9% 4 28.6% 3 21.4%
NORTHAMPTON 695 109 15.7% 149 21.4% 204 29.4% 46 6.6%
NORTHUMBERLAND 176 27 15.3% 25 14.2% 41 23.3% 32 18.2%
PERRY 60 9 15.0% 11 18.3% 14 23.3% 7 11.7%
PHILADELPHIA 2,681 510 19.0% 597 22.3% 664 24.8% 241 9.0%
PIKE 71 12 16.9% 18 25.4% 23 32.4% 8 11.3%
POTTER 34 6 17.6% 10 29.4% 9 26.5% 2 5.9%
SCHUYLKILL 268 45 16.8% 49 18.3% 65 24.3% 29 10.8%
SNYDER 69 15 21.7% 7 10.1% 17 24.6% 9 13.0%
SOMERSET 65 11 16.9% 18 27.7% 18 27.7% 10 15.4%
SULLIVAN 2 1 50.0% 0 0.0% 1 50.0% 0 0.0%
SUSQUEHANNA 45 10 22.2% 3 6.7% 9 20.0% 9 20.0%
TIOGA 92 17 18.5% 14 15.2% 17 18.5% 17 18.5%
UNION 50 7 14.0% 10 20.0% 7 14.0% 6 12.0%
VENANGO 105 25 23.8% 13 12.4% 30 28.6% 14 13.3%
WARREN 63 13 20.6% 16 25.4% 14 22.2% 6 9.5%
WASHINGTON 317 57 18.0% 62 19.6% 86 27.1% 29 9.1%
WAYNE 35 3 8.6% 8 22.9% 12 34.3% 6 17.1%
WESTMORELAND 550 89 16.2% 108 19.6% 142 25.8% 69 12.5%
WYOMING 53 11 20.8% 18 34.0% 14 26.4% 5 9.4%
YORK 1,323 232 17.5% 283 21.4% 369 27.9% 164 12.4%
TOTAL 22,309 3,589 16.1% 4,765 21.4% 5,953 26.7% 2,910 13.0%
Note: The data do not include dispositions resulting from disposition review and placement review hearings.
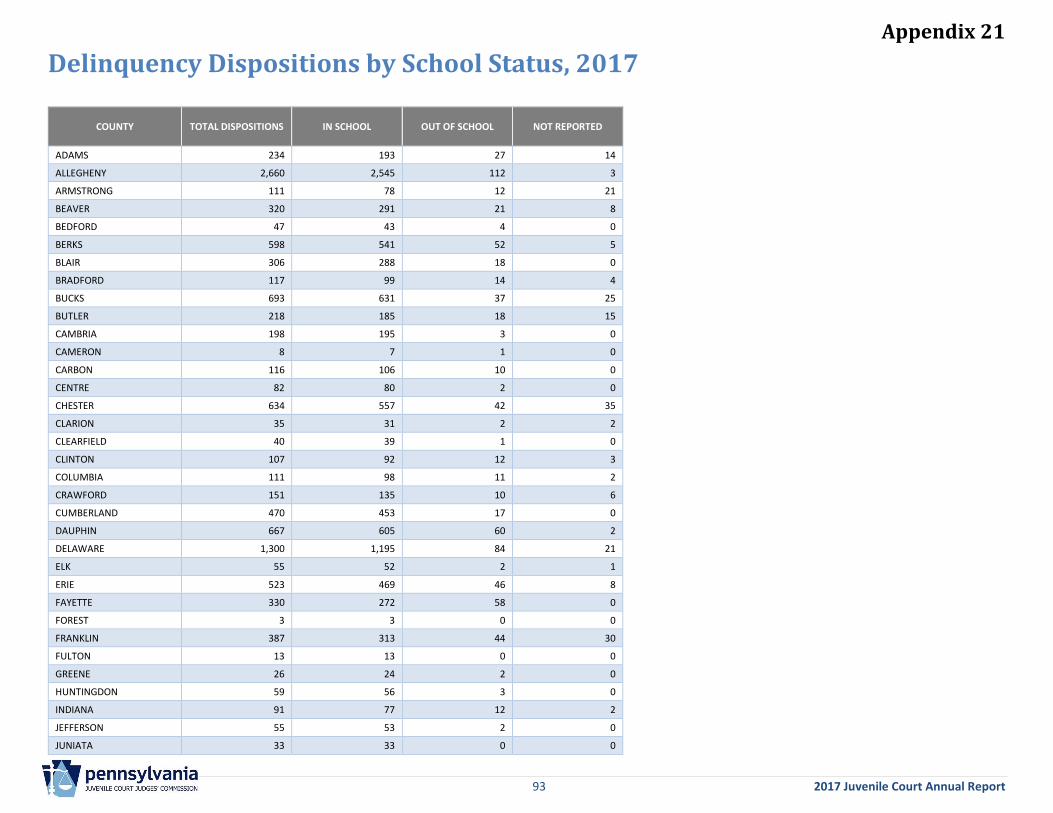
Appendix 21
93 2017 Juvenile Court Annual Report
Delinquency Dispositions by School Status, 2017
COUNTY TOTAL DISPOSITIONS IN SCHOOL OUT OF SCHOOL NOT REPORTED
ADAMS 234 193 27 14
ALLEGHENY 2,660 2,545 112 3
ARMSTRONG 111 78 12 21
BEAVER 320 291 21 8
BEDFORD 47 43 4 0
BERKS 598 541 52 5
BLAIR 306 288 18 0
BRADFORD 117 99 14 4
BUCKS 693 631 37 25
BUTLER 218 185 18 15
CAMBRIA 198 195 3 0
CAMERON 8 7 1 0
CARBON 116 106 10 0
CENTRE 82 80 2 0
CHESTER 634 557 42 35
CLARION 35 31 2 2
CLEARFIELD 40 39 1 0
CLINTON 107 92 12 3
COLUMBIA 111 98 11 2
CRAWFORD 151 135 10 6
CUMBERLAND 470 453 17 0
DAUPHIN 667 605 60 2
DELAWARE 1,300 1,195 84 21
ELK 55 52 2 1
ERIE 523 469 46 8
FAYETTE 330 272 58 0
FOREST 3 3 0 0
FRANKLIN 387 313 44 30
FULTON 13 13 0 0
GREENE 26 24 2 0
HUNTINGDON 59 56 3 0
INDIANA 91 77 12 2
JEFFERSON 55 53 2 0
JUNIATA 33 33 0 0
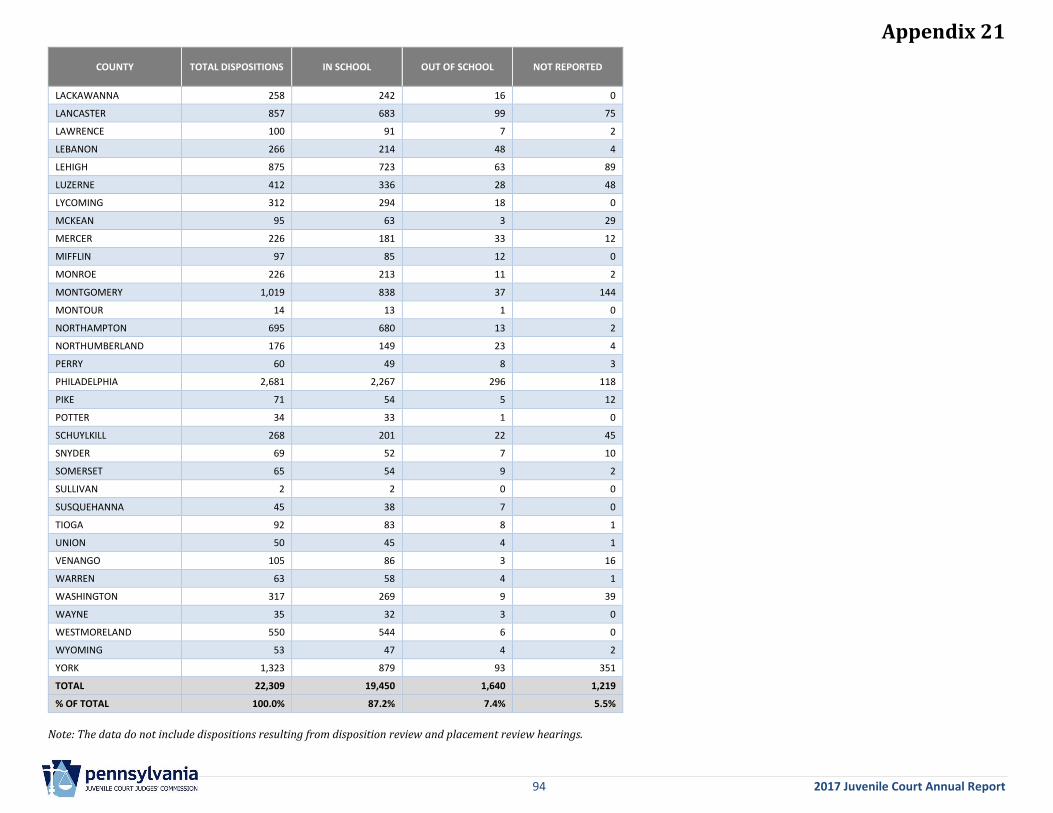
Appendix 21
94 2017 Juvenile Court Annual Report
COUNTY TOTAL DISPOSITIONS IN SCHOOL OUT OF SCHOOL NOT REPORTED
LACKAWANNA 258 242 16 0
LANCASTER 857 683 99 75
LAWRENCE 100 91 7 2
LEBANON 266 214 48 4
LEHIGH 875 723 63 89
LUZERNE 412 336 28 48
LYCOMING 312 294 18 0
MCKEAN 95 63 3 29
MERCER 226 181 33 12
MIFFLIN 97 85 12 0
MONROE 226 213 11 2
MONTGOMERY 1,019 838 37 144
MONTOUR 14 13 1 0
NORTHAMPTON 695 680 13 2
NORTHUMBERLAND 176 149 23 4
PERRY 60 49 8 3
PHILADELPHIA 2,681 2,267 296 118
PIKE 71 54 5 12
POTTER 34 33 1 0
SCHUYLKILL 268 201 22 45
SNYDER 69 52 7 10
SOMERSET 65 54 9 2
SULLIVAN 2 2 0 0
SUSQUEHANNA 45 38 7 0
TIOGA 92 83 8 1
UNION 50 45 4 1
VENANGO 105 86 3 16
WARREN 63 58 4 1
WASHINGTON 317 269 9 39
WAYNE 35 32 3 0
WESTMORELAND 550 544 6 0
WYOMING 53 47 4 2
YORK 1,323 879 93 351
TOTAL 22,309 19,450 1,640 1,219
% OF TOTAL 100.0% 87.2% 7.4% 5.5%
Note: The data do not include dispositions resulting from disposition review and placement review hearings.
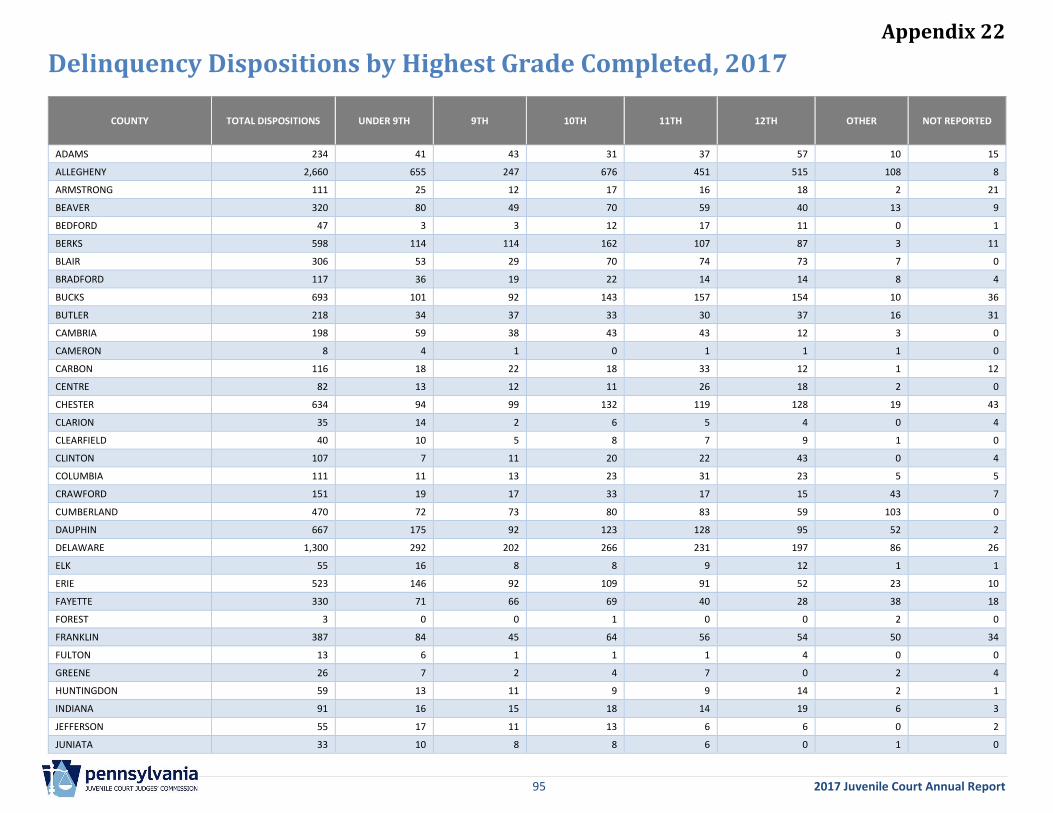
Appendix 22
95 2017 Juvenile Court Annual Report
Delinquency Dispositions by Highest Grade Completed, 2017
COUNTY TOTAL DISPOSITIONS UNDER 9TH 9TH 10TH 11TH 12TH OTHER NOT REPORTED
ADAMS 234 41 43 31 37 57 10 15
ALLEGHENY 2,660 655 247 676 451 515 108 8
ARMSTRONG 111 25 12 17 16 18 2 21
BEAVER 320 80 49 70 59 40 13 9
BEDFORD 47 3 3 12 17 11 0 1
BERKS 598 114 114 162 107 87 3 11
BLAIR 306 53 29 70 74 73 7 0
BRADFORD 117 36 19 22 14 14 8 4
BUCKS 693 101 92 143 157 154 10 36
BUTLER 218 34 37 33 30 37 16 31
CAMBRIA 198 59 38 43 43 12 3 0
CAMERON 8 4 1 0 1 1 1 0
CARBON 116 18 22 18 33 12 1 12
CENTRE 82 13 12 11 26 18 2 0
CHESTER 634 94 99 132 119 128 19 43
CLARION 35 14 2 6 5 4 0 4
CLEARFIELD 40 10 5 8 7 9 1 0
CLINTON 107 7 11 20 22 43 0 4
COLUMBIA 111 11 13 23 31 23 5 5
CRAWFORD 151 19 17 33 17 15 43 7
CUMBERLAND 470 72 73 80 83 59 103 0
DAUPHIN 667 175 92 123 128 95 52 2
DELAWARE 1,300 292 202 266 231 197 86 26
ELK 55 16 8 8 9 12 1 1
ERIE 523 146 92 109 91 52 23 10
FAYETTE 330 71 66 69 40 28 38 18
FOREST 3 0 0 1 0 0 2 0
FRANKLIN 387 84 45 64 56 54 50 34
FULTON 13 6 1 1 1 4 0 0
GREENE 26 7 2 4 7 0 2 4
HUNTINGDON 59 13 11 9 9 14 2 1
INDIANA 91 16 15 18 14 19 6 3
JEFFERSON 55 17 11 13 6 6 0 2
JUNIATA 33 10 8 8 6 0 1 0
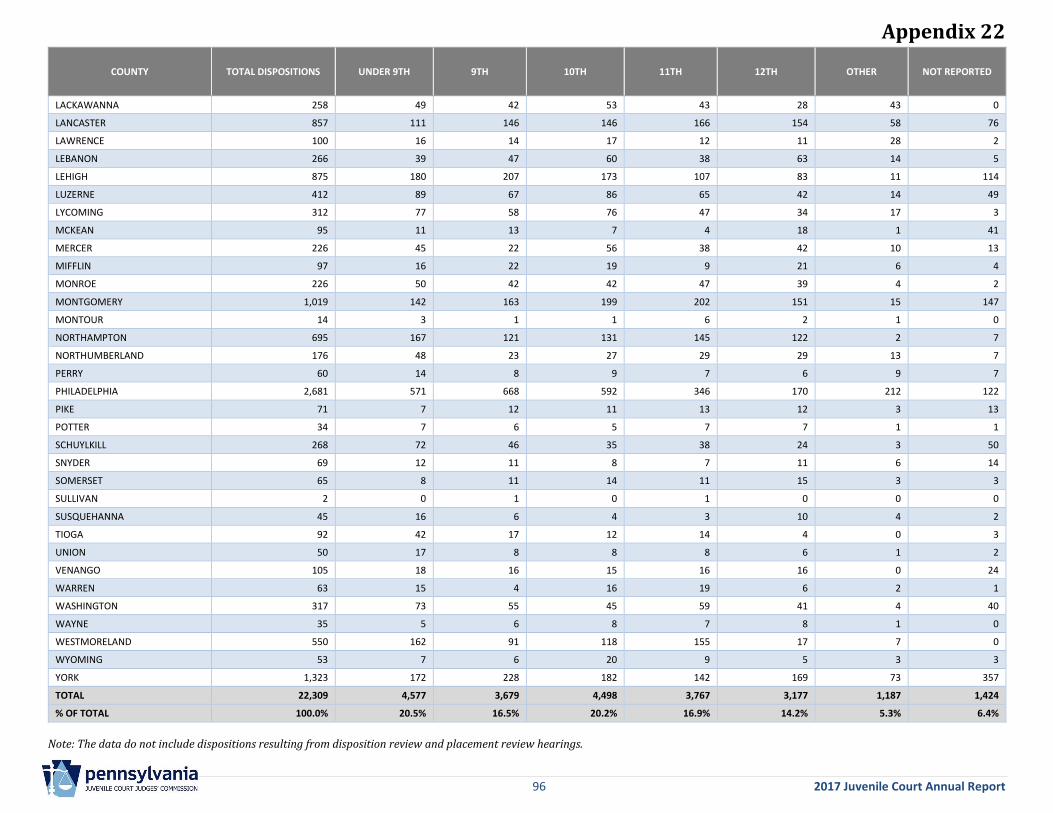
Appendix 22
96 2017 Juvenile Court Annual Report
COUNTY TOTAL DISPOSITIONS UNDER 9TH 9TH 10TH 11TH 12TH OTHER NOT REPORTED
LACKAWANNA 258 49 42 53 43 28 43 0
LANCASTER 857 111 146 146 166 154 58 76
LAWRENCE 100 16 14 17 12 11 28 2
LEBANON 266 39 47 60 38 63 14 5
LEHIGH 875 180 207 173 107 83 11 114
LUZERNE 412 89 67 86 65 42 14 49
LYCOMING 312 77 58 76 47 34 17 3
MCKEAN 95 11 13 7 4 18 1 41
MERCER 226 45 22 56 38 42 10 13
MIFFLIN 97 16 22 19 9 21 6 4
MONROE 226 50 42 42 47 39 4 2
MONTGOMERY 1,019 142 163 199 202 151 15 147
MONTOUR 14 3 1 1 6 2 1 0
NORTHAMPTON 695 167 121 131 145 122 2 7
NORTHUMBERLAND 176 48 23 27 29 29 13 7
PERRY 60 14 8 9 7 6 9 7
PHILADELPHIA 2,681 571 668 592 346 170 212 122
PIKE 71 7 12 11 13 12 3 13
POTTER 34 7 6 5 7 7 1 1
SCHUYLKILL 268 72 46 35 38 24 3 50
SNYDER 69 12 11 8 7 11 6 14
SOMERSET 65 8 11 14 11 15 3 3
SULLIVAN 2 0 1 0 1 0 0 0
SUSQUEHANNA 45 16 6 4 3 10 4 2
TIOGA 92 42 17 12 14 4 0 3
UNION 50 17 8 8 8 6 1 2
VENANGO 105 18 16 15 16 16 0 24
WARREN 63 15 4 16 19 6 2 1
WASHINGTON 317 73 55 45 59 41 4 40
WAYNE 35 5 6 8 7 8 1 0
WESTMORELAND 550 162 91 118 155 17 7 0
WYOMING 53 7 6 20 9 5 3 3
YORK 1,323 172 228 182 142 169 73 357
TOTAL 22,309 4,577 3,679 4,498 3,767 3,177 1,187 1,424
% OF TOTAL 100.0% 20.5% 16.5% 20.2% 16.9% 14.2% 5.3% 6.4%
Note: The data do not include dispositions resulting from disposition review and placement review hearings.
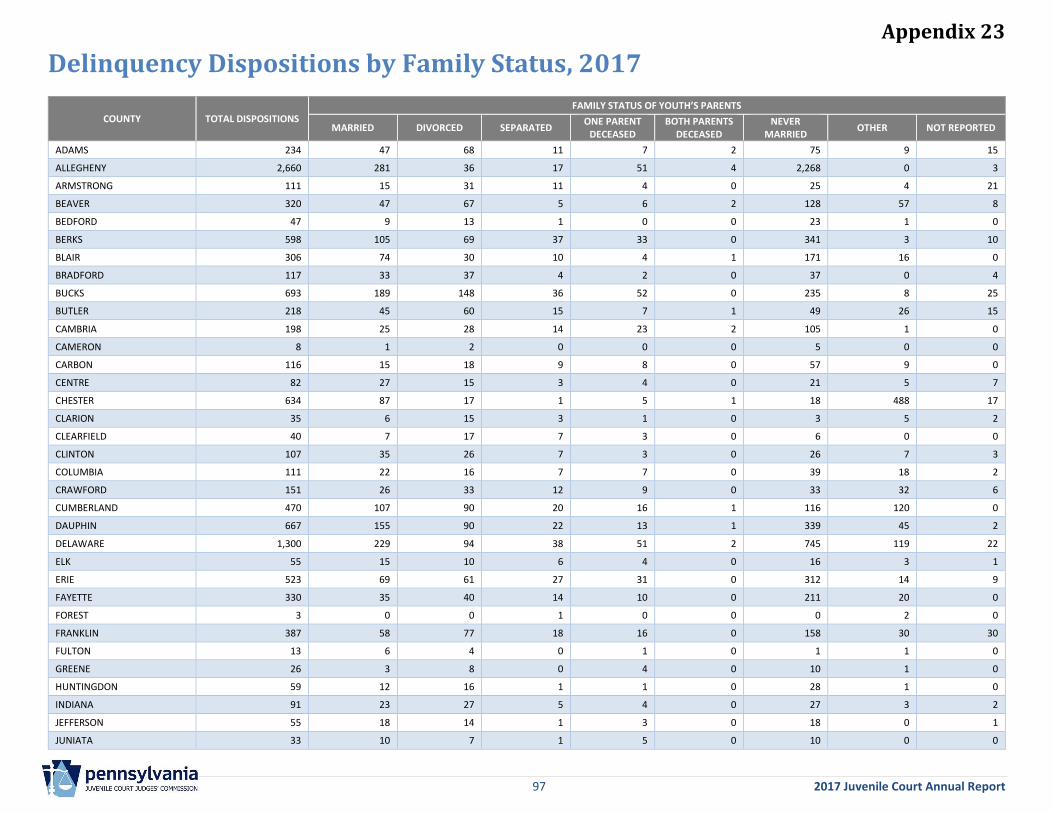
Appendix 23
97 2017 Juvenile Court Annual Report
Delinquency Dispositions by Family Status, 2017
COUNTY TOTAL DISPOSITIONS FAMILY STATUS OF YOUTH’S PARENTS
MARRIED DIVORCED SEPARATED ONE PARENT
DECEASED BOTH PARENTS
DECEASED NEVER
MARRIED OTHER NOT REPORTED
ADAMS 234 47 68 11 7 2 75 9 15
ALLEGHENY 2,660 281 36 17 51 4 2,268 0 3
ARMSTRONG 111 15 31 11 4 0 25 4 21
BEAVER 320 47 67 5 6 2 128 57 8
BEDFORD 47 9 13 1 0 0 23 1 0
BERKS 598 105 69 37 33 0 341 3 10
BLAIR 306 74 30 10 4 1 171 16 0
BRADFORD 117 33 37 4 2 0 37 0 4
BUCKS 693 189 148 36 52 0 235 8 25
BUTLER 218 45 60 15 7 1 49 26 15
CAMBRIA 198 25 28 14 23 2 105 1 0
CAMERON 8 1 2 0 0 0 5 0 0
CARBON 116 15 18 9 8 0 57 9 0
CENTRE 82 27 15 3 4 0 21 5 7
CHESTER 634 87 17 1 5 1 18 488 17
CLARION 35 6 15 3 1 0 3 5 2
CLEARFIELD 40 7 17 7 3 0 6 0 0
CLINTON 107 35 26 7 3 0 26 7 3
COLUMBIA 111 22 16 7 7 0 39 18 2
CRAWFORD 151 26 33 12 9 0 33 32 6
CUMBERLAND 470 107 90 20 16 1 116 120 0
DAUPHIN 667 155 90 22 13 1 339 45 2
DELAWARE 1,300 229 94 38 51 2 745 119 22
ELK 55 15 10 6 4 0 16 3 1
ERIE 523 69 61 27 31 0 312 14 9
FAYETTE 330 35 40 14 10 0 211 20 0
FOREST 3 0 0 1 0 0 0 2 0
FRANKLIN 387 58 77 18 16 0 158 30 30
FULTON 13 6 4 0 1 0 1 1 0
GREENE 26 3 8 0 4 0 10 1 0
HUNTINGDON 59 12 16 1 1 0 28 1 0
INDIANA 91 23 27 5 4 0 27 3 2
JEFFERSON 55 18 14 1 3 0 18 0 1
JUNIATA 33 10 7 1 5 0 10 0 0
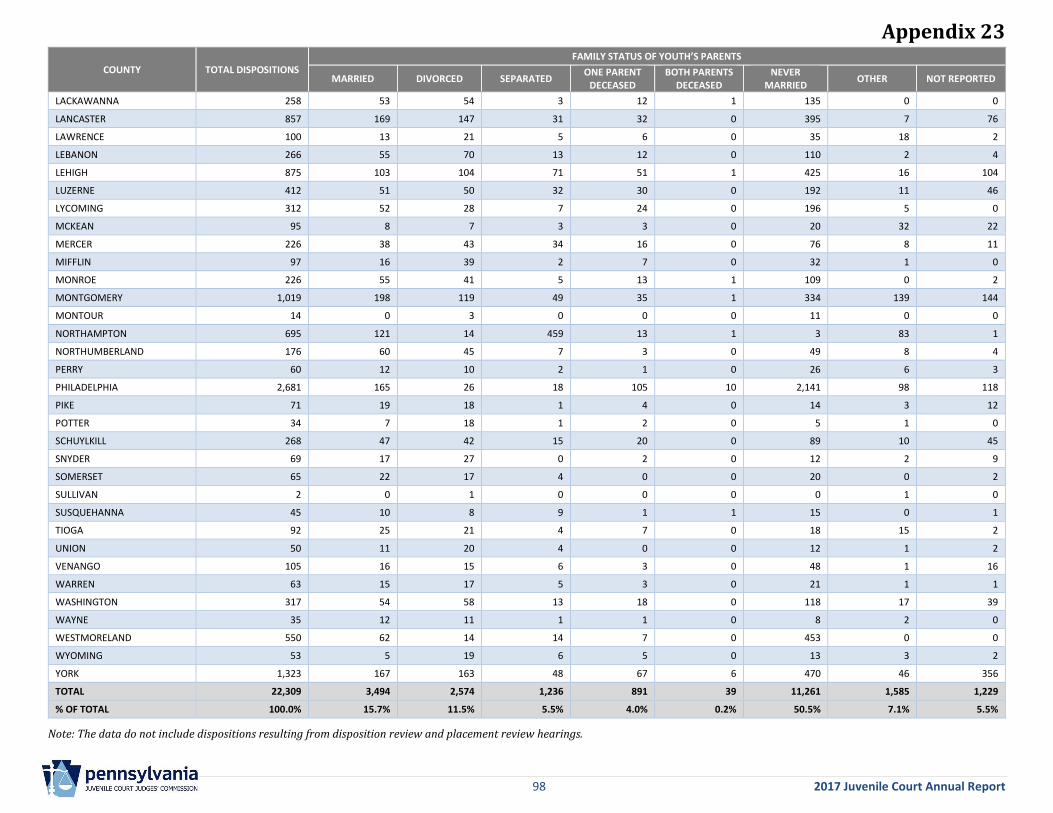
Appendix 23
98 2017 Juvenile Court Annual Report
COUNTY TOTAL DISPOSITIONS
FAMILY STATUS OF YOUTH’S PARENTS
MARRIED DIVORCED SEPARATED ONE PARENT
DECEASED BOTH PARENTS
DECEASED NEVER
MARRIED OTHER NOT REPORTED
LACKAWANNA 258 53 54 3 12 1 135 0 0
LANCASTER 857 169 147 31 32 0 395 7 76
LAWRENCE 100 13 21 5 6 0 35 18 2
LEBANON 266 55 70 13 12 0 110 2 4
LEHIGH 875 103 104 71 51 1 425 16 104
LUZERNE 412 51 50 32 30 0 192 11 46
LYCOMING 312 52 28 7 24 0 196 5 0
MCKEAN 95 8 7 3 3 0 20 32 22
MERCER 226 38 43 34 16 0 76 8 11
MIFFLIN 97 16 39 2 7 0 32 1 0
MONROE 226 55 41 5 13 1 109 0 2
MONTGOMERY 1,019 198 119 49 35 1 334 139 144
MONTOUR 14 0 3 0 0 0 11 0 0
NORTHAMPTON 695 121 14 459 13 1 3 83 1
NORTHUMBERLAND 176 60 45 7 3 0 49 8 4
PERRY 60 12 10 2 1 0 26 6 3
PHILADELPHIA 2,681 165 26 18 105 10 2,141 98 118
PIKE 71 19 18 1 4 0 14 3 12
POTTER 34 7 18 1 2 0 5 1 0
SCHUYLKILL 268 47 42 15 20 0 89 10 45
SNYDER 69 17 27 0 2 0 12 2 9
SOMERSET 65 22 17 4 0 0 20 0 2
SULLIVAN 2 0 1 0 0 0 0 1 0
SUSQUEHANNA 45 10 8 9 1 1 15 0 1
TIOGA 92 25 21 4 7 0 18 15 2
UNION 50 11 20 4 0 0 12 1 2
VENANGO 105 16 15 6 3 0 48 1 16
WARREN 63 15 17 5 3 0 21 1 1
WASHINGTON 317 54 58 13 18 0 118 17 39
WAYNE 35 12 11 1 1 0 8 2 0
WESTMORELAND 550 62 14 14 7 0 453 0 0
WYOMING 53 5 19 6 5 0 13 3 2
YORK 1,323 167 163 48 67 6 470 46 356
TOTAL 22,309 3,494 2,574 1,236 891 39 11,261 1,585 1,229
% OF TOTAL 100.0% 15.7% 11.5% 5.5% 4.0% 0.2% 50.5% 7.1% 5.5%
Note: The data do not include dispositions resulting from disposition review and placement review hearings.
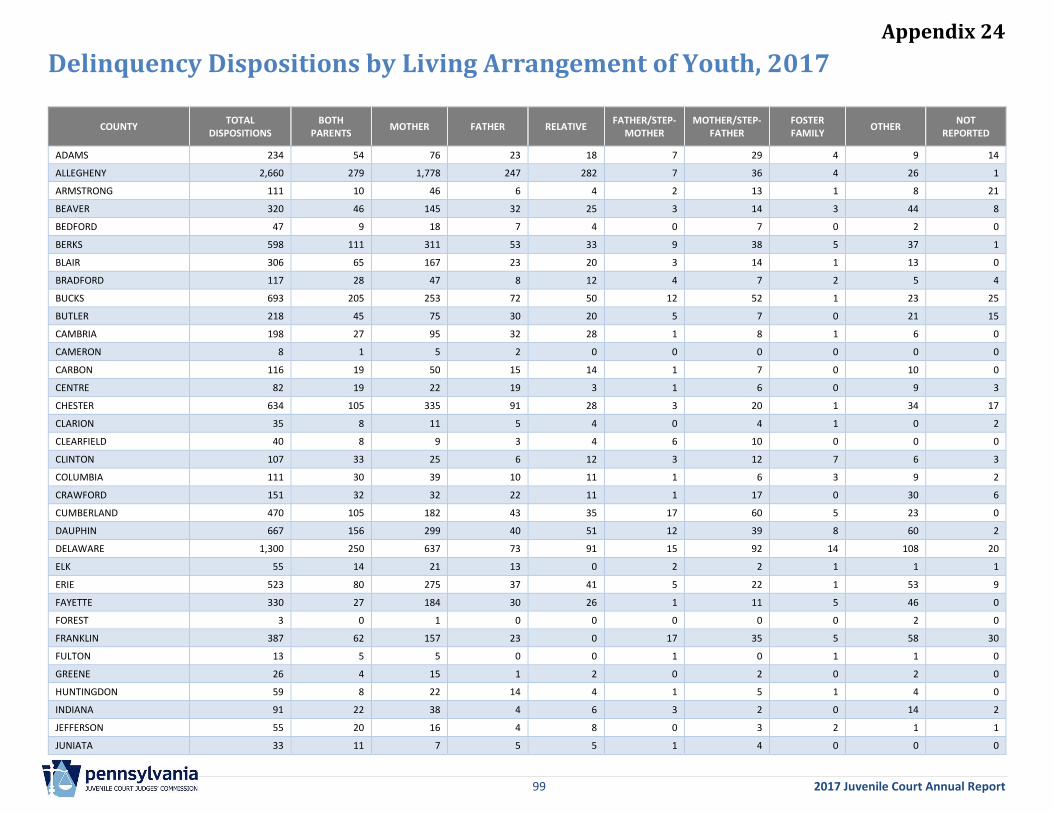
Appendix 24
99 2017 Juvenile Court Annual Report
Delinquency Dispositions by Living Arrangement of Youth, 2017
COUNTY TOTAL
DISPOSITIONS BOTH
PARENTS MOTHER FATHER RELATIVE
FATHER/STEP-MOTHER
MOTHER/STEP-FATHER
FOSTER FAMILY
OTHER NOT
REPORTED
ADAMS 234 54 76 23 18 7 29 4 9 14
ALLEGHENY 2,660 279 1,778 247 282 7 36 4 26 1
ARMSTRONG 111 10 46 6 4 2 13 1 8 21
BEAVER 320 46 145 32 25 3 14 3 44 8
BEDFORD 47 9 18 7 4 0 7 0 2 0
BERKS 598 111 311 53 33 9 38 5 37 1
BLAIR 306 65 167 23 20 3 14 1 13 0
BRADFORD 117 28 47 8 12 4 7 2 5 4
BUCKS 693 205 253 72 50 12 52 1 23 25
BUTLER 218 45 75 30 20 5 7 0 21 15
CAMBRIA 198 27 95 32 28 1 8 1 6 0
CAMERON 8 1 5 2 0 0 0 0 0 0
CARBON 116 19 50 15 14 1 7 0 10 0
CENTRE 82 19 22 19 3 1 6 0 9 3
CHESTER 634 105 335 91 28 3 20 1 34 17
CLARION 35 8 11 5 4 0 4 1 0 2
CLEARFIELD 40 8 9 3 4 6 10 0 0 0
CLINTON 107 33 25 6 12 3 12 7 6 3
COLUMBIA 111 30 39 10 11 1 6 3 9 2
CRAWFORD 151 32 32 22 11 1 17 0 30 6
CUMBERLAND 470 105 182 43 35 17 60 5 23 0
DAUPHIN 667 156 299 40 51 12 39 8 60 2
DELAWARE 1,300 250 637 73 91 15 92 14 108 20
ELK 55 14 21 13 0 2 2 1 1 1
ERIE 523 80 275 37 41 5 22 1 53 9
FAYETTE 330 27 184 30 26 1 11 5 46 0
FOREST 3 0 1 0 0 0 0 0 2 0
FRANKLIN 387 62 157 23 0 17 35 5 58 30
FULTON 13 5 5 0 0 1 0 1 1 0
GREENE 26 4 15 1 2 0 2 0 2 0
HUNTINGDON 59 8 22 14 4 1 5 1 4 0
INDIANA 91 22 38 4 6 3 2 0 14 2
JEFFERSON 55 20 16 4 8 0 3 2 1 1
JUNIATA 33 11 7 5 5 1 4 0 0 0
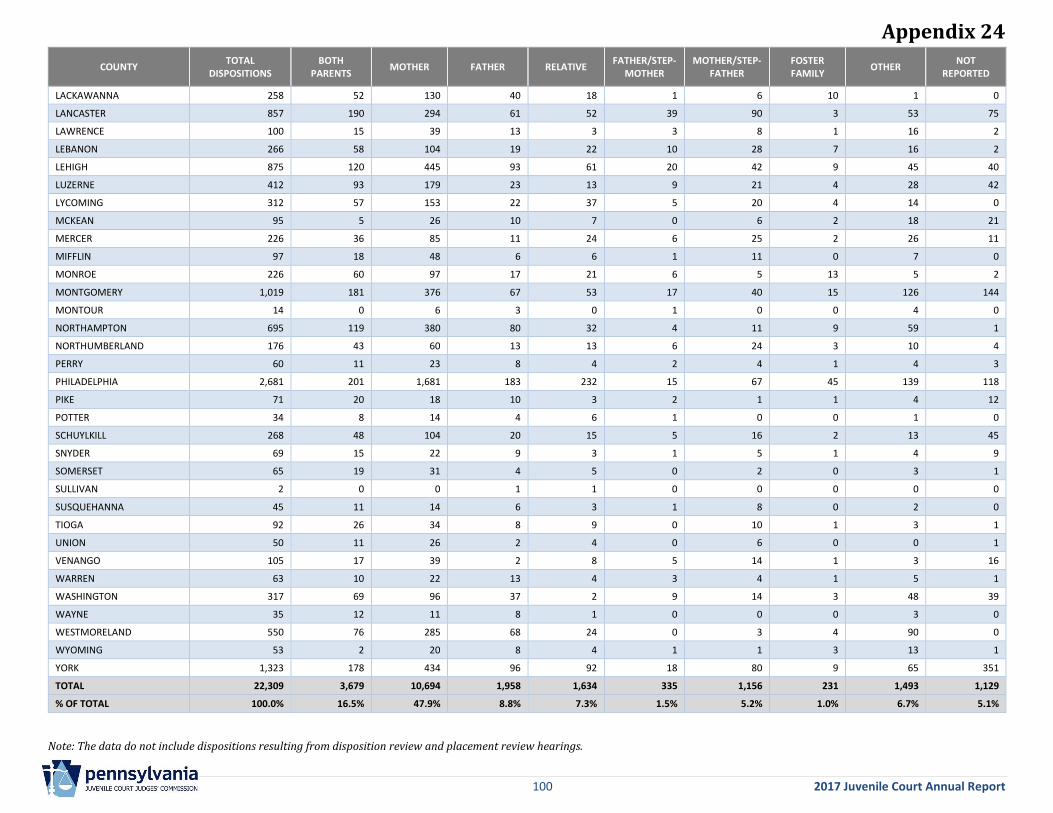
Appendix 24
100 2017 Juvenile Court Annual Report
COUNTY TOTAL
DISPOSITIONS BOTH
PARENTS MOTHER FATHER RELATIVE
FATHER/STEP-MOTHER
MOTHER/STEP-FATHER
FOSTER FAMILY
OTHER NOT
REPORTED
LACKAWANNA 258 52 130 40 18 1 6 10 1 0
LANCASTER 857 190 294 61 52 39 90 3 53 75
LAWRENCE 100 15 39 13 3 3 8 1 16 2
LEBANON 266 58 104 19 22 10 28 7 16 2
LEHIGH 875 120 445 93 61 20 42 9 45 40
LUZERNE 412 93 179 23 13 9 21 4 28 42
LYCOMING 312 57 153 22 37 5 20 4 14 0
MCKEAN 95 5 26 10 7 0 6 2 18 21
MERCER 226 36 85 11 24 6 25 2 26 11
MIFFLIN 97 18 48 6 6 1 11 0 7 0
MONROE 226 60 97 17 21 6 5 13 5 2
MONTGOMERY 1,019 181 376 67 53 17 40 15 126 144
MONTOUR 14 0 6 3 0 1 0 0 4 0
NORTHAMPTON 695 119 380 80 32 4 11 9 59 1
NORTHUMBERLAND 176 43 60 13 13 6 24 3 10 4
PERRY 60 11 23 8 4 2 4 1 4 3
PHILADELPHIA 2,681 201 1,681 183 232 15 67 45 139 118
PIKE 71 20 18 10 3 2 1 1 4 12
POTTER 34 8 14 4 6 1 0 0 1 0
SCHUYLKILL 268 48 104 20 15 5 16 2 13 45
SNYDER 69 15 22 9 3 1 5 1 4 9
SOMERSET 65 19 31 4 5 0 2 0 3 1
SULLIVAN 2 0 0 1 1 0 0 0 0 0
SUSQUEHANNA 45 11 14 6 3 1 8 0 2 0
TIOGA 92 26 34 8 9 0 10 1 3 1
UNION 50 11 26 2 4 0 6 0 0 1
VENANGO 105 17 39 2 8 5 14 1 3 16
WARREN 63 10 22 13 4 3 4 1 5 1
WASHINGTON 317 69 96 37 2 9 14 3 48 39
WAYNE 35 12 11 8 1 0 0 0 3 0
WESTMORELAND 550 76 285 68 24 0 3 4 90 0
WYOMING 53 2 20 8 4 1 1 3 13 1
YORK 1,323 178 434 96 92 18 80 9 65 351
TOTAL 22,309 3,679 10,694 1,958 1,634 335 1,156 231 1,493 1,129
% OF TOTAL 100.0% 16.5% 47.9% 8.8% 7.3% 1.5% 5.2% 1.0% 6.7% 5.1%
Note: The data do not include dispositions resulting from disposition review and placement review hearings.
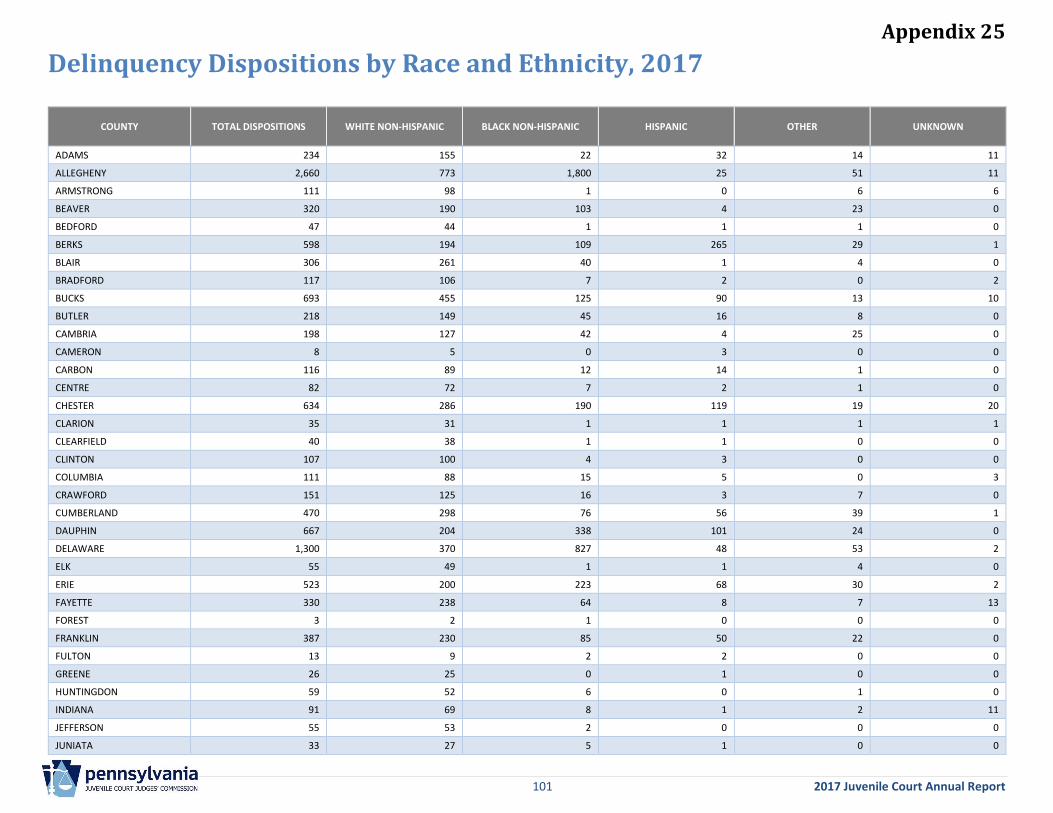
Appendix 25
101 2017 Juvenile Court Annual Report
Delinquency Dispositions by Race and Ethnicity, 2017
COUNTY TOTAL DISPOSITIONS WHITE NON-HISPANIC BLACK NON-HISPANIC HISPANIC OTHER UNKNOWN
ADAMS 234 155 22 32 14 11
ALLEGHENY 2,660 773 1,800 25 51 11
ARMSTRONG 111 98 1 0 6 6
BEAVER 320 190 103 4 23 0
BEDFORD 47 44 1 1 1 0
BERKS 598 194 109 265 29 1
BLAIR 306 261 40 1 4 0
BRADFORD 117 106 7 2 0 2
BUCKS 693 455 125 90 13 10
BUTLER 218 149 45 16 8 0
CAMBRIA 198 127 42 4 25 0
CAMERON 8 5 0 3 0 0
CARBON 116 89 12 14 1 0
CENTRE 82 72 7 2 1 0
CHESTER 634 286 190 119 19 20
CLARION 35 31 1 1 1 1
CLEARFIELD 40 38 1 1 0 0
CLINTON 107 100 4 3 0 0
COLUMBIA 111 88 15 5 0 3
CRAWFORD 151 125 16 3 7 0
CUMBERLAND 470 298 76 56 39 1
DAUPHIN 667 204 338 101 24 0
DELAWARE 1,300 370 827 48 53 2
ELK 55 49 1 1 4 0
ERIE 523 200 223 68 30 2
FAYETTE 330 238 64 8 7 13
FOREST 3 2 1 0 0 0
FRANKLIN 387 230 85 50 22 0
FULTON 13 9 2 2 0 0
GREENE 26 25 0 1 0 0
HUNTINGDON 59 52 6 0 1 0
INDIANA 91 69 8 1 2 11
JEFFERSON 55 53 2 0 0 0
JUNIATA 33 27 5 1 0 0
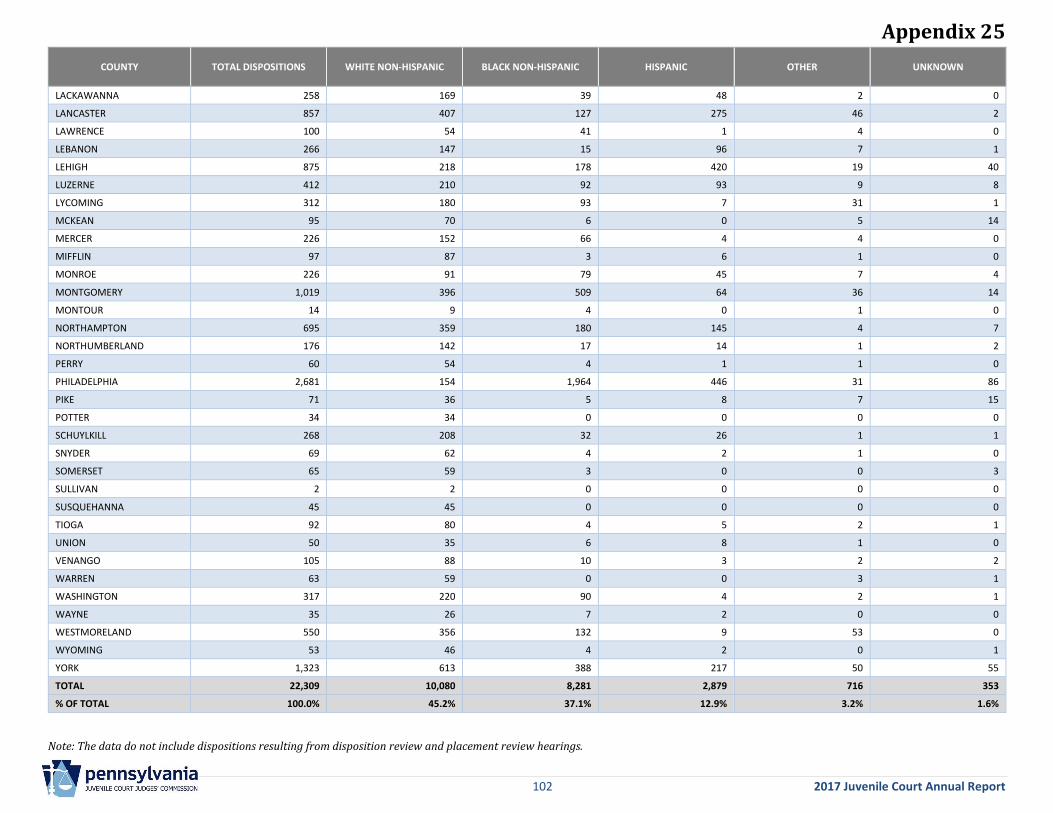
Appendix 25
102 2017 Juvenile Court Annual Report
COUNTY TOTAL DISPOSITIONS WHITE NON-HISPANIC BLACK NON-HISPANIC HISPANIC OTHER UNKNOWN
LACKAWANNA 258 169 39 48 2 0
LANCASTER 857 407 127 275 46 2
LAWRENCE 100 54 41 1 4 0
LEBANON 266 147 15 96 7 1
LEHIGH 875 218 178 420 19 40
LUZERNE 412 210 92 93 9 8
LYCOMING 312 180 93 7 31 1
MCKEAN 95 70 6 0 5 14
MERCER 226 152 66 4 4 0
MIFFLIN 97 87 3 6 1 0
MONROE 226 91 79 45 7 4
MONTGOMERY 1,019 396 509 64 36 14
MONTOUR 14 9 4 0 1 0
NORTHAMPTON 695 359 180 145 4 7
NORTHUMBERLAND 176 142 17 14 1 2
PERRY 60 54 4 1 1 0
PHILADELPHIA 2,681 154 1,964 446 31 86
PIKE 71 36 5 8 7 15
POTTER 34 34 0 0 0 0
SCHUYLKILL 268 208 32 26 1 1
SNYDER 69 62 4 2 1 0
SOMERSET 65 59 3 0 0 3
SULLIVAN 2 2 0 0 0 0
SUSQUEHANNA 45 45 0 0 0 0
TIOGA 92 80 4 5 2 1
UNION 50 35 6 8 1 0
VENANGO 105 88 10 3 2 2
WARREN 63 59 0 0 3 1
WASHINGTON 317 220 90 4 2 1
WAYNE 35 26 7 2 0 0
WESTMORELAND 550 356 132 9 53 0
WYOMING 53 46 4 2 0 1
YORK 1,323 613 388 217 50 55
TOTAL 22,309 10,080 8,281 2,879 716 353
% OF TOTAL 100.0% 45.2% 37.1% 12.9% 3.2% 1.6%
Note: The data do not include dispositions resulting from disposition review and placement review hearings.
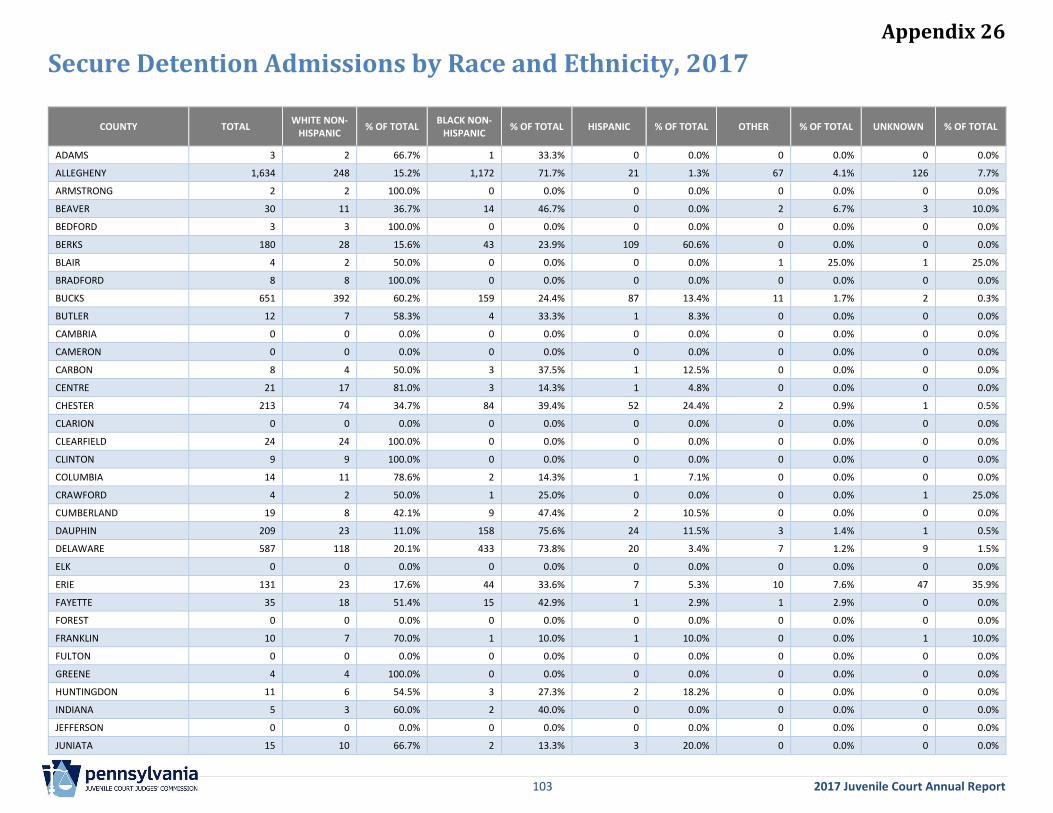
Appendix 26
103 2017 Juvenile Court Annual Report
Secure Detention Admissions by Race and Ethnicity, 2017
COUNTY TOTAL WHITE NON-
HISPANIC % OF TOTAL
BLACK NON-HISPANIC
% OF TOTAL HISPANIC % OF TOTAL OTHER % OF TOTAL UNKNOWN % OF TOTAL
ADAMS 3 2 66.7% 1 33.3% 0 0.0% 0 0.0% 0 0.0%
ALLEGHENY 1,634 248 15.2% 1,172 71.7% 21 1.3% 67 4.1% 126 7.7%
ARMSTRONG 2 2 100.0% 0 0.0% 0 0.0% 0 0.0% 0 0.0%
BEAVER 30 11 36.7% 14 46.7% 0 0.0% 2 6.7% 3 10.0%
BEDFORD 3 3 100.0% 0 0.0% 0 0.0% 0 0.0% 0 0.0%
BERKS 180 28 15.6% 43 23.9% 109 60.6% 0 0.0% 0 0.0%
BLAIR 4 2 50.0% 0 0.0% 0 0.0% 1 25.0% 1 25.0%
BRADFORD 8 8 100.0% 0 0.0% 0 0.0% 0 0.0% 0 0.0%
BUCKS 651 392 60.2% 159 24.4% 87 13.4% 11 1.7% 2 0.3%
BUTLER 12 7 58.3% 4 33.3% 1 8.3% 0 0.0% 0 0.0%
CAMBRIA 0 0 0.0% 0 0.0% 0 0.0% 0 0.0% 0 0.0%
CAMERON 0 0 0.0% 0 0.0% 0 0.0% 0 0.0% 0 0.0%
CARBON 8 4 50.0% 3 37.5% 1 12.5% 0 0.0% 0 0.0%
CENTRE 21 17 81.0% 3 14.3% 1 4.8% 0 0.0% 0 0.0%
CHESTER 213 74 34.7% 84 39.4% 52 24.4% 2 0.9% 1 0.5%
CLARION 0 0 0.0% 0 0.0% 0 0.0% 0 0.0% 0 0.0%
CLEARFIELD 24 24 100.0% 0 0.0% 0 0.0% 0 0.0% 0 0.0%
CLINTON 9 9 100.0% 0 0.0% 0 0.0% 0 0.0% 0 0.0%
COLUMBIA 14 11 78.6% 2 14.3% 1 7.1% 0 0.0% 0 0.0%
CRAWFORD 4 2 50.0% 1 25.0% 0 0.0% 0 0.0% 1 25.0%
CUMBERLAND 19 8 42.1% 9 47.4% 2 10.5% 0 0.0% 0 0.0%
DAUPHIN 209 23 11.0% 158 75.6% 24 11.5% 3 1.4% 1 0.5%
DELAWARE 587 118 20.1% 433 73.8% 20 3.4% 7 1.2% 9 1.5%
ELK 0 0 0.0% 0 0.0% 0 0.0% 0 0.0% 0 0.0%
ERIE 131 23 17.6% 44 33.6% 7 5.3% 10 7.6% 47 35.9%
FAYETTE 35 18 51.4% 15 42.9% 1 2.9% 1 2.9% 0 0.0%
FOREST 0 0 0.0% 0 0.0% 0 0.0% 0 0.0% 0 0.0%
FRANKLIN 10 7 70.0% 1 10.0% 1 10.0% 0 0.0% 1 10.0%
FULTON 0 0 0.0% 0 0.0% 0 0.0% 0 0.0% 0 0.0%
GREENE 4 4 100.0% 0 0.0% 0 0.0% 0 0.0% 0 0.0%
HUNTINGDON 11 6 54.5% 3 27.3% 2 18.2% 0 0.0% 0 0.0%
INDIANA 5 3 60.0% 2 40.0% 0 0.0% 0 0.0% 0 0.0%
JEFFERSON 0 0 0.0% 0 0.0% 0 0.0% 0 0.0% 0 0.0%
JUNIATA 15 10 66.7% 2 13.3% 3 20.0% 0 0.0% 0 0.0%
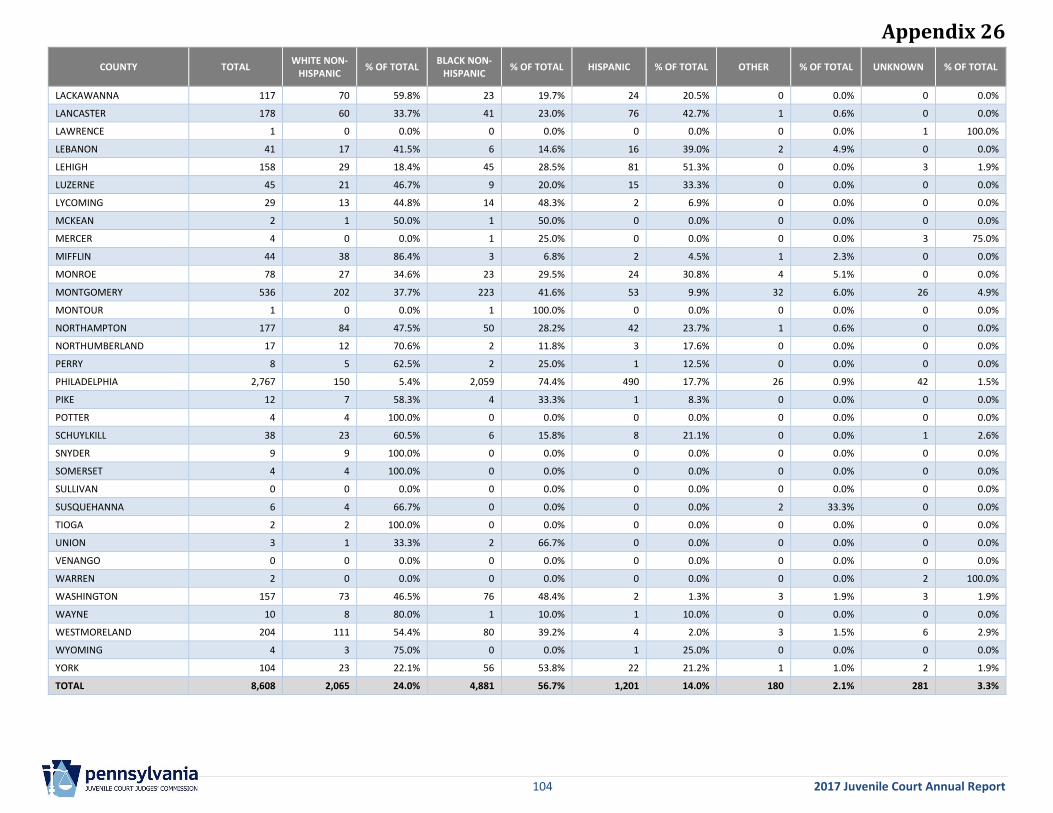
Appendix 26
104 2017 Juvenile Court Annual Report
COUNTY TOTAL WHITE NON-
HISPANIC % OF TOTAL
BLACK NON-HISPANIC
% OF TOTAL HISPANIC % OF TOTAL OTHER % OF TOTAL UNKNOWN % OF TOTAL
LACKAWANNA 117 70 59.8% 23 19.7% 24 20.5% 0 0.0% 0 0.0%
LANCASTER 178 60 33.7% 41 23.0% 76 42.7% 1 0.6% 0 0.0%
LAWRENCE 1 0 0.0% 0 0.0% 0 0.0% 0 0.0% 1 100.0%
LEBANON 41 17 41.5% 6 14.6% 16 39.0% 2 4.9% 0 0.0%
LEHIGH 158 29 18.4% 45 28.5% 81 51.3% 0 0.0% 3 1.9%
LUZERNE 45 21 46.7% 9 20.0% 15 33.3% 0 0.0% 0 0.0%
LYCOMING 29 13 44.8% 14 48.3% 2 6.9% 0 0.0% 0 0.0%
MCKEAN 2 1 50.0% 1 50.0% 0 0.0% 0 0.0% 0 0.0%
MERCER 4 0 0.0% 1 25.0% 0 0.0% 0 0.0% 3 75.0%
MIFFLIN 44 38 86.4% 3 6.8% 2 4.5% 1 2.3% 0 0.0%
MONROE 78 27 34.6% 23 29.5% 24 30.8% 4 5.1% 0 0.0%
MONTGOMERY 536 202 37.7% 223 41.6% 53 9.9% 32 6.0% 26 4.9%
MONTOUR 1 0 0.0% 1 100.0% 0 0.0% 0 0.0% 0 0.0%
NORTHAMPTON 177 84 47.5% 50 28.2% 42 23.7% 1 0.6% 0 0.0%
NORTHUMBERLAND 17 12 70.6% 2 11.8% 3 17.6% 0 0.0% 0 0.0%
PERRY 8 5 62.5% 2 25.0% 1 12.5% 0 0.0% 0 0.0%
PHILADELPHIA 2,767 150 5.4% 2,059 74.4% 490 17.7% 26 0.9% 42 1.5%
PIKE 12 7 58.3% 4 33.3% 1 8.3% 0 0.0% 0 0.0%
POTTER 4 4 100.0% 0 0.0% 0 0.0% 0 0.0% 0 0.0%
SCHUYLKILL 38 23 60.5% 6 15.8% 8 21.1% 0 0.0% 1 2.6%
SNYDER 9 9 100.0% 0 0.0% 0 0.0% 0 0.0% 0 0.0%
SOMERSET 4 4 100.0% 0 0.0% 0 0.0% 0 0.0% 0 0.0%
SULLIVAN 0 0 0.0% 0 0.0% 0 0.0% 0 0.0% 0 0.0%
SUSQUEHANNA 6 4 66.7% 0 0.0% 0 0.0% 2 33.3% 0 0.0%
TIOGA 2 2 100.0% 0 0.0% 0 0.0% 0 0.0% 0 0.0%
UNION 3 1 33.3% 2 66.7% 0 0.0% 0 0.0% 0 0.0%
VENANGO 0 0 0.0% 0 0.0% 0 0.0% 0 0.0% 0 0.0%
WARREN 2 0 0.0% 0 0.0% 0 0.0% 0 0.0% 2 100.0%
WASHINGTON 157 73 46.5% 76 48.4% 2 1.3% 3 1.9% 3 1.9%
WAYNE 10 8 80.0% 1 10.0% 1 10.0% 0 0.0% 0 0.0%
WESTMORELAND 204 111 54.4% 80 39.2% 4 2.0% 3 1.5% 6 2.9%
WYOMING 4 3 75.0% 0 0.0% 1 25.0% 0 0.0% 0 0.0%
YORK 104 23 22.1% 56 53.8% 22 21.2% 1 1.0% 2 1.9%
TOTAL 8,608 2,065 24.0% 4,881 56.7% 1,201 14.0% 180 2.1% 281 3.3%
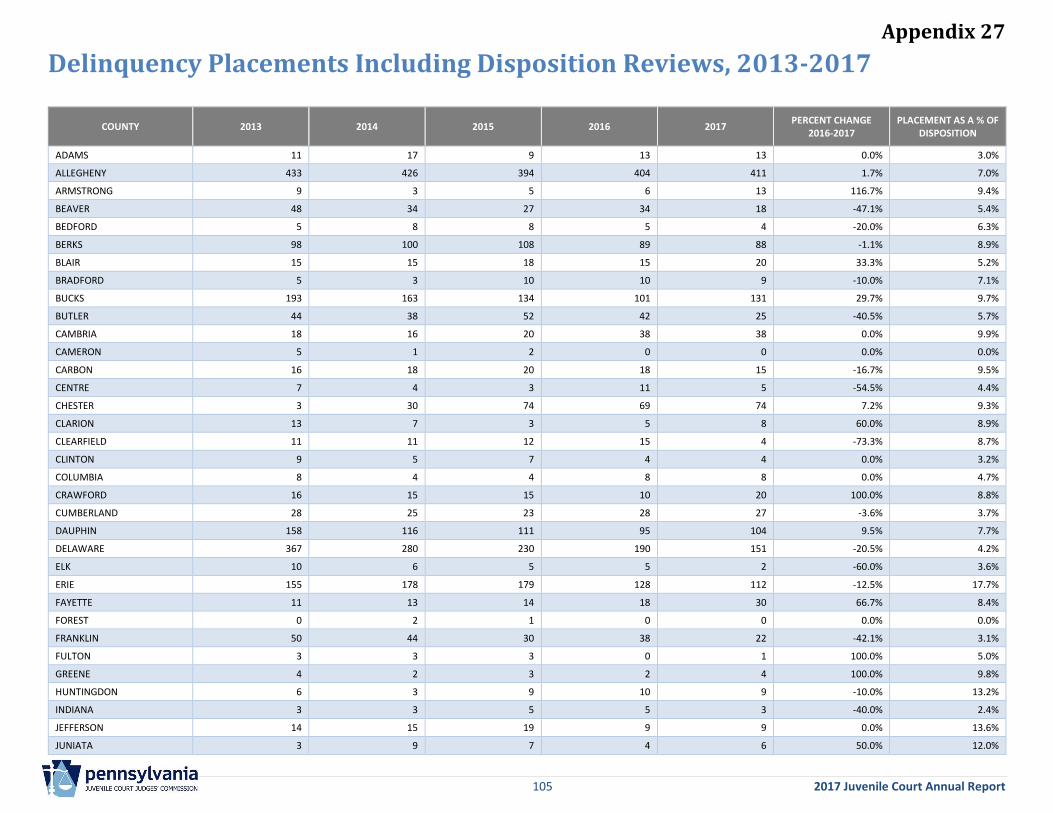
Appendix 27
105 2017 Juvenile Court Annual Report
Delinquency Placements Including Disposition Reviews, 2013-2017
COUNTY 2013 2014 2015 2016 2017 PERCENT CHANGE
2016-2017 PLACEMENT AS A % OF
DISPOSITION
ADAMS 11 17 9 13 13 0.0% 3.0%
ALLEGHENY 433 426 394 404 411 1.7% 7.0%
ARMSTRONG 9 3 5 6 13 116.7% 9.4%
BEAVER 48 34 27 34 18 -47.1% 5.4%
BEDFORD 5 8 8 5 4 -20.0% 6.3%
BERKS 98 100 108 89 88 -1.1% 8.9%
BLAIR 15 15 18 15 20 33.3% 5.2%
BRADFORD 5 3 10 10 9 -10.0% 7.1%
BUCKS 193 163 134 101 131 29.7% 9.7%
BUTLER 44 38 52 42 25 -40.5% 5.7%
CAMBRIA 18 16 20 38 38 0.0% 9.9%
CAMERON 5 1 2 0 0 0.0% 0.0%
CARBON 16 18 20 18 15 -16.7% 9.5%
CENTRE 7 4 3 11 5 -54.5% 4.4%
CHESTER 3 30 74 69 74 7.2% 9.3%
CLARION 13 7 3 5 8 60.0% 8.9%
CLEARFIELD 11 11 12 15 4 -73.3% 8.7%
CLINTON 9 5 7 4 4 0.0% 3.2%
COLUMBIA 8 4 4 8 8 0.0% 4.7%
CRAWFORD 16 15 15 10 20 100.0% 8.8%
CUMBERLAND 28 25 23 28 27 -3.6% 3.7%
DAUPHIN 158 116 111 95 104 9.5% 7.7%
DELAWARE 367 280 230 190 151 -20.5% 4.2%
ELK 10 6 5 5 2 -60.0% 3.6%
ERIE 155 178 179 128 112 -12.5% 17.7%
FAYETTE 11 13 14 18 30 66.7% 8.4%
FOREST 0 2 1 0 0 0.0% 0.0%
FRANKLIN 50 44 30 38 22 -42.1% 3.1%
FULTON 3 3 3 0 1 100.0% 5.0%
GREENE 4 2 3 2 4 100.0% 9.8%
HUNTINGDON 6 3 9 10 9 -10.0% 13.2%
INDIANA 3 3 5 5 3 -40.0% 2.4%
JEFFERSON 14 15 19 9 9 0.0% 13.6%
JUNIATA 3 9 7 4 6 50.0% 12.0%
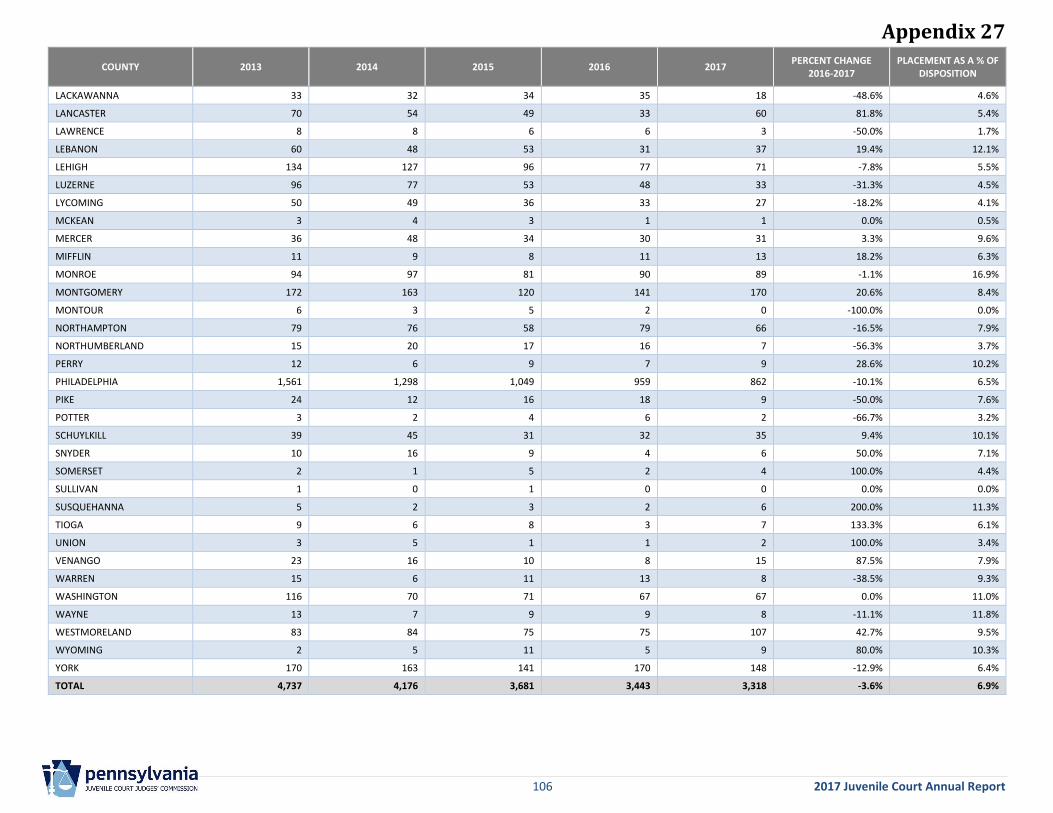
Appendix 27
106 2017 Juvenile Court Annual Report
COUNTY 2013 2014 2015 2016 2017 PERCENT CHANGE
2016-2017 PLACEMENT AS A % OF
DISPOSITION
LACKAWANNA 33 32 34 35 18 -48.6% 4.6%
LANCASTER 70 54 49 33 60 81.8% 5.4%
LAWRENCE 8 8 6 6 3 -50.0% 1.7%
LEBANON 60 48 53 31 37 19.4% 12.1%
LEHIGH 134 127 96 77 71 -7.8% 5.5%
LUZERNE 96 77 53 48 33 -31.3% 4.5%
LYCOMING 50 49 36 33 27 -18.2% 4.1%
MCKEAN 3 4 3 1 1 0.0% 0.5%
MERCER 36 48 34 30 31 3.3% 9.6%
MIFFLIN 11 9 8 11 13 18.2% 6.3%
MONROE 94 97 81 90 89 -1.1% 16.9%
MONTGOMERY 172 163 120 141 170 20.6% 8.4%
MONTOUR 6 3 5 2 0 -100.0% 0.0%
NORTHAMPTON 79 76 58 79 66 -16.5% 7.9%
NORTHUMBERLAND 15 20 17 16 7 -56.3% 3.7%
PERRY 12 6 9 7 9 28.6% 10.2%
PHILADELPHIA 1,561 1,298 1,049 959 862 -10.1% 6.5%
PIKE 24 12 16 18 9 -50.0% 7.6%
POTTER 3 2 4 6 2 -66.7% 3.2%
SCHUYLKILL 39 45 31 32 35 9.4% 10.1%
SNYDER 10 16 9 4 6 50.0% 7.1%
SOMERSET 2 1 5 2 4 100.0% 4.4%
SULLIVAN 1 0 1 0 0 0.0% 0.0%
SUSQUEHANNA 5 2 3 2 6 200.0% 11.3%
TIOGA 9 6 8 3 7 133.3% 6.1%
UNION 3 5 1 1 2 100.0% 3.4%
VENANGO 23 16 10 8 15 87.5% 7.9%
WARREN 15 6 11 13 8 -38.5% 9.3%
WASHINGTON 116 70 71 67 67 0.0% 11.0%
WAYNE 13 7 9 9 8 -11.1% 11.8%
WESTMORELAND 83 84 75 75 107 42.7% 9.5%
WYOMING 2 5 11 5 9 80.0% 10.3%
YORK 170 163 141 170 148 -12.9% 6.4%
TOTAL 4,737 4,176 3,681 3,443 3,318 -3.6% 6.9%
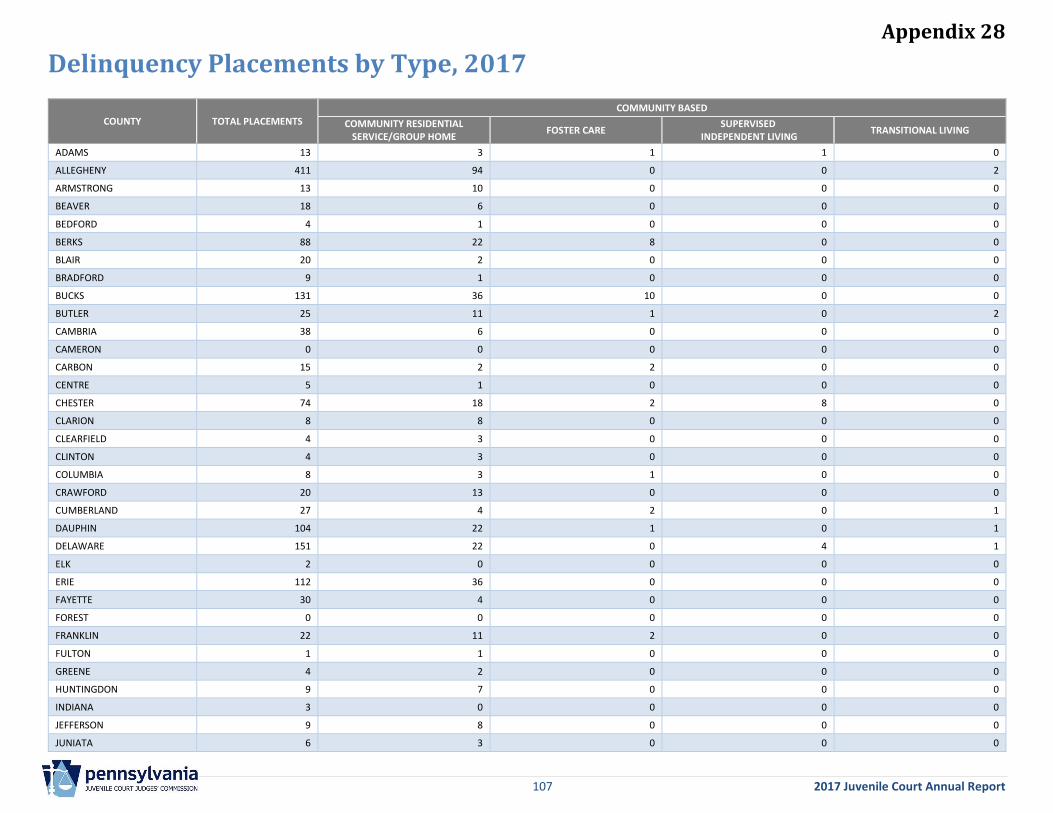
Appendix 28
107 2017 Juvenile Court Annual Report
Delinquency Placements by Type, 2017
COUNTY TOTAL PLACEMENTS
COMMUNITY BASED
COMMUNITY RESIDENTIAL SERVICE/GROUP HOME
FOSTER CARE SUPERVISED
INDEPENDENT LIVING TRANSITIONAL LIVING
ADAMS 13 3 1 1 0
ALLEGHENY 411 94 0 0 2
ARMSTRONG 13 10 0 0 0
BEAVER 18 6 0 0 0
BEDFORD 4 1 0 0 0
BERKS 88 22 8 0 0
BLAIR 20 2 0 0 0
BRADFORD 9 1 0 0 0
BUCKS 131 36 10 0 0
BUTLER 25 11 1 0 2
CAMBRIA 38 6 0 0 0
CAMERON 0 0 0 0 0
CARBON 15 2 2 0 0
CENTRE 5 1 0 0 0
CHESTER 74 18 2 8 0
CLARION 8 8 0 0 0
CLEARFIELD 4 3 0 0 0
CLINTON 4 3 0 0 0
COLUMBIA 8 3 1 0 0
CRAWFORD 20 13 0 0 0
CUMBERLAND 27 4 2 0 1
DAUPHIN 104 22 1 0 1
DELAWARE 151 22 0 4 1
ELK 2 0 0 0 0
ERIE 112 36 0 0 0
FAYETTE 30 4 0 0 0
FOREST 0 0 0 0 0
FRANKLIN 22 11 2 0 0
FULTON 1 1 0 0 0
GREENE 4 2 0 0 0
HUNTINGDON 9 7 0 0 0
INDIANA 3 0 0 0 0
JEFFERSON 9 8 0 0 0
JUNIATA 6 3 0 0 0

Appendix 28
108 2017 Juvenile Court Annual Report
COUNTY TOTAL PLACEMENTS
COMMUNITY BASED
COMMUNITY RESIDENTIAL SERVICE/GROUP HOME
FOSTER CARE SUPERVISED
INDEPENDENT LIVING TRANSITIONAL LIVING
LACKAWANNA 18 9 0 0 0
LANCASTER 60 24 0 0 0
LAWRENCE 3 2 0 0 0
LEBANON 37 5 1 0 0
LEHIGH 71 8 1 0 0
LUZERNE 33 11 1 2 0
LYCOMING 27 2 0 1 0
MCKEAN 1 1 0 0 0
MERCER 31 15 0 0 3
MIFFLIN 13 4 0 0 0
MONROE 89 2 0 0 0
MONTGOMERY 170 20 10 0 0
MONTOUR 0 0 0 0 0
NORTHAMPTON 66 20 1 0 0
NORTHUMBERLAND 7 1 1 0 0
PERRY 9 2 0 0 0
PHILADELPHIA 862 90 5 6 2
PIKE 9 3 0 0 0
POTTER 2 0 0 0 0
SCHUYLKILL 35 9 0 0 0
SNYDER 6 3 0 0 0
SOMERSET 4 2 0 0 0
SULLIVAN 0 0 0 0 0
SUSQUEHANNA 6 2 0 0 0
TIOGA 7 3 0 0 0
UNION 2 0 0 0 0
VENANGO 15 8 0 0 0
WARREN 8 4 0 0 0
WASHINGTON 67 24 0 0 0
WAYNE 8 1 0 0 0
WESTMORELAND 107 41 0 0 1
WYOMING 9 5 0 0 0
YORK 148 25 3 0 0
TOTAL 3,318 709 53 22 13
% OF TOTAL 100.0% 21.4% 1.6% 0.7% 0.4%
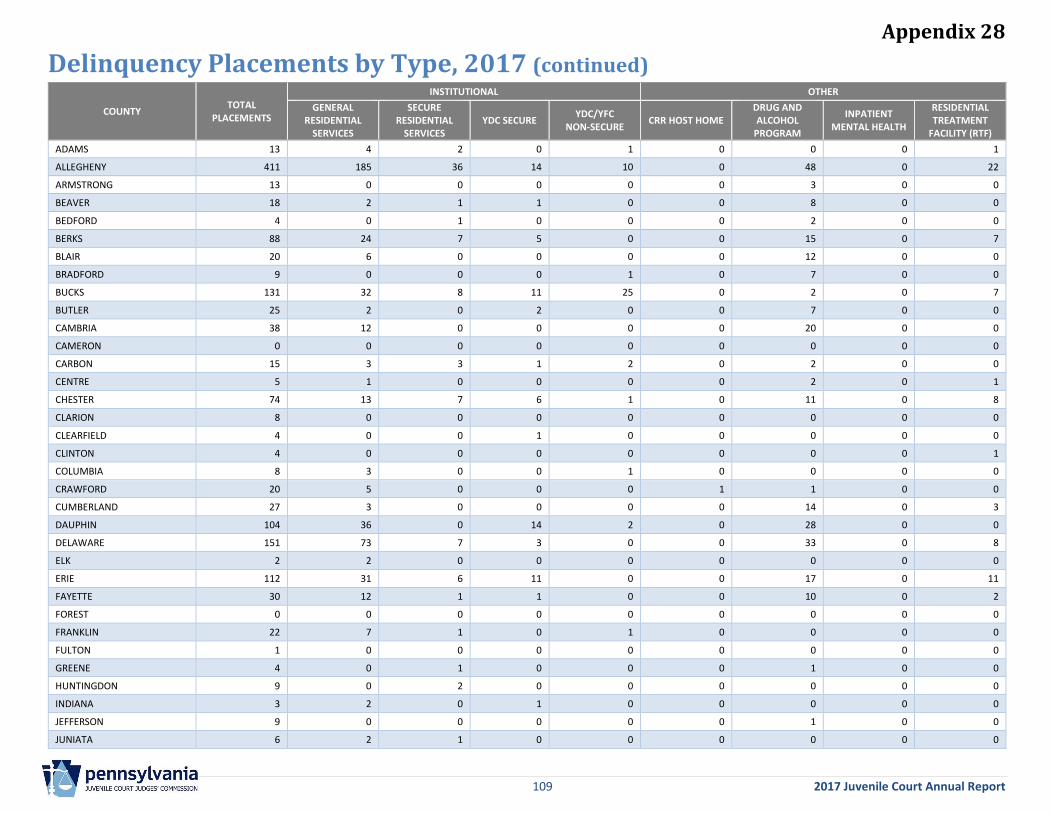
Appendix 28
109 2017 Juvenile Court Annual Report
Delinquency Placements by Type, 2017 (continued)
COUNTY TOTAL
PLACEMENTS
INSTITUTIONAL OTHER
GENERAL RESIDENTIAL
SERVICES
SECURE RESIDENTIAL
SERVICES YDC SECURE
YDC/YFC NON-SECURE
CRR HOST HOME DRUG AND ALCOHOL
PROGRAM
INPATIENT MENTAL HEALTH
RESIDENTIAL TREATMENT
FACILITY (RTF)
ADAMS 13 4 2 0 1 0 0 0 1
ALLEGHENY 411 185 36 14 10 0 48 0 22
ARMSTRONG 13 0 0 0 0 0 3 0 0
BEAVER 18 2 1 1 0 0 8 0 0
BEDFORD 4 0 1 0 0 0 2 0 0
BERKS 88 24 7 5 0 0 15 0 7
BLAIR 20 6 0 0 0 0 12 0 0
BRADFORD 9 0 0 0 1 0 7 0 0
BUCKS 131 32 8 11 25 0 2 0 7
BUTLER 25 2 0 2 0 0 7 0 0
CAMBRIA 38 12 0 0 0 0 20 0 0
CAMERON 0 0 0 0 0 0 0 0 0
CARBON 15 3 3 1 2 0 2 0 0
CENTRE 5 1 0 0 0 0 2 0 1
CHESTER 74 13 7 6 1 0 11 0 8
CLARION 8 0 0 0 0 0 0 0 0
CLEARFIELD 4 0 0 1 0 0 0 0 0
CLINTON 4 0 0 0 0 0 0 0 1
COLUMBIA 8 3 0 0 1 0 0 0 0
CRAWFORD 20 5 0 0 0 1 1 0 0
CUMBERLAND 27 3 0 0 0 0 14 0 3
DAUPHIN 104 36 0 14 2 0 28 0 0
DELAWARE 151 73 7 3 0 0 33 0 8
ELK 2 2 0 0 0 0 0 0 0
ERIE 112 31 6 11 0 0 17 0 11
FAYETTE 30 12 1 1 0 0 10 0 2
FOREST 0 0 0 0 0 0 0 0 0
FRANKLIN 22 7 1 0 1 0 0 0 0
FULTON 1 0 0 0 0 0 0 0 0
GREENE 4 0 1 0 0 0 1 0 0
HUNTINGDON 9 0 2 0 0 0 0 0 0
INDIANA 3 2 0 1 0 0 0 0 0
JEFFERSON 9 0 0 0 0 0 1 0 0
JUNIATA 6 2 1 0 0 0 0 0 0
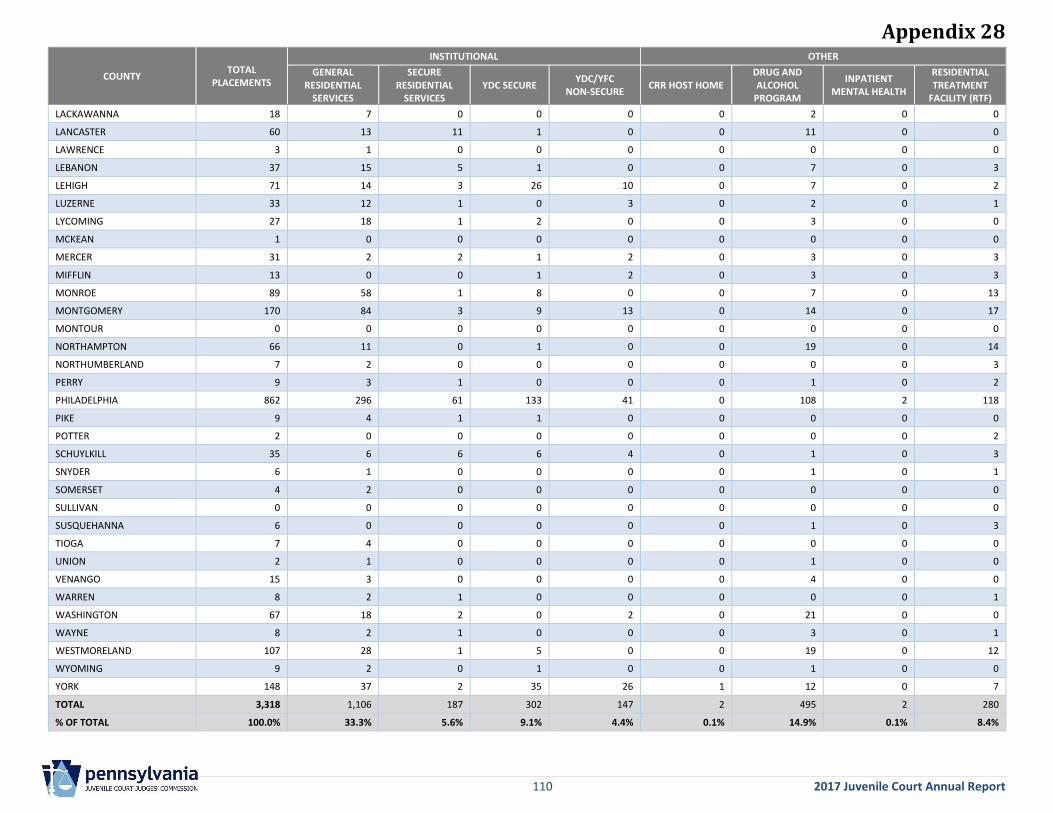
Appendix 28
110 2017 Juvenile Court Annual Report
COUNTY TOTAL
PLACEMENTS
INSTITUTIONAL OTHER
GENERAL RESIDENTIAL
SERVICES
SECURE RESIDENTIAL
SERVICES YDC SECURE
YDC/YFC NON-SECURE
CRR HOST HOME DRUG AND ALCOHOL
PROGRAM
INPATIENT MENTAL HEALTH
RESIDENTIAL TREATMENT
FACILITY (RTF)
LACKAWANNA 18 7 0 0 0 0 2 0 0
LANCASTER 60 13 11 1 0 0 11 0 0
LAWRENCE 3 1 0 0 0 0 0 0 0
LEBANON 37 15 5 1 0 0 7 0 3
LEHIGH 71 14 3 26 10 0 7 0 2
LUZERNE 33 12 1 0 3 0 2 0 1
LYCOMING 27 18 1 2 0 0 3 0 0
MCKEAN 1 0 0 0 0 0 0 0 0
MERCER 31 2 2 1 2 0 3 0 3
MIFFLIN 13 0 0 1 2 0 3 0 3
MONROE 89 58 1 8 0 0 7 0 13
MONTGOMERY 170 84 3 9 13 0 14 0 17
MONTOUR 0 0 0 0 0 0 0 0 0
NORTHAMPTON 66 11 0 1 0 0 19 0 14
NORTHUMBERLAND 7 2 0 0 0 0 0 0 3
PERRY 9 3 1 0 0 0 1 0 2
PHILADELPHIA 862 296 61 133 41 0 108 2 118
PIKE 9 4 1 1 0 0 0 0 0
POTTER 2 0 0 0 0 0 0 0 2
SCHUYLKILL 35 6 6 6 4 0 1 0 3
SNYDER 6 1 0 0 0 0 1 0 1
SOMERSET 4 2 0 0 0 0 0 0 0
SULLIVAN 0 0 0 0 0 0 0 0 0
SUSQUEHANNA 6 0 0 0 0 0 1 0 3
TIOGA 7 4 0 0 0 0 0 0 0
UNION 2 1 0 0 0 0 1 0 0
VENANGO 15 3 0 0 0 0 4 0 0
WARREN 8 2 1 0 0 0 0 0 1
WASHINGTON 67 18 2 0 2 0 21 0 0
WAYNE 8 2 1 0 0 0 3 0 1
WESTMORELAND 107 28 1 5 0 0 19 0 12
WYOMING 9 2 0 1 0 0 1 0 0
YORK 148 37 2 35 26 1 12 0 7
TOTAL 3,318 1,106 187 302 147 2 495 2 280
% OF TOTAL 100.0% 33.3% 5.6% 9.1% 4.4% 0.1% 14.9% 0.1% 8.4%
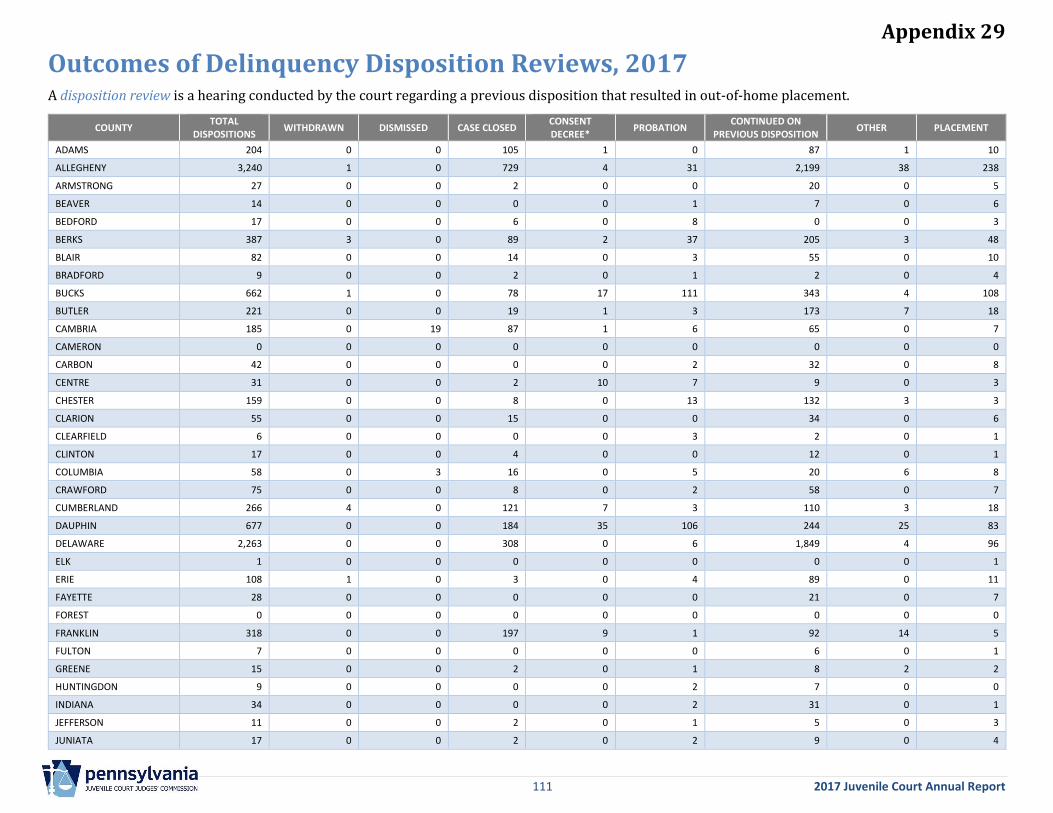
Appendix 29
111 2017 Juvenile Court Annual Report
Outcomes of Delinquency Disposition Reviews, 2017 A disposition review is a hearing conducted by the court regarding a previous disposition that resulted in out-of-home placement.
COUNTY TOTAL
DISPOSITIONS WITHDRAWN DISMISSED CASE CLOSED
CONSENT DECREE*
PROBATION CONTINUED ON
PREVIOUS DISPOSITION OTHER PLACEMENT
ADAMS 204 0 0 105 1 0 87 1 10
ALLEGHENY 3,240 1 0 729 4 31 2,199 38 238
ARMSTRONG 27 0 0 2 0 0 20 0 5
BEAVER 14 0 0 0 0 1 7 0 6
BEDFORD 17 0 0 6 0 8 0 0 3
BERKS 387 3 0 89 2 37 205 3 48
BLAIR 82 0 0 14 0 3 55 0 10
BRADFORD 9 0 0 2 0 1 2 0 4
BUCKS 662 1 0 78 17 111 343 4 108
BUTLER 221 0 0 19 1 3 173 7 18
CAMBRIA 185 0 19 87 1 6 65 0 7
CAMERON 0 0 0 0 0 0 0 0 0
CARBON 42 0 0 0 0 2 32 0 8
CENTRE 31 0 0 2 10 7 9 0 3
CHESTER 159 0 0 8 0 13 132 3 3
CLARION 55 0 0 15 0 0 34 0 6
CLEARFIELD 6 0 0 0 0 3 2 0 1
CLINTON 17 0 0 4 0 0 12 0 1
COLUMBIA 58 0 3 16 0 5 20 6 8
CRAWFORD 75 0 0 8 0 2 58 0 7
CUMBERLAND 266 4 0 121 7 3 110 3 18
DAUPHIN 677 0 0 184 35 106 244 25 83
DELAWARE 2,263 0 0 308 0 6 1,849 4 96
ELK 1 0 0 0 0 0 0 0 1
ERIE 108 1 0 3 0 4 89 0 11
FAYETTE 28 0 0 0 0 0 21 0 7
FOREST 0 0 0 0 0 0 0 0 0
FRANKLIN 318 0 0 197 9 1 92 14 5
FULTON 7 0 0 0 0 0 6 0 1
GREENE 15 0 0 2 0 1 8 2 2
HUNTINGDON 9 0 0 0 0 2 7 0 0
INDIANA 34 0 0 0 0 2 31 0 1
JEFFERSON 11 0 0 2 0 1 5 0 3
JUNIATA 17 0 0 2 0 2 9 0 4
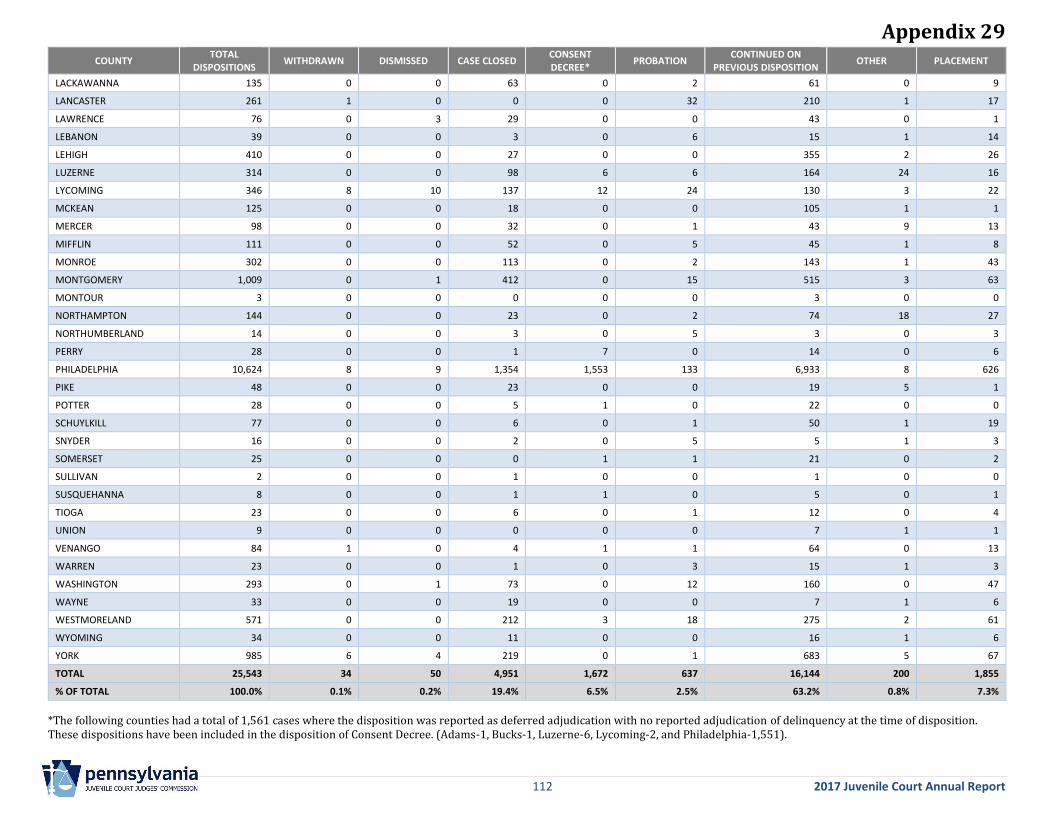
Appendix 29
112 2017 Juvenile Court Annual Report
COUNTY TOTAL
DISPOSITIONS WITHDRAWN DISMISSED CASE CLOSED
CONSENT DECREE*
PROBATION CONTINUED ON
PREVIOUS DISPOSITION OTHER PLACEMENT
LACKAWANNA 135 0 0 63 0 2 61 0 9
LANCASTER 261 1 0 0 0 32 210 1 17
LAWRENCE 76 0 3 29 0 0 43 0 1
LEBANON 39 0 0 3 0 6 15 1 14
LEHIGH 410 0 0 27 0 0 355 2 26
LUZERNE 314 0 0 98 6 6 164 24 16
LYCOMING 346 8 10 137 12 24 130 3 22
MCKEAN 125 0 0 18 0 0 105 1 1
MERCER 98 0 0 32 0 1 43 9 13
MIFFLIN 111 0 0 52 0 5 45 1 8
MONROE 302 0 0 113 0 2 143 1 43
MONTGOMERY 1,009 0 1 412 0 15 515 3 63
MONTOUR 3 0 0 0 0 0 3 0 0
NORTHAMPTON 144 0 0 23 0 2 74 18 27
NORTHUMBERLAND 14 0 0 3 0 5 3 0 3
PERRY 28 0 0 1 7 0 14 0 6
PHILADELPHIA 10,624 8 9 1,354 1,553 133 6,933 8 626
PIKE 48 0 0 23 0 0 19 5 1
POTTER 28 0 0 5 1 0 22 0 0
SCHUYLKILL 77 0 0 6 0 1 50 1 19
SNYDER 16 0 0 2 0 5 5 1 3
SOMERSET 25 0 0 0 1 1 21 0 2
SULLIVAN 2 0 0 1 0 0 1 0 0
SUSQUEHANNA 8 0 0 1 1 0 5 0 1
TIOGA 23 0 0 6 0 1 12 0 4
UNION 9 0 0 0 0 0 7 1 1
VENANGO 84 1 0 4 1 1 64 0 13
WARREN 23 0 0 1 0 3 15 1 3
WASHINGTON 293 0 1 73 0 12 160 0 47
WAYNE 33 0 0 19 0 0 7 1 6
WESTMORELAND 571 0 0 212 3 18 275 2 61
WYOMING 34 0 0 11 0 0 16 1 6
YORK 985 6 4 219 0 1 683 5 67
TOTAL 25,543 34 50 4,951 1,672 637 16,144 200 1,855
% OF TOTAL 100.0% 0.1% 0.2% 19.4% 6.5% 2.5% 63.2% 0.8% 7.3%
*The following counties had a total of 1,561 cases where the disposition was reported as deferred adjudication with no reported adjudication of delinquency at the time of disposition. These dispositions have been included in the disposition of Consent Decree. (Adams-1, Bucks-1, Luzerne-6, Lycoming-2, and Philadelphia-1,551).
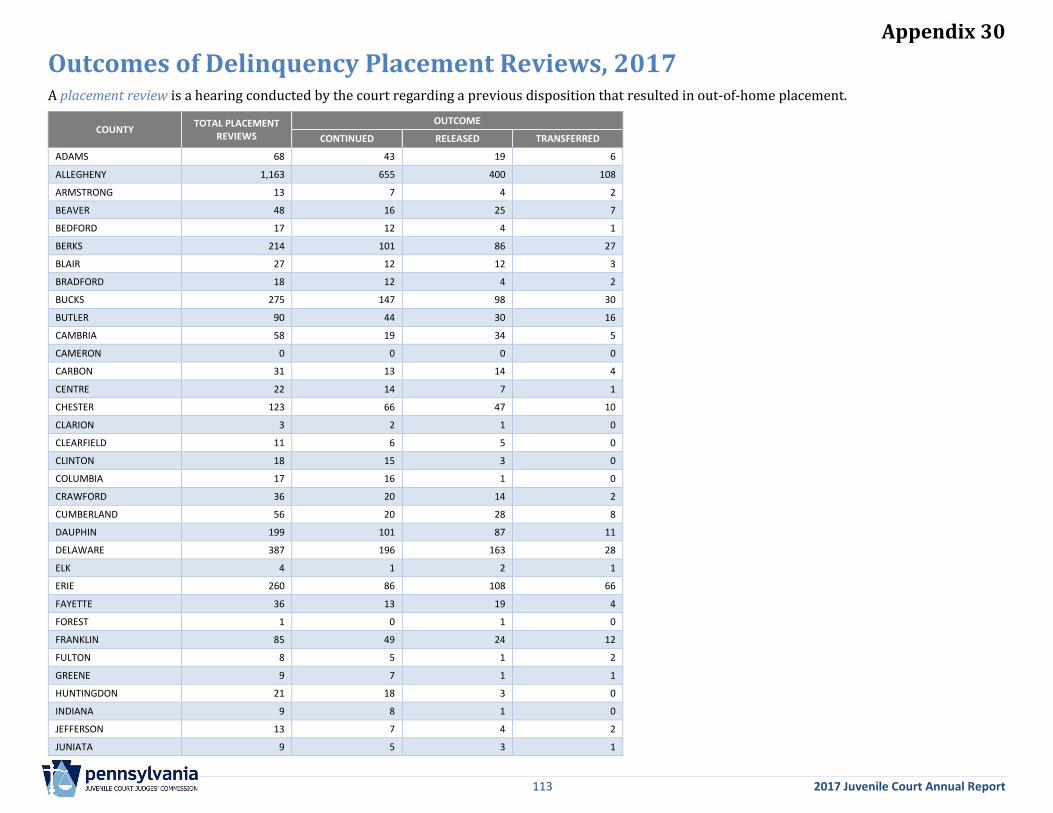
Appendix 30
113 2017 Juvenile Court Annual Report
Outcomes of Delinquency Placement Reviews, 2017 A placement review is a hearing conducted by the court regarding a previous disposition that resulted in out-of-home placement.
COUNTY TOTAL PLACEMENT
REVIEWS
OUTCOME
CONTINUED RELEASED TRANSFERRED
ADAMS 68 43 19 6
ALLEGHENY 1,163 655 400 108
ARMSTRONG 13 7 4 2
BEAVER 48 16 25 7
BEDFORD 17 12 4 1
BERKS 214 101 86 27
BLAIR 27 12 12 3
BRADFORD 18 12 4 2
BUCKS 275 147 98 30
BUTLER 90 44 30 16
CAMBRIA 58 19 34 5
CAMERON 0 0 0 0
CARBON 31 13 14 4
CENTRE 22 14 7 1
CHESTER 123 66 47 10
CLARION 3 2 1 0
CLEARFIELD 11 6 5 0
CLINTON 18 15 3 0
COLUMBIA 17 16 1 0
CRAWFORD 36 20 14 2
CUMBERLAND 56 20 28 8
DAUPHIN 199 101 87 11
DELAWARE 387 196 163 28
ELK 4 1 2 1
ERIE 260 86 108 66
FAYETTE 36 13 19 4
FOREST 1 0 1 0
FRANKLIN 85 49 24 12
FULTON 8 5 1 2
GREENE 9 7 1 1
HUNTINGDON 21 18 3 0
INDIANA 9 8 1 0
JEFFERSON 13 7 4 2
JUNIATA 9 5 3 1
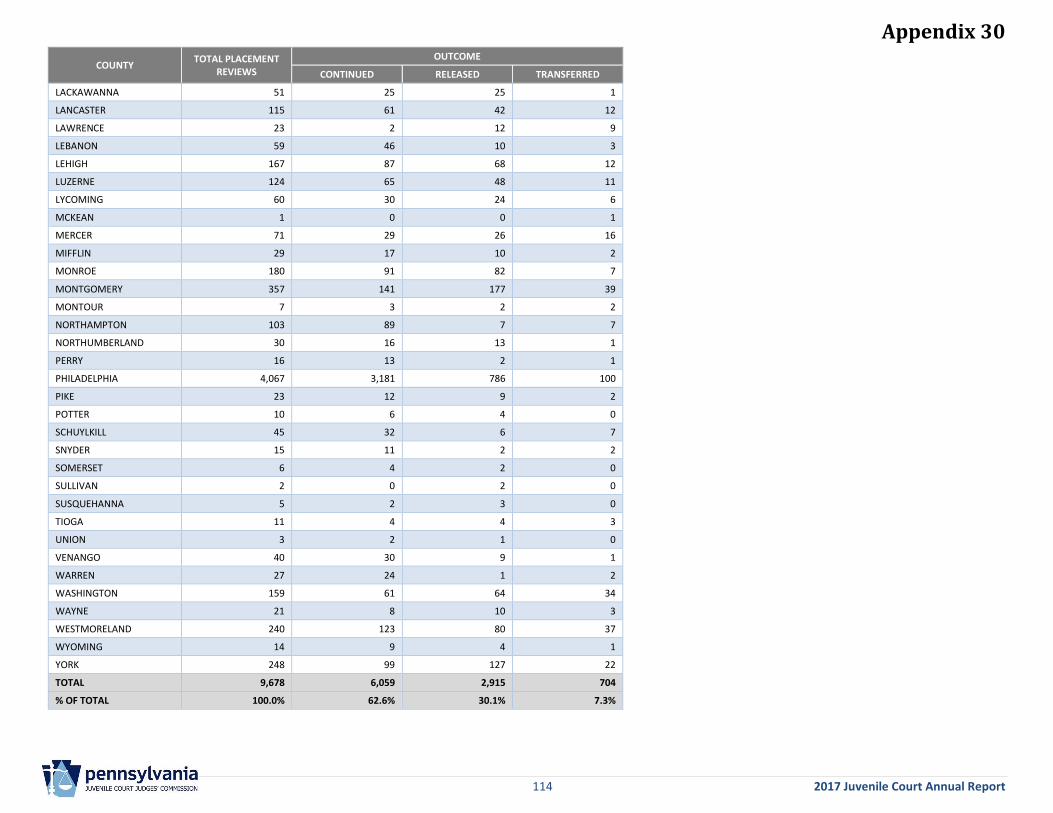
Appendix 30
114 2017 Juvenile Court Annual Report
COUNTY TOTAL PLACEMENT
REVIEWS
OUTCOME
CONTINUED RELEASED TRANSFERRED
LACKAWANNA 51 25 25 1
LANCASTER 115 61 42 12
LAWRENCE 23 2 12 9
LEBANON 59 46 10 3
LEHIGH 167 87 68 12
LUZERNE 124 65 48 11
LYCOMING 60 30 24 6
MCKEAN 1 0 0 1
MERCER 71 29 26 16
MIFFLIN 29 17 10 2
MONROE 180 91 82 7
MONTGOMERY 357 141 177 39
MONTOUR 7 3 2 2
NORTHAMPTON 103 89 7 7
NORTHUMBERLAND 30 16 13 1
PERRY 16 13 2 1
PHILADELPHIA 4,067 3,181 786 100
PIKE 23 12 9 2
POTTER 10 6 4 0
SCHUYLKILL 45 32 6 7
SNYDER 15 11 2 2
SOMERSET 6 4 2 0
SULLIVAN 2 0 2 0
SUSQUEHANNA 5 2 3 0
TIOGA 11 4 4 3
UNION 3 2 1 0
VENANGO 40 30 9 1
WARREN 27 24 1 2
WASHINGTON 159 61 64 34
WAYNE 21 8 10 3
WESTMORELAND 240 123 80 37
WYOMING 14 9 4 1
YORK 248 99 127 22
TOTAL 9,678 6,059 2,915 704
% OF TOTAL 100.0% 62.6% 30.1% 7.3%
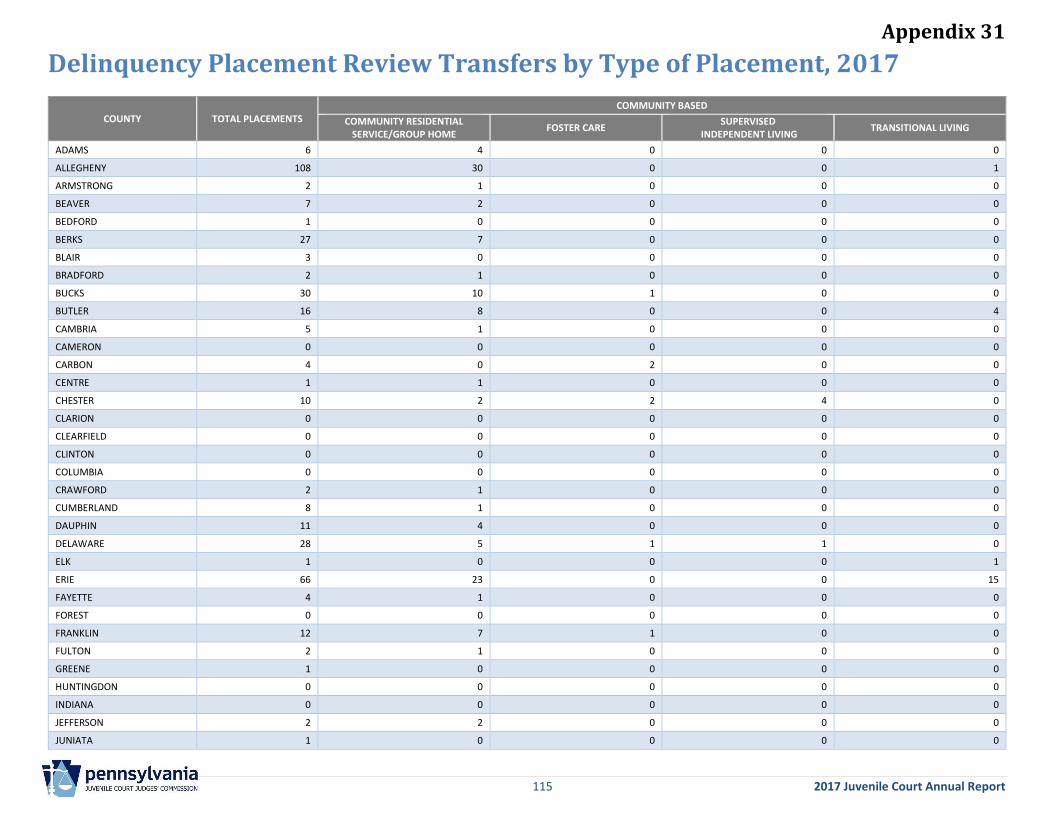
Appendix 31
115 2017 Juvenile Court Annual Report
Delinquency Placement Review Transfers by Type of Placement, 2017
COUNTY TOTAL PLACEMENTS COMMUNITY BASED
COMMUNITY RESIDENTIAL SERVICE/GROUP HOME
FOSTER CARE SUPERVISED
INDEPENDENT LIVING TRANSITIONAL LIVING
ADAMS 6 4 0 0 0
ALLEGHENY 108 30 0 0 1
ARMSTRONG 2 1 0 0 0
BEAVER 7 2 0 0 0
BEDFORD 1 0 0 0 0
BERKS 27 7 0 0 0
BLAIR 3 0 0 0 0
BRADFORD 2 1 0 0 0
BUCKS 30 10 1 0 0
BUTLER 16 8 0 0 4
CAMBRIA 5 1 0 0 0
CAMERON 0 0 0 0 0
CARBON 4 0 2 0 0
CENTRE 1 1 0 0 0
CHESTER 10 2 2 4 0
CLARION 0 0 0 0 0
CLEARFIELD 0 0 0 0 0
CLINTON 0 0 0 0 0
COLUMBIA 0 0 0 0 0
CRAWFORD 2 1 0 0 0
CUMBERLAND 8 1 0 0 0
DAUPHIN 11 4 0 0 0
DELAWARE 28 5 1 1 0
ELK 1 0 0 0 1
ERIE 66 23 0 0 15
FAYETTE 4 1 0 0 0
FOREST 0 0 0 0 0
FRANKLIN 12 7 1 0 0
FULTON 2 1 0 0 0
GREENE 1 0 0 0 0
HUNTINGDON 0 0 0 0 0
INDIANA 0 0 0 0 0
JEFFERSON 2 2 0 0 0
JUNIATA 1 0 0 0 0
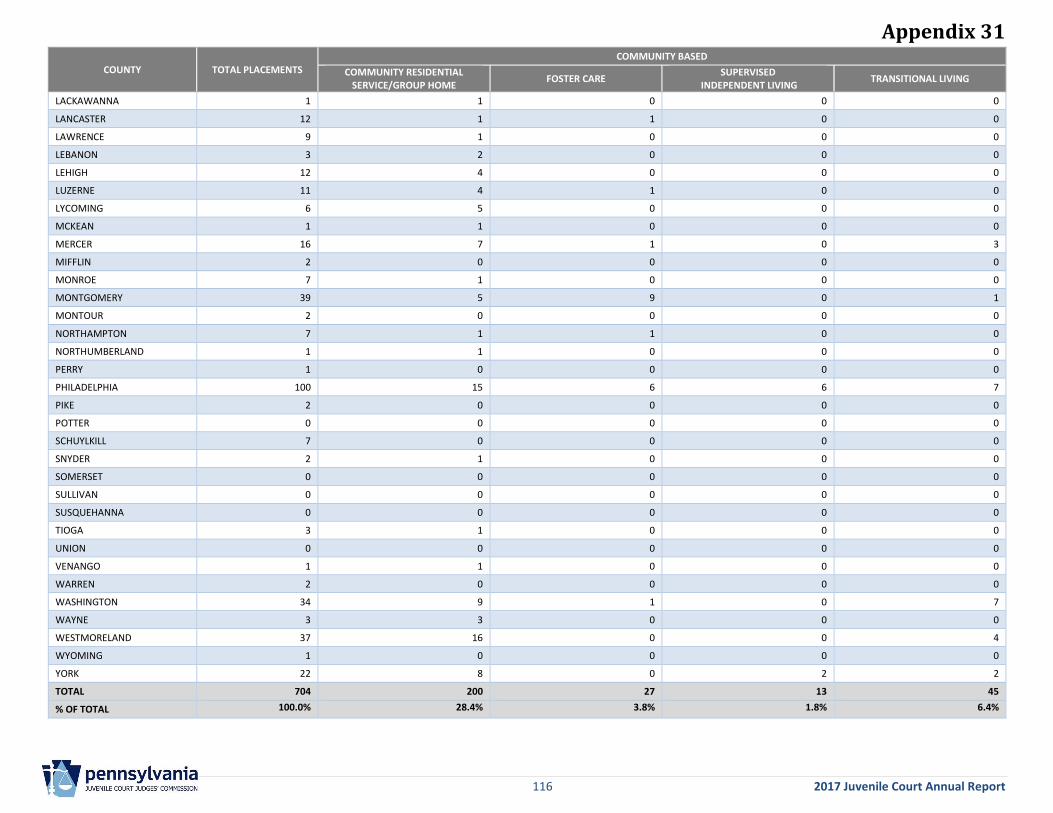
Appendix 31
116 2017 Juvenile Court Annual Report
COUNTY TOTAL PLACEMENTS
COMMUNITY BASED
COMMUNITY RESIDENTIAL SERVICE/GROUP HOME
FOSTER CARE SUPERVISED
INDEPENDENT LIVING TRANSITIONAL LIVING
LACKAWANNA 1 1 0 0 0
LANCASTER 12 1 1 0 0
LAWRENCE 9 1 0 0 0
LEBANON 3 2 0 0 0
LEHIGH 12 4 0 0 0
LUZERNE 11 4 1 0 0
LYCOMING 6 5 0 0 0
MCKEAN 1 1 0 0 0
MERCER 16 7 1 0 3
MIFFLIN 2 0 0 0 0
MONROE 7 1 0 0 0
MONTGOMERY 39 5 9 0 1
MONTOUR 2 0 0 0 0
NORTHAMPTON 7 1 1 0 0
NORTHUMBERLAND 1 1 0 0 0
PERRY 1 0 0 0 0
PHILADELPHIA 100 15 6 6 7
PIKE 2 0 0 0 0
POTTER 0 0 0 0 0
SCHUYLKILL 7 0 0 0 0
SNYDER 2 1 0 0 0
SOMERSET 0 0 0 0 0
SULLIVAN 0 0 0 0 0
SUSQUEHANNA 0 0 0 0 0
TIOGA 3 1 0 0 0
UNION 0 0 0 0 0
VENANGO 1 1 0 0 0
WARREN 2 0 0 0 0
WASHINGTON 34 9 1 0 7
WAYNE 3 3 0 0 0
WESTMORELAND 37 16 0 0 4
WYOMING 1 0 0 0 0
YORK 22 8 0 2 2
TOTAL 704 200 27 13 45
% OF TOTAL 100.0% 28.4% 3.8% 1.8% 6.4%
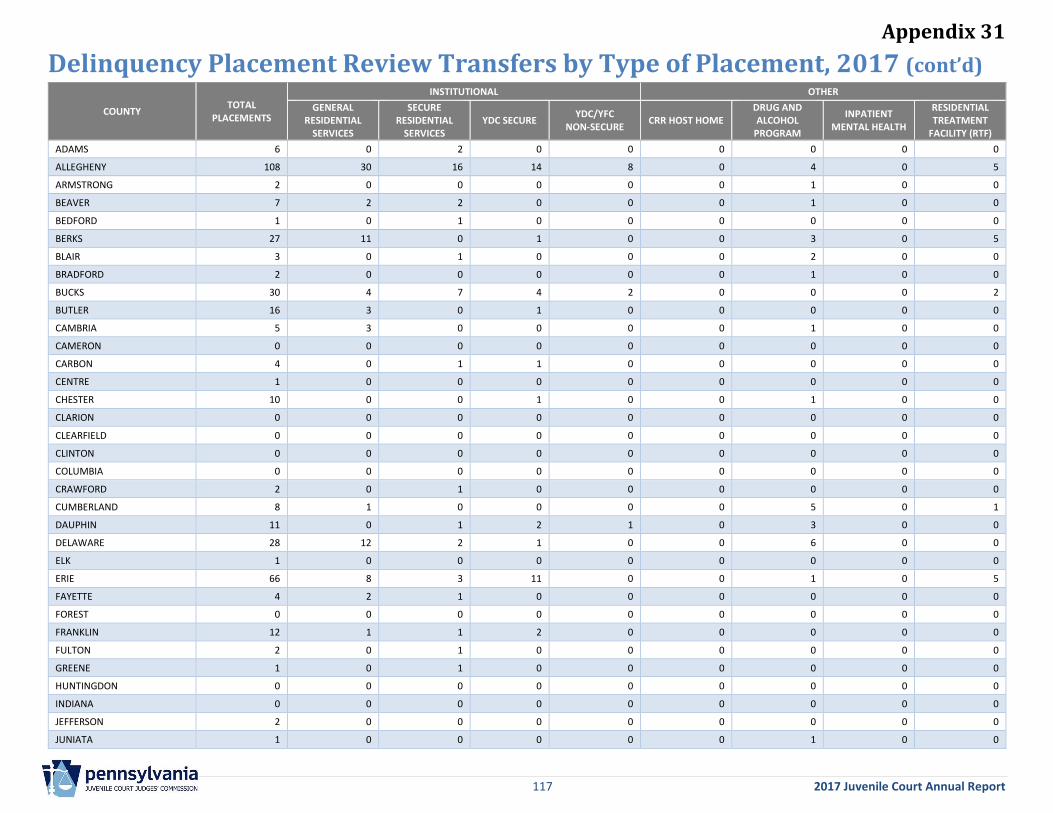
Appendix 31
117 2017 Juvenile Court Annual Report
Delinquency Placement Review Transfers by Type of Placement, 2017 (cont’d)
COUNTY TOTAL
PLACEMENTS
INSTITUTIONAL OTHER
GENERAL RESIDENTIAL
SERVICES
SECURE RESIDENTIAL
SERVICES YDC SECURE
YDC/YFC NON-SECURE
CRR HOST HOME DRUG AND ALCOHOL
PROGRAM
INPATIENT MENTAL HEALTH
RESIDENTIAL TREATMENT
FACILITY (RTF)
ADAMS 6 0 2 0 0 0 0 0 0
ALLEGHENY 108 30 16 14 8 0 4 0 5
ARMSTRONG 2 0 0 0 0 0 1 0 0
BEAVER 7 2 2 0 0 0 1 0 0
BEDFORD 1 0 1 0 0 0 0 0 0
BERKS 27 11 0 1 0 0 3 0 5
BLAIR 3 0 1 0 0 0 2 0 0
BRADFORD 2 0 0 0 0 0 1 0 0
BUCKS 30 4 7 4 2 0 0 0 2
BUTLER 16 3 0 1 0 0 0 0 0
CAMBRIA 5 3 0 0 0 0 1 0 0
CAMERON 0 0 0 0 0 0 0 0 0
CARBON 4 0 1 1 0 0 0 0 0
CENTRE 1 0 0 0 0 0 0 0 0
CHESTER 10 0 0 1 0 0 1 0 0
CLARION 0 0 0 0 0 0 0 0 0
CLEARFIELD 0 0 0 0 0 0 0 0 0
CLINTON 0 0 0 0 0 0 0 0 0
COLUMBIA 0 0 0 0 0 0 0 0 0
CRAWFORD 2 0 1 0 0 0 0 0 0
CUMBERLAND 8 1 0 0 0 0 5 0 1
DAUPHIN 11 0 1 2 1 0 3 0 0
DELAWARE 28 12 2 1 0 0 6 0 0
ELK 1 0 0 0 0 0 0 0 0
ERIE 66 8 3 11 0 0 1 0 5
FAYETTE 4 2 1 0 0 0 0 0 0
FOREST 0 0 0 0 0 0 0 0 0
FRANKLIN 12 1 1 2 0 0 0 0 0
FULTON 2 0 1 0 0 0 0 0 0
GREENE 1 0 1 0 0 0 0 0 0
HUNTINGDON 0 0 0 0 0 0 0 0 0
INDIANA 0 0 0 0 0 0 0 0 0
JEFFERSON 2 0 0 0 0 0 0 0 0
JUNIATA 1 0 0 0 0 0 1 0 0
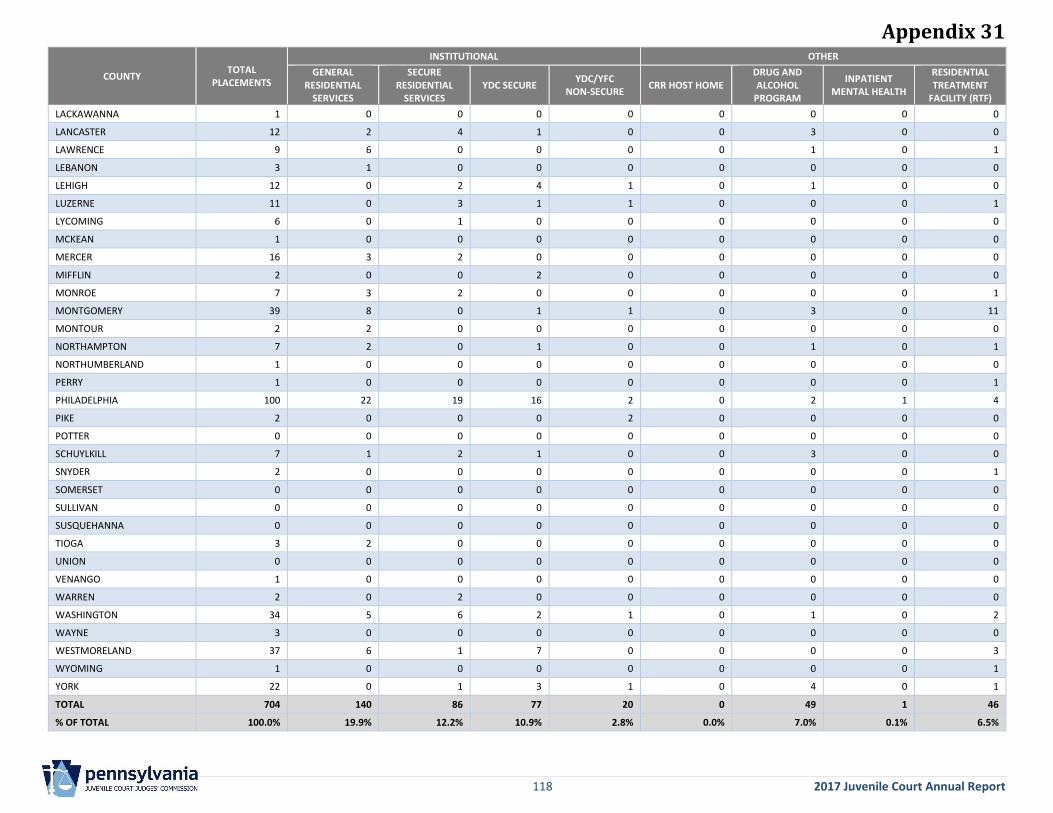
Appendix 31
118 2017 Juvenile Court Annual Report
COUNTY TOTAL
PLACEMENTS
INSTITUTIONAL OTHER
GENERAL RESIDENTIAL
SERVICES
SECURE RESIDENTIAL
SERVICES YDC SECURE
YDC/YFC NON-SECURE
CRR HOST HOME DRUG AND ALCOHOL
PROGRAM
INPATIENT MENTAL HEALTH
RESIDENTIAL TREATMENT
FACILITY (RTF)
LACKAWANNA 1 0 0 0 0 0 0 0 0
LANCASTER 12 2 4 1 0 0 3 0 0
LAWRENCE 9 6 0 0 0 0 1 0 1
LEBANON 3 1 0 0 0 0 0 0 0
LEHIGH 12 0 2 4 1 0 1 0 0
LUZERNE 11 0 3 1 1 0 0 0 1
LYCOMING 6 0 1 0 0 0 0 0 0
MCKEAN 1 0 0 0 0 0 0 0 0
MERCER 16 3 2 0 0 0 0 0 0
MIFFLIN 2 0 0 2 0 0 0 0 0
MONROE 7 3 2 0 0 0 0 0 1
MONTGOMERY 39 8 0 1 1 0 3 0 11
MONTOUR 2 2 0 0 0 0 0 0 0
NORTHAMPTON 7 2 0 1 0 0 1 0 1
NORTHUMBERLAND 1 0 0 0 0 0 0 0 0
PERRY 1 0 0 0 0 0 0 0 1
PHILADELPHIA 100 22 19 16 2 0 2 1 4
PIKE 2 0 0 0 2 0 0 0 0
POTTER 0 0 0 0 0 0 0 0 0
SCHUYLKILL 7 1 2 1 0 0 3 0 0
SNYDER 2 0 0 0 0 0 0 0 1
SOMERSET 0 0 0 0 0 0 0 0 0
SULLIVAN 0 0 0 0 0 0 0 0 0
SUSQUEHANNA 0 0 0 0 0 0 0 0 0
TIOGA 3 2 0 0 0 0 0 0 0
UNION 0 0 0 0 0 0 0 0 0
VENANGO 1 0 0 0 0 0 0 0 0
WARREN 2 0 2 0 0 0 0 0 0
WASHINGTON 34 5 6 2 1 0 1 0 2
WAYNE 3 0 0 0 0 0 0 0 0
WESTMORELAND 37 6 1 7 0 0 0 0 3
WYOMING 1 0 0 0 0 0 0 0 1
YORK 22 0 1 3 1 0 4 0 1
TOTAL 704 140 86 77 20 0 49 1 46
% OF TOTAL 100.0% 19.9% 12.2% 10.9% 2.8% 0.0% 7.0% 0.1% 6.5%
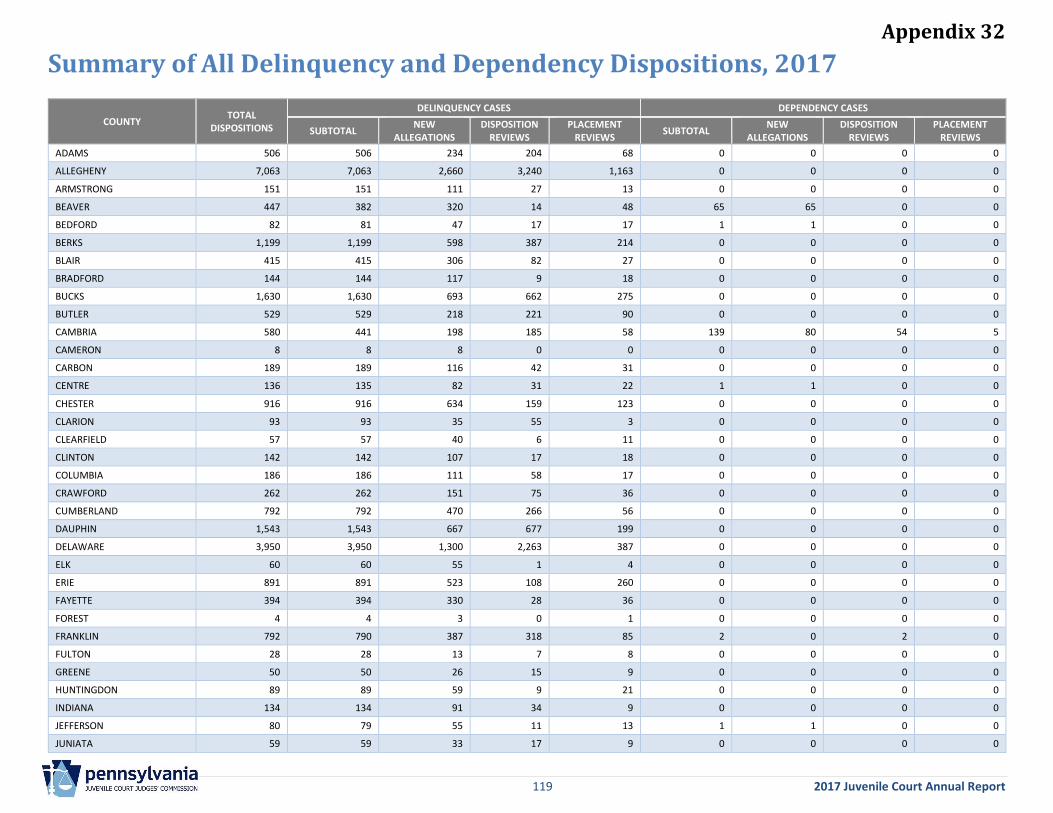
Appendix 32
119 2017 Juvenile Court Annual Report
Summary of All Delinquency and Dependency Dispositions, 2017
COUNTY TOTAL
DISPOSITIONS
DELINQUENCY CASES DEPENDENCY CASES
SUBTOTAL NEW
ALLEGATIONS DISPOSITION
REVIEWS PLACEMENT
REVIEWS SUBTOTAL
NEW ALLEGATIONS
DISPOSITION REVIEWS
PLACEMENT REVIEWS
ADAMS 506 506 234 204 68 0 0 0 0
ALLEGHENY 7,063 7,063 2,660 3,240 1,163 0 0 0 0
ARMSTRONG 151 151 111 27 13 0 0 0 0
BEAVER 447 382 320 14 48 65 65 0 0
BEDFORD 82 81 47 17 17 1 1 0 0
BERKS 1,199 1,199 598 387 214 0 0 0 0
BLAIR 415 415 306 82 27 0 0 0 0
BRADFORD 144 144 117 9 18 0 0 0 0
BUCKS 1,630 1,630 693 662 275 0 0 0 0
BUTLER 529 529 218 221 90 0 0 0 0
CAMBRIA 580 441 198 185 58 139 80 54 5
CAMERON 8 8 8 0 0 0 0 0 0
CARBON 189 189 116 42 31 0 0 0 0
CENTRE 136 135 82 31 22 1 1 0 0
CHESTER 916 916 634 159 123 0 0 0 0
CLARION 93 93 35 55 3 0 0 0 0
CLEARFIELD 57 57 40 6 11 0 0 0 0
CLINTON 142 142 107 17 18 0 0 0 0
COLUMBIA 186 186 111 58 17 0 0 0 0
CRAWFORD 262 262 151 75 36 0 0 0 0
CUMBERLAND 792 792 470 266 56 0 0 0 0
DAUPHIN 1,543 1,543 667 677 199 0 0 0 0
DELAWARE 3,950 3,950 1,300 2,263 387 0 0 0 0
ELK 60 60 55 1 4 0 0 0 0
ERIE 891 891 523 108 260 0 0 0 0
FAYETTE 394 394 330 28 36 0 0 0 0
FOREST 4 4 3 0 1 0 0 0 0
FRANKLIN 792 790 387 318 85 2 0 2 0
FULTON 28 28 13 7 8 0 0 0 0
GREENE 50 50 26 15 9 0 0 0 0
HUNTINGDON 89 89 59 9 21 0 0 0 0
INDIANA 134 134 91 34 9 0 0 0 0
JEFFERSON 80 79 55 11 13 1 1 0 0
JUNIATA 59 59 33 17 9 0 0 0 0
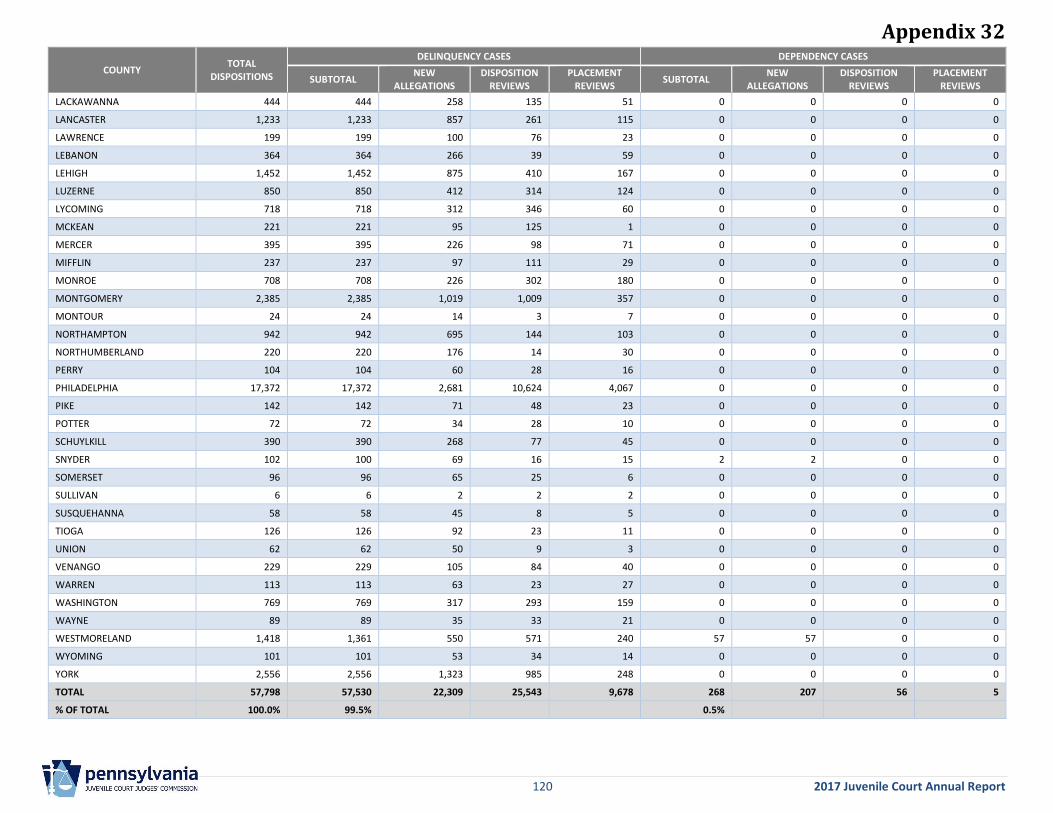
Appendix 32
120 2017 Juvenile Court Annual Report
COUNTY TOTAL
DISPOSITIONS
DELINQUENCY CASES DEPENDENCY CASES
SUBTOTAL NEW
ALLEGATIONS DISPOSITION
REVIEWS PLACEMENT
REVIEWS SUBTOTAL
NEW ALLEGATIONS
DISPOSITION REVIEWS
PLACEMENT REVIEWS
LACKAWANNA 444 444 258 135 51 0 0 0 0
LANCASTER 1,233 1,233 857 261 115 0 0 0 0
LAWRENCE 199 199 100 76 23 0 0 0 0
LEBANON 364 364 266 39 59 0 0 0 0
LEHIGH 1,452 1,452 875 410 167 0 0 0 0
LUZERNE 850 850 412 314 124 0 0 0 0
LYCOMING 718 718 312 346 60 0 0 0 0
MCKEAN 221 221 95 125 1 0 0 0 0
MERCER 395 395 226 98 71 0 0 0 0
MIFFLIN 237 237 97 111 29 0 0 0 0
MONROE 708 708 226 302 180 0 0 0 0
MONTGOMERY 2,385 2,385 1,019 1,009 357 0 0 0 0
MONTOUR 24 24 14 3 7 0 0 0 0
NORTHAMPTON 942 942 695 144 103 0 0 0 0
NORTHUMBERLAND 220 220 176 14 30 0 0 0 0
PERRY 104 104 60 28 16 0 0 0 0
PHILADELPHIA 17,372 17,372 2,681 10,624 4,067 0 0 0 0
PIKE 142 142 71 48 23 0 0 0 0
POTTER 72 72 34 28 10 0 0 0 0
SCHUYLKILL 390 390 268 77 45 0 0 0 0
SNYDER 102 100 69 16 15 2 2 0 0
SOMERSET 96 96 65 25 6 0 0 0 0
SULLIVAN 6 6 2 2 2 0 0 0 0
SUSQUEHANNA 58 58 45 8 5 0 0 0 0
TIOGA 126 126 92 23 11 0 0 0 0
UNION 62 62 50 9 3 0 0 0 0
VENANGO 229 229 105 84 40 0 0 0 0
WARREN 113 113 63 23 27 0 0 0 0
WASHINGTON 769 769 317 293 159 0 0 0 0
WAYNE 89 89 35 33 21 0 0 0 0
WESTMORELAND 1,418 1,361 550 571 240 57 57 0 0
WYOMING 101 101 53 34 14 0 0 0 0
YORK 2,556 2,556 1,323 985 248 0 0 0 0
TOTAL 57,798 57,530 22,309 25,543 9,678 268 207 56 5
% OF TOTAL 100.0% 99.5% 0.5%

November 2018