Embed Size (px)
Citation preview
Food and Agriculture Organization of the United Nations
CCP: JU/HF/ ST / 2017/1
Jute, kenaf, sisal, abaca,
coir and allied fibres
Statistical Bulletin2017
500
700
900
1 100
1 300
1 500
1 700
1 900
2 100
2 300
2 500
Forecasted price Type 3
Forecastedprice UG
3L
Type 3
UG
Sisal Price (f.o.b.) - East Africa: 3L and UG Brazil: Bahia Type 3 DB
USD / tonne
130
160
190
220
250
280
310
340
2013 2014 2015 2016 2017 2018
S2
JK
Indicator price
USD / baleAbaca Prices - Philippines
G
200
300
400
500
600
700
800
900
1000
1100
2013 2014 2015 2016 2017 2018
USD / tonne
Jute Export PricesBTD f.o.b. Bangladesh Port
Jute, kenaf, sisal, abaca, coir and allied fibres
Statistics
December 2017
Market and Policy Analysis of Raw Materials, Horticulture and Tropical (RAMHOT) Products Team
Trade and Markets Division Food and Agriculture Organization of the United Nations
FOOD AND AGRICULTURE ORGANIZATION OF THE UNITED NATIONS
Rome, 2018
The designations employed and the presentation of material in this information product do not imply the expression of any opinion whatsoever on the part of the Food and Agriculture Organization of the United Nations (FAO) concerning the legal or development status of any country, territory, city or area or of its authorities, or concerning the delimitation of its frontiers or boundaries. The mention of specific companies or products of manufacturers, whether or not these have been patented, does not imply that these have been endorsed or recommended by FAO in preference to others of a similar nature that are not mentioned. The views expressed in this information product are those of the author(s) and do not necessarily reflect the views or policies of FAO. FAO encourages the use, reproduction and dissemination of material in this information product. Except where otherwise indicated, material may be copied, downloaded and printed for private study, research and teaching purposes, or for use in non-commercial products or services, provided that appropriate acknowledgement of FAO as the source and copyright holder is given and that FAO’s endorsement of users’ views, products or services is not implied in any way. All requests for translation and adaptation rights, and for resale and other commercial use rights should be made via www.fao.org/contact-us/licence-request or addressed to [email protected]. FAO information products are available on the FAO website (www.fao.org/publications) and can be purchased through [email protected]. © FAO 2018
III
Table of contents
Jute, Kenaf and Allied Fibres
Current Supply and Demand Situation Page Table 1 - Estimate of supplies, domestic requirements, exports and imports in major producing countries, 2015/16 1 Table 2 - Estimate of supplies, domestic requirements, exports and imports in major producing countries, 2016/17 2 Prices Table 3 - Prices of jute and competing crops at grower level in major producing countries 3 Table 4 - Representative monthly export and import prices of jute fibre and Indicative Price of BWD grade 4 Table 5 - Monthly export prices of jute products in India 5 Production Table 6 - World production of jute, kenaf and allied Fibres 6 Table 7 - Area, production and yield in major producing countries 7 Trade Table 8 - World exports of raw jute, kenaf and allied fibres 8 Table 9 - World exports of products of jute, kenaf and allied fibres 9 Table 10 - World imports of raw jute, kenaf and allied fibres 10 Table 11 - World imports of products of jute, kenaf and allied fibres. 11 Table 12 - Monthly exports of jute products by type from India 12 Manufacturing Table 13 - Monthly production and stocks of jute products by type in India 13 Special Information Table 14 - Closing stocks and mill consumption of jute, kenaf and allied fibres in the major producing countries 14 Table 15 - Monthly export value of jute products by type from India 15 Table 16 - World apparent consumption of jute, kenaf and allied fibres 16 Table 17 - Exchange rates 17
***
IV
Sisal Page Table 18 - Production of sisal, henequen and other similar hard fibres 18 Table 19 - Sisal and henequen fibres and manufactures: Exports from producing countries 19 Table 20 - Sisal: Prices of representative grades, 2011-2017 20 Table 21 - Sisal: Imports of raw fibre 21 Table 22 - Sisal: Imports of manufactures 22
***
Abaca Table 23 - Production of abaca 23 Table 24 - Export of abaca: fibre and manufactures from producing countries 23 Table 25 - Abaca: Prices of representative grades, 2011-2017 24 Table 26 - Abaca: Imports of fibre and manufactures 25
***
Coir Table 27 - Production of coir fibre 26 Table 28 - Production of coir yarn 26 Table 29 - Exports of coir fibre 27 Table 30 - Exports of coir yarn 28 Table 31 - Exports of coir mats, matting and rugs from principal exporting countries 28 Table 32 - Sri Lanka: Prices of coir fibres and yarn 29 Table 33 - Imports of coir fibre 30 Table 34 - Imports of coir yarn into principal importing countries 31 Table 35 - Imports of coir mats, matting and rugs into principal importing countries 32
***
Notes 33
v
Foreword
The Market and Policy Analysis of Raw Materials, Horticulture and Tropical Products Team (RAMHOT), provides economic data and analysis on major agricultural raw materials, horticultural and tropical products. Commodities covered under the Team include, bananas and tropical fruits, citrus fruits, cotton, hard fibres (abaca, coir and sisal), hides and skins, jute, kenaf and allied fibres, sugar, and tea.
The Team also undertakes market reviews, outlook appraisals and projections, and provides assistance to developing countries in designing and implementing national policies for those agricultural commodities which enter into international trade.
The tables contained in this document bring together governments’ replies to the Group’s latest questionnaires, supplemented by other data available to the Secretariat at 31 December, 2017. It is prepared by the Trade and Markets Division, FAO, and it is available at the following FAO website:
http://www.fao.org/economic/futurefibres/resources2/en/
- 1 -
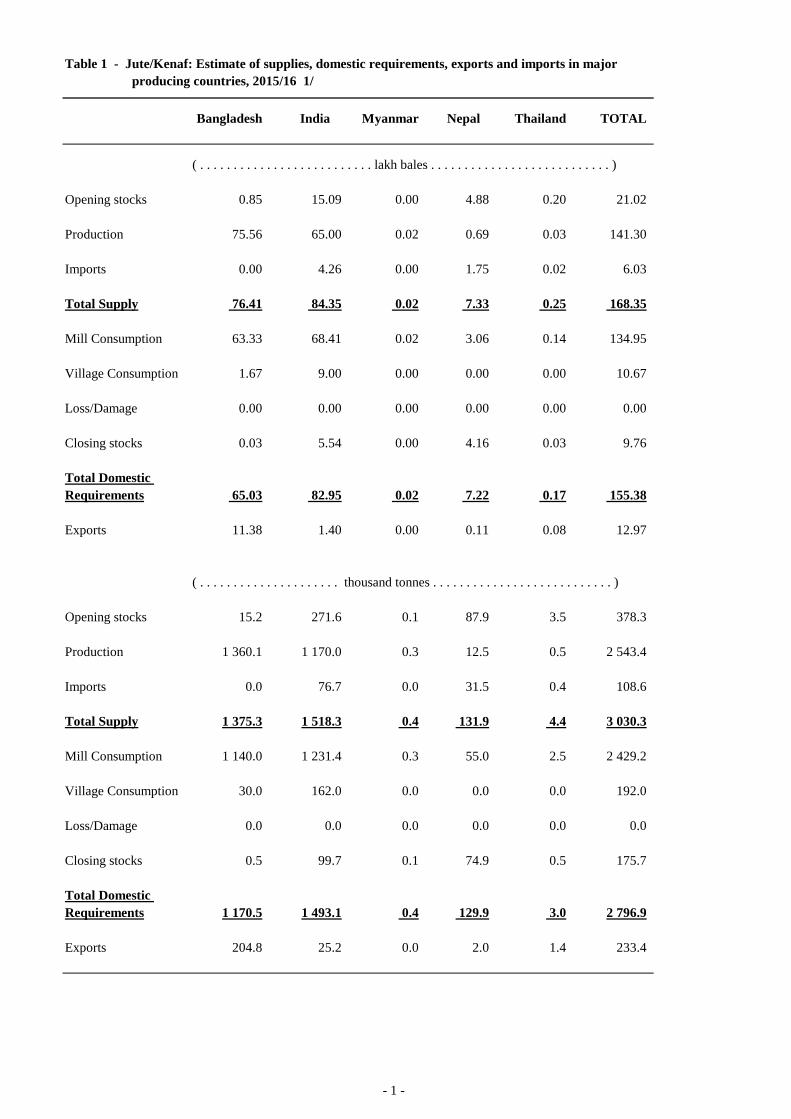
Table 1 - Jute/Kenaf: Estimate of supplies, domestic requirements, exports and imports in major producing countries, 2015/16 1/
Bangladesh India Myanmar Nepal Thailand TOTAL
( . . . . . . . . . . . . . . . . . . . . . . . . . . lakh bales . . . . . . . . . . . . . . . . . . . . . . . . . . . )
Opening stocks 0.85 15.09 0.00 4.88 0.20 21.02
Production 75.56 65.00 0.02 0.69 0.03 141.30
Imports 0.00 4.26 0.00 1.75 0.02 6.03
Total Supply 76.41 84.35 0.02 7.33 0.25 168.35
Mill Consumption 63.33 68.41 0.02 3.06 0.14 134.95
Village Consumption 1.67 9.00 0.00 0.00 0.00 10.67
Loss/Damage 0.00 0.00 0.00 0.00 0.00 0.00
Closing stocks 0.03 5.54 0.00 4.16 0.03 9.76
Total Domestic Requirements 65.03 82.95 0.02 7.22 0.17 155.38 Exports 11.38 1.40 0.00 0.11 0.08 12.97
( . . . . . . . . . . . . . . . . . . . . . thousand tonnes . . . . . . . . . . . . . . . . . . . . . . . . . . . )
Opening stocks 15.2 271.6 0.1 87.9 3.5 378.3
Production 1 360.1 1 170.0 0.3 12.5 0.5 2 543.4
Imports 0.0 76.7 0.0 31.5 0.4 108.6
Total Supply 1 375.3 1 518.3 0.4 131.9 4.4 3 030.3
Mill Consumption 1 140.0 1 231.4 0.3 55.0 2.5 2 429.2
Village Consumption 30.0 162.0 0.0 0.0 0.0 192.0
Loss/Damage 0.0 0.0 0.0 0.0 0.0 0.0
Closing stocks 0.5 99.7 0.1 74.9 0.5 175.7
Total Domestic Requirements 1 170.5 1 493.1 0.4 129.9 3.0 2 796.9
Exports 204.8 25.2 0.0 2.0 1.4 233.4
- 2 -
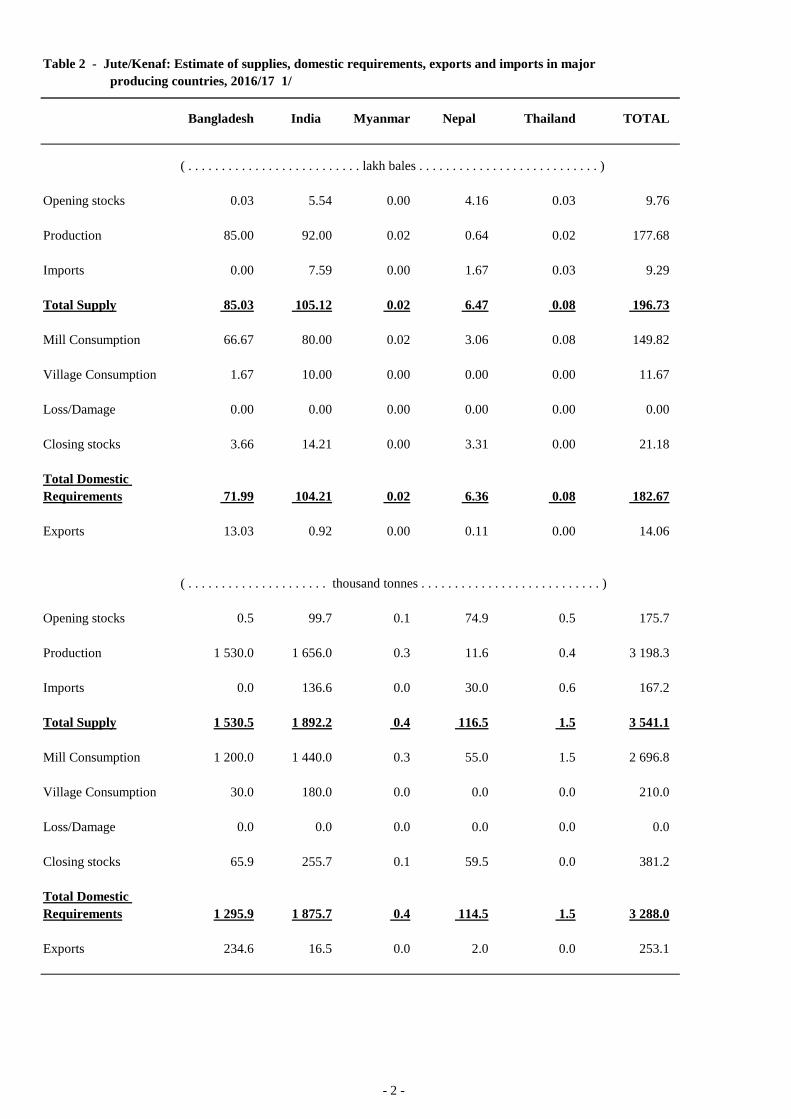
Table 2 - Jute/Kenaf: Estimate of supplies, domestic requirements, exports and imports in major producing countries, 2016/17 1/
Bangladesh India Myanmar Nepal Thailand TOTAL
( . . . . . . . . . . . . . . . . . . . . . . . . . . lakh bales . . . . . . . . . . . . . . . . . . . . . . . . . . . )
Opening stocks 0.03 5.54 0.00 4.16 0.03 9.76
Production 85.00 92.00 0.02 0.64 0.02 177.68
Imports 0.00 7.59 0.00 1.67 0.03 9.29
Total Supply 85.03 105.12 0.02 6.47 0.08 196.73
Mill Consumption 66.67 80.00 0.02 3.06 0.08 149.82
Village Consumption 1.67 10.00 0.00 0.00 0.00 11.67
Loss/Damage 0.00 0.00 0.00 0.00 0.00 0.00
Closing stocks 3.66 14.21 0.00 3.31 0.00 21.18
Total Domestic Requirements 71.99 104.21 0.02 6.36 0.08 182.67 Exports 13.03 0.92 0.00 0.11 0.00 14.06
( . . . . . . . . . . . . . . . . . . . . . thousand tonnes . . . . . . . . . . . . . . . . . . . . . . . . . . . )
Opening stocks 0.5 99.7 0.1 74.9 0.5 175.7
Production 1 530.0 1 656.0 0.3 11.6 0.4 3 198.3
Imports 0.0 136.6 0.0 30.0 0.6 167.2
Total Supply 1 530.5 1 892.2 0.4 116.5 1.5 3 541.1
Mill Consumption 1 200.0 1 440.0 0.3 55.0 1.5 2 696.8
Village Consumption 30.0 180.0 0.0 0.0 0.0 210.0
Loss/Damage 0.0 0.0 0.0 0.0 0.0 0.0
Closing stocks 65.9 255.7 0.1 59.5 0.0 381.2
Total Domestic Requirements 1 295.9 1 875.7 0.4 114.5 1.5 3 288.0
Exports 234.6 16.5 0.0 2.0 0.0 253.1
- 3 -
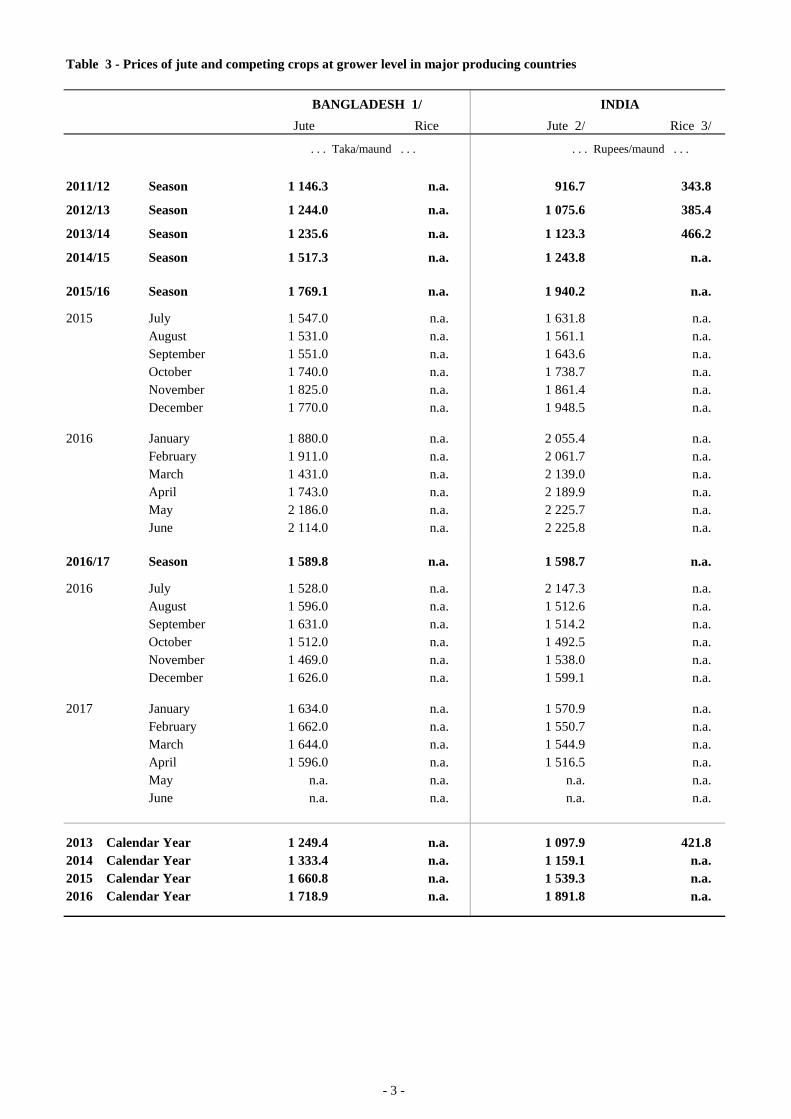
Table 3 - Prices of jute and competing crops at grower level in major producing countries
Jute Rice Jute 2/ Rice 3/
2011/12 Season 1 146.3 n.a. 916.7 343.8
2012/13 Season 1 244.0 n.a. 1 075.6 385.4
2013/14 Season 1 235.6 n.a. 1 123.3 466.2
2014/15 Season 1 517.3 n.a. 1 243.8 n.a.
2015/16 Season 1 769.1 n.a. 1 940.2 n.a.
2015 July 1 547.0 n.a. 1 631.8 n.a.August 1 531.0 n.a. 1 561.1 n.a.September 1 551.0 n.a. 1 643.6 n.a.October 1 740.0 n.a. 1 738.7 n.a.November 1 825.0 n.a. 1 861.4 n.a.December 1 770.0 n.a. 1 948.5 n.a.
2016 January 1 880.0 n.a. 2 055.4 n.a.February 1 911.0 n.a. 2 061.7 n.a.March 1 431.0 n.a. 2 139.0 n.a.April 1 743.0 n.a. 2 189.9 n.a.May 2 186.0 n.a. 2 225.7 n.a.June 2 114.0 n.a. 2 225.8 n.a.
2016/17 Season 1 589.8 n.a. 1 598.7 n.a.
2016 July 1 528.0 n.a. 2 147.3 n.a.August 1 596.0 n.a. 1 512.6 n.a.September 1 631.0 n.a. 1 514.2 n.a.October 1 512.0 n.a. 1 492.5 n.a.November 1 469.0 n.a. 1 538.0 n.a.December 1 626.0 n.a. 1 599.1 n.a.
2017 January 1 634.0 n.a. 1 570.9 n.a.February 1 662.0 n.a. 1 550.7 n.a.March 1 644.0 n.a. 1 544.9 n.a.April 1 596.0 n.a. 1 516.5 n.a.May n.a. n.a. n.a. n.a.June n.a. n.a. n.a. n.a.
2013 Calendar Year 1 249.4 n.a. 1 097.9 421.82014 Calendar Year 1 333.4 n.a. 1 159.1 n.a.2015 Calendar Year 1 660.8 n.a. 1 539.3 n.a.2016 Calendar Year 1 718.9 n.a. 1 891.8 n.a.
INDIA BANGLADESH 1/
. . . Rupees/maund . . . . . . Taka/maund . . .
- 4 -
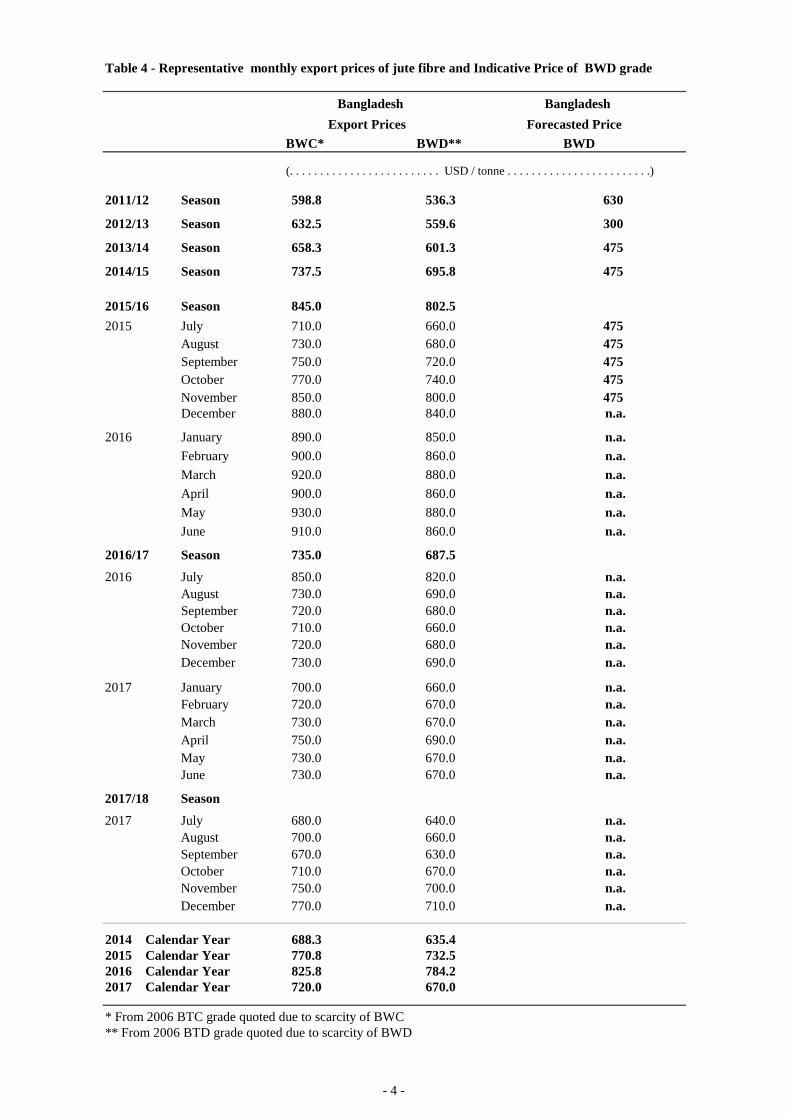
Table 4 - Representative monthly export prices of jute fibre and Indicative Price of BWD grade
Bangladesh Bangladesh Export Prices Forecasted Price
BWC* BWD** BWD
2011/12 Season 598.8 536.3
2012/13 Season 632.5 559.6
2013/14 Season 658.3 601.3
2014/15 Season 737.5 695.8
2015/16 Season 845.0 802.52015 July 710.0 660.0
August 730.0 680.0September 750.0 720.0October 770.0 740.0November 850.0 800.0December 880.0 840.0
2016 January 890.0 850.0February 900.0 860.0March 920.0 880.0April 900.0 860.0May 930.0 880.0June 910.0 860.0
2016/17 Season 735.0 687.52016 July 850.0 820.0
August 730.0 690.0September 720.0 680.0October 710.0 660.0November 720.0 680.0December 730.0 690.0
2017 January 700.0 660.0February 720.0 670.0March 730.0 670.0April 750.0 690.0May 730.0 670.0June 730.0 670.0
2017/18 Season2017 July 680.0 640.0
August 700.0 660.0September 670.0 630.0October 710.0 670.0November 750.0 700.0December 770.0 710.0
2014 Calendar Year 688.3 635.42015 Calendar Year 770.8 732.52016 Calendar Year 825.8 784.22017 Calendar Year 720.0 670.0
* From 2006 BTC grade quoted due to scarcity of BWC** From 2006 BTD grade quoted due to scarcity of BWD
n.a.n.a.
n.a.n.a.
n.a.
n.a.n.a.n.a.n.a.
n.a.
n.a.
n.a.
475
n.a.
475475475475
n.a.n.a.
n.a.
n.a.
(. . . . . . . . . . . . . . . . . . . . . . . . . USD / tonne . . . . . . . . . . . . . . . . . . . . . . . .)
300
475
475
n.a.n.a.n.a.
630
n.a.n.a.n.a.
n.a.
n.a.
- 5 -
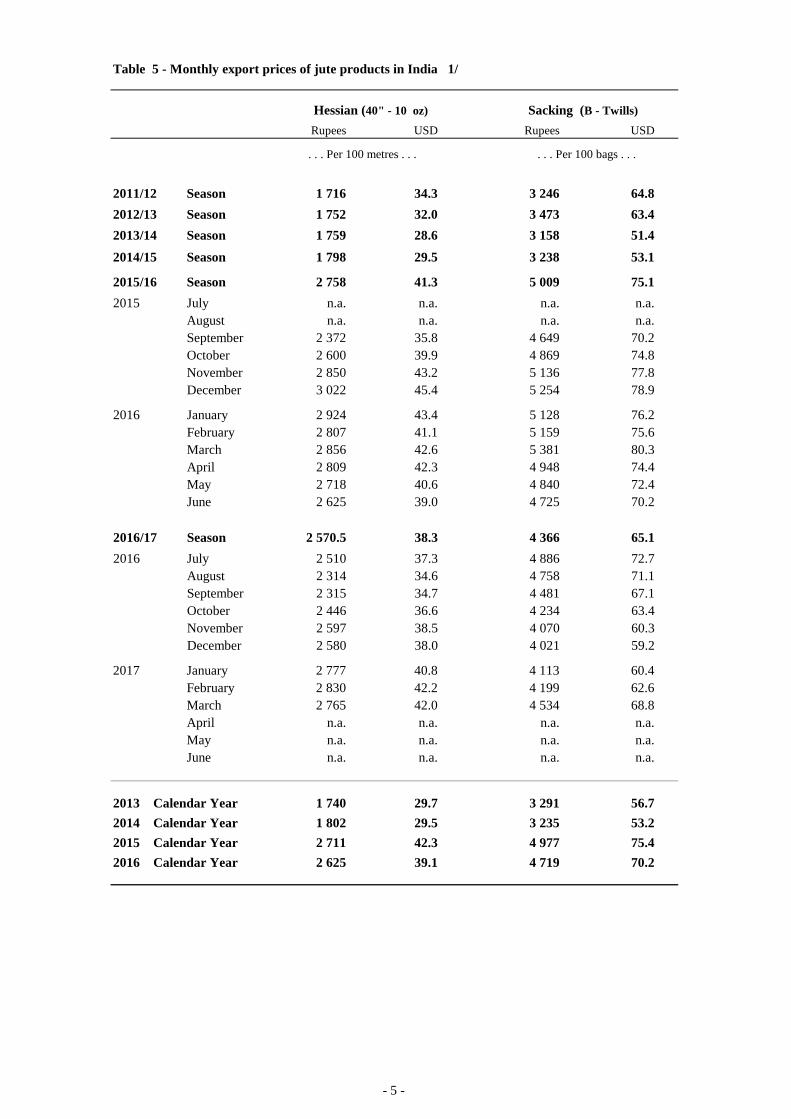
Table 5 - Monthly export prices of jute products in India 1/
Rupees USD Rupees USD
2011/12 Season 1 716 34.3 3 246 64.82012/13 Season 1 752 32.0 3 473 63.42013/14 Season 1 759 28.6 3 158 51.42014/15 Season 1 798 29.5 3 238 53.1
2015/16 Season 2 758 41.3 5 009 75.12015 July n.a. n.a. n.a. n.a.
August n.a. n.a. n.a. n.a.September 2 372 35.8 4 649 70.2October 2 600 39.9 4 869 74.8November 2 850 43.2 5 136 77.8December 3 022 45.4 5 254 78.9
2016 January 2 924 43.4 5 128 76.2February 2 807 41.1 5 159 75.6March 2 856 42.6 5 381 80.3April 2 809 42.3 4 948 74.4May 2 718 40.6 4 840 72.4June 2 625 39.0 4 725 70.2
2016/17 Season 2 570.5 38.3 4 366 65.12016 July 2 510 37.3 4 886 72.7
August 2 314 34.6 4 758 71.1September 2 315 34.7 4 481 67.1October 2 446 36.6 4 234 63.4November 2 597 38.5 4 070 60.3December 2 580 38.0 4 021 59.2
2017 January 2 777 40.8 4 113 60.4February 2 830 42.2 4 199 62.6March 2 765 42.0 4 534 68.8April n.a. n.a. n.a. n.a.May n.a. n.a. n.a. n.a.June n.a. n.a. n.a. n.a.
2013 Calendar Year 1 740 29.7 3 291 56.72014 Calendar Year 1 802 29.5 3 235 53.22015 Calendar Year 2 711 42.3 4 977 75.42016 Calendar Year 2 625 39.1 4 719 70.2
. . . Per 100 metres . . .
Hessian (40" - 10 oz) Sacking (B - Twills)
. . . Per 100 bags . . .
- 6 -
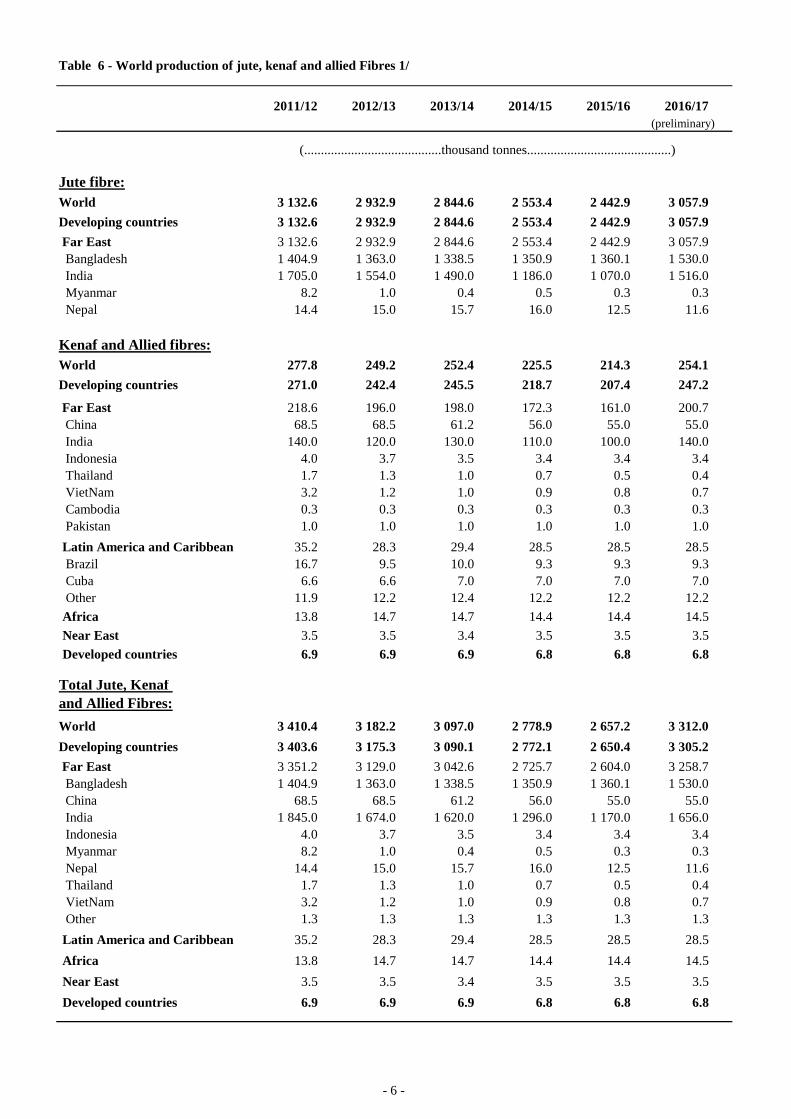
Table 6 - World production of jute, kenaf and allied Fibres 1/
2011/12 2012/13 2013/14 2014/15 2015/16 2016/17 (preliminary)
Jute fibre:World 3 132.6 2 932.9 2 844.6 2 553.4 2 442.9 3 057.9Developing countries 3 132.6 2 932.9 2 844.6 2 553.4 2 442.9 3 057.9 Far East 3 132.6 2 932.9 2 844.6 2 553.4 2 442.9 3 057.9 Bangladesh 1 404.9 1 363.0 1 338.5 1 350.9 1 360.1 1 530.0 India 1 705.0 1 554.0 1 490.0 1 186.0 1 070.0 1 516.0 Myanmar 8.2 1.0 0.4 0.5 0.3 0.3 Nepal 14.4 15.0 15.7 16.0 12.5 11.6
Kenaf and Allied fibres:World 277.8 249.2 252.4 225.5 214.3 254.1Developing countries 271.0 242.4 245.5 218.7 207.4 247.2
Far East 218.6 196.0 198.0 172.3 161.0 200.7 China 68.5 68.5 61.2 56.0 55.0 55.0 India 140.0 120.0 130.0 110.0 100.0 140.0 Indonesia 4.0 3.7 3.5 3.4 3.4 3.4 Thailand 1.7 1.3 1.0 0.7 0.5 0.4 VietNam 3.2 1.2 1.0 0.9 0.8 0.7 Cambodia 0.3 0.3 0.3 0.3 0.3 0.3 Pakistan 1.0 1.0 1.0 1.0 1.0 1.0 Latin America and Caribbean 35.2 28.3 29.4 28.5 28.5 28.5 Brazil 16.7 9.5 10.0 9.3 9.3 9.3 Cuba 6.6 6.6 7.0 7.0 7.0 7.0 Other 11.9 12.2 12.4 12.2 12.2 12.2 Africa 13.8 14.7 14.7 14.4 14.4 14.5 Near East 3.5 3.5 3.4 3.5 3.5 3.5 Developed countries 6.9 6.9 6.9 6.8 6.8 6.8
Total Jute, Kenaf and Allied Fibres:World 3 410.4 3 182.2 3 097.0 2 778.9 2 657.2 3 312.0Developing countries 3 403.6 3 175.3 3 090.1 2 772.1 2 650.4 3 305.2 Far East 3 351.2 3 129.0 3 042.6 2 725.7 2 604.0 3 258.7 Bangladesh 1 404.9 1 363.0 1 338.5 1 350.9 1 360.1 1 530.0 China 68.5 68.5 61.2 56.0 55.0 55.0 India 1 845.0 1 674.0 1 620.0 1 296.0 1 170.0 1 656.0 Indonesia 4.0 3.7 3.5 3.4 3.4 3.4 Myanmar 8.2 1.0 0.4 0.5 0.3 0.3 Nepal 14.4 15.0 15.7 16.0 12.5 11.6 Thailand 1.7 1.3 1.0 0.7 0.5 0.4 VietNam 3.2 1.2 1.0 0.9 0.8 0.7 Other 1.3 1.3 1.3 1.3 1.3 1.3 Latin America and Caribbean 35.2 28.3 29.4 28.5 28.5 28.5 Africa 13.8 14.7 14.7 14.4 14.4 14.5 Near East 3.5 3.5 3.4 3.5 3.5 3.5 Developed countries 6.9 6.9 6.9 6.8 6.8 6.8
(.........................................thousand tonnes...........................................)
- 7 -
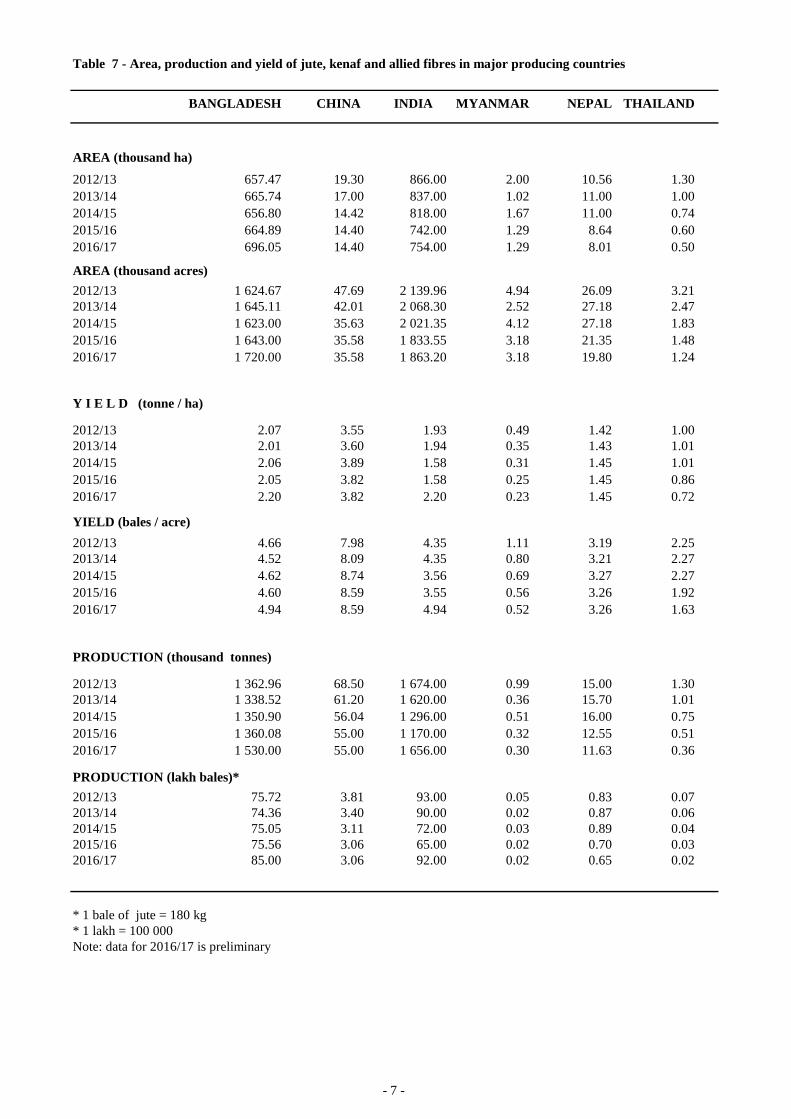
Table 7 - Area, production and yield of jute, kenaf and allied fibres in major producing countries
BANGLADESH CHINA INDIA MYANMAR NEPAL THAILAND
AREA (thousand ha)2012/13 657.47 19.30 866.00 2.00 10.56 1.302013/14 665.74 17.00 837.00 1.02 11.00 1.002014/15 656.80 14.42 818.00 1.67 11.00 0.742015/16 664.89 14.40 742.00 1.29 8.64 0.602016/17 696.05 14.40 754.00 1.29 8.01 0.50
AREA (thousand acres)2012/13 1 624.67 47.69 2 139.96 4.94 26.09 3.212013/14 1 645.11 42.01 2 068.30 2.52 27.18 2.472014/15 1 623.00 35.63 2 021.35 4.12 27.18 1.832015/16 1 643.00 35.58 1 833.55 3.18 21.35 1.482016/17 1 720.00 35.58 1 863.20 3.18 19.80 1.24
Y I E L D (tonne / ha)
2012/13 2.07 3.55 1.93 0.49 1.42 1.002013/14 2.01 3.60 1.94 0.35 1.43 1.012014/15 2.06 3.89 1.58 0.31 1.45 1.012015/16 2.05 3.82 1.58 0.25 1.45 0.862016/17 2.20 3.82 2.20 0.23 1.45 0.72
YIELD (bales / acre)2012/13 4.66 7.98 4.35 1.11 3.19 2.252013/14 4.52 8.09 4.35 0.80 3.21 2.272014/15 4.62 8.74 3.56 0.69 3.27 2.272015/16 4.60 8.59 3.55 0.56 3.26 1.922016/17 4.94 8.59 4.94 0.52 3.26 1.63
PRODUCTION (thousand tonnes)
2012/13 1 362.96 68.50 1 674.00 0.99 15.00 1.302013/14 1 338.52 61.20 1 620.00 0.36 15.70 1.012014/15 1 350.90 56.04 1 296.00 0.51 16.00 0.752015/16 1 360.08 55.00 1 170.00 0.32 12.55 0.512016/17 1 530.00 55.00 1 656.00 0.30 11.63 0.36
PRODUCTION (lakh bales)*2012/13 75.72 3.81 93.00 0.05 0.83 0.072013/14 74.36 3.40 90.00 0.02 0.87 0.062014/15 75.05 3.11 72.00 0.03 0.89 0.042015/16 75.56 3.06 65.00 0.02 0.70 0.032016/17 85.00 3.06 92.00 0.02 0.65 0.02
* 1 bale of jute = 180 kg* 1 lakh = 100 000Note: data for 2016/17 is preliminary
- 8 -
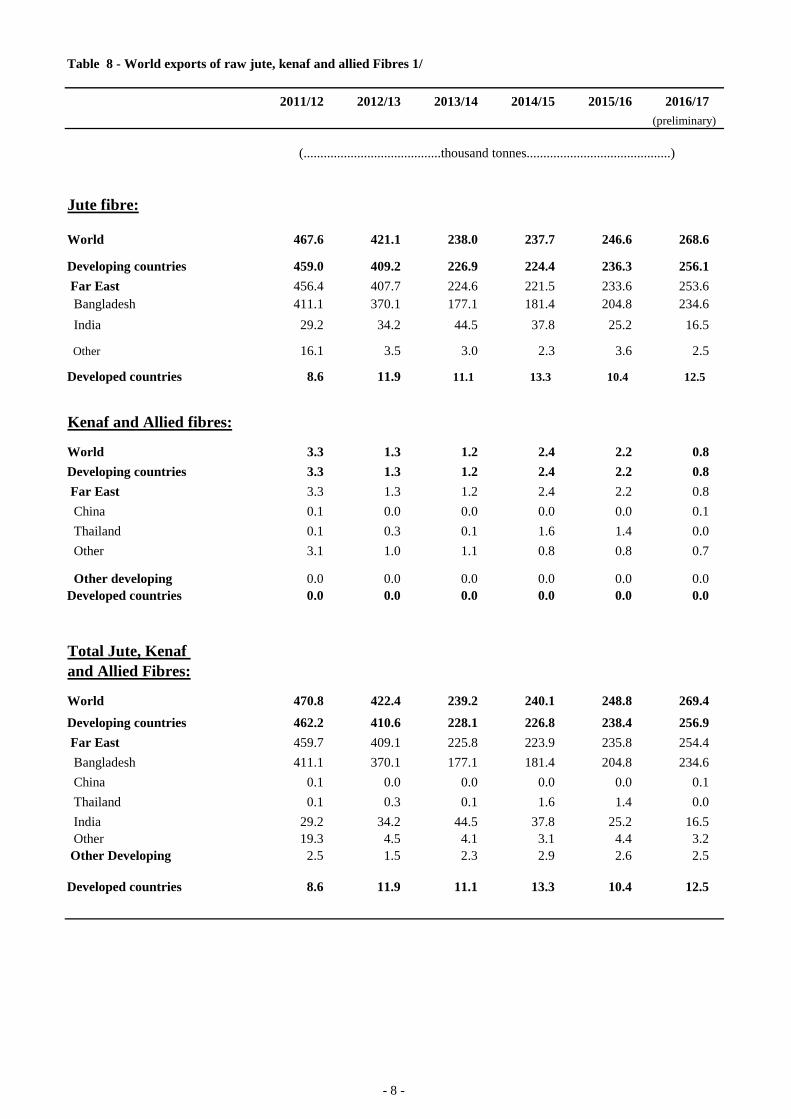
Table 8 - World exports of raw jute, kenaf and allied Fibres 1/
2011/12 2012/13 2013/14 2014/15 2015/16 2016/17
Jute fibre:
World 467.6 421.1 238.0 237.7 246.6 268.6
Developing countries 459.0 409.2 226.9 224.4 236.3 256.1 Far East 456.4 407.7 224.6 221.5 233.6 253.6 Bangladesh 411.1 370.1 177.1 181.4 204.8 234.6 India 29.2 34.2 44.5 37.8 25.2 16.5
Other 16.1 3.5 3.0 2.3 3.6 2.5
Developed countries 8.6 11.9 11.1 13.3 10.4 12.5
Kenaf and Allied fibres:
World 3.3 1.3 1.2 2.4 2.2 0.8Developing countries 3.3 1.3 1.2 2.4 2.2 0.8 Far East 3.3 1.3 1.2 2.4 2.2 0.8 China 0.1 0.0 0.0 0.0 0.0 0.1 Thailand 0.1 0.3 0.1 1.6 1.4 0.0 Other 3.1 1.0 1.1 0.8 0.8 0.7
Other developing 0.0 0.0 0.0 0.0 0.0 0.0Developed countries 0.0 0.0 0.0 0.0 0.0 0.0
Total Jute, Kenaf and Allied Fibres:
World 470.8 422.4 239.2 240.1 248.8 269.4Developing countries 462.2 410.6 228.1 226.8 238.4 256.9 Far East 459.7 409.1 225.8 223.9 235.8 254.4 Bangladesh 411.1 370.1 177.1 181.4 204.8 234.6 China 0.1 0.0 0.0 0.0 0.0 0.1 Thailand 0.1 0.3 0.1 1.6 1.4 0.0 India 29.2 34.2 44.5 37.8 25.2 16.5 Other 19.3 4.5 4.1 3.1 4.4 3.2 Other Developing 2.5 1.5 2.3 2.9 2.6 2.5
Developed countries 8.6 11.9 11.1 13.3 10.4 12.5
(preliminary)
(.........................................thousand tonnes...........................................)
- 9 -
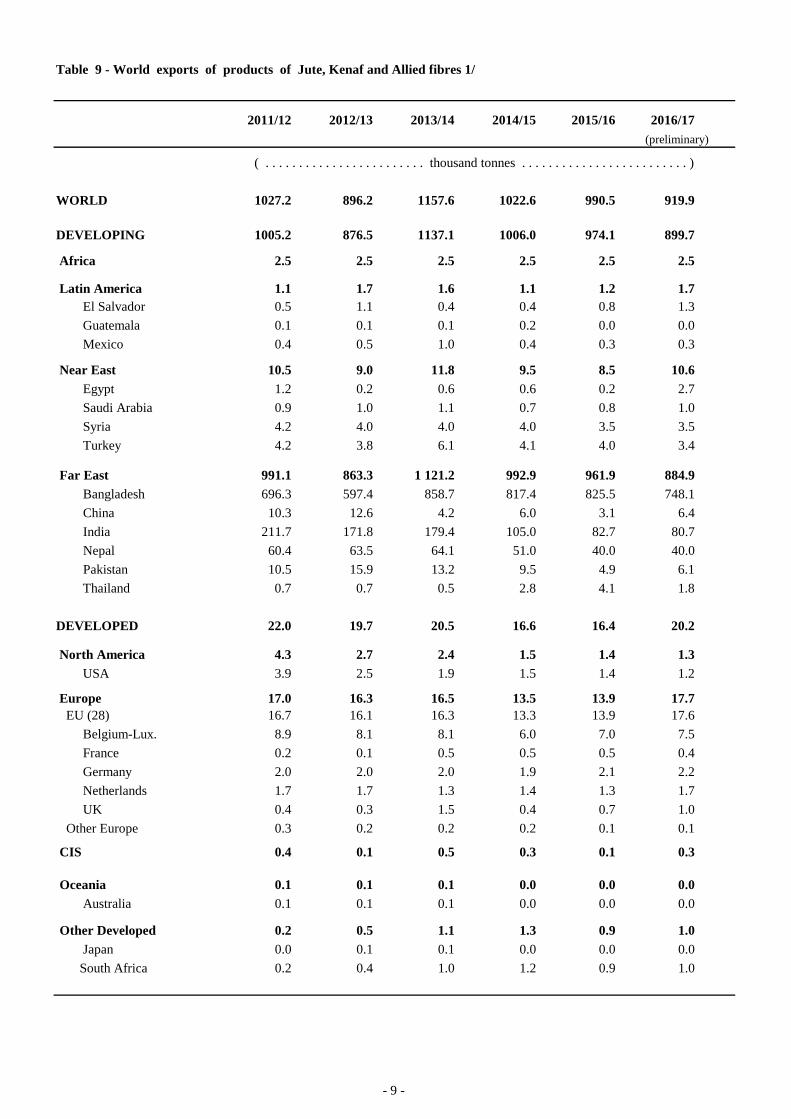
Table 9 - World exports of products of Jute, Kenaf and Allied fibres 1/
2011/12 2012/13 2013/14 2014/15 2015/16 2016/17
WORLD 1027.2 896.2 1157.6 1022.6 990.5 919.9
DEVELOPING 1005.2 876.5 1137.1 1006.0 974.1 899.7
Africa 2.5 2.5 2.5 2.5 2.5 2.5
Latin America 1.1 1.7 1.6 1.1 1.2 1.7 El Salvador 0.5 1.1 0.4 0.4 0.8 1.3 Guatemala 0.1 0.1 0.1 0.2 0.0 0.0 Mexico 0.4 0.5 1.0 0.4 0.3 0.3
Near East 10.5 9.0 11.8 9.5 8.5 10.6 Egypt 1.2 0.2 0.6 0.6 0.2 2.7 Saudi Arabia 0.9 1.0 1.1 0.7 0.8 1.0 Syria 4.2 4.0 4.0 4.0 3.5 3.5 Turkey 4.2 3.8 6.1 4.1 4.0 3.4
Far East 991.1 863.3 1 121.2 992.9 961.9 884.9 Bangladesh 696.3 597.4 858.7 817.4 825.5 748.1 China 10.3 12.6 4.2 6.0 3.1 6.4 India 211.7 171.8 179.4 105.0 82.7 80.7 Nepal 60.4 63.5 64.1 51.0 40.0 40.0 Pakistan 10.5 15.9 13.2 9.5 4.9 6.1 Thailand 0.7 0.7 0.5 2.8 4.1 1.8
DEVELOPED 22.0 19.7 20.5 16.6 16.4 20.2
North America 4.3 2.7 2.4 1.5 1.4 1.3 USA 3.9 2.5 1.9 1.5 1.4 1.2
Europe 17.0 16.3 16.5 13.5 13.9 17.7 EU (28) 16.7 16.1 16.3 13.3 13.9 17.6
Belgium-Lux. 8.9 8.1 8.1 6.0 7.0 7.5 France 0.2 0.1 0.5 0.5 0.5 0.4 Germany 2.0 2.0 2.0 1.9 2.1 2.2 Netherlands 1.7 1.7 1.3 1.4 1.3 1.7 UK 0.4 0.3 1.5 0.4 0.7 1.0
Other Europe 0.3 0.2 0.2 0.2 0.1 0.1
CIS 0.4 0.1 0.5 0.3 0.1 0.3
Oceania 0.1 0.1 0.1 0.0 0.0 0.0 Australia 0.1 0.1 0.1 0.0 0.0 0.0
Other Developed 0.2 0.5 1.1 1.3 0.9 1.0 Japan 0.0 0.1 0.1 0.0 0.0 0.0 South Africa 0.2 0.4 1.0 1.2 0.9 1.0
(preliminary)
( . . . . . . . . . . . . . . . . . . . . . . . . thousand tonnes . . . . . . . . . . . . . . . . . . . . . . . . . )
- 10 -
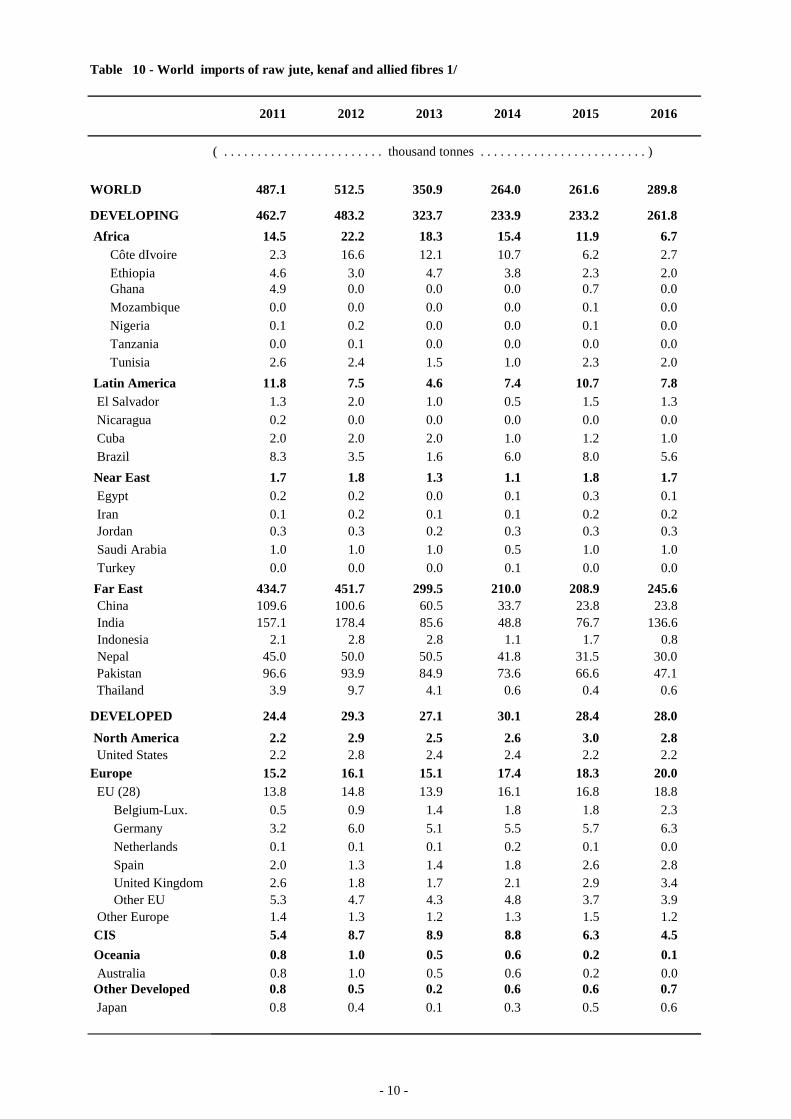
Table 10 - World imports of raw jute, kenaf and allied fibres 1/
2011 2012 2013 2014 2015 2016
( . . . . . . . . . . . . . . . . . . . . . . . . thousand tonnes . . . . . . . . . . . . . . . . . . . . . . . . . )
WORLD 487.1 512.5 350.9 264.0 261.6 289.8
DEVELOPING 462.7 483.2 323.7 233.9 233.2 261.8 Africa 14.5 22.2 18.3 15.4 11.9 6.7
Côte dIvoire 2.3 16.6 12.1 10.7 6.2 2.7Ethiopia 4.6 3.0 4.7 3.8 2.3 2.0Ghana 4.9 0.0 0.0 0.0 0.7 0.0Mozambique 0.0 0.0 0.0 0.0 0.1 0.0Nigeria 0.1 0.2 0.0 0.0 0.1 0.0Tanzania 0.0 0.1 0.0 0.0 0.0 0.0Tunisia 2.6 2.4 1.5 1.0 2.3 2.0
Latin America 11.8 7.5 4.6 7.4 10.7 7.8 El Salvador 1.3 2.0 1.0 0.5 1.5 1.3 Nicaragua 0.2 0.0 0.0 0.0 0.0 0.0 Cuba 2.0 2.0 2.0 1.0 1.2 1.0 Brazil 8.3 3.5 1.6 6.0 8.0 5.6 Near East 1.7 1.8 1.3 1.1 1.8 1.7 Egypt 0.2 0.2 0.0 0.1 0.3 0.1 Iran 0.1 0.2 0.1 0.1 0.2 0.2 Jordan 0.3 0.3 0.2 0.3 0.3 0.3 Saudi Arabia 1.0 1.0 1.0 0.5 1.0 1.0 Turkey 0.0 0.0 0.0 0.1 0.0 0.0 Far East 434.7 451.7 299.5 210.0 208.9 245.6 China 109.6 100.6 60.5 33.7 23.8 23.8 India 157.1 178.4 85.6 48.8 76.7 136.6 Indonesia 2.1 2.8 2.8 1.1 1.7 0.8 Nepal 45.0 50.0 50.5 41.8 31.5 30.0 Pakistan 96.6 93.9 84.9 73.6 66.6 47.1 Thailand 3.9 9.7 4.1 0.6 0.4 0.6
DEVELOPED 24.4 29.3 27.1 30.1 28.4 28.0 North America 2.2 2.9 2.5 2.6 3.0 2.8 United States 2.2 2.8 2.4 2.4 2.2 2.2Europe 15.2 16.1 15.1 17.4 18.3 20.0 EU (28) 13.8 14.8 13.9 16.1 16.8 18.8
Belgium-Lux. 0.5 0.9 1.4 1.8 1.8 2.3 Germany 3.2 6.0 5.1 5.5 5.7 6.3 Netherlands 0.1 0.1 0.1 0.2 0.1 0.0 Spain 2.0 1.3 1.4 1.8 2.6 2.8 United Kingdom 2.6 1.8 1.7 2.1 2.9 3.4 Other EU 5.3 4.7 4.3 4.8 3.7 3.9
Other Europe 1.4 1.3 1.2 1.3 1.5 1.2 CIS 5.4 8.7 8.9 8.8 6.3 4.5 Oceania 0.8 1.0 0.5 0.6 0.2 0.1 Australia 0.8 1.0 0.5 0.6 0.2 0.0 Other Developed 0.8 0.5 0.2 0.6 0.6 0.7 Japan 0.8 0.4 0.1 0.3 0.5 0.6
- 11 -
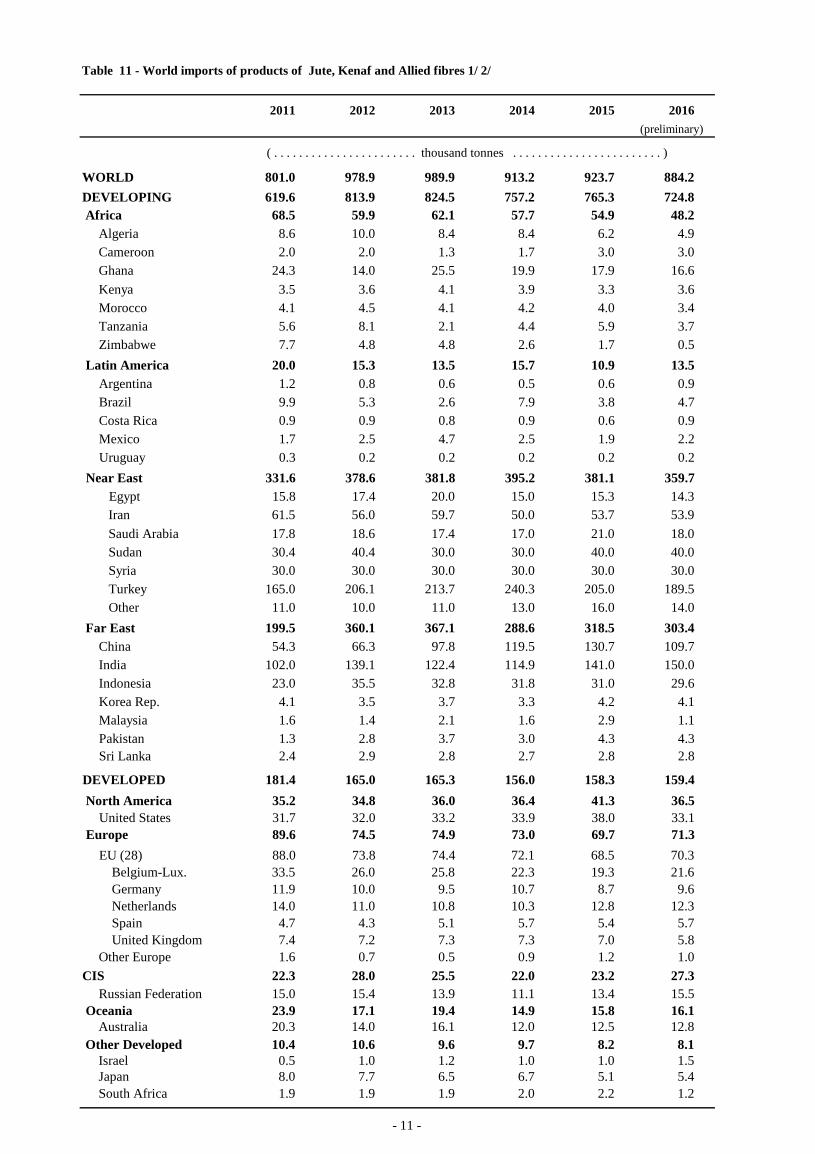
Table 11 - World imports of products of Jute, Kenaf and Allied fibres 1/ 2/
2011 2012 2013 2014 2015 2016 (preliminary)
WORLD 801.0 978.9 989.9 913.2 923.7 884.2DEVELOPING 619.6 813.9 824.5 757.2 765.3 724.8 Africa 68.5 59.9 62.1 57.7 54.9 48.2
Algeria 8.6 10.0 8.4 8.4 6.2 4.9 Cameroon 2.0 2.0 1.3 1.7 3.0 3.0 Ghana 24.3 14.0 25.5 19.9 17.9 16.6 Kenya 3.5 3.6 4.1 3.9 3.3 3.6 Morocco 4.1 4.5 4.1 4.2 4.0 3.4 Tanzania 5.6 8.1 2.1 4.4 5.9 3.7 Zimbabwe 7.7 4.8 4.8 2.6 1.7 0.5
Latin America 20.0 15.3 13.5 15.7 10.9 13.5 Argentina 1.2 0.8 0.6 0.5 0.6 0.9 Brazil 9.9 5.3 2.6 7.9 3.8 4.7 Costa Rica 0.9 0.9 0.8 0.9 0.6 0.9 Mexico 1.7 2.5 4.7 2.5 1.9 2.2 Uruguay 0.3 0.2 0.2 0.2 0.2 0.2
Near East 331.6 378.6 381.8 395.2 381.1 359.7 Egypt 15.8 17.4 20.0 15.0 15.3 14.3 Iran 61.5 56.0 59.7 50.0 53.7 53.9 Saudi Arabia 17.8 18.6 17.4 17.0 21.0 18.0 Sudan 30.4 40.4 30.0 30.0 40.0 40.0 Syria 30.0 30.0 30.0 30.0 30.0 30.0 Turkey 165.0 206.1 213.7 240.3 205.0 189.5 Other 11.0 10.0 11.0 13.0 16.0 14.0
Far East 199.5 360.1 367.1 288.6 318.5 303.4 China 54.3 66.3 97.8 119.5 130.7 109.7 India 102.0 139.1 122.4 114.9 141.0 150.0 Indonesia 23.0 35.5 32.8 31.8 31.0 29.6 Korea Rep. 4.1 3.5 3.7 3.3 4.2 4.1 Malaysia 1.6 1.4 2.1 1.6 2.9 1.1 Pakistan 1.3 2.8 3.7 3.0 4.3 4.3 Sri Lanka 2.4 2.9 2.8 2.7 2.8 2.8
DEVELOPED 181.4 165.0 165.3 156.0 158.3 159.4 North America 35.2 34.8 36.0 36.4 41.3 36.5
United States 31.7 32.0 33.2 33.9 38.0 33.1 Europe 89.6 74.5 74.9 73.0 69.7 71.3
EU (28) 88.0 73.8 74.4 72.1 68.5 70.3 Belgium-Lux. 33.5 26.0 25.8 22.3 19.3 21.6 Germany 11.9 10.0 9.5 10.7 8.7 9.6 Netherlands 14.0 11.0 10.8 10.3 12.8 12.3 Spain 4.7 4.3 5.1 5.7 5.4 5.7 United Kingdom 7.4 7.2 7.3 7.3 7.0 5.8
Other Europe 1.6 0.7 0.5 0.9 1.2 1.0CIS 22.3 28.0 25.5 22.0 23.2 27.3
Russian Federation 15.0 15.4 13.9 11.1 13.4 15.5 Oceania 23.9 17.1 19.4 14.9 15.8 16.1
Australia 20.3 14.0 16.1 12.0 12.5 12.8 Other Developed 10.4 10.6 9.6 9.7 8.2 8.1
Israel 0.5 1.0 1.2 1.0 1.0 1.5 Japan 8.0 7.7 6.5 6.7 5.1 5.4 South Africa 1.9 1.9 1.9 2.0 2.2 1.2
( . . . . . . . . . . . . . . . . . . . . . . . thousand tonnes . . . . . . . . . . . . . . . . . . . . . . . . )
- 12 -
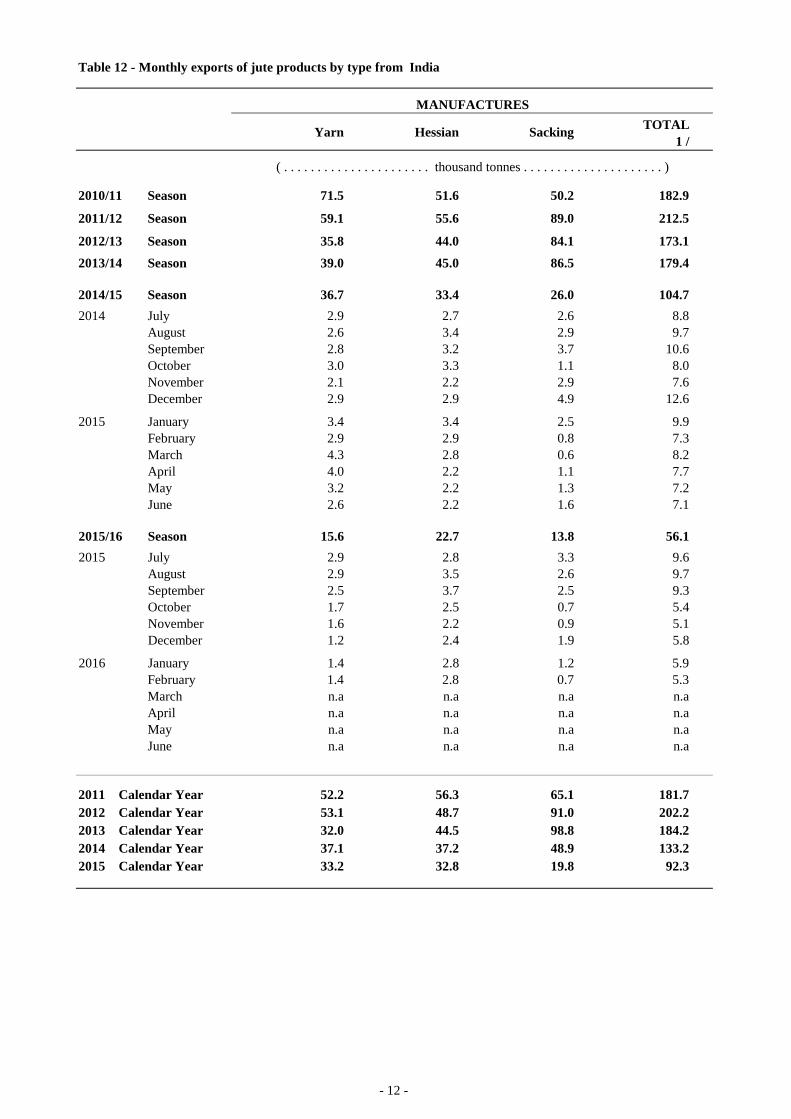
Table 12 - Monthly exports of jute products by type from India
Yarn Hessian Sacking TOTAL 1 /
2010/11 Season 71.5 51.6 50.2 182.9
2011/12 Season 59.1 55.6 89.0 212.5
2012/13 Season 35.8 44.0 84.1 173.12013/14 Season 39.0 45.0 86.5 179.4
2014/15 Season 36.7 33.4 26.0 104.72014 July 2.9 2.7 2.6 8.8
August 2.6 3.4 2.9 9.7September 2.8 3.2 3.7 10.6October 3.0 3.3 1.1 8.0November 2.1 2.2 2.9 7.6December 2.9 2.9 4.9 12.6
2015 January 3.4 3.4 2.5 9.9February 2.9 2.9 0.8 7.3March 4.3 2.8 0.6 8.2April 4.0 2.2 1.1 7.7May 3.2 2.2 1.3 7.2June 2.6 2.2 1.6 7.1
2015/16 Season 15.6 22.7 13.8 56.12015 July 2.9 2.8 3.3 9.6
August 2.9 3.5 2.6 9.7September 2.5 3.7 2.5 9.3October 1.7 2.5 0.7 5.4November 1.6 2.2 0.9 5.1December 1.2 2.4 1.9 5.8
2016 January 1.4 2.8 1.2 5.9February 1.4 2.8 0.7 5.3March n.a n.a n.a n.aApril n.a n.a n.a n.aMay n.a n.a n.a n.aJune n.a n.a n.a n.a
2011 Calendar Year 52.2 56.3 65.1 181.72012 Calendar Year 53.1 48.7 91.0 202.22013 Calendar Year 32.0 44.5 98.8 184.22014 Calendar Year 37.1 37.2 48.9 133.22015 Calendar Year 33.2 32.8 19.8 92.3
( . . . . . . . . . . . . . . . . . . . . . . thousand tonnes . . . . . . . . . . . . . . . . . . . . . )
MANUFACTURES
- 13 -
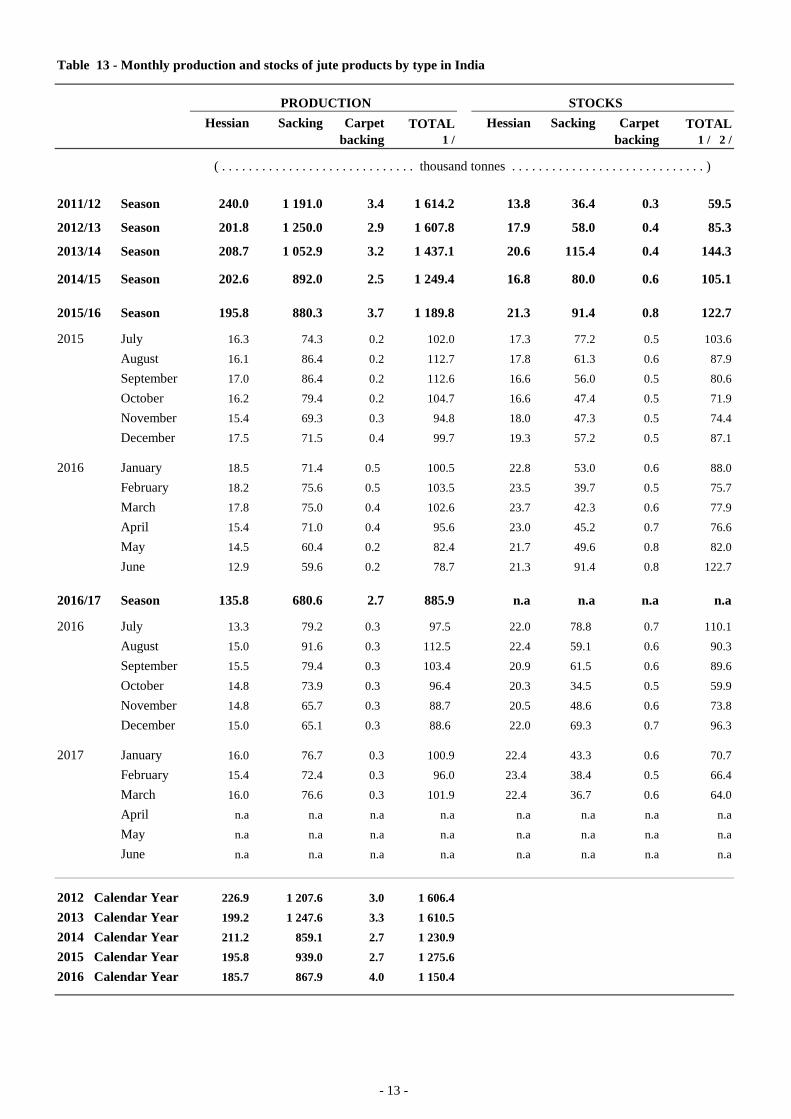
Table 13 - Monthly production and stocks of jute products by type in India
PRODUCTION STOCKSHessian Sacking Carpet
backingTOTAL
1 / Hessian Sacking Carpet
backingTOTAL
1 / 2 /
2011/12 Season 240.0 1 191.0 3.4 1 614.2 13.8 36.4 0.3 59.5
2012/13 Season 201.8 1 250.0 2.9 1 607.8 17.9 58.0 0.4 85.3
2013/14 Season 208.7 1 052.9 3.2 1 437.1 20.6 115.4 0.4 144.3
2014/15 Season 202.6 892.0 2.5 1 249.4 16.8 80.0 0.6 105.1
2015/16 Season 195.8 880.3 3.7 1 189.8 21.3 91.4 0.8 122.7
2015 July 16.3 74.3 0.2 102.0 17.3 77.2 0.5 103.6
August 16.1 86.4 0.2 112.7 17.8 61.3 0.6 87.9
September 17.0 86.4 0.2 112.6 16.6 56.0 0.5 80.6
October 16.2 79.4 0.2 104.7 16.6 47.4 0.5 71.9
November 15.4 69.3 0.3 94.8 18.0 47.3 0.5 74.4
December 17.5 71.5 0.4 99.7 19.3 57.2 0.5 87.1
2016 January 18.5 71.4 0.5 100.5 22.8 53.0 0.6 88.0
February 18.2 75.6 0.5 103.5 23.5 39.7 0.5 75.7
March 17.8 75.0 0.4 102.6 23.7 42.3 0.6 77.9
April 15.4 71.0 0.4 95.6 23.0 45.2 0.7 76.6
May 14.5 60.4 0.2 82.4 21.7 49.6 0.8 82.0
June 12.9 59.6 0.2 78.7 21.3 91.4 0.8 122.7
2016/17 Season 135.8 680.6 2.7 885.9 n.a n.a n.a n.a
2016 July 13.3 79.2 0.3 97.5 22.0 78.8 0.7 110.1
August 15.0 91.6 0.3 112.5 22.4 59.1 0.6 90.3
September 15.5 79.4 0.3 103.4 20.9 61.5 0.6 89.6
October 14.8 73.9 0.3 96.4 20.3 34.5 0.5 59.9
November 14.8 65.7 0.3 88.7 20.5 48.6 0.6 73.8
December 15.0 65.1 0.3 88.6 22.0 69.3 0.7 96.3
2017 January 16.0 76.7 0.3 100.9 22.4 43.3 0.6 70.7
February 15.4 72.4 0.3 96.0 23.4 38.4 0.5 66.4
March 16.0 76.6 0.3 101.9 22.4 36.7 0.6 64.0
April n.a n.a n.a n.a n.a n.a n.a n.a
May n.a n.a n.a n.a n.a n.a n.a n.a
June n.a n.a n.a n.a n.a n.a n.a n.a
2012 Calendar Year 226.9 1 207.6 3.0 1 606.42013 Calendar Year 199.2 1 247.6 3.3 1 610.52014 Calendar Year 211.2 859.1 2.7 1 230.92015 Calendar Year 195.8 939.0 2.7 1 275.62016 Calendar Year 185.7 867.9 4.0 1 150.4
( . . . . . . . . . . . . . . . . . . . . . . . . . . . . . thousand tonnes . . . . . . . . . . . . . . . . . . . . . . . . . . . . . )
- 14 -
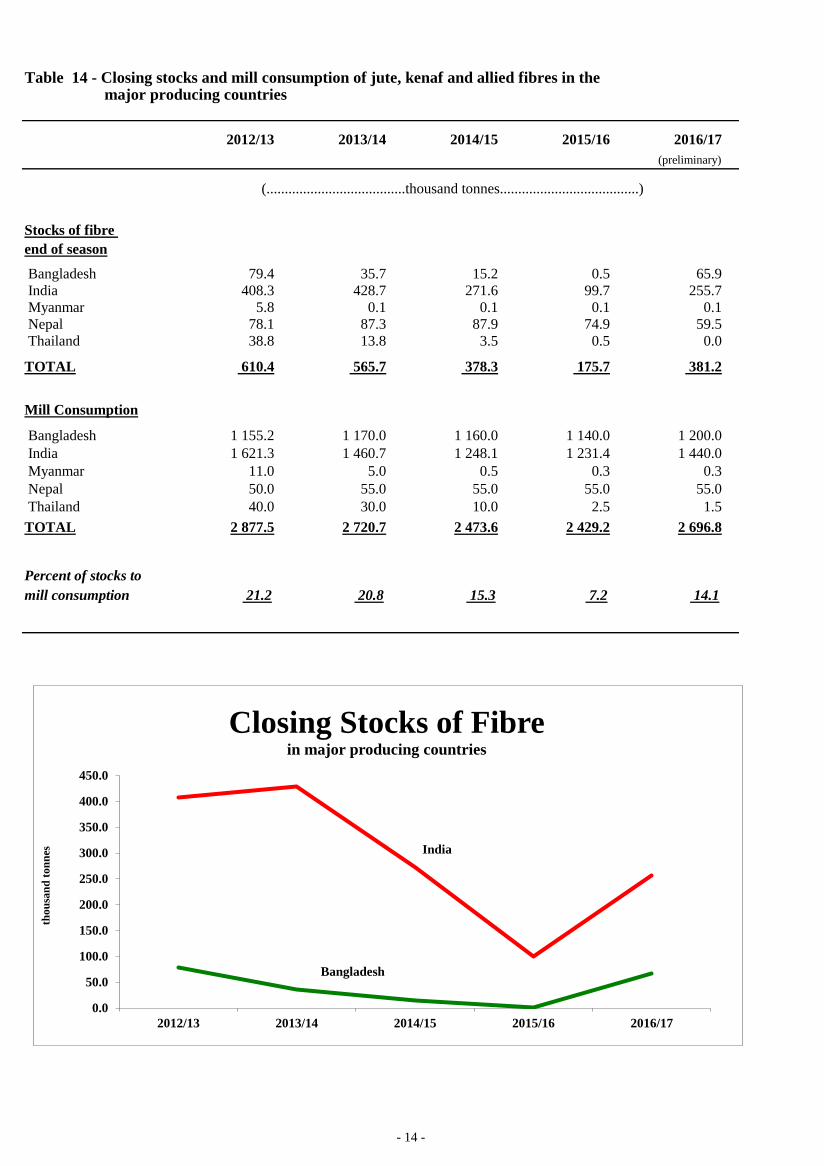
Table 14 - Closing stocks and mill consumption of jute, kenaf and allied fibres in the major producing countries
2012/13 2013/14 2014/15 2015/16 2016/17
Stocks of fibre end of season
Bangladesh 79.4 35.7 15.2 0.5 65.9 India 408.3 428.7 271.6 99.7 255.7 Myanmar 5.8 0.1 0.1 0.1 0.1 Nepal 78.1 87.3 87.9 74.9 59.5 Thailand 38.8 13.8 3.5 0.5 0.0
TOTAL 610.4 565.7 378.3 175.7 381.2
Mill Consumption
Bangladesh 1 155.2 1 170.0 1 160.0 1 140.0 1 200.0 India 1 621.3 1 460.7 1 248.1 1 231.4 1 440.0 Myanmar 11.0 5.0 0.5 0.3 0.3 Nepal 50.0 55.0 55.0 55.0 55.0 Thailand 40.0 30.0 10.0 2.5 1.5TOTAL 2 877.5 2 720.7 2 473.6 2 429.2 2 696.8
Percent of stocks tomill consumption 21.2 20.8 15.3 7.2 14.1
(......................................thousand tonnes......................................)
(preliminary)
0.0
50.0
100.0
150.0
200.0
250.0
300.0
350.0
400.0
450.0
2012/13 2013/14 2014/15 2015/16 2016/17
thou
sand
tonn
es
Closing Stocks of Fibrein major producing countries
India
Bangladesh
- 15 -
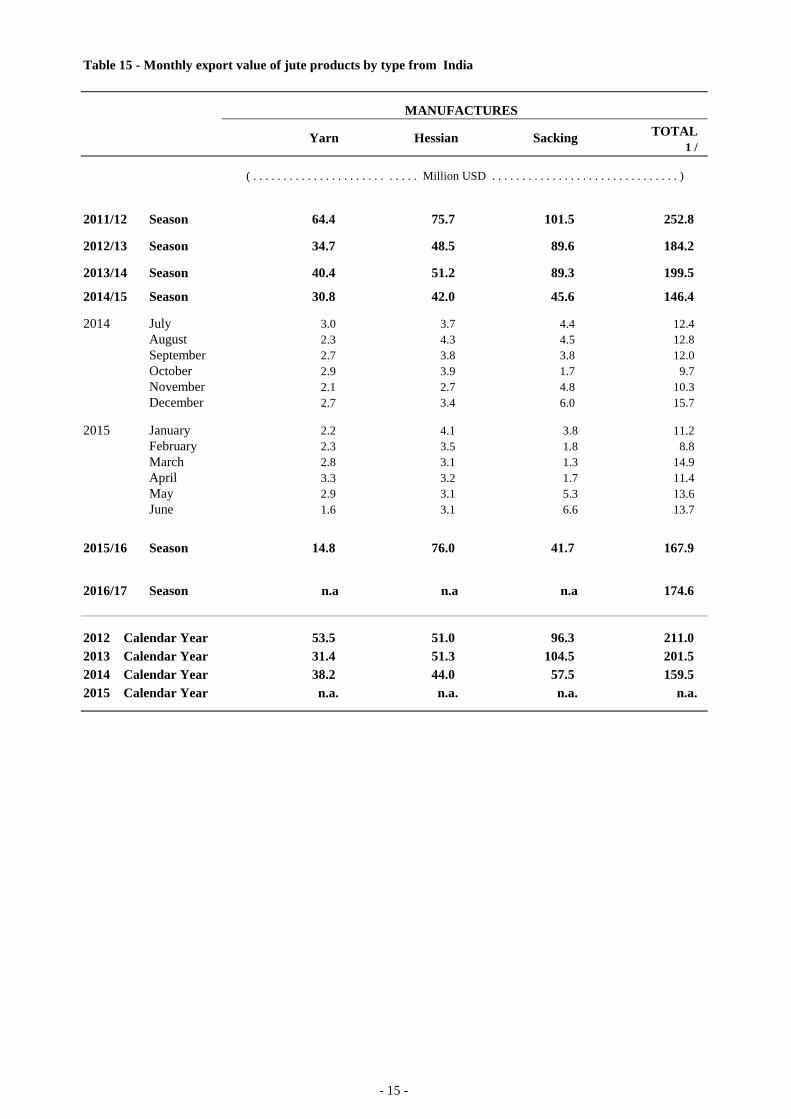
Table 15 - Monthly export value of jute products by type from India
Yarn Hessian Sacking TOTAL1 /
2011/12 Season 64.4 75.7 101.5 252.8
2012/13 Season 34.7 48.5 89.6 184.2
2013/14 Season 40.4 51.2 89.3 199.5
2014/15 Season 30.8 42.0 45.6 146.4
2014 July 3.0 3.7 4.4 12.4 August 2.3 4.3 4.5 12.8 September 2.7 3.8 3.8 12.0 October 2.9 3.9 1.7 9.7 November 2.1 2.7 4.8 10.3 December 2.7 3.4 6.0 15.7
2015 January 2.2 4.1 3.8 11.2 February 2.3 3.5 1.8 8.8 March 2.8 3.1 1.3 14.9 April 3.3 3.2 1.7 11.4 May 2.9 3.1 5.3 13.6 June 1.6 3.1 6.6 13.7
2015/16 Season 14.8 76.0 41.7 167.9
2016/17 Season n.a n.a n.a 174.6
2012 Calendar Year 53.5 51.0 96.3 211.0 2013 Calendar Year 31.4 51.3 104.5 201.5 2014 Calendar Year 38.2 44.0 57.5 159.5 2015 Calendar Year n.a. n.a. n.a. n.a.
( . . . . . . . . . . . . . . . . . . . . . . . . . . . Million USD . . . . . . . . . . . . . . . . . . . . . . . . . . . . . . . )
MANUFACTURES
- 16 -
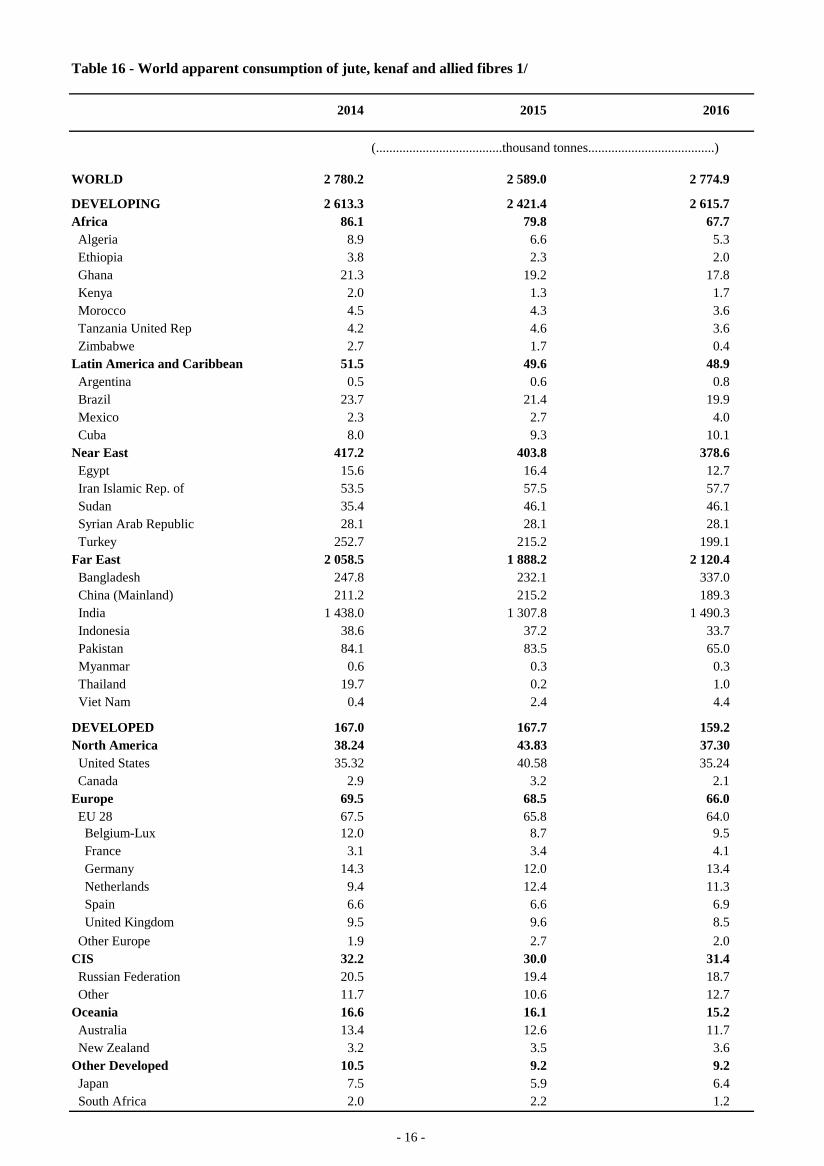
Table 16 - World apparent consumption of jute, kenaf and allied fibres 1/
2014 2015 2016
WORLD 2 780.2 2 589.0 2 774.9
DEVELOPING 2 613.3 2 421.4 2 615.7Africa 86.1 79.8 67.7 Algeria 8.9 6.6 5.3 Ethiopia 3.8 2.3 2.0 Ghana 21.3 19.2 17.8 Kenya 2.0 1.3 1.7 Morocco 4.5 4.3 3.6 Tanzania United Rep 4.2 4.6 3.6 Zimbabwe 2.7 1.7 0.4Latin America and Caribbean 51.5 49.6 48.9 Argentina 0.5 0.6 0.8 Brazil 23.7 21.4 19.9 Mexico 2.3 2.7 4.0 Cuba 8.0 9.3 10.1Near East 417.2 403.8 378.6 Egypt 15.6 16.4 12.7 Iran Islamic Rep. of 53.5 57.5 57.7 Sudan 35.4 46.1 46.1 Syrian Arab Republic 28.1 28.1 28.1 Turkey 252.7 215.2 199.1Far East 2 058.5 1 888.2 2 120.4 Bangladesh 247.8 232.1 337.0 China (Mainland) 211.2 215.2 189.3 India 1 438.0 1 307.8 1 490.3 Indonesia 38.6 37.2 33.7 Pakistan 84.1 83.5 65.0 Myanmar 0.6 0.3 0.3 Thailand 19.7 0.2 1.0 Viet Nam 0.4 2.4 4.4
DEVELOPED 167.0 167.7 159.2North America 38.24 43.83 37.30 United States 35.32 40.58 35.24 Canada 2.9 3.2 2.1Europe 69.5 68.5 66.0 EU 28 67.5 65.8 64.0 Belgium-Lux 12.0 8.7 9.5 France 3.1 3.4 4.1 Germany 14.3 12.0 13.4 Netherlands 9.4 12.4 11.3 Spain 6.6 6.6 6.9 United Kingdom 9.5 9.6 8.5 Other Europe 1.9 2.7 2.0CIS 32.2 30.0 31.4 Russian Federation 20.5 19.4 18.7 Other 11.7 10.6 12.7Oceania 16.6 16.1 15.2 Australia 13.4 12.6 11.7 New Zealand 3.2 3.5 3.6Other Developed 10.5 9.2 9.2 Japan 7.5 5.9 6.4 South Africa 2.0 2.2 1.2
(......................................thousand tonnes......................................)
- 17 -
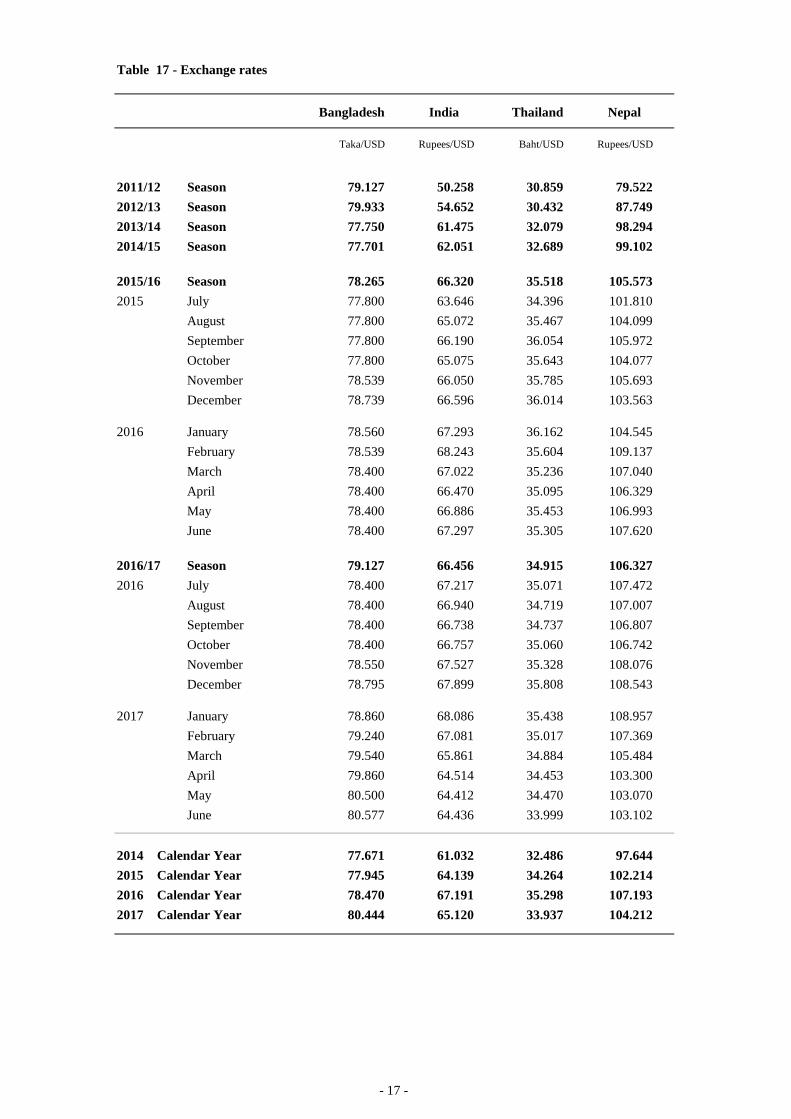
Table 17 - Exchange rates
Bangladesh India Thailand Nepal
Taka/USD Rupees/USD Baht/USD Rupees/USD
2011/12 Season 79.127 50.258 30.859 79.5222012/13 Season 79.933 54.652 30.432 87.7492013/14 Season 77.750 61.475 32.079 98.2942014/15 Season 77.701 62.051 32.689 99.102
2015/16 Season 78.265 66.320 35.518 105.5732015 July 77.800 63.646 34.396 101.810
August 77.800 65.072 35.467 104.099September 77.800 66.190 36.054 105.972October 77.800 65.075 35.643 104.077November 78.539 66.050 35.785 105.693December 78.739 66.596 36.014 103.563
2016 January 78.560 67.293 36.162 104.545February 78.539 68.243 35.604 109.137March 78.400 67.022 35.236 107.040April 78.400 66.470 35.095 106.329May 78.400 66.886 35.453 106.993June 78.400 67.297 35.305 107.620
2016/17 Season 79.127 66.456 34.915 106.3272016 July 78.400 67.217 35.071 107.472
August 78.400 66.940 34.719 107.007September 78.400 66.738 34.737 106.807October 78.400 66.757 35.060 106.742November 78.550 67.527 35.328 108.076December 78.795 67.899 35.808 108.543
2017 January 78.860 68.086 35.438 108.957February 79.240 67.081 35.017 107.369March 79.540 65.861 34.884 105.484April 79.860 64.514 34.453 103.300May 80.500 64.412 34.470 103.070June 80.577 64.436 33.999 103.102
2014 Calendar Year 77.671 61.032 32.486 97.6442015 Calendar Year 77.945 64.139 34.264 102.2142016 Calendar Year 78.470 67.191 35.298 107.1932017 Calendar Year 80.444 65.120 33.937 104.212
- 18 -
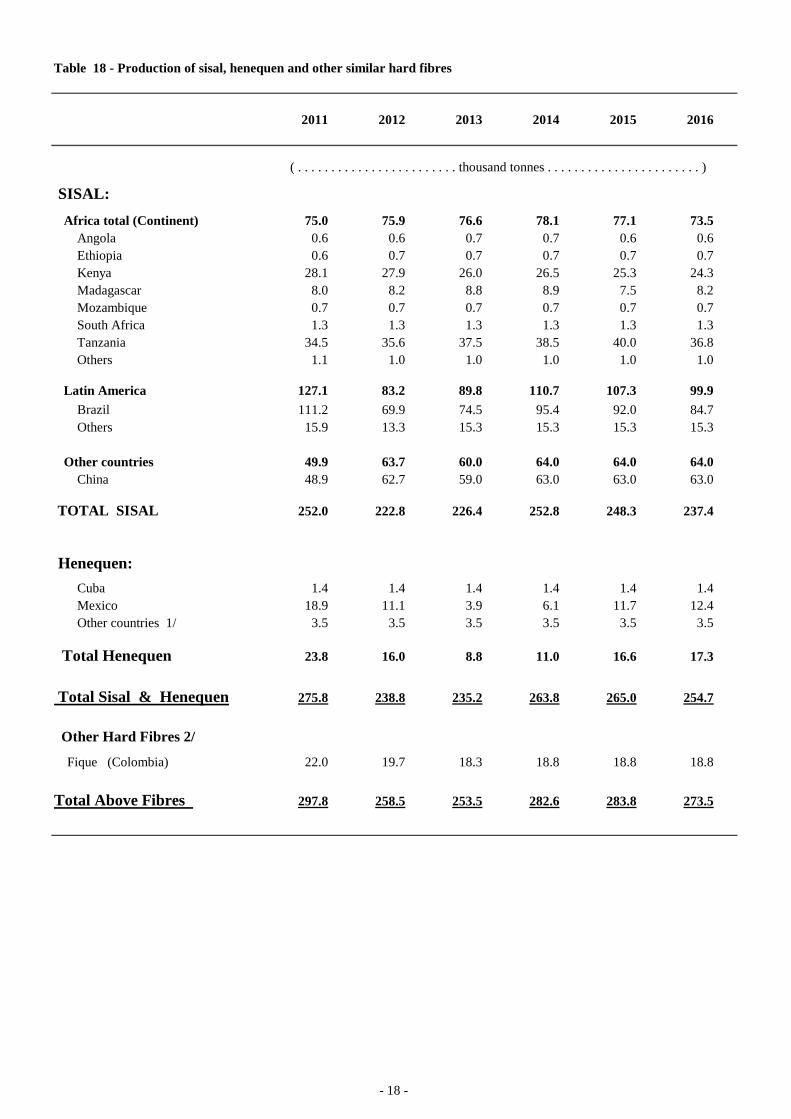
Table 18 - Production of sisal, henequen and other similar hard fibres
2011 2012 2013 2014 2015 2016
SISAL: Africa total (Continent) 75.0 75.9 76.6 78.1 77.1 73.5
Angola 0.6 0.6 0.7 0.7 0.6 0.6 Ethiopia 0.6 0.7 0.7 0.7 0.7 0.7 Kenya 28.1 27.9 26.0 26.5 25.3 24.3 Madagascar 8.0 8.2 8.8 8.9 7.5 8.2 Mozambique 0.7 0.7 0.7 0.7 0.7 0.7 South Africa 1.3 1.3 1.3 1.3 1.3 1.3 Tanzania 34.5 35.6 37.5 38.5 40.0 36.8 Others 1.1 1.0 1.0 1.0 1.0 1.0
Latin America 127.1 83.2 89.8 110.7 107.3 99.9 Brazil 111.2 69.9 74.5 95.4 92.0 84.7 Others 15.9 13.3 15.3 15.3 15.3 15.3
Other countries 49.9 63.7 60.0 64.0 64.0 64.0 China 48.9 62.7 59.0 63.0 63.0 63.0
TOTAL SISAL 252.0 222.8 226.4 252.8 248.3 237.4
Henequen: Cuba 1.4 1.4 1.4 1.4 1.4 1.4 Mexico 18.9 11.1 3.9 6.1 11.7 12.4 Other countries 1/ 3.5 3.5 3.5 3.5 3.5 3.5
Total Henequen 23.8 16.0 8.8 11.0 16.6 17.3
Total Sisal & Henequen 275.8 238.8 235.2 263.8 265.0 254.7
Other Hard Fibres 2/
Fique (Colombia) 22.0 19.7 18.3 18.8 18.8 18.8
Total Above Fibres 297.8 258.5 253.5 282.6 283.8 273.5
( . . . . . . . . . . . . . . . . . . . . . . . . thousand tonnes . . . . . . . . . . . . . . . . . . . . . . . )
- 19 -
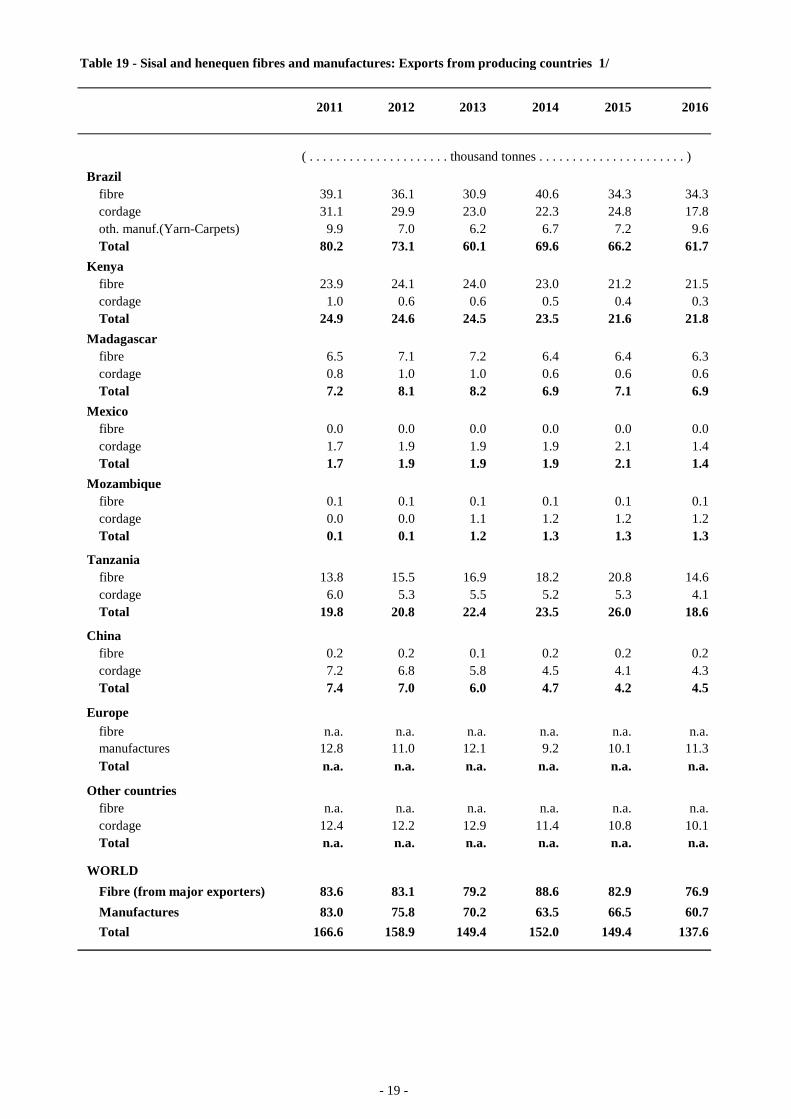
Table 19 - Sisal and henequen fibres and manufactures: Exports from producing countries 1/
2011 2012 2013 2014 2015 2016
Brazilfibre 39.1 36.1 30.9 40.6 34.3 34.3cordage 31.1 29.9 23.0 22.3 24.8 17.8oth. manuf.(Yarn-Carpets) 9.9 7.0 6.2 6.7 7.2 9.6Total 80.2 73.1 60.1 69.6 66.2 61.7
Kenyafibre 23.9 24.1 24.0 23.0 21.2 21.5cordage 1.0 0.6 0.6 0.5 0.4 0.3Total 24.9 24.6 24.5 23.5 21.6 21.8
Madagascarfibre 6.5 7.1 7.2 6.4 6.4 6.3cordage 0.8 1.0 1.0 0.6 0.6 0.6Total 7.2 8.1 8.2 6.9 7.1 6.9
Mexicofibre 0.0 0.0 0.0 0.0 0.0 0.0cordage 1.7 1.9 1.9 1.9 2.1 1.4Total 1.7 1.9 1.9 1.9 2.1 1.4
Mozambiquefibre 0.1 0.1 0.1 0.1 0.1 0.1cordage 0.0 0.0 1.1 1.2 1.2 1.2Total 0.1 0.1 1.2 1.3 1.3 1.3
Tanzaniafibre 13.8 15.5 16.9 18.2 20.8 14.6cordage 6.0 5.3 5.5 5.2 5.3 4.1Total 19.8 20.8 22.4 23.5 26.0 18.6
Chinafibre 0.2 0.2 0.1 0.2 0.2 0.2cordage 7.2 6.8 5.8 4.5 4.1 4.3Total 7.4 7.0 6.0 4.7 4.2 4.5
Europefibre n.a. n.a. n.a. n.a. n.a. n.a.manufactures 12.8 11.0 12.1 9.2 10.1 11.3Total n.a. n.a. n.a. n.a. n.a. n.a.
Other countries fibre n.a. n.a. n.a. n.a. n.a. n.a.cordage 12.4 12.2 12.9 11.4 10.8 10.1Total n.a. n.a. n.a. n.a. n.a. n.a.
WORLDFibre (from major exporters) 83.6 83.1 79.2 88.6 82.9 76.9Manufactures 83.0 75.8 70.2 63.5 66.5 60.7Total 166.6 158.9 149.4 152.0 149.4 137.6
( . . . . . . . . . . . . . . . . . . . . . thousand tonnes . . . . . . . . . . . . . . . . . . . . . . )
- 20 -
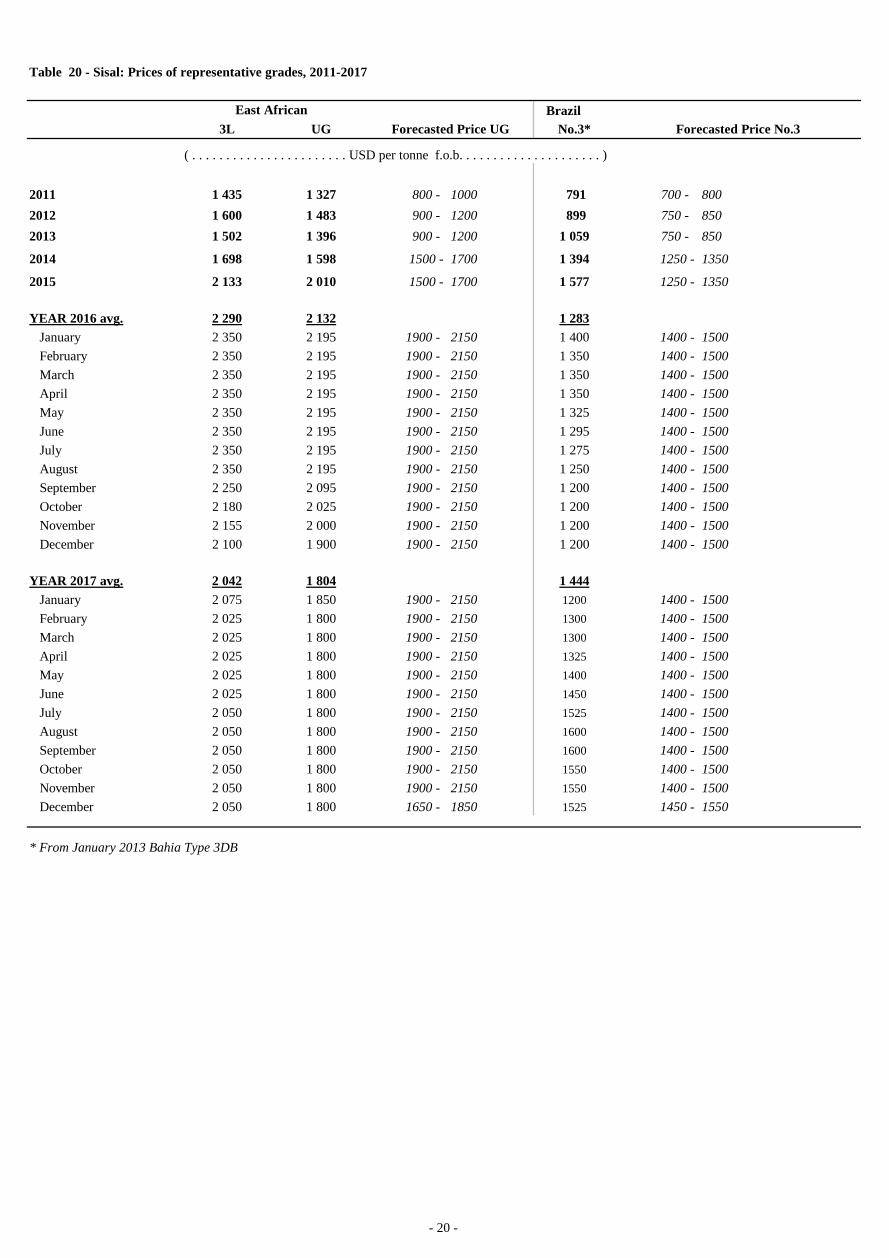
Table 20 - Sisal: Prices of representative grades, 2011-2017
Brazil3L UG Forecasted Price UG No.3* Forecasted Price No.3
( . . . . . . . . . . . . . . . . . . . . . . . USD per tonne f.o.b. . . . . . . . . . . . . . . . . . . . . )
2011 1 435 1 327 800 - 1000 791 700 - 8002012 1 600 1 483 900 - 1200 899 750 - 8502013 1 502 1 396 900 - 1200 1 059 750 - 850
2014 1 698 1 598 1500 - 1700 1 394 1250 - 1350
2015 2 133 2 010 1500 - 1700 1 577 1250 - 1350
YEAR 2016 avg. 2 290 2 132 1 283January 2 350 2 195 1900 - 2150 1 400 1400 - 1500February 2 350 2 195 1900 - 2150 1 350 1400 - 1500March 2 350 2 195 1900 - 2150 1 350 1400 - 1500April 2 350 2 195 1900 - 2150 1 350 1400 - 1500May 2 350 2 195 1900 - 2150 1 325 1400 - 1500June 2 350 2 195 1900 - 2150 1 295 1400 - 1500July 2 350 2 195 1900 - 2150 1 275 1400 - 1500August 2 350 2 195 1900 - 2150 1 250 1400 - 1500September 2 250 2 095 1900 - 2150 1 200 1400 - 1500October 2 180 2 025 1900 - 2150 1 200 1400 - 1500November 2 155 2 000 1900 - 2150 1 200 1400 - 1500December 2 100 1 900 1900 - 2150 1 200 1400 - 1500
YEAR 2017 avg. 2 042 1 804 1 444January 2 075 1 850 1900 - 2150 1200 1400 - 1500February 2 025 1 800 1900 - 2150 1300 1400 - 1500March 2 025 1 800 1900 - 2150 1300 1400 - 1500April 2 025 1 800 1900 - 2150 1325 1400 - 1500May 2 025 1 800 1900 - 2150 1400 1400 - 1500June 2 025 1 800 1900 - 2150 1450 1400 - 1500July 2 050 1 800 1900 - 2150 1525 1400 - 1500August 2 050 1 800 1900 - 2150 1600 1400 - 1500September 2 050 1 800 1900 - 2150 1600 1400 - 1500October 2 050 1 800 1900 - 2150 1550 1400 - 1500November 2 050 1 800 1900 - 2150 1550 1400 - 1500December 2 050 1 800 1650 - 1850 1525 1450 - 1550
* From January 2013 Bahia Type 3DB
East African
- 21 -
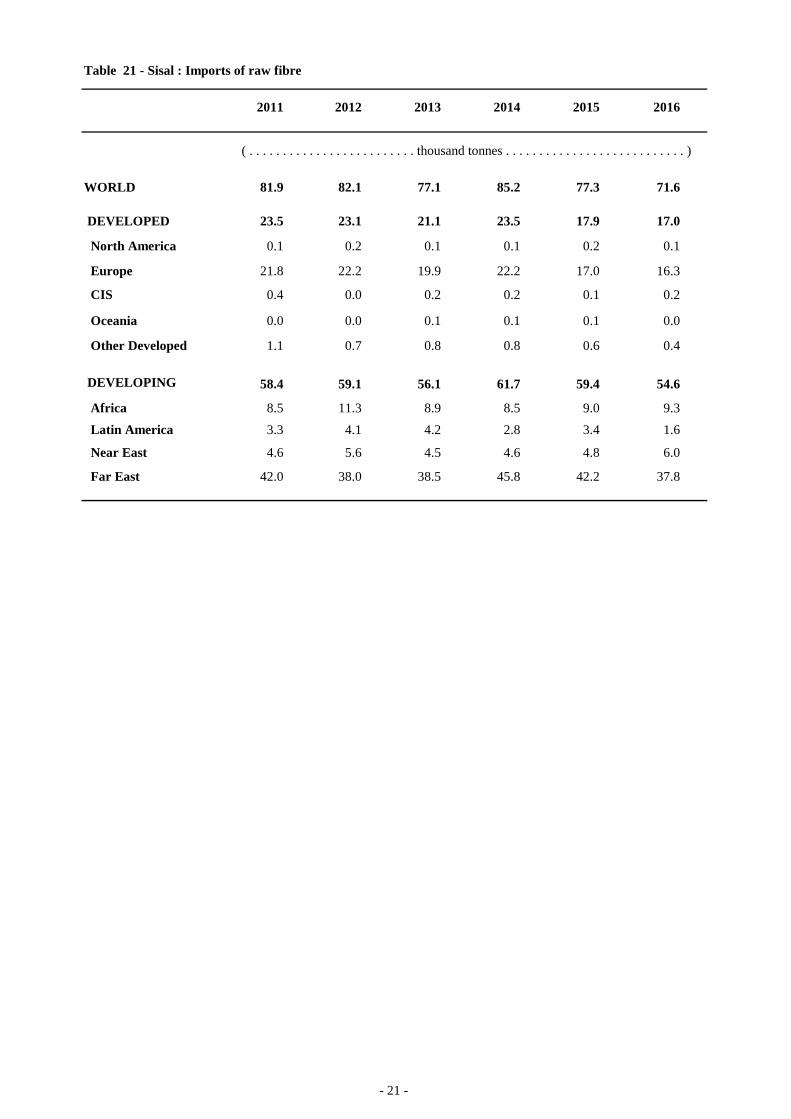
Table 21 - Sisal : Imports of raw fibre
2011 2012 2013 2014 2015 2016
WORLD 81.9 82.1 77.1 85.2 77.3 71.6
DEVELOPED 23.5 23.1 21.1 23.5 17.9 17.0
North America 0.1 0.2 0.1 0.1 0.2 0.1
Europe 21.8 22.2 19.9 22.2 17.0 16.3
CIS 0.4 0.0 0.2 0.2 0.1 0.2
Oceania 0.0 0.0 0.1 0.1 0.1 0.0
Other Developed 1.1 0.7 0.8 0.8 0.6 0.4
DEVELOPING 58.4 59.1 56.1 61.7 59.4 54.6
Africa 8.5 11.3 8.9 8.5 9.0 9.3 Latin America 3.3 4.1 4.2 2.8 3.4 1.6
Near East 4.6 5.6 4.5 4.6 4.8 6.0
Far East 42.0 38.0 38.5 45.8 42.2 37.8
( . . . . . . . . . . . . . . . . . . . . . . . . . thousand tonnes . . . . . . . . . . . . . . . . . . . . . . . . . . . )
- 22 -
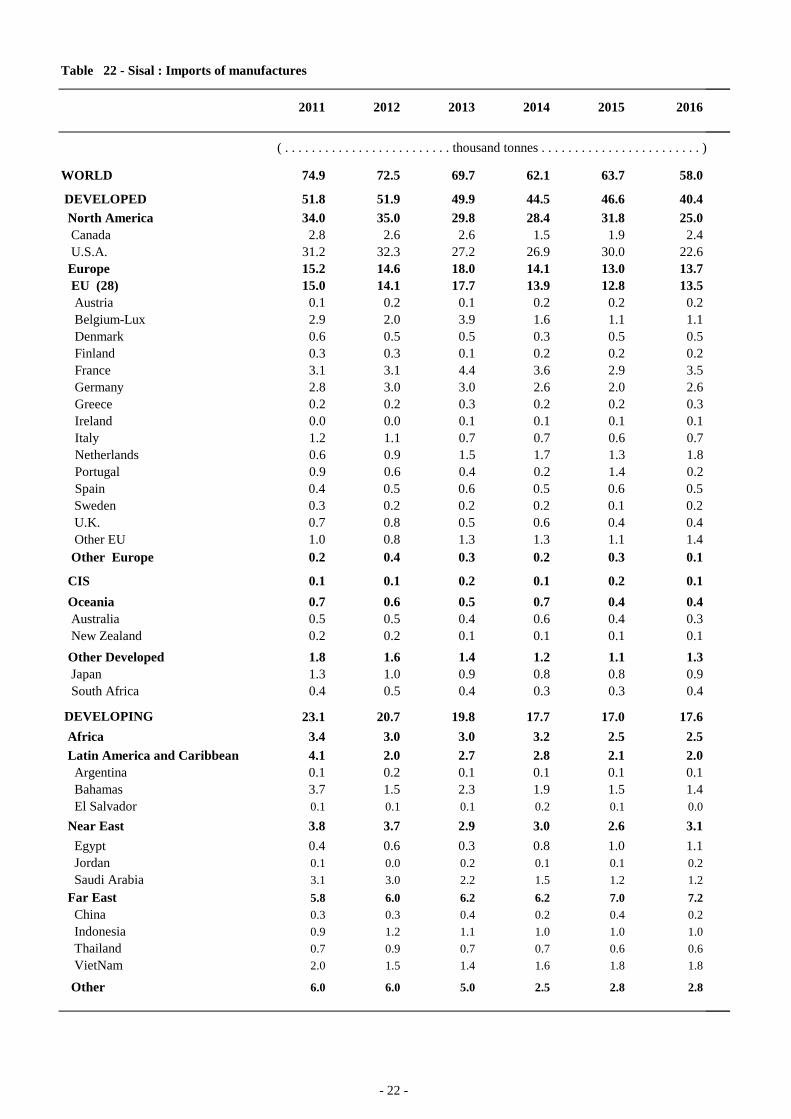
Table 22 - Sisal : Imports of manufactures
2011 2012 2013 2014 2015 2016
WORLD 74.9 72.5 69.7 62.1 63.7 58.0
DEVELOPED 51.8 51.9 49.9 44.5 46.6 40.4 North America 34.0 35.0 29.8 28.4 31.8 25.0 Canada 2.8 2.6 2.6 1.5 1.9 2.4 U.S.A. 31.2 32.3 27.2 26.9 30.0 22.6 Europe 15.2 14.6 18.0 14.1 13.0 13.7 EU (28) 15.0 14.1 17.7 13.9 12.8 13.5 Austria 0.1 0.2 0.1 0.2 0.2 0.2 Belgium-Lux 2.9 2.0 3.9 1.6 1.1 1.1 Denmark 0.6 0.5 0.5 0.3 0.5 0.5 Finland 0.3 0.3 0.1 0.2 0.2 0.2 France 3.1 3.1 4.4 3.6 2.9 3.5 Germany 2.8 3.0 3.0 2.6 2.0 2.6 Greece 0.2 0.2 0.3 0.2 0.2 0.3 Ireland 0.0 0.0 0.1 0.1 0.1 0.1 Italy 1.2 1.1 0.7 0.7 0.6 0.7 Netherlands 0.6 0.9 1.5 1.7 1.3 1.8 Portugal 0.9 0.6 0.4 0.2 1.4 0.2 Spain 0.4 0.5 0.6 0.5 0.6 0.5 Sweden 0.3 0.2 0.2 0.2 0.1 0.2 U.K. 0.7 0.8 0.5 0.6 0.4 0.4 Other EU 1.0 0.8 1.3 1.3 1.1 1.4 Other Europe 0.2 0.4 0.3 0.2 0.3 0.1
CIS 0.1 0.1 0.2 0.1 0.2 0.1 Oceania 0.7 0.6 0.5 0.7 0.4 0.4 Australia 0.5 0.5 0.4 0.6 0.4 0.3 New Zealand 0.2 0.2 0.1 0.1 0.1 0.1 Other Developed 1.8 1.6 1.4 1.2 1.1 1.3 Japan 1.3 1.0 0.9 0.8 0.8 0.9 South Africa 0.4 0.5 0.4 0.3 0.3 0.4
DEVELOPING 23.1 20.7 19.8 17.7 17.0 17.6 Africa 3.4 3.0 3.0 3.2 2.5 2.5 Latin America and Caribbean 4.1 2.0 2.7 2.8 2.1 2.0 Argentina 0.1 0.2 0.1 0.1 0.1 0.1 Bahamas 3.7 1.5 2.3 1.9 1.5 1.4 El Salvador 0.1 0.1 0.1 0.2 0.1 0.0
Near East 3.8 3.7 2.9 3.0 2.6 3.1 Egypt 0.4 0.6 0.3 0.8 1.0 1.1 Jordan 0.1 0.0 0.2 0.1 0.1 0.2 Saudi Arabia 3.1 3.0 2.2 1.5 1.2 1.2 Far East 5.8 6.0 6.2 6.2 7.0 7.2 China 0.3 0.3 0.4 0.2 0.4 0.2 Indonesia 0.9 1.2 1.1 1.0 1.0 1.0 Thailand 0.7 0.9 0.7 0.7 0.6 0.6 VietNam 2.0 1.5 1.4 1.6 1.8 1.8
Other 6.0 6.0 5.0 2.5 2.8 2.8
( . . . . . . . . . . . . . . . . . . . . . . . . . thousand tonnes . . . . . . . . . . . . . . . . . . . . . . . . )
- 23 -
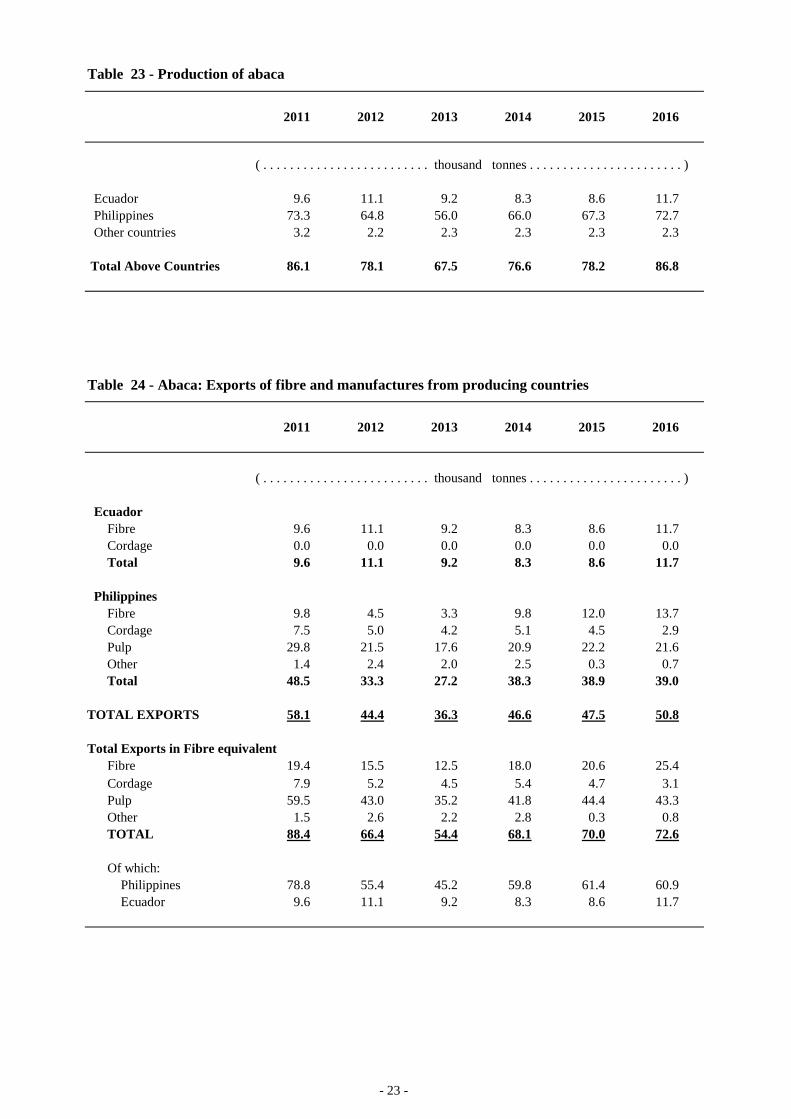
Table 23 - Production of abaca
2011 2012 2013 2014 2015 2016
Ecuador 9.6 11.1 9.2 8.3 8.6 11.7 Philippines 73.3 64.8 56.0 66.0 67.3 72.7 Other countries 3.2 2.2 2.3 2.3 2.3 2.3
Total Above Countries 86.1 78.1 67.5 76.6 78.2 86.8
Table 24 - Abaca: Exports of fibre and manufactures from producing countries
2011 2012 2013 2014 2015 2016
EcuadorFibre 9.6 11.1 9.2 8.3 8.6 11.7Cordage 0.0 0.0 0.0 0.0 0.0 0.0Total 9.6 11.1 9.2 8.3 8.6 11.7
PhilippinesFibre 9.8 4.5 3.3 9.8 12.0 13.7Cordage 7.5 5.0 4.2 5.1 4.5 2.9Pulp 29.8 21.5 17.6 20.9 22.2 21.6Other 1.4 2.4 2.0 2.5 0.3 0.7Total 48.5 33.3 27.2 38.3 38.9 39.0
TOTAL EXPORTS 58.1 44.4 36.3 46.6 47.5 50.8
Total Exports in Fibre equivalent Fibre 19.4 15.5 12.5 18.0 20.6 25.4Cordage 7.9 5.2 4.5 5.4 4.7 3.1Pulp 59.5 43.0 35.2 41.8 44.4 43.3Other 1.5 2.6 2.2 2.8 0.3 0.8TOTAL 88.4 66.4 54.4 68.1 70.0 72.6
Of which: Philippines 78.8 55.4 45.2 59.8 61.4 60.9 Ecuador 9.6 11.1 9.2 8.3 8.6 11.7
( . . . . . . . . . . . . . . . . . . . . . . . . . thousand tonnes . . . . . . . . . . . . . . . . . . . . . . . )
( . . . . . . . . . . . . . . . . . . . . . . . . . thousand tonnes . . . . . . . . . . . . . . . . . . . . . . . )
- 24 -
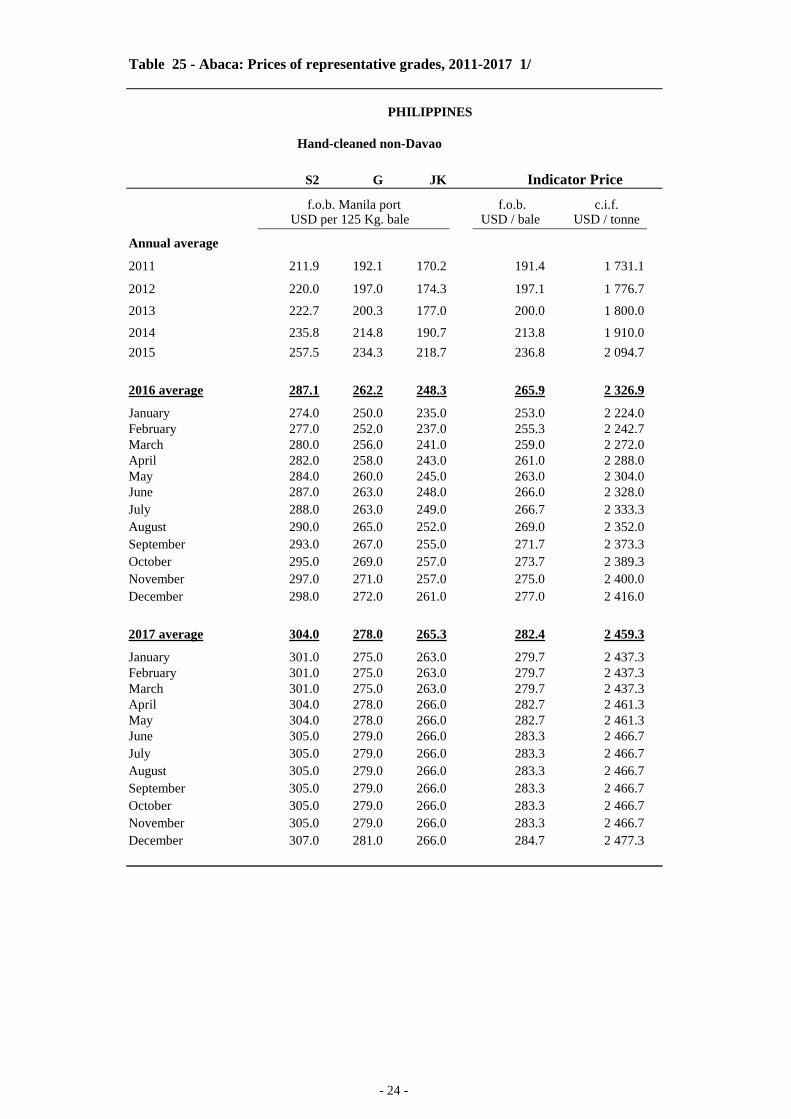
Table 25 - Abaca: Prices of representative grades, 2011-2017 1/
PHILIPPINES
Hand-cleaned non-Davao
S2 G JK
f.o.b. Manila port f.o.b. c.i.f. USD per 125 Kg. bale USD / bale USD / tonne
Annual average
2011 211.9 192.1 170.2 191.4 1 731.1
2012 220.0 197.0 174.3 197.1 1 776.7
2013 222.7 200.3 177.0 200.0 1 800.0
2014 235.8 214.8 190.7 213.8 1 910.02015 257.5 234.3 218.7 236.8 2 094.7
2016 average 287.1 262.2 248.3 265.9 2 326.9
January 274.0 250.0 235.0 253.0 2 224.0February 277.0 252.0 237.0 255.3 2 242.7March 280.0 256.0 241.0 259.0 2 272.0April 282.0 258.0 243.0 261.0 2 288.0May 284.0 260.0 245.0 263.0 2 304.0June 287.0 263.0 248.0 266.0 2 328.0July 288.0 263.0 249.0 266.7 2 333.3August 290.0 265.0 252.0 269.0 2 352.0September 293.0 267.0 255.0 271.7 2 373.3October 295.0 269.0 257.0 273.7 2 389.3November 297.0 271.0 257.0 275.0 2 400.0December 298.0 272.0 261.0 277.0 2 416.0
2017 average 304.0 278.0 265.3 282.4 2 459.3
January 301.0 275.0 263.0 279.7 2 437.3February 301.0 275.0 263.0 279.7 2 437.3March 301.0 275.0 263.0 279.7 2 437.3April 304.0 278.0 266.0 282.7 2 461.3May 304.0 278.0 266.0 282.7 2 461.3June 305.0 279.0 266.0 283.3 2 466.7July 305.0 279.0 266.0 283.3 2 466.7August 305.0 279.0 266.0 283.3 2 466.7September 305.0 279.0 266.0 283.3 2 466.7October 305.0 279.0 266.0 283.3 2 466.7November 305.0 279.0 266.0 283.3 2 466.7December 307.0 281.0 266.0 284.7 2 477.3
Indicator Price
- 25 -
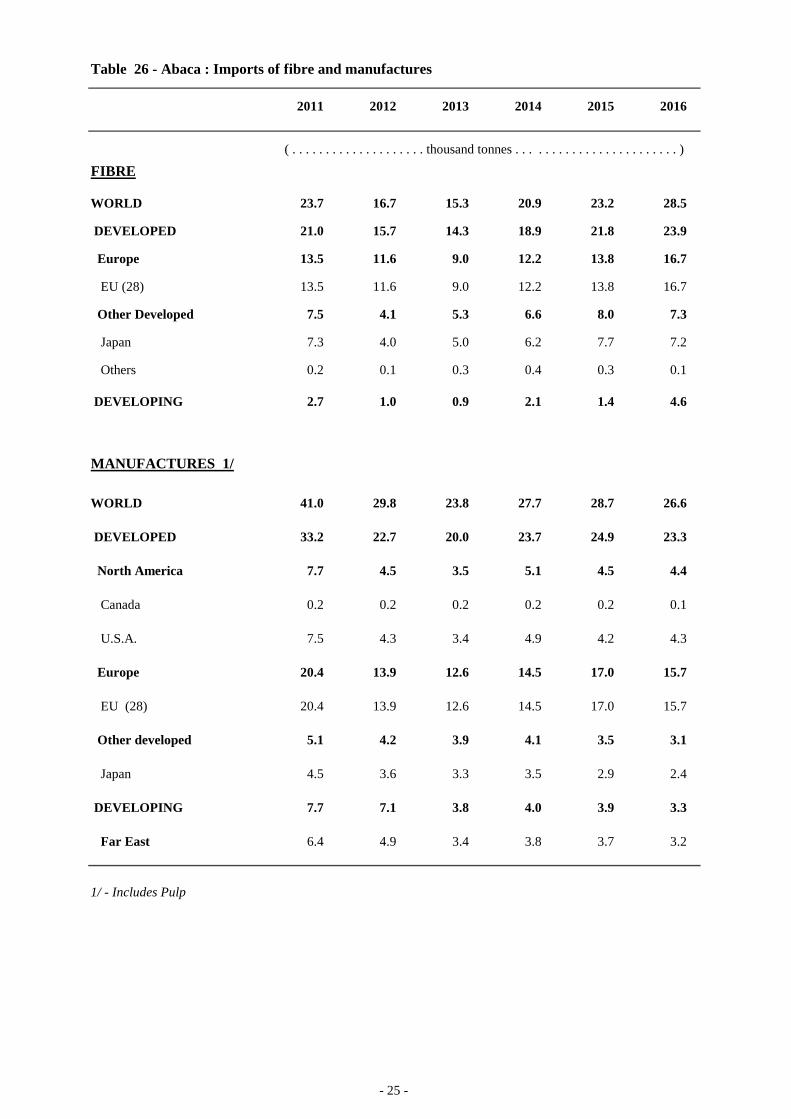
Table 26 - Abaca : Imports of fibre and manufactures
2011 2012 2013 2014 2015 2016
FIBRE
WORLD 23.7 16.7 15.3 20.9 23.2 28.5
DEVELOPED 21.0 15.7 14.3 18.9 21.8 23.9
Europe 13.5 11.6 9.0 12.2 13.8 16.7
EU (28) 13.5 11.6 9.0 12.2 13.8 16.7
Other Developed 7.5 4.1 5.3 6.6 8.0 7.3
Japan 7.3 4.0 5.0 6.2 7.7 7.2
Others 0.2 0.1 0.3 0.4 0.3 0.1
DEVELOPING 2.7 1.0 0.9 2.1 1.4 4.6
MANUFACTURES 1/
WORLD 41.0 29.8 23.8 27.7 28.7 26.6
DEVELOPED 33.2 22.7 20.0 23.7 24.9 23.3
North America 7.7 4.5 3.5 5.1 4.5 4.4
Canada 0.2 0.2 0.2 0.2 0.2 0.1
U.S.A. 7.5 4.3 3.4 4.9 4.2 4.3
Europe 20.4 13.9 12.6 14.5 17.0 15.7
EU (28) 20.4 13.9 12.6 14.5 17.0 15.7
Other developed 5.1 4.2 3.9 4.1 3.5 3.1
Japan 4.5 3.6 3.3 3.5 2.9 2.4
DEVELOPING 7.7 7.1 3.8 4.0 3.9 3.3
Far East 6.4 4.9 3.4 3.8 3.7 3.2
1/ - Includes Pulp
( . . . . . . . . . . . . . . . . . . . . thousand tonnes . . . . . . . . . . . . . . . . . . . . . . . . )
- 26 -
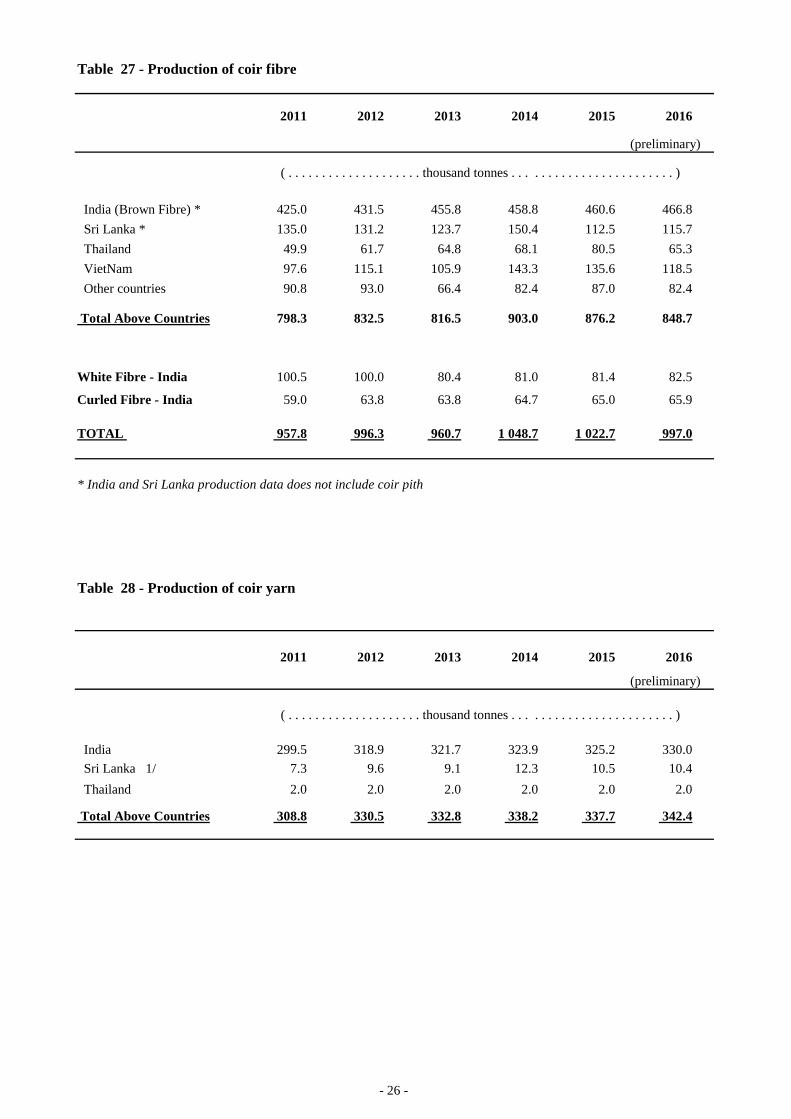
Table 27 - Production of coir fibre
2011 2012 2013 2014 2015 2016
(preliminary)
India (Brown Fibre) * 425.0 431.5 455.8 458.8 460.6 466.8 Sri Lanka * 135.0 131.2 123.7 150.4 112.5 115.7 Thailand 49.9 61.7 64.8 68.1 80.5 65.3 VietNam 97.6 115.1 105.9 143.3 135.6 118.5 Other countries 90.8 93.0 66.4 82.4 87.0 82.4
Total Above Countries 798.3 832.5 816.5 903.0 876.2 848.7
White Fibre - India 100.5 100.0 80.4 81.0 81.4 82.5
Curled Fibre - India 59.0 63.8 63.8 64.7 65.0 65.9
TOTAL 957.8 996.3 960.7 1 048.7 1 022.7 997.0
* India and Sri Lanka production data does not include coir pith
Table 28 - Production of coir yarn
2011 2012 2013 2014 2015 2016
(preliminary)
India 299.5 318.9 321.7 323.9 325.2 330.0 Sri Lanka 1/ 7.3 9.6 9.1 12.3 10.5 10.4 Thailand 2.0 2.0 2.0 2.0 2.0 2.0
Total Above Countries 308.8 330.5 332.8 338.2 337.7 342.4
( . . . . . . . . . . . . . . . . . . . . thousand tonnes . . . . . . . . . . . . . . . . . . . . . . . . )
( . . . . . . . . . . . . . . . . . . . . thousand tonnes . . . . . . . . . . . . . . . . . . . . . . . . )
- 27 -
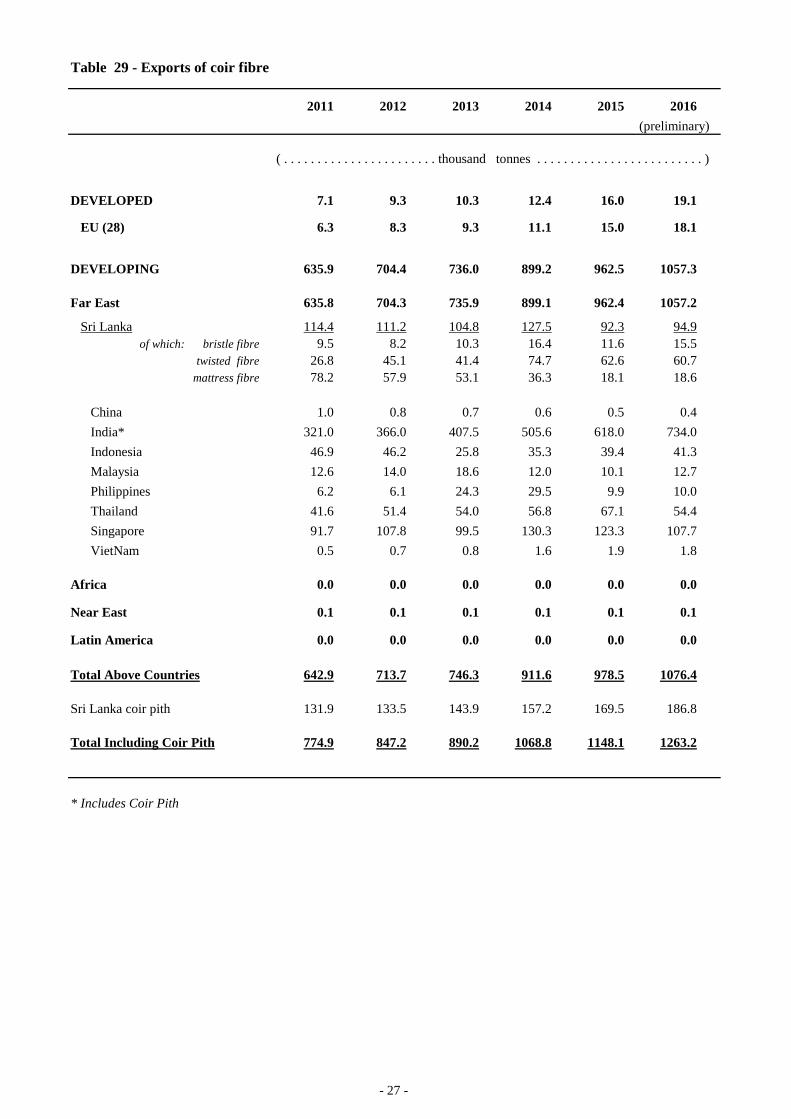
Table 29 - Exports of coir fibre
2011 2012 2013 2014 2015 2016 (preliminary)
DEVELOPED 7.1 9.3 10.3 12.4 16.0 19.1
EU (28) 6.3 8.3 9.3 11.1 15.0 18.1
DEVELOPING 635.9 704.4 736.0 899.2 962.5 1057.3
Far East 635.8 704.3 735.9 899.1 962.4 1057.2
Sri Lanka 114.4 111.2 104.8 127.5 92.3 94.9 of which: bristle fibre 9.5 8.2 10.3 16.4 11.6 15.5
twisted fibre 26.8 45.1 41.4 74.7 62.6 60.7mattress fibre 78.2 57.9 53.1 36.3 18.1 18.6
China 1.0 0.8 0.7 0.6 0.5 0.4India* 321.0 366.0 407.5 505.6 618.0 734.0Indonesia 46.9 46.2 25.8 35.3 39.4 41.3Malaysia 12.6 14.0 18.6 12.0 10.1 12.7Philippines 6.2 6.1 24.3 29.5 9.9 10.0Thailand 41.6 51.4 54.0 56.8 67.1 54.4Singapore 91.7 107.8 99.5 130.3 123.3 107.7VietNam 0.5 0.7 0.8 1.6 1.9 1.8
Africa 0.0 0.0 0.0 0.0 0.0 0.0
Near East 0.1 0.1 0.1 0.1 0.1 0.1
Latin America 0.0 0.0 0.0 0.0 0.0 0.0
Total Above Countries 642.9 713.7 746.3 911.6 978.5 1076.4
Sri Lanka coir pith 131.9 133.5 143.9 157.2 169.5 186.8
Total Including Coir Pith 774.9 847.2 890.2 1068.8 1148.1 1263.2
* Includes Coir Pith
( . . . . . . . . . . . . . . . . . . . . . . . thousand tonnes . . . . . . . . . . . . . . . . . . . . . . . . . )
- 28 -
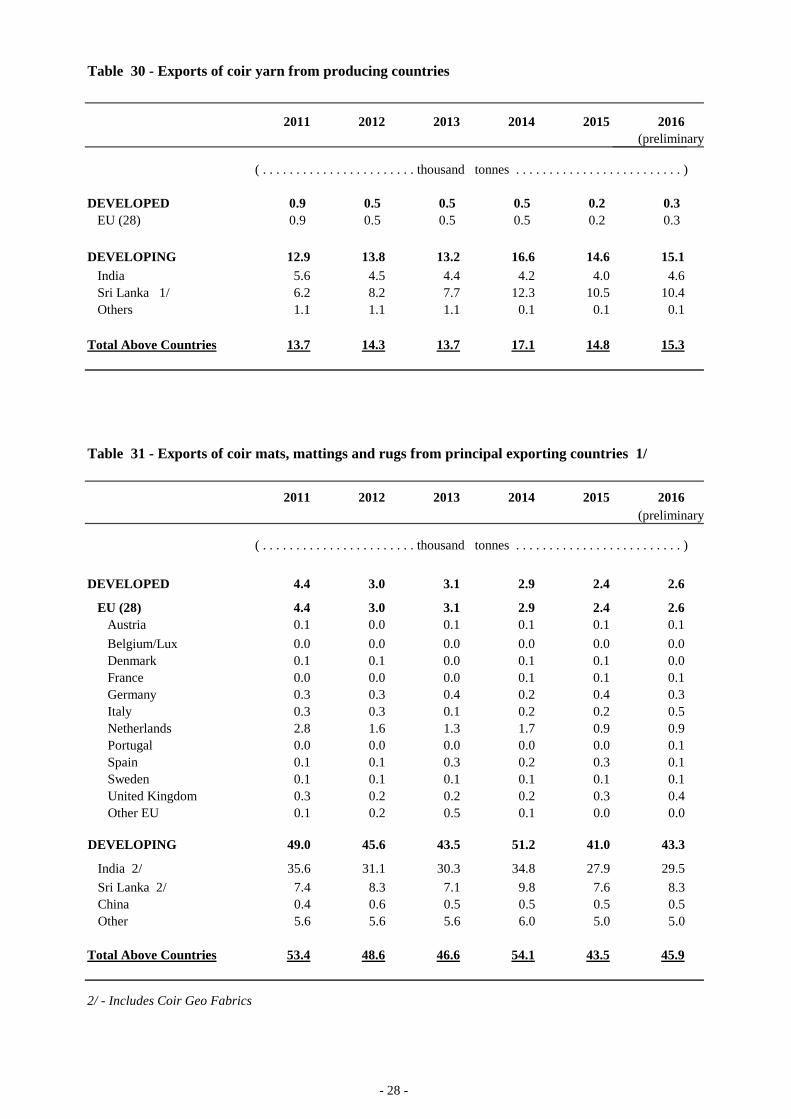
Table 30 - Exports of coir yarn from producing countries
2011 2012 2013 2014 2015 2016 (preliminary)
DEVELOPED 0.9 0.5 0.5 0.5 0.2 0.3EU (28) 0.9 0.5 0.5 0.5 0.2 0.3
DEVELOPING 12.9 13.8 13.2 16.6 14.6 15.1 India 5.6 4.5 4.4 4.2 4.0 4.6 Sri Lanka 1/ 6.2 8.2 7.7 12.3 10.5 10.4
Others 1.1 1.1 1.1 0.1 0.1 0.1
Total Above Countries 13.7 14.3 13.7 17.1 14.8 15.3
Table 31 - Exports of coir mats, mattings and rugs from principal exporting countries 1/
2011 2012 2013 2014 2015 2016 (preliminary)
DEVELOPED 4.4 3.0 3.1 2.9 2.4 2.6
EU (28) 4.4 3.0 3.1 2.9 2.4 2.6 Austria 0.1 0.0 0.1 0.1 0.1 0.1 Belgium/Lux 0.0 0.0 0.0 0.0 0.0 0.0 Denmark 0.1 0.1 0.0 0.1 0.1 0.0 France 0.0 0.0 0.0 0.1 0.1 0.1 Germany 0.3 0.3 0.4 0.2 0.4 0.3 Italy 0.3 0.3 0.1 0.2 0.2 0.5 Netherlands 2.8 1.6 1.3 1.7 0.9 0.9 Portugal 0.0 0.0 0.0 0.0 0.0 0.1 Spain 0.1 0.1 0.3 0.2 0.3 0.1 Sweden 0.1 0.1 0.1 0.1 0.1 0.1 United Kingdom 0.3 0.2 0.2 0.2 0.3 0.4 Other EU 0.1 0.2 0.5 0.1 0.0 0.0
DEVELOPING 49.0 45.6 43.5 51.2 41.0 43.3
India 2/ 35.6 31.1 30.3 34.8 27.9 29.5Sri Lanka 2/ 7.4 8.3 7.1 9.8 7.6 8.3China 0.4 0.6 0.5 0.5 0.5 0.5Other 5.6 5.6 5.6 6.0 5.0 5.0
Total Above Countries 53.4 48.6 46.6 54.1 43.5 45.9
2/ - Includes Coir Geo Fabrics
( . . . . . . . . . . . . . . . . . . . . . . . thousand tonnes . . . . . . . . . . . . . . . . . . . . . . . . . )
( . . . . . . . . . . . . . . . . . . . . . . . thousand tonnes . . . . . . . . . . . . . . . . . . . . . . . . . )
- 29 -
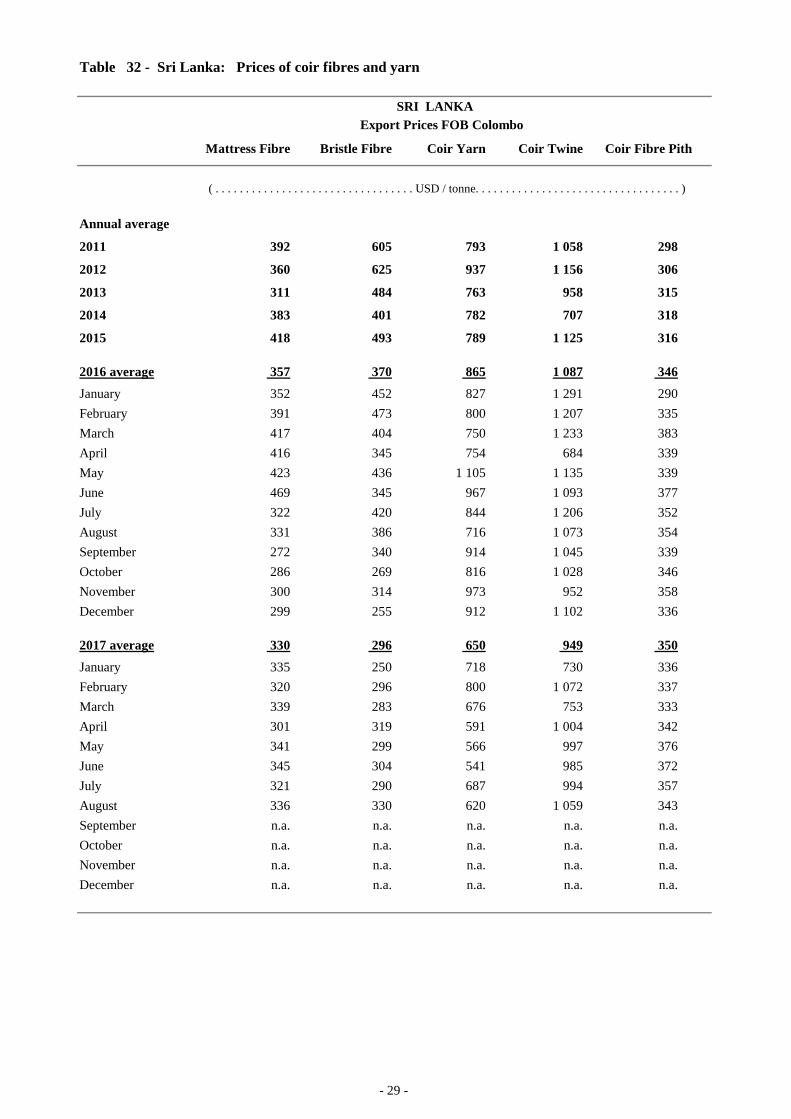
Table 32 - Sri Lanka: Prices of coir fibres and yarn
SRI LANKAExport Prices FOB Colombo
Mattress Fibre Bristle Fibre Coir Yarn Coir Twine Coir Fibre Pith
Annual average
2011 392 605 793 1 058 298
2012 360 625 937 1 156 306
2013 311 484 763 958 315
2014 383 401 782 707 318
2015 418 493 789 1 125 316
2016 average 357 370 865 1 087 346January 352 452 827 1 291 290February 391 473 800 1 207 335March 417 404 750 1 233 383April 416 345 754 684 339May 423 436 1 105 1 135 339June 469 345 967 1 093 377July 322 420 844 1 206 352August 331 386 716 1 073 354September 272 340 914 1 045 339October 286 269 816 1 028 346November 300 314 973 952 358December 299 255 912 1 102 336
2017 average 330 296 650 949 350January 335 250 718 730 336February 320 296 800 1 072 337March 339 283 676 753 333April 301 319 591 1 004 342May 341 299 566 997 376June 345 304 541 985 372July 321 290 687 994 357August 336 330 620 1 059 343September n.a. n.a. n.a. n.a. n.a.October n.a. n.a. n.a. n.a. n.a.November n.a. n.a. n.a. n.a. n.a.December n.a. n.a. n.a. n.a. n.a.
( . . . . . . . . . . . . . . . . . . . . . . . . . . . . . . . . . USD / tonne. . . . . . . . . . . . . . . . . . . . . . . . . . . . . . . . . . )
- 30 -
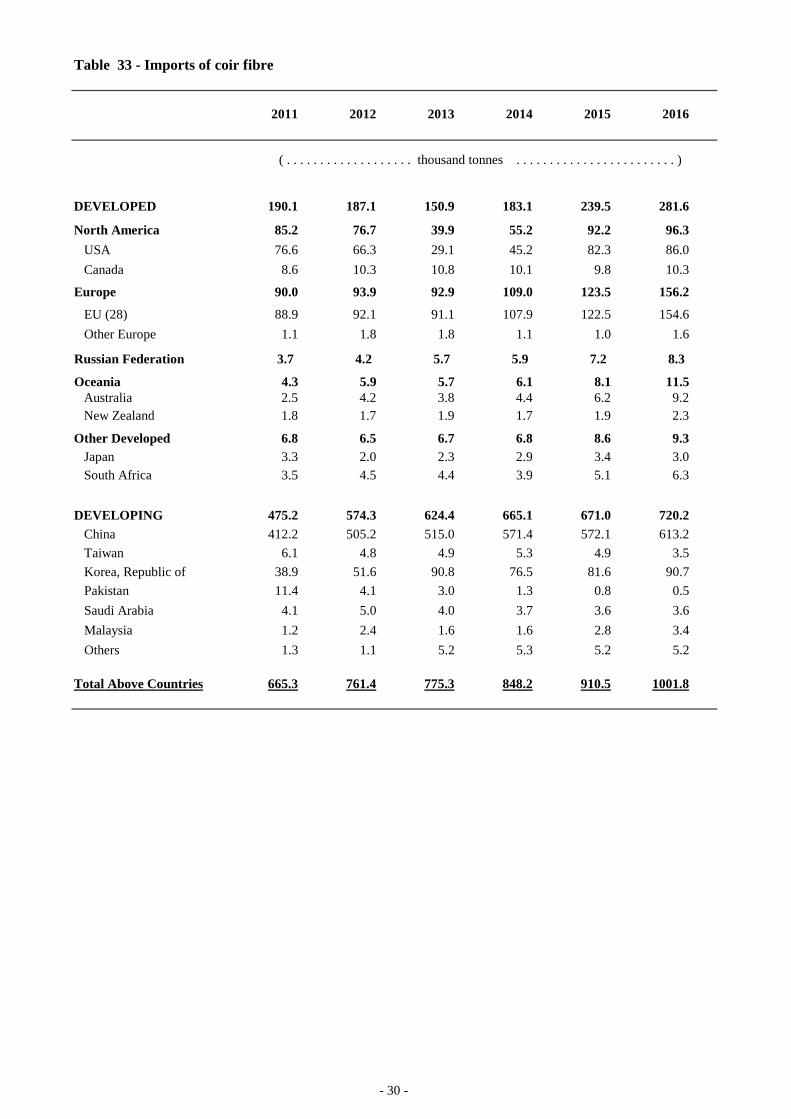
Table 33 - Imports of coir fibre
2011 2012 2013 2014 2015 2016
DEVELOPED 190.1 187.1 150.9 183.1 239.5 281.6
North America 85.2 76.7 39.9 55.2 92.2 96.3USA 76.6 66.3 29.1 45.2 82.3 86.0Canada 8.6 10.3 10.8 10.1 9.8 10.3
Europe 90.0 93.9 92.9 109.0 123.5 156.2
EU (28) 88.9 92.1 91.1 107.9 122.5 154.6Other Europe 1.1 1.8 1.8 1.1 1.0 1.6
Russian Federation 3.7 4.2 5.7 5.9 7.2 8.3
Oceania 4.3 5.9 5.7 6.1 8.1 11.5Australia 2.5 4.2 3.8 4.4 6.2 9.2New Zealand 1.8 1.7 1.9 1.7 1.9 2.3
Other Developed 6.8 6.5 6.7 6.8 8.6 9.3Japan 3.3 2.0 2.3 2.9 3.4 3.0South Africa 3.5 4.5 4.4 3.9 5.1 6.3
DEVELOPING 475.2 574.3 624.4 665.1 671.0 720.2China 412.2 505.2 515.0 571.4 572.1 613.2Taiwan 6.1 4.8 4.9 5.3 4.9 3.5Korea, Republic of 38.9 51.6 90.8 76.5 81.6 90.7Pakistan 11.4 4.1 3.0 1.3 0.8 0.5Saudi Arabia 4.1 5.0 4.0 3.7 3.6 3.6Malaysia 1.2 2.4 1.6 1.6 2.8 3.4Others 1.3 1.1 5.2 5.3 5.2 5.2
Total Above Countries 665.3 761.4 775.3 848.2 910.5 1001.8
( . . . . . . . . . . . . . . . . . . . thousand tonnes . . . . . . . . . . . . . . . . . . . . . . . . )
- 31 -
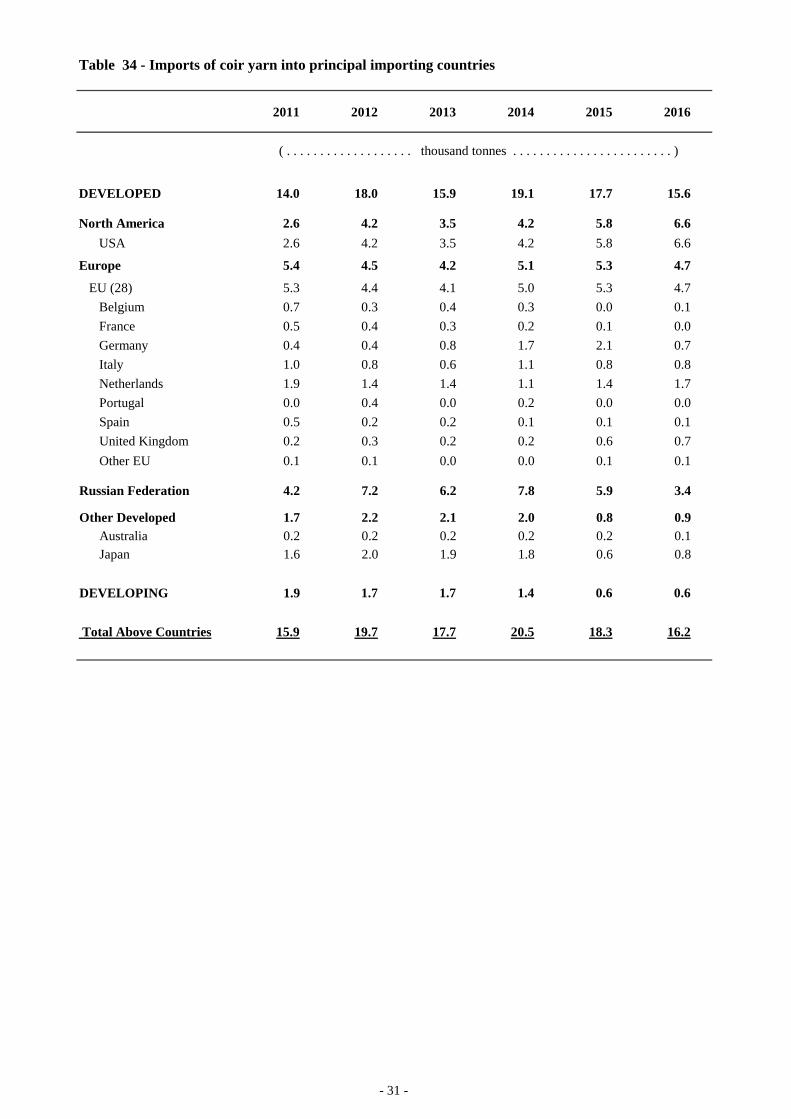
Table 34 - Imports of coir yarn into principal importing countries
2011 2012 2013 2014 2015 2016
DEVELOPED 14.0 18.0 15.9 19.1 17.7 15.6
North America 2.6 4.2 3.5 4.2 5.8 6.6USA 2.6 4.2 3.5 4.2 5.8 6.6
Europe 5.4 4.5 4.2 5.1 5.3 4.7
EU (28) 5.3 4.4 4.1 5.0 5.3 4.7Belgium 0.7 0.3 0.4 0.3 0.0 0.1France 0.5 0.4 0.3 0.2 0.1 0.0Germany 0.4 0.4 0.8 1.7 2.1 0.7Italy 1.0 0.8 0.6 1.1 0.8 0.8Netherlands 1.9 1.4 1.4 1.1 1.4 1.7Portugal 0.0 0.4 0.0 0.2 0.0 0.0Spain 0.5 0.2 0.2 0.1 0.1 0.1United Kingdom 0.2 0.3 0.2 0.2 0.6 0.7
Other EU 0.1 0.1 0.0 0.0 0.1 0.1
Russian Federation 4.2 7.2 6.2 7.8 5.9 3.4
Other Developed 1.7 2.2 2.1 2.0 0.8 0.9Australia 0.2 0.2 0.2 0.2 0.2 0.1Japan 1.6 2.0 1.9 1.8 0.6 0.8
DEVELOPING 1.9 1.7 1.7 1.4 0.6 0.6
Total Above Countries 15.9 19.7 17.7 20.5 18.3 16.2
( . . . . . . . . . . . . . . . . . . . thousand tonnes . . . . . . . . . . . . . . . . . . . . . . . . )
- 32 -
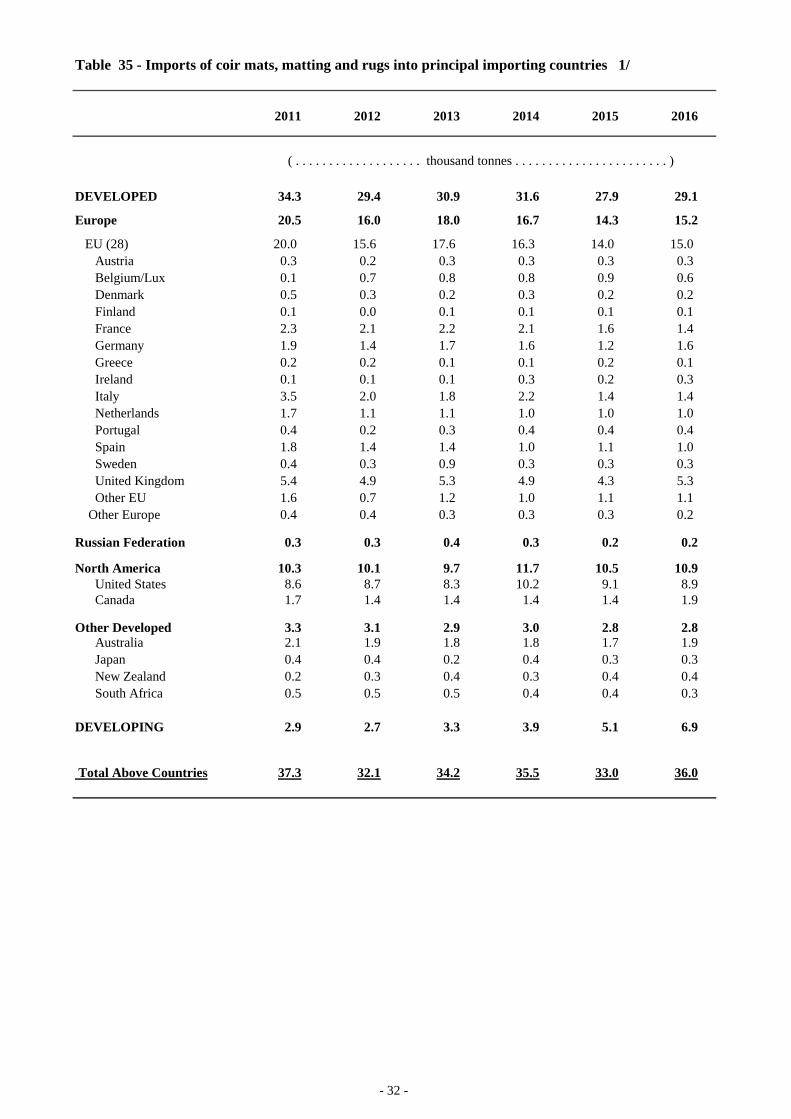
Table 35 - Imports of coir mats, matting and rugs into principal importing countries 1/
2011 2012 2013 2014 2015 2016
DEVELOPED 34.3 29.4 30.9 31.6 27.9 29.1
Europe 20.5 16.0 18.0 16.7 14.3 15.2
EU (28) 20.0 15.6 17.6 16.3 14.0 15.0 Austria 0.3 0.2 0.3 0.3 0.3 0.3 Belgium/Lux 0.1 0.7 0.8 0.8 0.9 0.6 Denmark 0.5 0.3 0.2 0.3 0.2 0.2 Finland 0.1 0.0 0.1 0.1 0.1 0.1 France 2.3 2.1 2.2 2.1 1.6 1.4 Germany 1.9 1.4 1.7 1.6 1.2 1.6 Greece 0.2 0.2 0.1 0.1 0.2 0.1 Ireland 0.1 0.1 0.1 0.3 0.2 0.3 Italy 3.5 2.0 1.8 2.2 1.4 1.4 Netherlands 1.7 1.1 1.1 1.0 1.0 1.0 Portugal 0.4 0.2 0.3 0.4 0.4 0.4 Spain 1.8 1.4 1.4 1.0 1.1 1.0 Sweden 0.4 0.3 0.9 0.3 0.3 0.3 United Kingdom 5.4 4.9 5.3 4.9 4.3 5.3 Other EU 1.6 0.7 1.2 1.0 1.1 1.1
Other Europe 0.4 0.4 0.3 0.3 0.3 0.2
Russian Federation 0.3 0.3 0.4 0.3 0.2 0.2
North America 10.3 10.1 9.7 11.7 10.5 10.9 United States 8.6 8.7 8.3 10.2 9.1 8.9 Canada 1.7 1.4 1.4 1.4 1.4 1.9
Other Developed 3.3 3.1 2.9 3.0 2.8 2.8 Australia 2.1 1.9 1.8 1.8 1.7 1.9 Japan 0.4 0.4 0.2 0.4 0.3 0.3 New Zealand 0.2 0.3 0.4 0.3 0.4 0.4 South Africa 0.5 0.5 0.5 0.4 0.4 0.3
DEVELOPING 2.9 2.7 3.3 3.9 5.1 6.9
Total Above Countries 37.3 32.1 34.2 35.5 33.0 36.0
( . . . . . . . . . . . . . . . . . . . thousand tonnes . . . . . . . . . . . . . . . . . . . . . . . )
- 33 -
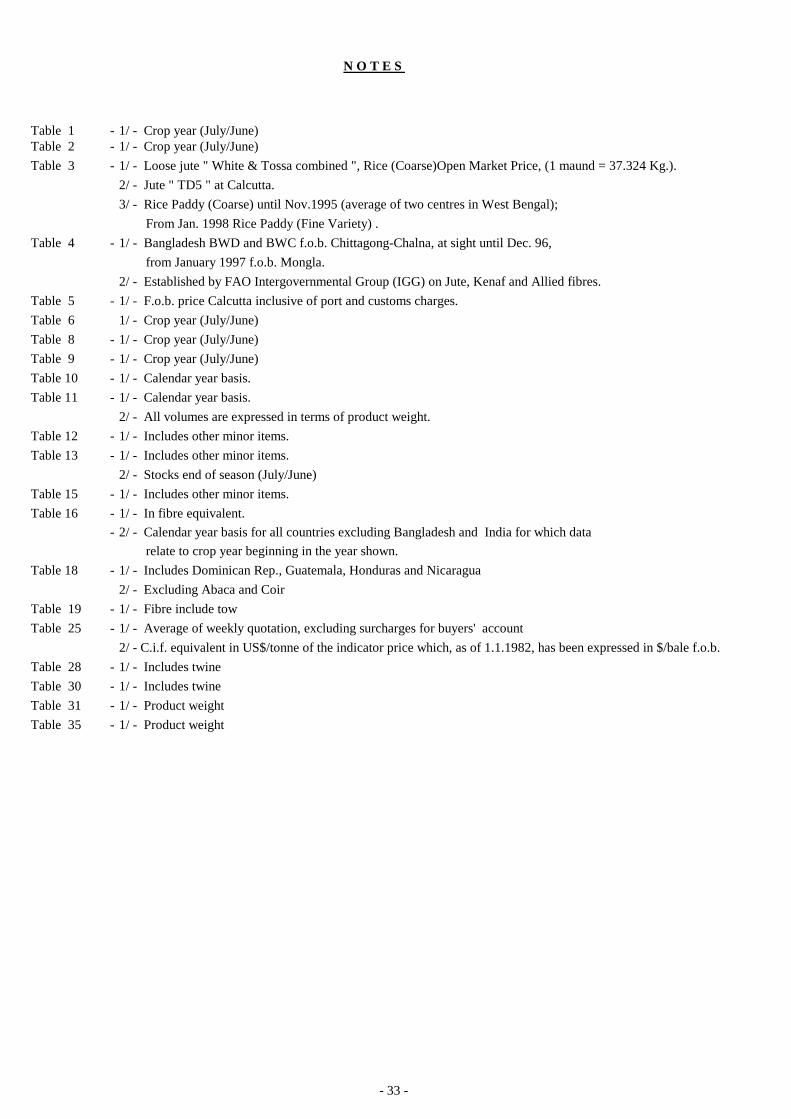
N O T E S
Table 1 - 1/ - Crop year (July/June)Table 2 - 1/ - Crop year (July/June)Table 3 - 1/ - Loose jute " White & Tossa combined ", Rice (Coarse)Open Market Price, (1 maund = 37.324 Kg.).
2/ - Jute " TD5 " at Calcutta. 3/ - Rice Paddy (Coarse) until Nov.1995 (average of two centres in West Bengal); From Jan. 1998 Rice Paddy (Fine Variety) .
Table 4 - 1/ - Bangladesh BWD and BWC f.o.b. Chittagong-Chalna, at sight until Dec. 96, from January 1997 f.o.b. Mongla.2/ - Established by FAO Intergovernmental Group (IGG) on Jute, Kenaf and Allied fibres.
Table 5 - 1/ - F.o.b. price Calcutta inclusive of port and customs charges.Table 6 1/ - Crop year (July/June)Table 8 - 1/ - Crop year (July/June)Table 9 - 1/ - Crop year (July/June)Table 10 - 1/ - Calendar year basis.Table 11 - 1/ - Calendar year basis.
2/ - All volumes are expressed in terms of product weight.Table 12 - 1/ - Includes other minor items. Table 13 - 1/ - Includes other minor items.
2/ - Stocks end of season (July/June)Table 15 - 1/ - Includes other minor items. Table 16 - 1/ - In fibre equivalent.
- 2/ - Calendar year basis for all countries excluding Bangladesh and India for which data relate to crop year beginning in the year shown.
Table 18 - 1/ - Includes Dominican Rep., Guatemala, Honduras and Nicaragua2/ - Excluding Abaca and Coir
Table 19 - 1/ - Fibre include towTable 25 - 1/ - Average of weekly quotation, excluding surcharges for buyers' account
2/ - C.i.f. equivalent in US$/tonne of the indicator price which, as of 1.1.1982, has been expressed in $/bale f.o.b.Table 28 - 1/ - Includes twineTable 30 - 1/ - Includes twineTable 31 - 1/ - Product weightTable 35 - 1/ - Product weight

![Advanced Materials Manufacturing & Characterization · 2017-09-28 · [8-12]. The tensile properties of sisal, hemp, coir, kenaf, and jute reinforced composites have been studied](https://img.pdfslide.us/doc/110x75/5f6d50e3c0ed2e008c6979aa/advanced-materials-manufacturing-2017-09-28-8-12-the-tensile-properties.jpg)