Embed Size (px)
Citation preview

1
Just How Big Is the Too Big to Fail Problem?*
James R. Barth†
Lowder Eminent Scholar, Auburn University Senior Finance Fellow, Milken Institute
Fellow, Wharton Financial Institutions Center [email protected]
Apanard (Penny) Prabha Economist, Milken Institute [email protected]
Phillip Swagel
Professor in international economic policy, the Maryland School of Public Policy Senior Fellow, Milken Institute.
March 27, 2012
Abstract The idea of banks too big to fail (TBTF) is not new. Indeed, it has been three decades
since the first TBTF bailout due to concerns about serious and widespread financial repercussions. Since then, of course, big banks have grown much bigger and have become increasingly complex, both in the United States and elsewhere. In this paper, we put the issue of too big to fail in U.S. historical and quantitative perspective, and assess the potential impacts of recent regulatory changes. The developments relating to the TBTF problem based on a global perspective are also examined. The measures taken since the financial crisis of 2007‐2009—including the Basel III regulatory reforms, domestic regulations like the Dodd‐Frank Act, and the designation of global systemically important banks—have distinct purposes but also complement one another, to the extent that they are successful. Our analysis points out that despite the recent regulatory changes the future of TBTF remains unclear, but it is likely that it will be different from the past. JEL Classifications: G2, G21, G28 Keywords: banks, financial firms, financial crisis, too big to fail, Dodd‐Frank Act, Basel III
*The authors are grateful to Jakob Thomas, Kumiko Green and Nan (Annie) Zhang for excellent research assistance. †Corresponding author: Milken Institute, 1250 Fourth Street, Santa Monica, CA 90401. Phone: (310) 570‐4678, Fax: (310) 570‐4625, Email: [email protected]

2
Just How Big Is the Too Big to Fail Problem?
Introduction
During the financial crisis of 2007–2009, governments worldwide took extraordinary
measures to prevent the failure of large financial institutions. Policymakers clearly considered
some of them too big to fail (TBTF). At different times and across various countries and
economic conditions, they protected both insured and uninsured depositors, guaranteed bank
debt, insured risky assets, provided liquidity for exceptionally long periods and against collateral
of depressed value, and injected public capital to the benefit of shareholders of banks that
would otherwise have failed.
To be sure, many shareholders suffered large losses despite that support (and in some
cases, because of it). But governmental intervention made losses infrequent among the
bondholders and other creditors at systemically important financial institutions. If anything, the
market disruptions that followed bondholder losses at Lehman Brothers and Washington
Mutual (WaMu) made governments even more reluctant to allow similar failures during the
crisis.1 Meanwhile, hundreds of smaller banks were allowed to fail, with their shareholders
wiped out and creditors and uninsured depositors taking losses, in some cases through the
normal resolution process.
The resolution authority of the Dodd–Frank Wall Street Reform and Consumer
Protection Act (Dodd–Frank), which became law in July 2010, formalizes the idea that the
largest banks will be regulated differently from smaller ones, to eliminate any special or
deferential treatment. The new law includes not only a different regulatory regime for normal
times but also a new resolution authority to be invoked in case of a serious problem, and that
allows regulatory authorities to support a large financial institution that faces insolvency while
imposing losses on its creditors and shareholders. Thus, it could allow big banks to fail without
leading to severe negative spillovers among other firms—though the key word is “could,” since
the authority is yet untested.
1. It turns out that WaMu bondholders as of March 2012 were likely to recover all or nearly all of their value in the end, as a result of litigation. This suggests that some of the market turmoil that ensued from the resolution of WaMu might have been avoidable.

3
Even so, Dodd–Frank constitutes a potential sea change for large financial institutions.
Creditors now understand that it is possible, even more likely, that they will take losses if the
firm fails. This in turn should increase financing costs for large financial institutions even in
normal times, removing one source of their funding advantage over smaller banks: the
presumption that being TBTF meant that regulators would make good on the debts of the
largest banks; thus, bondholders were willing to fund them at a lower cost than they would
smaller institutions. This is no longer as obvious going forward.
Moreover, large financial institutions face new regulatory burdens and other more
stringent requirements for capital and liquidity that raise the cost of being big. And this is on
top of the recent move by the Federal Deposit Insurance Corporation (FDIC) to charge
insurance premiums on banks’ non‐deposit liabilities other than capital. Thus, large banks that
rely on borrowing rather than deposits would have to pay deposit insurance premiums, even on
uninsured liabilities.
These changes promise to redefine the playing field for large, interconnected financial
companies (LIFCs), which Dodd–Frank identifies as banks/bank holding companies with $50
billion or more in assets. On a global level, the G‐20 member countries and the Financial
Stability Board (FSB) in November 2011 identified an initial group of 29 banks as systemically
important financial institutions (G‐SIFIs), to be subjected to more stringent prudential
standards. At the same time, the Basel Committee on Banking Supervision (BCBS) set forth an
additional capital requirement for global systemically important banks (G‐SIBs).2 Other
regulatory reforms remain works in progress, including implementation of Dodd–Frank and the
Basel III standards. Still more measures, such as efforts toward international coordination of the
bankruptcy of multinational banks, also remain to be implemented. The future of too big to fail
remains unclear, but it is likely that it will be different from the past.
This paper puts the issue of too big to fail in historical and quantitative perspective, and
assesses the potential impacts of recent regulatory changes. Both an understanding of how the
TBTF problem has evolved and a consideration of quantitative measures for bank size are useful
2. The G‐SIBs will be grouped into different categories of systemic importance to determine the minimum additional loss absorbency (common equity as a percentage of risk‐weighted assets), with the recommended additional capital ranging from a low of 1 percentage point to a high of 3.5 percentage points (for additional information, see http://www.bis.org/publ/bcbs207.htm).

4
for considering the potential impacts of Dodd–Frank and other regulatory and financial system
changes. Accordingly, the next section reviews historical developments in the United States.
The third section continues those developments relating to TBTF in the context of the U.S.
financial crisis of 2007–2009.3 The fourth section provides quantitative measures for U.S. banks
that one might consider too big to fail, as well as banks identified by regulatory authorities as
no longer TBTF. The fifth section reviews developments relating to the TBTF problem based on
a global perspective, as well as quantitative measures one might use to assess whether a bank
is too big to fail. The paper then uses those measures for the list of banks identified as TBTF by
international authorities. The final section discusses whether indeed bank “bigness” is a serious
problem and, if so, how to address it in the context of recent market and policy developments.
This problem of too big to fail is not new. The term itself dates back to 1984, when the
FDIC took over the Continental Illinois National Bank and Trust Company (Continental Illinois),
then the seventh‐largest U.S. bank (Feldman and Rolnick, 1998). Continental Illinois
shareholders were wiped out, but uninsured depositors and creditors were made whole, or
shielded from losses, making the government action a bailout of these parties. Then, as now,
the true bailout in most financial‐sector interventions was for the creditors, not the equity
holders.
C.T. Conover, Comptroller of the Currency at the time, explained the government
bailout by noting that “had Continental failed and been treated in a way in which depositors
and creditors were not made whole, we could very well have seen a national, if not an
international, financial crisis the dimensions of which were difficult to imagine” (Conover, 1984,
p. 288). When asked by Banking Committee Chairman Fernand St. Germain at a congressional
hearing, “Do we allow, ever, a large bank to fail?” he replied, “I think it is important that we find
a way to do that” (1984, p. 300).
In the three decades between the rescue of Continental Illinois and the widespread
rescues of 2008 and 2009, big banks grew bigger and the financial system became more
complicated, both in the United States and around the world. Yet despite these developments,
no regulatory measures were implemented that would allow deeply troubled big banks to fail.
3. For a discussion of the TBTF problem in the context of responses to the global financial crisis by several European countries during this period, see Mullineux (2012).

5
I. The Origins of TBTF in the United States
Banks play a central role in the economy by providing credit to individuals and
businesses, and offering services, such as deposits, and by facilitating payments for goods and
services. If its depositors withdraw their funds on the belief that the bank is on the verge of
insolvency, it could be forced to sell off its assets at “fire sale” prices, thereby turning an
illiquidity problem into a solvency problem. Such a run could trigger similar runs on other
institutions and drive them all into insolvency. This state of affairs could lead to a disruption in
the payments system and a tightening of available credit, with an adverse macroeconomic
impact.
To address issues of systemic risk in the banking system, Congress established the
Federal Reserve in December 1913. A major purpose of the Federal Reserve was to act as a
lender of last resort by providing funds to solvent banks experiencing liquidity problems. These
loans were to be made against good collateral, defined by the Federal Reserve Act as secured
“to the satisfaction of the Federal Reserve.” Twenty years later, in June 1933, Congress created
the FDIC, its purpose being to guarantee deposits, up to a limit, to lessen the incentive of
depositors to make panicked withdrawals and thereby to reduce the likelihood of bank runs.
Prior to the establishment of these two federal institutions, U.S. banks suffered through
several periods of runs, with dire financial consequences. Although the Federal Reserve had
already been in existence for nearly two decades, the worst such period was during the Great
Depression, demonstrating that the Fed by itself could not prevent bank runs4 and paving the
way for creation of the FDIC. But even before the FDIC was up and running, the government
had been forced to address widespread problems that existed in the banking industry during
1929–1933.5 Thus, in January 1932, Congress created and chartered the Reconstruction Finance
4. Todd (1992, p. 24) points out that “[p]rior to 1932, the Federal Reserve Banks were not authorized to make advances against assets other than ‘real bills’ or government securities, and they could lend for no longer than 15 days on the government securities owned by member banks.” 5. It is interesting to note that, according to Kaufman (2002, p. 425), “Before the introduction of deposit insurance in 1934, very big banks did not often become insolvent and fail, even in periods of widespread bank failures and macroeconomic difficulties, such as 1893, 1907, and the early 1930s.”
6
Corporation (RFC)6 to “make loans to banks and financial institutions which cannot otherwise
secure credit where such advances will protect the credit structure and stimulate employment”
(Todd, 1992). The Emergency Banking Act of March 1933 further authorized the RFC to
purchase preferred stock issued by banks in need of capital for organization or reorganization
(Federal Reserve Bulletin, 1933, and Final Report on the Reconstruction Finance Corporation,
Secretary of the Treasury, 1959).7
Some of the RFC’s actions, especially those with respect to the purchase of preferred
stock, represented the first government bailouts of banks to address broader credit and
economic problems arising from the financial sector.8 Beginning in March 1933 and continuing
until 1945, the RFC purchased the preferred stock of 4,202 banks (Final Report, 1959). To put
these numbers in perspective, it should be noted that roughly 9,000 of about 25,000 banks
failed during the 1930s, with nearly half of the failures occurring in 1933 alone. Did big banks,
perhaps considered too big to fail, receive special treatment with respect to the bailouts?
According to Todd (1992, p. 26), “[a]lmost all large banks ... funded themselves through the
RFC.” This suggests that most of the banks that failed or were allowed to fail during and for
several years after 1933 were small banks.9
Once the FDIC was in operation, it assumed responsibility for dealing with failed and
failing banks. Until 1950, the agency had only two options available to it under the Federal
Deposit Insurance Act (FDIA): (1) to liquidate a bank and pay off insured depositors or (2) to
arrange for the bank’s acquisition by a healthy bank. The FDIC was required to choose the less
costly of the two. In 1950, however, Congress authorized the FDIC to infuse funds into a bank to
keep it open. The FDIC had sought this authority out of “concern that the Federal Reserve
would not be a dependable lender to banks faced with temporary funding problems” (FDIC,
6. The Treasury Department provided the RFC with $500 million in capital. It was also allowed to borrow funds, but the outstanding amount was not to exceed three times its capital (Final Report on the Reconstruction Finance Corporation, 1959). 7. This authority expired in June 1947, when the applicable provision of the Emergency Bank Act was repealed (Final Report on the Reconstruction Finance Corporation, 1959). 8. Of course, not all of the funds were used by the RFC to bail out banks. Funds were also made to conservators, receivers, or liquidating agents to aid in the liquidation of closed banks (Final Report on the Reconstruction Finance Corporation, 1959). 9. Kaufman (2002) also provides evidence to support this point. At least one large bank—Bank of United States—failed before the establishment of the FDIC; indeed, the 1930 failure of this institution is often seen as contributing to the broader panic that took hold at the end of 1932 and into 1933.

7
1984, p. 94). But such “open bank assistance” was only permitted “when in the opinion of the
[FDIC’s] Board of Directors the continued operation of such a bank is essential to provide
adequate banking service in the community” (FDIC, 1984, p. 94). When this “essentiality”
condition was invoked, the FDIC could ignore the requirement to choose the less costly
resolution method.10
Before the rescue of Continental Illinois in 1984, essentiality was used just five times,11
and in only one of these cases was the FDIC’s determination of essentiality based mainly on the
size of the bank. This case, in 1980, involved First Pennsylvania, which was the nation’s 23rd‐
largest bank at the time.12 The FDIC concluded that closing such a large bank would have
serious repercussions in both the local market and probably the entire nation.13 This appears to
be the first bank the FDIC considered too big to fail.14
As noted earlier, the government defended its 1984 bailout of Continental Illinois citing
concerns about systemic risk due to the bank’s size. The essentiality condition was therefore
invoked to enable open bank assistance, under which the FDIC infused $1 billion in new capital
10. See FDIC (1997, p. 248). More specifically, according to the FDIC (1997), “Also after 1950, and until the passage of the Federal Deposit Insurance Corporation Improvement Act of 1991, the FDIC operated under a cost test for determining which method to use: it was required to estimate the cost of a payoff and liquidation as the standard of comparison, and could adopt an alternative resolution if the alternative was expected to be less costly than the standard. But the FDIC was also allowed to use an alternative method under the essentiality provision, and the statutory language was sufficiently general to provide the FDIC with discretion to extend essentiality beyond local economic dislocation (as was done with Continental). When essentiality was invoked, cost considerations could be ignored.” In addition, the “FDICIA as enacted essentially took this road, attempting to place limits on regulatory activities associated with TBTF but still leaving regulators the ability to invoke it under certain circumstances. FDIC resolutions were now required to proceed according to a least‐cost test, which would mean that uninsured depositors would often have to bear losses.” 11. In the case of the Franklin National Bank, the 20th‐largest bank in 1974, all depositors were fully protected and the Federal Reserve did provide advances to it due to enormous deposit outflows. Indeed, by the time the bank was closed, its borrowings from the Federal Reserve had reached $1.7 billion. These borrowings were repaid by the FDIC. Franklin, however, was treated as a purchase and assumption, and not considered to have received open bank assistance under essentiality (FDIC, 1997). 12. The other four banks supported under essentiality were Unity Bank and Trust in 1971, Bank of the Commonwealth in 1972, American Bank and Trust Company in 1974, and Farmers Bank of the State of Delaware in 1976. 13. See FDIC (1997) for a more detail discussion of this issue. The first of the five banks bailed out was Unity Bank in Boston in 1971. 14. It should be noted that, according to the New York Times, “The too‐big‐to‐fail doctrine, sometimes called T.B.T.F., goes back at least as far as Brandeis’ time, when, in 1914, the Treasury stepped in to provide financial aid to New York City. In the 1980s, when the government rescued Continental Illinois Bank, Stewart B. McKinney, a Connecticut Congressman, declared that the government had created a new class of banks, those too big to fail. The phrase returned and stuck” (http://www.nytimes.com/2009/06/21/weekinreview/21dash.html).

8
into Continental Illinois Corporation, the bank’s holding company, in exchange for preferred
stock convertible to 80 percent of the equity.15 These funds were then downstreamed to
Continental as equity capital to recapitalize the bank. In addition to the financial assistance, the
FDIC provided the assurance that all uninsured depositors and creditors of Continental would
be protected.16 The resolution of that troubled bank focused far greater attention on the
question as to whether certain banks or bank holding companies were indeed too big to fail.
The reason for Continental’s bailout, as noted earlier, was provided by Comptroller Conover in
the response to a question by Chairman St. Germain about whether he could “ever foresee one
of the 11 multinational money center banks failing.” Conover replied, “I admit that we don't
have a way right now. And so, since we don't have a way, your premise appears to be correct at
the moment” (Conover, 1984, pp. 299–300).
Conover did not identify particular banks, but these firms were easily named—as the
Wall Street Journal did in listing the 11 largest banks at the time‐‐those therefore considered
too big to fail (see table 1).17 These big banks accounted for nearly one‐third of the total assets
15. As regards the way in which the government bailed out Continental, Conover wrote: “We had two options. We could put capital in the form of debt directly into the bank. We couldn’t put preferred stock into the bank because there were covenants in the bond indentures of the holding company which said you couldn’t do that unless you had the permission of the bondholders. In this case, they were holders of bearer bonds which had been sold in Europe. Since we didn't have a chance of getting the bondholders’ approval, the FDIC could not have acquired preferred stock in the bank. Its only alternative was to put debt into the bank.
“The disadvantage of putting debt into the bank was that we would have ended up with a very strange looking balance sheet. There would have been a little bit of the remaining shareholders’ equity and a big pile of debt. We figured that it was not going to help the bank recover as it published its quarterly financial statements to have a balance sheet that didn’t look like a bank balance sheet ought to look.
“So we considered the other option—buying preferred stock in the holding company and having the holding company downstream it into the bank in the form of common stock equity. That satisfied our goal of having a sound looking bank balance sheet when the bank’s financial statements were published. It had the undesirable feature of propping up the holding company bondholders and commercial paperholders. “We knew that at the time, and there was significant debate back and forth about which was the preferable way
to go. The Treasury Department felt, and several memos were written to Mr. Volcker and Mr. Isaac and myself, that the alternative of putting debt into the holding company was the preferable one because you could always say “Oh, look, the Federal Government is standing behind this bank, anyway.” I felt and my fellow directors at the FDIC felt and Mr. Volcker felt that the appropriate way to go was the way we went—buying preferred stock in the holding company” (Conover, 1984, p. 302). 16. For a more detailed discussion of Continental, see Kaufman (2002), Shull (2010), FDIC (1997) and FDIC (2003). 17. See Wall Street Journal (1984).

9
in the banking industry at the end of 1983. Notice that the criterion emphasized to identify
banks as too big to fail was simply asset size.18
Table 1: Eleven banks considered “too big to fail” at year‐end 1983
Bank Location Total assets (US$ millions)
% of U.S. total bank assets
Cumulative assets as % of U.S. total bank
assets
1 Citibank New York 104,392 5.2 ‐
2 Bank of America San Francisco
104,085 5.2 10.4
3 Chase Manhattan Bank New York 72,956 3.6 14.0
4 Morgan Guaranty Trust New York 54,368 2.7 16.7
5 Manufacturers Hanover Trust New York 54,321 2.7 19.4
6 Chemical Bank New York 45,956 2.3 21.7
7 Continental Illinois National Bank & Trust Chicago 39,811 2.0 23.7
8 Bankers Trust New York 36,949 1.8 25.5
9 Security Pacific National Bank Los Angeles 34,329 1.7 27.2
10 First National Bank of Chicago Chicago 33,505 1.7 28.9
11 Wells Fargo Bank San Francisco
23,390 1.2 30.1
U.S. total commercial bank assets 2,018,593 30.1 30.1
Sources: Wall Street Journal, The Banker, Federal Reserve, Milken Institute.
In the case of Continental, it was the holding company that was bailed out; therefore,
the holding companies associated with each of the 11 big banks are listed in table 2. As may be
seen, the vast majority of the holding companies’ assets were their subsidiary banks, ranging
from a low of 83 percent to a high of 100 percent. Thus, in most of these cases, any action
taken to rescue the bank holding company would not encompass a relatively large percentage
of assets beyond those of the subsidiary bank. The situation has changed quite significantly in
recent years, with the repeal of the Glass–Steagall Act19 and the expansion of banks into
18. TBTF specifically defined as the invocation of the essentiality clause with regard to an institution was used only three times between the resolutions of Continental and the Bank of New England Corporation in January 1991. In the latter case, the FDIC extended guarantees to all uninsured depositors and two affiliated banks. The justification was that the continued operation of the three banks was essential to provide adequate depository services in their respective communities until an acquirer could be found. These three banks were ultimately taken over by the FDIC and sold to Fleet/Norstar Financial Group (see Shull, 2010). The focus of this paper is on open bank assistance to banks deemed too big to fail. 19. The Glass–Steagall Act separated commercial from investment banking in 1933 and was repealed in 1999.

10
broader activities, such as investment banking, market‐making, and full‐service asset
management.
Table 2: Holding companies of 11 big banks considered TBTF at year‐end 1983
Bank name
BHC name
BHC’s assets (US$
millions)
Bank assets as % of BHC’s assets
1 Citibank Citicorp 125,974 82.9
2 Bank of America Bank America Corp. 115,442 90.2
3 Chase Manhattan Bank Chase Manhattan Corp. 75,350 96.8
4 Morgan Guaranty Trust J.P. Morgan & Co. 56,186 96.8
5 Manufacturers Hanover Trust Manufacturers Hanover Corp. 60,918 89.2
6 Chemical Bank Chemical New York Corp. 47,789 96.2
7 Continental Illinois National Bank & Trust Continental Illinois Corp. 41,238 96.5
8 Bankers Trust Bankers Trust New York Corp. 36,952 100.0
9 Security Pacific National Bank Security Pacific Corp. 38,613 88.9
10 First National Bank of Chicago First Chicago Corp. 34,871 96.1
11 Wells Fargo Bank Wells Fargo & Co. 26,522 88.2
Sources: The Banker, Milken Institute.
The next important development in the TBTF saga occurred with the enactment of the
FDIC Improvement Act (FDICIA) in December 1991.20 Changes made in FDICIA were heavily
influenced by the savings and loan crisis of the 1980s, during which regulators extended
substantial forbearance to struggling banks, resulting in the expansion of taxpayer costs to
cover the bad loans made by savings and loans.21 According to Shull (2010), the law limited the
FDIC’s ability to provide open bank assistance for essential banks by requiring that it receive
concurrence from the Federal Reserve and the Treasury secretary, and consult with the
president. The law also placed new constraints on Federal Reserve loans to undercapitalized
banks.22 Moreover, FDICIA required federal banking regulators to take prompt corrective action
to identify and address capital deficiencies at banks in order to minimize FDIC losses.
20. It should be noted that in the late 1980s in some cases, the FDIC protected all depositors and creditors of a bank, while letting the parent holding company file for bankruptcy (e.g., First National Bank of Oklahoma City versus its holding company, the first Oklahoma Corporation). 21. See, for example, Barth (1991). 22. Also, see Kaufman (2002, pp. 427–428).

11
At the same time, however, FDICIA provided for a “systemic risk exception” to the
requirement that the FDIC resolve troubled institutions using the less costly alternative. The
exception was to be based upon the determination that the failure of an insured depository
institution would have serious adverse effects on broader economic conditions or financial
stability.23 Thus, FDICIA replaced the FDIA’s essentiality condition with the systemic risk
exception, although with a set of hurdles clearly meant to limit its use.
II. The U.S. Financial Crisis of 2007–2009 and Too Big to Fail
From late 1991 to the summer of 2008, the systemic risk exception was not invoked by
the regulatory authorities. Things changed in the fall of 2008, however. According to Hurley
(2010, p. 371), it was then that “[o]ut of concern for the effects of a possible failure, on
September 29, the FDIC acted for the first time under the systemic risk exception of the 1991
FDICIA and ordered Wachovia to sell itself to Citigroup.” Under the agreement initially made
between Citigroup, Wachovia, and the FDIC, Wachovia’s creditors were to be protected and the
FDIC would take on some of the bank’s potential losses in exchange for preferred stock and
warrants in Citigroup. The transaction was heavily motivated by the experience with
Washington Mutual a short time earlier, in which the FDIC had imposed unexpected, but legal,
losses on WaMu’s creditors, leading to an immediate spillover of funding pressures on other
banks, including Wachovia, that were seen as risky. Wachovia eventually stepped away from
the deal with Citigroup and sold itself to Wells Fargo without FDIC assistance.24 This first‐ever
use of the systemic risk exception was to represent an opening of the floodgates.
At the time of the Wachovia failure, the United States was experiencing its worst
financial crisis since the Great Depression.25 As part of a broad response, the October 2008
Emergency Economic Stabilization Act (EESA) authorized the secretary of the Treasury, under
the Troubled Asset Relief Program (TARP), to spend up to $700 billion to purchase and insure
23. The determination was to be made by the Board of Directors of the FDIC, the Board of Governors of the Federal Reserve, and the secretary of the Treasury (in consultation with the president). 24. For more detail, see Hurley (2010). 25. For discussion, see Barth et al. (2009), and Swagel (2009), among many others.

12
distressed assets. These purchases were expected to consist of mortgage‐backed securities, but
in the end TARP was used mostly to make capital injections into banks and other firms
(eventually including insurance companies and automakers; other TARP funds were spent on
foreclosure relief).26 Under TARP’s Capital Purchase Program, 707 banks received capital
injections from the government, amounting to $245 billion (see figure 1). Of these banks, 32
were among the 50 biggest banks in the United States in the fourth quarter of 2011.27 American
International Group (AIG), General Motors, and Chrysler also received capital injections, while
auto parts suppliers received guarantees. Fannie Mae and Freddie Mac received government
capital injections amounting to $180.4 billion as of early 2012 under the Housing and Economic
Recovery Act of 2008 (HERA).
Figure 1: Total government capital injections to U.S. financial institutions: US$ 425.4 billion28
26. The capital injections were undertaken in the form of preferred and eventually common stock in banks. These were seen as purchases of troubled assets, though of equity rather than mortgage‐backed securities (MBS). 27. See Appendix 1 for information on the 50 biggest banks in the United States and Appendix 2 for information on the 39 financial institutions that received the largest capital injections. 28. Of the total disbursed, the government, as of August 31, 2011, has received back a total of $314 billion, representing about three‐fourths of all TARP investments. Also, for the banking program, $226 billion out of $245 billion has been repaid (http://www.treasury.gov/initiatives/financial‐stability/briefing‐room/news/Documents/TARP%20Three%20Year%20Anniversary%20Report.pdf).

13
Freddie Mac, 12%
Fannie Mae, 14%
AIG, 16%
32 of the 50 biggest banks as
of Q4 2011 that
received bailouts,
52%
Other 675 received bailouts,
6%
Total government capital injection to U.S. financial institutions: US$425.4 billion
Other 675 received bailouts,
11%
32 of the current 50
biggest banks as
of Q4 2011 that
received bailouts,
89%
Total government capital injection to U.S. banks (excluding AIG, Fannie Mae, and
Freddie Mac): US$245 billion
Note: The “other 675” refers to all types of financial institutions that received financial assistance from the government. The period covered for capital injections is 2008–2009. Sources: U.S. Treasury Department, Milken Institute.
The fact that 89 percent of the TARP’s capital purchase program funds went to 32 big
banks,29 while the other 11 percent went to the 675 smaller institutions, again focused
substantial attention on the TBTF issue. Indeed, even the Federal Reserve (2012) stated:
As a result of the imprudent risk taking of major financial companies and the severe consequences to the financial system and the economy associated with the disorderly failure of these interconnected companies, the U.S. government (and many foreign governments in their home countries) intervened on an unprecedented scale to reduce the impact of, or prevent, the failure of these companies and the attendant consequences for the broader financial system. Market participants before the crisis had assumed some probability that major financial companies would receive government assistance if they became troubled. But the actions taken by the government in response to the crisis, although necessary, have solidified that market view.
The Federal Reserve went on to point out that:
The market perception that some companies are “too big to fail” poses threats to the financial system. First, it reduces the incentives of shareholders, creditors and counterparties of these companies to discipline excessive risk‐taking. Second, it produces competitive distortions because companies perceived as “too big to fail” can often fund themselves at a lower cost than other companies. This distortion is
29. These 32 banks were also among the biggest banks in the United States when they received capital injections.

14
unfair to smaller companies, damaging to competition, and tends to artificially encourage further consolidation and concentration in the financial system.
In response to these developments, Benjamin Bernanke (2010), Chairman of the Federal
Reserve Board, stated that “if the crisis has a single lesson, it is that the too big to fail problem
must be solved.”
A major goal of Dodd–Frank and other post‐crisis regulatory changes was to mitigate the
threat to financial stability posed by banks perceived as too big to fail.30 To accomplish this goal,
the Federal Reserve proposed implementing enhanced prudential standards and early
remediation requirements for the largest complex BHCs. These requirements together impose
considerable charges and constraints on the behavior of large banks and include requiring
them:
(1) to demonstrate their ability to maintain capital above existing minimum regulatory
capital ratios, and above a Tier 1 common equity ratio of 5 percent, under both expected and
stressed conditions over a minimum nine‐quarter planning horizon, as well as to satisfy a
quantitative risk‐based capital surcharge based on Basel Committee on Banking Supervision
(BCBS) guidelines;
(2) to comply with enhanced liquidity risk‐management standards, including liquidity
stress testing, as well as with the enhanced liquidity requirements for the G‐SIBs of Basel III.
(3) to not have a credit exposure to any unaffiliated company that exceeds 25 percent of
its capital;
(4) to maintain a debt‐to‐equity ratio of no more than 15:1, but only upon a
determination by the Financial Stability Oversight Council (FSOC) that (a) such company poses a
grave threat to the financial stability of the United States and (b) the imposition of such a
requirement is necessary to mitigate the risk that the company poses to U.S. financial stability;
(5) to be subjected to early remediation in financial distress, including for emerging or potential
issues, before they develop into larger problems.
30. In particular, Dodd–Frank requires the Federal Reserve to impose a package of enhanced prudential standards on bank holding companies with total consolidated assets of $50 billion or more, and nonbank financial companies the Financial Stability Oversight Council (FSOC) has designated for supervision by the Federal Reserve (together, covered companies and each a covered company) (Federal Reserve, 2012).

15
In the event that one of these BHCs encounters financial difficulty and early remediation
efforts fail, the Federal Reserve is to recommend to the Treasury Department and the FDIC that
the company be resolved under its new orderly liquidation authority. This means that the
company would be placed into FDIC receivership. This is to happen if the secretary of Treasury,
in consultation with the president, determines that the company is in default or in danger of
default; the default of the financial company would have a serious adverse effect on the
financial stability of the United States; no viable private‐sector alternative is available to
prevent the default; the effect on the claims or interests of its creditors, counterparties, and
shareholders, and other market participants is appropriate, given the impact that any action
would have on the financial stability of the United States; and an orderly liquidation would
avoid or mitigate such adverse effects.
Once the orderly liquidation authority is invoked, the FDIC can put taxpayer funds into
the company to keep it afloat for a limited period (which can be lengthy, just not indefinite) and
has broad authority to change contracts and impose losses on creditors. Any resources
deployed by the FDIC must be collateralized by the assets of the firm in liquidation, and any
eventual losses beyond the available assets are to be borne by creditors through an ex‐post
clawback provision from bondholders. If the losses exceed what can be imposed on
bondholders, then other financial firms will be assessed to cover the additional amount of
losses —in no case is the government allowed to bear the costs of liquidation without further
congressional authorization. As a result of the FDIC’s orderly liquidation authority, the
government at long last is trying to resolve the “too big to fail” problem. To re‐enforce this
point, Dodd–Frank seeks to eliminate open bank assistance by prohibiting the FDIC from taking
an equity interest in or becoming a shareholder of any such company.
A reasonable expectation is that the FDIC will use its liquidation authority to inject
funding to keep an institution afloat while it arranges for a buyer or for a wind‐down if no buyer
appears. Losses would be borne by shareholders first (who should expect to be wiped out), and
then by bondholders. The FDIC’s new role is meant to eliminate government bailouts while
providing policymakers with better tools to address the failure of a large, complex financial
institution than they had before the enactment of the EESA legislation and the TARP program.

16
Not everyone, however, is convinced that Dodd–Frank has solved the problem of too big
to fail. For instance, Johnson (2011) asserts several potential complications:31
First, the resolution authority under Dodd–Frank is purely domestic—there is no cross‐border dimension. This presents a major problem if large financial institutions, which typically have extensive international operations, need to be shut down in an orderly way. U.S. legislation can’t specify how assets and liabilities in other countries will be treated; this requires an intergovernmental agreement of some kind. … Second, it has never been clear that any government agency would be willing to use such resolution powers preemptively—before losses grow so large that they threaten to rock the macroeconomy. …Third, who would lose money in any potential liquidation? The fundamental premise of the resolution authority is that some creditors could face losses, but would they be imposed in an orderly and predictable manner to avoid undermining confidence and destabilizing the financial system? Any such thinking today seems far‐fetched.
Johnson argues that the problem lies with the biggest banks, and that since they “pose a
real threat”…“[t]he only credible way to counter this threat—and the only reasonable way to
protect our democracy—is to break them up.” Richard W. Fisher (2011), President of the
Federal Reserve Bank of Dallas, apparently shares this view, noting that “there is only one fail‐
safe way to deal with too big to fail. I believe that too‐big‐to‐fail banks are too‐dangerous‐to‐
permit. ... I favor an international accord that would break up these institutions into more
manageable size.” Former FDIC Chair Sheila Bair (2012) also states that “[i]t would surely be in
the government's interest to downsize megabanks.”
Others disagree with this approach. Krugman (2009), for example, states, “One
argument I don’t buy … is that we should try to shrink financial institutions down to the point
where nobody is too big to fail. Basically, it’s just not possible.” Federal Reserve Governor
Daniel K. Tarullo (2009) likewise has stated that “the conceptual and practical challenges in
breaking up the nation’s largest financial institutions … [make it] … more a provocative idea
than a proposal.” Calomiris (2009) agrees that “[l]imiting the size, complexity, and global reach
of financial institutions is fraught with downsides for the international economy.” He adds, “We
can solve the too‐big‐to‐fail problem without destroying global finance. It certainly is worth a
try.” A key issue in considering proposals to break up or shrink large financial institutions is to
31. Also, see Barth, Caprio, and Levine (2012).
17
gauge the costs and benefits of these firms. The Clearing House Association (2011) tallies
benefits, while Swagel (2011) provides further discussion.
III. How Big Are Big Banks in the United States?
Over time, the notion of which banks are too big to fail has undergone some
refinement. The initial view considered asset size, but more recent definitions, while still based
on asset size, take into account additional factors including complexity and systemic
interconnectedness.32
To answer the question posed in the section title, we focus on two measures. The first is
asset size. Recall that Dodd–Frank also focuses on asset size. Moreover, as will be seen,
regardless of other factors, the banks now subject to the most stringent U.S. regulatory scrutiny
all rank among the biggest banks. The second measure we use is bank asset size as a
percentage of U.S. GDP. This helps to gauge a bank’s size relative to the U.S. economy, while
recognizing that it compares the stock of assets against the annual flow of income. Simon
Johnson and James Kwak (2010, p. 214) argue that “no financial institution [s]hould be allowed
to control or have an ownership interest in assets worth more than a fixed percentage of U.S.
GDP.”
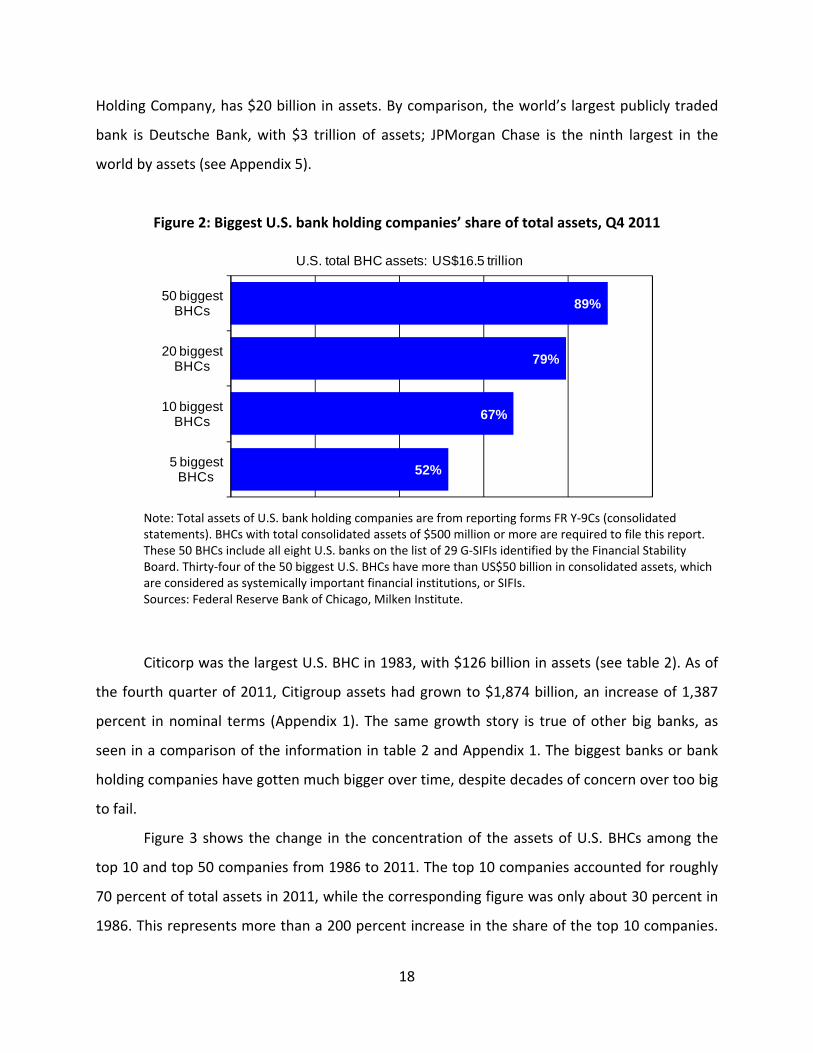
Figure 2 shows the share of total bank holding company assets accounted for by the five
largest U.S. BHCs ranging up through the 50 largest companies. The top five BHCs account for
slightly over half of all U.S. BHC assets, while the 50 largest BHCs account for 89 percent of total
assets; the next 966 BHCs hold the remaining 11 percent of assets.33 Information on these 50
BHCs is reported in Appendix 1.34 Of these companies, eight are included among the 29 G‐SIFIs.
The biggest BHC, JPMorgan Chase, has $2.3 trillion in assets, while the smallest, Hancock
32. The 29 G‐SIFIs identified by the Financial Stability Board and the Basel Committee on Banking Supervision at the G‐20 meeting on November 4, 2011, was based on the following factors, with the individual weights in parentheses: cross‐jurisdictional activity (20 percent), size (20 percent), interconnectedness (20 percent), substitutability (20 percent), and complexity (20 percent) (See BCBS, 2011). 33. Appendix 4 shows that the total assets of all U.S. bank holding companies equal $16.5 trillion, while the total assets of all U.S. commercial banks equal $12.6 trillion as of fourth quarter 2011. 34. Appendix 1 also shows that these bank holding companies differ substantially with respect to funding their assets with deposits, ratios of equity to assets, and ratios of market capitalization to equity.
18
Holding Company, has $20 billion in assets. By comparison, the world’s largest publicly traded
bank is Deutsche Bank, with $3 trillion of assets; JPMorgan Chase is the ninth largest in the
world by assets (see Appendix 5).
Figure 2: Biggest U.S. bank holding companies’ share of total assets, Q4 2011
52%
67%
79%
89%
5 biggest BHCs
10 biggest BHCs
20 biggest BHCs
50 biggest BHCs
U.S. total BHC assets: US$16.5 trillion
Note: Total assets of U.S. bank holding companies are from reporting forms FR Y‐9Cs (consolidated statements). BHCs with total consolidated assets of $500 million or more are required to file this report. These 50 BHCs include all eight U.S. banks on the list of 29 G‐SIFIs identified by the Financial Stability Board. Thirty‐four of the 50 biggest U.S. BHCs have more than US$50 billion in consolidated assets, which are considered as systemically important financial institutions, or SIFIs. Sources: Federal Reserve Bank of Chicago, Milken Institute.
Citicorp was the largest U.S. BHC in 1983, with $126 billion in assets (see table 2). As of
the fourth quarter of 2011, Citigroup assets had grown to $1,874 billion, an increase of 1,387
percent in nominal terms (Appendix 1). The same growth story is true of other big banks, as
seen in a comparison of the information in table 2 and Appendix 1. The biggest banks or bank
holding companies have gotten much bigger over time, despite decades of concern over too big
to fail.
Figure 3 shows the change in the concentration of the assets of U.S. BHCs among the
top 10 and top 50 companies from 1986 to 2011. The top 10 companies accounted for roughly
70 percent of total assets in 2011, while the corresponding figure was only about 30 percent in
1986. This represents more than a 200 percent increase in the share of the top 10 companies.

19
The top 50 companies also accounted for a larger share of total assets over this period. Their
share increased from roughly 60 percent in 1986 to 89 percent in 2011. The big are indeed
getting bigger.
Figure 3: Concentration of U.S. bank holding company assets, 1986–Q4 2011
0
10
20
30
40
50
60
70
80
90
100
Top 50 BHCs Top 10 BHCs
Percent
Sources: Federal Reserve Bank of Chicago, Milken Institute.
It is useful to point out that the biggest BHCs differ with respect to the importance of
their banking subsidiaries on a consolidated basis. For example, in the case of the largest BHC,
JPMorgan Chase & Co., its largest bank subsidiary, JP Morgan Chase Bank, accounts for 80
percent of assets on a consolidated basis (Appendix 4). This subsidiary bank is also the largest
bank in the United States. However, not all of the largest banks are subsidiaries of the largest
BHCs. Appendix 4 provides a list of the top 50 banks and their parent holding companies, as
well as the share of the total consolidated assets accounted for by the subsidiary banks. Based
upon these data, it could make a big difference whether a bailout occurs with a bank or a
BHC—indeed, a primary purpose of the new resolution authority was to allow the FDIC to
intervene at the holding company level, rather than at the bank subsidiary, as previously under

20
FDICIA. During the financial crisis of 2007–2009, a large portion of TARP capital injections went
to large BHCs (Appendix 2).35
Moreover, the Spearman rank correlation coefficient between asset size and funds
received is 0.92 (Appendix 3). This reflects the fact that the TARP capital injections generally
equaled 3 percent of banks’ risk‐weighted assets; thus, larger institutions received more TARP
funds. However, the correlation coefficients also indicate that the capital injection is
significantly and negatively correlated with both an institution’s common and tangible common
equity capital‐to‐asset ratios, while not significantly related to either an institution’s Tier1 risk‐
based or total risk‐based capital ratios. This indicates that the injections on average were
smaller for the better capitalized institutions, but “better capitalized” based only the two non‐
risk‐based measures of capital (Appendix 3).
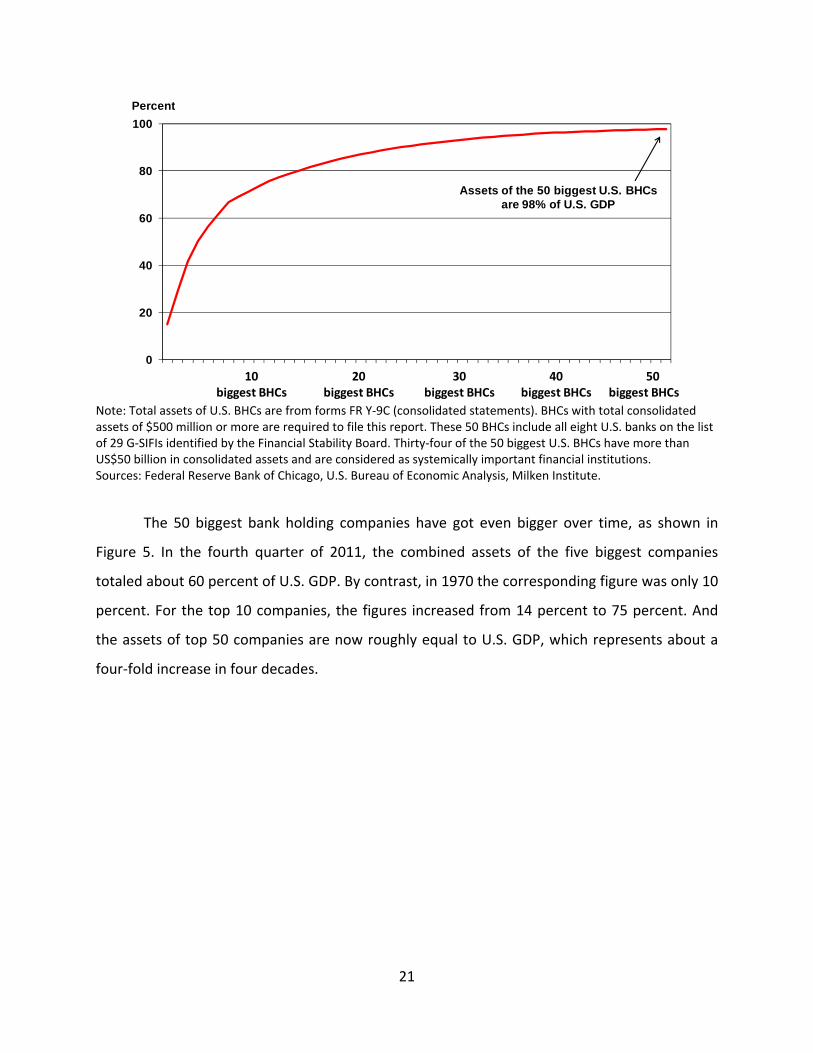
The other measure of bank bigness is asset size relative to GDP. Figure 4 shows that as
one adds the assets of more BHCs, the cumulative total relative to GDP reaches 98 percent for
the 50 biggest companies. The assets of just the 10 biggest companies equal 75 percent of GDP.
It could only take trouble at a few large financial companies to sharply curtail available credit
and disrupt real economic activity. A catastrophic scenario would be one in which difficulty at
key banks disrupts the payments system that constitutes the central nervous system of the U.S.
economy. Indeed, fear that the crisis would affect the payments system was a key motivating
factor behind the proposal of TARP.
Figure 4: Cumulative assets of the biggest U.S. bank holding companies
(% of U.S. GDP), Q4 2011
35. Appendix 2 shows for the 39 companies receiving the most funds, the amount each received. It also shows that the financial condition of the institutions differs substantially, depending upon the capital‐to‐asset ratio used.
21
0
20
40
60
80
100
1 2 3 4 5 6 7 8 91011121314151617181920212223242526272829303132333435363738394041424344454647484950
Assets of the 50 biggest U.S. BHCs are 98% of U.S. GDP
20 biggest BHCs
30 biggest BHCs
40 biggest BHCs
50 biggest BHCs
Percent
10 biggest BHCs
Note: Total assets of U.S. BHCs are from forms FR Y‐9C (consolidated statements). BHCs with total consolidated assets of $500 million or more are required to file this report. These 50 BHCs include all eight U.S. banks on the list of 29 G‐SIFIs identified by the Financial Stability Board. Thirty‐four of the 50 biggest U.S. BHCs have more than US$50 billion in consolidated assets and are considered as systemically important financial institutions. Sources: Federal Reserve Bank of Chicago, U.S. Bureau of Economic Analysis, Milken Institute.
The 50 biggest bank holding companies have got even bigger over time, as shown in
Figure 5. In the fourth quarter of 2011, the combined assets of the five biggest companies
totaled about 60 percent of U.S. GDP. By contrast, in 1970 the corresponding figure was only 10
percent. For the top 10 companies, the figures increased from 14 percent to 75 percent. And
the assets of top 50 companies are now roughly equal to U.S. GDP, which represents about a
four‐fold increase in four decades.

22
Figure 5: Growth of the biggest U.S. bank holding companies over 40 years
25%
33% 33%
49%
98%
0
20
40
60
80
100
1970 1980 1990 2000 2011
Percent Combined assets of the 50 biggest U.S. bank holding companies (% of U.S. GDP)
Sources: The Banker, the Federal Reserve Bank of Chicago, U.S. Bureau of Economic Analysis, Milken Institute.
IV. How Big Are the Biggest Banks in the World?
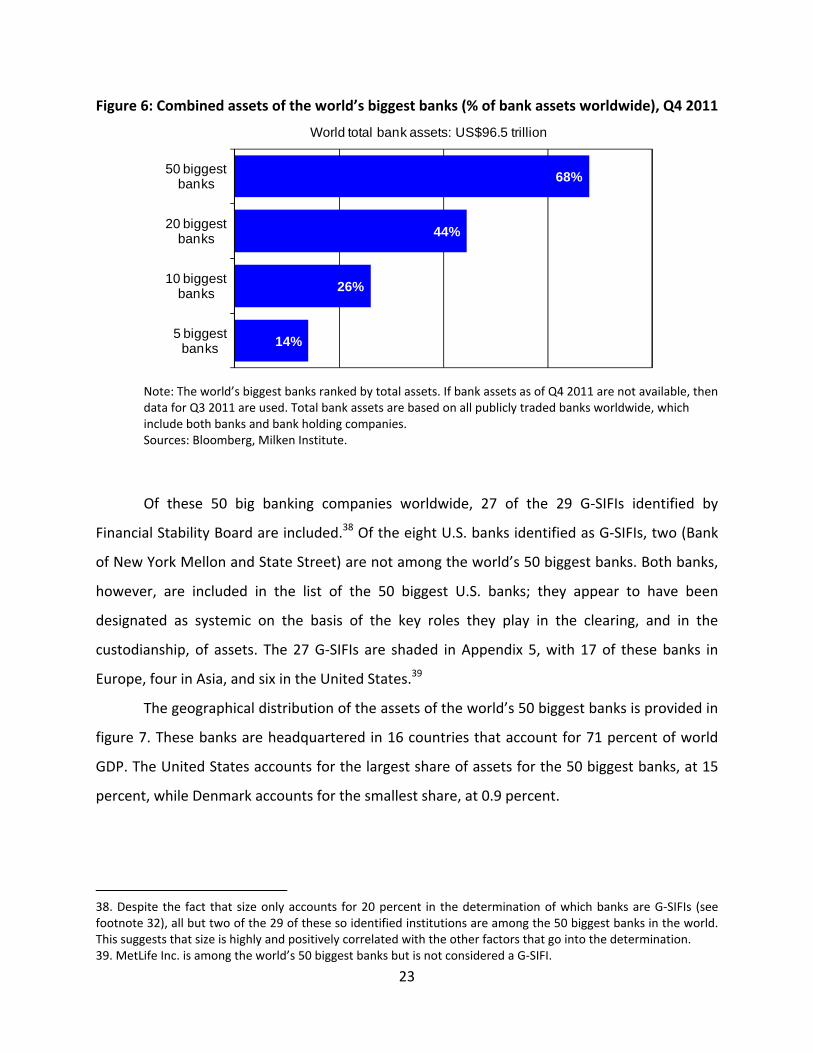
Based on asset size, the five biggest banks in the world accounted for 14 percent of total
bank assets in the fourth quarter of 2011.36 The 50 biggest banks or BHCs account for nearly 70
percent of total bank assets (see figure 6). Although still relatively high, the figures for the
concentration of bank assets worldwide are lower than the corresponding figures for U.S. bank
assets. Selected information on the 50 biggest banks in the world is provided in Appendix 5.37 It
is seen there that the world’s biggest bank is Deutsche Bank, with $3 trillion in assets as of the
fourth quarter of 2011. The smallest is Sumitomo Mitsui Trust Holdings of Japan, with $435
billion in assets.
36. The total assets of banks worldwide are based on publicly traded banks in 180 countries and obtained from Bloomberg. The IMF Global Financial Stability Report, September 2011, reports that the consolidated assets of commercial banks worldwide (latest available data) were $100 trillion in 2010. Based on Bloomberg and BankScope, the total assets of publicly traded commercial banks worldwide were $91.5 trillion in 2010 and, in the fourth quarter of 2011, $96.5 trillion. 37. Appendix 5 also shows that these banks or bank holding companies differ substantially with respect to funding their assets with deposits, ratios of equity to assets, and ratios of market capitalization to equity.
23
Figure 6: Combined assets of the world’s biggest banks (% of bank assets worldwide), Q4 2011
14%
26%
44%
68%
5 biggest banks
10 biggest banks
20 biggest banks
50 biggest banks
World total bank assets: US$96.5 trillion
Note: The world’s biggest banks ranked by total assets. If bank assets as of Q4 2011 are not available, then data for Q3 2011 are used. Total bank assets are based on all publicly traded banks worldwide, which include both banks and bank holding companies. Sources: Bloomberg, Milken Institute.
Of these 50 big banking companies worldwide, 27 of the 29 G‐SIFIs identified by
Financial Stability Board are included.38 Of the eight U.S. banks identified as G‐SIFIs, two (Bank
of New York Mellon and State Street) are not among the world’s 50 biggest banks. Both banks,
however, are included in the list of the 50 biggest U.S. banks; they appear to have been
designated as systemic on the basis of the key roles they play in the clearing, and in the
custodianship, of assets. The 27 G‐SIFIs are shaded in Appendix 5, with 17 of these banks in
Europe, four in Asia, and six in the United States.39
The geographical distribution of the assets of the world’s 50 biggest banks is provided in
figure 7. These banks are headquartered in 16 countries that account for 71 percent of world
GDP. The United States accounts for the largest share of assets for the 50 biggest banks, at 15
percent, while Denmark accounts for the smallest share, at 0.9 percent.
38. Despite the fact that size only accounts for 20 percent in the determination of which banks are G‐SIFIs (see footnote 32), all but two of the 29 of these so identified institutions are among the 50 biggest banks in the world. This suggests that size is highly and positively correlated with the other factors that go into the determination. 39. MetLife Inc. is among the world’s 50 biggest banks but is not considered a G‐SIFI.

24
Figure 7: Where the world’s 50 biggest banks are headquartered, Q4 2011
U.S., 15%
U.K., 15%
China, 13%
France, 12%
Japan, 11%
Germany, 6%
Switzerland, 4%
Australia, 4%
Canada, 4%
Spain, 4%
Italy, 3%
Netherlands, 3%
Belgium, 2%Brazil
2% Sweden, 1%
Denmark, 1%
Biggest 50 banks headquartered in 16 countries total assets = US$65.5 trillion
Sources: Bloomberg, BankScope, Milken Institute.
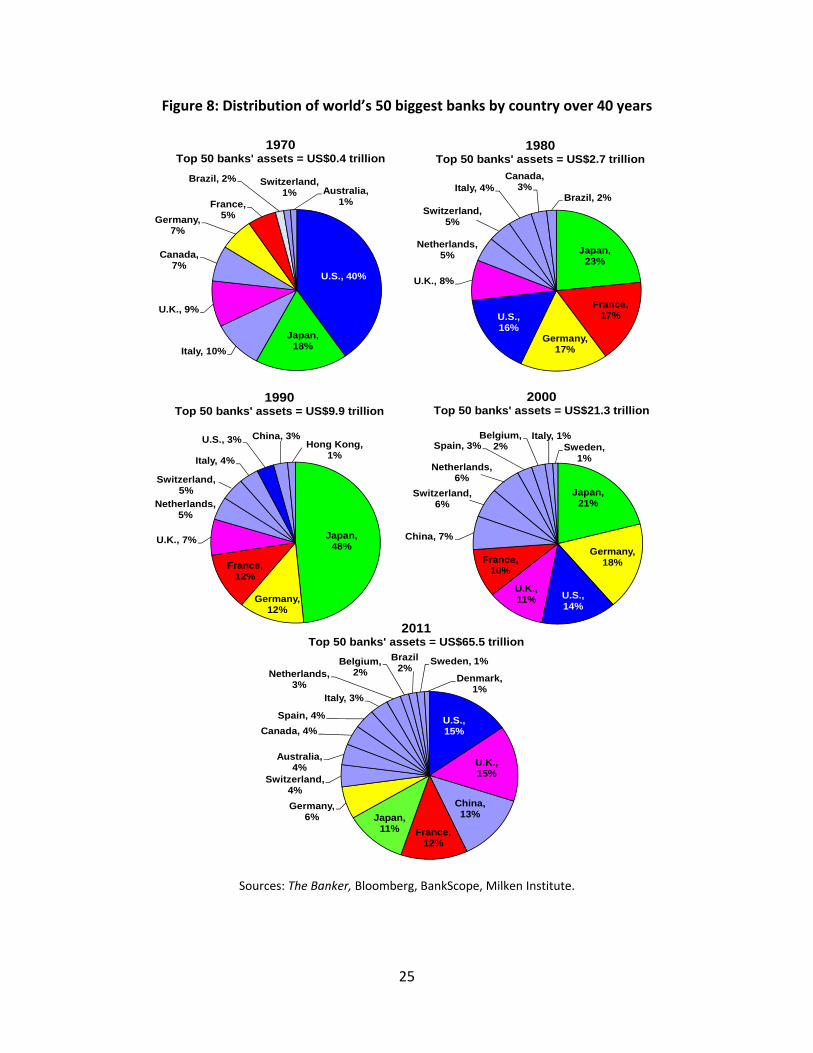
Figure 8 shows the distribution of the assets of the 50 biggest banks in the world by
country over the past 40 years. In 1970, the United States ranked first; its big banks accounted
for 40 percent of the total assets of the 50 biggest banks in the world. Japan took that position
in 1980, 1990, and 2000, before turning it back over to the United States in the fourth quarter
of 2011. But the U.S. share of assets was 15 percent most recently, far lower than its earlier
share. This is also the case for Japan. China’s share at the same time increased to 13 percent,
only 2 percentage points below that of the United States.
25
Figure 8: Distribution of world’s 50 biggest banks by country over 40 years
U.S., 40%
Japan, 18%Italy, 10%
U.K., 9%
Canada, 7%
Germany, 7%
France, 5%
Brazil, 2%Australia,
1%
1970Top 50 banks' assets = US$0.4 trillion
Switzerland, 1%
Japan, 23%
France, 17%
Germany, 17%
U.S., 16%
U.K., 8%
Italy, 4%Canada,
3%Brazil, 2%
1980Top 50 banks' assets = US$2.7 trillion
Switzerland, 5%
Netherlands, 5%
Japan, 48%
Germany, 12%
France, 12%
U.K., 7%
Italy, 4%
U.S., 3% China, 3%
1990Top 50 banks' assets = US$9.9 trillion
Switzerland, 5%
Netherlands, 5%
Hong Kong, 1%
Japan, 21%
Germany, 18%
U.S., 14%
U.K., 11%
France, 10%
China, 7%
Spain, 3%Belgium,
2%Italy, 1%
Sweden, 1%
2000Top 50 banks' assets = US$21.3 trillion
Netherlands, 6%
Switzerland, 6%
U.S., 15%
U.K., 15%
China, 13%
France, 12%
Japan, 11%
Germany, 6%
Switzerland, 4%
Australia, 4%
Canada, 4%
Spain, 4%
Italy, 3%
Netherlands, 3%
Belgium, 2%
Brazil2%
Sweden, 1%
Denmark, 1%
2011Top 50 banks' assets = US$65.5 trillion
Sources: The Banker, Bloomberg, BankScope, Milken Institute.

26
It is interesting to compare the assets of the world’s 50 biggest banks to world GDP,
similar to the measure taken for U.S. banks.40 Figure 9 shows that the assets of these 50 big
banks were nearly equal to world GDP in the fourth quarter of 2011. Assets belonging to the
top 10 banks were slightly more than one‐third of world GDP, while adding the next 10 biggest
banks increased the figure to almost two‐thirds. And the top 30 banks raise the figure to three‐
fourths of world GDP. Furthermore, seven of these banks have assets that exceed 100 percent
of the GDP of their home countries. These banks are indeed big banks, not only in terms of their
sheer asset size but also relative to world GDP.
Figure 9: Cumulative assets of the world’s biggest banks (% of world GDP), Q4 2011
0
20
40
60
80
100
1 2 3 4 5 6 7 8 91011121314151617181920212223242526272829303132333435363738394041424344454647484950
Assets of the world's 50 biggest banks are 94% of world GDP
20 biggest banks
30 biggest banks
40 biggest banks
50 biggest banks
Percent
10 biggest banks
Note: The 50 biggest publicly traded banks in the world ranked by total assets. World GDP is a 2011 IMF estimate. Sources: Bloomberg, International Monetary Fund, Milken Institute.
40. “Some might argue that since the European Union has a policy to create a single financial market, bank assets should be compared to the EU GDP rather than the national GDP of the country of headquarters, in which case the EU and U.S. figures would be of a comparable order of magnitude. However, such a comparison of aggregates is less relevant from a policy perspective: As the recent crisis brought home forcefully, de facto public guarantees for most banks come from the home country and only from there, a reality aptly summarized by the quip often attributed to Mervyn King that ’international banks are global in life, but national in death.’ In truth, the European reality is somewhat blurred by some banks’ multiple national allegiances” Goldstein and Veron (2011, p. 13).

27
These big banks, moreover, have gotten bigger over time. Figure 10 shows that while the
assets of the 50 biggest banks in the fourth quarter of 2011 totaled 94 percent of world GDP,
the corresponding figure was only 15 percent in 1970. This represents more than a six‐fold
increase in four decades. The figures for the top five, 10, and 20 banks show similar increases
over the period.
Figure 10: The world’s 50 biggest banks have gotten even bigger
15%
24%
45%
66%
94%
0
20
40
60
80
100
1970 1980 1990 2000 2011
Percent Combined assets of the world's 50 biggest banks (% of world GDP)
Sources: The Banker, Bloomberg, International Monetary Fund, World Bank, Milken Institute.
Figure 11 shows total injections of public capital by governments during the crisis to
financial institutions in the countries in which the 50 biggest banks worldwide are
headquartered. Information is provided for the 50 biggest banks worldwide that received
support, as well as for other financial institutions that received support (also see Appendix 6).
Of the 50 biggest banks worldwide, those receiving injections of public capital were
headquartered in only seven of the 16 countries. The biggest banks that received bailouts
account for a high of 100 percent of the total bailout amount, in the case of Switzerland, and a
low of 39 percent, in the case of Germany. The United States ranks third, at 89 percent of the
seven countries, in terms of the percentage of the total public support going to banks included
in the top 50 biggest banks in the world. In terms of total bailout funds, however, the United
States ranks first, the United Kingdom second, and Switzerland seventh. Overall, in six of the
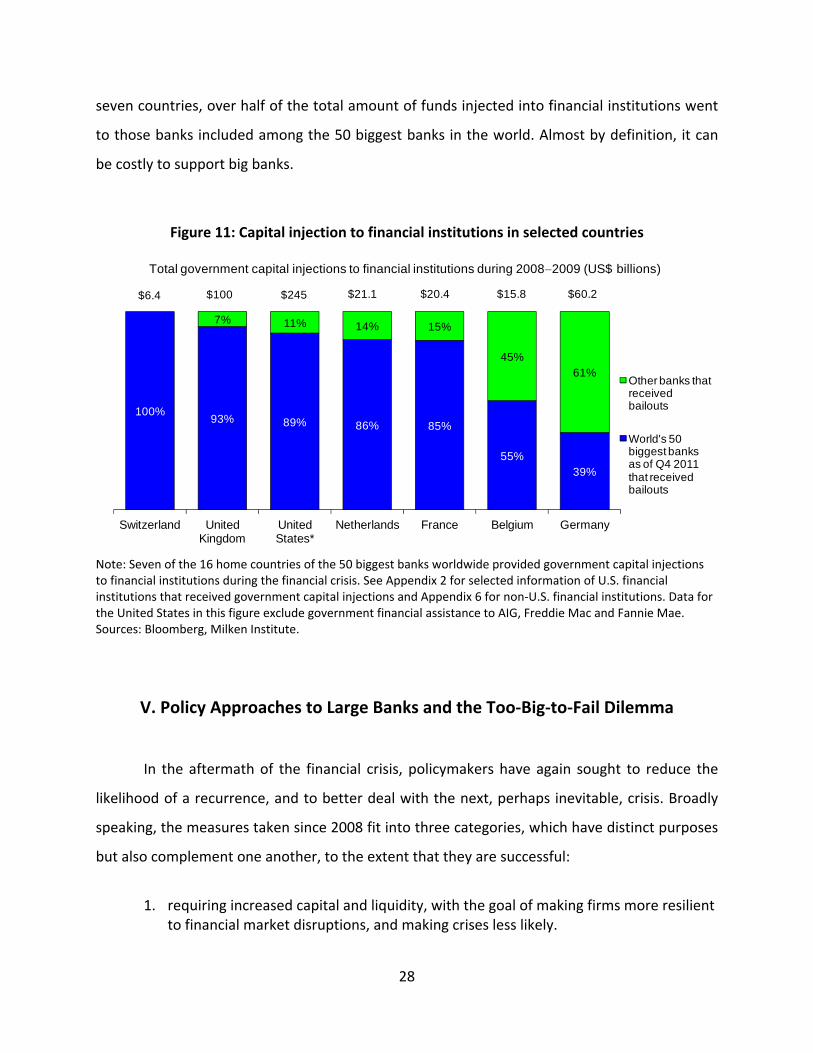
28
seven countries, over half of the total amount of funds injected into financial institutions went
to those banks included among the 50 biggest banks in the world. Almost by definition, it can
be costly to support big banks.
Figure 11: Capital injection to financial institutions in selected countries
100%93% 89% 86% 85%
55%39%
7% 11% 14% 15%
45%61%
Switzerland United Kingdom
United States*
Netherlands France Belgium Germany
Other banks that received bailouts
World's 50 biggest banks as of Q4 2011 that received bailouts
$6.4
Total government capital injections to financial institutions during 2008 ̶ 2009 (US$ billions)
$100 $245 $20.4 $21.1 $15.8 $60.2
Note: Seven of the 16 home countries of the 50 biggest banks worldwide provided government capital injections to financial institutions during the financial crisis. See Appendix 2 for selected information of U.S. financial institutions that received government capital injections and Appendix 6 for non‐U.S. financial institutions. Data for the United States in this figure exclude government financial assistance to AIG, Freddie Mac and Fannie Mae. Sources: Bloomberg, Milken Institute.
V. Policy Approaches to Large Banks and the Too‐Big‐to‐Fail Dilemma
In the aftermath of the financial crisis, policymakers have again sought to reduce the
likelihood of a recurrence, and to better deal with the next, perhaps inevitable, crisis. Broadly
speaking, the measures taken since 2008 fit into three categories, which have distinct purposes
but also complement one another, to the extent that they are successful:
1. requiring increased capital and liquidity, with the goal of making firms more resilient
to financial market disruptions, and making crises less likely.

29
2. restricting financial institutions’ activities and size, with the hope that this will reduce the risks they take and pose to the financial system.
3. devising a framework in which to deal with failures, including through corporate
“living wills,” expanded resolution authority, and perhaps eventually international coordination of bankruptcies for multinational financial firms.
The first, requiring additional capital and more secure access to liquidity, is meant to
ensure that firms have an increased buffer against losses and a greater ability to survive the
strains of a crisis. They also would provide increased protection for taxpayers before the
financial institution’s failure prompts consideration of a policy intervention. While most
financial institutions are likely to face increased requirements for capital under Basel III, firms
seen as systemically important globally have additional requirements. These requirements can
come about through both multinational efforts, such as the designation of global systemically
important banks; and through domestic regulation, such as Dodd–Frank, which subjects the
largest firms, with assets of $50 billion or more, to an enhanced supervisory regime that
includes both additional capital charges and other aspects of increased regulatory scrutiny.
Regulators in continental Europe have generally been comfortable with lower capital
requirements than have their counterparts in the U.S., the U.K, and Canada; this is often seen
as a reflection of the belief that additional public capital would be available to stabilize banks as
needed. Continuing difficulties with fiscal positions in Greece, Italy, Spain, and elsewhere could
put this belief to the test.41 The European approach contrasts with that of U.S., where it is
unlikely that another TARP‐like authority to inject taxpayer capital into banks will be enacted
for a considerable time because of public anger. As we discuss later, the orderly liquidation
authority of Dodd‐Frank allows the deployment of taxpayer resources, though not for indefinite
periods. Since this new authority is untested, it is unclear whether the act in reality facilitates
the use of public resources or instead prevents such steps.
Additional capital requirements for large or systemically important firms provide an
incentive against size (and perhaps complexity or interconnectedness). These might also be
seen as an “incentive” that offsets the possible funding advantages of large firms—a
41. For a short description of this problem, see Barth, Li, and Prabha (2011), among many others.

30
disincentive for size, but not a blunt restriction along the lines of the second category of policy
measures. Alternately, if a large institutional failure imposes costs on society, the additional
capital charges could be used to correct for the latent negative externality along the lines of a
Pigovian tax, though in this case the implicit revenue from the tax accrues to private suppliers
of capital rather than to the government.
It should be kept in mind that there are benefits to society from large financial
institutions, as well as costs, a point discussed by the Clearing House Association (2011) and
Swagel (2011).42 Moreover, the capital charge, as usual with a tax, results in a deadweight loss
in the form of reduced lending and economic activity. The quantitative importance of this
impact remains a subject of considerable debate. Admati et al. (2010) see little negative impact
of higher capital requirements, but Kashyap, Stein, and Hanson (2010) see a meaningful impact
on bank funding costs during the transition, while banks are raising additional equity capital,
and then a modest ongoing impact. Research from regulators points to modest impacts, while
banks and their associations point to greater ones. In the wake of the recent crisis, it is certain
that large financial institutions will hold more capital, both at the insistence of regulators and of
their own volition. Given the considerable changes in the financial industry and its regulation,
the ongoing impacts of higher capital standards will be understood only over time.
The second category of policy change involves limits on firms’ activities and scale. Dodd–
Frank imposes some limits on banking‐sector concentration, including caps of 10 percent on
any one institution’s share of total financial‐sector liabilities or any institution’s share of insured
deposits. These limits could affect future merger activity. Other provisions—such as the Volcker
Rule, which seeks to limit proprietary trading at banks, and the so‐called Lincoln Amendment,
which requires certain derivative trading activities to be pushed out of banks into separately
capitalized entities—would limit a firm’s activities. The presumption behind these policy actions
is that simpler institutions pose less risk to the financial system and broader economy because
42. It should be noted that only 7 of the 50 biggest banks in the world are U.S. banks (Appendix 5). To the extent that U.S. banks are limited in size they may be put at a competitive disadvantage as compared to the biggest banks in other countries that are not so limited. After all, as banks expand their geographical reach to tap into new markets, they may naturally become bigger in size.

31
some activities are inherently more risky and because simpler organizations are more easily
regulated.
An important concern with such provisions is that it is difficult to evaluate the cost‐
benefit ratio, largely because there is little evidence on either side. It is not clear, for example,
that a meaningful relationship exists between proprietary trading and the recent financial crisis.
The losses that led to problems at Lehman, Bear Stearns, WaMu, and other failed institutions
were connected to long‐term investments, such as mortgage‐backed securities and commercial
real estate, rather than to losses from the sort of short‐term trading activities targeted by the
Volcker Rule. In a sense, it is not even easy to pinpoint the problem to which the Volcker Rule is
the solution. This is not to say that there will be no benefits from it. For example, simpler
institutions may very well be less prone to problems and thus less apt to contribute to the
makings of a future crisis. But this is essentially conjecture, and an uneasy basis on which to
reorganize the financial system.
As noted in Swagel (2011), there are likely to be costs in terms of reduced liquidity and
increased transactions costs, which in turn translate into less investment, economic growth,
and job creation. Indeed, this concern is implicit in the exemption to the Volcker Rule with
respect to trading in Treasury securities. It is also implicit in the entreaties of domestic state
and local borrowers, and of foreign governments, for similar treatment. Similarly, while there
may be benefits from separating certain derivatives activities from bank holding companies that
encompass insured depository institutions, in terms of a simpler and more readily regulated
financial system, there is no evidence either way. Indeed, so far regulators have found it
difficult to implement these provisions of Dodd–Frank, raising further concerns about the
balance between benefits and costs.
The post‐crisis regulatory regime embodied in Dodd–Frank does not seek to break up
large financial institutions or to reinstitute broader barriers to their activities, as did the Glass–
Steagall Act separating commercial and investment banking. This perhaps reflects the
observation that the failures of firms in the crisis are not well correlated with the end of the
Glass–Steagall restrictions. Bear Stearns and Lehman Brothers both failed, for example, but
they were investment banks, while JPMorgan Chase combined investment banking and
commercial banking but weathered the crisis relatively well. An alternative to Glass–Steagall‐

32
like restrictions would be for regulators to focus more intently on activities that appear to pose
particular risks, and to act more pre‐emptively to head off systemic problems. This approach is
embodied in the creation of the Financial Stability Oversight Council (FSOC) as a body meant to
look across the financial system.
While Dodd–Frank does not actively seek to break up large banks, and while there
appears to be no such movement in other important global financial centers, the recent
regulatory process in some ways appears cognizant of the potential dangers that large financial
institutions pose. The Federal Reserve’s lengthy examination of the acquisition of ING Direct by
Capital One, for example, has been interpreted as an implicit cautionary warning about the
willingness of regulators to permit acquisitions that give rise to additional large‐scale financial
institutions.
The third category of policies involves changes to the framework for dealing with the
collapse of large or systemically important financial institutions. There are two motivations for
such policies: the first, making it easier to ensure the stability of the system, and a second,
alerting market participants to the fact that institutions are more likely to be allowed to fail and
thus creditors will be forced to take losses. Such recognition in turn may help remove
advantages that large firms previously enjoyed from a perception that they were too big to fail
and that their creditors would be supported in the event of a crisis.
The requirement for institutions to devise their own “living wills” might be a partly
symbolic step in the sense that even the most thoughtful plan could well be discarded in the
event of an actual crisis, especially if the genesis of the crisis was not well anticipated. Even so,
the preparation of a living will may provide a signal that regulators contemplate failures rather
than bailouts.
The new orderly liquidation authority in Title II of Dodd–Frank could fundamentally
change the way in which problems at large financial institutions are resolved. As noted earlier,
this should have profound impacts on the cost of funding for large, complex financial
institutions. Bondholders and other creditors are now more likely to incur losses if a firm fails,
even though the Title II authority allows for the deployment of government resources to
support a firm and slow its demise. Absent additional Congressional action (which is now
harder to imagine, given the unpopularity of the TARP), in the case of a future failure of a large

33
financial institution that involves resolution of the holding company beyond simply the insured
depository institution, bondholders will incur losses.
While it is difficult to predict how the resolution authority will be used, it seems likely
that the problems following Lehman’s demise will lead the FDIC to initially deploy government
funds to keep a firm in operation during resolution. The FDIC might then use its new Title II
authorities to arrange a debt‐for‐equity swap that recapitalizes the failing firm, with the former
bondholders as the new owners. Such a debt‐for‐equity recapitalization would be similar to a
pre‐packaged Chapter 11 reorganization under the bankruptcy code, although the Title II
authorities would allow this to be done faster and with the government providing the
equivalent of debtor‐in‐possession financing. Losses to the government from such financing
ultimately would be borne by bondholders. The resolution authority provides government
officials with an open checkbook to act through the troubled firm, with bondholders picking up
the tab. It seeks to narrow the FDIC’s scope of action in resolution by guaranteeing bondholders
that they will receive as much in resolution as would have been the case under bankruptcy, but
this still gives scope for actions to keep the firm operating under resolution.
The possibility of having such a swap imposed on them should affect the terms under
which potential creditors, such as bond buyers, are willing to provide funding to financial
institutions that might be taken into resolution. A potentially worrisome implication of the new
resolution authority is that it could give providers of funding to banks an incentive to flee at
early signs of trouble. Such a run from failing institutions is an important disciplining device, but
the regime change could mean a more hair‐trigger response and inadvertently prove
destabilizing.
The resolution authority will be incomplete and perhaps unworkable until there is more
progress on the international coordination of bankruptcy regimes. In the case of Lehman’s
failure, for example, the U.K. bankruptcy regime disrupted the operations of many U.S.‐based
firms when it froze their overseas assets. Appendix 7 illustrates the degree to which many large
financial institutions work broadly across the global financial system. While 85 percent or more
of some large institutions’ assets are domestic—those of Bank of America, Mitsubishi UFJ, or
especially the large Chinese banks—others, such as Barclays, have more than half of their assets
outside their home countries. International coordination of both regulatory regimes for both

34
normal times and during resolution or bankruptcy procedures will be crucial for the continued
evolution of the global financial system.43 As Brummer (2012) points out, “In the absence of
detailed, prescriptive global standards, national regulators enjoy considerable discretion with
regard to their local approaches. In practice, such flexibility means any one country’s efforts to
deal with the problem can potentially be undercut by another country’s inaction” (p. 250).
Other policy approaches combine the three categories listed in this section. The use of
regular stress tests, for example, that provides better information for regulators and market
participants, will in turn have an impact on bank behavior; transparency can provide a market‐
based incentive for prudence. While this will not directly address the potential for financial
institutions to become too big to fail, such information and the resulting incentives could help
affect behavior in a way that makes it less likely that future failures will transpire.
VI. Conclusion
The idea that some financial institutions are too big to fail is not new. Neither is the
challenge that such firms pose for policymakers. The regulatory regime for large, complex
financial institutions is undergoing a vast change from that which prevailed before the financial
crisis. Firms will now be required to hold more capital, have more robust access to liquidity,
undergo increased regulatory scrutiny, and face limitations on certain activities. In the United
States and in other countries, many of these changes are evolving as the rulemaking process
moves forward and as new regulations are implemented.
These changes will bring both costs and benefits. Higher capital and liquidity
requirements, for example, will affect lending activity and thus the overall economy, but the
quantitative impact remains to be seen. The new resolution authority is likely to have an impact
on creditor behavior and thus on funding costs, but it remains unclear how great this effect will
be. It will be necessary for policymakers to monitor such impacts over time and to adjust the
43. See, for example, Prabha and Wihlborg (2012) for a discussion of this issue as it relates to global bank organizational structure.

35
regime as needed to ensure that the benefits of improved stability are commensurate with the
costs involved.44
44. For a skeptical assessment of recent financial reform efforts and a new approach to improving regulatory performance, see Barth, Caprio, and Levine (2012).

36
References Admati, Anat R., Peter M. DeMarzo, Martin F. Hellwig, and Paul Pfleiderer, 2010. “Fallacies,
Irrelevant Facts, and Myths in the Discussion of Capital Regulation: Why Bank Equity Is Not Expensive,” Stanford GSB Research Paper No. 2063, September.
Barth, James R. 1991. The Great Savings and Loan Debacle. Washington, D.C.: The AEI Press. Barth, James R., Tong Li and Apanard Prabha 2011. “Greece’s ‘Unpleasant Arithmetic’:
Containing the Threat to the Global Economy,” Global Economy Journal, 11(4), article 6. Barth, James R., Gerard Caprio Jr., and Ross Levine. 2012. The Guardians of Finance: Making
Regulators Work for Us. MIT Press. Barth, James R., Tong Li, Wenling Lu, Triphon Phumiwasana, and Glenn Yago. 2009. The Rise
and Fall of the U.S. Mortgage and Credit Markets: A Comprehensive Analysis of the Meltdown. John Wiley & Sons.
Basel Committee on Banking Supervision (BCBS). 2011. Global Systemically Important Banks:
Assessment Methodology and the Additional Loss Absorbency Requirement, November. Bank of International Settlements.
Bair, Sheila. 2012. “Why It’s Time to Break Up the ‘Too Big to Fail’ Banks.” Fortune, February 6.
Bernanke, Ben S. 2010. “Causes of the Recent Financial and Economic Crisis.” Testimony Before the Financial Crisis Inquiry Commission, Washington, D.C., September 2.
Brummer, Chris. 2012. Soft Law and the Global Financial System: Rule Making in the 21st
Century, Cambridge University Press. Calomiris, Charles. 2009. “In the World of Banks, Bigger Can Be Better.” Wall Street Journal,
October 19. Carrington, Tim. 1984. “U.S. Won’t Let 11 Biggest Banks in Nation Fail.” Wall Street Journal,
September 20. Clearing House Association, 2011. “Understanding the Economics of Large Banks,” November.
Available on http://www.theclearinghouse.org/index.html?f=073071. Conover, C.T. 1984. “Testimony: Inquiry Into the Continental Illinois Corp. and Continental
Illinois National Bank.” Hearings Before the Subcommittee on Financial Institutions Supervision, Regulation, and Insurance of the Committee on Banking, Finance and Urban Affairs, U.S. House of Representatives, 98th Cong., 2nd Session, September 18, 19 and October 4: 172‐391.

37
Federal Depository Insurance Corporation (FDIC). 1984. “Chapter 5: Handling Bank Failures.” In
a History of the FDIC 1933‐1983. Washington, D.C. Federal Depository Insurance Corporation (FDIC). 1997. “Chapter 7: Continental Illinois and Too
Big to Fail.” In History of the Eighties: Lessons for the Future, Volume I: An Examination of the Banking Crises of the 1980s and Early 1990s. Washington, D.C.
Federal Depository Insurance Corporation (FDIC). 2003. “Case Studies of Significant Bank
Resolutions, Chapter 4: Continental Illinois National Bank and Trust Company.” In Managing the Crisis: The FDIC and RTC Experience, Volume 2: Symposium. Washington, D.C.
FDIC Law, Regulations, Related Acts, Federal Deposit Insurance Act, SEC. 13 (a) Investment of
Corporation's Funds. 2011. FDIC. http://www.fdic.gov/regulations/laws/rules. (Accessed December 20, 2011).
Federal Reserve. 1933. Federal Reserve Bulletin, 19(3): 117. Federal Reserve. 2012. “Enhanced Prudential Standards and Early Remediation Requirements
for Covered Companies.” Federal Register, January 5. https://federalregister.gov/a/2011‐33364. (Accessed January 10, 2012).
Feldman, Ron J., and Authur J. Rolnick. 1998. “Fixing FDICIA: A Plan to Address the Too Big to
Fail Problem.” Annual Report 1997, Federal Reserve Bank of Minneapolis: 2‐22. Final Report on the Reconstruction Finance Corporation, Secretary of the Treasury, 1959.
http://fraser.stlouisfed.org/docs/publications/rcf/rfc_19590506_finalreport.pdf. (Accessed January 10, 2012).
Fischer, Richard W. 2011. “Taming the Too‐Big‐to‐Fails: Will Dodd–Frank Be the Ticket or Is Lap‐
Band Surgery Required?” Remarks before Columbia University’s Politics and Business Club, New York City, November 15. http://dallasfed.org/news/speeches/fisher/2011/fs111115.cfm. (Accessed December 20, 2011).
Goldstein, Morris, and Nicolas Veron. 2011. “Too Big to Fail: The Transatlantic Debate.”
Peterson Institute for International Economics Working Paper Series 11‐2. Hurley, Cornelius. 2010. “Paying the Price for Too Big to Fail.” Entrepreneurial Business Law
Journal, 4(2): 351–390.

38
Johnson, Simon. 2011. “Too‐Big‐To‐Fail Not Fixed, Despite Dodd–Frank.” Bloomberg, October 10. http://www.bloomberg.com/news/2011‐10‐10/too‐big‐to‐fail‐not‐fixed‐despite‐dodd‐frank‐commentary‐by‐simon‐johnson.html. (Accessed December 20, 2011).
Johnson, Simon and James Kwak. 2010. 13 Bankers: The Wall Street Takeover and the Next
Financial Meltdown. New York: Pantheon. Kashyap, Anil K, Jeremy C. Stein, and Samuel Hanson, 2010. “An Analysis of the Impact of
‘Substantially Heightened’ Capital Requirements on Large Financial Institutions,” Harvard University mimeo, May 2010.
Kaufman, George G. 2002. “Too Big to Fail in Banking: What Remains?” The Quarterly Review of
Economics and Finance, 42: 423–436. King, Mervyn. 2010. Speech at the Lord Mayor’s Banquet for Bankers and Merchants of the City
of London at the Mansion House, June 16. Krugman, Paul. 2009. “Too big to fail FAIL.” New York Times, June 18.
http://krugman.blogs.nytimes.com/2009/06/18/too‐big‐to‐fail‐fail. (Accessed December 20, 2011).
Mullineux, Andy. 2012. “The Governance of ‘Too Big to Fail’ Banks” in James R. Barth, Chen Lin,
and Clas Wihlborg (eds.), International Research Handbook on Banking and Governance, Edward Elgar Publishing, 2012.
Prabha, Apanard and Clas Wihlborg. 2012. “Cross‐Border Banking in Subsidiaries and Branches;
Organization, Supervision and Resolution.” in Gerard Caprio (ed.), Encyclopedia of Financial Globalization, Elsevier.
Shull, Bernard. 2010. “Too Big to Fail in Financial Crisis: Motives, Countermeasures, and
Prospects.” the Levy Economics Institute of Brad College Working Paper, No. 601. Swagel, Phillip, 2009. “The Financial Crisis: An Inside View,” Brookings Papers on Economic
Activity, April. Swagel, Phillip 2011. Testimony on “Enhanced Supervision: A New Regime for Regulating Large,
Complex Financial Institutions Testimony on large complex financial institutions,” Senate Banking Committee, December 7, 2011.
Tarullo, Daniel K. 2009. “Confronting Too Big to Fail.” Speech at the Exchequer Club,
Washington, D.C., October 21. Todd, Walker F. 1992. “History of and Rationales for the Reconstruction Finance Corporation.”
Federal Reserve Bank of Cleveland Economic Review, 28(4): 22‐35.

39
Appendix 1: U.S. 50 biggest bank holding companies, Q4 2011 (8 of 29 G‐SIFIs identified by the Financial Stability Board are highlighted)
Bank holding company Total assets ($ billions)
Total assets (% of U.S.
GDP)
Deposits to Total assets
(%)
Common equity to total assets
(%)
Market cap to common equity
(%)
JPMorgan Chase & Co. 2,266 14.8 49.8 7.8 71.1 Bank of America Corporation 2,137 13.9 48.4 9.9 27.6 Citigroup Inc. 1,874 12.2 46.4 9.6 42.9 Wells Fargo & Company 1,314 8.6 70.1 9.9 111.4 Goldman Sachs Group Inc. 924 6.0 5.0 7.4 67.9 Metlife, Inc. 800 5.2 1.3 7.3 56.7 Morgan Stanley 750 4.9 8.8 9.1 42.5 Taunus Corporation 355 2.3 7.8 1.5 Private U.S. Bancorp 340 2.2 67.9 9.5 159.6 HSBC North America Holdings Inc. 331 2.2 41.5 9.5 Private Bank of New York Mellon Corporation 326 2.1 67.4 10.5 70.4 PNC Financial Services Group Inc. 271 1.8 69.3 13.1 85.3 State Street Corporation 216 1.4 72.7 8.7 103.8 Capital One Financial Corporation 206 1.3 62.3 14.4 65.6 TD Bank US Holding Company 201 1.3 81.5 10.6 n.a Ally Financial Inc. 184 1.2 23.3 6.8 n.a. SunTrust Banks Inc. 177 1.2 72.3 11.2 47.8 BB&T Corporation 175 1.1 71.6 10.0 100.4 American Express Company 152 1.0 28.3 12.3 292.1 Citizens Financial Group Inc. 130 0.8 71.6 18.0 n.a Regions Financial Corporation 127 0.8 75.3 10.5 40.6 BMO Financial Corp 117 0.8 64.1 11.2 Private Fifth Third Bancorp 117 0.8 73.5 11.0 91.0 Northern Trust Corporation 100 0.7 82.5 7.1 134.3 UnionBanCal Corporation 90 0.6 71.8 13.2 n.a KeyCorp 89 0.6 69.8 10.9 76.1 RBC USA Holdco Corporation 83 0.5 25.5 10.9 Private BancWest Corporation 78 0.5 70.4 10.9 n.a M&T Bank Corporation 78 0.5 76.2 10.8 114.2 Discover Financial Services 69 0.5 57.0 12.0 156.7 BBVA USA Bancshares Inc. 63 0.4 73.0 16.7 Private Comerica Incorporated 61 0.4 78.2 17.2 48.6 Huntington Bancshares Incorporated 54 0.4 79.6 12.6 69.1 Zions Bancorporation 53 0.3 80.7 9.6 59.0 Utrecht-America Holdings Inc. 47 0.3 18.0 9.9 Private CIT Group Inc. 45 0.3 13.7 4.0 386.8 New York Community Bancorp Inc. 42 0.3 53.1 21.2 60.8 Popular, Inc. 37 0.2 74.8 14.9 25.6 First Niagara Financial Group Inc. 33 0.2 59.6 11.8 78.0 Synovus Financial Corp. 27 0.2 82.5 16.4 24.8 BOK Financial Corporation 25 0.2 73.6 7.4 208.9 First Horizon National Corporation 25 0.2 65.4 11.2 73.9 City National Corporation 24 0.2 86.1 11.3 86.4 East West Bancorp Inc. 22 0.1 79.6 9.8 137.5 Associated Banc-Corp 22 0.1 68.8 10.2 87.5 First Citizens Bancshares Inc. 21 0.1 84.2 13.4 64.2 Commerce Bancshares Inc. 21 0.1 81.3 9.0 182.9 Cullen/Frost Bankers Inc. 20 0.1 82.6 10.6 149.4 SVB Financial Group 20 0.1 83.7 11.4 90.9 Hancock Holding Company 20 0.1 79.4 11.4 120.3 TOTAL ASSETS 14,759
n.a. = Not available (the company is a subsidiary or has a pending listing). Sources: Federal Reserve Bank of Chicago, National Information Center, Federal Reserve, Bloomberg, U.S. Bureau of Economic Analysis.

40
Appendix 2: Financial institutions that received U.S. government capital injections
Bank
Government financial assistance
Current Status Selected information prior to first receiving funds (1)
First received
Funds received
($ billions)
50 biggest BHCs as
of Q4 2011
Total assets
(US$bn) (Q4, 2011)
Total assets
($ billions)
Risk-weighted assets
($ billions)
Common equity to assets
(%)
Tangible common equity to
assets ratio (%)
Tier1 risk-based capital ratio
Total risk-
based capital ratio
1 AIG 11/25/2008 69.8 N/A 556 1,022 n.a. 7.0 3.6 n.a. n.a.
2 Fannie Mae 2/25/2009 59.9 N/A 3,211 912 n.a. -4.1 -4.1 n.a. n.a.
3 Freddie Mac 11/24/2008 50.7 N/A 2,172(2) 804 n.a. -3.6 n.a. n.a. n.a.
4 Citigroup Inc. 10/28/2008 45.0 Yes 1874 2,050 1,176 4.8 2.1 8.2 11.7
5 Bank of America Corporation 10/26/2008 45.0 Yes 2137 1,831 1,329 7.5 2.5 7.6 11.5
6 Wells Fargo & Company 10/29/2008 25.0 Yes 1314 1,310 1,101 5.2 2.3 7.84 11.83
7 JPMorgan Chase & Co. 10/28/2008 25.0 Yes 2266 2,251 1,261 6.1 3.8 8.9 12.6
8 Morgan Stanley 10/26/2008 10.0 Yes 750 987 297 3.5 3.1 12.7 19.0
9 Goldman Sachs Group Inc. 10/28/2008 10.0 Yes 924 1,082 379 3.9 3.4 11.6 15.2
10 PNC Financial Services Group Inc. 12/31/2008 7.6 Yes 271 146 120 9.8 3.4 8.2 11.9
11 U.S. Bancorp 11/14/2008 6.6 Yes 340 247 223 8.2 3.7 8.5 12.3
12 SunTrust Banks Inc. 11/14/2008 4.9 Yes 177 175 162 10.0 5.8 8.2 11.2
13 Capital One Financial 11/14/2008 3.6 Yes 206 155 n.a. 16.5 8.3 12.0 14.9
14 Regions Financial Corp 11/14/2008 3.5 Yes 127 146 116 9.2 5.0 10.4 14.6
15 Fifth Third Bancorp 12/31/2008 3.4 Yes 117 116 114 8.3 5.0 8.6 12.3
16 Hartford Financial SVCS 6/26/2009 3.4 No 304 276 n.a. 2.8 2.5 n.a. n.a.
17 American Express Company 1/9/2009 3.4 Yes 152 126 n.a. 9.4 7.0 9.7 11.1
18 BB&T Corporation 11/14/2008 3.1 Yes 175 137 212 9.4 5.2 9.4 14.4
19 Bank of New York Mellon Corp. 10/26/2008 3.0 Yes 326 268 125 10.3 2.0 9.3 12.8
20 KeyCorp 11/14/2008 2.5 Yes 89 101 109 7.9 6.2 8.6 12.4
21 CIT Group Inc. 12/31/2008 2.3 Yes 45 n.a. n.a. n.a. n.a. n.a. n.a.
22 Comerica Incorporated 11/14/2008 2.3 Yes 61 65 n.a. 7.4 7.2 10.7 14.7
23 State Street Corporation 10/26/2008 2.0 Yes 216 286 75 4.6 2.3 16.0 17.2
24 Northern Trust Corporation 11/14/2008 1.6 Yes 100 82 51 6.0 5.4 13.1 15.4
25 Zions Bancorporation 11/14/2008 1.4 Yes 53 55 52 8.9 5.7 10.2 14.3
26 Huntington Bancshares Incorporated 11/14/2008 1.4 Yes 54 55 47 10.6 4.3 8.8 12.0
27 Discover Financial Services 3/13/2009 1.2 Yes 69 40 n.a. 14.8 13.7 n.a. n.a.
28 Synovus Financial Corp. 12/19/2008 1.0 Yes 27 34 32 9.8 8.4 8.8 12.2
29 Lincoln National Corp. 7/10/2009 1.0 No 203 167 n.a. 5.4 3.4 n.a. n.a.
30 Popular Inc. 12/5/2008 0.9 Yes 37 40 31 6.0 4.4 9.1 10.4
31 M&T Bank Corporation 11/14/2008 0.6 Yes 78 66 37 9.4 4.3 8.8 12.8
32 First Horizon National Corporation 11/14/2008 0.9 Yes 25 33 26 7.9 7.1 11.1 16.1

41
Bank
Government financial assistance
Current Status Selected information prior to first receiving funds (1)
First received
Funds received
($ billions)
50 biggest BHCs as
of Q4 2011
Total assets
(US$bn) (Q4, 2011)
Total assets
($ billions)
Risk-weighted assets
($ billions)
Common equity to assets
(%)
Tangible common equity to
assets ratio (%)
Tier1 risk-based capital ratio
Total risk-
based capital ratio
33 Associated Banc-Corp 11/21/2008 0.5 Yes 22 22 18 10.5 6.2 9.2 11.1
34 Webster Financial Corp. 11/21/2008 0.4 No 19 18 14 9.1 4.8 10.8 13.2
35 City National Corporation 11/21/2008 0.4 Yes 24 16 27 10.2 7.1 9.1 11.0
36 First BanCorp 1/16/2009 0.4 No 14(2) 19 14 5.1 4.9 11.6 12.8
37 East West Bancorp, Inc. 12/5/2008 0.3 Yes 22 12 n.a. 9.4 6.5 8.8 10.6
38 SVB Financial Group 12/12/2008 0.2 Yes 20 8 n.a. 9.1 9.0 9.9 14.3
39 First Niagara Financial Group Inc. 11/21/2008 0.2 Yes 33 9 6 16.0 7.1 7.6 11.3
Other 668 financial institutions 20.1 No
Total BHCs that received bailouts and are current among 50 biggest BHCs
Total = $218
32 BHCs
Total = 12,131
Total = 11,954
Total = 7,198
Average for 32 BHCs which are currently among 50 biggest BHCs
8.7 5.4 9.7 13.1
Average for all publicly traded U.S. banks (prior to the bailout period) (2)
8.7 8.1 14.6 13.8
Note: First Niagara Financial Group is included as the last bank on the list of Capital Purchase Program because it is included in our list of the 50 U.S. biggest banks. N/A = Not Applicable n.a. = Not Available (1) The subsequent quarter is used if the data in the quarter prior to bailout is not available. (2) As of Q3 2011.
Sources: Bloomberg, Milken Institute.

42
Appendix 3: Spearman rank correlations (based on information from Appendix 2)
Funds received
Total assets (Q4, 2011)
Pre-bailout total assets
Pre-bailout risk-weighted assets
Pre-bailout equity to total
assets
Pre-bailout tangible
common equity to total assets
Pre-bailout Tier1 risk-based
capital Total assets (Q4, 2011) 0.9197** (0.0000) 39 Pre-bailout total assets 0.9162** 0.9677** (0.0000) (0.0000) 38 38 Pre-bailout risk-weighted assets
0.9711** 0.9571** 0.9543** (0.0000) (0.0000) (0.0000)
27 27 27 Pre-bailout equity to total assets
-0.4390** -0.4869** -0.5439** -0.4015** (0.0058) (0.0019) (0.0004) (0.0379)
38 38 38 27 Pre-bailout tangible common equity to total assets
-0.5865** -0.7189** -0.7508** -0.6536** 0.6063** (0.0001) (0.0000) (0.0000) (0.0002) (0.0001)
37 37 37 27 37 Pre-bailout Tier1 risk-based capital
-0.1977 -0.1986 -0.1221 -0.2566 -0.2851 0.1471 (0.2782) (0.2759) (0.5055) (0.1964) (0.1137) (0.4216)
32 32 32 27 32 32 Pre-bailout total risk-based capital
0.1186 0.1439 0.1830 0.0979 -0.3697** -0.0626 0.7432** (0.5178) (0.4320) (0.3162) (0.6271) (0.0373) (0.7337) (0.0000)
32 32 32 27 32 32 32 Note: The numbers in parentheses are p‐values, and the numbers in the third line are the number of observations. ** indicates the significance level of 5 percent.

43
Appendix 4: Fifty biggest U.S. commercial banks and their holding companies (BHCs), Q4 2011
Bank Total
assets ($ billions)
BHC name
Consolidated BHC total
assets ($billions)
Bank's total assets/BHC total assets
(%) JPMorgan Chase Bank, National Association 1,812 JPMorgan Chase & Co. 2,266 80.0 Bank of America, National Association 1,452 Bank of America Corporation 2,137 68.0 Citibank, National Association 1,289 Citigroup Inc. 1,874 68.8 Wells Fargo Bank, National Association 1,161 Wells Fargo & Company 1,314 88.4 U.S. Bank, National Association 330 U.S. Bancorp 340 97.2 PNC Bank, National Association 263 PNC Financial Services Group Inc. 271 97.0 Bank of New York Mellon 256 Bank of New York Mellon Corporation 326 78.6 State Street Bank & Trust Company 212 State Street Corporation 216 98.1 HSBC Bank USA, National Association 206 HSBC North America Holdings Inc. 331 62.2 TD Bank, National Association 189 TD Bank US Holding Company 201 94.0 SunTrust Bank 171 SunTrust Banks Inc. 177 96.8 Branch Banking and Trust Company 169 BB&T Corporation 175 96.7 FIA Card Services, National Association 167 Bank of America Corporation 2,137 7.8 Capital One, National Association 133 Capital One Financial Corporation 206 64.8 Regions Bank 123 Regions Financial Corporation 127 97.1 Chase Bank USA, National Association 122 JPMorgan Chase & Co. 2,266 5.4 Fifth Third Bank 115 Fifth Third Bancorp 117 97.9 RBS Citizens, National Association 107 Citizens Financial Group Inc. 130 82.4 Goldman Sachs Bank USA 104 Goldman Sachs & Group Inc. 924 11.2 The Northern Trust Company 100 Northern Trust Corporation 100 99.6 BMO Harris Bank, National Association 97 BMO Financial Corp 117 82.9 Union Bank, National Association 89 UnionBancal Corporation 90 99.2 KeyBank National Association 86 KeyCorp 89 97.1 Ally Bank 85 Ally Financial Inc. 184 46.4 Manufacturers & Traders Trust Company 77 M&T Bank Corporation 78 98.7 Capital One Bank USA, National Association 71 Capital One Financial Corporation 206 34.5 Discover Bank 68 Discover Financial Services 69 97.5 Morgan Stanley Bank, National Association 67 Morgan Stanley 750 8.9 Compass Bank 63 BBVA USA Bancshares Inc. 63 100.0 Bank of the West 62 BancWest Corporation 78 79.9 Comerica Bank 61 Comerica Incorporated. 61 99.7 The Huntington National Bank 54 Huntington Bancshares Incorporated 54 99.5 Deutsche Bank Trust Company Americas 51 Taunus Corporation 355 14.4 Wells Fargo Bank South Central, National 34 Wells Fargo & Company 1,314 2.6 First Niagara Bank, National Association 33 First Niagara Financial Group Inc. 33 99.8 First Republic Bank 28 Independent bank N/A N/A RBC Bank USA 27 RBC USA Holdco Corporation 83 32.7 Synovus Bank 27 Synovus Financial Corp 27 98.9 Metlife Bank, National Association 26 Metlife, Inc. 800 3.2 BOKF, National Association 25 BOK Financial Corporation 25 99.5 First Tennessee Bank, National Association 25 First Horizontal National Corporation 25 99.1 City National Bank 23 City National Corporation 24 98.5 East West Bank 22 East West Bancorp Inc. 22 100.0 Associated Bank, National Association 22 Associated Banc-Corp 22 99.0 First-Citizens Bank & Trust Company 21 First Citizens Bancshares Inc. 21 98.5 Commerce Bank 20 Commerce Bancshares Inc. 21 99.2 The Frost National Bank 20 Cullen/Frost Bankers Inc. 20 99.9 TCF National Bank 19 TCF Financial Corporation 19 100.0 Silicon Valley Bank 19 SVB Financial Group 20 93.9 Webster Bank, National Association 19 Webster Financial Corporation 19 98.3 Number of BHCs = 45‡ Total assets of 50 biggest banks: $9.8 trillion Total assets of 45 BHCs that control top 50 banks: $14.4 trillion Total assets of all U.S. banks: $12.6 trillion Total assets of all U.S. BHCs: $16.5 trillion Top 50 banks account for 77.8% of total bank assets These 45 BCHs account for 87% of total all BHC assets ‡ All but 2 of 45 holding companies (TCF Financial Corporation and Webster Financial Corporation) are on the list of the 50 biggest BHCs in Appendix 1. Total assets of U.S. bank holding companies are from reporting forms FR Y‐9Cs (consolidated statements). BHCs with total consolidated assets of $500 million or more are required to file this report. Sources: National Information Center, Federal Reserve, Federal Deposit Insurance Corporation, Milken Institute.

44
Appendix 5: World’s 50 publicly traded biggest banks and bank holding companies, Q4 2011 (27 of 29 G‐SIFIs identified by the Financial Stability Board are highlighted)
Bank Home country Total
assets ($ billions)
Assets (% of home
country GDP)
Deposits to assets (%)
Common equity to
assets (%)
Market cap to common equity (%)
Deutsche Bank AG Germany 3,082 84.9 25.8 2.4 46.8 BNP Paribas France 2,746 97.8 25.8 3.2 53.7 Mitsubishi UFJ Financial Group Japan 2,722 46.5 58.3 4.7 51.5 HSBC Holdings Plc United Kingdom 2,716 109.5 46.8 5.9 85.4 Barclays Plc United Kingdom 2,390 96.3 25 3.4 41.3 Industrial & Comm. Bank of China China 2,380 34.1 80.3 6.0 164.7 Crédit Agricole France 2,349 83.7 19.8 2.7 22.5 Royal Bank of Scotland Group Plc United Kingdom 2,315 93.3 35.8 4.6 17.4 JPMorgan Chase & Co. United States 2,266 14.8 49.8 7.8 71.1 Bank of America Corporation United States 2,137 13.9 48.4 9.9 27.6 Mizuho Financial Group Japan 2,057 35.1 49.1 2.9 59.7 Citigroup Inc United States 1,874 12.2 46.4 9.6 42.9 China Construction Bank China 1,852 26.5 82.7 6.6 181.3 Agricultural Bank of China China 1,824 26.1 83.7 5.4 136.7 Bank of China Limited China 1,814 26 68.8 6.2 125.4 ING Groep NV Netherlands 1,731 201.7 35.8 3.5 46 Banco Santander SA Spain 1,688 109.9 45.6 5.6 68.4 Société Générale France 1,684 60 26.7 3.9 26.6 Sumitomo Mitsui Financial Group Japan 1,673 28.6 63.2 3.9 67.5 UBS AG Switzerland 1,605 241 22.9 3.9 72.6 Lloyds Banking Group Plc United Kingdom 1,567 63.2 40.9 4.6 38.3 Wells Fargo & Company United States 1,314 8.6 70.1 9.9 111.4 UniCredit SpA Italy 1,283 57.1 41.3 5.8 53.4 Credit Suisse Group AG Switzerland 1,178 176.8 29.7 4.6 52.5 Commerzbank AG Germany 997 27.5 30.7 3.4 25.8 Goldman Sachs Group Inc. United States 924 6 5 7.4 67.9 Nordea Bank AB Sweden 906 158.5 27.6 3.8 91.6 Intesa Sanpaolo Italy 901 40.1 28.1 9 42.5 Banco Bilbao Vizcaya Argentaria SA Spain 789 51.4 44 7.1 75.5 Metlife, Inc. United States 800 5.2 1.3 7.3 56.7 Royal Bank of Canada RBC Canada 755 42.9 56.5 5.1 181.5 Morgan Stanley United States 750 4.9 8.8 9.1 42.5 Commonwealth Bank of Australia Australia 713 47.3 52.8 5.2 235.6 National Australia Bank Australia 712 47.3 42.7 5.3 128.1 Toronto Dominion Bank Canada 689 39.2 68.4 6.3 157.7 Bank of Communications Co. Ltd China 686 9.8 72.5 6 124.8 Natixis France 654 23.3 14 4 29.8 Westpac Banking Corporation Australia 643 42.6 46.4 6.5 144.6 Danske Bank Denmark 613 175.7 26.3 3.8 51.1 Bank of Nova Scotia Canada 578 32.9 65.2 5.8 172.4 Standard Chartered Plc United Kingdom 568 22.9 60.4 6.7 136.7 Banque Populaire (1) France 563 20.1 31.4 4.9 N/A Dexia Belgium 557 105.2 10.7 0.3 49.3 Australia and NZ Banking Group Australia 555 36.8 49.7 7 130 Resona Holdings Inc Japan 527 9 81.2 1.5 147.1 Banco do Brasil S.A. Brazil 512 20.4 42.7 5.8 120.9 Bank of Montreal-Banque de Montreal Canada 479 27.3 59.1 5.4 147.1 Fortis Bank -BNP Paribas Fortis Belgium 465 87.9 45.9 5.7 68.2 Itaú Unibanco Holdings Brazil 452 17.9 26.1 8.2 112 Sumitomo Mitsui Trust Holdings Japan 435 7.4 64.6 5.3 25.5 TOTAL ASSETS 65,470
Note: Q3 2011 data are used if Q4 2011 data are not available. GDP is from 2011 IMF estimates. (1) Data as of 2009. In that year, the Banques Populaires and the Caisses d’Epargne merged into the BPCE Groupe.
Sources: Federal Reserve Bank of Chicago, BankScope, Bloomberg.

45
Appendix 6: Selected information of non‐U.S. financial institutions worldwide that received government capital injections and biggest non‐U.S. banks and bank holding companies
Country Bank
Government financial assistance
Current Status Selected information prior to first receiving funds(1)
First received
Funds received
($ billions)
50 biggest banks in the world as of Q4
2011
Total assets
($ billions) Q4 2011(2)
Total assets
($billions)
Risk-weighted assets
($billions)
Common equity to assets
(%)
Tangible common equity to assets
ratio (%)
Tier1 risk-
based capital ratio
Total risk-
based capital ratio
Six home countries of the world’s current 50 banks that provided capital injections to financial institutions (excluding the United States)
Belgium
KBC Groep 10/27/2008 7.12 No 382 540 207 3.7 2.7 8.8 12.5 Fortis 9/29/2008 6.08 Yes 465 1,119 394 4.4 4.2 8.6 n.a. Dexia 9/30/2008 2.59 Yes 557 981 191 1.4 1.0 11.4 12.3
France
BNP Paribas 10/22/2008 6.60 Yes 2,746 2,860 765 2.4 1.7 7.6 11.0 Société Générale 10/21/2008 4.40 Yes 1,684 1,693 536 2.9 2.3 8.2 10.9 Crédit Agricole 10/21/2008 3.88 Yes 2,349 2,305 504 2.3 0.9 8.9 9.6
Crédit Mutuel Group 10/21/2008 1.55 No 790 812 282 4.2 4.1 9.8 9.5 Groupe Caisse d'Epargne 10/21/2008 1.42 No 907 907 31 2.6 2.4 8.1 9.6 Dexia 9/30/2008 1.29 Yes 557 981 191 1.4 1.0 11.4 12.3 Banque Populaire 10/21/2008 1.23 Yes n.a. 563 n.a. 4.9 4.6 n.a. 9.4
Germany
Deutsche Bank AG N/A N/A Yes 3,082 2,899 449 1.7 1.2 10.3 12.7 Commerzbank AG 11/3/2008 23.54 Yes 997 838 322 2.4 2.1 7.6 11.3 Bayerische Landesbank 12/18/2008 14.44 No 430 606 2,395 2.6 2.0 6.4 11.5 Hypo Real Estate Holding 3/28/2009 7.37 No 515 586 133 -0.4 -0.4 6.2 8.6 WestLB 1/23/2008 6.47 No 300 399 161 2.3 2.2 6.5 9.7 Landesbank Baden-Wurttemberg
12/15/2009 6.47 No 500
787 274 1.7 1.6 n.a. 11.1
IKB Deutsche Industriebank 2/13/2008 1.94 No 45 79 48 2.3 2.3 6.0 9.8
Netherlands ING Groep NV 10/20/2008 12.94 Yes 1,731 1,935 485 1.7 1.2 n.a. n.a. Fortis 9/29/2008 5.18 Yes 465 n.a. n.a. n.a. n.a. n.a. n.a. Aegon 11/30/2008 3.00 No 448 418 n.a. 3.2 -0.5 n.a. n.a.
Switzerland Credit Suisse Group AG N/A N/A Yes 1,178 1,242 283 2.8 2.0 10.4 14.6 UBS AG 10/16/2008 6.42 Yes 1,605 1,780 296 2.3 1.6 10.8 14.9
United Kingdom
HSBC Holdings Plc N/A N/A Yes 2,716 2,547 1,232 5.0 3.4 8.8 11.9 Barclays Plc N/A N/A Yes 2,390 2,719 702 1.6 1.0 7.9 12.6 Standard Chartered Plc N/A N/A Yes 568 397 201 5.1 3.4 8.5 15.1 Royal Bank of Scotland Group Plc
10/13/2008 70.45 Yes 2,315
3,745 1,282 3.3 0.9 9.1 13.2
Lloyds Banking Group Plc 10/13/2008 17.48 Yes 1,567 732 306 2.9 2.3 8.6 11.3 Northern Rock 8/5/2008 5.26 No 103 197 53 1.6 1.6 5.1 10.2 HBOS 10/13/2008 4.64 Yes (3) 1,0001 1,357 660 3.0 2.5 7.3 10.9 Bradford & Bingley 9/29/2008 2.24 No 701 104 35 2.2 2.1 7.6 14.0

46
Country Bank
Government financial assistance
Current Status Selected information prior to first receiving funds(1)
First received
Funds received
($ billions)
50 biggest banks in the world as of Q4
2011
Total assets
($ billions) Q4 2011(2)
Total assets
($billions)
Risk-weighted assets
($billions)
Common equity to assets
(%)
Tangible common equity to assets
ratio (%)
Tier1 risk-
based capital ratio
Total risk-
based capital ratio
Other nine home countries of the world’s current 50 banks that did not provide capital injections to financial institutions(4)
Australia
Commonwealth Bank of Australia
N/A N/A Yes 713 467 197 5.3 3.7 8.2 11.6
National Australia Bank N/A N/A Yes 712 519 271 4.6 3.8 7.4 10.9 Westpac Banking Corporation
N/A N/A Yes 643
347 154 4.0 2.8 7.8 10.8
Australia & New Zealand Banking Group
N/A N/A Yes 555
372 218 5.5 4.7 7.7 11.1
Brazil
Banco do Brasil S.A. N/A N/A Yes 512 239 n.a. 6.1 6.1 13.0 13.6 Itaú Unibanco Holding N/A N/A Yes 452 206 n.a. 8.0 n.a. 14.7 14.9
Canada
Royal Bank of Canada RBC N/A N/A Yes 755 621 248 4.1 2.4 9.4 11.6 Toronto-Dominion Bank N/A N/A Yes 689 496 180 5.8 2.4 9.5 13.4 Bank of Nova Scotia N/A N/A Yes 578 451 220 4.1 3.6 9.8 13.9 Bank of Montreal-Banque de Montreal
N/A N/A Yes 479
366 178 4.1 3.6 9.9 12.3
China
Industrial & Commercial Bank of China
N/A N/A Yes 2,380
1,674 804 5.4 5.3 10.0 12.1
China Construction Bank N/A N/A Yes 1,852 1,107 615 6.2 6.1 10.2 12.2 Bank of China Ltd. N/A N/A Yes 1,814 946 575 6.7 6.7 10.9 13.8 Agricultural Bank of China N/A N/A Yes 1,824 n.a. n.a. n.a. n.a. n.a. n.a. Bank of Communications Co. Ltd.
N/A N/A Yes 686
355 185 5.7 5.7 10.0 14.1
Denmark Danske Bank N/A N/A Yes 613 663 175 3.0 2.2 10.1 13.9
Italy UniCredit SpA N/A N/A Yes 1,283 1,668 864 5.3 2.8 6.5 10.1 Intesa Sanpaolo N/A N/A Yes 901 892 560 8.0 n.a. 6.9 10.0
Japan
Mitsubishi UFJ Financial Group
N/A N/A Yes 2,722
1,827 1,034 3.6 3.2 7.6 10.6
Mizuho Financial Group N/A N/A Yes 2,057 1,443 607 1.5 1.4 7.4 11.5 Sumitomo Mitsui Financial N/A N/A Yes 1,673 1,046 597 2.8 2.5 7.1 10.3 Resona Holdings Inc. N/A N/A Yes 527 432 n.a. -0.6 -0.7 n.a. 15.1 Sumitomo Mitsui Trust Holding
N/A N/A Yes 435
161 n.a. 2.7 2.3 n.a. n.a.
Spain Banco Santander SA N/A N/A Yes 1,688 1,436 665 5.3 3.2 7.9 11.4 Banco Bilbao Vizcaya Argentaria
N/A N/A Yes 789
744 393 5.0 3.4 7.8 12.3
Sweden Nordea Bank AB N/A N/A Yes 906 619 272 4.0 3.4 n.a. n.a.
Average for non-U.S. banks that received bailout funds and are currently among 50 biggest banks worldwide 1,607 495 2.7 2.0 9.0 11.6
Average for non-U.S. banks that did not receive bailout funds and are currently among 50 biggest banks worldwide 963 457 4.4 3.3 9.1 12.4

47
Note: This list includes financial institutions that received financial assistance from governments from 15 countries in which the 50 current biggest banks in the world are headquartered. The information for U.S. bank holding companies is provided in Appendix 2. Some financial institutions have assets that exceed the assets of some of the 50 biggest banks in the world, but they are not listed in Appendix 5 because they are not publicly traded or classified as banks or bank holding companies.
N/A = Not Applicable n.a. = Not Available (1) The subsequent quarter is used if the data in the quarter prior to bailout is not available. (2) Q3 2011 data are used if Q4 2011 data are not available. (3) Subsidiary of Lloyds Banking Group Plc. (4) Selected information of banks that did not receive funds is as of the third quarter of 2008.
Sources: Bloomberg, Milken Institute.

48
Appendix 7: Ratio of domestic assets (revenue) relative to foreign assets (revenue), ranked by bank total asset size as of 2010
Bank Home country Total assets,
2010 ($ billions)
Domestic assets/total assets (%)
Total net revenue
($ billions)
Domestic net revenue/total net
revenue (%) BNP Paribas France 2,671 48.0 58.2 34.9 Deutsche Bank AG Germany 2,532 n.a.(1) 37.9 30.8 HSBC Holdings Plc United Kingdom 2,455 50.9 80.0 34.3(8) Royal Bank of Scotland Group Plc United Kingdom 2,266 64.2 49.3 64.3 Bank of America Corporation United States 2,265 85.6 110.2 79.1 Mitsubishi UFJ Financial Group Japan 2,184 85.2(2) 53.0 79.0(9) Credit Agricole France 2,130 77.7 26.7 51.1 JPMorgan Chase & Co. United States 2,118 61.0(3) 102.7 78.4 Industrial & Comm. Bank of China China 2,038 96.3 56.3 97.1 UBS AG Switzerland 2,003 9.9 30.8 39.6 Barclays Plc United Kingdom 1,951 40.8 45.6 44.1(2) Citigroup Inc. United States 1,914 55.8(3) 86.6 30.8 Mizuho Financial Group Japan 1,672 88.6 31.8 86.1(9) ING Groep NV Netherlands 1,667 51.7 72.8 31.3 China Construction Bank China 1,640 97.5 48.1 97.9 Banco Santander SA Spain 1,627 41.0 n.a. n.a. Bank of China Ltd. China 1,587 81.5 40.9 80.3 Agricultural Bank of China China 1,569 73.7 43.2 99.4 Lloyds Banking Group Plc United Kingdom 1,546 88.1 36.2 100.0 Société Générale France 1,513 71.9 35.0 49.5 Sumitomo Mitsui Financial Group Japan 1,318 87.2 45.0 89.3 UniCredit SpA Italy 1,242 41.7 34.0 36.9 Wells Fargo & Company United States 1,227 100.0 85.2 100.0 Credit Suisse Group AG Switzerland 1,105 17.9 30.2 29.3 Commerzbank AG Germany 1,008 65.0(1) 16.8 63.4 Goldman Sachs Group Inc. United States 911 99.9(3) 39.2 55.1 Intesa Sanpaolo Italy 880 93.2 22.1 77.1 Morgan Stanley United States 808 72.2 31.6 68.5 Nordea Bank AB Sweden 777 22.9 12.4 34.8 Banco Bilbao Vizcaya Argentaria Spain 739 66.0(4) n.a. n.a. Metlife Inc. United States 731 68.0 52.7 82.6(9) Royal Bank of Canada RBC Canada 714 55.6 27.8 67.8 National Australia Bank Australia 662 73.2 18.1 64.3 Danske Bank Denmark 655 82.4(5) 8.5 56.0 Westpac Banking Corporation Australia 652 42.5 21.0 80.3(9) Dexia Belgium 651 90.5(6) 7.4 42.7 Natixis France 612 76.4 5.3 60.1(2) Toronto-Dominion Bank Canada 609 57.3 21.9 63.4(2) Bank of Communications Co. Ltd. China 600 91.1 15.5 96.4 Bank of Nova Scotia Canada 578 n.a. n.a. n.a. Banque Populaire France 536 n.a. n.a. n.a. Standard Chartered Plc United Kingdom 517 22.8(7) 16.1 9.5 Resona Holdings Inc. Japan 516 100.0 8.7 100.0 Australia and NZ Banking Group Australia 513 62.2 17.4 85.7(2)(10) Banco do Brasil S.A. Brazil 484 98.6 38.4 100.0 Bank of Montreal-Banque de Montreal Canada 480 n.a.(1) 11.8 75.1 Fortis Banque Belgium 465 78.9 3.9 66.3(9) Itaú Unibanco Holding Brazil 438 n.a. (1) n.a. n.a. Commonwealth Bank of Australia Australia 425 80.3(5) 45.8 88.1(9) Sumitomo Mitsui Trust Holding Japan 160 100.0 3.9 84.3 Sources: Bloomberg; companies’ representatives, FDIC, Milken Institute. (1) Information obtained from companies’ representatives. (2) Data based on either 2009 or 2011. (3) Data are the ratio of domestic assets to total assets of the FDIC‐insured subsidiaries of the holding company. The ratio for the holding company could not be obtained from companies’ representatives. (4) Domestic assets are those from Spain and Portugal combined. (5) The data are as of December 31, 2007. (6) The data are as of December 31, 2008. Domestic assets are those in European Union countries. (7) Americas, U.K., and the group’s head office combined. (8) Data on foreign revenues are based on revenue from other European countries. (9) Data based on gross revenue. (10) Domestic net revenue is from Australia and New Zealand combined.