Embed Size (px)
Citation preview
73:6 (2015) 111–116 | www.jurnalteknologi.utm.my | eISSN 2180–3722 |
Full paper Jurnal
Teknologi
A Review on the Developments, Potentials and Challenges of Application of Metal Products and in Metal Industry Using Process Tomography System Ling En Honga, Ruzairi Hj. Abdul Rahima*, Yusri Md. Yunosa, Mohd Hafis Izran Ishaka, Kumeresan A. Danapalasingama, Ahmad Ridhwan Wahaba, Mohd Hafiz Fazlul Rahimanb, Nor Muzakkir Nor Ayoba, Jaysuman Pusppanathana, Elmy Johana Mohamadc
aProtom-i Research Group, Infocomm Research Alliance, Control and Mechatronic Engineering Department, Universiti Teknologi Malaysia, 81310 UTM Johor Bahru, Johor, Malaysia bSchool of Mechatronic Engineering, Universiti Malaysia Perlis, Pauh Putra Campus, 02600 Arau, Perlis, Malaysia cDept. of Mechatronic and Robotics Engineering, Faculty of Electrical and Electronic Engineering, Universiti Tun Hussein Onn, 86400 Batu Pahat, Johor, Malaysia
*Corresponding author: [email protected]
Article history
Received : 15 August 2014
Received in revised form :
5 January 2015 Accepted : 10 February 2015
Graphical abstract
Abstract This paper will provide an overall view of the developments, potentials and challenges of industrial
applications involving metal products and in metal industry using process tomography system. The
primary focus of the review is to highlight the differences occurred in process tomography in using metallic and non-metallic product especially involving the steel pipes which includes the differences in
sensor arrangements (ERT, ECT, EIT), the issues that arises in the use of metal and steel products besides
in the metal production itself.
Keywords: Electrical resistance tomography; electrical capacitance tomography; electrical impedance
tomography; metal, steel pipes; pipelines; corrosion; erosion; defect; crack; forward and inverse problem; structural health monitoring; nondestructive testing
© 2015 Penerbit UTM Press. All rights reserved.
1.0 INTRODUCTION
Industrial process tomography (IPT) is generally a cross
sectional imaging of parameters of industrial processes and
usually a function of time [1]. In IPT, the three classifications of
sensor systems are transmission mode, reflection mode and
emission mode techniques [2] and the four typical tomography
section are sensor array, data acquisition system, image
reconstruction and display system [3, 4] as shown in Figure 1.
In this paper, the authors hope to highlight the
developments, potentials and challenges of industrial
applications involving metal products particularly steel products
and in metal industry processes using process tomography
systems. The primary motivation of this review is the wide use
of metal products in industrial applications due to its strength
properties at a reasonable cost besides the fact that the use of
metal products will always be a dominant contributor in
improving the human life as metal could be recycled without
reducing the quality of metal itself. However, the focus of this
review will emphasize on steel but will also include other metals
due to the fact that steel is a very common metal used for
industrial applications. In the U.S, the steel industry provides
150, 000 well-paying jobs and is among the most productive,
efficient, and technologically sophisticated industries in the
world [5]. The successes of this industry could be seen in the
new steel grades currently produced which are not able to be
made 10 years ago with 55 percent of US steel industry inputs
are from scrap.

112 Ruzairi Hj. Abdul Rahim et al. / Jurnal Teknologi (Sciences & Engineering) 73:6 (2015), 111–116
Figure 1 Block diagram of typical tomography system [3, 4]
The sections are divided into 1.0 Introduction, 2.0
Difference in sensor arrangements between metal and non-metal
pipe for Electrical Resistance Tomography (ERT), Electrical
Capacitance Tomography (ECT), and Electrical Impedance
Tomography (EIT) 3.0 Examples of application in fluid
properties determination, Structural Health Monitoring (SHM)
and Nondestructive Testing (NDT) 4.0 Examples of application
of tomography in metal industry particularly the steel industry
from upstream to downstream 5.0 Conclusions.
2.0 DIFFERENCE IN SENSOR ARRANGEMENTS
2.1 ERT Sensor Arrangements
In ERT systems, the sensors must be in continuous electrical
contact with the electrolyte inside the process vessel [6] and
more conductive than the electrolyte in order to obtain reliable
measurements. An important attention needs to be taken on the
different way of installing metal electrode on metal pipe and
non-conducting pipe considering to the measurement that is
taken is the resistance.
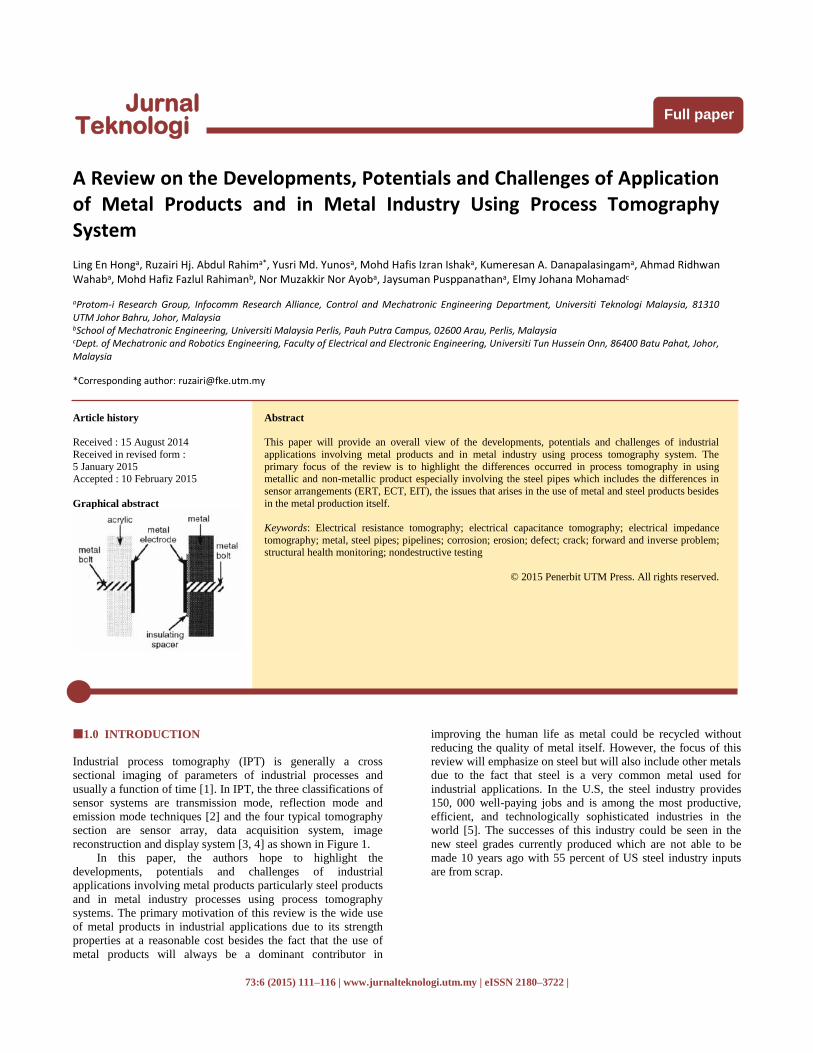
(a) (b)
Figure 2 Difference in arrangement between electrode installations to
(a) a non-conducting and (b) a conducting pipe [6]
In Figure 2, a commonly non-conducting pipe e.g. acrylic
and an electrically conducting metal pipe e.g steel is used to
illustrate the arrangement. The primary reason for this
arrangement (b) is to eliminate the direct short-circuits contact
between two conducting materials, i.e metal electrode and pipe.
The spacer should be very much wider and taller than the
electrode to mimic a non-conducting walled vessel but usually
there will be a trade-off between spacer/electrode dimensions
[6]. Besides that, one should consider the length of signal-
carrying cable between the electrode and the current
injection/voltage measurement circuitry when building the
sensors into the vessel. Larger associated stray capacitance and
current leakage which causes highly undesirable phase shifted
signals could be caused by longer cable. In addition,
electromagnetic interference from heavy duty electrical
machinery could cause the cable acting like an antenna.
(a) (b)
Figure 3 (a) Retro-fitted via vertical poles and (b) Retro-fitted via a
circular conduit [6]
In Figure 3, Dickin [6] has proposed two strategies to be
used when drilling holes into the vessel to mount the electrodes
is not an option. Figure 3(a) one of a number of hollow poles,
each fitted with an electrode, carefully lowered into position
from a secured carrier arrangement at the top of the vessel. The
poles are held in place by attaching them to the wall using an
adhesive or a second ‘ring’ structure towards the opposite end of
the poles. Electrode’s cabling to the data acquisition system is
done by each of the water-tight hollow plastic tubes. On the
other hand, Figure 3(b), one of an array of electrodes is
fabricated into a hollow water-tight plastic conduit used to carry
the cabling and then attached to the vessel wall via a number of
adhesive pads. The disadvantage of the proposed retrofitting
strategy is the non-intrusive nature of the measurement
procedure is neglected. The authors recommended that 5% of
the vessel’s diameter (T/20) is the most retrofitted electrodes
can protrude without severely affecting the flow patterns.
However, the advantages of retrofitting in this manner is the
process vessel is unaffected and the plastic tubes or conduit,
which act as an insulating backing for the metallic electrodes,
can be used in many types of process vessel.
2.2 ECT Sensor Arrangements
Generally, an Electrical Capacitance Tomography (ECT) sensor
is a ring of thin rectangular electrodes usually between 8 and 16
of them separated from each other by small gaps around an
insulating pipe or vessel, which contains the fluids or materials
to be imaged as shown in Figure 4 [7]. An additional grounded
metallic pipe surrounded the assembly acts as an electric screen.
The electrodes are commonly placed on an electrically non-
conducting (i.e non-metallic) tube but has a limitation of unable
to contain a high-pressure flow. An example of solution to the
said limitation is as shown in Figure 5. In the design, there is an
inner borosilicate glass tube through which the fluids flow, with
the electrodes placed on its exterior surface, surrounded by an

113 Ruzairi Hj. Abdul Rahim et al. / Jurnal Teknologi (Sciences & Engineering) 73:6 (2015), 111–116
outer stainless steel pipe, equipped with hermetic electrical
connectors.
Figure 4 Basic structure of a typical ECT sensor [7]
Figure 5 Schematic diagram of sensor [7]
2.3 EIT Sensor Arrangements
In 2002, Liter [8] has carry out the Benchtop Validation Test to
show that the EIT system would provide accurate results using
the wall as ground, a simple verification experiment was
conducted to provide a one-dimensional (vertical) step-variation
in electrical conductivity, resulting in two electrically
differentiable regions as shown in Figure 6. In his experiment
setup, the electrode rod used is fabricated from a PVC tube with
a 2.2 cm outer diameter and a 1.5 cm inner diameter. The author
uses two sets of electrodes with each consisted of 7 ring
electrodes, one set made from 0.04 mm thick copper foil and the
other from 0.07 mm thick stainless steel 304 foils. Other
dimensions are all the same. The length of the electrodes is 2.54
cm and is wrapped around the rod with a 3.5cm edge to edge
separation between them. The distance between the bottom
electrode and the base of the standpipe is 7.0 cm when the rod is
inserted into the standpipe. The liquid level h1 is kept at 7.0cm
above the top electrode to maintain vertical symmetry. Electrode
ground wires are attached to the vessel exterior. The particle bed
consists of polystyrene spheres of diameter dp = 3 mm, allowed
to fall through the water into random packing. Subsequently, the
particles are stirred to remove trapped air bubbles, and then the
particle-bed surface is planed flat.
A metal cylinder known as standpipe of diameter d = 14.7
cm with an electrically insulating base is used as the vessel
(ground electrode) [8]. The electrode rod is positioned coaxially
inside the standpipe. The standpipe is filled to various heights hb
with solid particles and a liquid (water with a small amount of
aqueous sodium nitrate to control the liquid conductivity),
resulting in a region of lower conductivity in the saturated
particle bed, and a region of higher conductivity in the liquid
above the bed.
Schematic of an EIT System Applied to an Electrically Insulating (Non-
conducting) Vessel [8]
Schematic of an EIT System Applied to an Electrically Conducting
Vessel [8]
Figure 6 Schematic of verification experiment consisting of an
electrode rod inserted coaxially in an electrically conducting standpipe filled with non-conducting solid polystyrene particles and liquid [8]

114 Ruzairi Hj. Abdul Rahim et al. / Jurnal Teknologi (Sciences & Engineering) 73:6 (2015), 111–116
3.0 APPLICATION IN FLUID PROPERTIES
DETERMINATION, SHM AND NDT
Tomography technology helps to reduce the two most important
concerns in the industry i.e harm to humans and the
environment. Media corrosion, cavitation erosion, welding
defects cracking, stress corrosion cracking and materials
deterioration causes leakage and explosion accidents after a
certain period of time [9]. Besides that, an issue due to
corrosions or defects in the pipelines and storage tanks could
cause the oil and gas as well as petrochemical company heavy
financial lost annually in product losses, production downtime,
environmental cleanup efforts and fines [10]. The National
Society of Corrosion Engineers estimates a maximum of 25%
costs reduction by implementing best practices and updated with
new technologies.
In ultrasonic tomography, the implementation of steel pipes
faced an unique issue which is irrelevant to other types of pipes
of acrylic, PVC and plastics material [11], [12], [13]. Steel pipes
have high attenuation of ultrasonic energy and the high
influence of bulk waves besides the worst internal reflections
within enclosed pipes [14]. In order have a good understanding
of the limitation of steel pipe, one need to first understand the
fundamental physical properties of waves. The ultrasound are
commonly tested in two modes i.e Longitudinal and Shear
waves [15], [16] although there are other modes which includes
shear waves, surface waves and in thin material as plate
waves[17].
Abbaszadeh [11], [12], [13] used transmission-mode
technique as the sensing mode in which only longitudinal mode
of ultrasonic wave propagation is desired to determine the fluid
properties in a steel pipe. COMSOL, a Finite Element
Simulation software was used to determine the optimum
frequency of the ultrasonic sensor and to determine the
receiving time of the longitudinal waves and Lamb waves. The
wave’s properties differ by using steel pipe as the Lamb Wave
reaches the receiver at the opposite side of transmitter before the
longitudinal wave where as for other material used, the
longitudinal will arrived first and the first data received could be
assumed to be from the longitudinal wave. In his proposed
method, there is a trade-off in selecting the optimum frequency.
An increase in frequency causes an increase in pressure level of
the Lamb Wave and capability improvement to diagnose small
particles [14], [18] but a decrease in pressure level of the
longitudinal wave [11], [12], [13]. Based on the parameters,
Abbaszadeh have chosen in his experiment, the optimum
frequency is found to be 40 kHz.
Ironically, Lamb waves are used as guided ultrasonic
waves to locate and size flaws in metal pipe e.g aluminum pipe
[19]. In the study of corrosions, defects, or commonly known as
Structural Health Monitoring (SHM) and Nondestructive
Testing (NDT), one will find hard to exclude the guided
acoustic waves. History of possibility of providing spatially
localized information with guided waves through the
combination of multiple transmission measurements and
tomographic techniques started in the early 1990s by Hutchins’s
group [20]. The research trend on guided wave tomography is
mainly on flat plate geometries with fewer works on pipe
applications [21]. When the pipe wall thickness is small
compared to its radius (5% to 10%), guided wave tomography
can be implemented by ideally unwrapping the section of pipe
between the arrays and treating it as a flat plate. The ring arrays
are therefore transformed into two parallel linear arrays and the
guided wave tomography problem reduces to the classical
borehole tomography configuration [22].
The authors have observed in the research on crack and
corrosion of steel pipe using various type of tomography, there
are three main focuses. The first group of researchers focuses on
the physical properties of the pipe which includes flexible pipe
e.g the development of X-ray computed tomography (CT)
systems for on-site inspection of flexible pipelines with special
consideration for the end fitting area on topsides [23], pipelines
e.g. infrared tomography performed for four types of stainless
steel and carbon steel pipes [9], material composition of high
temperature pressure the steel pipe e.g X-ray microtomograhy
used in three dimensions quantification of collinear cracks from
a low-carbon gas pipeline X65 steel colony [24], pitting
corrosion of stainless steel with high resolution in situ X-ray
microtomography in three dimensions. [25], at welding point e.g
ultrasonic and radiography for weld integrity [26], a 2-coils
Magnetic Induction planar sensor of transmitter and receiver
coil [27], inspection of multi-hole steel floral pipes using a low
frequency longitudinal guided wave mode [28], aged pipes e.g
X-ray Radiography for transfer pipes for the low-level
radioactive liquid waste are made of steel or stainless steel [29].
The second group has carried out experiments on different
condition in which the steel pipe is in which includes in
underground pipes e.g a subsurface radar system for imaging
buried pipes [30] and concrete-filled steel pipes e.g application
of Electromagnetic Acoustic Transducers (EMATs) transmitting
and receiving cylindrical guided waves [31]. Finally, the third
group researches on the technique itself which includes
ultrasonic waves based imaging technique using longitudinal
ultrasonic waves for detecting defects in pipeline structures [32],
a numerical simulation analysis of pipeline corrosion using
Electrical Capacitance Tomography (ECT) [33]
Considering the number of research in the area of
Structural Health Monitoring (SHM) and Nondestructive
Testing (NDT) is tremendous, only selected research will be
discussed here. An aspect of guided wave tomography is the
helical modes. Willey [34] have introduced a general inversion
method to extract information in the higher-order helical modes.
Based on the observation for a given transmit–receive
transducer pair, there exists infinite helical wave paths that
connect the transmitter to the receiver each corresponding to a
different number of turns around the pipe. Larger number of
turns around the pipe due to the higher order of the helical path
causes better ray coverage in the circumferential direction.
Figure 7 An 8″ diameter pipe is instrumented with two ring arrays each
containing 16 EMAT transducers [34]

115 Ruzairi Hj. Abdul Rahim et al. / Jurnal Teknologi (Sciences & Engineering) 73:6 (2015), 111–116
4.0 APPLICATION IN METAL INDUSTRY
In the manufacturing or production line, besides challenges in
applying tomography system using end product of metal product
in the production of other products as explain previously, there
is also significant concern in the metal production itself
particularly in metal casing process. An example of this is an
electromagnetic approach for tomographically visualizing the
molten steel distribution within a submerged entry nozzle (SEN)
[35]. The system consists of an eight-coil sensor array, data
acquisition unit, associated conditioning circuitry, and a PC
computer, which was designed and constructed for hot trials.
The tomography helps to ensure an optimum laminar flow
pattern in the casting mold and stable meniscus [36].
Ultrasonic testing is also used to detect defect inside billets
[37] which includes pulse echo method and transmission
method. In pulse echo method, pulse wave is launched into the
billet from a transducer and received at the same transducer. The
received signal includes the back scattering wave from a defect
when the defect exists on the path. Ultrasonic wave attenuated
by diffusion and scattering in steel [38] which cause the pulse
echo method not suitable to be used for high-attenuation billets
due to echo from the defect becomes small. Some of the
important facts include the longer the distance between the
transducer and the defect, the larger the scattering attenuation
coefficient, the lower the echo levels. On the other hand, the
transmission method, uses ultrasonic computerized tomography
(CT) using time of flight (TOF) of longitudinal wave [37]. Some
of the advantages on the transmission method with CT include
(1) the distance between the transmitter and the defect is large,
the received signal level by the transmission method was higher
than by the pulse echo method; (2) due to TOF is derived from
pulse compression of the received signals, the effect of noise
can be reduced; and (3) the receivers can be arranged widely
against the incidence angle of the signal, the measurement
points can be increased, and the defect information can be
extracted easily by reconstruction. As a result, the transmission
method with CT is predicted to be more robust in measurement
for high-attenuation billet than the pulse echo method.
In high-quality steel making, one of the important factor is
nonmetallic inclusions which is the degree of steel cleanness
[39]. Generally, Computed X-ray tomography (XCT) detects
and measures inhomogeneities giving an absorption contrast in
volumes. The detection of inhomogeneities such as shrinkage
pores, microfocus x-rays computed tomography (μXCT) is not a
new technology. Ferum-based materials are usually noisy, of
poor contrast and the interpretation is affected by measurement
artefacts which caused the evaluation of CT-data more difficult.
Due to the higher x-ray absorption coefficient of the base metal,
the said inhomogeneities and non-metallic inclusions are more
difficult to detect in continuously cast steel slabs. High-
resolution μXCT and synchrotron tomography (sXCT) was used
to obtain measurements of non-metallic inclusions and pores in
steel slabs. These inhomogeneities can be differentiated clearly
via the grey value only with monochromatic synchrotron
radiation. A sufficient difference in the x-ray absorption
coefficient for quantifying these particles as well as pores of
over critical size reliably with XCT-techniques is provided by
the mass density of oxidic and sulphuric inclusions is about half
the density of iron [40]. Destructive Metallographic Methods is
used to distinguish between the different kinds of
inhomogeneities while target preparation determines its exact
position.
Besides the upstream metal industry, we would like to
include some of the applications of tomography system in the
middle and downstream metal industry. A brief elaboration
Magnetic Induction Tomography (MIT) or also known as
Mutual Inductance Tomography or Eddy-Current Tomography
[41] will be done to assist readers to grasp a good
understanding. In a typical Magnetic Induction Tomography,
coils are used as transmitters and receivers. A changing
magnetic flux is set up by establishing a sinusoidal current in the
transmitting coil which induces a voltage across the terminals of
the receiving coil. The induced signal picked up by the sensing
coil is proportional to local magnetic field strength B, which is
referred to as the “background” or “primary” signal, and
represented as a phasor [42], [43].An eddy current will be
induced on an object if the object is positioned between two
coils which causes a magnetic field perturbation ∆ B in B. The
detected signal on the receiving coil can be expressed as a
fraction ∆ B / B of the primary field. In the detection of metallic
objects (σ > 10 6 S/m) placed between two coils, the primary
effect is a reduction in the amplitude of magnetic field strength
B, i.e ∆ B is real and negative, resulting from surface currents
on the object [42]. In Wei’s experiment [41] to verify the metal-
sensing capability using MIT system, he has chosen two
aluminum sheets of 0.5 mm thickness and 2mm thickness and a
steel sheet of 1 mm thickness. All other dimensions of all the
three sheets are 112 mm x 214 mm). The findings from his work
are as follows: (i) metallic objects do cause a real negative
perturbation signal at the receiver and the signal change is more
significant when the metal sheet is closer to either the
transmitter or the receiver with the receiver being slightly more
sensitive; (ii) The shapes of the patterns were very similar for all
three metal sheets. (iii) The larger difference in permeability
between aluminium and steel have no significant effect on the
magnitude change. (iv) Small electromagnetic penetration into
both metal sheets. W. Yin [44] has explained that the reason (iv)
discussed is the reason behind low-frequency systems is used
high-conductivity materials as low-frequency systems can have
sensitivity to subsurface structures due to the high skin depth.
Besides for production purposes, tomography is also used
in the protection of environment even for the steel industry.
“Orphan” radioactive sources could be melted with scrap metal
in the upstream industry [45]. Muon tomography could be used
to identify unobserved radiation scanning portals high density
material of lead for instance by the scattering of muons inside
materials to build a three-dimensional density map of a volume.
Fine-tuning optimization is needed in case of tight time
constraints and large analysed volumes because the scan of the
portal has to be performed with a minimal impact on the
queuing schedules of the facility hosting the portal even it is
most effective when a large number of muons is gathered.
5.0 CONCLUSIONS
As a summary, there are still much improvement needs to be
done in various areas in implementing tomography system in
metal (steel) products and the industries that manufacture them.
The properties of steel pipes that makes it special compared to
other type of pipe material is that steel pipes have high
attenuation of ultrasonic energy, the high influence of bulk
waves and the worst internal reflections within enclosed pipes.
From the authors’ observation, the current method used for
ECT, ERT and EIT are generally intrusive in nature. Various
application of tomography in metal industries in the upstream
such as scrap properties determination and metal casting besides
the midstream and downstream such as sheets processing could
be observed. It is hoped that some of the examples of different
arrangements using different type of sensors between metallic
and non-metallic pipes and the elaboration of application of

116 Ruzairi Hj. Abdul Rahim et al. / Jurnal Teknologi (Sciences & Engineering) 73:6 (2015), 111–116
tomography in various stages of metal industry would be
beneficial to readers.
Acknowledgement
The authors wish to thank Ministry of Education Malaysia for
providing financial supports under d UTM GUP Grant (03H96),
UTM Race Matching Grant (M01) and ERGS (4L034) and also
Zamalah scholarship.
References
[1] International Atomic Energy Agency. 2008. Industrial Process Gamma
Tomography: Final Report of A Coordinated Research Project 2003–
2007. Vienna, Austria.
[2] N. Reinecke et al. 1998. Tomographic Measurement Techniques:
Visualization of Multiphase Flows. Chemical Engineering Technology. 21: 7–18.
[3] S. Ibrahim et al. 2000. Modelling to Optimize the Design of Optical
Tomography Systems for Process Measurement. Symposium on
Process Tomography. 18–19 May, Jurata.
[4] S. Ibrahim et al. 2000. Optical Tomography for Process Measurement
and Control. Control 2000. UKACC Int. Conference. University of
Cambridge. 4–7 Sept.
[5] Office of Energy Efficiency and Renewable Energy, U.S Department of Energy. 2001. Steel–Industry of the Future.
[6] F. Dickin and M. Wang. 1996. Electrical Resistance Tomography for
Process Applications. Meas. Sci. Technol. 7: 247–260.
[7] J. C. Gamio et al. 2005. Visualisation of Gas-Oil Two-phase Flows in
Pressurised Pipes using Electrical Capacitance Tomography. Flow
Measurement and Instrumentation. 16: 129–134.
[8] S. G. Liter et al. 2002. Electrical-Impedance Tomography for Opaque
Multiphase Flows in Metallic (Electrically-Conducting) Vessels. Springfield: Sandia National Laboratories.
[9] G. Shen and T. Li. 2007. Infrared Thermography for High-
Temperature Pressure Pipe. Insight. 49(3): 151–153.
[10] B. Lasser and D. Oehl. 2014. Corrosion Testing with Real-Time 2-D
Ultrasound Camera Imaging. Inspectioneering Journal. 20(1): 31–35.
[11] Javad Abbaszadeh et al. 2012. Optimizing the Frequency of Ultrasonic
Tomography System with a Metal Pipe Conveyor. IEEE 8th International Colloquium on Signal Processing and its Applications.
52–57.
[12] Javad Abbaszadeh, et al. 2013. Design Procedure of Ultrasonic
Tomography System with Steel Pipe Conveyor. Sensors and Actuators
A: Physical. 203: 215–224.
[13] Javad Abbaszadeh, et al. 2013. Frequency Adjustment in Ultrasonic
Tomography System with a Metal Pipe Conveyor. Sensors and
Materials. 25(6): 379–387. [14] M. H. F. Rahiman, et al. 2006. Ultrasonic Transmission-mode
Tomography Imaging for Liquid/Gas Two-phase Flow. IEEE Sensors
Journal. 6: 1706–1715.
[15] J. K. Na, et al. 2008. Design, Fabrication, and Characterization of
Single-element Inter-digital Transducers for NDT Applications.
Sensors and Actuators A: Physical. 148: 359–365.
[16] S. W. Or, et al. 1998. Ultrasonic Wire-bond Quality Monitoring using Piezoelectric Sensor. Sensors and Actuators A: Physical. 65: 69–75.
[17] Z. Zhu, et al. 1995. A General Dispersion Relation for Lamb-wave
Sensors with Liquid-layer Loading. Sensors and Actuators A: Physical.
49: 79–84.
[18] B. Hoyle and L. Xu. 1995. Ultrasonic Sensors, in: Process
Tomography: Principles, Techniques and Applications. Butterworth-
Heinemann, Oxford, UK. 119–149.
[19] K. R. Leonard and M. K. Hinders. 2005. Lamb Wave Tomography of Pipe-like Structures. Ultrasonics. 43: 574–583.
[20] D. Jansen and D. Hutchins. 1990. Lamb Wave Tomography. In
Proceedings of IEEE Ultrasonic Symposium IEEE. 1017–1020.
[21] P. Huthwaite and F. Simonetti. 2013. High-resolution Guided Wave
Tomography. Wave Motion. 50: 979–993.
[22] T. Lo. 1987. Seismic Borehole Tomography. Massachusetts Institute of
Technology, Department of Earth, Atmospheric and Planetary
Sciences.
[23] A. Daaland et al. 2003. Tomx–High-Energy Tomographic X-ray for
In-Service Inspection of Flexible Pipeline Systems. Proceedings of OMAE 2003 22nd International Conference on Offshore Mechanics and
Arctic Engineering. 8–13 June, 2003. Cancun, Mexico. 1–8.
[24] E. Gamboa et al. 2014. X-ray Microtomography Observation of
Subsurface Stress Corrosion Crack Interactions in a Pipeline Low
Carbon Steel. Scripta Materialia. 81: 1–3.
[25] S. M. Ghahari et al. 2011. In Situ Synchrotron X-ray Micro-
tomography Study of Pitting Corrosion in Stainless Steel. Corrosion
Science. 53: 2684–2687. [26] I. Lima et al. 2013. Investigation of Weld Cracks by Microfocus
Tomography, 12th IMEKO TC10 Workshop on Technical Diagnostics,
New Perspectives in Measurements, Tools and Techniques for
Industrial Applications, Florence, Italy. 149–153.
[27] D. Sutisna et al. 2014. Flaw Detection in Welded Metal Using
Magnetic Induction Tomography. Advanced Materials Research. 896:
722–725.
[28] Z. H. Liu et al. 2012. The Application of Low Frequency Longitudinal Guided Wave Mode for the Inspection of Multi-hole Steel Floral Pipes,
10th Anglo-French Physical Acoustics Conference (AFPAC 2011).
Journal of Physics: Conference Series 353. IOP Publishing Ltd. 1–8.
[29] M. Ito et al. 2013. Applicability of X-Ray Radiography for Integrity
Assessment of Aged Pipes in The JMTR, 6th International Symposium
on Material Testing Reactors, Bariloche, Rio Negro, Argentina, 28–31
October [30] Y. Michiguchi et al. 1988. Advanced Subsurface Radar System for
Imaging Buried Pipes. IEEE Transactions on Geoscience and Remote
Sensing. Vol, 26. No.6, 733–740
[31] W. Na et al. 2005. Concrete Filled Steel Pipe Inspection using Electro
Magnetic Acoustic Transducer (EMAT), Smart Structures and
Materials: Sensors and Smart Structures Technologies for Civil,
Mechanical and Aerospace Systems, Proc. of SPIE. 5765: 74–84.
[32] H. Lee et al. 2014. Pipe Defect Visualization and Quantification Using Longitudinal Ultrasonic Mode. International Journal of Structural
Stability and Dynamics. 14(5): 1440008–1–1440008–14.
[33] W. A. Al-Tabey. 2013. Simulation Analysis of Sensitivity fir Corrosion
of Pipe Wall Using Electrical Capacitance Tomography Technique.
African Journal of Engineering Research. 1(2): 49–53.
[34] C. L. Willey et al. 2014. Guided Wave Tomography of Pipes with
High-order Helical Modes. NDT&E International. 65: 8–21. [35] X. Ma et al. 2005. Electromagnetic Techniques for Imaging the Cross-
Section Distribution of Molten Steel Flow in the Continuous Casting
Nozzle. IEEE Sensors Journal. 5(2): 224–232.
[36] X. Ma et al. 2003. Imaging the Flow Profile of Molten Steel through a
Submerged Pouring Nozzle. In Proc. 3rd World Congr. Industrial
Process Tomography, Banff, AB, Canada. 736–742.
[37] Y. Norose et al. 2013. Comparative Study of Pulse Echo Method and
Transmission Method with Computerized Tomography for Defect Detection Inside Billet. Proceedings of Symposium on Ultrasonic
Electronics. 34: 20–22 November, 217–218.
[38] W. P. Mason, and H. J. McSkimin. 1984. J. Acoust. Soc. Am. 20: 586.
[39] B. Harrer et al. 2008. On the Detection of Inhomogeneities in Steel by
Computed Tomography. 17th World Conference on Nondestructive
Testing, 25–28 Oct, Shanghai, China.
[40] B. Harrer et al. 2007. Röntgen-Computer-Tomographie zur
Charakterisierung von Inhomogenitäten in Gussgefügen von Aluminium und Stahl. Sbd. Prakt. Metallogr. 39, G. Petzow (Hrg.).
131–136.
[41] H. Wei and A. J. Wilkinson. 2011. Design of a Sensor Coil and
Measurement Electronics for Magnetic Induction Tomography. IEEE
Transactions on Instrumentation and Measurement. 60(12): 3853–
3859.
[42] H. Griffiths. 2001. Magnetic Induction Tomography. Meas. Sci. Technol. 12(8): 1126–1131.
[43] D. S. Holder. 2005. Electrical Impedance Tomography: Methods,
History, and Applications. Bristol, U.K.: Inst. Phys. Publ.
[44] W. Yin and A. J. Peyton. 2006. A Planar EMT System for the
Detection of Faults on Thin Metallic Plates. Meas. Sci. Technol. 17(8):
2130–2135.
[45] M. Furlan et al. 2014. Application of Muon Tomography to Detect
Radioactive Sources Hidden in Scrap Metal Containers. IEEE Transactions on Nuclear Science. 61(4): 2204–2209.