Embed Size (px)
Citation preview
Jurnal Kejuruteraan (UKM Engineering Journal) X (X): 9 pages, In Press
ISSN:0128-0198 E-ISSN:2289-7526
1
Optimization of Internal Mixing Parameter on the Electrical Conductivity of
Multiwall Carbon Nanotubes/Synthetic Graphite/Epoxy Nanocomposites for
Conductive Polymer Composites Using Taguchi Method
(Pengoptimuman Parameter Pencampur Dalaman terhadap Kekonduksian Elektrik bagi Nanotuib Karbon Berbilang
Dinding/ Grafit sintetik / Epoksi Nanokomposit untuk Komposit Polimer Pengalir menggunakan Kaedah Taguchi)
Irmayani*,
Department of Industrial Engineering, Universitas Ekasakti, Indonesia
Hendra Suherman
Department of Mechanical Engineering, Universitas Bung Hatta, Indonesia
ABSTRACT
Conductive polymer composites (CPCs) can be widely uses as electronic devices, artificial muscles, solar energy
conversion, and sensors. Nevertheless, CPCs has a low electrical conductivity. Therefore this study focused to
improved the electrical conductivity of CPCs by optimizing the internal mixing parameter using Taguchi Method.
Multiwall carbon nanotubes (MWCNTs) as secondary filler and synthetic graphite (SG) as primary filler use in this
study. The CPCs composition are; 5wt% MWCNTs; 75wt% SG; 20wt% epoxy resin as matrix. The internal mixing
parameter applied as control factor in Taguchi Method analysis are mixing time, mixing temperature, and mixing
rotation. Experiment was carried out based on orthogonal array design using these three internal mixing
parameter. The results were analyzed using the signal to noise ratio (S/N) and analysis of variance (ANOVA). The
percent contribution of each internal mixing parameters to the electrical conductivity of MWCNTs/ SG/ epoxy resin
were mixing rotation (44 %), mixing temperature (26 %) and mixing time (18 %). This was managed to reduce the
number of voids and nano size particles conductive filler material (MWCNTs) more evenly dispersed in the epoxy
resin. The optimum internal mixing parameters used to produce MWCNTs/SG/epoxy nanocomposites was effective
to increase the electrical conductivity becomes 197 S/cm.
Keywords : Internal Mixing Parameters; Electrical Conductivity; Taguchi Method; Analysis of Variance (ANOVA)
INTRODUCTION
Conductive polymer composites (CPCs) are a combination of conductive fillers and polymers as matrix. The CPCs
properties depend on the materials conductive filler, matrix, and the manufacturing processes used in producing
CPCs material. CPCs had a very wide attention from researchers because this material can be used for various
applications (Kishi et al. 2004; Liao et al. 2008; Song et al. 2006; Ahmad et al. 2016). The main problem of CPCs is
a low electrical conductivity. Some efforts were made to improve the electrical conductivity by adding a conductive
material that has different size, shape, and loading concentration. Carbon based conductive filler such as carbon
nanotubes (CNTs), carbon black (CB), graphite (G), carbon fibers (CF), and expanded graphite (EG) has been
extensively used to improve the electrical conductivity of CPCs (Rybak et al. 2010; Lee et al. 2009; Antunes et al.
2011). Previous work by others researchers reported the mixing parmeters with short mixing time will improve the
conductive networks formation (Hu et al. 2008). Meanwhile high speed mixing will also increase the dispersion of
filler within polymer matrix (Xie et al. 2005). Thus a proper mixing parameters is needed to produce CPCs with
good electrical conductivity. The internal mixer has been widely used in producing CPCs, because it has parameters
such as temperature, rotation, and time that can be varied according to the process requirements. The optimum
combination of internal mixer parameters is needed in producing CPCs with high electrical conductivity and
suitable mechanical properties (Suherman et al., 2013; Zakaria et al 2015). Taguchi method was required to reduce
the number of experiments, cost, and time, to optimize manufacturing process in engineering applications (Asiltürk
dan Akkuş. 2011; Lin et al. 2000; Sulong et al. 2011; Wang & Northwood. 2008). Taguchi method was developed
Jurnal Kejuruteraan (UKM Engineering Journal) X (X): 9 pages, In Press
ISSN:0128-0198 E-ISSN:2289-7526
2
to get optimal results with fewer number of specimens. Based on that condition, the Taguchi method using
orthogonal arrays (OA), signal to noise (S/N) ratio analysis and design of experiments (DOE) (Chang et al. 2011;
Lin et al. 2009). Thus, this paper investigated the optimization of internal mixing parameter of
MWCNTs/SG/epoxy nanocomposites on the electrical conductivity for conductive polymer composites (CPCs)
using the Taguchi method.
EXPERIMENTAL
Materials
In this study, two conductive filler namely multiwalled carbon nanotubes (MWCNTs) and synthetic graphite (SG)
were used. MWCNTs was obtained from Nanocyl Carbon, Belgium. Based on manufacturer the properties of
MWCNTs were; a diameter of 9.5 nm, a length of 1.5 mm, surface area of 300 m2/g, and a purity of 90%. SG with a
surface area of 1.5 m2/g and a particle size of 74 µm was obtained from Asbury carbon, New Jersey, while the epoxy
resin (635 thin epoxy resin) with a viscosity of 6 P obtained from the US Composites.
Fabrication of MWCNTS/SG/Epoxy Nanocomposites
The composition of multiwall carbon nanotubes (MWCNTs), synthetic graphite (SG) and epoxy used in this study
are 5/75/20 in weight percentage (wt.%). The fabrication of MWCNTs/SG/epoxy nanocomposites consist of three
stages. The first stages, to obtaine homogenous mixture, two conductive filler of MWCNTs and SG were mixed
using ball mill. Steel balls used are made from stainless steel with a diameter of 10 mm. The ratio of stainless steel
balls with graphite and MWCNTs powder is 4:1. The time of ball milling process is one hour at 200 rpm. The
second stages, resin and hardener were mixed using a high speed mixer model RM 20-KIKA-WERK at 1200 rpm
for 40 seconds. The ratio of resin and hardener is 3:1 in accordance with suggested by manufacturer. The third
stages, the mixed filler and epoxy resin were further mixed using an internal mixer model Haake Rheomix at
different mixing rotation (20, 25, and 30 rpm), different mixing time (5, 10, and 15 min) and different mixing
temperature (30, 35, and 40 0C). Then the MWCNTs/SG/epoxy nanocomposites mixture were poured into a steel
mold at molding pressure of 1800 Psi and molding temperature of 150 ºC for 90 minutes.
Characterization
Jandel four point probe wit h RM3 test unit was used to measure the electrical conductivity of MWCNTs/SG/epoxy
nanocomposites. Meanwhile, to investigate the dispersion of the primary and secondary conductive filler in the
polymer matrix used field emission scanning electron microscopic (FESEM, Model Supra 55/55VP).
Selection of Control Factors
The internal mixing parameter that need to be control are mixing rotation, mixing time and mixing temperature.
Table.1 show three control factors with three levels of internal mixing parameters; mixing rotation (Amr) = 20, 25,
and 30 rpm, mixing time (Bmt) = 5, 10, and 15 0C, and mixing temperature (Cmtr) = 30, 35, 40 minutes.
Jurnal Kejuruteraan (UKM Engineering Journal) X (X): 9 pages, In Press
ISSN:0128-0198 E-ISSN:2289-7526
3
TABLE 1. Control factor and level of internal mixing parameter
Symbol Control Factors Unit Level
1 2 3
Amr Mixing Rotation Rpm 20 25 30
Bmt Mixing Time Min 5 10 15
Cmtr Mixing Temperature 0C 30 35 40
Mixing rotation (Amr) serves to produce a uniform mixture of conductive filler in the polymer matrix. Hu et al.
(2008) found that high speed of mixing rotation (Amr) is not required to obtain an evenly mixture of conductive filler
material. Thus, the different mixing rotation (Amr) that selected to optimize the process parameters of the internal
mixing in producing MWCNTs/SG/epoxy nanocomposites were increased from the lowest rotation, at 20, 25 and
30 rpm. Mixing time (Bmt) used to produce MWCNTs/SG/epoxy nanocomposites are also effective to improve the
dispersion of the conductive filler within epoxy resin, so that increased the electrical conductivity of
MWCNTs/SG/epoxy nanocomposites produced (Kalyon et al. 2002). Therefore, the mixing time (Bmt) selected are
5, 10 and 15 minutes. The MWCNTs/SG/epoxy nanocomposites mixture begins to harden at 20 minutes mixing
time. Mixing temperature (Cmtr) serves to reduce the viscosity of the polymer matrix material so that the electrical
conductivity of the network will be easily formed (Das et al. 2002). Therefore, the mixing temperature level of the
internal mixing parameters were increased from 30, 35 and 40 0C.
The Orthogonal Array (OA) L9 (33) of the Internal Mixing Parameters
TABLE 2. The Orthogonal array L9 (33) of the internal mixing parameters
Number of
Experiment
Control Factor and Levels
A B C
1 20 5 30
2 20 10 35
3 20 15 40
4 25 5 35
5 25 10 40
6 25 15 30
7 30 5 40
8 30 10 30
9 30 15 35
The study was conducted by providing nine plates dimensions 100 mm × 100 mm × 2.5 mm. The number of
MWCNTs/SG/epoxy nanocomposites plates provided based on the factors and levels of internal mixing parameters
as shown in Table 2. The composition of orthogonal L9 (33) with nine runs total experiments is to get a set of the
optimum internal mixing parameters. Although nine runs is the minimum number of runs for three control factors
and three levels, but this minimum runs managed to set a combination of optimum parameters for a study of three
control factors and three levels ( Liu et al., 2010; Surace et al., 2010; Sulong et al. 2011)
RESULTS AND DISCUSSION
The Electrical Conductivity of MWCNTS/SG/Epoxy Nanocomposite
The electrical conductivity of MWCNTs/SG/epoxy nanocomposite for number of experiment 1 to 9 were measured
in three different areas of the far right, middle, and left end of each sample produced. The electrical conductivity of
MWCNT/SG/epoxy nanocomposites for any tests show in Table 3. The highest average value of the electrical
conductivity and the signal to noise ratio (S/N) obtained on the running number three (191 S/cm and 45.64 dB) with
a set combination of internal mixing parameters (A1-mr (20 rpm), B3-mt ( 15 min), and C3- mtr (40 0C). The lowest
Jurnal Kejuruteraan (UKM Engineering Journal) X (X): 9 pages, In Press
ISSN:0128-0198 E-ISSN:2289-7526
4
average value of the electrical conductivity and signal to noise ratio obtained on the running number seven (122
S/cm and 41,75 dB) with a set combination of internal mixing parameters are (A3-mt (30 rpm), B1-mt (5 min), and C3-
mtr (40 0C).
TABLE 3. The electrical conductivity of the internal mixing parameters of MWCNTs/SG/epoxy nanocomposites based on
orthogonal array L9 (33)
Number of experiment Control factors and levels Electrical conductivity S/N (dB)
A (rpm) B (min) C (0C) (S/cm)
1 20 5 30 153 43.71
2 20 10 35 190 45.57
3 20 15 40 191 45.64
4 25 5 35 155 43.80
5 25 10 40 151 43.56
6 25 15 30 138 42.78
7 30 5 40 122 41.75
8 30 10 30 135 42.62
9 30 15 35 174 44.78
Avg 157
Max 191
Min 122
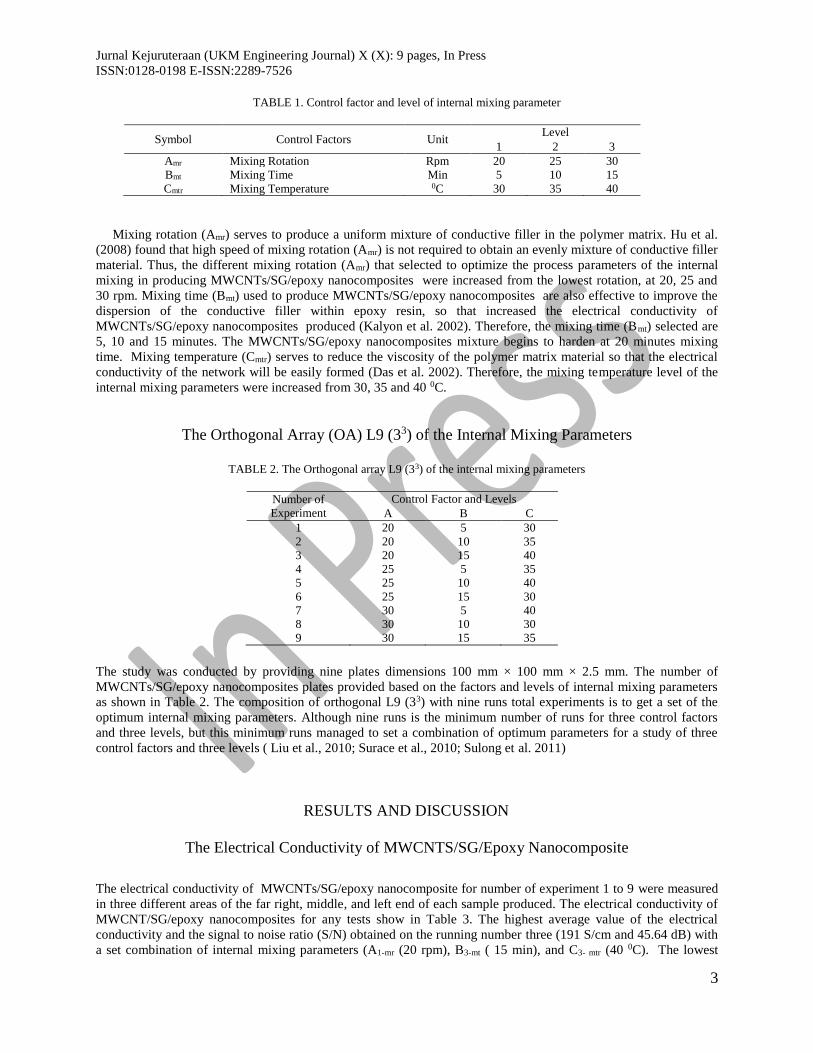
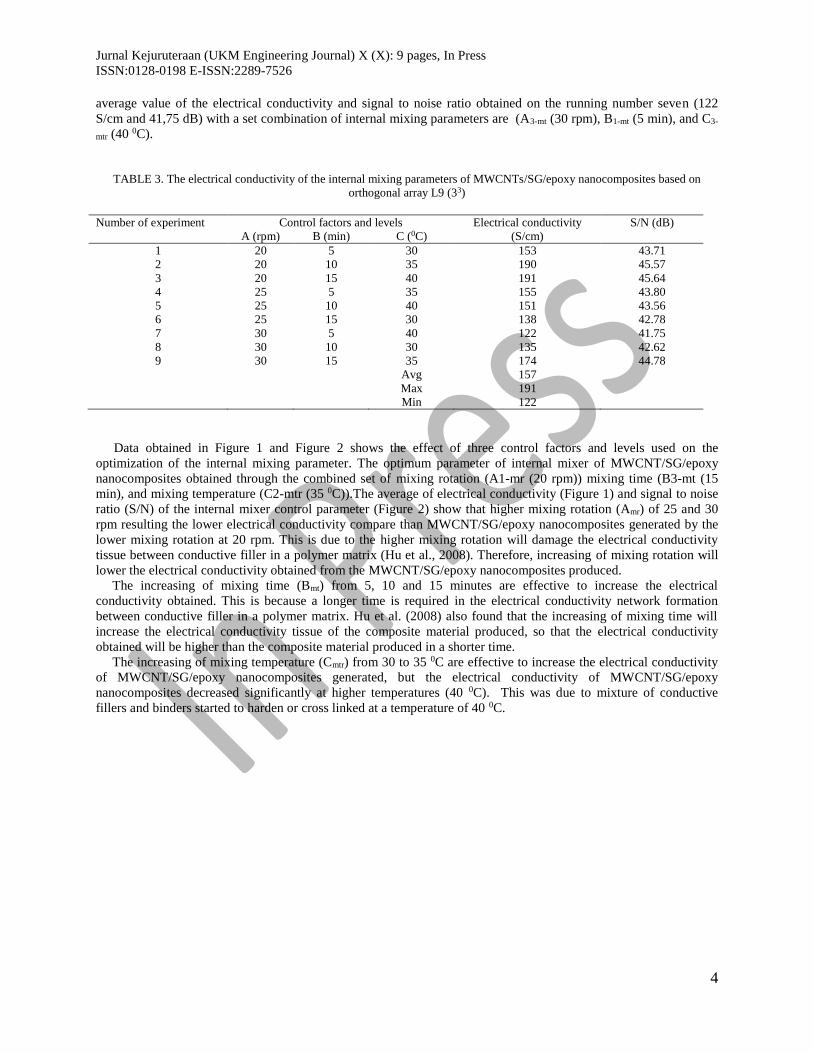
Data obtained in Figure 1 and Figure 2 shows the effect of three control factors and levels used on the
optimization of the internal mixing parameter. The optimum parameter of internal mixer of MWCNT/SG/epoxy
nanocomposites obtained through the combined set of mixing rotation (A1-mr (20 rpm)) mixing time (B3-mt (15
min), and mixing temperature (C2-mtr (35 0C)).The average of electrical conductivity (Figure 1) and signal to noise
ratio (S/N) of the internal mixer control parameter (Figure 2) show that higher mixing rotation (Amr) of 25 and 30
rpm resulting the lower electrical conductivity compare than MWCNT/SG/epoxy nanocomposites generated by the
lower mixing rotation at 20 rpm. This is due to the higher mixing rotation will damage the electrical conductivity
tissue between conductive filler in a polymer matrix (Hu et al., 2008). Therefore, increasing of mixing rotation will
lower the electrical conductivity obtained from the MWCNT/SG/epoxy nanocomposites produced.
The increasing of mixing time (Bmt) from 5, 10 and 15 minutes are effective to increase the electrical
conductivity obtained. This is because a longer time is required in the electrical conductivity network formation
between conductive filler in a polymer matrix. Hu et al. (2008) also found that the increasing of mixing time will
increase the electrical conductivity tissue of the composite material produced, so that the electrical conductivity
obtained will be higher than the composite material produced in a shorter time.
The increasing of mixing temperature (Cmtr) from 30 to 35 0C are effective to increase the electrical conductivity
of MWCNT/SG/epoxy nanocomposites generated, but the electrical conductivity of MWCNT/SG/epoxy
nanocomposites decreased significantly at higher temperatures (40 0C). This was due to mixture of conductive
fillers and binders started to harden or cross linked at a temperature of 40 0C.
Jurnal Kejuruteraan (UKM Engineering Journal) X (X): 9 pages, In Press
ISSN:0128-0198 E-ISSN:2289-7526
5
FIGURE 1. Effect of internal mixing parameter on the electrical conductivity of MWCNTs/SG/epoxy nanocomposites
FIGURE 2. Effect of internal mixing parameter on S/N ratio averages of MWCNTs/SG/epoxy nanocomposites
Analysis of Variance of Internal Mixing MWCNTS/SG/EP Nanocomposite
Analysis of Variance (ANOVA) using statistical method to separate the individual effect of control factors. The
percentage contribution of each control factor were used to measure the internal mixing parameters effect on the
electrical conductivity of MWCNT/SG/epoxy nanocomposites generated.
The analysis of variance (ANOVA) result for internal mixing experimental parameters are shown in Table 4. All
predetermined factors shows the highest significant level, with α = 0.005 (99.5% confidence level) of the mixing
rotation (Amr), mixing time, (Bmt) and mixing temperature (Cmtr). Mixing rotation (Amr) contributed the largest
Jurnal Kejuruteraan (UKM Engineering Journal) X (X): 9 pages, In Press
ISSN:0128-0198 E-ISSN:2289-7526
6
percentage (44 %) for the electrical conductivity properties of MWCNT/SG/epoxy nanocomposites produced,
followed by mixing temperature (Cmtr) of 27 % and mixing time (Bmt) (18 %).
A Bigger contribution from the mixing rotation was due to the dispersion and distribution of conductor filler,
specially the secondary conductive filler in the polymer matrix. Good dispersion of the conductive filler in the
polymer matrix increases the conductivity network and the electrical conductivity of MWCNT/SG/epoxy
nanocomposites. Evenly dispersion of conductive filler in the polymer matrix could improve network conductive
path and the electrical conductivity of MWCNTs/SG/epoxy nanocomposites produced (Antunes et al., 2011; Ma et
al., 2009; Lee et al. 2009). Analysis of variance (ANOVA) error, ie 12 %, show that there are no significant factors
are missed in Taguchi approach.
TABLE 4. Analysis of variance (ANOVA) on the electrical conductivity of MWCNT/SG/epoxy nanocomposites
Factor Degree of
Freedom
fn
Sum of Square
Sn
Variance
Vn
Variance
Ratio
Fn
Critical Value
F
Percentage
Contribution
Pn
A 2 6396 3198 49 F(0.005;2;20): 6.99 44
B 2 2649 1325 20 F(0.005;2;20): 6.99 18
C 2 3786 1893 29 F(0.005;2;20): 6.99 26
Error 20 1318 66 12
Total 26 14150 100
Verification Tests of MWCNTS/SG/Epoxy Nanocomposite
Verification test is the last step to identify Taguchi method impact for each experimental parameters. Confirmatory
tests can be done in two ways; using forecast equation (ηforecast) and experimental verification of the optimum
parameters obtained from the signal to noise ratio (S/N) for the internal mixing parameters, namely parameters A1-
mr, B3-mt, C2-mtr. Forecast equations to predict the electrical conductivity and signal to noise ratio (S/N) for the
optimum internal mixing parameter, using Equation 1 (Liu et al. 2010).
ramalan optimum = + (A1- )+(B3- )+(C2- ) (1)
= The average value of signal to noise ratio (S/N) or the electrical conductivity average obtained from the
experimental. The optimum combination of parameters A1-im, B3-im, C2-im is the average signal to noise ratio (S/N) or
the electrical conductivity average of MWCNT/SG/epoxy nanocomposites for each significant level. The optimum
forecast are 205 S/cm and 46 dB. The experimental study then conducted to set the optimum electrical conductivity
and signal to noise ratio (S/N) of MWCNT/SG/epoxy nanocomposites. Experiments conducted by provide a sample
of the optimum internal mixing parameters combination, mixing rotation (20 rpm), mixing time (15 min), and
mixing temperature (35 0C).
The results of the initial combination, optimum combination, and optimum ηforecast are shown in Table 5. The
average value of the electrical conductivity and signal to noise ratio for the initial combination parameter of A1-mr ,
B1-mt , and C1-mtr, are 153 S/cm and 44 dB. The optimum combination parameter of A1-mr B3-mt C2-mtr produce
MWCNTs/SG/epoxy nanocomposites with the electrical conductivity and the signal to noise ratio S/N average
values of 197 S/cm and 46 dB. The confirmation test of the optimum parameter combination managed to increase
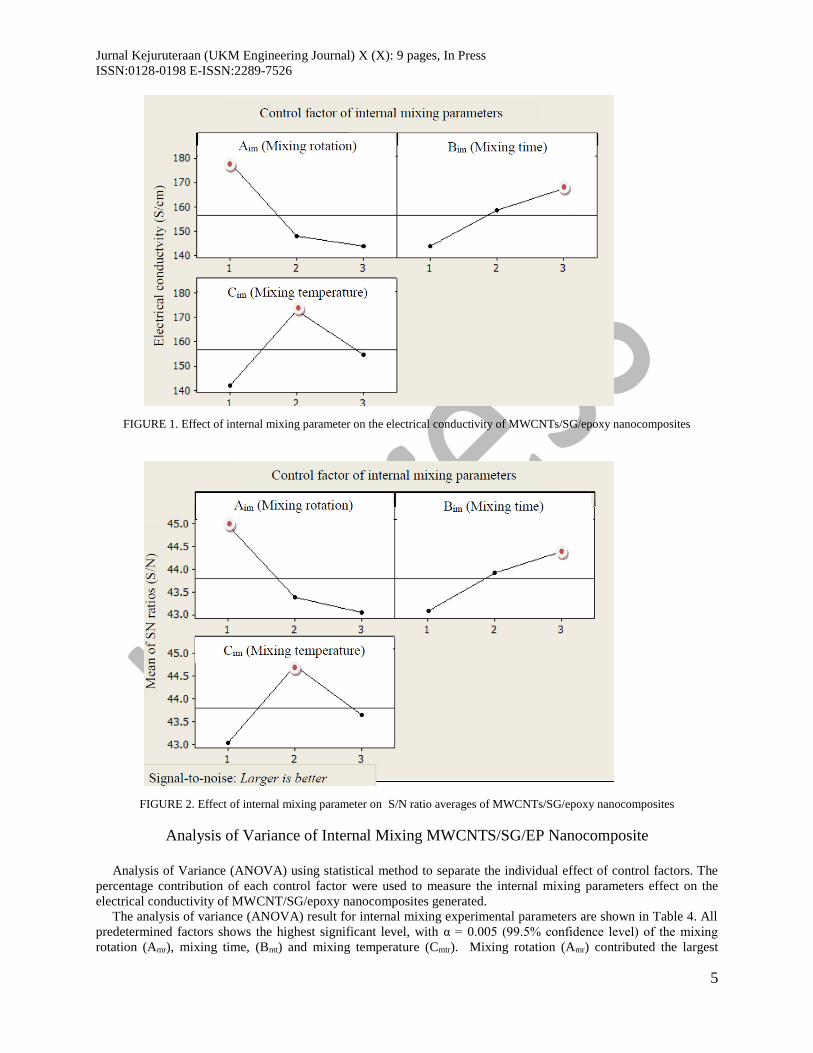
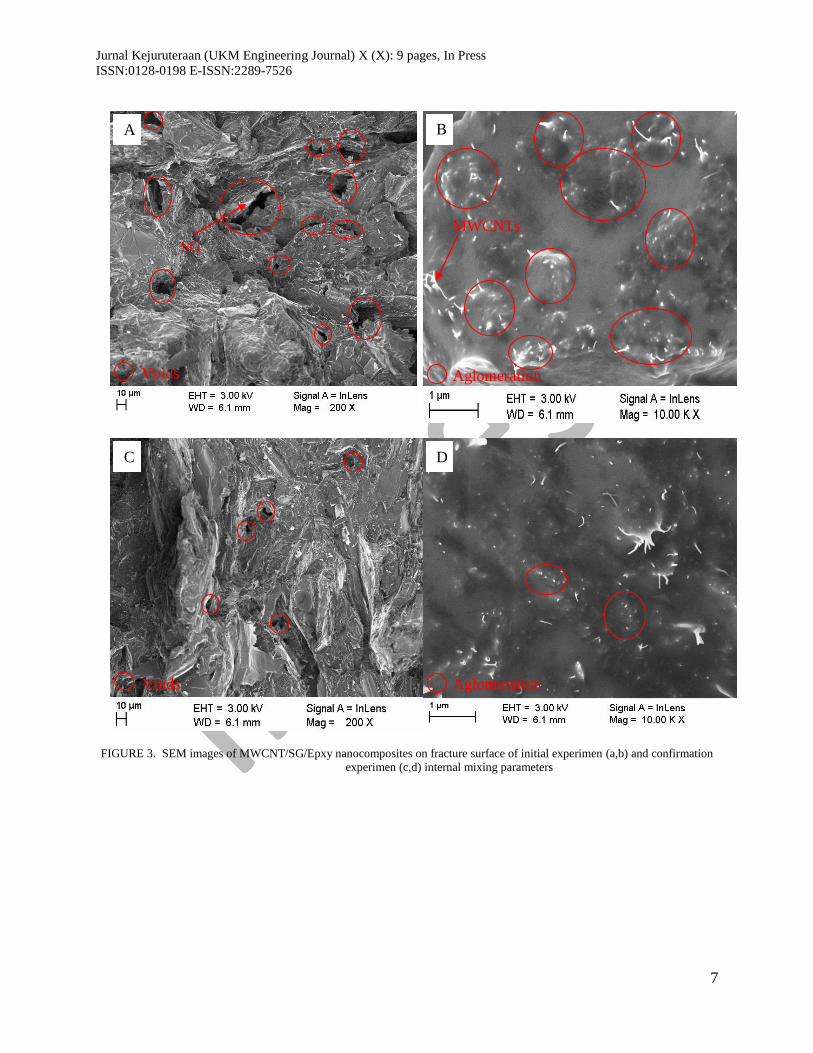
the electrical conductivity of MWCNT/SG/epoxy nanocomposites obtained as 28 %. Field emission scanning
electron microscopic (FESEM ) images on the experimental confirmation shows that the number of voids (figure 3c
and 3d) was significantly reduced and conductive filler (MWCNTs) as a second filler material dispersed better in the
whole area epoxy resin as a matrix. The electrical conductivity of MWCNTs/SG/epoxy nanocomposites obtain is
much higher than the initial combination (figure 3a and 3b) The electrical conductivity and signal to noise (S/N)
ratio from the experimental results were not significantly different with the optimum of forecast, which are only as
much as 4.47% and 1.35%. These results show that the forecast equations used was effective to predict the electrical
conductivity and signal to noise ratio (S/N) to get the optimum parameter combination of MWCNT/SG/epoxy
nanocomposites
Jurnal Kejuruteraan (UKM Engineering Journal) X (X): 9 pages, In Press
ISSN:0128-0198 E-ISSN:2289-7526
7
FIGURE 3. SEM images of MWCNT/SG/Epxy nanocomposites on fracture surface of initial experimen (a,b) and confirmation
experimen (c,d) internal mixing parameters
A B
C D
Voids
Voids Aglomeration
Aglomeration
SG
MWCNTs
Jurnal Kejuruteraan (UKM Engineering Journal) X (X): 9 pages, In Press
ISSN:0128-0198 E-ISSN:2289-7526
8
TABLE 5. The optimization of the electrical conductivity of MWCNT/SG/epoxy nanocomposites
Level Electrical Conductivity (S/cm) S/N Ratio
Everage (dB)
Initial Combination A1-mrB1-mtC1-mtr 153 44
Optimum Combination A1-mr B3-mtC2-mtr 197 45
Optimum forecast A1-mrB3-mtC2-mtr 205 46
Mixing rotation 20 rpm (A1-mr); Mixing time 15 min (B3-mt) ; Mixing temperature 35 0C (C2-mtr)
CONCLUSION
Based on the optimization of the internal mixing parameters on the electrical conductivity of MWCNTs/SG/epoxy
nanocomposites can be concludes as below:
1. Taguchi method has been successful in increasing the value of the electrical conductivity of 153 S/cm
(initial combination) to 195 S / cm (optimum combination).
2. The highest percent contribution of the internal mixing parameters of the electrical conductivity
MWCNTs/SG/epoxy nanocomposites is mixing rotation (44 %).
3. Forecast equations is efective to predict the electrical conductivity and signal to noise ratio (S/N) for the
optimum internal mixing parameter.
ACKNOWLEDGEMENTS
This work was supported by the Research Fund provided by the Directorate General of Higher Education, 2016 with
contract number: SP DIPA-042.06.1.401516/2016, 7 Desember 2015, for Kopertis Wilayah X, number: 18/Kontrak-
Penelitian/010/KM/2016, 22 February 2016.
REFERENCES
Ahmad, M.A.F., Nuawi, M.Z., Mohamed, N.F., Wahid, Z. & Dirhamsyah, M. 2016. The study of polymer material
characterisation using M-Z-N statistical analysis method. Jurnal Kejuruteraan, 28: 9-18.
Antunes, R.A., de Oliveira, M.C.L., Ett, G. & Ett, V. 2011. Carbon materials in composite bipolar plates for
polymer electrolyte membrane fuel cells: A review of the main challenges to improve electrical
performance. Journal of Power Sources, 196: 2945-2961.
Asiltürk, İ. & Akkuş, H. 2011. Determining the effect of cutting parameters on surface roughness in hard turning
using the Taguchi method. Measurement, 44: 1697-1704.
Chang, C.Y., Huang, R., Lee, P.C. & Weng, T.L. 2011. Application of a weighted Grey-Taguchi method for
optimizing recycled aggregate concrete mixtures. Cement and Concrete Composites, 33: 1038-1049.
Das, N.C., Chaki, T.K & Khastgir, D. 2002. Effect of processing parameters, applied pressure and temperature on
the electrical resistivity of rubber-based conductive composites. Carbon, 40: 807–816.
Hu, N., Masuda, Z., Yamamoto, G., Fukunaga, H., Hashida, T. & Qiu, J. 2008. Effect of fabrication process on
electrical properties of polymer/multi-wall carbon nanotube nanocomposites. Composites Part A:Applied
Science and Manufacturing, 39: 893-903.
Kalyon, D.M., Birinci, E., Yazici, R., Karuv, B. & Walsh, S. 2002. Electrical properties of composites as affected by
the degree of mixedness of the conductive filler in the polymer matrix. Polymer Engineering and Science,
42:1606-1612.
Kishi, H., Kuwata, M., Matsuda, S., Asami, T. & Murakami, A. 2004. Damping properties of thermoplastic-
elastomer interleaved carbon fiber-reinforced epoxy composites. Composites Science and Technology,
64: 2517-2523.
Jurnal Kejuruteraan (UKM Engineering Journal) X (X): 9 pages, In Press
ISSN:0128-0198 E-ISSN:2289-7526
9
Lee, J.H., Jang, Y.K., Hong, C.E., Kim, N.H., Li, P. & Lee, H.K. 2009. Effect of carbon fillers on properties of
polymer composite bipolar plates of fuel cells. Journal of Power Sources, 193: 523-529.
Liao, S., Yen, C., Weng, C., Lin, Y., Ma, C., Yang, C., Tsai, M., Yen, M. Hsiao, M. & Lee, S. 2008. Preparation
and properties of carbon nanotube/polypropylene nanocomposite bipolar plates for polymer electrolyte
membrane fuel cells. Journal of Power Sources, 185: 1225-1232.
Lin, J.L., Wang, K.S., Yan, B.H. & Tarng, Y.S. 2000. Optimization of the electrical discharge machining process
based on the Taguchi method with fuzzy logics. Journal of Materials Processing Technology, 102: 48-55.
Lin, Y.C., Chen, Y.F., Wang, D.A. & Lee, H.S. 2009. Optimization of machining parameters in magnetic force
assisted EDM based on Taguchi method. Journal of Materials Processing Technology, 209: 3374-3383.
Liu, Y.T., Chang, W.C.& Yamagata, Y. 2010. A study on optimal compensation cutting for an aspheric surface
using the Taguchi method. CIRP Journal of Manufacturing Science and Technology, 3: 40–48.
Ma, P.C., Liu, M.Y., Zhang, H., Wang, S.Q., Wang, R., Wang, K., Wong, Y.K., Tang, B.Z., Hong, S.H., Paik, K.W
& Kim, J.K. 2009. Enhanced electrical conductivity of nanocomposites containing hybrid fillers of carbon
nanotubes and carbon black. ACS Applied Materials & Interface, American Chemical Society, 1:1090–
1096.
Rybak, A., Boiteux, G., Melis, F. & G. Seytre. 2010. Conductive polymer composites based on metallic nanofiller
as smart materials for current limiting devices. Composites Science and Technology, 70: 410-416.
Song, L.N., Xiao, M. & Meng, Y.Z. 2006. Electrically conductive nanocomposites of aromatic
polydisulfide/expanded graphite. Composites Science and Technology, 66: 2156-2162.
Suherman, Hendra., Sahari, J., Sulong, A.B. 2013. Effect of small-sized conductive filler on the properties of an
epoxy composite for a bipolar plate in a PEMFCs. Ceramis International, 39: 7159-7166.
Sulong, A.B., Park, J., Azhari, C.H. & Jusoff, K. 2011. Process optimization of melt spinning and mechanical
strength enhancement of functionalized multi-walled carbon nanotubes reinforcing polyethylene fibers.
Composites Part B: Engineering, 42:11- 17.
Surace, R., Filippis, L.A.C., Ludovico, A.D & Boghetich, G. 2010. Application of Taguchi method for the multi-
objective optimization of aluminium foam manufacturing parameters. International Journal of Materials
Forming, 3: 1–5.
Wang, Y. & Northwood, D.O. 2008. Optimization of the polypyrrole-coating parameters for proton exchange
membrane fuel cell bipolar plates using the Taguchi method. Journal of Power Sources, 185: 226-232.
Xie, X., Mai, Y. & Zhou, X. 2005. Dispersion and alignment of carbon nanotubes in polymer matrix: a review.
Materials Science and Engineering: Reports,49: 89-112.
Zakaria, M.Y., Sulong. A.N., Sahari.J., Suherman.H. 2015. Effect of the addition of milled carbon fiber as
secondary filler on the electrical conductivity of graphite/epoxy composite for electrical conductive
material. Composite Part B, 83:75-80.
*Irmayani,
Department of Industrial Engineering,
Universitas Ekasakti, Padang,
West Sumatera, Indonesia
Hendra Suherman
Department of Mechanical Engineering,
Universitas Bung Hatta
25143 Padang, Indonesia
*Corresponding author; email: [email protected]
Received Date: 13th June 2017
Accepted Date: 15th November 2017
In Press date : 15th December 2017
Published date : XX