Embed Size (px)
Citation preview
RAIRO-Oper. Res. 55 (2021) S1529–S1549 RAIRO Operations Researchhttps://doi.org/10.1051/ro/2020046 www.rairo-ro.org
SHAREHOLDING OPERATION OF PRODUCT REMANUFACTURING – FROMA SUSTAINABLE PRODUCTION PERSPECTIVE
Junwu Chai1,2, Hengyu Li1,∗, Chien-Hung Lee3,∗, Sang-Bing Tsai4,∗
and Hong Chen1
Abstract. We consider a supply chain in which an original equipment manufacturer (OEM) autho-rizes the remanufacturing business to a third-party remanufacturer (TPR). The OEM may make aninvestment to hold equity in TPR. This operation not only enables OEM to share the profit of the TPRas a forward shareholding supply chain, but also improve the production efficiency of the TPR andconsequently benefits the whole supply chain. We characterize the equilibrium production decisions ofall members by using Stackelberg game in such a supply chain. We find that shareholding operationby OEM helps increase the production quantity of remanufactured products and total market vol-ume. From the economic perspective, our results show both sides in the forward shareholding supplychain prefer the shareholding operation if the equity holding cost and remanufactured cost is relativelysmall. Additionally, from an environmental perspective, our results show under certain relative pollutionratio of remanufactured products, shareholding operation can reduce environmental impact. Finally, wecheck the key results by stimulating numerical examples and obtain some useful management insights.
Mathematics Subject Classification. 90A35, 90B30, 91A10, 91B42.
Received August 11, 2019. Accepted April 28, 2020.
1. Introduction
Developments in science and technology have accelerated the differentiation and renewal of high-tech productsand greatly shortened the life cycle of products, resulting in a vast number of discarded or end-of-life (EOL)products [55]. Consequently, this has not only significantly negatively impacted the environment, but has alsowasted a lot of valuable resources and energy [58]. In order to alleviate the negative impact of waste productson the environment, governments all over the world are beginning to attach great importance to reusablewaste, which reduces resource and energy consumption, and, subsequently, makes use of the surplus value ofEOL products [50]. Accordingly, remanufacturing is considered to be one of the most important methods indeveloping a circular sustainable economy and will continue to play an essential role in the issues surroundingindustrial environmental protection increasingly confronting the world [54]. The remanufacturing industry in
Keywords. Sustainable supply chain, forward shareholding, stackelberg game, remanufacturing operation, sustainable production,LCA.
1 School of Management and Economics, University of Electronic Science and Technology of China, Chengdu 611731, P.R. China.2 Center for West African Studies of University of Electronic Science and Technology of China, Chengdu 611731, P.R. China.3 College of Tourism and Service Management, Nankai University, Tianjin 300071, P.R. China.4 Regional Green Economy Development Research Center, School of Business, WUYI University, Wuyishan 354300, P.R. China.∗Corresponding authors: [email protected] (H.L.); [email protected] (S.T.); [email protected] (C.L.)
Article published by EDP Sciences c© EDP Sciences, ROADEF, SMAI 2021
S1530 J. CHAI ET AL.
the developed world is growing rapidly, with more than $140 billion and directly employed nearly more than fivemillion jobs worldwide. In the USA, remanufacturing output is worth $75 billion, and provides 180 000 full-timejobs [33].
However, not all OEMs are willing or capable of remanufacturing used products in a profitable manner dueto a lack of relevant technologies [32], the unprofitability associated with investing in new infrastructure andtraining professionals [6], and the damage to the image of the OEM’s brand [15]. Consequently, the remanu-facturing sector is dominated by third-party remanufacturers (TPRs) in many industries [63]. With the knownadvantages for environmental protection, as well as the economic benefits associated with remanufacturing, thissector is becoming increasingly recognizable to governments and private enterprises [9, 18]. Furthermore, thecontinuous reduction in remanufacturing costs and increases in the quality of remanufactured products resultsin intense competition between new products from OEMs and the remanufactured products from TPRs [39].As a result, OEMs have begun to charge a license fee for remanufacturing of products, and this setting may reflectcircumstances in which the remanufacturing industry is particularly inefficient, causing a double marginalizationproblem to arise [49].
As a consequence, firms in the supply chain tend to explore a better way of cooperation to maximize profits.Equity participation of one party with another has been observed widely in industries, and this phenomenon iscalled the ‘partial vertical ownership’ (PVO) in the vertical supply chain or ‘strategic collaborations’ in high-tech industries [12]. OEMs expect to enter the remanufacturing business by way of a shareholding operationand to control the production and pricing of remanufactured goods, which may allow the acquirer to playa role in monitoring and disciplining target management. With this type of “collaboration”, parties in thesupply chain can advocate for a contract to share profits through proportion in equity. Therefore, there is thepotential that the PVO may be able to moderate double marginalization due to the promotion of “bonding”between upstream and downstream firms through revenue sharing [23]. For example, PVO is common to theautomobile industry – e.g., Toyota shares were held by the manufacturer for General Motors [17].
Besides the automobile industry, this pattern of holding-share is undergoing rapid developments in the reman-ufacturing sector in China [53]. For example, Cummins Inc. in China has become a shareholder of Navistar inview of the remanufacturing standards in the Chinese market and the needs of consumers in order to meetthe stringent emission regulations and, simultaneously, achieve continuous improvement in performance andefficiency. Likewise, Guangxi Yuchai Machinery Co., Ltd. (GYMCL) has taken ownership of the remanufac-turing company, Caterpillar China, who provides remanufacturing services for diesel engines and components.Compared with less than 40% before, GYMCL can achieve a remanufacturing rate of 60–70%. Such mutuallybeneficial partnership generated $300 million in sales and helped GYMCL enter China’s top 500 companies’list. Early, Land Rover have signed an agreement about with Caterpillar. Caterpillar was allowed to producethe remanufactured engines qualified by Land Rover and share revenues. These cases demonstrate that “share-holding” in remanufacturing has become the driving force behind OEMs’ return to the remanufacturing sector.
Nevertheless, there are both advantages and disadvantages associated with economic performance within thepartial ownership strategy. On the one hand, moving forward in an unfamiliar market through investing inequity with other enterprise and obtaining additional profits through profit distribution is relatively effective.On the other hand, such operating shareholding may lead to declines in a positive economic effect overall dueto the instability of the alliance and high holding cost of equity. Based on such uncertainty, the main purposeof this paper is to explore whether “shareholding” as business cooperation is beneficial to the OEM, TPR ordetrimental to the them from a sustainable production perspective. In particular, we aim to answer the followingquestions:
(1) What are the optimal decision-making adjustments of OEM and TPR with the shareholding business?(2) Whether equity participation achieves benefits for all parties in the supply chain?(3) What is the environmental impact of the OEM’s shareholding operation on TPR’s remanufacturing?(4) Under what conditions an economic and environmental win–win situation can be achieved in terms of
shareholding operation?
SHAREHOLDING OPERATION OF PRODUCT REMANUFACTURING S1531
In order to approach a better understanding of the abovementioned questions, this investigation utilizeda Stackelberg game model with an OEM in a leadership position and a TPR as follower. The Stackelbergmodel is a strategic game in economics in which the leader firm moves first and then the follower firms movesequentially [15, 44, 57]. Here, Stackelberg game model reflected the fact that OEM usually have pricing rightof license fee, bargaining power and the ability to choose whether or not buy into TPR’s share. We proposedtwo types of exclusive authority to TPR, including a license fee operation (Model N) and a shareholdingoperation (Model S). Under these two operations, the OEM and TPR developed competition in the terminalmarket through new and remanufactured products. Through solving the equilibrium solution for the OEM andTPR under two operations, the effectiveness boundary for the remanufacturing sector for the TPR and thatof the shareholding operation for the OEM is found. Moreover, in some situations we found the shareholdingoperation to be of benefit to the whole supply chain. From an environmental perspective, we determined thescope of the remanufactured cost and environmental coefficient, which achieved a win–win situation for boththe manufacturing economy and the environment. Essentially, Model N always had a smaller consumer surpluscompared with Model S. More specifically, apart from regular profitability, we compared the social benefits ofboth models and found that, when the environmental impact generated by remanufactured products is small andthe holding cost of equity were not too pronounced, the shareholding operation had significant social benefitson consumer surplus, economy and environment impacts.
The remainder of this paper is organized as follows: Section 2 reviews the relevant literature and explains ourcontributions in more detail; Section 3 describes the research hypotheses and the model symbols; Section 4 buildsand solves mathematical models for two different operations; Section 5 analyzes their optimal decisions andpresents the main results from the production decision-making, economic and environmental benefits; Section 6gives some more intuitive numerical examples; and, finally, Section 7 provides our concluding remarks andpresents suggestions for future research directions. All evidence for this study is presented in the Appendix A.
2. Literature review
The paper is related to the literature on competition between OEM and TPR, product life cycle and forwardshareholding.
In general, competition between the OEM and the TPR has become an inevitable trend in the development ofthe remanufacturing sector. The body of literature on remanufacturing has been expanding. Following extensiveeconomics literature, most research assumes that the consumers typically value less on remanufactured productsto express demand cannibalization [1, 9, 16, 26, 31, 33, 39, 40, 42, 44, 56, 57]. In which, consumers have valuationU ∈ [0, 1] for the new product and θU for the remanufactured product. Early, Ferguson [16] proposed thatOEM should take into account the encroachment of remanufactured products on the sales of new products,and strategies to resist remanufacturers’ entry into the market should be put forward. Orsdemir et al. [42]considered the remanufacturing competition between the OEM and TPR and, besides economic impacts, theyargued that environmental impact is reduced when the remanufacturer is the OEM. Subsequently, part of theresearch focuses on competition in remanufacturing recycling channels between OEM and TPR [22,26,57], pricecompetition between new and remanufactured products [40,42], and quality differentiation [37,39,44,56]. Morerecently, Jin et al. [31] demonstrated that third-party remanufacturing could be beneficial to the OEM becauseof reductions in the price of components provided by supplier. Qian et al. [44] argued that products upgradingstrategy can mitigate cannibalization problems and create an optimal pareto improvement for both OEM andTPR. He et al. [26] propose two coordination mechanisms to ameliorate the decentralized model and alleviatecompetition. Li et al. [37] considered a manufacturer facing the decision of investing in either product qualityimprovement or in remanufacturing its used products. In this context, our research contributes to this streamof research by not only consider the competition relationship between OEM and TPR, but also explores a newway of cooperation relationship between OEM and TPR.
The interactions between OEM and TPR are modelled as a Stackelberg game, which OEM as a leader and TPRas a follower. This Stackelberg competition game is followed by the work of other studies [4, 15, 31, 44, 56, 57, 63].
S1532 J. CHAI ET AL.
The way of using Stackelberg game is that OEM has a first-mover advantage while TPR move sequentially as afollower. The Stackelberg game not only reflects the OEM in the actual situation as the industry leader [44,56],but also show that the OEM has the initiative power of charging a license fee for TPR’s remanufacturing orwholesale price for recycling components [4, 15, 63]. From another perspective, some literature show that TPRremanufacturing as a new entrant brings the problem of cannibalism to OEM products. It also proves that TPRis in the follower position in the Stackelberg game. Research involved in such competition between OEM andTPR are widely investigated with respect to the variation of production cost of remanufacturing. Following theprevious literature, we also use these variables in the analysis to exhibit the level of competition between OEMand TPR.
The second stream of literature focuses on the Product Life Cycle and Life Cycle Assessment. The concept ofproduct life cycle (PLC) was first proposed by Levitt and appears in the field of economic and management [35].PLC can be divided into four phases: introduction, growth, maturity and decline [47]. With the developmentof supply chain management and environmental problems are paid more attention, PLC can be extended toinclude product design, manufacturing, use and scrap [43, 45]. Besides, since remanufacturing can extend thelife cycle of products. PLC of remanufactured product also contains recycling and remanufacturing [1,13,19,44].We assume that our model in this paper can also be viewed as the PLC of remanufactured products, whichincludes manufacturing, remanufacturing, usage, recycling and disposal [2]. Further, to assess the environmentalimpacts along the PLC of remanufactured products, a large number of scholars have used Life Cycle Assess-ment (LCA) techniques to study environmental problems in the field of remanufacturing [2,14,24,25,44,57,60].Although energy consumption, non-renewable raw material consumption, carbon emissions, toxicity can measurethe environment, Life Cycle Assessment (LCA) techniques are popular for this purpose in the field of environ-mental economics [3]. Specifically, Atasu et al. [2] use a single, aggregate measure of environmental impact perunit at each stage of the life cycle to measure environmental impact. Esenduran et al. [13] also measure theimpact of take-back legislation on the environment through an approach based on life cycle Assessment. Zhiet al. [60] investigated the environmental impact of the product by using LCA-based approach to characterizesthe environmental impact of the fund policy. Following the above article, we also use LCA to measure theenvironment impact of new and remanufacturing products by shareholding operation caused by OEM. In thiscontext, following previous research [14, 57, 60], we define environmental impact to be linear in sales quantity,everything else being equal, to reflect the notion that higher quantities of products typically represent the needfor larger quantities of virgin materials and bring more environment impacts.
The third part of literature is on forward shareholding. Admittedly, the competitive relationship between theOEM and the third party can effectively be coordinated via external means, such as reward and punishmentmechanisms, contract mechanisms, government coordination policies, subsidies and legislation [3, 14, 18, 62].However, Reitman [46] supported the notion that, in order to commit to less aggressive competition, partialownership with the competitor is an advantageous arrangement. After minority shareholding among firms, thesupply chain is essentially only a part partially integrated supply chain. Therefore, our work is also related to theliterature on the revenue-sharing contract, where Cachon [8] and Chauhan [10] proposed a general theoreticalframework for this contract type. Subsequently, the coordination of revenue-sharing contracts has been studiedextensively under varying conditions [5, 29]. Moreover, we combed the literature on partial ownership fields[7, 17, 27, 34, 41, 48, 57]. These studies focused on the impact of cross-shareholdings on the performance of thesupply chain among enterprises under the condition of Cournot competition. Furthermore, Fu [17], Gomes[21] and Ghosh and Morita [20] studied the economic performance and the outcomes of competition in terms ofpartial vertical ownership. These articles emphasize the impact of holding proportion in equity and equity holdingcost on the conclusion In order to highlight the value of “shareholding” variables in our operation managementinvestigation we focus on the parameters: the equity holding cost to reflect the efficiency of shareholding Despitethe prevalence of partial ownership in the literature, however, little theoretical work has been conducted on thephenomenon of remanufacturing.
By analyzing the abovementioned literature, to the best of our knowledge, we found that little researchhas been conducted on remanufacturing operations incorporating equity participation. Essentially, our paper
SHAREHOLDING OPERATION OF PRODUCT REMANUFACTURING S1533
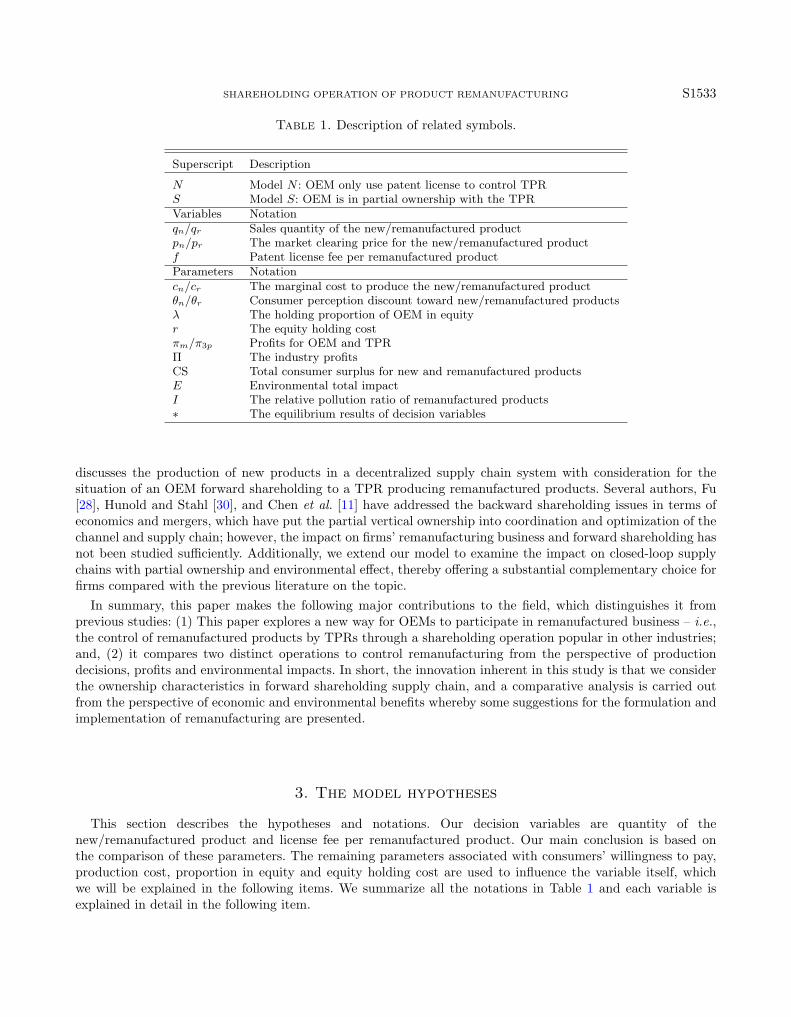
Table 1. Description of related symbols.
Superscript Description
N Model N : OEM only use patent license to control TPRS Model S: OEM is in partial ownership with the TPRVariables Notationqn/qr Sales quantity of the new/remanufactured productpn/pr The market clearing price for the new/remanufactured productf Patent license fee per remanufactured productParameters Notationcn/cr The marginal cost to produce the new/remanufactured productθn/θr Consumer perception discount toward new/remanufactured productsλ The holding proportion of OEM in equityr The equity holding costπm/π3p Profits for OEM and TPRΠ The industry profitsCS Total consumer surplus for new and remanufactured productsE Environmental total impactI The relative pollution ratio of remanufactured products∗ The equilibrium results of decision variables
discusses the production of new products in a decentralized supply chain system with consideration for thesituation of an OEM forward shareholding to a TPR producing remanufactured products. Several authors, Fu[28], Hunold and Stahl [30], and Chen et al. [11] have addressed the backward shareholding issues in terms ofeconomics and mergers, which have put the partial vertical ownership into coordination and optimization of thechannel and supply chain; however, the impact on firms’ remanufacturing business and forward shareholding hasnot been studied sufficiently. Additionally, we extend our model to examine the impact on closed-loop supplychains with partial ownership and environmental effect, thereby offering a substantial complementary choice forfirms compared with the previous literature on the topic.
In summary, this paper makes the following major contributions to the field, which distinguishes it fromprevious studies: (1) This paper explores a new way for OEMs to participate in remanufactured business – i.e.,the control of remanufactured products by TPRs through a shareholding operation popular in other industries;and, (2) it compares two distinct operations to control remanufacturing from the perspective of productiondecisions, profits and environmental impacts. In short, the innovation inherent in this study is that we considerthe ownership characteristics in forward shareholding supply chain, and a comparative analysis is carried outfrom the perspective of economic and environmental benefits whereby some suggestions for the formulation andimplementation of remanufacturing are presented.
3. The model hypotheses
This section describes the hypotheses and notations. Our decision variables are quantity of thenew/remanufactured product and license fee per remanufactured product. Our main conclusion is based onthe comparison of these parameters. The remaining parameters associated with consumers’ willingness to pay,production cost, proportion in equity and equity holding cost are used to influence the variable itself, whichwe will be explained in the following items. We summarize all the notations in Table 1 and each variable isexplained in detail in the following item.

S1534 J. CHAI ET AL.
3.1. Consumer behaviors
In this study, we assume the existence of a continuum of consumers who typically differ in their willingnessto pay, and the size of the consumer population is assumed to be constant over time and is normalized to 1.To capture consumers who differ in their willingness to pay, we suppose that consumers are heterogeneous in theutility that they derive from consumption and are characterized by their type u, which is heterogeneous and uni-formly distributed in [0, 1]. Specifically, a consumer will value the product in reserved willingness to pay, U , fora given product i is defined by U = θiu−pi, pi is the market clearing price, and θi (θn and θr) indicates the dis-count of consumers’ perceptions toward new and remanufactured products, respectively. We assume that θn = 1and θr = θ < 1. The reason is that the consumer will discount the value of remanufactured products than that ofnew products [1,15] (i.e., the price of a remanufactured iPhone 7 is always lower than that of new iPhone 7 [44]).To obtain tractable results, we let θn = 1 and θr = θ < 1 without loss of generality. Thus, one consumer is willingto pay for the new good from OEM derive a net utility of Un = u − pn; other with lower values Ur = θu − prbelong to the remanufactured products. Thus, the indifferent point between purchasing a new product ora remanufactured product is at (pn − pr)/(1 − θ). In this case, only consumers with valuations in the interval(pn − pr)/(1 − θ) < U < 1 will buy new products. The quantity is qn = 1 − (pn − pr)/(1 − θ) Similarly, theindifferent point between purchasing a remanufactured product and not purchasing is at pr/θ. In this case,only consumers with valuations in the interval pr/θ < U < (pn− pr)/(1− θ) will buy remanufactured products.The quantity is qr = (pn−pr)/(1−θ)−pr/θ. Finally, consumers with valuations lower than pr/θ would not pur-chase. Then, after the simplification, we obtain the reversed demand functions for the new and remanufacturedproduct, respectively, in equation (3.1):
pn = 1− qn − θqrpr = θ(1− qn − qr). (3.1)
3.2. Cost structure
Similar to the majority of the literature on the closed-loop supply chain [31, 44], we assume that all playersare risk-neutral and profit-seeking. Furthermore, we assume the OEM to be a Stackelberg leader to maximizeits profit with common knowledge of the demand and cost information of new products (cn). In addition, weassume that the marginal cost for TPR to produce a remanufactured product is (cr). To ensure the TPR isincentivized to engage in this business and to make a remanufactured product, we further assume cn > cr > 0.This assumption reflects that remanufacturing process requires only part of the new component because ofcollecting the serviceable parts, thereby making the remanufacturing product cost cheaper.
Additionally, the OEM will choose proportion in equity λ to maximize his own profits, using an equityinvestment cost described by the cost function C =
∫ λ0rλdλ = 1
2rλ2, which is composed of the holding
proportion in equity λ and equity holding cost r. Here, r represents the obstacle of shareholding activitiesamong competitors (i.e., the cost of integration between negotiations, corporate culture and business activitiesamong enterprises). Consequently, the cost is an integral function that represents the following: the higherthe proportion of an OEM’s stake in a TPR, the higher the marginal cost of holding it. We ignore the costof undertaking the collection of the product because the take-back channel and technology have been well-developed, and we focus on the impacts of remanufacturing on the forward supply chain [15,37,55].
3.3. Environmental impact
This study addresses environmental impact using an LCA-based approach, which is a technique that assessesa product’s environmental impact over its entire life cycle, including its manufacture from raw materials tonew products, its use, and its disposal [13]. Following recent work in the area of environmental implicationsfor operations management [1, 60], the impact during the stages of manufacturing, remanufacturing, usage,recycling (proper disposal by the TPR), and disposal (by consumer) is considered separately, and the subscriptsi ∈ (n, r, u, c, d) are used to represent each stage, respectively. Let ei denote the environmental impact of one
SHAREHOLDING OPERATION OF PRODUCT REMANUFACTURING S1535
product in stage i. The total environmental impact of new products and remanufactured products is representedby En = enqn and Er = erqr, the environmental impact of usage is represented by Eu = eu(qn + qr), and theenvironmental impact of recycling and disposal is represented by Ec = ec(qc − qr) and Ed = ed(qn − qc + qr).Furthermore, in our study, we assume that all collected products can be used for remanufacturing – that is,qc = qr [24, 44]. The total environmental impact is E = En + Er + Eu + Ec + Ed = (en + ed + eu)qn + (er +eu)qr. It is important to note that, since remanufacturing requires less material and energy compared with themanufacturing of new products, we further assume that the per-unit environmental impact of a new product islarger than that of a remanufactured one (essentially, en > er).
3.4. OEM and TPR
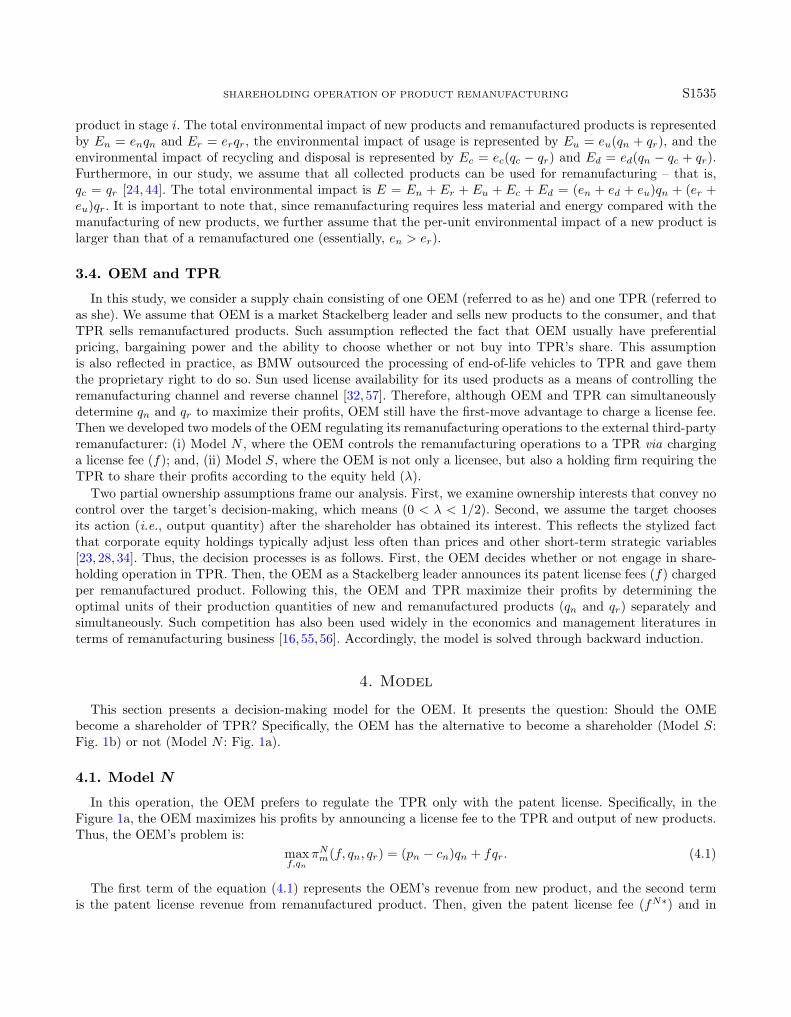
In this study, we consider a supply chain consisting of one OEM (referred to as he) and one TPR (referred toas she). We assume that OEM is a market Stackelberg leader and sells new products to the consumer, and thatTPR sells remanufactured products. Such assumption reflected the fact that OEM usually have preferentialpricing, bargaining power and the ability to choose whether or not buy into TPR’s share. This assumptionis also reflected in practice, as BMW outsourced the processing of end-of-life vehicles to TPR and gave themthe proprietary right to do so. Sun used license availability for its used products as a means of controlling theremanufacturing channel and reverse channel [32, 57]. Therefore, although OEM and TPR can simultaneouslydetermine qn and qr to maximize their profits, OEM still have the first-move advantage to charge a license fee.Then we developed two models of the OEM regulating its remanufacturing operations to the external third-partyremanufacturer: (i) Model N , where the OEM controls the remanufacturing operations to a TPR via charginga license fee (f); and, (ii) Model S, where the OEM is not only a licensee, but also a holding firm requiring theTPR to share their profits according to the equity held (λ).
Two partial ownership assumptions frame our analysis. First, we examine ownership interests that convey nocontrol over the target’s decision-making, which means (0 < λ < 1/2). Second, we assume the target choosesits action (i.e., output quantity) after the shareholder has obtained its interest. This reflects the stylized factthat corporate equity holdings typically adjust less often than prices and other short-term strategic variables[23, 28, 34]. Thus, the decision processes is as follows. First, the OEM decides whether or not engage in share-holding operation in TPR. Then, the OEM as a Stackelberg leader announces its patent license fees (f) chargedper remanufactured product. Following this, the OEM and TPR maximize their profits by determining theoptimal units of their production quantities of new and remanufactured products (qn and qr) separately andsimultaneously. Such competition has also been used widely in the economics and management literatures interms of remanufacturing business [16,55,56]. Accordingly, the model is solved through backward induction.
4. Model
This section presents a decision-making model for the OEM. It presents the question: Should the OMEbecome a shareholder of TPR? Specifically, the OEM has the alternative to become a shareholder (Model S:Fig. 1b) or not (Model N : Fig. 1a).
4.1. Model N
In this operation, the OEM prefers to regulate the TPR only with the patent license. Specifically, in theFigure 1a, the OEM maximizes his profits by announcing a license fee to the TPR and output of new products.Thus, the OEM’s problem is:
maxf,qn
πNm(f, qn, qr) = (pn − cn)qn + fqr. (4.1)
The first term of the equation (4.1) represents the OEM’s revenue from new product, and the second termis the patent license revenue from remanufactured product. Then, given the patent license fee (fN∗) and in
S1536 J. CHAI ET AL.
Figure 1. The flow of two models. (a) Model N . (b) Model S.
anticipation of the OEM’s response (qN∗n ), the issue for the TPR subsequently becomes:
maxqr
πN3p(f, qn, qr) = (pr − cr − f)qr. (4.2)
Using backward induction, and once the OEM can maximize his profit by choosing (qN∗n ), the TPR can alsodo so by choosing the remanufactured products (qN∗r ). Following this, the OEM can choose the patent licensefee (fN∗). The equilibrium decisions are summarized in the Table A.1.
Lemma 4.1. Under License fee operation, there exists the influence of various parameters on output and pricingdecision (Proof see Appendix A.1).
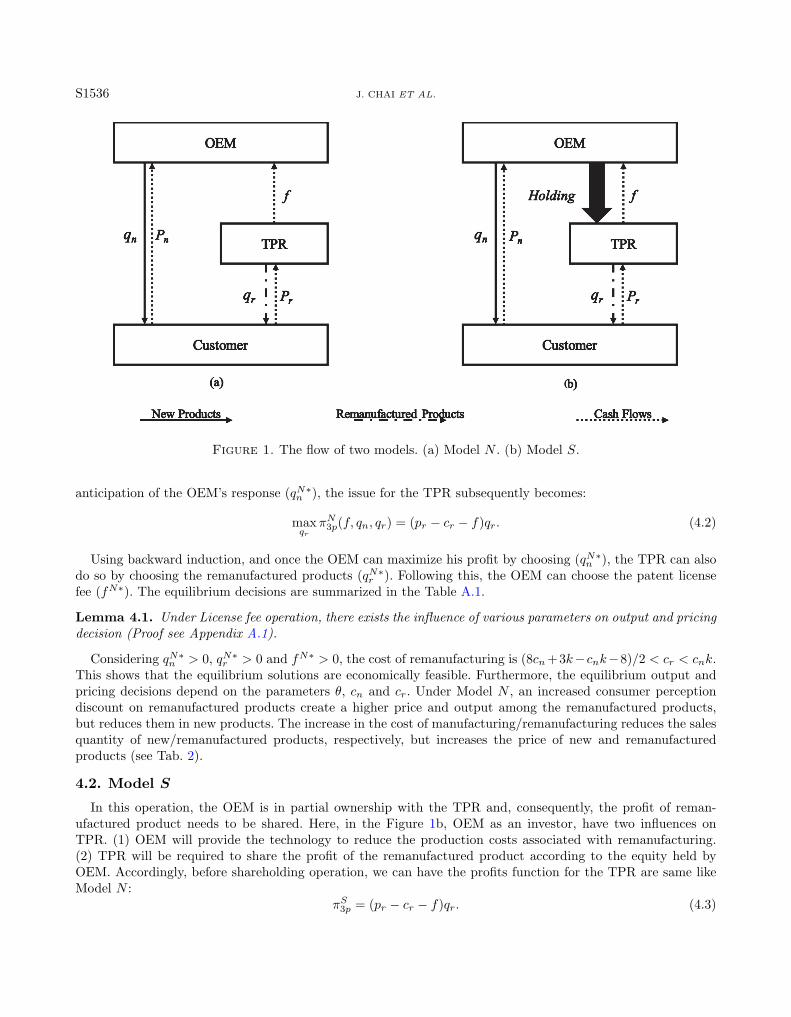
Considering qN∗n > 0, qN∗r > 0 and fN∗ > 0, the cost of remanufacturing is (8cn+3k−cnk−8)/2 < cr < cnk.This shows that the equilibrium solutions are economically feasible. Furthermore, the equilibrium output andpricing decisions depend on the parameters θ, cn and cr. Under Model N , an increased consumer perceptiondiscount on remanufactured products create a higher price and output among the remanufactured products,but reduces them in new products. The increase in the cost of manufacturing/remanufacturing reduces the salesquantity of new/remanufactured products, respectively, but increases the price of new and remanufacturedproducts (see Tab. 2).
4.2. Model S
In this operation, the OEM is in partial ownership with the TPR and, consequently, the profit of reman-ufactured product needs to be shared. Here, in the Figure 1b, OEM as an investor, have two influences onTPR. (1) OEM will provide the technology to reduce the production costs associated with remanufacturing.(2) TPR will be required to share the profit of the remanufactured product according to the equity held byOEM. Accordingly, before shareholding operation, we can have the profits function for the TPR are same likeModel N :
πS3p = (pr − cr − f)qr. (4.3)
SHAREHOLDING OPERATION OF PRODUCT REMANUFACTURING S1537
Table 2. Influence of parameters on the output and pricing decisions under Model N .
VariableParameter qN∗n qN∗r pN∗n pN∗r
θ ↗ ↘ ↗ ↘ ↗cn ↗ ↘ ↗ ↗ ↗cr ↗ ↗ ↘ ↘ ↗
Notes. The signs ↗, ↘ and× represent the relationships as monotonically increasing, monotonically decreasing andunrelated with respect to the parameter, respectively.
After OEM becomes a shareholder of TPR, with λ representing portion equity, the cost of the remanufacturedproduct declines λcr due to the technology of OEM and his familiarity with the disposal components. As a result,the TPR needs to share the λ portion of her profits with OEM. Thus, the profits function for TPR becomesthe rest of the 1− λ portion of her profits:
maxqr
πS3p(f, qn, qr) = (1− λ)(pr − (1− λ)cr − f)qr. (4.4)
And then, the profits function for OME becomes:
maxf,qn
πSm = (pn − cn)qn + fqr −12rλ2 + λ(pr − (1− λ)cr − f)qr. (4.5)
Where, the first term of the equation (4.5) represents the OEM’s revenue from the new product, the secondterm represents the cost of equity held, and the last term represents the λ portion of profits from the TPR.Again, with the use of backward induction, the equilibrium decisions are summarized in the Table A.1.
Lemma 4.2. Under the Shareholding operation, there exists the influence of various parameters on output andpricing decision (Proof see Appendix A.2).
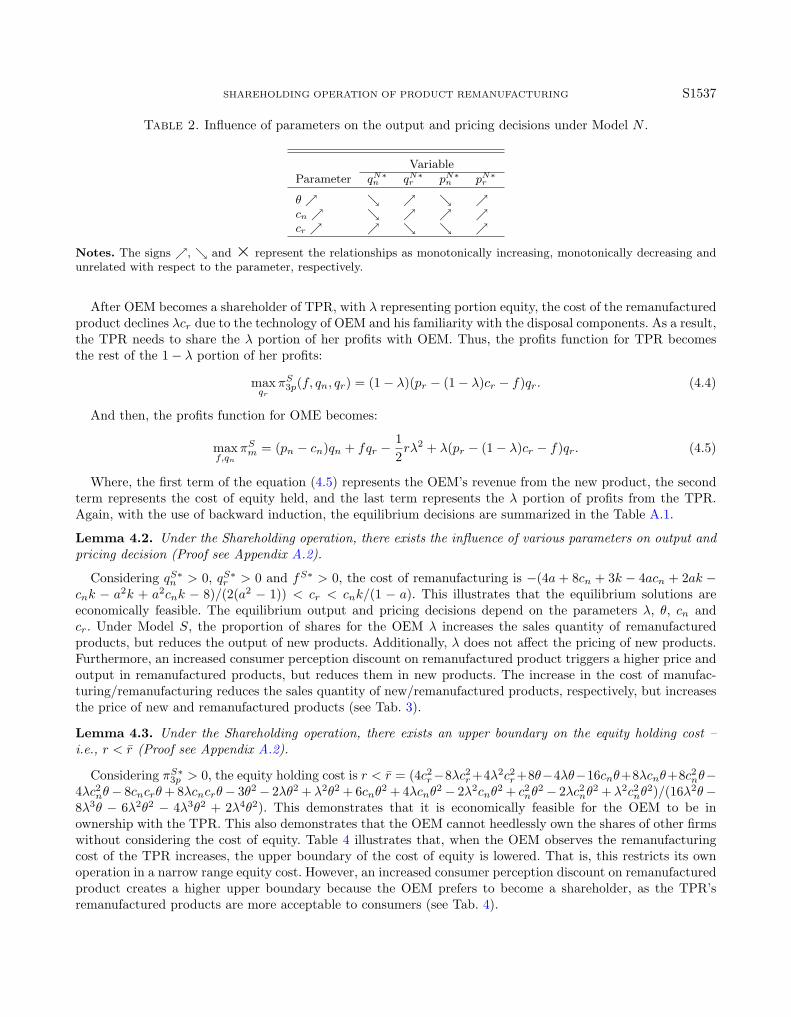
Considering qS∗n > 0, qS∗r > 0 and fS∗ > 0, the cost of remanufacturing is −(4a + 8cn + 3k − 4acn + 2ak −cnk − a2k + a2cnk − 8)/(2(a2 − 1)) < cr < cnk/(1 − a). This illustrates that the equilibrium solutions areeconomically feasible. The equilibrium output and pricing decisions depend on the parameters λ, θ, cn andcr. Under Model S, the proportion of shares for the OEM λ increases the sales quantity of remanufacturedproducts, but reduces the output of new products. Additionally, λ does not affect the pricing of new products.Furthermore, an increased consumer perception discount on remanufactured product triggers a higher price andoutput in remanufactured products, but reduces them in new products. The increase in the cost of manufac-turing/remanufacturing reduces the sales quantity of new/remanufactured products, respectively, but increasesthe price of new and remanufactured products (see Tab. 3).
Lemma 4.3. Under the Shareholding operation, there exists an upper boundary on the equity holding cost –i.e., r < r (Proof see Appendix A.2).
Considering πS∗3p > 0, the equity holding cost is r < r = (4c2r−8λc2r+4λ2c2r+8θ−4λθ−16cnθ+8λcnθ+8c2nθ−4λc2nθ− 8cncrθ+ 8λcncrθ− 3θ2− 2λθ2 + λ2θ2 + 6cnθ2 + 4λcnθ2− 2λ2cnθ
2 + c2nθ2− 2λc2nθ
2 + λ2c2nθ2)/(16λ2θ−
8λ3θ − 6λ2θ2 − 4λ3θ2 + 2λ4θ2). This demonstrates that it is economically feasible for the OEM to be inownership with the TPR. This also demonstrates that the OEM cannot heedlessly own the shares of other firmswithout considering the cost of equity. Table 4 illustrates that, when the OEM observes the remanufacturingcost of the TPR increases, the upper boundary of the cost of equity is lowered. That is, this restricts its ownoperation in a narrow range equity cost. However, an increased consumer perception discount on remanufacturedproduct creates a higher upper boundary because the OEM prefers to become a shareholder, as the TPR’sremanufactured products are more acceptable to consumers (see Tab. 4).
S1538 J. CHAI ET AL.
Table 3. Influence of parameters on the output and pricing decisions under Model S.
VariableParameter qS∗n qS∗r pS∗n pS∗r
λ↗ ↘ ↗ × ↘θ ↗ ↘ ↗ ↘ ↗cn ↗ ↘ ↗ ↗ ↗cr ↗ ↗ ↘ ↘ ↗
Notes. The signs ↗, ↘ and× represent the relationships as monotonically increasing, monotonically decreasing andunrelated with respect to the parameter, respectively.
Table 4. Influence of parameters on the upper boundary.
ParameterUpper boundary λ↗ θ ↗ cn ↗ cr ↗
r × ↗ × ↘
Notes. The signs ↗, ↘ and× represent the relationships as monotonically increasing, monotonically decreasing andunrelated with respect to the parameter, respectively.
5. Analysis
This section comparatively analyzes the practicability of the shareholding operation schemes in terms of threeaspects: output decisions, economic benefits, and environmental benefits.
5.1. Comparison of equilibrium solutions
Proposition 5.1. When cn < cn1 , the OEM is likely to decrease the patent license fee if cr < cr1 and increasethe patent license fee if cr > cr1 . When cn > cn1 , the OEM always increases the patent license fee (Proof seeAppendix A.3).
Based on Proposition 5.1, the OEM decreases the license fee if the production cost of both new and reman-ufactured products is relatively low due to less of an influence on profits. When the cost of remanufacturingproducts exceeds cr1 , the OEM increases his license fee. This is because the OEM offers technical support toreduce the cost of remanufactured goods after being in partial ownership with the TPR. The OEM participatesin the remanufacturing process and bears the cost. Moreover, the OEM usually sets a higher patent license feefor the TPR. When the production cost of new products becomes significant (cn > cn1), the OEM still setsa higher license fee for the TPR to compensate for the technological support he has given to the TPR.
Proposition 5.2. The Shareholding operation always brings positive remanufactured product sales growth(qS∗r > qN∗r ) but reduces the sales of new products (qS∗n < qN∗n ). Additionally, the shareholding operation expandsoverall sales volume (qS∗n + qS∗r > qN∗n + qN∗r ) (Proof see Appendix A.4).
Proposition 5.2 shows that the shareholding operation offers advantages in generating an increased quantityof remanufactured products but a decrease in new products. This is due to two reasons: First, the OEM is moreconcerned about his profits in remanufactured product due to profit sharing under the shareholding operationand, thus, the sale of remanufactured products increases; Second, remanufactured products encroach on themarket of products, thus weakening the advantages of the new products. However, we have still demonstratedthat the volume of products expands, meaning that, in the case of the shareholding operation, an increase inthe quantity of remanufactured products is capable of compensating for the loss in new products.
SHAREHOLDING OPERATION OF PRODUCT REMANUFACTURING S1539
5.2. Comparison of economic benefits
To better understand the effect of the shareholding operation on all parties in the supply chain, and toassist in selecting a better operation, in this section we highlight economic benefits from two main perspectives:Is the shareholding operation more beneficial to the OEM and the TPR, and, in particular, is this operationwell supported on a whole-industry scale?
Proposition 5.3. There exists a threshold such that, if r < r1, the profits for the OEM in Model S are higherthan those in Model N (i.e., πS∗m > πN∗m ). Otherwise, if r1 < r < r, these profits are lower (i.e., πS∗m < πN∗m )(Proof see Appendix A.5).
Proposition 5.3 demonstrates that the OEM would benefit more when the equity holding cost is relativelysmall. This situation occurs for two reasons. First, when the equity holding cost is relatively high (r1 < r < r),which means the reorganization of assets, personnel mobilization and business integration are difficult to carryout between the OEM and TPR smoothly. Second, the shareholding operation can create an increase in salesvolume of this series of products, which results in more intense market competition (refer to Prop. 5.2). Therefore,the shareholding operation is regarded as prohibitive for the OEM unless the costs are low enough and the profitshare from the TPR is effective in compensating for the loss of profits from the current product.
Proposition 5.4. It is less profitable for the TPR under the shareholding operation when cr < cr2 , with essen-tially πS∗3p < πN∗3p . Otherwise, if cr > cr2 , π
S∗3p > πN∗3p (Proof see Appendix A.6).
Based on Proposition 5.4, when cr < cr2 , the shareholding operation is less beneficial for the TPR. Conven-tional wisdom suggests that the low cost is conducive to third-party remanufacturing, and third-party remanu-facturing always hurts the OEM (as illustrated in the literature [34,36,38,51,52,59,61]). However, if the OEMdecides to become a shareholder and invest in a third-party, he can benefit more from the business of remanu-facturing. Therefore, if the cost of remanufacturing is relatively small, the TPR needs to distribute profits to theOEM. Consequently, the TPR may not welcome ownership from the OEM. When the cost of remanufacturingis significant (cr > cr2), the TPR can benefit from partial ownership from the OEM as a result of an observabledecline in remanufacturing cost through the use of the OEM’s technology.
Proposition 5.5. When cr < cr2 , r2 < r < r1, the shareholding operation is always detrimental to the industry– i.e., ΠS∗ < ΠN∗. Otherwise, when r < r2, and ΠS∗ > ΠN∗ (Proof see Appendix A.7).
Propositions 5.3 and 5.4 show that shareholding operation may be beneficial to the OEM (i.e., r < r1)but may be detrimental to the TPR (i.e., cr < cr2). While this proposition shows when cr < cr2 , r2 < r <r1, the shareholding operation is always detrimental to the industry. This further indicates that the benefitsfor the OEM’s profitability (see Prop. 5.3) cannot compensate for the TPR’s loss in profits (see Prop. 5.4).On the contrary, when the equity holding cost is lower than r2, the whole industry can benefit from shareholding(Model S).
5.3. Comparison of environmental benefits
In this section, we answer the question, what is the environmental impact of the OEM’s shareholding operationon TPR’s remanufacturing? And under what conditions an economic and environmental win–win situation canbe achieved in terms of shareholding operation? To better understands the effect of the shareholding operationon the environment, we use the LCA-based approach to assesses a product’s environmental impact over itsentire life cycle. In Section 3.3, following literature [14, 44, 60], we define E = En + Er + Eu + Ec + Ed =(en+ed+eu)qn+(er+eu)qr. For simplicity, we set e1 = en+ed+eu and e2 = er+eu, where e1 and e2 representthe per-unit environmental pollution associated with a new and a remanufactured product in their entire lifecycle. Obviously, e1 > e2. In this context, the lower is the environmental impact, the more environmentallyfriendly is the model. When comparing the equilibrium environmental impact of the two models, we arrive atthe following proposition:
S1540 J. CHAI ET AL.
Proposition 5.6. When 0 < e2/e1 < I, the shareholding operation is superior in environmental impact(ES < EN ). When I < e2/e1 < 1, the environmental impact in Model S is greater than in Model N : (ES > EN )(Proof see Appendix A.8).
Based on Proposition 5.6, when the environmental pollution associated with a remanufactured product isrelatively small (0 < e2/e1 < I) the shareholding operation provides a greener solution compared with ModelN . Although compared to Model N the OEM (TPR) provides fewer (more) new (remanufactured) productsthan in Model S, based on Proposition 5.2 (with essentially qS∗n < qN∗n and qS∗r > qN∗r ), the factor influencingthe environment is the per-unit environmental pollution associated with the remanufactured product. In otherwords, it is essential to control the environmental damage associated with remanufactured products relative tonew products.
Corollary 5.7. Compared with Model N , the consumer surplus in Model S is always greater (i.e., CSS > CSN ).If 0 < e2/e1 < I, cr > cr2 and r < r1, then the shareholding operation is capable of creating an overall outcomethat benefits the economy and the environment (Proof see Appendix A.9).
Consumer surplus consists of two components in our paper: consumers’ willingness to pay for the OEM’s newproducts and for the TPR’s remanufactured products [2, 42,57,62]. It is calculated as follows:
CS =∫ 1−qn
1−qn−qr(θu− pr) du+
∫ 1
1−qn(u− pn) du. (5.1)
Comparing the consumer surplus of the two models, Corollary 5.7 shows that, when the OEM becomesa shareholder in the remanufacturing business of the TPR, it is an environmentally-friendly situation for con-sumers. It is important to note that the OEM cares greatly about the TPR’s revenue in the shareholdingoperation, because it can drive larger volumes of market capacity in Model S than it can in Model N (seeProp. 5.2). In particular, the OEM would allow the TPR to remanufacture products with the aim of earningmore profits from those remanufactured products. In other words, the competition between new and remanufac-tured products in Model S gains more momentum compared with that in Model N , which ultimately benefitsconsumers (CSS∗ > CSL∗).
Corollary 5.7 further reveals that, under certain conditions (i.e., 0 < e2/e1 < I, cr > cr2 and r < r2), theOEM undertaking ownership operations with the TPR can lead to a win–win situation in terms of both economicand environmental benefits within a certain range. More specifically, when remanufacturing is undertaken bya TPR, the OEM as a shareholder does not necessarily harm the third party.
Corollary 5.8. I is influenced by various parameters – specifically, cn, λ and θ have a positive effect on I,while cr has a negative effect on I (Proof see Appendix A.10)
Again, Proposition 5.6 indicates that, when the pollution ratio on the environment from remanufacturing issmaller (0 < e2/e1 < I), Model S creates less impact on the environment compared with Model N . Accordingto the calculation method of environmental pollution based on LCA, the number of new and remanufacturedproducts will determine the pollution level of each model. In our hypothesis, the production of new and remanu-factured products is controlled by these parameters (i.e., The marginal cost to produce the new/remanufacturedproduct cn and cr, consumer preferences for remanufactured goods θ, and the holding proportion of OEM inequity λ). Therefore, these parameters will further affect the pollution coefficient of the total environmentE = e1qn + e2qr. Although we have indicated which model is optimal for the range of different pollution ratioI ∈ (0, 1), we also want to explore how the range fluctuations are affected by other parameters.
The outcome of this derivative indicates that pollution ratio I is positively affected by cn, λ and θ, butnegatively affected by cr. That is to say, reducing the cost of remanufacturing, increasing consumer preferencesfor remanufactured goods or increasing the proportion of the OEM’s share in the TPR’s equity can increaseequilibria pollution ratio I, and further cause the applicability of Model S is wide (see Tab. 5). Conversely, thereverse change of these parameters is beneficial to Model N . From a practical perspective, if the shareholding
SHAREHOLDING OPERATION OF PRODUCT REMANUFACTURING S1541
Table 5. Influence of parameters on the pollution rate.
ParameterPollution ratio λ↗ θ ↗ cn ↗ cr ↗
I ↗ ↗ ↗ ↘
Notes. The signs ↗, ↘ and× represent the relationships as monotonically increasing, monotonically decreasing andunrelated with respect to the parameter, respectively.
operation is executed, managers in the supply chain should pay attention to reducing the remanufacturingcost and increasing the share proportion of the TPR, which is a necessary approach to take to protect theenvironment.
6. Numerical example and managerial relevance
This section analyzes the environmental impacts of product remanufacturing under the two different modelsby using numerical examples. The analysis not only corroborates the propositions and conclusions presentedabove, but also offers management insights.
6.1. Numerical example on equilibrium solutions
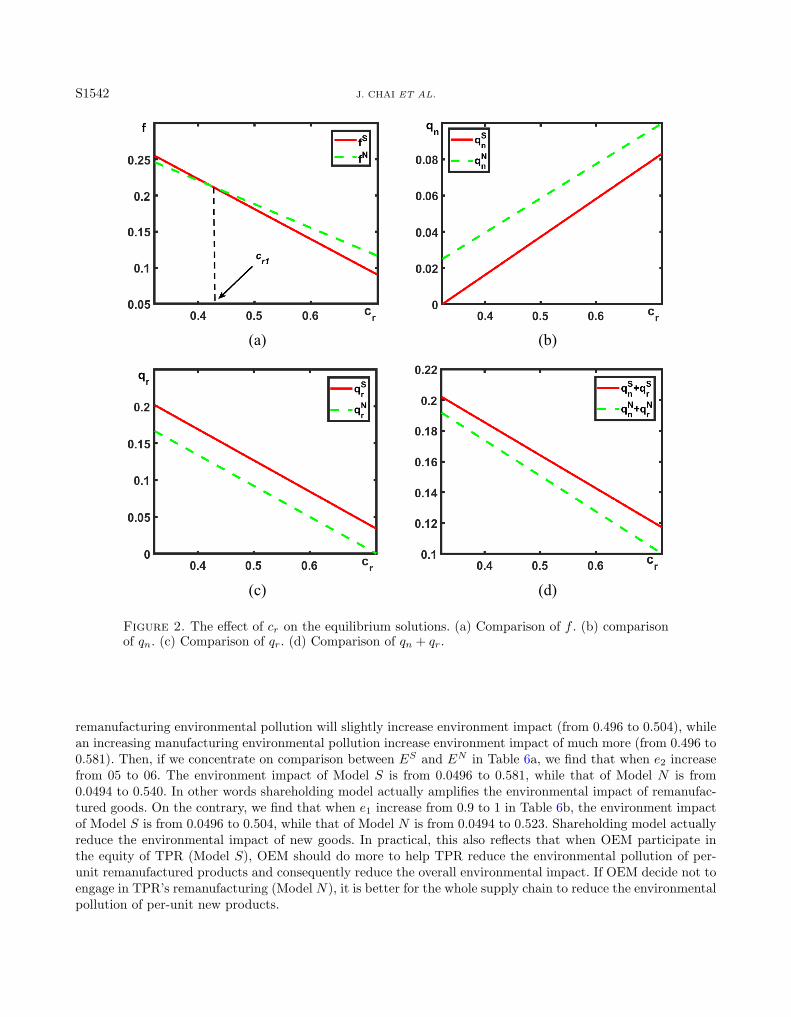
he parameter values are λ = 0.1, θ = 0.9 and cn = 0.8. To make it economically feasible, 0.3223 < cr < 0.7200.Here, we simulate the conclusions of item 5.1 in Figure 2. As Figure 2a illustrates, it is proved that the license feeof OEM between Model S and Model N are different. Figures 2b–2d shows that sales volume of new products ofModel S is lower than that of Model N , while the remanufactured products sales is higher than Model N . Mean-while, the overall sales are also higher than that of no-shareholding operation. As shown in Lemmas 4.1 and 4.2,these figures also show that the sales quantity of new/remanufactured products decrease/increase with increasein the cost of remanufacturing increases.
6.2. Numerical example on economic benefits
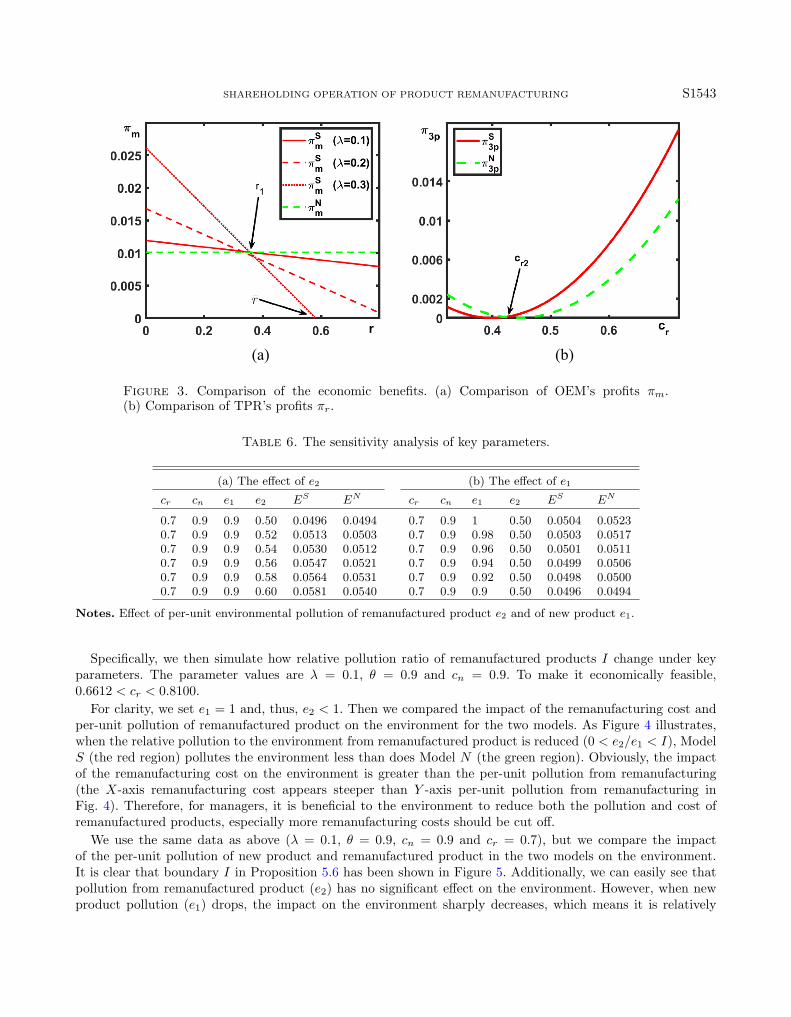
The parameter values are λ = 0.1, θ = 0.9 and cn = 0.8. To make it economically feasible, 0.3223 < cr <0.7200. Figure 3a illustrate the OEM’s profits comparison between Model S and Model N . We find that thereexists a threshold r1 = 0.3606; as shown in Proposition 5.3, when r < r1 = 0.3606, the OEM’s profits in ModelS is higher than that in Model N . Particularly, we revalue λ = 0.2 and λ = 0.3 to the holding proportion ofOEM in equity. Then, we further find that an increase in holding proportion can improve OEM’s profitability(the slope of the red line gets steeper) but reduce the upper limit of the equity holding cost that OEM cantolerate (the point where red line intersects the X-axis moves to the left). In other words, the more shares OEMhold, the more production responsibilities and risks OEM have to bear. Therefore, as shown in Figure 3a theupper limit of the equity holding cost r decrease. Figure 3b illustrate the TPR’s profits comparison betweenModel S and Model N . Obviously, when 0.3223 < cr < cr2 = 0.4213, the TPR’s profits in Model N is higherthan that in Model S, otherwise, when 0.4213 = cr2 < cr < 0.7200, the TPR’s profits in Model S is higher thanthat in Model N . In sum, based on Figure 3, we can conclude our results in Propositions 5.3 and 5.4.
6.3. Numerical example on environmental benefits
We presented the sensitivity analysis with respect to key parameters cr, e1 and e2. The parameter values areλ = 0.1 and θ = 0.9. We varied one parameter at a time while keeping the others fixed. All results obtained bycalculation are presented in Table 6.
Table 6 shows that how environment impact changes with per-unit environmental pollution of remanufac-tured and new product. First, let’s focus on Model S between Table 6a and b, it reflects that an increasing
S1542 J. CHAI ET AL.
(a) (b)
(c) (d)
Figure 2. The effect of cr on the equilibrium solutions. (a) Comparison of f . (b) comparisonof qn. (c) Comparison of qr. (d) Comparison of qn + qr.
remanufacturing environmental pollution will slightly increase environment impact (from 0.496 to 0.504), whilean increasing manufacturing environmental pollution increase environment impact of much more (from 0.496 to0.581). Then, if we concentrate on comparison between ES and EN in Table 6a, we find that when e2 increasefrom 05 to 06. The environment impact of Model S is from 0.0496 to 0.581, while that of Model N is from0.0494 to 0.540. In other words shareholding model actually amplifies the environmental impact of remanufac-tured goods. On the contrary, we find that when e1 increase from 0.9 to 1 in Table 6b, the environment impactof Model S is from 0.0496 to 0.504, while that of Model N is from 0.0494 to 0.523. Shareholding model actuallyreduce the environmental impact of new goods. In practical, this also reflects that when OEM participate inthe equity of TPR (Model S), OEM should do more to help TPR reduce the environmental pollution of per-unit remanufactured products and consequently reduce the overall environmental impact. If OEM decide not toengage in TPR’s remanufacturing (Model N), it is better for the whole supply chain to reduce the environmentalpollution of per-unit new products.
SHAREHOLDING OPERATION OF PRODUCT REMANUFACTURING S1543
(a) (b)
Figure 3. Comparison of the economic benefits. (a) Comparison of OEM’s profits πm.(b) Comparison of TPR’s profits πr.
Table 6. The sensitivity analysis of key parameters.
(a) The effect of e2 (b) The effect of e1
cr cn e1 e2 ES EN cr cn e1 e2 ES EN
0.7 0.9 0.9 0.50 0.0496 0.0494 0.7 0.9 1 0.50 0.0504 0.05230.7 0.9 0.9 0.52 0.0513 0.0503 0.7 0.9 0.98 0.50 0.0503 0.05170.7 0.9 0.9 0.54 0.0530 0.0512 0.7 0.9 0.96 0.50 0.0501 0.05110.7 0.9 0.9 0.56 0.0547 0.0521 0.7 0.9 0.94 0.50 0.0499 0.05060.7 0.9 0.9 0.58 0.0564 0.0531 0.7 0.9 0.92 0.50 0.0498 0.05000.7 0.9 0.9 0.60 0.0581 0.0540 0.7 0.9 0.9 0.50 0.0496 0.0494
Notes. Effect of per-unit environmental pollution of remanufactured product e2 and of new product e1.
Specifically, we then simulate how relative pollution ratio of remanufactured products I change under keyparameters. The parameter values are λ = 0.1, θ = 0.9 and cn = 0.9. To make it economically feasible,0.6612 < cr < 0.8100.
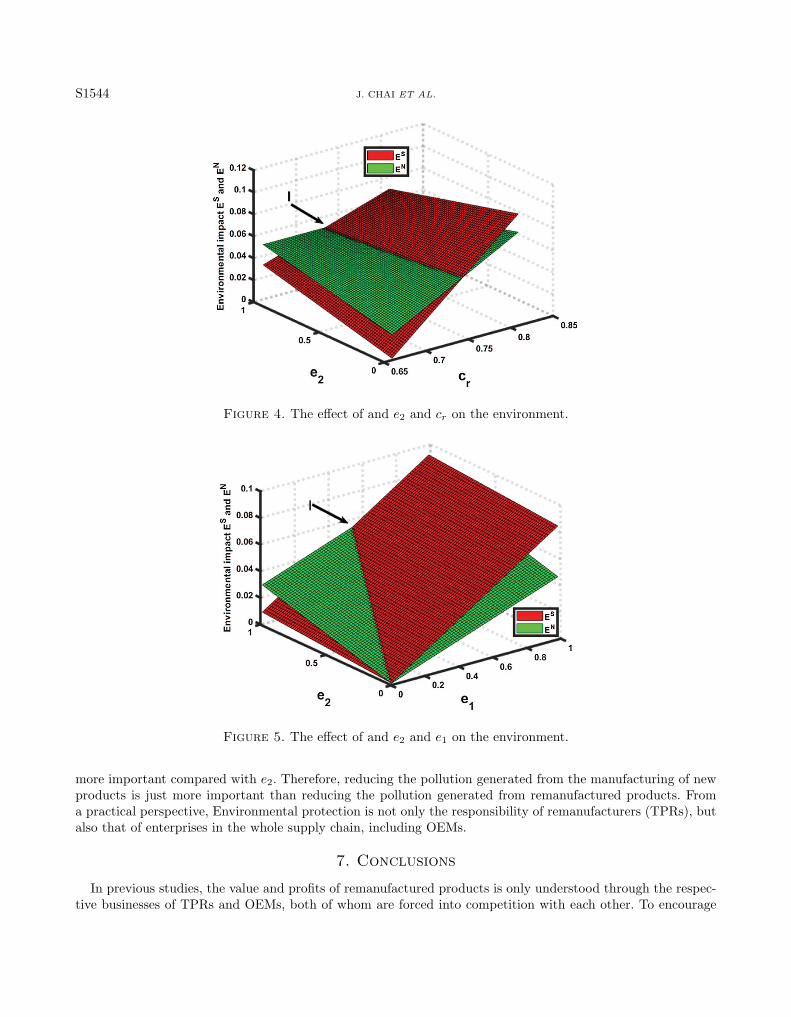
For clarity, we set e1 = 1 and, thus, e2 < 1. Then we compared the impact of the remanufacturing cost andper-unit pollution of remanufactured product on the environment for the two models. As Figure 4 illustrates,when the relative pollution to the environment from remanufactured product is reduced (0 < e2/e1 < I), ModelS (the red region) pollutes the environment less than does Model N (the green region). Obviously, the impactof the remanufacturing cost on the environment is greater than the per-unit pollution from remanufacturing(the X-axis remanufacturing cost appears steeper than Y -axis per-unit pollution from remanufacturing inFig. 4). Therefore, for managers, it is beneficial to the environment to reduce both the pollution and cost ofremanufactured products, especially more remanufacturing costs should be cut off.
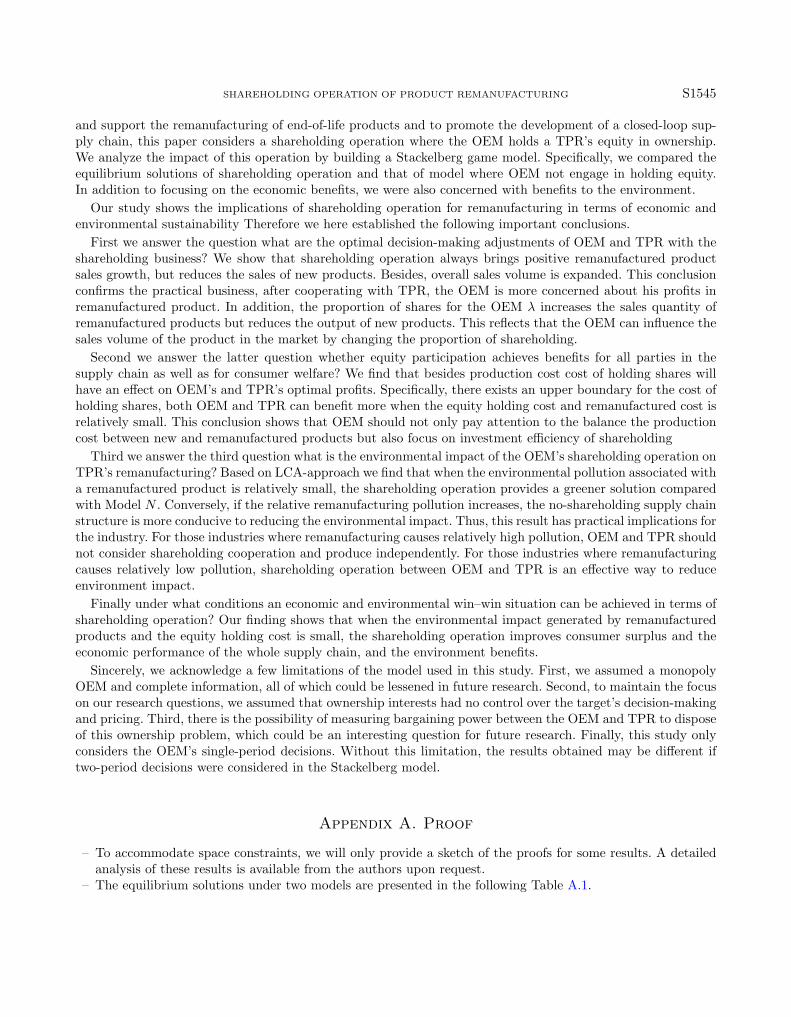
We use the same data as above (λ = 0.1, θ = 0.9, cn = 0.9 and cr = 0.7), but we compare the impactof the per-unit pollution of new product and remanufactured product in the two models on the environment.It is clear that boundary I in Proposition 5.6 has been shown in Figure 5. Additionally, we can easily see thatpollution from remanufactured product (e2) has no significant effect on the environment. However, when newproduct pollution (e1) drops, the impact on the environment sharply decreases, which means it is relatively
S1544 J. CHAI ET AL.
Figure 4. The effect of and e2 and cr on the environment.
Figure 5. The effect of and e2 and e1 on the environment.
more important compared with e2. Therefore, reducing the pollution generated from the manufacturing of newproducts is just more important than reducing the pollution generated from remanufactured products. Froma practical perspective, Environmental protection is not only the responsibility of remanufacturers (TPRs), butalso that of enterprises in the whole supply chain, including OEMs.
7. Conclusions
In previous studies, the value and profits of remanufactured products is only understood through the respec-tive businesses of TPRs and OEMs, both of whom are forced into competition with each other. To encourage
SHAREHOLDING OPERATION OF PRODUCT REMANUFACTURING S1545
and support the remanufacturing of end-of-life products and to promote the development of a closed-loop sup-ply chain, this paper considers a shareholding operation where the OEM holds a TPR’s equity in ownership.We analyze the impact of this operation by building a Stackelberg game model. Specifically, we compared theequilibrium solutions of shareholding operation and that of model where OEM not engage in holding equity.In addition to focusing on the economic benefits, we were also concerned with benefits to the environment.
Our study shows the implications of shareholding operation for remanufacturing in terms of economic andenvironmental sustainability Therefore we here established the following important conclusions.
First we answer the question what are the optimal decision-making adjustments of OEM and TPR with theshareholding business? We show that shareholding operation always brings positive remanufactured productsales growth, but reduces the sales of new products. Besides, overall sales volume is expanded. This conclusionconfirms the practical business, after cooperating with TPR, the OEM is more concerned about his profits inremanufactured product. In addition, the proportion of shares for the OEM λ increases the sales quantity ofremanufactured products but reduces the output of new products. This reflects that the OEM can influence thesales volume of the product in the market by changing the proportion of shareholding.
Second we answer the latter question whether equity participation achieves benefits for all parties in thesupply chain as well as for consumer welfare? We find that besides production cost cost of holding shares willhave an effect on OEM’s and TPR’s optimal profits. Specifically, there exists an upper boundary for the cost ofholding shares, both OEM and TPR can benefit more when the equity holding cost and remanufactured cost isrelatively small. This conclusion shows that OEM should not only pay attention to the balance the productioncost between new and remanufactured products but also focus on investment efficiency of shareholding
Third we answer the third question what is the environmental impact of the OEM’s shareholding operation onTPR’s remanufacturing? Based on LCA-approach we find that when the environmental pollution associated witha remanufactured product is relatively small, the shareholding operation provides a greener solution comparedwith Model N . Conversely, if the relative remanufacturing pollution increases, the no-shareholding supply chainstructure is more conducive to reducing the environmental impact. Thus, this result has practical implications forthe industry. For those industries where remanufacturing causes relatively high pollution, OEM and TPR shouldnot consider shareholding cooperation and produce independently. For those industries where remanufacturingcauses relatively low pollution, shareholding operation between OEM and TPR is an effective way to reduceenvironment impact.
Finally under what conditions an economic and environmental win–win situation can be achieved in terms ofshareholding operation? Our finding shows that when the environmental impact generated by remanufacturedproducts and the equity holding cost is small, the shareholding operation improves consumer surplus and theeconomic performance of the whole supply chain, and the environment benefits.
Sincerely, we acknowledge a few limitations of the model used in this study. First, we assumed a monopolyOEM and complete information, all of which could be lessened in future research. Second, to maintain the focuson our research questions, we assumed that ownership interests had no control over the target’s decision-makingand pricing. Third, there is the possibility of measuring bargaining power between the OEM and TPR to disposeof this ownership problem, which could be an interesting question for future research. Finally, this study onlyconsiders the OEM’s single-period decisions. Without this limitation, the results obtained may be different iftwo-period decisions were considered in the Stackelberg model.
Appendix A. Proof
– To accommodate space constraints, we will only provide a sketch of the proofs for some results. A detailedanalysis of these results is available from the authors upon request.
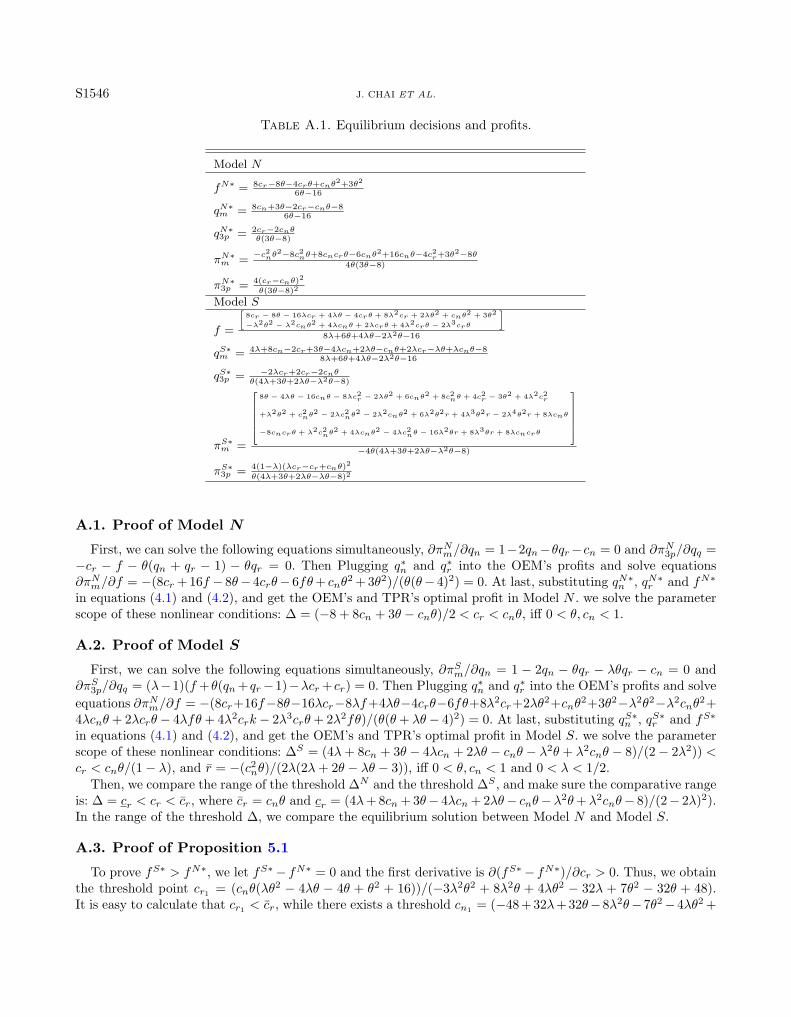
– The equilibrium solutions under two models are presented in the following Table A.1.
S1546 J. CHAI ET AL.
Table A.1. Equilibrium decisions and profits.
Model N
fN∗ = 8cr−8θ−4crθ+cnθ2+3θ2
6θ−16
qN∗m = 8cn+3θ−2cr−cnθ−86θ−16
qN∗3p = 2cr−2cnθθ(3θ−8)
πN∗m =−c2nθ
2−8c2nθ+8cncrθ−6cnθ2+16cnθ−4c2r+3θ2−8θ
4θ(3θ−8)
πN∗3p = 4(cr−cnθ)2θ(3θ−8)2
Model S
f =
[8cr − 8θ − 16λcr + 4λθ − 4crθ + 8λ2cr + 2λθ2 + cnθ
2 + 3θ2
−λ2θ2 − λ2cnθ2 + 4λcnθ + 2λcrθ + 4λ2crθ − 2λ3crθ
]
8λ+6θ+4λθ−2λ2θ−16
qS∗m = 4λ+8cn−2cr+3θ−4λcn+2λθ−cnθ+2λcr−λθ+λcnθ−88λ+6θ+4λθ−2λ2θ−16
qS∗3p = −2λcr+2cr−2cnθθ(4λ+3θ+2λθ−λ2θ−8)
πS∗m =
8θ − 4λθ − 16cnθ − 8λc2r − 2λθ2 + 6cnθ2 + 8c2nθ + 4c2r − 3θ2 + 4λ2c2r
+λ2θ2 + c2nθ2 − 2λc2nθ
2 − 2λ2cnθ2 + 6λ2θ2r + 4λ3θ2r − 2λ4θ2r + 8λcnθ
−8cncrθ + λ2c2nθ2 + 4λcnθ2 − 4λc2nθ − 16λ2θr + 8λ3θr + 8λcncrθ
−4θ(4λ+3θ+2λθ−λ2θ−8)
πS∗3p = 4(1−λ)(λcr−cr+cnθ)2θ(4λ+3θ+2λθ−λθ−8)2
A.1. Proof of Model N
First, we can solve the following equations simultaneously, ∂πNm/∂qn = 1−2qn−θqr−cn = 0 and ∂πN3p/∂qq =−cr − f − θ(qn + qr − 1) − θqr = 0. Then Plugging q∗n and q∗r into the OEM’s profits and solve equations∂πNm/∂f = −(8cr + 16f − 8θ− 4crθ− 6fθ+ cnθ
2 + 3θ2)/(θ(θ− 4)2) = 0. At last, substituting qN∗n , qN∗r and fN∗
in equations (4.1) and (4.2), and get the OEM’s and TPR’s optimal profit in Model N . we solve the parameterscope of these nonlinear conditions: ∆ = (−8 + 8cn + 3θ − cnθ)/2 < cr < cnθ, iff 0 < θ, cn < 1.
A.2. Proof of Model S
First, we can solve the following equations simultaneously, ∂πSm/∂qn = 1 − 2qn − θqr − λθqr − cn = 0 and∂πS3p/∂qq = (λ−1)(f +θ(qn+qr−1)−λcr + cr) = 0. Then Plugging q∗n and q∗r into the OEM’s profits and solveequations ∂πNm/∂f = −(8cr+16f−8θ−16λcr−8λf+4λθ−4crθ−6fθ+8λ2cr+2λθ2+cnθ2+3θ2−λ2θ2−λ2cnθ
2+4λcnθ+ 2λcrθ− 4λfθ+ 4λ2crk− 2λ3crθ+ 2λ2fθ)/(θ(θ+ λθ− 4)2) = 0. At last, substituting qS∗n , qS∗r and fS∗
in equations (4.1) and (4.2), and get the OEM’s and TPR’s optimal profit in Model S. we solve the parameterscope of these nonlinear conditions: ∆S = (4λ+ 8cn + 3θ − 4λcn + 2λθ − cnθ − λ2θ + λ2cnθ − 8)/(2− 2λ2)) <cr < cnθ/(1− λ), and r = −(c2nθ)/(2λ(2λ+ 2θ − λθ − 3)), iff 0 < θ, cn < 1 and 0 < λ < 1/2.
Then, we compare the range of the threshold ∆N and the threshold ∆S , and make sure the comparative rangeis: ∆ = cr < cr < cr, where cr = cnθ and cr = (4λ+ 8cn + 3θ− 4λcn + 2λθ− cnθ−λ2θ+λ2cnθ− 8)/(2− 2λ)2).In the range of the threshold ∆, we compare the equilibrium solution between Model N and Model S.
A.3. Proof of Proposition 5.1
To prove fS∗ > fN∗, we let fS∗− fN∗ = 0 and the first derivative is ∂(fS∗− fN∗)/∂cr > 0. Thus, we obtainthe threshold point cr1 = (cnθ(λθ2 − 4λθ − 4θ + θ2 + 16))/(−3λ2θ2 + 8λ2θ + 4λθ2 − 32λ + 7θ2 − 32θ + 48).It is easy to calculate that cr1 < cr, while there exists a threshold cn1 = (−48 + 32λ+ 32θ−8λ2θ−7θ2−4λθ2 +
SHAREHOLDING OPERATION OF PRODUCT REMANUFACTURING S1547
3λ2θ2)/(−48 + 32λ+ 24θ − 8λθ − 8λ2θ − 3θ2 + 3λ2θ2), iff cn < cn1 , cr < cr1 < cr. Iff cn > cn1 , cr1 < cr. Thatis to say, when cn < cn1 and cr < cr1 , fS∗ < fN∗. When cn < cn1 and cr > cr1 or cn > cn1 , fS∗ > fN∗ alwayshold.
A.4. Proof of Proposition 5.2
To prove qS∗r > qN∗r , we let qS∗r − qN∗r = 0 and the first derivative is ∂(qS∗r − qN∗r )/∂cr > 0. Thus, we obtainthe threshold point cra = cnθ(12− θ − λθ)/(2θ − 8λ+ 2λθ + 4), It is easy to obtain cra > cr, thus qS∗r > qN∗r .Applying a computational process similar to the previous one, we obtain qS∗n < qN∗n and qS∗n + qS∗r > qN∗n + qN∗r .
A.5. Proof of Proposition 5.3
To prove πS∗m > πN∗m , we let πS∗m − πN∗m = 0 and we obtain the threshold point r1 = (16λc2r + 16c2rθ − 24c2r +8cn2θ2 + 4c2nθ
3 − 2λc2nθ3 + 16cncrθ − 8λc2rθ − 20cncrθ2 + 4λcncrθ2)/(λθ(3θ − 8)(4λ + 3θ + 2λθ − λ2θ − 8)).
It is easy to obtain r1 < r. We let r1 = 0, and thus we obtain two intersection point crb > cr and crc < cr.We calculate the second derivative ∂2r1/∂
2cr < 0, thus when cr < cr < cr, r1 > 0 always hold. We calculatethe first derivative ∂(πS∗m − πN∗m )/∂r < 0. Thus when r < r1, πS∗m > πN∗m , when r1 < r < r, πS∗m < πN∗m .
A.6. Proof of Proposition 5.4
To prove πS∗3p > πN∗3p , we let πS∗3p − πN∗3p = 0 and we obtain two intersection point crd > cr and cr < cr2 =−(cnθ(48λ− 80λθ− (32λ+ 48θ− 64− 9θ2− 6λθ2− 8λ2θ+ 3λ2θ2 + 4λθ)
√1− λ+ 104θ+ 11λθ2 + 8λ2θ− 30θ2 +
4λ2θ2−λ3θ2−64))/(λ3θ2 +5a2θ2−56λ2θ+64λ2−29λθ2 +176λθ−176λ+39θ2−152θ+128) < cr. We calculatethe second derivative ∂(πS∗3p − πN∗3p )/∂cr > 0, thus when cr < cr2 , πS∗3p < πN∗3p always hold. When cr > cr2 ,πS∗3p > πN∗3p .
A.7. Proof of Proposition 5.5
To prove ΠS∗ > ΠN∗, we let ΠS∗−ΠN∗ = 0 and we obtain the threshold point r2, applying a computationalprocess similar to the proof of Proposition 5.3, it is easy to obtain 0 < r2 < r1 < r always hold. We calculatethe first derivative ∂(ΠS∗ −ΠN∗)/∂r < 0. Thus, when r2 < r < r1, ΠS∗ < ΠN∗, when 0 < r < r2, ΠS∗ > ΠN∗.
A.8. Proof of Proposition 5.6
To compare the total environment impacts between Model S and Model N , we let ES − EN = (λ(8cre2 +8cne2θ+ 4cre1θ−10cre2θ−12cne1θ2 + cne1θ
3 + 4cne2θ2 + 2cre1θ2 +λcne1θ3−2λcne2θ2 + 2λcre1θ2−8λcre1θ+
2λcre2θ))/(θ(3θ − 8)(4λ+ 3θ + 2λθ − λ2θ − 8)) = 0 and we obtain the threshold point e2 = −θe1(4cr − 8λcr −12cnθ + 2crθ + cnθ
2 + 2λcrθ + λcnθ2)/2(4cr + 4cnθ − 5crθ + 2cnθ2 + λcrθ − λcnθ2), we let I = e2/e1 and it is
easy to obtain 0 < I < 1. We calculate the first derivative ∂(ES − EN )/∂e2 > 0, thus, when 0 < e2/e1 < I,ES < EN , when I < e2/e1 < 1, ES > EN .
A.9. Proof of Corollary 5.7
To prove CSS > CSN , we let CSS − CSN = 0 and we obtain two intersection point cre > cr and crf < cr.We calculate the second derivative ∂2r1/∂
2cr < 0, thus when cr < cr < cr, CSS > CSN always hold.
A.10. Proof of Corollary 5.8
We calculate the first-order condition of the pollution ratio I under this condition with respect to cr. Thatis ∂I/∂cr = cnθ
2(8 − 3θ)(4λ + 3θ + 2λθ − λ2θ − 8)/(2(4cr + 4cnθ − 5crθ + 2cnθ2 + λcrθ − λcnθ2)2). It is easyto obtain the denominator is always greater than 0, and the molecule is always less than 0. That is to say,∂I/∂cr < 0 always hold. Applying a computational process similar to the previous one, we get ∂I/∂cn > 0,∂I/∂λ > 0 and ∂I/∂θ > 0.
S1548 J. CHAI ET AL.
Acknowledgements. The authors thank the National Natural Science Foundation of China under Grant (71872028) andGrant (71472026), Research Fund for the Circular Economy (XHJJ-1801 and XHJJ-1805) for supporting this research.The authors have declared that no competing interests exist.
Data availability statement. All Data is in this paper.
References
[1] V. Agrawal, A. Atasu, K. Van Ittersum, Remanufacturing, third-party competition, and consumers’ perceived value of newproducts. Manage. Sci. 61 (2015) 60–72.
[2] A. Atasu and G.C. Souza, How does product recovery affect quality choice? Prod. Oper. Manage. 22 (2013) 991–1010.
[3] A. Atasu, L.N. Van Wassenhove and M. Sarvary, Efficient take-back legislation. Prod. Oper. Manage. 18 (2019) 243–258.
[4] D. Basak, Cournot vs. Bertrand under centralised bargaining. Econ. Lett. 154 (2017) 124–127.
[5] M. Becker-Peth and U.W. Thonemann, Reference points in revenue sharing contracts – How to design optimal supply chaincontracts. Eur. J. Oper. Res. 249 (2016) 1033–1049.
[6] V. Blass, Closed-loop supply chains: new developments to improve the sustainability of business practices, edited by Mark E.Ferguson and Gilvan C. Souza. J. Ind. Ecol. 16 (2012) 285–285.
[7] D. Brito, L. Cabral and H. Vasconcelos, Divesting ownership in a rival. Int. J. Ind. Organ. 34 (2014) 9–24.
[8] G.P. Cachon and M.A. Lariviere, Supply chain coordination with revenue-sharing contracts: strengths and limitations. Manage.Sci. 51 (2005) 30–44.
[9] J. Cao, X. Chen, X. Zhang, Y. Gao, X. Zhang and S. Kumar, Overview of remanufacturing industry in China: governmentpolicies, enterprise, and public awareness. J. Clean. Prod. 242 (2020) 118450.
[10] S.S. Chauhan and J.M. Proth, Analysis of a supply chain partnership with revenue sharing. Int. J. Prod. Econ. 97 (2005)44–51.
[11] J. Chen, Q. Hu and J.S. Song, Effect of partial cross ownership on supply chain performance. Eur. J. Oper. Res. 258 (2017)525–536.
[12] S. Dasgupta and Z. Tao, Bargaining, bonding, and partial ownership. Int. Econ. Rev. 41 (2000) 609–635.
[13] G. Esenduran, E. Kemahlıoglu-Ziya, J.M. Swaminathan, Take-back legislation: consequences for remanufacturing and environ-ment. Decision. Sci. 47 (2016) 219–256.
[14] G. Esenduran, E. Kemahlıoglu-Ziya and J.M. Swaminathan, Impact of take-back regulation on the remanufacturing industry.Prod. Oper. Manage. 26 (2017) 924–944.
[15] C. Fang, Z. You, Y. Yang, D. Chen and S. Mukhopadhyay, Is third-party remanufacturing necessarily harmful to the originalequipment manufacturer? Ann. Oper. Res. (2019) 1–22.
[16] M.E. Ferguson and L.B. Toktay, The effect of competition on recovery strategies. Prod. Oper. Manage. 15 (2006) 351–368.
[17] H. Fu and Y. Ma, Optimization and coordination of decentralized supply chains with vertical cross-shareholding. Comput. Ind.Eng. 132 (2019) 23–35.
[18] X. Gao and H. Zheng, Environmental concerns, environmental policy and green investment. Int. J. Env. Res. Pub. He. 14(2017) 1570.
[19] R. Geyer, L.N. Van Wassenhove and A. Atasu, The economics of remanufacturing under limited component durability andfinite product life cycles. Manage. Sci. 53 (2007) 88–100.
[20] A. Ghosh and H. Morita, Knowledge transfer and partial equity ownership. Rand. J. Econ. 48 (2017) 1044–1067.
[21] B. Gomes, Do alliances promote knowledge flows? J. Financ. Econ. 80 (2006) 5–33.
[22] K. Govindan, L.P. Feng and C.F. Li, Strategic planning: design and coordination for dual-recycling channel reverse supplychain considering consumer behavior. Eur. J. Oper. Res. 260 (2017) 601–612.
[23] P. Greenlee and A. Raskovich, Partial vertical ownership. Eur. Econ. Rev. 50 (2006) 1017–1041.
[24] W. Gu, D. Chhajed, N.C. Petruzzi and B. Yalabik, Quality design and environmental implications of green consumerism inremanufacturing. Int. J. Prod. Econ. 162 (2015) 55–69.
[25] T.G. Gutowski, S. Sahni, A. Boustani and S.C. Graves, Remanufacturing and energy savings. Environ. Sci. Technol. 45 (2011)4540–4547.
[26] Q.D. He, N.M. Wang, Z. Yang, Z.W. He and B. Jiang, Competitive collection under channel inconvenience in closed-loopsupply chain. Eur. J. Oper. Res. 275 (2019) 155–166.
[27] F. Hoffler and S. Kranz, Legal unbundling can be a golden mean between vertical integration and ownership separation. Int.J. Ind. Organ. 29 (2011) 576–588.
[28] F.U. Hong, M.A. Yongkai and C.A.I. Xiaoqiang, Downstream firm’s investment with equity holding in decentralized assemblysystems. Omega-Int. J. Manage. S. 75 (2018) 27–56.
[29] B. Hu, D. Xu and C. Meng, Inconsistency of a retailer’s optimal policies and channel performance under revenue sharingcontracts. Int. J. Prod. Econ. 183 (2017) 53–65.
[30] M. Hunold and K. Stahl, Passive vertical integration and strategic delegation. Rand. J. Econ. 47 (2016) 891–913.
[31] M. Jin, J. Nie, F. Yang and Y. Zhou, The impact of third-party remanufacturing on the forward supply chain: a blessing or acurse? Int. J. Prod. Res. 55 (2017) 6871–6882.
SHAREHOLDING OPERATION OF PRODUCT REMANUFACTURING S1549
[32] I. Karakayali, H. Emir-Farinas and E. Akcali, An analysis of decentralized collection and processing of end-of-life products.J. Oper. Manage. 25 (2007) 1161–1183.
[33] A. Kumar, R.B. Chinnam and A. Murat, Hazard rate models for core return modeling in auto parts remanufacturing.Int. J. Prod. Econ. 183 (2017) 354–361.
[34] Y.C. Lee, Y.C. Hsiao, C.F. Peng, S.B. Tsai, C.H. Wu and Q. Chen, Using mahalanobis-taguchi system, logistic regression andneural network method to evaluate purchasing audit quality. Proc. Inst. Mech. Eng. Part B: J. Eng. Manuf. 229 (2014) 3–12.
[35] T. Levitt, Exploit the product life cycle. Harvard Bus. Rev. 43 (1965) 81–94.
[36] N. Levy, Y. Spiegel and D. Gilo, Partial vertical integration, ownership structure, and foreclosure. Am. Econ. J. Microecon.10 (2018) 132–180.
[37] G.D. Li, M. Reimann and W.H. Zhang, When remanufacturing meets product quality improvement: the impact of productioncost. Eur. J. Oper. Res. 271 (2018) 913–925.
[38] W. Liu, H.B. Shi, Z. Zhang, S.B. Tsai, Y. Zhai, Q. Chen and J. Wang, The development evaluation of economic zones inChina. Int. J. Environ. Res. Publ. Health 15 (2018) 56.
[39] Z. Liu, K.W. Li, B.Y. Li, J. Huang and J. Tang, Impact of product-design strategies on the operations of a closed-loop supplychain. Transp. Res. E-log. 124 (2019) 75–91.
[40] Z.J. Ma, Z. Qin, D. Ying and J.B. Sheu, Optimal pricing decisions under the coexistence of “trade old for new” and “tradeold for remanufactured” programs. Transp. Res. E-log. 106 (2017) 337–352.
[41] H.T. Normann, W. Guth and N. Nikiforakis, Vertical cross-shareholding: theory and experimental evidence. Int. J. Ind. Organ.25 (2007) 69–89.
[42] A. Orsdemir, E. Kemahlıoglu-Ziya and A.K. Parlakturk, Competitive quality choice and remanufacturing. Prod. Oper. Manage.23 (2014) 48–64.
[43] A. Ovchinnikov, V. Blass and G. Raz, Economic and environmental assessment of remanufacturing strategies for product+service firms. Prod. Oper. Manage. 23 (2014) 744–761.
[44] Z. Qian, J. Chai, H. Li, W. Yan and H. Chen, Implications of product upgrading confronting supplier remanufacturing. Int.J. Prod. Res. (2019) 1–23.
[45] J. Quariguasi-Frota-Neto and J. Bloemhof, An analysis of the Eco-Efficiency of remanufactured personal computers and mobilephones. Prod. Oper. Manage. 21 (2012) 101–114.
[46] D. Reitman, Partial ownership arrangements and the potential for collusion. J. Ind. Econ. 42 (1994) 313–322.
[47] D.R. Rink and J.E. Swan, Product life cycle research: a literature review. J. Bus. Res. 7 (1979) 219–242.
[48] S. Shelegia and Y. Spiegel, Bertrand competition when firms hold passive ownership stakes in one another. Econ. Lett. 114(2012) 136–138.
[49] J.J. Spengler, Vertical integration and antitrust policy. Eur. J. Polit. Econ. 58 (1950) 347–352.
[50] Z. Tao, S.X. Zhou and C.S. Tang, Managing a remanufacturing system with random yield: properties, observations, andheuristics. Prod. Oper. Manage. 21 (2012) 797–813.
[51] S.-B. Tsai, Y.-C. Lee, C.-H. Wu, J.-J. Guo, Examining how manufacturing corporations win orders. S. Afr. J. Ind. Eng. 24(2013) 112–124.
[52] S.B. Tsai, J. Yu, L. Ma, F. Luo, J. Zhou, Q. Chen and L. Xu, A study on solving the production process problems of thephotovoltaic cell industry. Renew. Sustainable Energy Rev. 82 (2018) 3546–3553.
[53] L. Wang and M. Chen, Policies and perspective on end-of-life vehicles in China. J. Clean. Prod. 44 (2013) 168–176.
[54] X. Wu and Z. Yu, Does the entry of third-party remanufacturers always hurt original equipment manufacturers? Decision.Sci. 47 (2016) 762–780.
[55] X. Wu and Y. Zhou, The optimal reverse channel choice under supply chain competition. Eur. J. Oper. Res. 259 2017 63–66.
[56] W. Yan, Y. Xiong, Z. Xiong and N. Guo, Bricks vs. clicks: Which is better for marketing remanufactured products? Eur. J.Oper. Res. 242 (2015) 434–444.
[57] W. Yan, H. Li, J. Chai, Z. Qian and H. Chen, Owning or outsourcing? Strategic choice on take-back operations for third-partyremanufacturing. Sustainability 10 (2018) 151.
[58] A. Yenipazarli, Managing new and remanufactured products to mitigate environmental damage under emissions regulation.Eur. J. Oper. Res. 249 (2016) 117–130.
[59] M.-C. Yu, Q. Mai, S.B. Tsai, Y. Dai, An empirical study on the organizational trust, employee-organization relationship andinnovative behavior from the integrated perspective of social exchange and organizational sustainability. Sustainability 10(2018) 864.
[60] L. Zhi, J. Tang, B. Li and W. Zhe, Trade-off between remanufacturing and recycling of WEEE and the environmental impli-cation under the Chinese Fund Policy. J. Clean. Prod. 167 (2017) 97–109.
[61] J. Zhou, Q. Wang, S.-B. Tsai, Y. Xue and W. Dong, How to evaluate the job satisfaction of development personnel. IEEETrans. Syst. Man Cybern.-Syst. 47 (2017) 2809–2816.
[62] X. Zhu, Z. Wang, Y. Wang and B. Li, Incentive policy options for product remanufacturing: subsidizing donations or resales?Int. J. Env. Res. Pub. He. 14 (2017) 1496.
[63] Z.B. Zou, J.J. Wang, G.S. Deng and H. Chen, Third-party remanufacturing mode selection: outsourcing or authorization?Transp. Res. E-log. 87 (2016) 1–19.