Embed Size (px)
Citation preview

I N V E S T O R P R E S E N TAT I O N
J U N E 2 0 1 7

GGP Inc.’s mission is to own and operate best-in-class retail properties that provide an outstanding environment and experience for our Communities, Retailers, Employees, Consumers
and Shareholders. GGP is an S&P 500 company focused exclusively on owning, managing, leasing, and redeveloping high-quality retail properties throughout the United States.
GGP defines best-in-class retail and modern luxury through curated merchandising and elegant culinary experiences set against the backdrop of refined ambience across
this distinguished collection of destinations.
DO THE RIGHT THING
ATTITUDE
HUMILITY
TOGETHER
O W N I T
Headquarters Chicago
Retail Properties 127
States 40
Inline & Freestanding GLA
56 million
Total Retail GLA 121 million
Equity Market
Cap$20.6 billion
Enterprise Value $39.0 billion
S & P 5 0 0 R E A L E S T A T E I N V E S T M E N T T R U S T ( a )
2a. As of 3/31 / 17

E X E C U T I V E T E A M
SANDEEP MATHRANIChief Executive Officer
SHOBI KHANPresident and Chief Operating Officer
MICHAEL BERMANExecutive Vice President and Chief Financial Officer
JARED CHUPAILAExecutive Vice President, Leasing
RICHARD PESINExecutive Vice President, Anchors, Development and Construction
ROSEMARY FEITExecutive Vice President, General Counsel
BRIAN McCARTHYExecutive Vice President, Asset Management
JULIE KNUDSONSenior Vice President and Chief Human Resources Officer
TARA MARSZEWSKISenior Vice President, Chief Accounting Officer
3

GLA (in millions)
SF Per Capita
% of Total High-Quality GLA
High-Quality (a) Regional Shopping Center GLA 495 1.6 40%
High-Quality (b) Open-Air Center GLA 732 2.3 60%
Total High-Quality Retail Real Estate 1,227 3.9 100%
T O T A L U . S . R E A L E S T A T E G L A
a. “High- Qual i t y ” def ined as a regional shopping center rated B+ or bet ter.b. “High- Qual i t y ” def ined as a Trade Area Power score of 75 -100 for s t r ip centers .
H I G H Q U A L I T Y R E T A I L P R O P E R T I E S
GGP owns 8.2% of all High-Quality Retail Real Estate
High-Quality Retail Real Estate 1.2 billion sf 3.9 sf per capita
High-Quality Regional Shopping Centers
Regional Shopping Centers 1.1 billion sf 3.4 sf per capita
Open-air Centers 6.4 billion sf 20.2 sf per capita
Mid- to Low-Quality Retail Real Estate 6.3 billion sf 19.7 sf per capita
T Y P E Q U A L I T Y
High-Quality Open-Air Centers
4
Source: GGP

Top Retail Properties
NOI Weighted Sales PSF(b)
% of Company NOI
Lease Spreads
Top 10 $924 23% 16.1%
Top 30 $828 49% 15.7%
Top 50 $770 67% 11.8%
Top 100 $710 95% 11.0%
Total Retail Properties $705 100% 10.1%
75 Class A Retail Properties $764 77% 13.7%
S A L E S A N D N O I C O N T R I B U T I O N S ( a )
a. Retai l proper t ies ranked by NOI .
b. Weighted Sales per square foot for t rai l ing 12 months ended March 31 , 2017 for comparable tenants occupying space less than 10,000 square feet .
I R R E P L A C E A B L E R E T A I L R E A L E S T A T E I N T H E U . S .
GGP owns 100 of the top 500 regional shopping centers in the U.S.
5

R E T A I L R E A L E S T A T E
STRIP MALL
CONVENIENCE
COMMUNITY
OUTLET
SUPER-REGIONAL
LIFESTYLE
POWER
NEIGHBORHOOD
REGIONAL
C H A N G I N G T H E V O C A B U L A R Y
Retailers, restaurants and entertainment venues are property type agnostic and want to be in high-quality retail
locations that attract heavy traffic.
S O U R C E S O F “ N E W ” D E M A N D
Restaurants Entertainment Fitness & Beauty Grocery
6

R E S T A U R A N T S
C U R A T I O N I S K E Y T O P E R F O R M A N C E
P E R S O N A L C A R E H O M E F U R N I S H I N G S E N T E R T A I N M E N T
O M N I C H A N N E L B I G B O X E L E C T R O N I C S G R O C E R Y
7
F O O D & B E V E R A G E
O M N I C H A N N E L B I G B O X E L E C T R O N I C S G R O C E R Y
P E R S O N A L C A R E H O M E F U R N I S H I N G S E N T E R T A I N M E N T
C U R A T I O N I S K E Y T O P E R F O R M A N C E
8

S U S T A I N A B I L I T Y
2 0 1 6 I M P A C T AT A G L A N C E
Composted as additional 160 tons of food waste; a 7.6% increase from 2015.
In October 2016, the Solar Industries Energy Association (“SEIA”) ranked GGP 9th among all U.S. companies based on installed solar generation capacity & ranked GGP 3rd based on the solar capacity it installed in calen-dar year 2016.
Completed lighting and HVAC up-grades with projected savings of 80.4 million kilowatt hours of electricity annually; the equivalent of removing 8,300 homes from the grid.
Reduced its carbon footprint by 25,600 metric tons of carbon dioxide equivalents; the equivalent of remov-ing approximately 19,800 cars from U.S. roads.
Since 2011, reduced grid-purchased electricity consumption by 267.9 million kilowatt hours; enough electricity to power all of the homes in Napa, CA for one year.
Diverted more than 55,200 tons of waste from landfills; enough to fill more than 6,200 garbage trucks.
S e c t o r L e a d e r 2 0 1 4
® ®
G r e e n S t a r 2 0 1 4
9

10
D E B T P R O F I L E a
D E B T M A T U R I T Y L A D D E R b
$ I N B I L L I O N S A T G G P S H A R E
$0.0
2017 2018
$0.5
2019
$2.1
2020
$3.1
2021
$3.0
2022
$2.4
2023
$1.9
2024
$1.6
2025
$1.7
2026
$0.5
2027+
$0.5
A V E R A G E R E M A I N I N G T E R M
N E T D E B T / E B I T D A c
I N T E R E S T C O V E R A G E
5 . 2 Y E A R S
4 7. 4 %
7. 8 X
2 . 8 X
a. As of 3/31 /2017
b. Assumes maturi t y ex tension opt ions are exercised and approved.
c. Net debt as of 3/31 /2017 div ided by 2017 projected EBITDA.
18
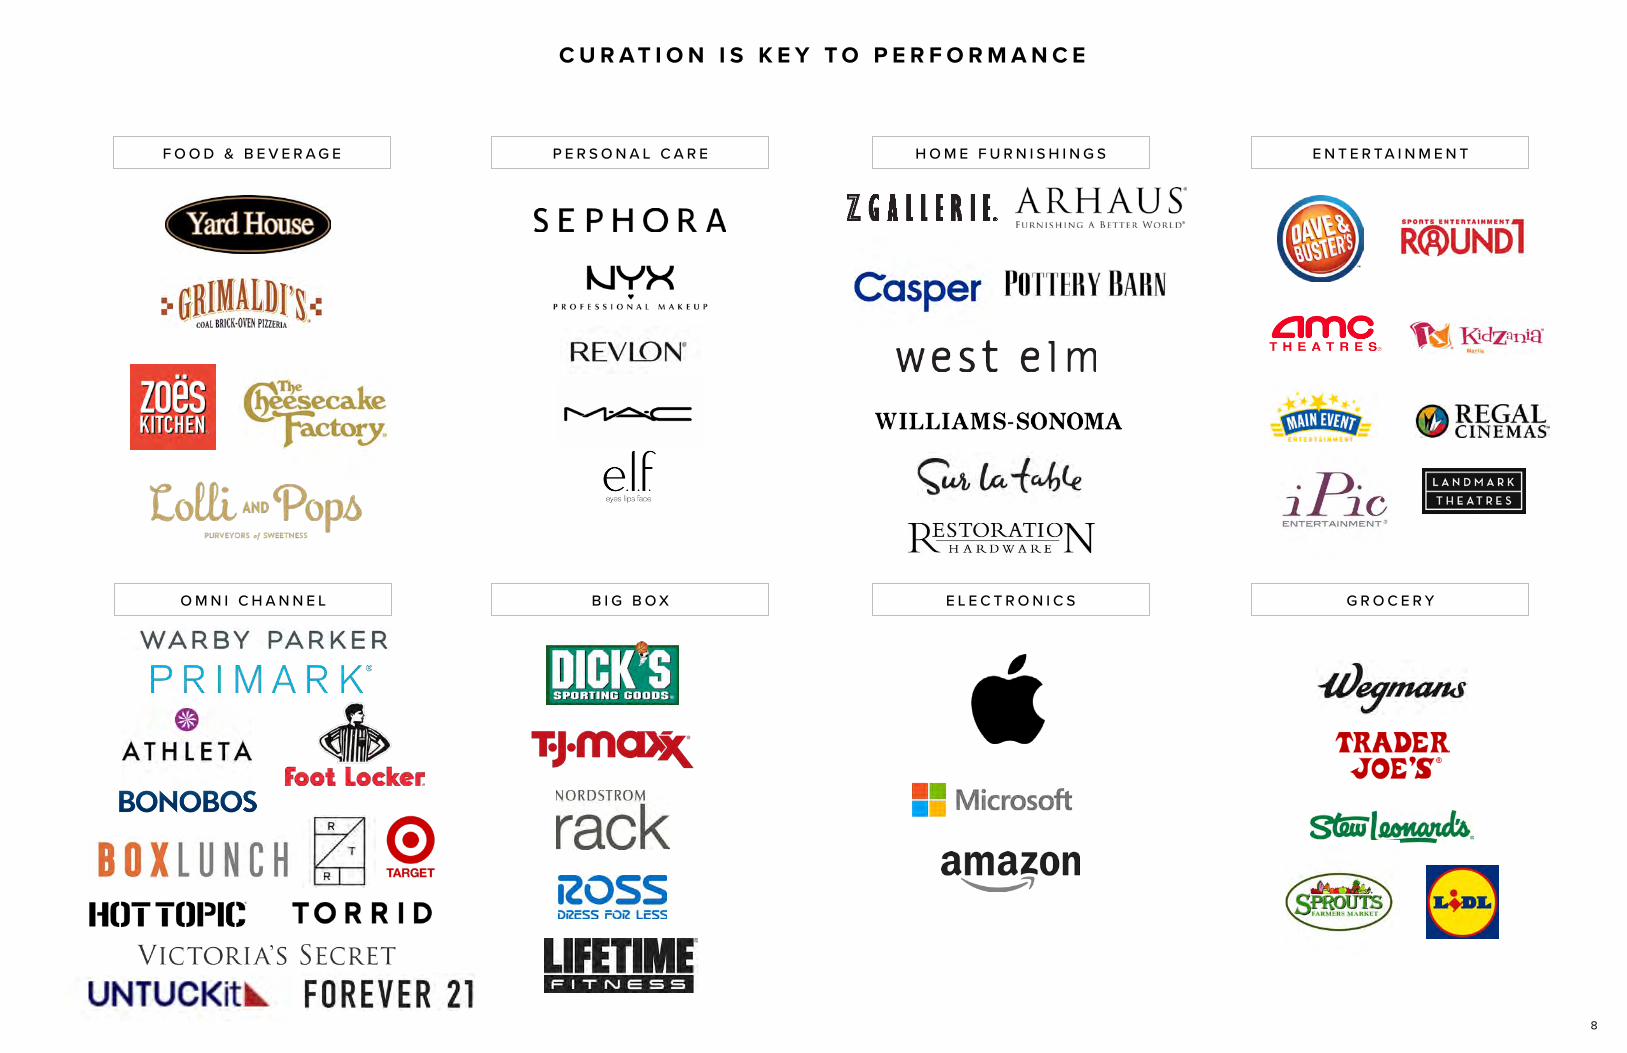
Company FFO/Share (b)
NAREIT FFO/Share (b)
Diluted EPS
1ST QUARTER ACTUAL
$0.36
$0.36
$0.11
$0.34-$0.36
$0.33-$0.35
$0.10-$0.12
2ND QUARTER GUIDANCE
$0.86-$0.88
$0.84-$0.86
$0.38-$0.40
SECOND HALF
$1.56-$1.60
$1.53-$1.57
$0.59-$0.63
2017
The guidance estimate reflects management’s view of current and future market conditions, including assumptions with respect to Company Same Store NOI
and Operating Income growth, rental rates, occupancy levels, retail sales, variable expenses, interest rates and the earnings impact of the events referenced in
this release and previously disclosed. The guidance also reflects management’s view of capital market conditions. The estimates do not include future gains or
losses, or the impact on operating results from future property acquisitions or dispositions or capital market activity. Earnings per share estimates may be subject
to fluctuations as a result of several factors, including any gains or losses associated with disposition activity. By definition, FFO and Company FFO exclude
real estate-related depreciation and amortization, provisions for impairment, or gains or losses associated with property disposition activities. This guidance is a
forward-looking statement and is subject to the risks and other factors described elsewhere in this release and in the Company’s annual and quarterly periodic
reports filed with the Securities and Exchange Commission.
2 0 1 7 E A R N I N G S G U I D A N C E a
a. As of 5/ 1 /2017
b. Company FFO per share and NAREIT FFO per share are non-GAAP financial measures. Please refer to GGP’s 1st quar ter 2017 supplemental informat ion for the reconcil iat ion to GAAP earnings per share and
the discussion of the definit ions, purpose, and use of these measures.
11

S T O R E S T H R I V E

S T O R E S T H R I V E
Retailers focused on three key factors will succeed
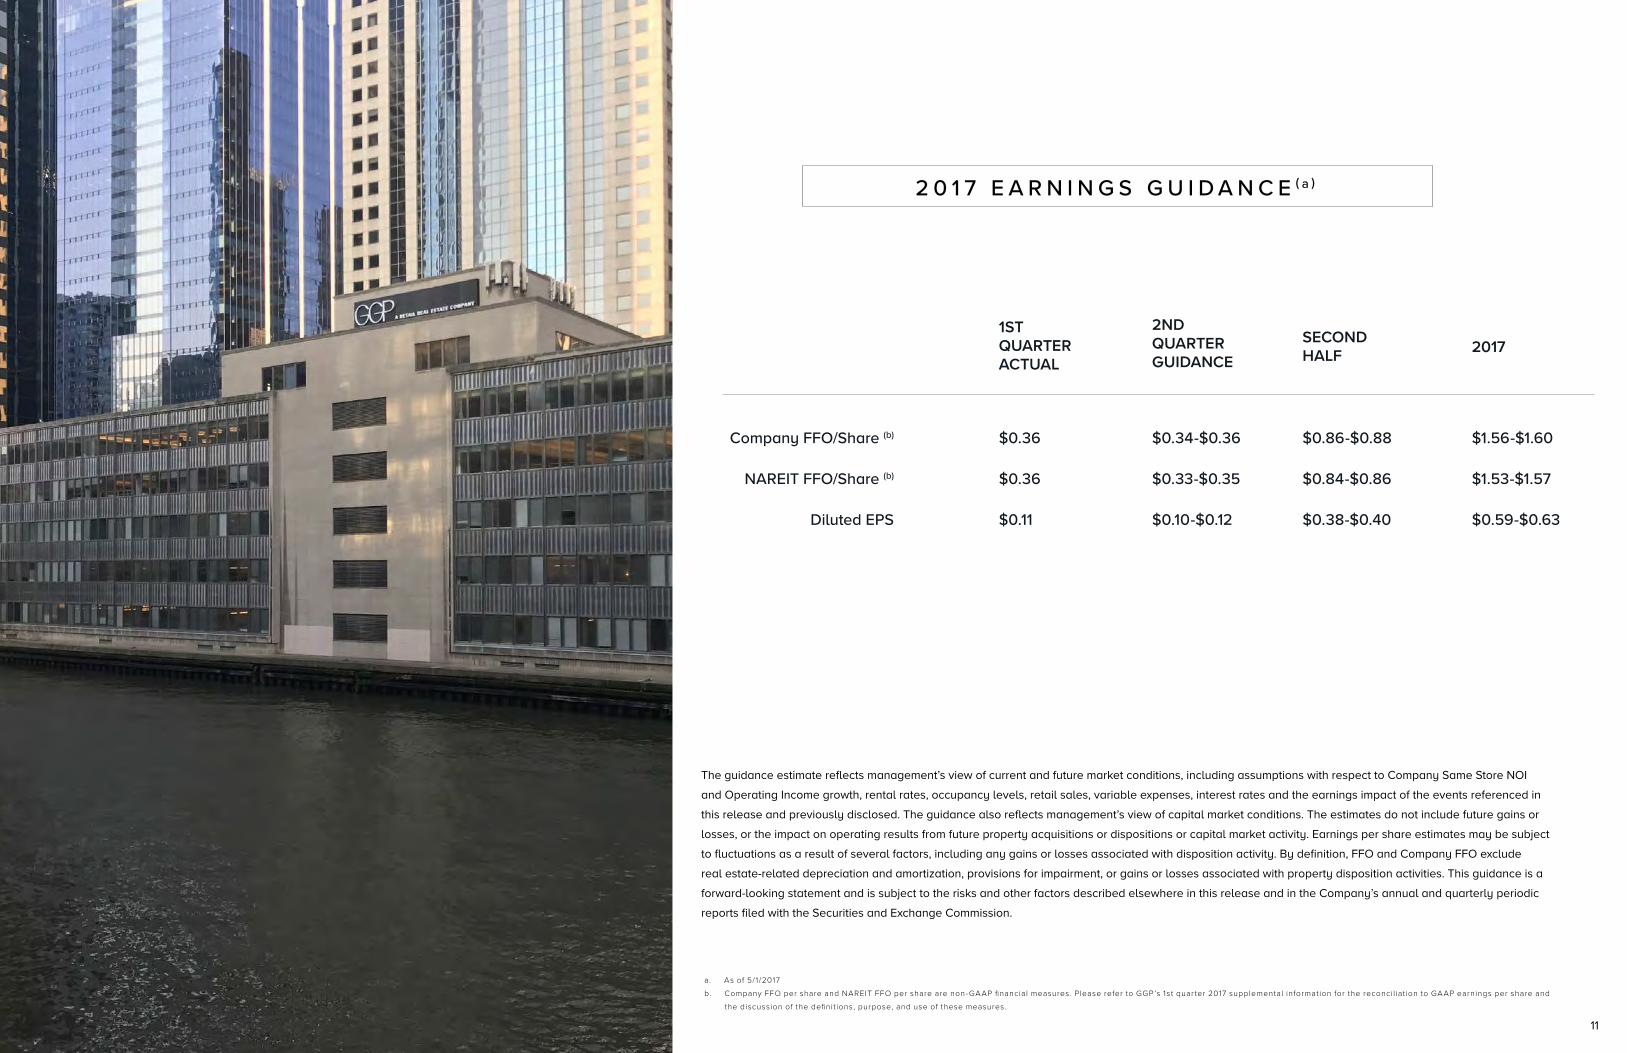
P R O D U C T
THE RIGHT ASSORTMENT
featuring current, relevant,and occasion-appropriatemerchandise that delightsthe target consumer
COMPELLING VALUE
balancing the total benefit of the shopping experience against the cost
APPROPRIATE QUALITY
for the price and brand promise
S E R V I C E
EXPERT GUIDANCE
curating product and styling recommendations beyond what a shopper can research online
SUPPORT A CONSISTENT BRAND EXPERIENCE
with the right visual merchandising, stocking levels, and store aesthetic
REMOVE FRICTION
from the experience with fast,convenient returns and check out
E X P E R I E N C E
LIVE YOUR BRAND
with a compelling, differentiated and consistent experience in-store
PROVIDE THERIGHT AMBIANCE
that is brand-appropriate
PERSONALIZE SERVICES AND OFFERINGS
to what best delights the target consumer and builds loyalty
Source: GGP Strategy & Analy t ics .
13
P R O D U C T
LUXURY TRADITIONAL APPAREL FAST FASHION DEPARTMENT STORE
VA
LUE
TORY BURCH
KATE SPADECOACH
NORDSTROM
HOT TOPIC
ZARA
H&MFOREVER 21
TALBOTS
J.CREW
EXPRESSJC PENNEY
MACY’SA&F
GAP
OLD NAVY
AEO
ARITZIA
BANANA REPUBLIC
J.J ILL
DVF
NEIMAN MARCUS
PRADA
GUCCI
LOUIS VUITTON
VA
LUE
PE
RC
EP
TIO
N
PRODUCT ASSORTMENT
LUX
UR
Y
BASICS SPECIALTY / DESIGNER
Sources: GGP Strategy & Analy t ics .
14
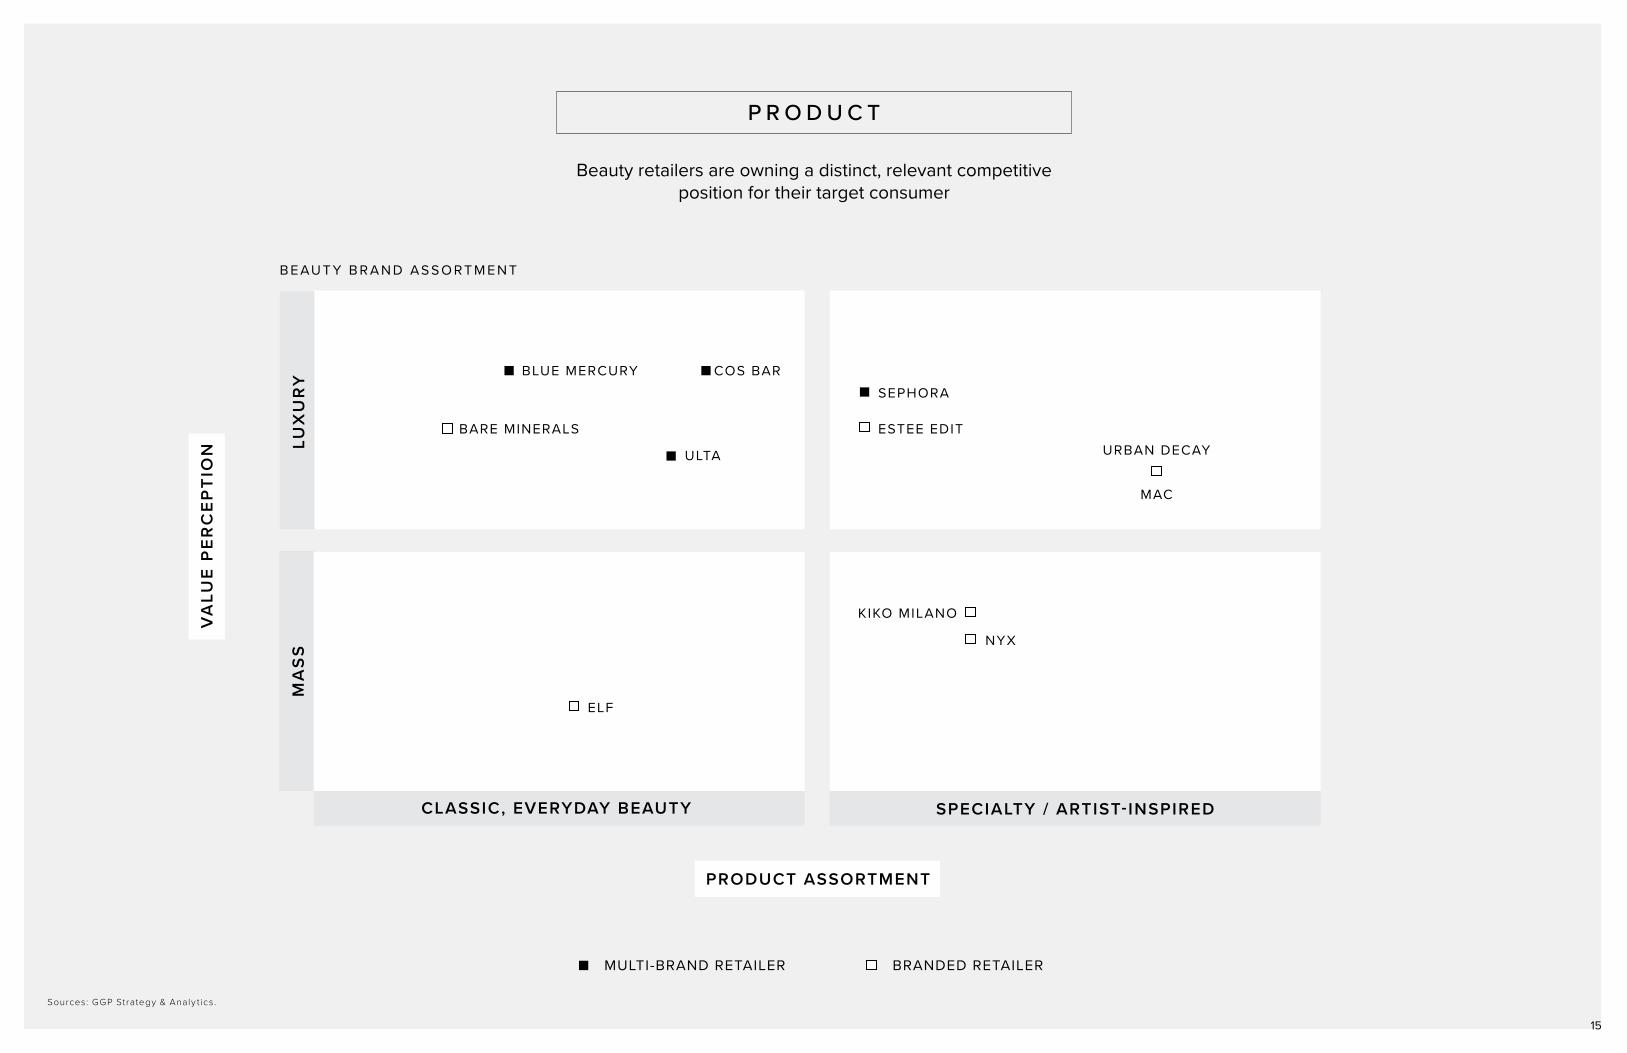
P R O D U C T
Beauty retailers are owning a distinct, relevant competitive position for their target consumer
Sources: GGP Strategy & Analy t ics .
MULTI-BRAND RETAILER BRANDED RETAILER
B E AU T Y B R A N D AS S O R T M E N T
MA
SS
VA
LUE
PE
RC
EP
TIO
N
PRODUCT ASSORTMENT
LUX
UR
Y
CLASSIC, EVERYDAY BEAUTY SPECIALTY / ARTIST-INSPIRED
BLUE MERCURY
BARE MINERALS
ULTA
COS BAR
SEPHORA
ESTEE EDITURBAN DECAY
MAC
NYX
KIKO MILANO
ELF
15

S E R V I C E
To generate sales retailers need knowledgeable,skilled staff to meet consumer expectations
Q: What do you value most when you are shopping in a retail store?
Q: When helped by a knowledgeable associate, how likely are you to buy?
Q: If you try on clothes in a dressing room and find you need a different size or color – but no associate is available to help, how often do you consider abandoning the dressing room and leaving the store?
PROMPT SERVICE
PERSONALIZED EXPERIENCE
SMART RECOMMENDATIONS
47%
26%
17%
0% 10% 20% 30% 40% 50%
EVERYTIME
SOMETIMES
NEVER
21%
NOT LIKELY
12%
50%
29%
Sources: T imeTrade The State of Retai l 2017
16
LIKELY
88%

S E R V I C E
Constraining SG&A prohibits sufficient sales associates on the floor
PWC 2014 -2016 Retai l and Consumer Insight Benchmarking Studies
M E D I A N S G & A AS A % O F S A L E S N E T S A L E S G R OW T H
24
23
22
21
20
19
18
17
16
15
20
15
10
5
0
2009 2010 2011 2012 2013 2014 2015
3.5%
7.5%
9.4%7.8%
3.6%
5.7%
3.8%
SG&A AS A % OF SALES NET SALES GROWTH
7 8 % o f c o n s u m e r s s a y t h e y w a n t s a l e s a s s o c i a t e s w i t h d e e p k n o w l e d g e o f t h e p r o d u c t r a n g e
17
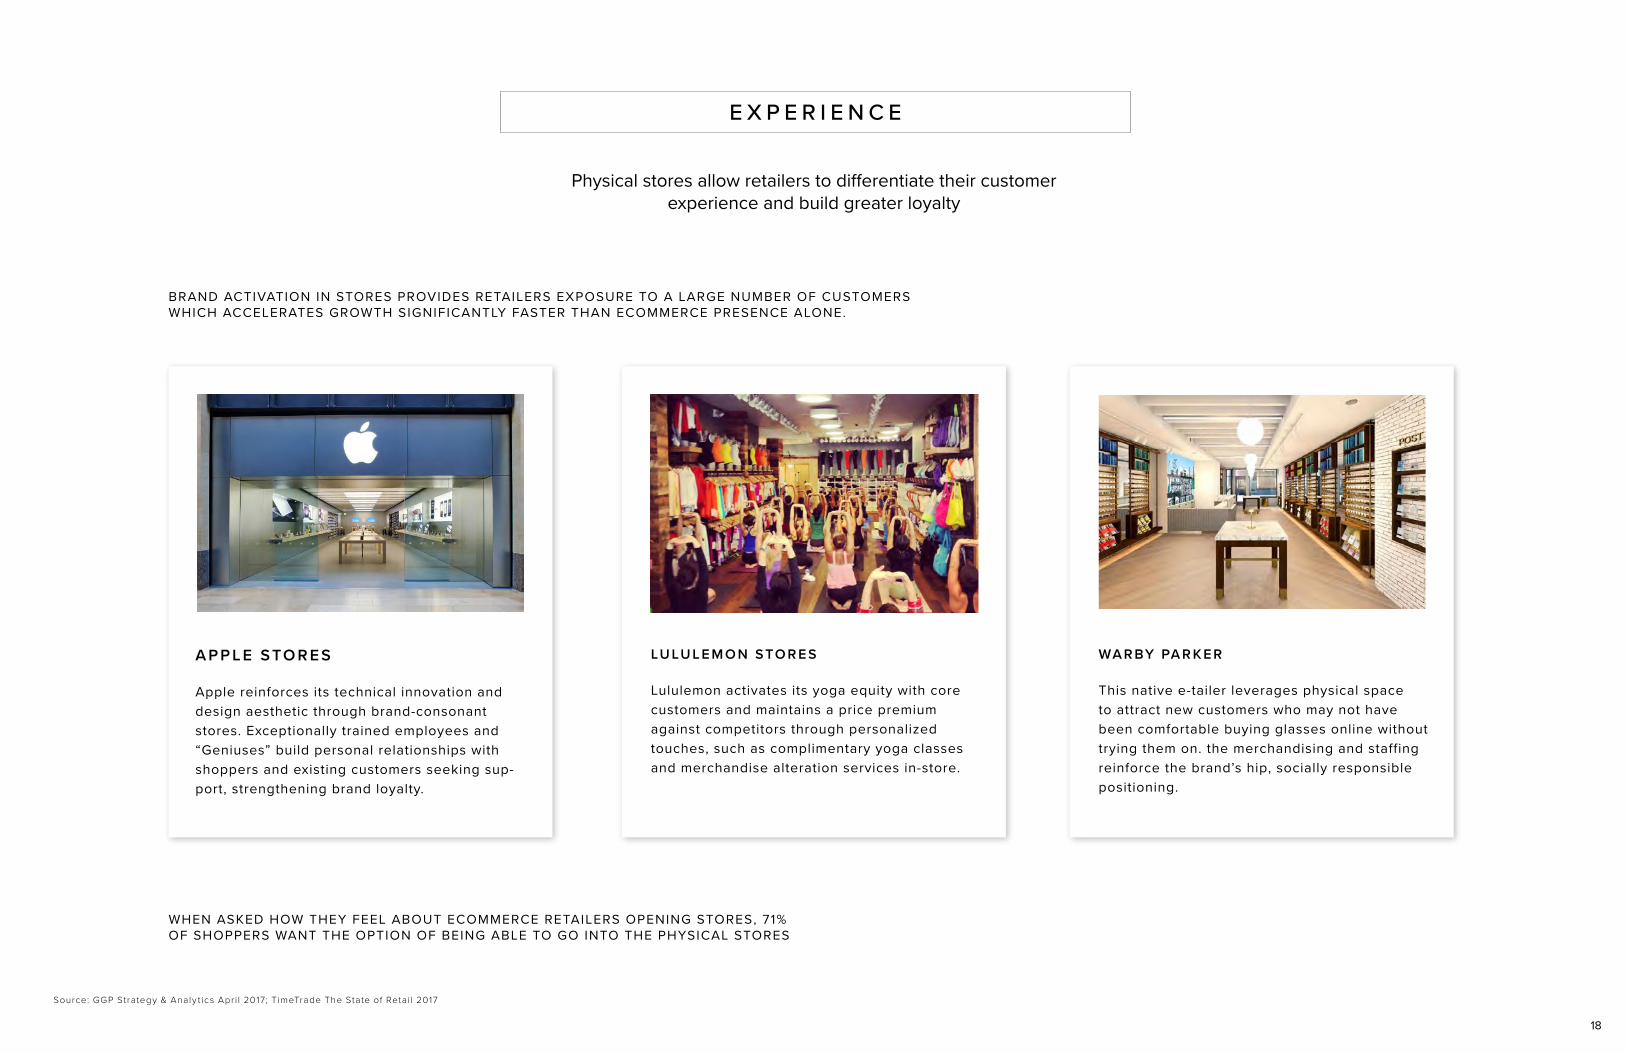
E X P E R I E N C E
Physical stores allow retailers to differentiate their customer experience and build greater loyalty
Source: GGP Strategy & Analy t ics Apr i l 2017; T imeTrade The State of Retai l 2017
BRAND ACTIVATION IN STORES PROVIDES RETAILERS EXPOSURE TO A LARGE NUMBER OF CUSTOMERSWHICH ACCELERATES GROWTH SIGNIFICANTLY FASTER THAN ECOMMERCE PRESENCE ALONE.
WHEN ASKED HOW THEY FEEL ABOUT ECOMMERCE RETAILERS OPENING STORES, 71%OF SHOPPERS WANT THE OPTION OF BEING ABLE TO GO INTO THE PHYSICAL STORES
A P P L E S TO R E S
Apple reinforces its technical innovation and design aesthetic through brand-consonant stores. Exceptionally trained employees and “Geniuses” build personal relationships with shoppers and existing customers seeking sup-port, strengthening brand loyalty.
LU LU L E M O N S TO R E S
Lululemon activates its yoga equity with core customers and maintains a price premium against competitors through personalized touches, such as complimentary yoga classes and merchandise alteration services in-store.
WA R BY PA R K E R
This native e-tailer leverages physical space to attract new customers who may not have been comfortable buying glasses online without trying them on. the merchandising and staffing reinforce the brand’s hip, socially responsible positioning.
18

E X P E R I E N C E
Physical stores allow retailers to differentiate their customer experience and build greater loyalty
Source: GGP Strategy & Analy t ics Apr i l 2017; T imeTrade The State of Retai l 2017
BRAND ACTIVATION IN STORES PROVIDES RETAILERS EXPOSURE TO A LARGE NUMBER OF CUSTOMERSWHICH ACCELERATES GROWTH SIGNIFICANTLY FASTER THAN ECOMMERCE PRESENCE ALONE.
Z A R A
Zara puts customers first, actively mining feedback for product and experience insights. To cater to its millennial consumers, Zara uses technology like RFID tags and self-service checkouts to enhance inventory visibility and remove friction from the shopping experience, enabling employees to focus on assisting customers with their styling needs.
F O OT LO C K E R
Footlocker revitalized its merchandising and in-store experience with a focus on active performance and becoming more brand and trend-focused. The refreshed store features sleek lighting and dark interiors, letting the product shine.
P R I M A R K
Primark offers fast fashion, merchandised by occasion at very low prices. Its dynamic, vibrant aesthetic engages shoppers with video walls, hip seating areas, and neon signage. They do not sell online but digitally engage consumers via Primania, where brand fans post their looks to inspire other shoppers.
19

B R I C K S & C L I C K S W I N

Total Sales (billions)
% of Total Sales
$4,200 91.0% Direct brick and mortar sales
+ $97 2.3% Online sales from Retailers with Brick and Mortar presence (Omni-channel)
$4,297 93.3% Brick and mortar related sales
+ $139 3.6% Mail order and E-commerce Auction sales
+ $29 0.6% Non-merchandise receipts ( including shipping, service charges)
+ $169 3.6% Pure-play E-commerce
$4,634 100% Total retail sales
B R I C K A N D M O R T A R C A P T U R E S 9 3 % O F R E T A I L S A L E S
21Source: ICSC analysis of 2015 U.S. Census data 21Sources: 2015 U.S . Census Retai l Trade Sales Annual Repor ts & ICSC Research
Pure Play E-commerce
Sales
Non Merchandise Receipt: (shipping & handling, auction commissions and other costs)
Mail Order & E-Commerce Auction Sales
Brick & Mortar Online Sales
Other Sales $434 B 9.2% of Total
Brick & Mortar In-Store Sales
$4.2 T

22
CUSTOMER ACQUISTITION COSTS
LAST MILE OF DISTRBIUTION
UPSELLING IN BRICKS AND MORTAR STORES
O N E - C H A N N E L G E N E R A T E S H I G H E R S A L E S
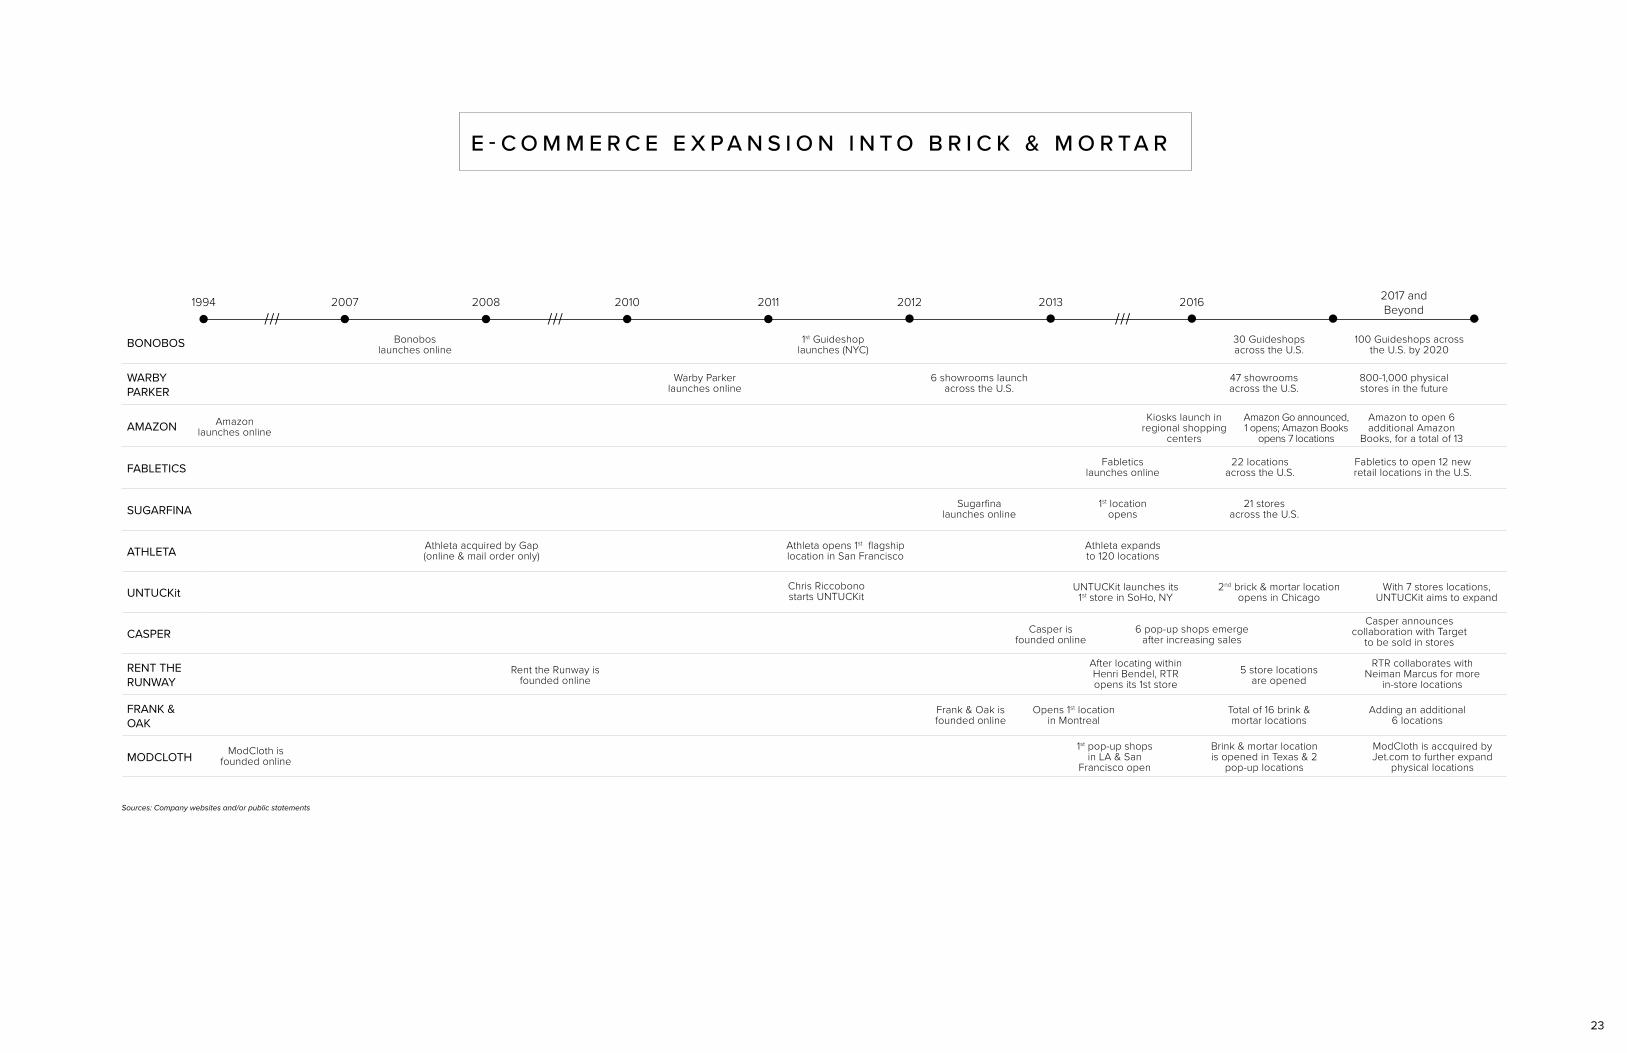
BONOBOS
WARBY PARKER
AMAZON
FABLETICS
SUGARFINA
ATHLETA
UNTUCKit
CASPER
RENT THE RUNWAY
FRANK & OAK
MODCLOTH
1994 2007 2008 2010 2011 2012 2013 2016 2017 and Beyond
Athleta expands to 120 locations
Kiosks launch in regional shopping
centers
Amazon Go announced, 1 opens; Amazon Books
opens 7 locations
22 locations across the U.S.
Fabletics to open 12 new retail locations in the U.S.
21 stores across the U.S.
100 Guideshops across the U.S. by 2020
800-1,000 physical stores in the future
47 showrooms across the U.S.
Amazon to open 6 additional Amazon
Books, for a total of 13
1st Guideshop launches (NYC)
30 Guideshops across the U.S.
Athleta opens 1st flagship location in San Francisco
6 showrooms launch across the U.S.
Sugarfina launches online
Fabletics launches online
1st location opens
Amazonlaunches online
ModCloth is founded online
1st pop-up shops in LA & San
Francisco open
Brink & mortar location is opened in Texas & 2
pop-up locations
ModCloth is accquired by Jet.com to further expand
physical locations
Rent the Runway is founded online
After locating within Henri Bendel, RTR opens its 1st store
5 store locations are opened
Frank & Oak is founded online
Opens 1st location in Montreal
Total of 16 brink & mortar locations
Adding an additional 6 locations
RTR collaborates with Neiman Marcus for more
in-store locations
Chris Riccobono starts UNTUCKit
UNTUCKit launches its 1st store in SoHo, NY
Casper is founded online
6 pop-up shops emerge after increasing sales
Casper announces collaboration with Target
to be sold in stores
2nd brick & mortar location opens in Chicago
With 7 stores locations, UNTUCKit aims to expand
Bonoboslaunches online
Athleta acquired by Gap (online & mail order only)
Warby Parker launches online
E - C O M M E R C E E X P A N S I O N I N T O B R I C K & M O R TA R
Sources: Company websites and/or public statements
/// /// ///
23

$1.27T $1.46T $1.51T
2012
$1.39T
20112010
$1.32T
2009
$1.65T$1.57T
2013 2014 2015200820072006
$1.32T$1.33T$1.29T
Willi
ams
Sono
ma,
Inc.
*
Urb
an O
utfit
ters
, Inc
.
J.Cre
w
Appl
e
Nei
man
Mar
cus
Aber
crom
bie
& Fi
tch
Co.
New
Yor
k &
Com
pany
Nor
dstro
m
Cabe
la’s
The
Child
ren’
s Pl
ace
Lulu
lem
on
Asce
na R
etai
l Gro
up
Mac
y’s
Fini
sh L
ine
Gap
, Inc
.
L Br
ands
Zum
iez
Hud
son’
s Ba
y Co
mpa
ny
Foot
lock
er
Gam
eSto
p
Gym
bore
e
J.C.P
enne
y
Dic
k's
Spor
ting
Goo
ds
Chic
o's
FAS,
Inc.
PacS
un
Mic
hael
Kor
s
Tiffa
ny &
Co.
franc
esca
's
5%6%7%8%10%12%12%13%13%13%14%15%16%16%18%18%19%19%20%
22%22%25%26%
30%
37%38%38%
52%
19%Avg.
Source: : US Depar tment of Labor Bureau of Labor Stat is t ics: Personal Income and i t s Dis t r ibut ion. Categor ies include Furni ture and Furnishings, Glassware, Tableware, and utensi ls , Spor t ing Equipment , Recreat ional Books, Musical Ins t ruments , Jewelr y, Luggage, Telephone equipment , Clothing and Footwear, Personal Care Produc ts , and Food Ser v ices. eMarketer Retai l Index . *Wi l l iams Sonoma eCommerce includes regis t r y sales;
C O N S U M E R S P E N D I N G I S U P
N E A R LY A L L R E T A I L E R S H A V E F U L LY F U N C T I O N I N G E C O M M E R C E S I T E S
F Y 2 0 1 6 E - C O M M E R C E P E N E T R A T I O N A S A % O F T O T A L S A L E S
9 -Y E A R C A G R
+ 2 . 8 %
C O N S U M E R S S H I F T I N G C H A N N E L S D O E S N O T E X P L A I N R E T A I L E R P E R F O R M A N C E .
$1.27T $1.46T $1.51T
2012
$1.39T
20112010
$1.32T
2009
$1.65T$1.57T
2013 2014 2015200820072006
$1.32T$1.33T$1.29T
Will
iam
s So
nom
a, In
c.*
Urb
an O
utfit
ters
, Inc
.
J.C
rew
App
le
Nei
man
Mar
cus
Abe
rcro
mbi
e &
Fitc
h C
o.
New
Yor
k &
Com
pany
Nor
dstr
om
Cab
ela’
s
The
Chi
ldre
n’s
Plac
e
Lulu
lem
on
Asc
ena
Reta
il G
roup
Mac
y’s
Fini
sh L
ine
Gap
, Inc
.
L B
rand
s
Zum
iez
Hud
son’
s B
ay C
ompa
ny
Foot
lock
er
Gam
eSto
p
Gym
bore
e
J.C
.Pen
ney
Dic
k's
Spor
ting
Goo
ds
Chi
co's
FA
S, In
c.
PacS
un
Mic
hael
Kor
s
Tian
y &
Co.
franc
esca
's
5%6%7%8%10%
12%12%13%13%13%14%15%16%16%18%18%19%19%20%22%22%
25%26%
30%
37%38%38%
52%
19%Avg.
24
O M N I C H A N N E L I S H E R E T O S TAY
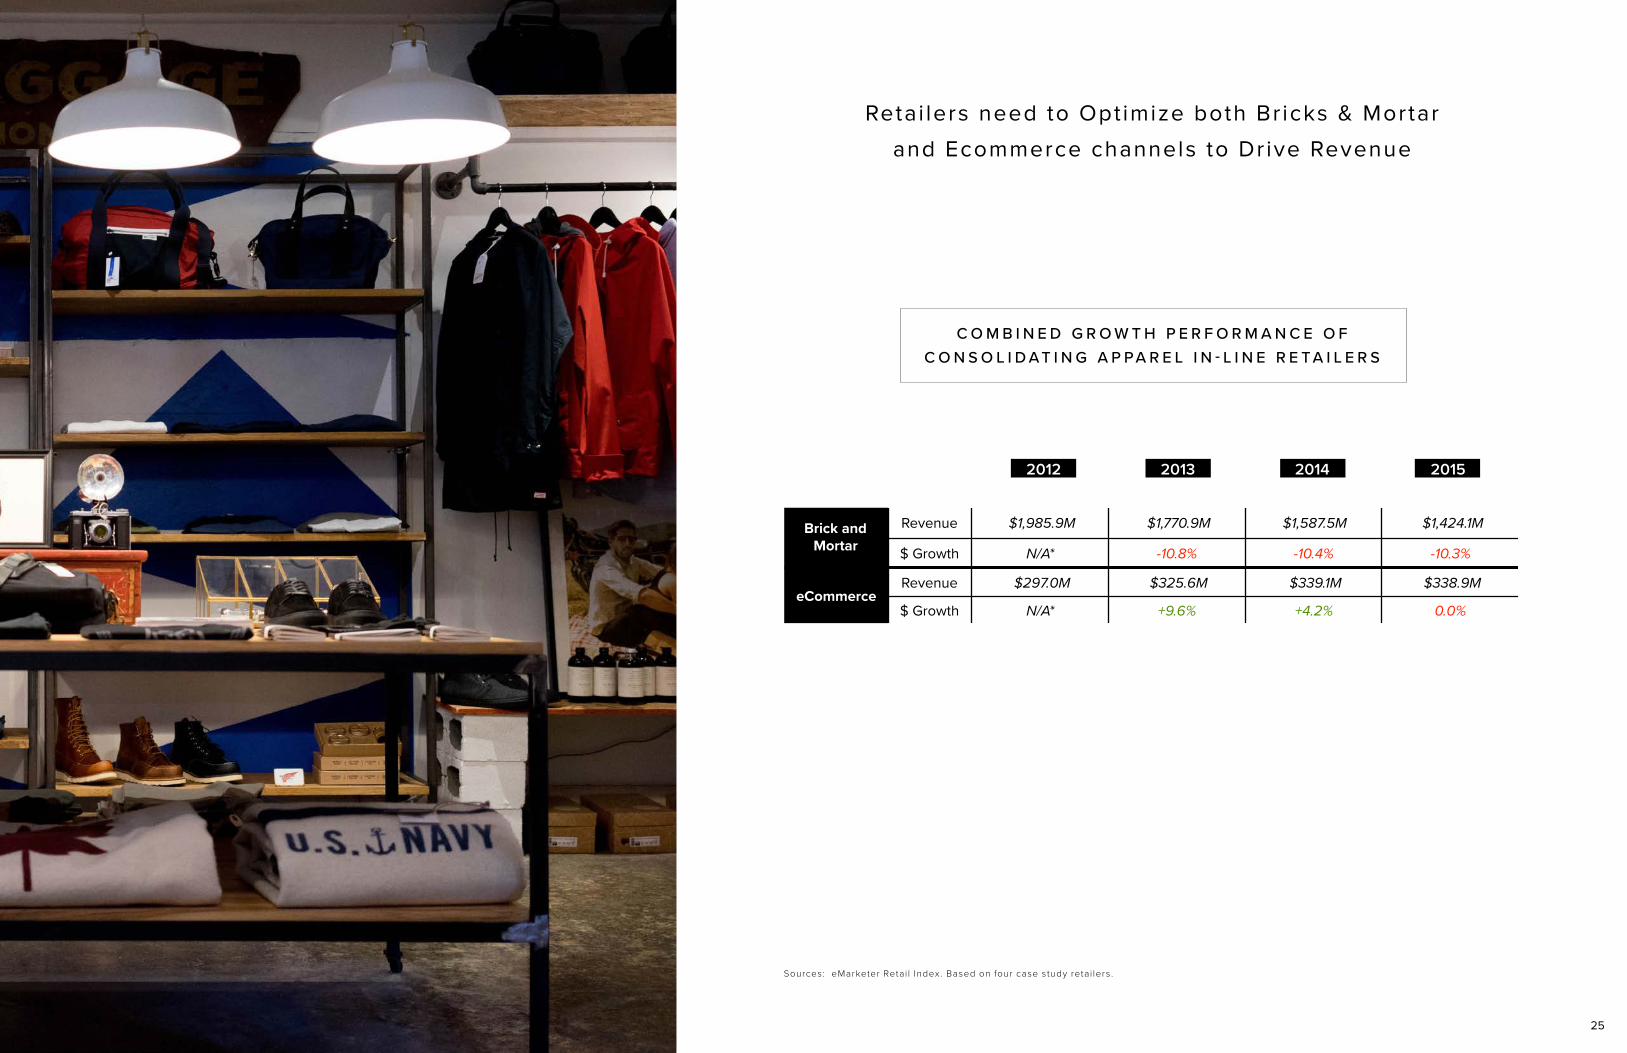
Retai lers need to Opt imize both Br icks & Mortar
and Ecommerce channels to Dr ive Revenue
Sources: eMarketer Retai l Index . Based on four case s tudy retai lers .
2012
Brick and Mortar
Revenue $1,985.9M $1,770.9M $1,587.5M $1,424.1M
$ Growth N/A* -10.8% -10.4% -10.3%
eCommerceRevenue $297.0M $325.6M $339.1M $338.9M
$ Growth N/A* +9.6% +4.2% 0.0%
Brick and Mortar
Revenue $24,935.6M $24,676.2M $24,380.0M $22,972.3M $21,156.5M
$ Growth +2.0% -1.0% -1.2% -5.8% -7.9%
eCommerceRevenue $2,750.4M $3,254.8M $3,725.0M $4106.7M $4,621.5M
$ Growth +41.0% +18.3% +14.4% +10.2% +12.5%
2013 2014 2015
2012 2013 2014 2015 2016
25
C O M B I N E D G R O W T H P E R F O R M A N C E O F C O N S O L I D A T I N G A P PA R E L I N - L I N E R E T A I L E R S

aaaaaaaaaaaaaaaaaaaaaaaaaaaaaaaaaaaaaaaaaaaaaaaaaaaaaaaa
S H O P P I N G C E N T E R O F T H E F U T U R E

New deals in recent years have focused on non-apparel categor ies
Source/Note: GGP Strategy & Analy t ics , non-anchor mutual ly approved and/or executed deals wi th rent commencement dates af ter 12 /31 /2012.
27
N E W D E A L S B Y C A T E G O R Y
0%
25%
50%
75%
100%
2013 2017
22%27%
22%20%
18%4%
13%
7%
25%
43%
Apparel Beauty & Personal Services Entertainment Food Other
PERCENTAGE OF GLA LEASED
P E R C E N T O F
G L A L E A S E D

Apparel F & B Entertainment Other
Existing 72% 7% 0% 21%
Expansion 15% 12% 55% 18%
G L A
S E A R S R E D E V E L O P M E N T A T S T A T E N I S L A N D M A L L
B E F O R E A F T E R
S T A T E N I S L A N D M A L L R E D E V E L O P M E N T
28
Sources: GGP Intel , GGP Strategy & Analy t ics .
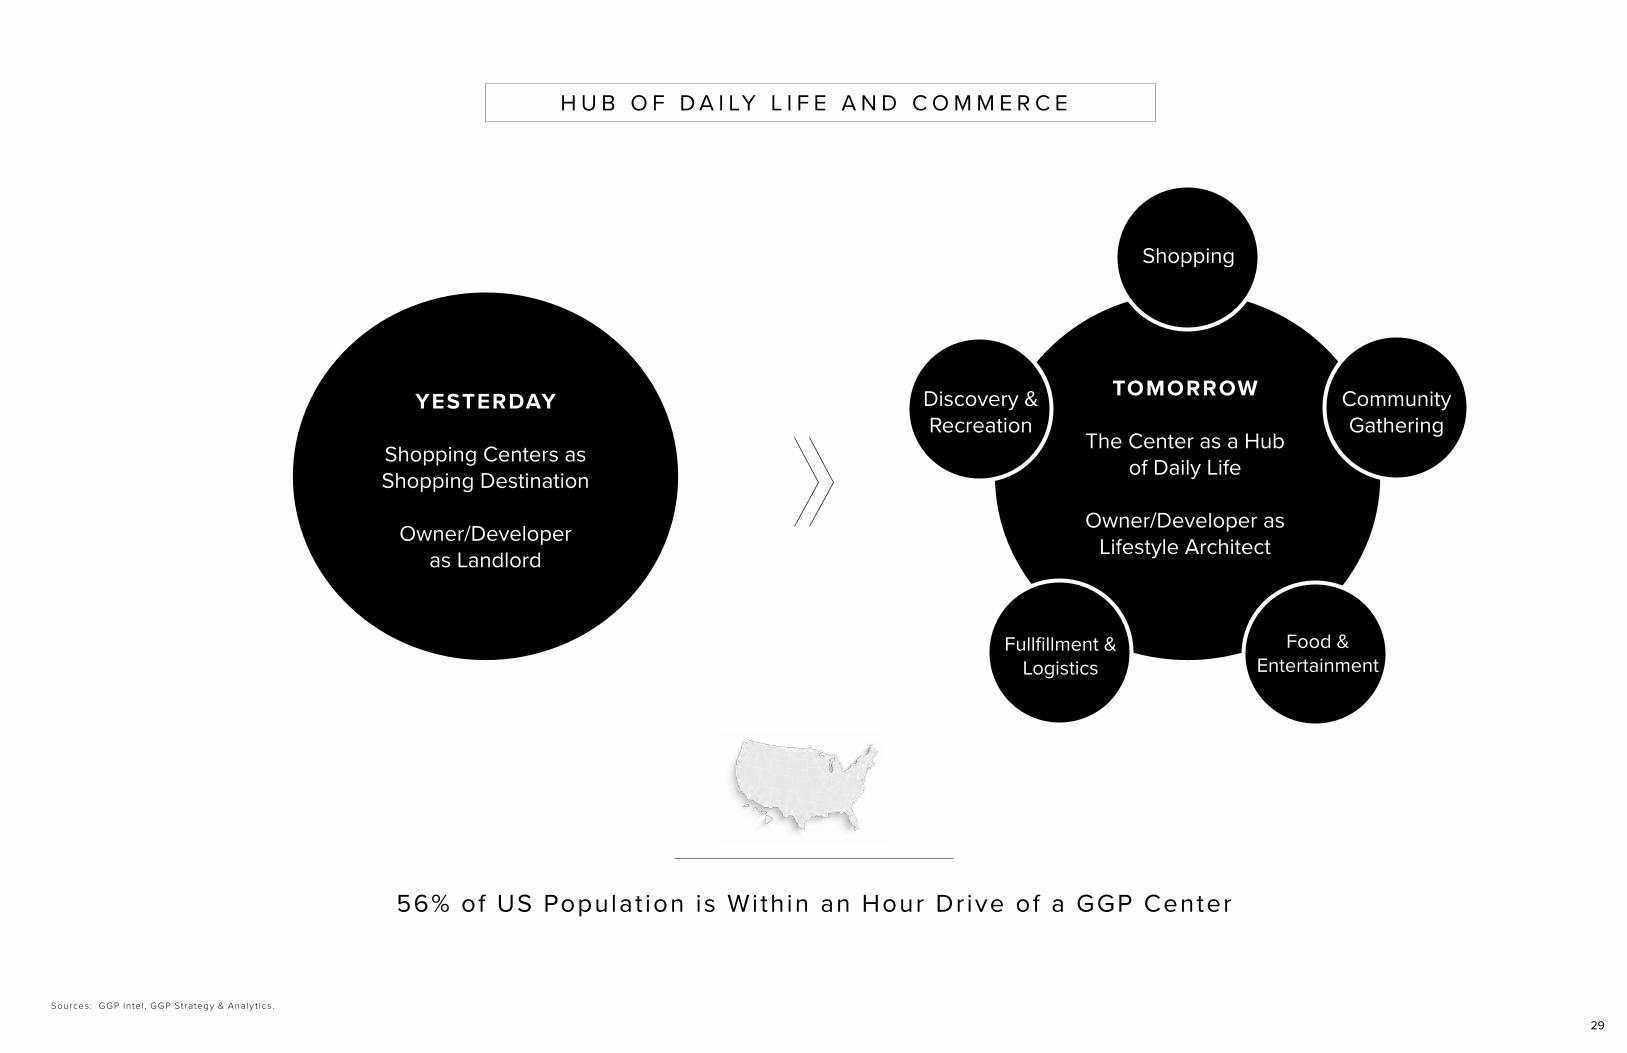
YESTERDAY
Shopping Centers as Shopping Destination
Owner/Developer as Landlord
H U B O F D A I LY L I F E A N D C O M M E R C E
29
TOMORROW
The Center as a Hub of Daily Life
Owner/Developer as Lifestyle Architect
Shopping
CommunityGathering
Discovery &Recreation
Food &Entertainment
Fullfillment &Logistics
56% of US Populat ion is Within an Hour Dr ive of a GGP Center
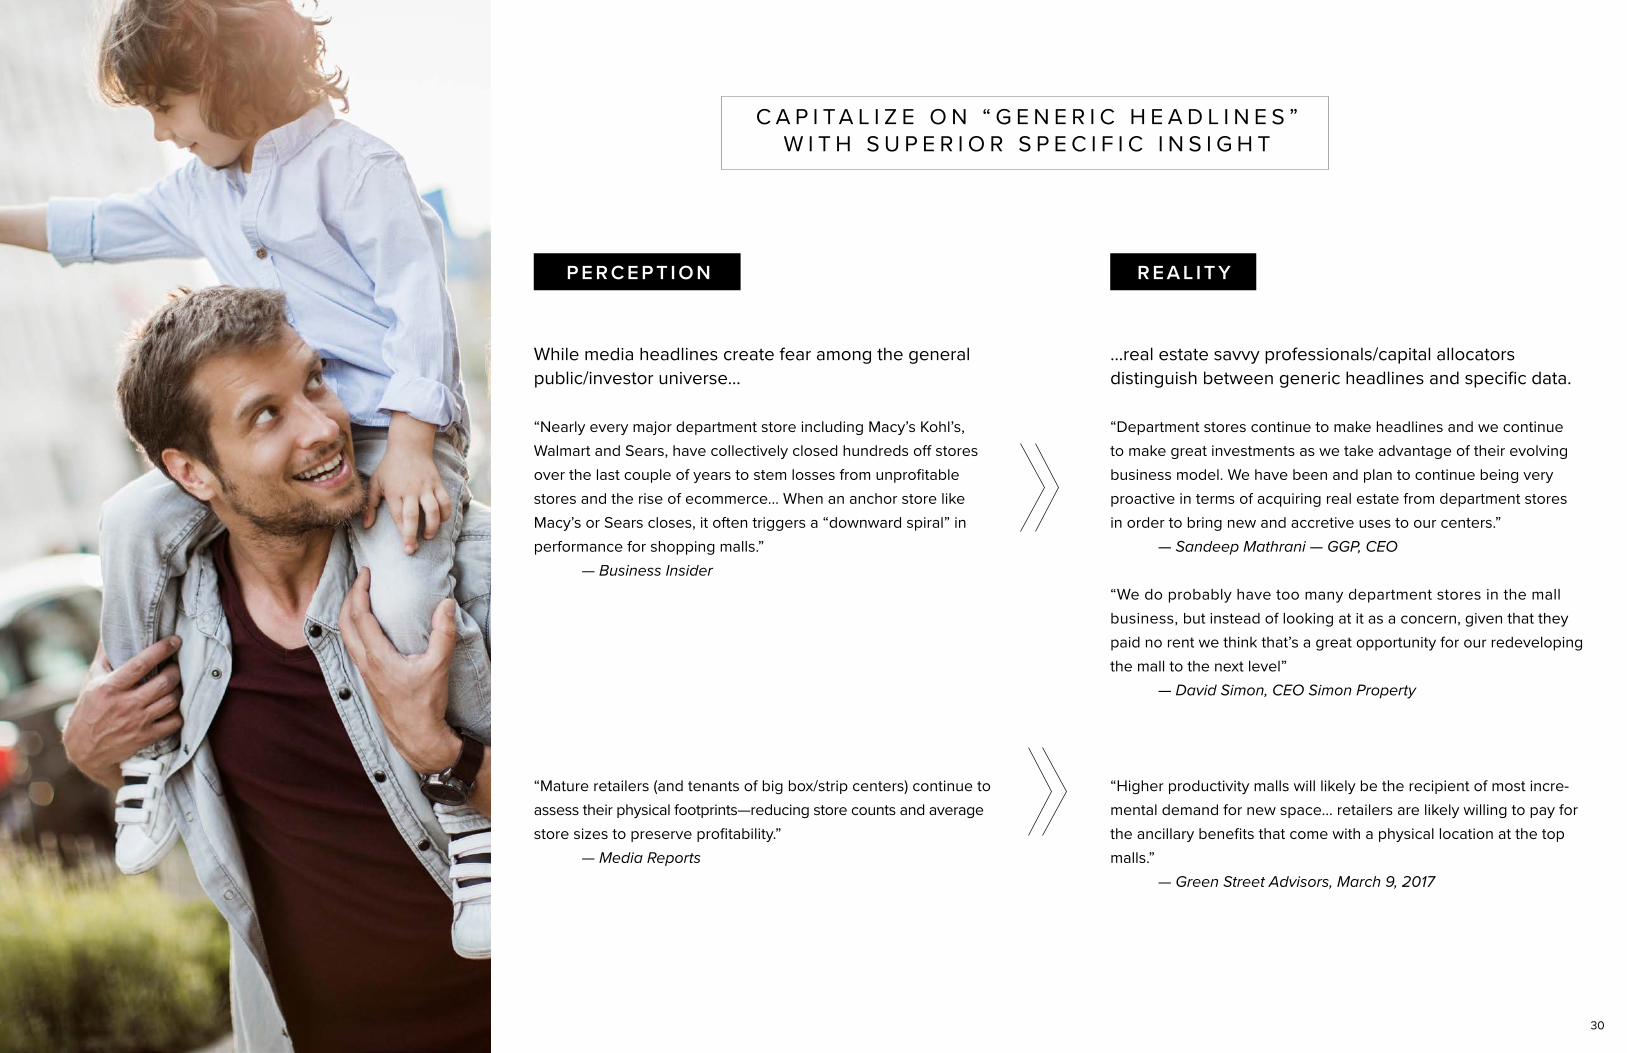
While media headlines create fear among the general public/investor universe…
“Nearly every major department store including Macy’s Kohl’s, Walmart and Sears, have collectively closed hundreds off stores over the last couple of years to stem losses from unprofitable stores and the rise of ecommerce… When an anchor store like Macy’s or Sears closes, it often triggers a “downward spiral” in performance for shopping malls.” — Business Insider
“Mature retailers (and tenants of big box/strip centers) continue to assess their physical footprints—reducing store counts and average store sizes to preserve profitability.” — Media Reports
…real estate savvy professionals/capital allocators distinguish between generic headlines and specific data.
“Department stores continue to make headlines and we continue to make great investments as we take advantage of their evolving business model. We have been and plan to continue being very proactive in terms of acquiring real estate from department stores in order to bring new and accretive uses to our centers.” — Sandeep Mathrani — GGP, CEO
“We do probably have too many department stores in the mall business, but instead of looking at it as a concern, given that they paid no rent we think that’s a great opportunity for our redeveloping the mall to the next level” — David Simon, CEO Simon Property
“Higher productivity malls will likely be the recipient of most incre-mental demand for new space... retailers are likely willing to pay for the ancillary benefits that come with a physical location at the top malls.” — Green Street Advisors, March 9, 2017
C A P I T A L I Z E O N “ G E N E R I C H E A D L I N E S ” W I T H S U P E R I O R S P E C I F I C I N S I G H T
P E R C E P T I O N R E A L I T Y
30

MICHAEL BERMANExecutive Vice President and
Chief Financial [email protected]
C O N T A C T I N F O R M A T I O N F O R W A R D - L O O K I N G S T A T E M E N T S
Certain statements made in this presentation may be deemed “forward-looking statements”
within the meaning of the Private Securities Litigation Reform Act of 1995. Although the
Company believes the expectations reflected in any forward-looking statement are based
on reasonable assumption, it can give no assurance that its expectations will be attained,
and it is possible that actual results may differ materially from those indicated by these for-
ward-looking statements due to a variety of risks, uncertainties and other factors. Such fac-
tors include, but are not limited to, the Company’s ability to refinance, extend, restructure or
repay near and intermediate term debt, its indebtedness, its ability to raise capital through
equity issuances, asset sales or the incurrence of new debt, retail and credit market condi-
tions, impairments, its liquidity demands, and economic conditions. The Company discusses
these and other risks and uncertainties in its annual and quarterly periodic reports filed
with the Securities and Exchange Commission. The Company may update that discussion
in its periodic reports, but otherwise takes no duty or obligation to update or revise these
forward-looking statements, whether as a result of new information, future developments,
or otherwise.
Investors and others should note that the Company posts this Investor Presentation on the
Investors page of its website at www.ggp.com. From time to time, the Company updates
the Investor Presentation and when it does, it will be posted on the Investors section of its
website at www.ggp.com. It is possible that the updates could include information deemed
to be material information. Therefore, the Company encourages investors, the media and
others interested in the Company to review the information posted on the Investors section
of its website at www.ggp.com from time to time.
KEVIN BERRYSenior Vice President
Investor & Public [email protected]
31