Embed Size (px)
Citation preview

Investor Presentation June 2014

2
This presentation contains “forward-looking” statements, within the meaning of the federal securities laws, that are based on our management’s beliefs and assumptions and on information currently available to management. Forward-looking statements include information concerning our possible or assumed future results of operations, business strategies, financing plans, competitive position, industry environment, potential growth opportunities, potential market opportunities and the effects of competition.
Forward-looking statements include all statements that are not historical facts and can be identified by terms such as “anticipates,” “believes,” “could,” “seeks,” “estimates,” “intends,” “may,” “plans,” “potential,” “predicts,” “projects,” “should,” “will,” “would” or similar expressions and the negatives of those terms. Forward-looking statements involve known and unknown risks, uncertainties and other factors that may cause our actual results, performance or achievements to be materially different from any future results, performance or achievements expressed or implied by the forward-looking statements. Forward-looking statements represent our management’s beliefs and assumptions only as of the date of this presentation. You should read the prospectus filed with the Securities and Exchange Commission (the “SEC”) on April 7, 2014, including the Risk Factors set forth therein and the documents that we have filed as exhibits to the registration statement, of which the prospectus is a part, and any further disclosures we make on related subjects in our quarterly reports on Form 10-Q and current reports on Form 8-K filed with the SEC completely and with the understanding that our actual future results may be materially different from what we expect. Except as required by law, we assume no obligation to update these forward-looking statements publicly, or to update the reasons actual results could differ materially from those anticipated in the forward-looking statements, even if new information becomes available in the future.
This presentation includes certain non-GAAP financial measures as defined by SEC rules. We have provided a reconciliation of those measures to the most directly comparable GAAP measures, which is available in the Appendix.
In this presentation, unless the context otherwise requires, financial results and operating metrics (i) prior to the merger on August 8, 2013 reflect the combined historical results for GrubHub and Seamless, which operated as separate companies, and (ii) on or after August 8, 2013 reflect the results of GrubHub Inc. (the merged company).
Safe Harbor Statement

Company Overview Matt Maloney - CEO

4
Our Mission is to Make Takeout Better
Hungry Diners Restaurants

5
Largest Online and Mobile Takeout Marketplace
$78
$119
$170
$39 $59
2011 2012 2013 Q1 2013 Q1 2014
Combined Revenues (MM)
Combined Adjusted EBITDA
(MM)
$6 $10
$40
$6
$16
2011 2012 2013 Q1 2013 Q1 2014
(1) As of Q1 2014
$1.7B Gross Food Sales - Run rate (1)
181,200 Daily Average Grubs (1)
3.85 MM Active Diners (1)
~30,000 / 700 Restaurants (1) Cities (1)
+49% Y/Y
+192% Y/Y

6
Massive, Untapped & Highly Fragmented Market
(1) Based on data from a 2013 industry report prepared by Euromonitor International and our analysis of such data
(2) Based on 2013 GrubHub Gross Food Sales relative to the $67Bn takeout market in 2012 and GrubHub’s size relative to competitors based on ComScore data on total visits to online delivery websites from the three months ended January 31, 2014
(3) Commission rate represents a range of GrubHub Inc. commission rates
(1)
Independent restaurants (1)
350,000 Spent by consumers on
takeout annually (1)
$67B ~95%
Paper Menus and Phones
~5% Online
$8.5 - $9.5B Total U.S. Addressable Market
13% - 14% commission rate (3)
Online vs. call-in takeout orders (2)

7
Takeout: Broken for Restaurants
Reaching Hungry Diners is Difficult
Marketing Requires Upfront Expense
Limited Technology Expertise
Capital and Resource Constrained

8
Takeout: Broken for Diners
Limited Choices
Frustrating Phone Calls
Long Hold Times
Error-Prone

9
GrubHub Makes Takeout Better

10
Why Restaurants Love GrubHub
Low Risk, High Return
Insight from Order Data
Reach New Customers
Higher Margin Takeout
More Orders at Full Menu Prices

11
Superior Service
Control and Transparency
Free to Use
Convenience
Expanded Choices
Why Diners Love GrubHub
12
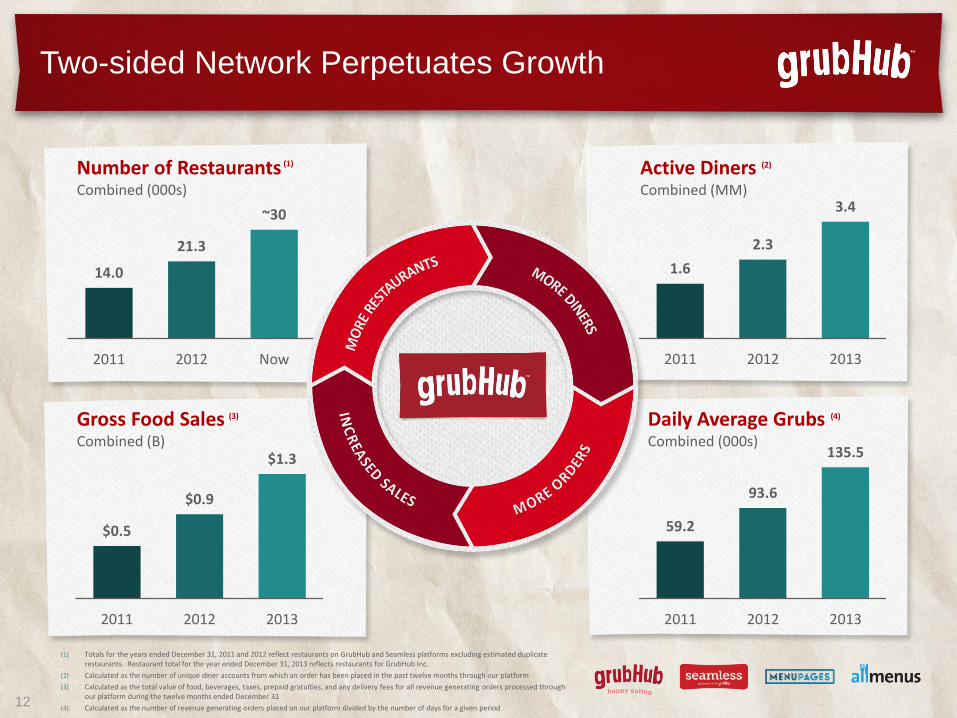
Two-sided Network Perpetuates Growth
(1) Totals for the years ended December 31, 2011 and 2012 reflect restaurants on GrubHub and Seamless platforms excluding estimated duplicate restaurants. Restaurant total for the year ended December 31, 2013 reflects restaurants for GrubHub Inc.
(2) Calculated as the number of unique diner accounts from which an order has been placed in the past twelve months through our platform
(3) Calculated as the total value of food, beverages, taxes, prepaid gratuities, and any delivery fees for all revenue generating orders processed through our platform during the twelve months ended December 31
(4) Calculated as the number of revenue generating orders placed on our platform divided by the number of days for a given period
$0.5
$0.9
$1.3
2011 2012 2013
Gross Food Sales (3) Combined (B)
Number of Restaurants (1)
Combined (000s)
14.0
21.3
~30
2011 2012 Now
Active Diners (2) Combined (MM)
1.6
2.3
3.4
2011 2012 2013
59.2
93.6
135.5
2011 2012 2013
Daily Average Grubs (4) Combined (000s)

13
Corporate Mobile Restaurant Technology
Delivery Driver Tools
Long History of Product Innovation
14
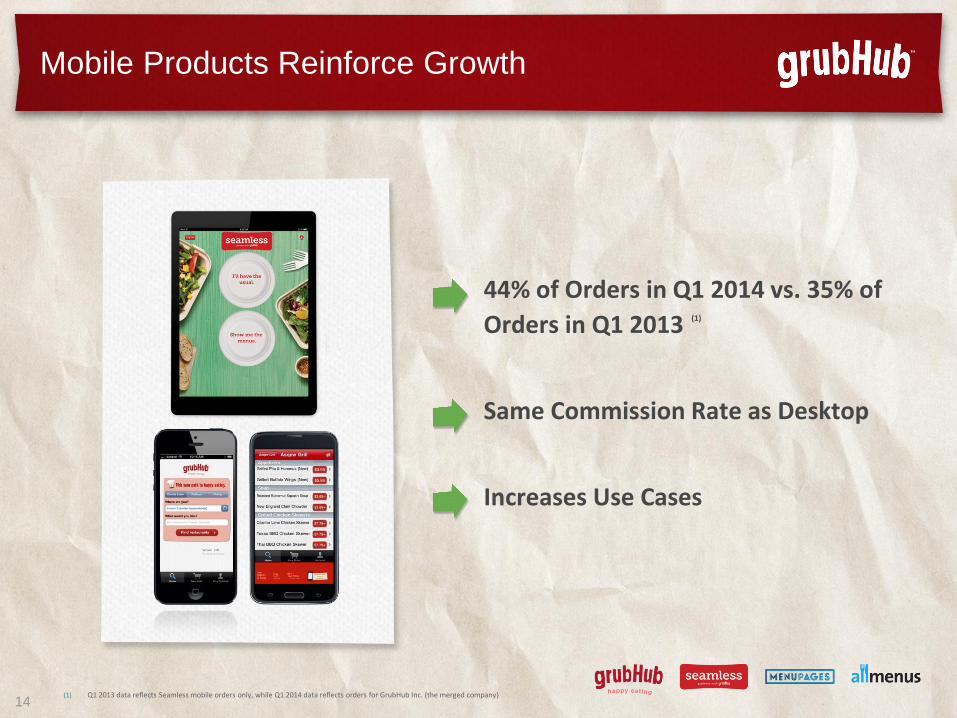
44% of Orders in Q1 2014 vs. 35% of
Orders in Q1 2013
(1)
Same Commission Rate as Desktop
Increases Use Cases
Mobile Products Reinforce Growth
(1) Q1 2013 data reflects Seamless mobile orders only, while Q1 2014 data reflects orders for GrubHub Inc. (the merged company)

15
$16
$27
$31
2011 2012 2013
Combined Advertising Spend
(MM)
Multi-channel Strategy Reaches Potential Diners On and Offline
National and Local Outreach
Substantial Awareness Opportunity
Marketing Raises Awareness

16
More Efficient Marketing and Sales
Unparalleled Geographic Reach
Scale and Growth
Product and Technology Fit
GrubHub & Seamless = Massive Scale, Reach and Growth

17
Restaurant-Driven Pricing
Restaurants Decide their own Pricing
Restaurants can Impact Placement with Pricing
GrubHub Historically seen Improvement of Take-rates in Markets over Time
Launched on Seamless in April 2014 with Promising Results

Financials Adam DeWitt - CFO

19
Strong Financial Model
Demonstrated Profitability and Operating Leverage
Capital Efficient
Strong Growth
Transactional Model at Scale

20
1.6
2.3
3.4
2.6
3.9
2011 2012 2013 Q12013
Q12014
Active Diners Combined (MM)
59.2
93.6
135.5 129.1
181.2
2011 2012 2013 Q12013
Q12014
Daily Average Grubs Combined (000s)
Consistent Growth in Key Metrics…
+40% Y/Y +49% Y/Y

21
$78
$119
$170
$39
$59
2011 2012 2013 Q12013
Q12014
…Has Led to Strong Topline Growth
Combined Revenue (MM)
$0.5
$0.9
$1.3
$0.3
$0.4
2011 2012 2013 Q12013
Q12014
Gross Food Sales Combined (B)
+49% Y/Y +44% Y/Y

22
Attractive Unit Economics
Credit Card Processing
Care and Operations
Other Processing 74%
Incremental Margin
26%(1) 100%
Net Revenue
74% Incremental Margin per Order
(1) Reflects operations and support as a percentage of revenues for Q1 2014

23
Robust Operating Leverage
2011 2012 2013 Q1 2014
Revenue 100% 100% 100% 100%
Sales and Marketing 35% 36% 28% 27%
Operations and Support 26% 28% 27% 26%
Technology 11% 13% 11% 9%
General & Administrative 26% 18% 14% 14%
Adjusted EBITDA Margin (2) 8% 9% 23% 28%
(1) Financial results (i) prior to the merger on August 8, 2013 reflect the combined historical results for GrubHub and Seamless, which operated as separate companies, and (ii) on or after August 8, 2013 reflect the results of GrubHub Inc. (the merged company) . Please note individual lines will not sum to 100% as categories include stock-based compensation
(2) Adjusted EBITDA is defined as net income adjusted to exclude merger and restructuring costs, income taxes, depreciation and amortization and stock-based compensation expense
Combined Financials (1)
(%)

24
Strong Conversion to Cash Flow
$16.4
$26.0
AdjustedEBITDA
CashTaxes
Change inWorkingCapital
CapEx FCF
($0.4)
$12.2
(1)
(2)
(1)
($2.2)
(1) CapEx represents the combined purchases of property and equipment and capitalized web development in Q1 2014.
(2) Represents the working capital of GrubHub Inc. as of March 31, 2014 minus the working capital as of December 31, 2013.
Business Funds Itself – Negative Working Capital
Low CapEx Requirements
No Debt
Free Cash Flow – Q1 2014
(MM)

Appendix

26
($MM) CY 2011 CY 2012 CY 2013 Q1 2013 Q1 2014
Net Income $2.0 ($2.3) $1.5 $0.7 $4.4
Income Taxes (2) ($5.2) $0.8 $8.1 $0.8 $3.9
Depreciation and Amortization $4.7 $8.2 $15.0 $2.4 $5.5
EBITDA $1.5 $6.8 $24.6 $3.9 $13.7
Merger and Restructuring costs (3) — — $9.3 $0.8 $0.3
Stock-based Compensation $1.2 $3.6 $5.8 $1.0 $2.4
Common Stock Redemption $3.5 — — — —
Adjusted EBITDA $6.2 $10.4 $39.7 $5.6 $16.4
Reconciliation of Adjusted EBITDA (1)
(1) Financial results (i) prior to the merger on August 8, 2013 reflect the combined historical results for GrubHub and Seamless, which operated as separate companies, and (ii) on or after August 8, 2013 reflect the results of GrubHub Inc. (the merged company). Financial results also exclude non-cash acquisition adjustments related to stock-based compensation
(2) The increase in income tax expense was primarily attributable to a reversal of deferred tax liability of $8.4MM in 2011 associated with the June 2011 sale of preferred stock to SLW Investors, LLC offset by 2011 income tax paid of $2.2MM, which represents the income tax expense from January 1, 2011 through May 31, 2011. For the period January 1, 2012 through October 27, 2012, the Company was a pass-through entity for income tax purposes. Immediately following the Merger Date, 100% of our taxable income is subject to income tax
(3) Merger and restructuring costs include transaction and integration related costs, such as legal and accounting costs, associated with the Merger, and restructuring costs

27
(MM unless otherwise noted) Q1 2013 Q2 2013 Q3 2013 Q4 2013 2013 Total Q1 2014
Active Diners – End of Period (000s) 2,577 2,782 3,050 3,421 3,421 3,851
Daily Average Grubs (000s) 129.1 130.1 129.8 152.9 135.5 181.2
Gross Food Sales (000s) $300.0 $306.7 $309.2 $370.0 $1,285.9 $433.0
Net Revenue $39.4 $40.7 $41.0 $49.0 $170.1 $58.6
Operating Expenses (1)
Sales and Marketing 14.9 10.6 10.4 12.4 48.3 16.1
Operations and Support 10.7 10.8 11.2 12.9 45.6 15.1
Technology 4.3 4.2 5.1 5.6 19.2 5.3
Depreciation & Amortization 2.4 2.6 4.1 6.0 15.0 5.5
General & Administrative 4.8 5.2 5.9 7.1 23.1 8.0
Total Operating Expenses $37.2 $33.4 $36.7 $43.9 $151.2 $50.1
Operating Pre-tax Income $2.2 $7.3 $4.3 $5.1 $18.9 $8.5
Merger and Restructuring Costs (2) 0.8 6.7 1.7 0.2 9.3 0.3
Total Pre-tax Income $1.5 $0.6 $2.6 $4.9 $9.6 $8.2
Adjusted EBITDA (3)
$5.6 $10.8 $10.3 $13.0 $39.7 $16.4
Unaudited Combined Financials – 2013 & 2014
(1) Excludes non-cash acquisition adjustments related to stock-based compensation
(2) Includes transaction, integration and restructuring related costs associated with the merger of GrubHub and Seamless, which operated as separate companies until August 8, 2013
(3) Excludes deal and restructuring costs and stock-based compensation expense

28
Unaudited Combined Financials – 2012
(1) Excludes non-cash acquisition adjustments related to stock-based compensation
(2) Includes transaction, integration and restructuring related costs associated with the merger of GrubHub and Seamless, which operated as separate companies until August 8, 2013
(3) Excludes deal and restructuring costs and stock-based compensation expense
(MM unless otherwise noted) Q1 2012 Q2 2012 Q3 2012 Q4 2012 2012 Total
Active Diners – End of Period (000s) 1,779 1,922 2,109 2,321 2,321
Daily Average Grubs (000s) 89.3 89.4 90.5 105.9 93.6
Gross Food Sales (000s) $204.3 $205.6 $211.5 $249.6 $871.0
Net Revenue $28.0 $28.4 $29.5 $33.1 $118.9
Operating Expenses (1)
Sales and Marketing 10.0 10.5 9.7 11.9 42.2
Operations and Support 7.7 8.2 8.1 9.1 33.2
Technology 3.2 4.1 4.2 4.2 15.7
Depreciation & Amortization 1.9 2.0 2.2 2.1 8.2
General & Administrative 5.5 5.3 4.9 5.4 21.0
Total Operating Expenses $28.4 $30.1 $29.1 $32.7 $120.3
Operating Pre-tax Income ($0.4) ($1.8) $0.3 $0.4 ($1.5)
Merger and Restructuring Costs (2) – – – – –
Total Pre-tax Income ($0.4) ($1.8) $0.3 $0.4 ($1.5)
Adjusted EBITDA (3)
$2.4 $1.3 $3.3 $3.4 $10.4


![[PPT]EUROMONITOR CAPABILITIES - TIKZN · Web viewA presentation compiled by Euromonitor Internationalfor Export week KZN. October 2017. About Euromonitor. ABOUT EUROMONITOR INTERNATIONAL](https://img.pdfslide.us/doc/110x75/5b2684ad7f8b9a53228b465d/ppteuromonitor-capabilities-web-viewa-presentation-compiled-by-euromonitor.jpg)


![Presentación Euromonitor [EDocFind.com]](https://img.pdfslide.us/doc/110x75/577d37a11a28ab3a6b960b75/presentacion-euromonitor-edocfindcom.jpg)