Embed Size (px)
Citation preview
1616 P St. NW Washington, DC 20036 202-328-5000 www.rff.org
June 2012 RFF DP 12-25
The Health Effects of Coal Electricity Generation in India
Maureen Cr opper , Shama Gam khar , Kabi r Ma l i k ,
Al ex L im onov, and I an Par t r idge
DIS
CU
SS
ION
PA
PE
R
© 2012 Resources for the Future. All rights reserved. No portion of this paper may be reproduced without
permission of the authors.
Discussion papers are research materials circulated by their authors for purposes of information and discussion.
They have not necessarily undergone formal peer review.
The Health Effects of Coal Electricity Generation in India
Maureen Cropper, Shama Gamkhar, Kabir Malik, Alex Limonov, and Ian Partridge
Abstract
To help inform pollution control policies in the Indian electricity sector we estimate the health
damages associated with particulate matter, sulfur dioxide (SO2), and nitrogen oxides (NOx) from
individual coal-fired power plants. We calculate the damages per ton of pollutant for each of 89 plants
and compute total damages in 2008, by pollutant, for 63 plants. We estimate health damages by
combining data on power plant emissions of particulate matter, SO2 and NOx with reduced-form intake
fraction models that link emissions to changes in population-weighted ambient concentrations of fine
particles. Concentration-response functions for fine particles from Pope et al. (2002) are used to estimate
premature cardiopulmonary deaths associated with air emissions for persons 30 and older. Our results
suggest that 75 percent of premature deaths are associated with fine particles that result from SO2
emissions. After characterizing the distribution of premature mortality across plants we calculate the
health benefits and cost-per-life saved of the flue-gas desulfurization unit installed at the Dahanu power
plant in Maharashtra and the health benefits of coal washing at the Rihand power plant in Uttar Pradesh.
Key Words: coal-fired power plants, particulate matter, electricity, health damages, pollution
control, concentration-response function, India
JEL Classification Numbers: Q01, Q51, A53
Contents
I. Introduction ......................................................................................................................... 1
II. Overview of the Indian Power Sector .............................................................................. 3
Plant Thermal Efficiency and Coal Quality ........................................................................ 4
Environmental Regulations Affecting Air Emissions......................................................... 6
III. Emissions and Emissions Intensity of Existing Plants .................................................. 7
IV. Health Damages from Coal-Fired Power Plants ......................................................... 10
The Intake Fraction Approach to Estimating Health Damages ........................................ 10
Application of the Intake Fraction Approach to Indian Power Plants .............................. 12
V. Policy Implications of Our Results ................................................................................. 14
Health Benefits and Costs of Using Washed Coal............................................................ 15
Health Benefits and Costs of a Flue-Gas Desulfurization Unit ........................................ 16
VI. Conclusions and Caveats ............................................................................................... 17
References .............................................................................................................................. 19
Appendix. Calculation Methodologies and Sources of Data ............................................. 22
Tables and Figures ................................................................................................................ 27
Resources for the Future Cropper et al.
1
The Health Effects of Coal Electricity Generation in India
Maureen Cropper, Shama Gamkhar, Kabir Malik, Alex Limonov, and Ian Partridge
I. Introduction
Throughout the world, thermal power plants, in addition to emitting greenhouse gases,
are a major source of local pollution and health damages. This is especially true of coal-fired
power plants, which generate 41 percent of the world’s electricity (IEA 2008). In the United
States, after three decades of regulation, coal-fired power plants were estimated to cause between
10,000 (NRC 2010) and 30,000 (Levy et al. 2009) deaths annually, due to emissions of sulfur
dioxide (SO2), nitrogen oxides (NOx) and directly emitted particulate matter (PM).1 In the United
States, the benefits of further reducing emissions from coal-fired power plants have been
thoroughly studied (Banzhaf et al. 2004; Levy et al. 2007; Muller and Mendelsohn 2009; USEPA
2005). The purpose of this paper is to shed light on the health benefits of reducing emissions
from coal-fired power plants in India, a country where 70 percent of electricity is generated from
coal.
The regulation of power plant emissions raises several policy questions: the first is which
pollutants should be targeted and how stringently they should be regulated. In the United States,
regulation has focused on sulfur dioxide (SO2) to control fine particles and on nitrogen oxides
(NOx) to control fine particles and reduce ground-level ozone. In India, environmental
regulations limit particulate emissions, and two states have begun to establish markets to control
directly emitted particulate matter.2 However there are no direct limitations on emissions of SO2
or NOx from coal-fired power plants. An important question is whether more emphasis should be
placed on controlling SO2 and NOx.
Cropper, University of Maryland and Resources for the Future; Gamkhar, University of Texas, Austin; Malik,
University of Maryland; Limonov, Resources for the Future; Partridge, University of Texas, Austin. We would like
to thank Jonathan Levy and Nick Muller for helpful comments. We also thank the following individuals for
enriching our understanding of the Indian power sector: AK Gupta (Central Electricity Authority), Rajiv Misra (PTC
India Ltd.), Amarjeet Singh (Central Electricity Authority), Ruchi Soni (World Bank).
1 The NAS figure is based on emissions in 2005. Levy et al. (2009) is based on emissions data from 1999.
According to NRC (2010), if 2005 emissions data were used by Levy et al., the death figure would be approximately
30,000.
2 ―India to Unveil Emissions Trading Scheme February 1,‖ The Economic Times, January 27, 2011.
Resources for the Future Cropper et al.
2
The answer to this question depends on the benefits of reducing emissions from these
pollutants relative to the costs. To help determine this, we estimate the health damages associated
with SO2, NOx and directly emitted fine particles (PM2.5) from individual power plants in India.
Our analysis suggests that most deaths attributable to power plants in India are associated with
SO2, followed by NOx and directly emitted PM. The average number of deaths per plant
associated with each pollutant in 2008 was approximately 500 for SO2, 120 for NOx and 30 for
PM2.5. Whether this implies that more emphasis should be placed on controlling SO2 and NOx
depends on the cost of measures to control these pollutants and upon how effective various
measures would be in reducing emissions. Although we do not examine pollution control costs in
detail, we provide illustrative calculations that suggest that scrubbers to reduce SO2 emissions
are likely to pass the benefit-cost test at some plants.
A second policy question is what instruments should be used to regulate pollution: should
India rely on a cap-and-trade program, as in the United States, or on an emissions tax? If a
pollution permit program is used, should permits trade one-for-one, or should they trade at ratios
that reflect differences in marginal damages across plants? The answer to this question depends
on how much the damages per ton of SO2, NOx and PM2.5 vary across plants. In the United
States, Muller and Mendelsohn (2009) argue that the efficiency of SO2 reduction could be
increased significantly by taking differences in marginal damages into account. Our analysis
suggests that this is not the case for India. In India, the mean number of deaths per thousand tons
of SO2 is 10, and the 5th
and 95th
percentile are 7 and 12 deaths per thousand tons respectively.
(The standard deviation is 2 deaths.)3 The reason for the small variation in damages per ton in
India is that health damages depend heavily on population density: there is much more variation
in population density across power plants in the United States than in India.
To estimate the health damages associated with coal-fired power plants we have
assembled a database of coal characteristics and usage, electricity generation and emissions for
92 coal-fired power plants for the years 2000–2008. We estimate the health impacts of directly
emitted fine particles, sulfates and nitrates based on emissions for the year 2008. To calculate the
impact of emissions on ambient air quality, we estimate intake fractions for each category of
emissions. An intake fraction measures the change in population-weighted ambient
concentrations of a pollutant (e.g., PM2.5) per unit of primary pollutant emitted from a pollution
3 The range of damages per ton of SO2 across coal-fired power plants in the United States is much greater, with the
standard deviation of damages per ton equal to approximately half the mean (NRC 2010).
Resources for the Future Cropper et al.
3
source. We estimate intake fractions using equations generated by Zhou et al. (2006) using
Chinese data that relate the intake fraction of each pollutant to the population surrounding each
power plant and meteorological conditions. Concentration-response functions for fine particles
from Pope et al. (2002) are used to estimate premature deaths associated with air emissions.
After characterizing the distribution of premature mortality across plants we calculate the
reduction in mortality and cost-effectiveness of two options to reduce power plant emissions—
washing coal to reduce ash content and installing a flue-gas desulfurization unit (scrubber).
According to some calculations (Zamuda and Sharpe 2007), coal washing actually pays for itself.
We calculate the health benefits and cost-per-life saved of reducing the ash content of coal at the
Rihand power plant in Uttar Pradesh. Similar calculations are made for the flue-gas
desulfurization unit installed at the Dahanu power plant in Maharashtra.
The paper is organized as follows: The next section presents an overview of the Indian
power sector, including a discussion of Indian coal production and the environmental regulations
facing power plants. Section 3 describes our database and presents summary statistics on the
thermal efficiency of power plants, characteristics of coal consumed and amount and intensity of
pollutants emitted, by plant. The impacts of emissions on premature mortality are described in
section 4. Section 5 summarizes the policy implications of our findings, and section 6 concludes.
II. Overview of the Indian Power Sector
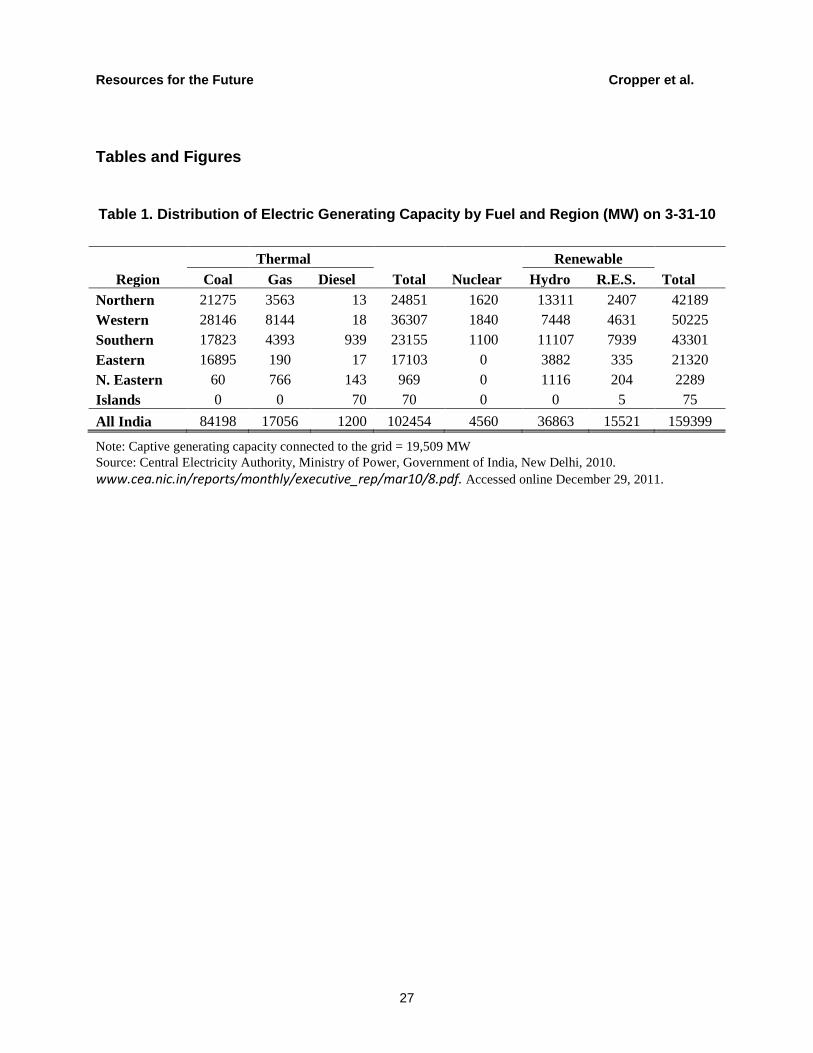
In 2010, India had approximately 179 gigawatts (GW) of installed electric capacity.4
Table 1 shows the breakdown of installed capacity by fuel type and region. Coal-fired power
plants accounted for 53 percent and natural gas plants for 11 percent of installed capacity;
however, thermal power plants accounted for 83 percent of electricity generated (CEA 2010).
Figure 1 maps the location of coal-fired capacity by state.
Most generating capacity in India is government owned. The 1948 Electricity Supply Act
created State Electricity Boards (SEBs) and gave them responsibility for the generation,
transmission, and distribution of power, as well as the authority to set tariffs. SEBs operated on
soft budgets, with revenue shortfalls made up by state governments. Electricity tariffs set by
SEBs failed to cover costs, generating capacity expanded slowly in the 1960s and 1970s, and
blackouts were common. To increase generating capacity, the Government of India in 1975
4 This represents capacity connected to the grid, including 19,509 MW of captive generation.
Resources for the Future Cropper et al.
4
established the National Hydroelectric Power Corporation and the National Thermal Power
Corporation, which built generating capacity and transmission lines that fed into the SEB
systems. In 1990, 63 percent of installed capacity in the electricity sector in India was owned by
SEBs, 33 percent by the central government, and 4 percent by private companies (Tongia 2003).
In 1991, legislation was passed to encourage independent power producers (IPPs) to enter
the electricity market, in accordance with the government’s broader macroeconomic
liberalization and privatization agenda. The Electricity Acts of 1998 and 2003 led to the creation
of a Central Electricity Regulatory Commission (CERC) and similar regulatory bodies at the
state level (the SERCs). The Acts also paved the way for the unbundling of generation,
transmission, and distribution functions; the privatization of distribution companies; and the
restructuring of the electricity tariff structure. Currently, private companies (including IPPs) own
14 percent of generation capacity in India; however, they own a smaller share (9 percent) of
coal-fired generation capacity. Thirty-eight percent of coal-fired capacity is owned by the central
government and 53 percent is state owned (CEA 2010).
Plant Thermal Efficiency and Coal Quality
Coal-fired power plants in India are, in general, less efficient than their counterparts in
the United States. Thermal efficiency is typically measured by the net output of an electricity
generating unit expressed as percent of the heat input used (net thermal efficiency), or by
operating heat rate—the heat input (in kcal) required to produce a kWh of electricity. The
average net efficiency of coal-fired power plants in India is currently below 28 percent (see
Table 5). In 2008, the U.S. coal-fired power plant fleet had a generation-weighted average
efficiency of 32.5 percent, while the top 10 percent of the fleet had an efficiency of 37.6 percent,
five percentage points higher (DOE 2010). The average operating heat rate of the coal-fired
power plants in our database in 2008 (see Table 5) is 2,856 kcal/kWh, which is 20 percent higher
than the average operating heat rate of subcritical plants in the United States during the period
1960–1980 (Joskow and Schmalensee 1987).
The higher average operating heat rates of Indian plants are due in part to the poor quality
of Indian coal but also to inefficiencies in management. The design heat rate of generating units
that use coal with high moisture and/or high ash content is higher than for units with low
moisture and ash content (MIT 2007). The ash content of Indian coal is between 30 and 50
percent. This implies that Indian plants will require more energy to produce a kWh of electricity
than comparable plants in the United States. The operating heat rate of the plant—the actual
number of kcal of thermal energy required to produce a kWh—may be higher than the design
Resources for the Future Cropper et al.
5
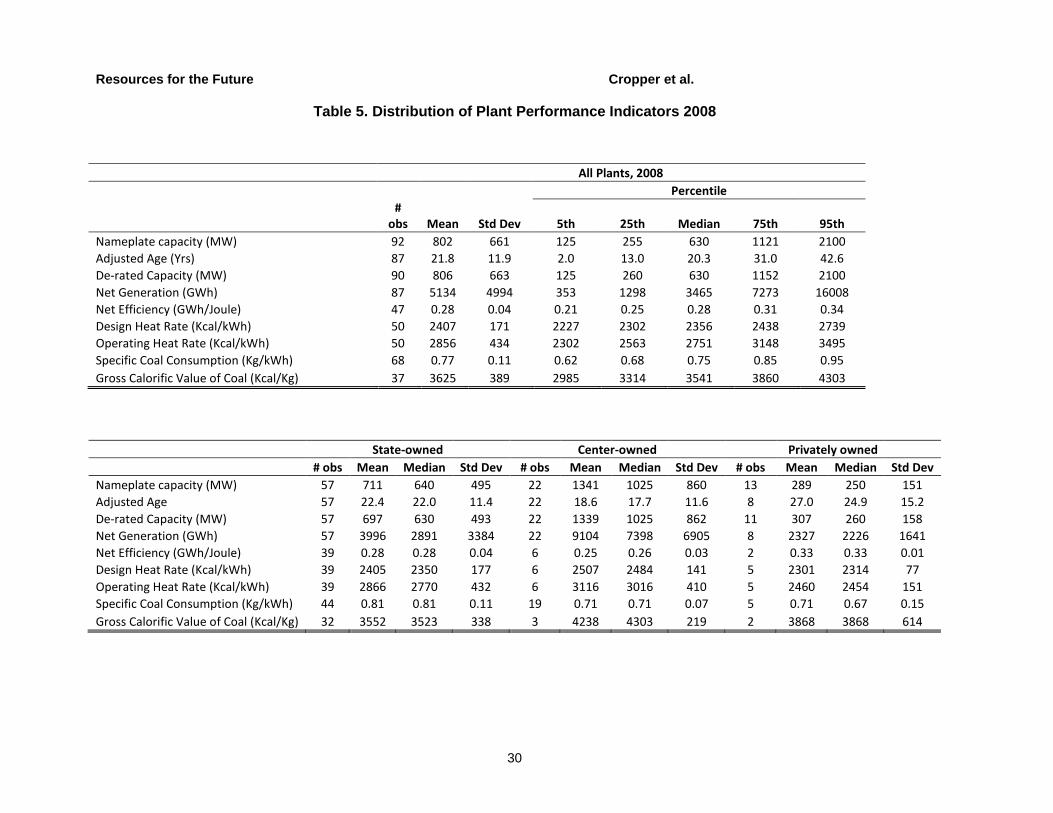
heat rate if the plant is poorly maintained or experiences frequent outages.5 For the 50 coal-fired
power plants for which we have data in 2008, operating heat rates are, on average, 18 percent
higher than design heat rates. Privately owned plants have, on average, lower operating heat rates
and smaller deviations of operating from design heat rates than do state-owned plants.
Indian coal also has much lower heating value than coal mined in the United States or
China. One consequence of the low heating value of Indian coal is that, ceteris paribus, more
coal is used to produce a kWh of electricity in India than in other countries. The coal
consumption per kWh of electricity (in kg/kWh) equals, by definition, a plant’s operating heat
rate (kcal/kWh) divided by the heating value of its coal (kcal/kg). Ninety percent of the coal used
to generate electricity in India is domestic coal with a heating value between 2,700 and 4,400
kcal/kg.6 The heating value of coal mined in the eastern United States is between 6,000 and
7,300 kcal/kg (MIT 2007). It is lower in the western United States (4,600–4,700 kcal/kg) and
slightly higher in China (4,600–6,000 kcal/kg) (MIT, 2007). The end result of higher operating
heat rates and the use of coal with lower heating value is that approximately 770 grams of coal
are burned to produce one kWh of electricity in India, in contrast to values half as large in the
United States and China.7
The pollution intensity of Indian power plants (i.e., grams of pollutant per kWh) also
depends on the ash and sulfur content of the coal burned. Indian coal has high ash content,
between 35 and 50 percent by weight, and lower sulfur content: about 0.5 percent by weight.
Based on data from the late 1990s , Garg et al. (2002) report a consumption-weighted ash content
of 45 percent; Reddy and Venkataraman (2002) report a consumption-weighted ash content of 39
percent. The corresponding figures for sulfur are 0.51 percent (Garg et al. 2002) and 0.59 percent
(Reddy and Venkataraman 2002). Information on the distribution of ash and sulfur across
individual plants is more difficult to obtain. A chemical analysis of coal at five Indian plants in
1998 by researchers at Ohio State University (Ohio Supercomputer Center) revealed a range of
ash contents from 26 to 47 percent (with an average of 39 percent) and sulfur contents from 0.33
to 0.8 percent (average 0.48 percent). To put these numbers in perspective, the ash content of
5 Whenever a plant is started up after an outage, more coal is burned than during the normal operation of the plant.
6 This is the range of values reported in our database for 2008. The Future of Coal (MIT 2007) reports a range of
3,000–5,000 kcal/kg for Indian coal.
7 A study by Ohio State University reports 360 g/kWh for Ohio coal, with a heating value of 6,378 kcal/kg. A study
quoted by the World Resources Institute (WRI) reports 345 g/kWh in China.
Resources for the Future Cropper et al.
6
eastern U.S. coal in the same year ranged from 7.5 to 20 percent, and the sulfur content from 1.0
to 2.5 percent.8
The high ash content of Indian coal may lead to high PM emissions. Although all coal
plants in India have electrostatic precipitators (ESPs), the high ash content of coal and its
chemical composition reduce their removal efficiency (CPCB 2007). There is also the problem
of fly ash disposal. Approximately 100 million tons of fly ash is generated annually. The ash is
stored in ponds and poses a hazard to surface water sources from runoff and to ground water
from percolation. Our analysis does not quantify the health costs associated with fly ash disposal.
Environmental Regulations Affecting Air Emissions
In India, the primary responsibility for issuing and enforcing environmental regulations
lies with the State and Central Pollution Control Boards, which fall under the State and Central
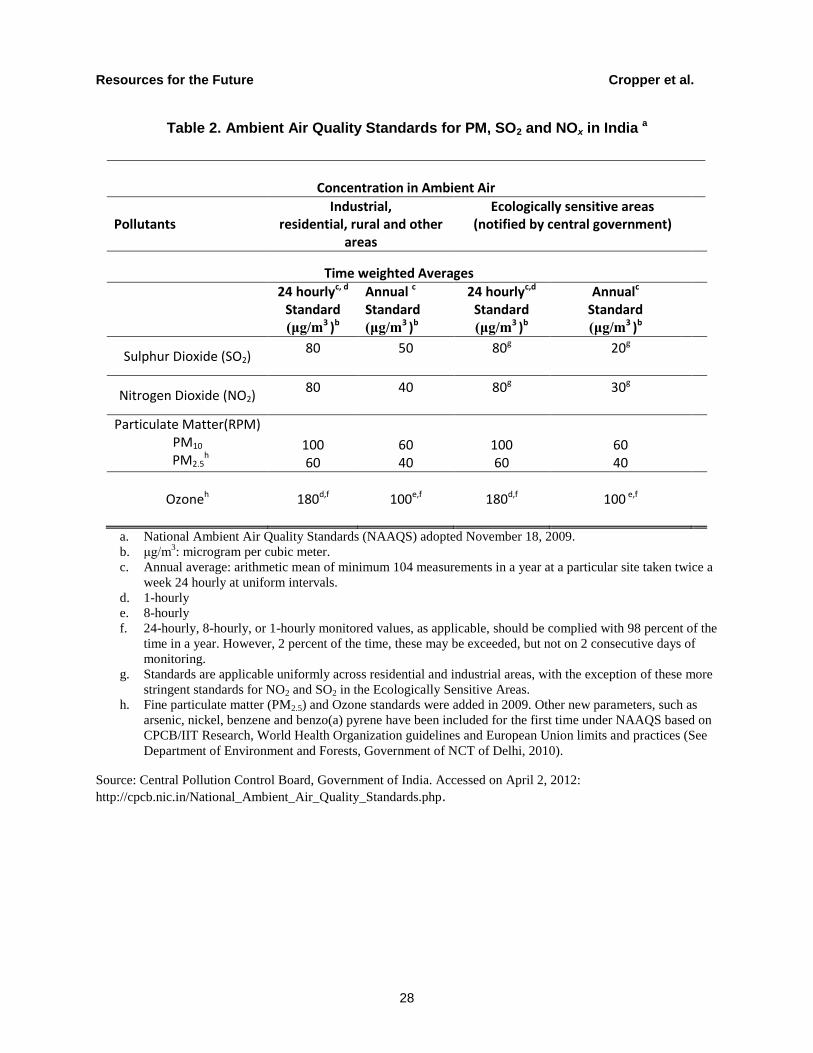
Ministries of Environment and Forests (MoEF) (Chikkatur 2008). The current federal ambient
air quality standards for particulates, SO2, NOx and ozone are listed in Table 2. The State and
Central Pollution Control Boards are responsible for achieving ambient standards, but
implementation plans similar to those in the United States are required only for 24 ―critically
polluted‖ areas and 17 cities (Narain 2008).
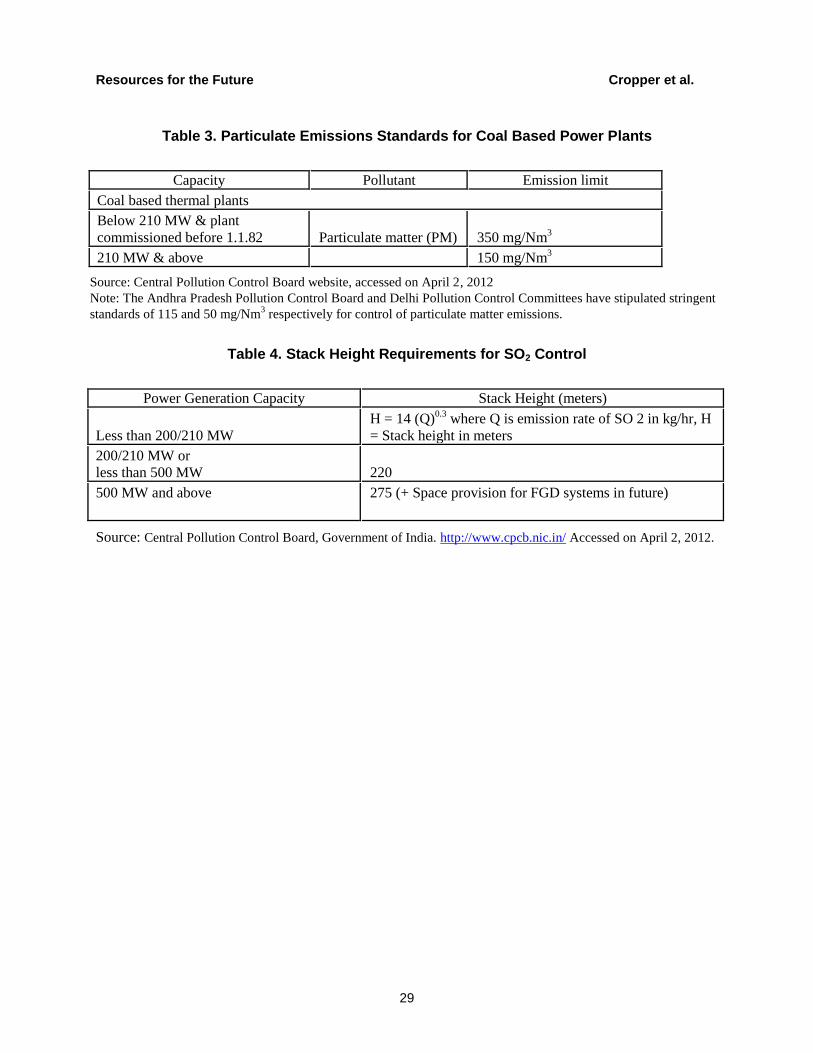
The CPCB issues emissions regulations for highly polluting industries, including power
plants.9 Particulate emissions are affected indirectly by coal washing requirements and directly
by emission limits (see Table 3). Beginning in 2002, the use of coal with ash content exceeding
34 percent was prohibited in any thermal power plant located more than 1,000 km from the
pithead or in urban or sensitive or critically polluted areas. At the time the regulation was issued,
it was estimated to affect approximately 24 GW of installed capacity.10
In practice, the standard
is achieved by blending washed and unwashed coal (or imported coal) to reduce average ash
content to 34 percent. Zamuda and Sharpe (2007) estimate that in 2005-2006, only 5 percent of
8 Reliance on coal from the Appalachian and Illinois basins in the United States has declined over time. Currently,
30 percent of coal comes from the Powder River Basin in southeastern Montana and northeastern Wyoming. PRB
coal has a sulfur content below 0.5 percent, and a lower ash (and heat) content than coal mined in the eastern US
(MIT 2007).
9 We focus in this section on regulations that affect air emissions. Thermal power plants are also subject to
Environmental Impact Assessments before they are built and must meet standards for the discharge of water used for
cooling and for disposal of fly ash (http://www.cpcb.nic.in/divisionsofheadoffice/pci2/ThermalpowerPlants.pdf).
10 See http://www.cpcb.nic.in/divisionsofheadoffice/pci2/ThermalpowerPlants.pdf.
Resources for the Future Cropper et al.
7
domestic coal used in power plants was washed. They also note that beneficiation plants were
operating at only 44 percent of capacity.
The emission limits for total suspended particulates listed in Table 3 are concentration
limits. Historically, they have been violated by a significant fraction of plants: in 2000–2001, 63
percent of plants did not comply with these standards; in 2006-07, 28 percent of plants failed to
comply (Chikkatur and Sagar 2007).
There are no emission limits for sulfur dioxide or for nitrogen oxides for coal-fired power
plants.11
SO2 concentrations are affected primarily by minimum stack height requirements and
the requirement that electricity generating units of 500 MW or more leave space for a flue-gas
desulfurization (FGD) unit (see Table 4). Generating units between 210 and 500 MW must have
stacks of at least 220 meters; units greater than 500 MW must have stacks at least 275 meters in
height. Currently only one plant (Dahanu) has installed a flue-gas desulfurization unit.
III. Emissions and Emissions Intensity of Existing Plants
To examine the air pollution impacts of coal-fired power plants, we have constructed a
dataset on the operating characteristics of all coal-fired plants that report to the Central
Electricity Authority of India (CEA).12
The result is an unbalanced panel of 92 thermal power
plants, located in 17 states, for the years 2000–2008.13
Our analysis focuses on the year 2008.14
In that year we have 57 state owned, 22 central government owned and 13 privately owned
plants, which constituted 88 percent of the total installed coal-fired generation capacity in the
country.
11 Officials at the Central Electricity Authority report that most plants have low-NOx burners, although this is not
required by law (CEA personal communication 2011).
12 The CEA annually publishes the Thermal Power Review, which describes the operating characteristics of all
state- operated thermal power plants in India and provides some data on central government and privately-owned
plants.
13 All years in our dataset are Indian fiscal years. Thus 2000 refers to the time period April 1, 2000 through March
30, 2001. Our data on emissions begin in 2000. Data on plant characteristics are available beginning in 1994 (see
Cropper et al. 2011).
14 All information in Tables 5–8 is based on the year 2008. Calculations based on averages for the period 2006–
2008 produced very similar results.
Resources for the Future Cropper et al.
8
Table 5 presents summary statistics on operating characteristics of plants, for all plants
and for plants by type of ownership.15
The table underscores the points made above regarding the
thermal efficiency of coal-fired power plants and Indian coal: net thermal efficiency, averaged
across all plants, is 27.7 percent. The average heating value of coal is approximately 3,625
kcal/kg; and, on average, 770 grams of coal are burned to produce one kWh of electricity. A
comparison of operating heat rates and heating value of coal by ownership status is difficult, as
data are often missing for privately owned plants and for plants operated by the National
Thermal Power Corporation (NTPC). The table does, however, suggest that state owned plants
consume significantly more coal per kWh than do private and central government plants.
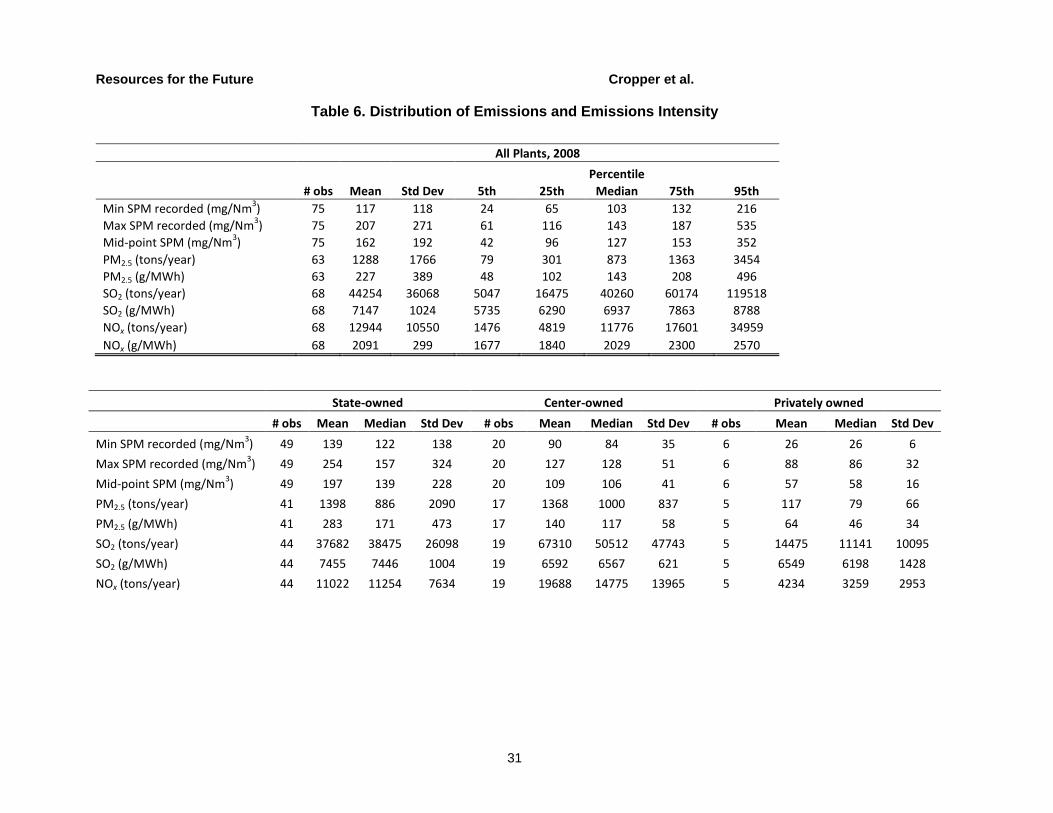
The CEA reports total suspended particulate (SPM) concentrations, measured in mg per
normal cubic meter of flue gases (mg/Nm3) in its annual thermal power sector reports.
Concentrations for each plant are reported as a range. Table 6 reports summary statistics for the
upper and lower ends of this range, as well as the midpoint of the range, for 2008. The midpoint
of the emissions range is below the 150 mg/Nm3 standard for three-quarters of the 74 plants for
which data are available. Data are not randomly missing: they are missing for 62 percent of
private plants, 23 percent of state plants and 14 percent of central government owned plants.
Subject to these caveats, it is clear that emission concentrations are, on average, lowest at
privately owned plants, and lower at central government owned plants than they are at state
owned plants. The difference in concentration rates between state and centrally owned plants
disappears, however, once the vintage of generating equipment and the heating value of coal are
held constant.
A simple regression of the logarithm of the midpoint of SPM concentrations in flue gas
on the average age of generating equipment, average age squared, heating value of coal and
ownership dummies explains 51 percent of the variation in concentration rates. Concentration
rates are lower the higher the heating value of coal and increase (at a decreasing rate) with the
vintage of generating equipment. Evaluated at mean plant age, a one year increase in the age of
electrical generating unit (EGU) raises particulate concentrations by about 3.5 percent. An
increase in the heating value of coal by 1,000 kcal/kg is associated with a 0.25 percent reduction
in SPM concentrations. Concentrations are significantly lower at private plants than at state
15 Central plants are plants operated by the central government, including National Thermal Power Corporation
(NTPC) plants.
Resources for the Future Cropper et al.
9
plants, but there is no statistically significant difference between state and centrally owned plants
when age and heating value are held constant.
Table 6 also presents summary statistics on annual tons of particulate matter, SO2 and
NOx emitted, as well as on the emissions intensity (in kg of pollutant per MWh) of these
pollutants.16
To convert SPM concentration rates into tons of SPM emitted per year requires data
on annual coal usage as well as assumptions about the volume of flue gases per ton of coal
burned. (Our calculations are described in detail in the Appendix.) Results are presented for
emissions of PM2.5, assuming a ratio of PM2.5/SPM of 0.29. Calculating sulfur emissions requires
data on the sulfur content of coal as well as on coal consumption. Since this is not available at
the plant level, we calculate emissions based on the default value of 0.5 percent sulfur by weight
for all plants. Our calculations of NOx emissions are based on information provided by the CEA
that NOx concentrations in flue gases are about 400 ppm with a limited range of variation
between plants.
The quantity of pollutants a plant emits each year reflects the total electricity generated
by that plant, the amount of coal it uses per kWh, and its emissions per ton of coal burned.
Pollution intensity (i.e. quantity of pollutant per kWh generated) reflects kg of coal per kWh and
emissions per ton of coal burned. For all three pollutants, pollution intensity is lower at private
than at state or central government owned plants. The pollution intensity of SO2 emissions is, on
average, higher at Indian than at U.S. coal-fired power plants, in spite of the low sulfur content
of Indian coal. The median SO2 pollution intensity at U.S. plants in 2005 was 8.9 pounds per
MWh; the mean was 12.3 pounds per MWh (NRC 2010): at Indian plants, (see Table 6) the
median SO2 intensity is 15.3 pounds per MWh; the mean is 15.7 pounds per MWh. This reflects
the smaller amount of coal burned per MWh in the United States and the fact that over one-
quarter of U.S. coal-fired plants have scrubbers. The average pollution intensity of NOx
emissions is also higher at the plants in our database than at plants in the United States. On
average, NOx intensity at U.S. plants in 2005 was 4.10 pounds per MWh, compared with 4.6
pounds per MWh for Indian plants (see Table 6).
16 SO2 and NOx emissions data are missing for plants for which coal consumption data are missing. PM2.5 emissions
data are missing if either coal consumption data or SPM data are missing.
Resources for the Future Cropper et al.
10
IV. Health Damages from Coal-Fired Power Plants
Measuring the health effects of air pollution emissions requires estimating the impact of
emissions on ambient air quality and using dose-response functions to relate population-
weighted changes in concentrations to health endpoints. We estimate intake fractions—the
change in population-weighted ambient concentrations of a pollutant—for directly emitted
particles and for secondary sulfates and nitrates using relationships established by Zhou et al.
(2006) for China. The resulting changes in population-weighted ambient concentrations are
translated into premature deaths using Pope et al. (2002).
The Intake Fraction Approach to Estimating Health Damages
An intake fraction measures the change in population-weighted ambient concentrations of
a pollutant (e.g., PM2.5) per unit of primary pollutant emitted from a pollution source. For
example, if Q is emissions of PM2.5 from a power plant in grams per second, ΔCi is the change in
ambient PM2.5 in grid cell i resulting from Q, Pi is the population of the grid cell and BR is the
average breathing rate, then the intake fraction is defined as:
(1) QBRCPIF i
i
i /][ ,
where the sum in (1) is taken over all grid cells for which ΔCi is greater than 0.17
If the
average annual intake fraction for PM2.5 for a power plant were 1x10⁻⁵
, this would mean that for
every metric ton of PM2.5 emitted by the plant, 10 grams are inhaled by the exposed population.
The IF corresponding to an air pollution source depends on the distribution of population
around the source, on meteorological conditions, and on characteristics of the source that affect
{ΔCi/Q}. For power plants, source characteristics include stack height, stack diameter and exit
velocity. Meteorological conditions include wind speed and direction, temperature, and the
concentration of ammonia in the atmosphere.
Rather than modeling intake fractions by running an atmospheric dispersion model for
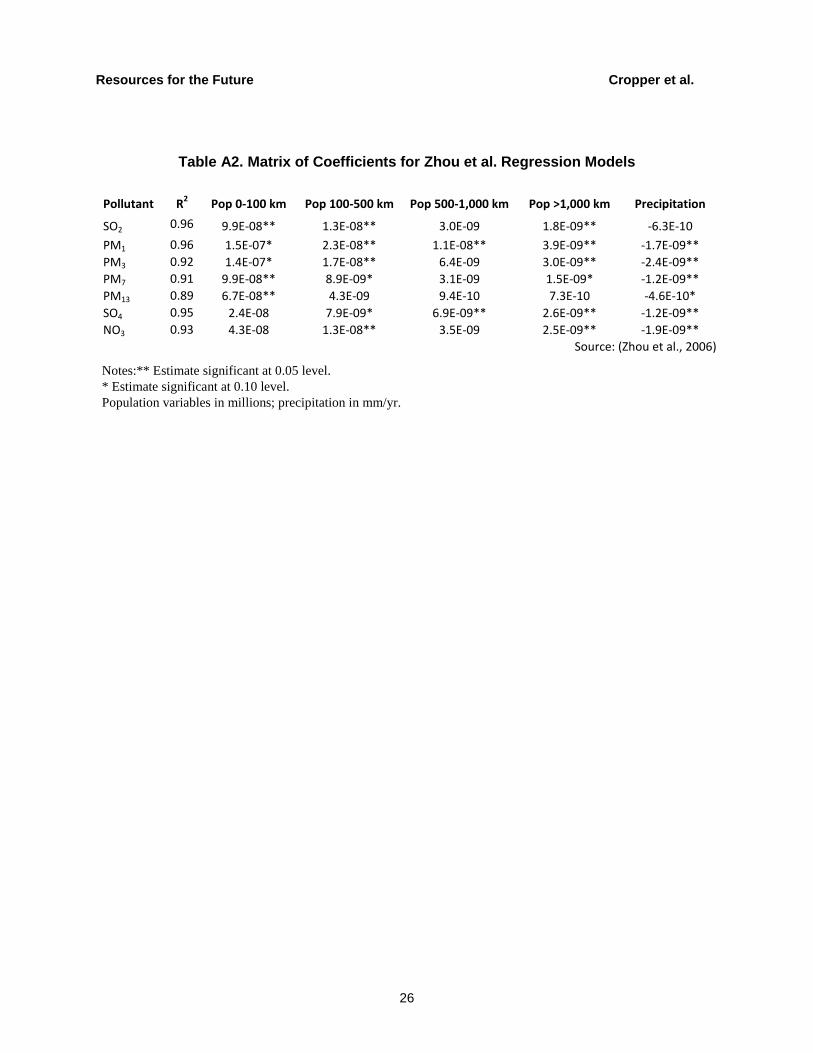
each power plant, we estimate intake fractions using the results of Zhou et al. (2006). Zhou et al.
(2006) use a Lagrangian plume model (CALPUFF) to estimate the impact of an 800 MW coal-
17 In Zhou et al. (2006) the average breathing rate is 20 m
3 per day.
Resources for the Future Cropper et al.
11
fired power plant with fixed design characteristics on air quality (i.e., {ΔCi}) in 29 locations in
China. IFs are calculated for PM1, PM3, PM7, PM13, SO2, ammonium sulfate, and ammonium
nitrate. For each pollutant, the authors regress the annual average intake fraction on the
population in concentric annuli around each plant and on annual precipitation at the plant (in
mm/year). The R2s range from 0.96 (for PM1) to 0.89 (for PM13). (See Table A2 of the
Appendix.) We use these equations to predict intake fractions for Indian power plants. (Details of
this transfer are described in the Appendix.)
The validity of these transfers depends on the similarity between the characteristics of the
plant in Zhou et al. (2006) and Indian power plants.18
Zhou et al. (2006) use a plant with two
stacks of 4 and 7 meters in diameter and 210 meters in height. Because damages per ton of
pollutant generally decrease with stack height (Muller and Mendelsohn 2007), this will tend to
overstate the impacts of power plants with taller stacks and underestimate the impacts of power
plants with shorter stacks. Zhou et al. (2006) estimate the impact of the plant on ambient air
quality using a modeling domain 3,360 km by 3,360 km. We examine the impact of each power
plant in our database on an area that includes India, Pakistan, Bangladesh and Sri Lanka.
Once the intake fraction has been estimated for a particular source and pollutant, it can be
used to calculate health impacts. Rearranging equation (1), the population-weighted average
change in ambient concentrations,
i
i
i CPi
i
i CP
, is given by
(2)
i
i
i CPBRQIF / .
Thus, once IF has been calculated and annual emissions (Q) are known,
i
i
i CP
can be
calculated. In most epidemiological studies of the health effects of air pollution, the relative risk
(RR) of death or illness associated with a change in pollutant concentration is given by
(3) )exp( i
ii CPRR ,
where β is estimated from an epidemiological study. The number of cases (E) of premature
mortality or illness associated with i
i
i CP is given by
18 It also depends on similarity in meteorological conditions such as wind speed and direction, which are more
difficult to compare.
Resources for the Future Cropper et al.
12
(4) BaseCasesRRRRE )/)1(( ,
implying that (RR-1)/RR is the fraction of existing cases attributable to the source.
Application of the Intake Fraction Approach to Indian Power Plants
We calculate premature mortality associated with the emissions from each power plant,
compared to no emissions, using cardiopulmonary mortality coefficients from Pope et al. (2002).
Because Pope et al. (2002) relate premature mortality to PM2.5, we convert estimates of SPM to
PM2.5 assuming a ratio of PM2.5 to SPM of 0.29 (USEPA AP-42). We use SO2 and NOx
emissions for each power plant to estimate the contribution of the plant to sulfates and nitrates,
which we add to directly emitted PM2.5.
Choice of Concentration-Response Function
The effects of air pollution on human health include the chronic effects of long-term
exposure and the acute effects of short-term exposure. In the past two decades, a large number of
studies—especially short-term, time-series studies—have reported concentration-response
relationships between air pollution exposure and premature mortality. Long-term cohort studies
provide the best method of evaluating the chronic effects of air pollution on human health,
whereas time-series studies are appropriate for revealing the acute effects of short-term
fluctuations in pollution levels. Concentration-response coefficients from cohort studies of
premature mortality are typically several times higher than coefficients reported in time-series
studies. It is assumed that the short-term effects found in time-series studies are embedded in the
long-term effects on mortality rates derived from cohort studies.
As of this writing, only a few time-series studies relating air pollution to mortality have
been conducted in India (Cropper et al. 1997; Health Effects Institute 2011). The most recent
studies—in Ludhiana, Delhi, and Chennai—are part of the Health Effects Institute’s Public
Health and Air Pollution in Asia (PAPA) program. These studies find similar impacts of PM10 on
daily mortality as time-series studies conducted in the United States (the NMMAPS (National
Morbidity, Mortality, and Air Pollution Study)) and Europe (the APHEA project) (HEI 2011).
There are, however, no studies that capture the effects of long-term exposure to particulate
matter on mortality in India. Thus we must rely on concentration-response transfer.
The prospective cohort study by Pope et al. (2002) added measurements of air pollution
levels (fine particles in 50 cities and sulfates in 151 cities) to data on approximately 500,000
individuals in a prospective cohort assembled by the American Cancer Society. The study, which
followed adults aged 30 and over, relates all-cause, cardiopulmonary and lung cancer mortality
Resources for the Future Cropper et al.
13
to annual average PM2.5 using a Cox proportional hazard model. Separate coefficients are
reported for exposures in 1979–1983 and 1999–2000.
Transferring all-cause mortality coefficients from Pope et al. (2002) to India may be
inappropriate for two reasons: the levels of PM2.5 in India are higher than in the United States,
and the distribution of deaths by cause in the United States differs from the distribution in India.
One way to deal with the former problem is to use the Pope et al. (2002) coefficients based on air
pollution readings in the United States in the 1979–1983 period, when average air pollution
levels were higher than in the years 1999–2000. Our analysis is based on the former coefficients.
The similarity of results in time-series studies across cities with very different pollution readings
also lends credence to our analysis. The second problem is handled by transferring impacts from
Pope et al. (2002) by cause of death. The primary impact of air pollution on mortality occurs
through cardiopulmonary mortality (ICD-9 codes 401–440 and 460–519). In the United States in
2007, 42.5 percent of all deaths over the age of 30 were due to cardiopulmonary causes (CDC
2011); the comparable figure for India in 2004 was 41.7 percent (Indiastat). We proceed with
dose-response transfer, based on the cardiopulmonary dose-response coefficient from Pope et al.
(2002).19
In interpreting our results, several points should be kept in mind: the Pope et al. (2002)
study applies only to adults 30 years of age and older. Our estimates therefore do not capture the
impact of air pollution on child deaths.20
We also ignore the impact of air pollution on morbidity.
In this sense, our estimates represent lower bounds to health effects. At the same time, we
calculate the impact of air pollution on premature mortality in India, Pakistan, Bangladesh and
Sri Lanka. Approximately 16 percent of the deaths reported below occur outside of India.
Estimated Deaths Due to Air Pollution from Coal-Fired Power Plants
Table 7 presents summary statistics for the distribution of deaths attributable to directly
emitted PM2.5, SO2 and NOx from the power plants for which emissions data are available. The
average number of deaths associated with current emissions levels, compared to zero emissions,
is approximately 650 per plant per year: approximately 500 deaths are associated with SO2, 120
with NOx and 30 with PM2.5. The table also presents information on the damages per ton of
19 Pope et al. (2002) also find a significant impact of PM2.5 on lung cancer deaths. Lung cancer accounts for less
than one percent of deaths over age 30 in India (Indiastat); hence we ignore this endpoint.
20 Deaths occurring under the age of 30 constitute 28.8 percent of deaths in India.
Resources for the Future Cropper et al.
14
pollutant, which can be calculated for all plants. Damages per ton are, on average, greater for
directly emitted PM2.5 than for SO2 or NOx. There are, on average, 23 deaths per 1,000 tons of
PM2.5, 10 deaths per 1,000 tons of SO2, and 9 deaths per 1,000 tons of NOx.
Two results from Table 7 deserve emphasis: the first is that more deaths are attributable
to SO2 emissions than to either directly emitted particulates or NOx. Although SO2 is associated
with fewer deaths per ton than PM2.5, plants emit many more tons of SO2 than they do of PM2.5.
(Recall that all plants use electrostatic precipitators.) NOx is also associated with more deaths
than PM2.5 for the same reason. This suggests that more emphasis be placed on policies to
control SO2. The second is that the variation in deaths per ton of pollutant across plants is small:
deaths per 1,000 tons of PM2.5 range from 15 (5th
percentile) to 29 (95th
percentile). For SO2,
they range from 7 (5th
percentile) to 12 (95th
percentile). This variation is due solely to
differences in plant location and variation in the size of the population surrounding each plant.
Because we count populations 1,000 (and more) km from a plant—whether people live in India
or elsewhere—differences in exposed populations across plants are not as great as in the United
States.
Table 8 shows deaths associated with air pollution broken down by plant ownership.
While there are few differences in mean deaths per ton of pollution among state, center and
private plants, there are significant differences in deaths per GWh. These reflect differences in
pollution intensity across plants: private plants use, on average, less coal to produce a kWh of
electricity and in the case of particulate emissions, they emit less pollution (on average) per ton
of coal burned than do state- or center-owned plants.
V. Policy Implications of Our Results
Our analysis of health damages associated with power plants can be used to evaluate the
benefits of specific pollution control options. To illustrate how it can be used, we calculate the
benefits of two pollution abatement strategies that are not currently in widespread use in India:
coal washing and installation of a flue-gas desulfurization unit (FGD). Although thermal power
plants located more than 1,000 km from the pithead or in urban or sensitive or critically polluted
areas are required to use coal containing no more than 34 percent ash content (CEA 2010), only
5 percent of non-coking coal is washed (Zamuda and Sharpe 2007). We analyze the costs and
benefits of using washed coal at the Rihand plant in Uttar Pradesh. We also calculate the benefits
of installing a flue-gas desulfurization unit at the Dahanu power plant in Maharashtra (the only
plant to have installed a scrubber) and calculate the cost per premature death avoided.
Resources for the Future Cropper et al.
15
Health Benefits and Costs of Using Washed Coal
Coal washing reduces the ash content of coal and improves its heating value: it also
removes small amounts of other substances, such as sulfur and hazardous air pollutants. The use
of washed coal improves the combustion efficiency of a plant (less coal needs to be burned to
produce electricity). Per unit of heat input, particulate and sulfur emissions are reduced, as are
flyash disposal costs and the cost of transporting coal. Use of washed coal may also reduce plant
maintenance costs and increase plant availability (Zamuda and Sharpe 2007).
We examine the costs and benefits of using washed coal at the Rihand plant, which is
located in a coal-mining area and is thus not currently required to use beneficiated coal. Rihand
is a 2,000 MW plant that in 2008 produced 17,000 GWh of electricity, using coal with a sulfur
content of 0.39 percent and an ash content of 43 percent. We assume that using washed coal
would reduce the ash content of coal burned to 35 percent and the sulfur content to 0.34 percent
and would raise the heating value of coal by 17 percent. Based on information provided by the
CEA, we calculate the levelized cost of electricity generation (lcoe) at Rihand using unwashed
coal to be 1.206 Rs/kWh. We estimate that using washed coal increases the lcoe by 16.5 percent,
to 1.405 Rs/kWh (see Appendix). Our cost analysis focuses only on the yield and direct
operating costs of washing. Other researchers have found that the use of washed coal leads to
significant gains in generation plant availability and plant load factor and reductions in repair
costs (see, for example, Zamuda and Sharpe 2007). Our estimates take no account of these
economic benefits, nor of likely rail freight savings.
The health benefits of coal washing (see Table 9) come from reductions in the ash
content of coal, which reduces PM2.5 emissions, and reductions in sulfur emissions. Tons of
PM2.5 and SO2 emitted are also reduced by the fact that less coal need be burned to generate
electricity. Although coal washing is usually regarded as a measure aimed at reducing SPM
emissions, our analysis indicates that benefits due to the reduction in SO2 far outweigh those of
lower PM2.5 emissions. This is particularly significant because the coal used at Rihand has a
sulfur content of 0.39 percent, which is lower than the average for Indian coal. Our estimates
assume that NOx emissions are essentially proportional to the energy throughput of the boiler.
The assumption of unchanged electricity generation thus implies unchanged emissions of NOx.
The net impact of coal washing on mortality associated with air emissions from the
Rihand plant is to save 251 lives. The increased cost of coal washing is Rs 3.39 billion, implying
a cost per life saved of approximately Rs 13.5 million. This figure falls within the range of
Resources for the Future Cropper et al.
16
estimates of the value of a statistical life (VSL) for India which, conservatively estimated, ranges
from Rs 1 million to Rs 15 million.21
Health Benefits and Costs of a Flue-Gas Desulfurization Unit
Only one Indian power plant—Dahanu, in Maharashtra—is currently fitted with a FGD
(scrubber), although the MOEF stipulates that space be set aside in power plants with 500 MW
and greater capacity to facilitate retrofitting of a FGD (see Table 4). The Dahanu plant is a 500
MW plant located in an environmentally sensitive area. Its SPM emissions are among the lowest
in our database (32.5 mg/Nm3 in 2008). In 2000, the Indian Supreme Court ordered that an FGD
be installed at the plant.
Various scrubber technologies exist: in the United States wet scrubbing is the most
common. The U.S. EPA’s AP-42 database indicates that a wet scrubber can achieve up to 95
percent SO2 removal; equipment suppliers claim SO2 removal efficiencies of up to 99 percent
with additives in the flue gas stream. The Dahanu FGD is a seawater scrubber: this type is
particularly cheap to operate but has a maximum removal efficiency of about 80 percent.22
Capital costs of wet scrubbers range from $100 to $200 per KW while the auxiliary
power required for operation ranges from 1.0 to 3.0 percent of plant output, depending on coal
sulfur level and removal level (MIT 2007). Operating costs of FGD units in the United States
average 0.16 cents/kWh23
and range up to 0.30 cents/kWh depending on sulfur level, removal
efficiency and the costs (or potentially revenues) from disposal of sludge (MIT 2007). Our
analysis of generation costs shows that the retrofitted FGD at Dahanu adds about 9 percent to the
lcoe.24
The Dahanu FGD has very low operating costs, as it employs seawater as the reactant to
absorb SO2 rather than purchased chemicals—a design that obviously can be employed only for
a plant at a coastal location. If the additional operations and maintenance (O&M) cost for a FGD
21 Bhattacharya et al. (2007) report a preferred VSL estimate of Rs 1.3 million (2006 Rs) based on a stated
preference study of Delhi residents. Madheswaran’s (2007) estimate of the VSL based on a compensating wage
study of workers in Calcutta and Mumbai is approximately Rs 15 million. Shanmugam (2001) reports a much higher
value (Rs 56 million) using data from 1990.
22 A useful source is an evaluation of control technologies considered for a power station in Hong Kong (see
http://www.epd.gov.hk/eia/register/report/eiareport/eia_1232006/HTML/Main/Section2.htm). 23 See http://www.eia.gov/cneaf/electricity/epa/epa_sum.html (the EIA Electric Power Annual 2009). 24 Cost data taken from the report of a regulatory hearing before the Maharashtra Electricity Regulatory
Commission dated September 8, 2010.
Resources for the Future Cropper et al.
17
is instead taken as the average figure for the United States, the effect is to increase the lcoe by a
further 6 percent (see Appendix for details).
Assuming coal with 0.5 percent sulfur content and an SO₂ removal rate of 80 percent, the
FGD at Dahanu saves 123 lives per year, at a cost of Rs 3.55 million per life saved. An important
question is how applicable these results are to other power plants. The costs of scrubbing will be
higher at plants employing conventional wet scrubbers—in the neighborhood of 15 percent of
the levelized cost of electricity (see Appendix). Benefits will be lower at plants burning coal with
sulfur content lower than 0.5 percent. The benefits of installing a scrubber with an 80 percent
removal rate will, however, be substantial given the results in Tables 7–9: at the Rihand plant,
approximately 990 statistical lives would be saved. We also note that estimated deaths per ton of
SO2 at the Dahanu plant are among the lowest of all plants in our database.
VI. Conclusions and Caveats
The goal of this paper is to provide bottom-up estimates of the health damages associated
with coal-fired power plants in India and the benefits of reducing emissions of particulate matter,
SO2 and NOx at individual plants. Our analysis of the health effects of air emissions from coal-
fired power plants is a preliminary one, using intake fraction equations derived from power
plants in China to estimate the impact of power plant emissions on population exposures. We
also rely on concentration-response transfer from the United States to estimate impacts on
premature mortality. Because we estimate impacts only for persons aged 30 and older and only
for cardiopulmonary mortality, our estimates are lower-bound estimates of health effects. As is
the case for most estimates of the health effects of air pollution, the weakest part of our analysis
is the atmospheric chemistry linking changes in emissions to changes in population-weighted
exposures. We believe, however, that some conclusions are possible from our study.
Policies to control air pollution from Indian power plants have traditionally focused on
reducing particulate emissions, due to the high ash content of Indian coal. The low sulfur content
of Indian coal has, perhaps, been responsible for failure to directly control SO2 emissions
(Chikkatur and Sagar 2007). This paper suggests that more emphasis should be placed on direct
SO2 controls. The current approach—relying on tall stacks—mirrors the approach taken in the
United States in the 1980s to achieve local air quality standards. Tall stacks cause pollution to be
dispersed but do not eliminate exposure, especially in a densely populated country. Although
Indian coal has lower sulfur content than coal mined in the eastern United States, more coal is
used to produce a kWh hour of electricity in India due to the low heating value of Indian coal.
Resources for the Future Cropper et al.
18
This, combined with the magnitude of SO2 emissions from coal-fired power plants, makes SO2
the main pollutant of concern from a health standpoint.
Whether the use of FGDs to reduce SO2 emissions passes the benefit-cost test depends on
the cost of scrubbers and on plant location. We note that the scrubber installed at the Dahanu
plant in Maharashtra does pass this test (i.e., it has a cost-per-life-saved below estimates of the
value of a statistical life for India), in spite of the fact that the deaths per ton of SO2 associated
with this plant are among the lowest of the 89 plants in our database. Coal washing, which may
pay for itself based on improved combustion efficiency and reduced transportation costs, also has
health benefits due mainly to the lower quantity of coal burned per kWh generated as well as to
small reductions in the sulfur content of coal burned. The percentage reduction in SO2 emissions
due to coal washing at the Rihand plant (see Table 9) is 25 percent. Due to the importance of
sulfates versus directly emitted PM, the reduction in SO2 emissions conveys more health benefits
than the 30 percent reduction in directly emitted PM2.5.
Our estimates can also be used to calculate a lower bound to monetary damages per ton
of PM2.5, SO2 and NOx, given appropriate estimates of the VSL for India. These damages could
be used to calculate pollution taxes, as well as to conduct benefit-cost analyses of specific
pollution control strategies.
Resources for the Future Cropper et al.
19
References
Bhattacharya, Soma; Anna Alberini; and Maureen Cropper. 2007. "The Value of Mortality Risk
Reductions in Delhi, India." Journal of Risk and Uncertainty, 34(1), 21–47.
CDC. 2011. "National Vital Statistics Reports," Center for Disease Control, Vol. 59, No. 4,
Table II.
Central Electricity Authority. 1988–2008. ―Review of Performance of Thermal Power
Stations,‖Government of India, Ministry of Power.
Chikkatur, Ananth P. 2008. "A Resource and Technology Assessment of Coal Utilization in
India," Coal Initiative Series. Pew Center on Global Climate Change.
Chikkatur, Ananth P. and Sagar Ambuj D. 2007. "Cleaner Power in India: Towards a Clean-
Coal-Technology Roadmap," Belfer Center Discussion Paper. Cambridge, MA: Kennedy
School of Government, Harvard University.
Central Pollution Control Board (CPCB), Government of India:
http://cpcb.nic.in/National_Ambient_Air_Quality_Standards.php. Accessed April 2, 2012:
CPCB. 2007. "Assessment of Requirement of Bag Filter Vis a Vis Electrostatic Precipitator in
Thermal Power Plants," Program Objective Series, Probes/105/2007. Central Pollution
Control Board, MoEF.
Cropper, M., Simon, N.B., Alberini, A., Arora, S., and P. K. Sharma. 1997. ―The Health Benefits
of Air Pollution Control in Delhi. American Journal of Agricultural Economics 79:
1625–1629.
Cropper, M., Limonov, A., Malik, K. and A. Singh. 2011. Estimating the Impact of
Restructuring on Electricity Generation Efficiency: The Case of the Indian Thermal
Power Sector. NBER Working Paper No. 17383.
Department of Environment and Forests, Government of NCT of Delhi. (2010) State of
Environment Report for Delhi, 2010. New Delhi: TERI Press.
Garg, A.; M. Kapshe; P. R. Shukla and D. Ghosh. 2002. "Large Point Source (Lps) Emissions
from India: Regional and Sectoral Analysis." Atmospheric Environment, 36(2), 213-24.
Resources for the Future Cropper et al.
20
Health Effects Institute. 2011. "Public Health and Air Pollution in Asia: Coordinated Studies of
Short-Term Exposure to Air Pollution and Daily Mortality in Two Indian Cities," Boston,
MA.
Health Effects Institute. 2011. Public Health and Air Pollution in Asia (PAPA): Coordinated
Studies of Short-Term Exposure to Air Pollution and Daily Mortality in Two Indian
Cities. HEI Research Report 157.
Indiastat.Com: Revealing India—Statistically," New Delhi, India.
IEA. 2008. World Energy Outlook. International Energy Agency.
http://www.iea.org/weo/2008.asp.
Joskow, Paul L. and Richard Schmalensee. 1987. "The Performance of Coal-Burning Electric
Generating Units in the United States: 1960–1980." Journal of Applied Econometrics,
2(2), 85–109.
Levy, Jonathan I.; Lisa K. Baxter and Joel Schwartz. 2009. "Uncertainty and Variability in
Health-Related Damages from Coal-Fired Power Plants in the United States." Risk
Analysis, 29(7), 1000–14.
Levy, Jonathan I.; Andrew M. Wilson and Leonard M. Zwack. 2007. "Quantifying the Efficiency
and Equity Implications of Power Plant Air Pollution Control Strategies in the United
States." Environmental Health Perspectives, 115(5).
Madheswaran, S. 2007. ―Measuring the Value of Statistical Life: Estimating Compensating
Wage Differentials Among Workers in India.‖ Social Indicators Research 84: 83–96.
MIT. 2007. "The Future of Coal: An Interdisciplinary MIT Study," Cambridge,
MA: Massachusetts Institute of Technology.
Muller, Nicholas Z. and Robert Mendelsohn. 2007. "Measuring the Damages of Air Pollution in
the United States." Journal of Environmental Economics and Management, 54(1), 1–14.
Muller, Nicholas Z. and Robert Mendelsohn. 2009. "Efficient Pollution Regulation: Getting the
Prices Right," American Economic Review, 99(5), 1714–39.
Narain, Urvashi. 2008. "Policy Monitor." Review of Environmental Economics and Policy, 2(2),
276–91.
National Research Council. 2010. Hidden Costs of Energy: Unpriced Consequences of Energy
Production and Use. Washington DC: National Academies Press.
Resources for the Future Cropper et al.
21
Ohio Supercomputer Center. 2005. "Anthropogenic Emissions from Energy Activities in India:
Generation and Source Characterization," Program for Computational Reactive
Mechanics, Columbus, Ohio.
Pope, C. Arden, Richard T. Burnett, Michael J. Thun, Eugenia E. Calle, Daniel Krewski,
Kazuhiko Ito, and George D. Thurston. 2002. "Lung Cancer, Cardiopulmonary Mortality,
and Long-Term Exposure to Fine Particulate Air Pollution." JAMA: The Journal of the
American Medical Association, 287(9), 1132–41.
Reddy, M. Shekar and Chandra Venkataraman. 2002. "Inventory of Aerosol and Sulphur
Dioxide Emissions from India: I—Fossil Fuel Combustion." Atmospheric Environment,
36(4), 677–97.
Shanmugam, K.R. 2001. ―Self-Selection Bias in the Estimates o Compensating Wage
Differentials for Job Risks in India.‖ Journal of Risk and Uncertainty, 23(3), 263–275.
Spencer Banzhaf, H., Dallas Burtraw, and Karen Palmer. 2004. "Efficient Emission Fees in the
Us Electricity Sector." Resource and Energy Economics, 26(3), 317–41.
Tongia, R. 2003. "The Political Economy of Indian Power Sector Reforms," Program on Energy
and Sustainable Development Working Paper 4. Stanford University.
USEPA. March 2005. "Regulatory Impact Analysis for the Final Clean Air Interstate Rule,"
EPA-452/R-05-002
Zamuda, C.D., Sharpe, M.A. 2007. ―A Case for Enhanced Use of Clean Coal in India: An
Essential Step Towards Energy Security and Environmental Protection,‖ Workshop on
Coal Beneficiation and Utilization of Rejects. Ranchi, India.
Zhou, Ying, Jonathan I. Levy, John S. Evans, and James K. Hammitt. 2006. "The Influence of
Geographic Location on Population Exposure to Emissions from Power Plants
Throughout China." Environment International, 32(3), 365–73.
Zhou, Ying, Jonathan I. Levy, James K. Hammitt, and John S. Evans. 2003. "Estimating
Population Exposure to Power Plant Emissions Using Calpuff: A Case Study in Beijing,
China." Atmospheric Environment, 37(6), 815–26.
Resources for the Future Cropper et al.
22
Appendix. Calculation Methodologies and Sources of Data
Calculation of Emissions Estimates – Base Case
The CEA Annual Report provides SPM emissions data for most Indian power plants in
mg/Nm3, shown as a range (the highest and lowest actual readings during the year). For each
plant, the midpoint of the range was converted into grams per second using the F-factors method
given in the U.S. Code of Federal Regulations (see 40 CFR Part 60, Appendix A Method 19).
The F-factors calculation is based on the ultimate analysis of the coal used: in the absence of
plant-by-plant data on coal quality, an analysis of a coal sample from the Dadri power station
(made by the U.S. National Energy Technology Laboratory) was used for all locations—this
grade is typical of Indian thermal coals. The Dadri analysis was taken from a study entitled
Anthropogenic Emissions from Energy Activities in India made by the OSU Supercomputer
Center.25
The F-factor calculation requires a value for the oxygen content of flue gas—this was
taken as 4 percent (personal communication from CEA). The resulting emissions rate for SPM
was converted to PM2.5 using data on particle size distribution from the U.S. EPA’s AP-42
methodology.
Emissions of SO2 were estimated assuming that 7.5 percent of sulfur in the coal is
retained in ash with all the rest emitted as SO2 (i.e., emissions of other oxides of sulfur taken as
zero). The 7.5 percent retention figure is the mean of several values found in the literature.
Emissions of NOx were estimated by taking a representative figure of 400 ppm in flue
gas, measured as NO₂ (CEA personal communication).
Emissions and Economics – Coal Washing and FGD Cases
We examined the effects on emissions and generation costs of (a) using washed coal; and
(b) retrofitting flue-gas desulfurization equipment. In both cases the effect on the levelized cost
of electricity (lcoe) was estimated using a model of a representative new 500 MW subcritical
25 See http://www.osc.edu/research/archive/pcrm/emissions/coal.shtml..
Resources for the Future Cropper et al.
23
generation unit in India.26
Key assumptions are described below:
a. Prior studies of the use of washed coal in India focus on economic impact—typical
economic assumptions were provided by the CEA (private communication). An ultimate
analysis of Dadri washed coal made for a USAID project27
was modified to be
compatible with the yield/ash reduction data provided by the CEA. We found that
washing Dadri coal to reduce its ash content by 8 percent increased the lcoe by 17 percent
(c.f. advice received from the CEA that washing increases generation cost by 15–20
percent).
Our cost analysis (and the CEA’s) focuses only on the yield and direct operating costs of
washing. Other researchers have found that the use of washed coal leads to significant
gains in generation plant availability and plant load factor (PLF) and also to reductions in
repair costs (see, for example, Zamuda and Sharpe 2007). Our estimates take no account
of these economic benefits, nor of likely rail freight savings.
The impact of washing on PM2.5 emissions was estimated for an 8 percent reduction in
coal ash content assuming that 80 percent of coal ash goes to fly ash, of which 99.84
percent is removed by the ESP. These percentages are in line with CEA advice and,
averaged over a sample of modern plants, are in line with actual emissions as reported by
the CEA. The impacts on SO₂ and NOx emissions were estimated as described above.
b. The only flue-gas desulfurization unit currently operating in India is located at the
Dahanu plant, in Maharashtra. Information on its capital and operating costs and
additional auxiliary power requirement is given in a regulatory case before the
Maharashtra Electricity Regulatory Commission dated September 8, 2010. Based on
these data, retrofitted FGD adds about 9% to the lcoe. The Dahanu FGD has very low
operating costs as it employs seawater as the reactant to absorb SO₂ rather than purchased
chemicals—a design that obviously can be employed only for a plant at a coastal
location. If the additional operations and maintenance (O&M) cost for a FGD is instead
26 Described in ―What can an analysis of CDM projects tell us about the problem of cutting greenhouse gas
emissions in India?‖ (http://www.webmeets.com/aere/2011/prog/viewpaper.asp?pid=421) by Partridge and
Gamkhar; presented at the conference of the Association of Environmental and Resource Economists, June 2011. 27 See http://www.indiapower.org/igcc/standon.pdf.
Resources for the Future Cropper et al.
24
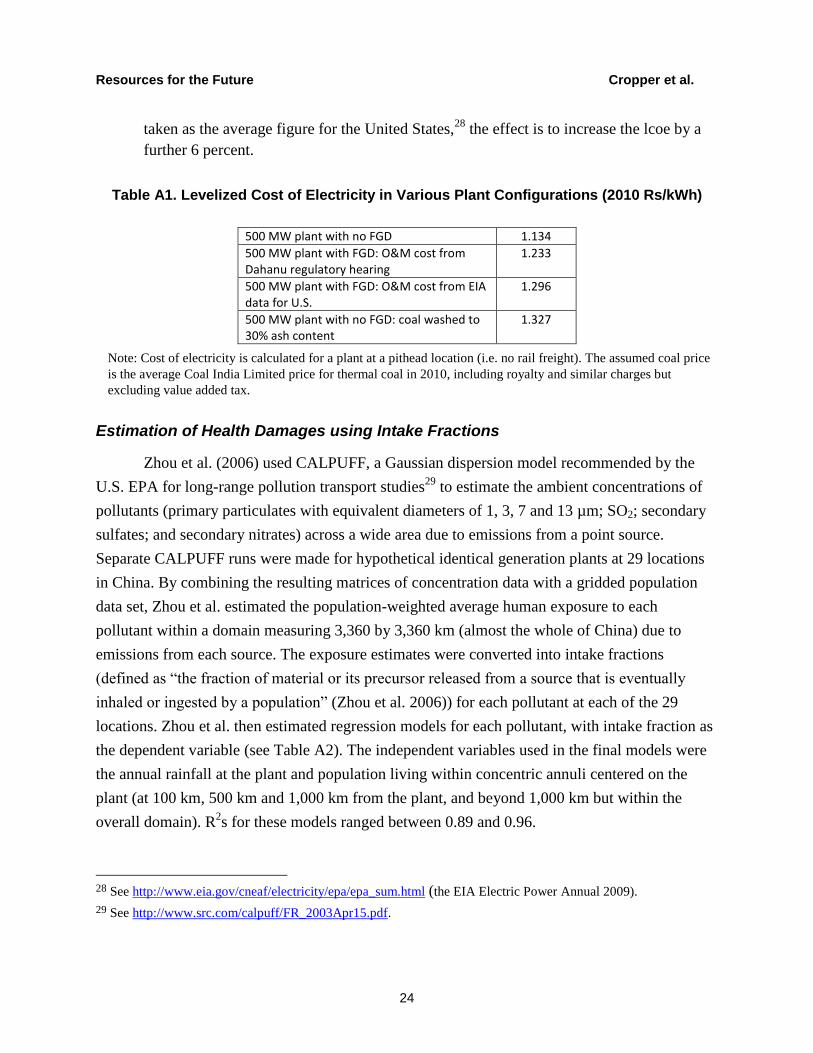
taken as the average figure for the United States,28
the effect is to increase the lcoe by a
further 6 percent.
Table A1. Levelized Cost of Electricity in Various Plant Configurations (2010 Rs/kWh)
500 MW plant with no FGD 1.134
500 MW plant with FGD: O&M cost from Dahanu regulatory hearing
1.233
500 MW plant with FGD: O&M cost from EIA data for U.S.
1.296
500 MW plant with no FGD: coal washed to 30% ash content
1.327
Note: Cost of electricity is calculated for a plant at a pithead location (i.e. no rail freight). The assumed coal price
is the average Coal India Limited price for thermal coal in 2010, including royalty and similar charges but
excluding value added tax.
Estimation of Health Damages using Intake Fractions
Zhou et al. (2006) used CALPUFF, a Gaussian dispersion model recommended by the
U.S. EPA for long-range pollution transport studies29
to estimate the ambient concentrations of
pollutants (primary particulates with equivalent diameters of 1, 3, 7 and 13 µm; SO2; secondary
sulfates; and secondary nitrates) across a wide area due to emissions from a point source.
Separate CALPUFF runs were made for hypothetical identical generation plants at 29 locations
in China. By combining the resulting matrices of concentration data with a gridded population
data set, Zhou et al. estimated the population-weighted average human exposure to each
pollutant within a domain measuring 3,360 by 3,360 km (almost the whole of China) due to
emissions from each source. The exposure estimates were converted into intake fractions
(defined as ―the fraction of material or its precursor released from a source that is eventually
inhaled or ingested by a population‖ (Zhou et al. 2006)) for each pollutant at each of the 29
locations. Zhou et al. then estimated regression models for each pollutant, with intake fraction as
the dependent variable (see Table A2). The independent variables used in the final models were
the annual rainfall at the plant and population living within concentric annuli centered on the
plant (at 100 km, 500 km and 1,000 km from the plant, and beyond 1,000 km but within the
overall domain). R2s for these models ranged between 0.89 and 0.96.
28 See http://www.eia.gov/cneaf/electricity/epa/epa_sum.html (the EIA Electric Power Annual 2009).
29 See http://www.src.com/calpuff/FR_2003Apr15.pdf.
Resources for the Future Cropper et al.
25
Zhou et al. did not use plant characteristics as independent variables as they assumed an
identical plant at each location. However, they made a number of sensitivity analyses using
alternative values for such variables as stack height. These alternative values made little
difference to the results of the analysis, at least within the range (e.g., of stack heights) likely to
be encountered at modern power stations.30
Sensitivities using different assumed emission rates
for pollutants showed that estimated intake fractions remained reasonably constant (Zhou et al.
2006; Zhou et al. 2003).
We used the Zhou et al. regression models to estimate intake fractions for primary PM2.5
and secondary sulfates and nitrates for actual plant locations in India. Population estimates (i.e.,
populations living within 100 km, 500 km and 1,000 km of each plant location) were made using
the Landscan gridded population data set for 2008 maintained by the Oak Ridge National
Laboratory (ORNL).31
The overall domain (used to estimate population beyond 1,000 km) was
taken as the whole of India, Pakistan, Bangladesh, and Sri Lanka. Estimates of annual rainfall are
primarily from Indian data sources, but as these relate mainly to major cities and large towns, in
several cases values had to be interpolated between locations reasonably close to a plant.
The methodology and assumptions used for analysis of health impacts based on these
estimated intake fractions are described in the text of the paper.
30 This is not quite true—runs using different stack heights found significant differences for large primary particles,
but the impact of large particles on human health is limited.
31 See http://www.ornl.gov/sci/landscan/.
Resources for the Future Cropper et al.
26
Table A2. Matrix of Coefficients for Zhou et al. Regression Models
Pollutant R2 Pop 0-100 km Pop 100-500 km Pop 500-1,000 km Pop >1,000 km Precipitation
SO2 0.96 9.9E-08** 1.3E-08** 3.0E-09 1.8E-09** -6.3E-10
PM1 0.96 1.5E-07* 2.3E-08** 1.1E-08** 3.9E-09** -1.7E-09**
PM3 0.92 1.4E-07* 1.7E-08** 6.4E-09 3.0E-09** -2.4E-09**
PM7 0.91 9.9E-08** 8.9E-09* 3.1E-09 1.5E-09* -1.2E-09**
PM13 0.89 6.7E-08** 4.3E-09 9.4E-10 7.3E-10 -4.6E-10*
SO4 0.95 2.4E-08 7.9E-09* 6.9E-09** 2.6E-09** -1.2E-09**
NO3 0.93 4.3E-08 1.3E-08** 3.5E-09 2.5E-09** -1.9E-09**
Source: (Zhou et al., 2006)
Notes:** Estimate significant at 0.05 level.
* Estimate significant at 0.10 level.
Population variables in millions; precipitation in mm/yr.
Resources for the Future Cropper et al.
27
Tables and Figures
Table 1. Distribution of Electric Generating Capacity by Fuel and Region (MW) on 3-31-10
Thermal Renewable
Region Coal Gas Diesel Total Nuclear Hydro R.E.S. Total
Northern 21275 3563 13 24851 1620 13311 2407 42189
Western 28146 8144 18 36307 1840 7448 4631 50225
Southern 17823 4393 939 23155 1100 11107 7939 43301
Eastern 16895 190 17 17103 0 3882 335 21320
N. Eastern 60 766 143 969 0 1116 204 2289
Islands 0 0 70 70 0 0 5 75
All India 84198 17056 1200 102454 4560 36863 15521 159399
Note: Captive generating capacity connected to the grid = 19,509 MW
Source: Central Electricity Authority, Ministry of Power, Government of India, New Delhi, 2010.
www.cea.nic.in/reports/monthly/executive_rep/mar10/8.pdf. Accessed online December 29, 2011.
Resources for the Future Cropper et al.
28
Table 2. Ambient Air Quality Standards for PM, SO2 and NOx in India a
Concentration in Ambient Air
Pollutants Industrial,
residential, rural and other areas
Ecologically sensitive areas (notified by central government)
Time weighted Averages
24 hourlyc, d
Standard (μg/m
3 )b
Annual c
Standard (μg/m
3 )b
24 hourlyc,d Standard (μg/m
3 )b
Annualc Standard (μg/m
3 )b
Sulphur Dioxide (SO2) 80 50 80g 20g
Nitrogen Dioxide (NO2) 80 40 80g 30g
Particulate Matter(RPM) PM10
PM2.5h
100 60
60 40
100 60
60 40
Ozoneh
180d,f
100e,f
180d,f
100 e,f
a. National Ambient Air Quality Standards (NAAQS) adopted November 18, 2009.
b. μg/m3: microgram per cubic meter.
c. Annual average: arithmetic mean of minimum 104 measurements in a year at a particular site taken twice a
week 24 hourly at uniform intervals.
d. 1-hourly
e. 8-hourly
f. 24-hourly, 8-hourly, or 1-hourly monitored values, as applicable, should be complied with 98 percent of the
time in a year. However, 2 percent of the time, these may be exceeded, but not on 2 consecutive days of
monitoring.
g. Standards are applicable uniformly across residential and industrial areas, with the exception of these more
stringent standards for NO2 and SO2 in the Ecologically Sensitive Areas.
h. Fine particulate matter (PM2.5) and Ozone standards were added in 2009. Other new parameters, such as
arsenic, nickel, benzene and benzo(a) pyrene have been included for the first time under NAAQS based on
CPCB/IIT Research, World Health Organization guidelines and European Union limits and practices (See
Department of Environment and Forests, Government of NCT of Delhi, 2010).
Source: Central Pollution Control Board, Government of India. Accessed on April 2, 2012:
http://cpcb.nic.in/National_Ambient_Air_Quality_Standards.php.
Resources for the Future Cropper et al.
29
Table 3. Particulate Emissions Standards for Coal Based Power Plants
Capacity Pollutant Emission limit
Coal based thermal plants
Below 210 MW & plant
commissioned before 1.1.82 Particulate matter (PM) 350 mg/Nm3
210 MW & above 150 mg/Nm3
Source: Central Pollution Control Board website, accessed on April 2, 2012
Note: The Andhra Pradesh Pollution Control Board and Delhi Pollution Control Committees have stipulated stringent
standards of 115 and 50 mg/Nm3 respectively for control of particulate matter emissions.
Table 4. Stack Height Requirements for SO2 Control
Power Generation Capacity Stack Height (meters)
Less than 200/210 MW
H = 14 (Q)0.3
where Q is emission rate of SO 2 in kg/hr, H
= Stack height in meters
200/210 MW or
less than 500 MW 220
500 MW and above 275 (+ Space provision for FGD systems in future)
Source: Central Pollution Control Board, Government of India. http://www.cpcb.nic.in/ Accessed on April 2, 2012.
Resources for the Future Cropper et al.
30
Table 5. Distribution of Plant Performance Indicators 2008
State-owned Center-owned Privately owned
# obs Mean Median Std Dev # obs Mean Median Std Dev # obs Mean Median Std Dev
Nameplate capacity (MW) 57 711 640 495 22 1341 1025 860 13 289 250 151
Adjusted Age 57 22.4 22.0 11.4 22 18.6 17.7 11.6 8 27.0 24.9 15.2
De-rated Capacity (MW) 57 697 630 493 22 1339 1025 862 11 307 260 158
Net Generation (GWh) 57 3996 2891 3384 22 9104 7398 6905 8 2327 2226 1641
Net Efficiency (GWh/Joule) 39 0.28 0.28 0.04 6 0.25 0.26 0.03 2 0.33 0.33 0.01
Design Heat Rate (Kcal/kWh) 39 2405 2350 177 6 2507 2484 141 5 2301 2314 77
Operating Heat Rate (Kcal/kWh) 39 2866 2770 432 6 3116 3016 410 5 2460 2454 151
Specific Coal Consumption (Kg/kWh) 44 0.81 0.81 0.11 19 0.71 0.71 0.07 5 0.71 0.67 0.15
Gross Calorific Value of Coal (Kcal/Kg) 32 3552 3523 338 3 4238 4303 219 2 3868 3868 614
All Plants, 2008
Percentile
#
obs Mean Std Dev 5th 25th Median 75th 95th
Nameplate capacity (MW) 92 802 661 125 255 630 1121 2100
Adjusted Age (Yrs) 87 21.8 11.9 2.0 13.0 20.3 31.0 42.6
De-rated Capacity (MW) 90 806 663 125 260 630 1152 2100
Net Generation (GWh) 87 5134 4994 353 1298 3465 7273 16008
Net Efficiency (GWh/Joule) 47 0.28 0.04 0.21 0.25 0.28 0.31 0.34
Design Heat Rate (Kcal/kWh) 50 2407 171 2227 2302 2356 2438 2739
Operating Heat Rate (Kcal/kWh) 50 2856 434 2302 2563 2751 3148 3495
Specific Coal Consumption (Kg/kWh) 68 0.77 0.11 0.62 0.68 0.75 0.85 0.95
Gross Calorific Value of Coal (Kcal/Kg) 37 3625 389 2985 3314 3541 3860 4303
Resources for the Future Cropper et al.
31
Table 6. Distribution of Emissions and Emissions Intensity
All Plants, 2008
Percentile
# obs Mean Std Dev 5th 25th Median 75th 95th
Min SPM recorded (mg/Nm3) 75 117 118 24 65 103 132 216
Max SPM recorded (mg/Nm3) 75 207 271 61 116 143 187 535
Mid-point SPM (mg/Nm3) 75 162 192 42 96 127 153 352
PM2.5 (tons/year) 63 1288 1766 79 301 873 1363 3454
PM2.5 (g/MWh) 63 227 389 48 102 143 208 496
SO2 (tons/year) 68 44254 36068 5047 16475 40260 60174 119518
SO2 (g/MWh) 68 7147 1024 5735 6290 6937 7863 8788
NOx (tons/year) 68 12944 10550 1476 4819 11776 17601 34959
NOx (g/MWh) 68 2091 299 1677 1840 2029 2300 2570
State-owned Center-owned Privately owned
# obs Mean Median Std Dev # obs Mean Median Std Dev # obs Mean Median Std Dev
Min SPM recorded (mg/Nm3) 49 139 122 138 20 90 84 35 6 26 26 6
Max SPM recorded (mg/Nm3) 49 254 157 324 20 127 128 51 6 88 86 32
Mid-point SPM (mg/Nm3) 49 197 139 228 20 109 106 41 6 57 58 16
PM2.5 (tons/year) 41 1398 886 2090 17 1368 1000 837 5 117 79 66
PM2.5 (g/MWh) 41 283 171 473 17 140 117 58 5 64 46 34
SO2 (tons/year) 44 37682 38475 26098 19 67310 50512 47743 5 14475 11141 10095
SO2 (g/MWh) 44 7455 7446 1004 19 6592 6567 621 5 6549 6198 1428
NOx (tons/year) 44 11022 11254 7634 19 19688 14775 13965 5 4234 3259 2953
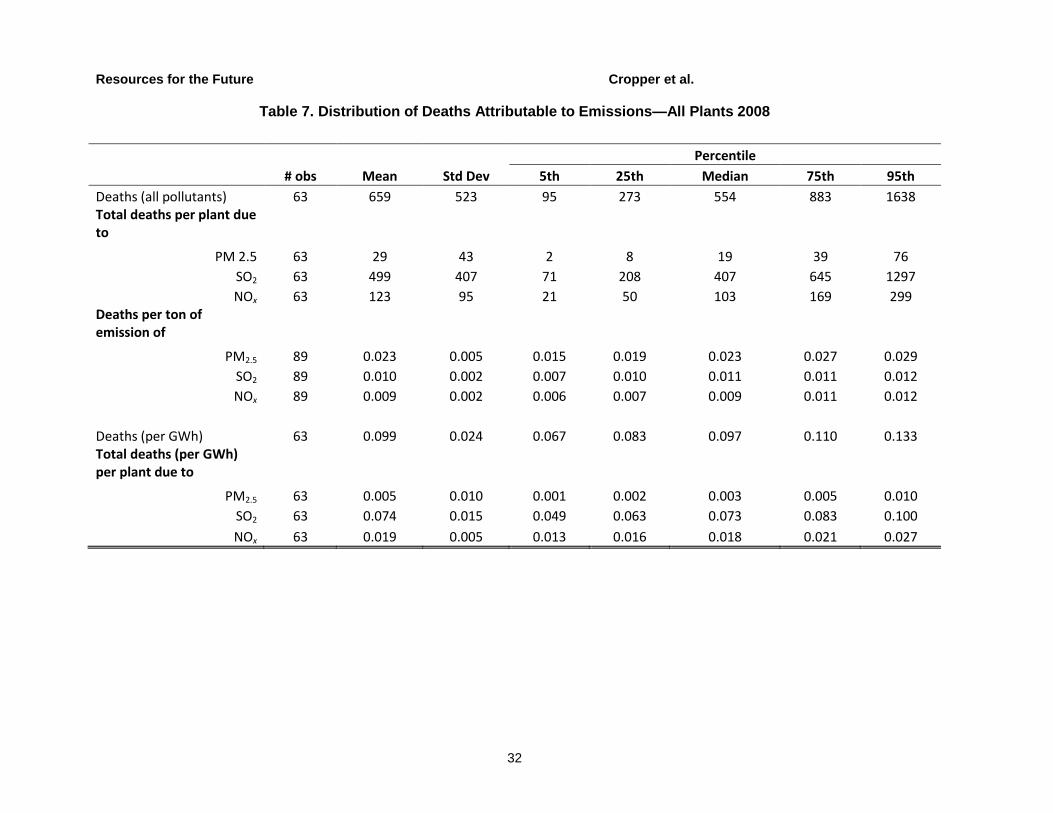
Resources for the Future Cropper et al.
32
Table 7. Distribution of Deaths Attributable to Emissions—All Plants 2008
Percentile
# obs Mean Std Dev 5th 25th Median 75th 95th
Deaths (all pollutants) 63 659 523 95 273 554 883 1638 Total deaths per plant due to
PM 2.5 63 29 43 2 8 19 39 76
SO2 63 499 407 71 208 407 645 1297
NOx 63 123 95 21 50 103 169 299 Deaths per ton of emission of
PM2.5 89 0.023 0.005 0.015 0.019 0.023 0.027 0.029
SO2 89 0.010 0.002 0.007 0.010 0.011 0.011 0.012
NOx 89 0.009 0.002 0.006 0.007 0.009 0.011 0.012
Deaths (per GWh) 63 0.099 0.024 0.067 0.083 0.097 0.110 0.133 Total deaths (per GWh) per plant due to
PM2.5 63 0.005 0.010 0.001 0.002 0.003 0.005 0.010
SO2 63 0.074 0.015 0.049 0.063 0.073 0.083 0.100
NOx 63 0.019 0.005 0.013 0.016 0.018 0.021 0.027
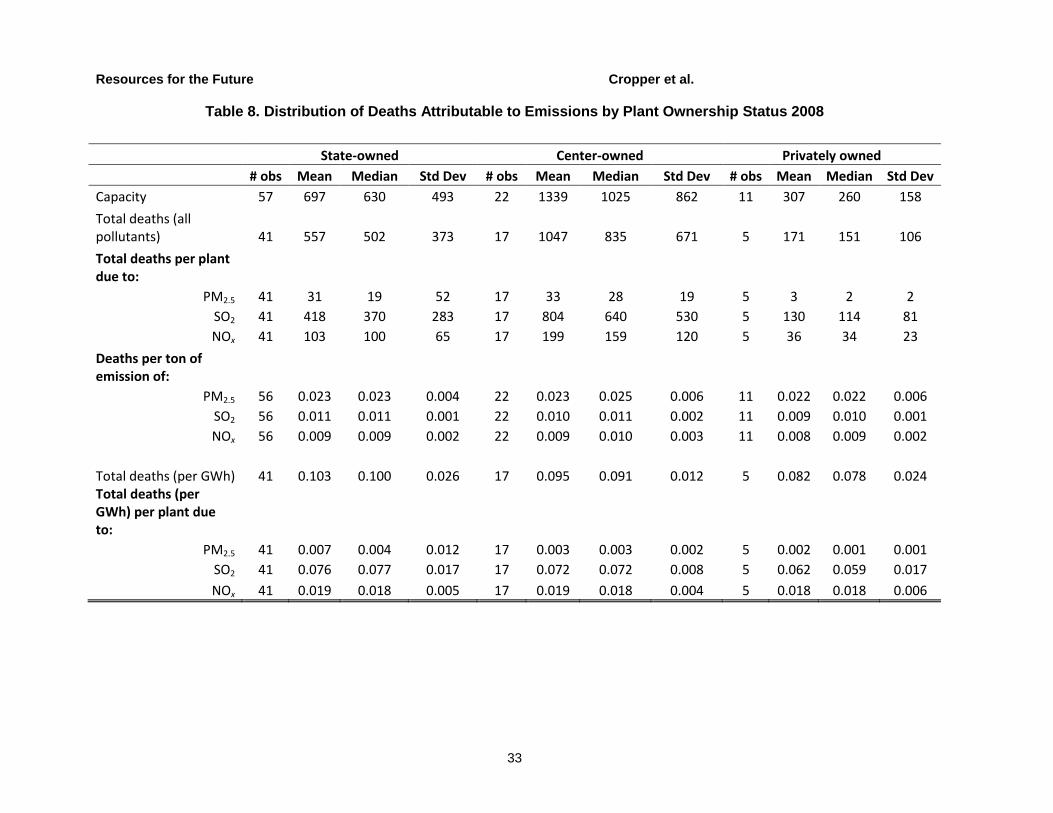
Resources for the Future Cropper et al.
33
Table 8. Distribution of Deaths Attributable to Emissions by Plant Ownership Status 2008
State-owned Center-owned Privately owned
# obs Mean Median Std Dev # obs Mean Median Std Dev # obs Mean Median Std Dev
Capacity 57 697 630 493 22 1339 1025 862 11 307 260 158
Total deaths (all pollutants) 41 557 502 373 17 1047 835 671 5 171 151 106
Total deaths per plant due to:
PM2.5 41 31 19 52 17 33 28 19 5 3 2 2
SO2 41 418 370 283 17 804 640 530 5 130 114 81
NOx 41 103 100 65 17 199 159 120 5 36 34 23
Deaths per ton of emission of:
PM2.5 56 0.023 0.023 0.004 22 0.023 0.025 0.006 11 0.022 0.022 0.006
SO2 56 0.011 0.011 0.001 22 0.010 0.011 0.002 11 0.009 0.010 0.001
NOx 56 0.009 0.009 0.002 22 0.009 0.010 0.003 11 0.008 0.009 0.002
Total deaths (per GWh) 41 0.103 0.100 0.026 17 0.095 0.091 0.012 5 0.082 0.078 0.024 Total deaths (per GWh) per plant due to:
PM2.5 41 0.007 0.004 0.012 17 0.003 0.003 0.002 5 0.002 0.001 0.001
SO2 41 0.076 0.077 0.017 17 0.072 0.072 0.008 5 0.062 0.059 0.017
NOx 41 0.019 0.018 0.005 17 0.019 0.018 0.004 5 0.018 0.018 0.006
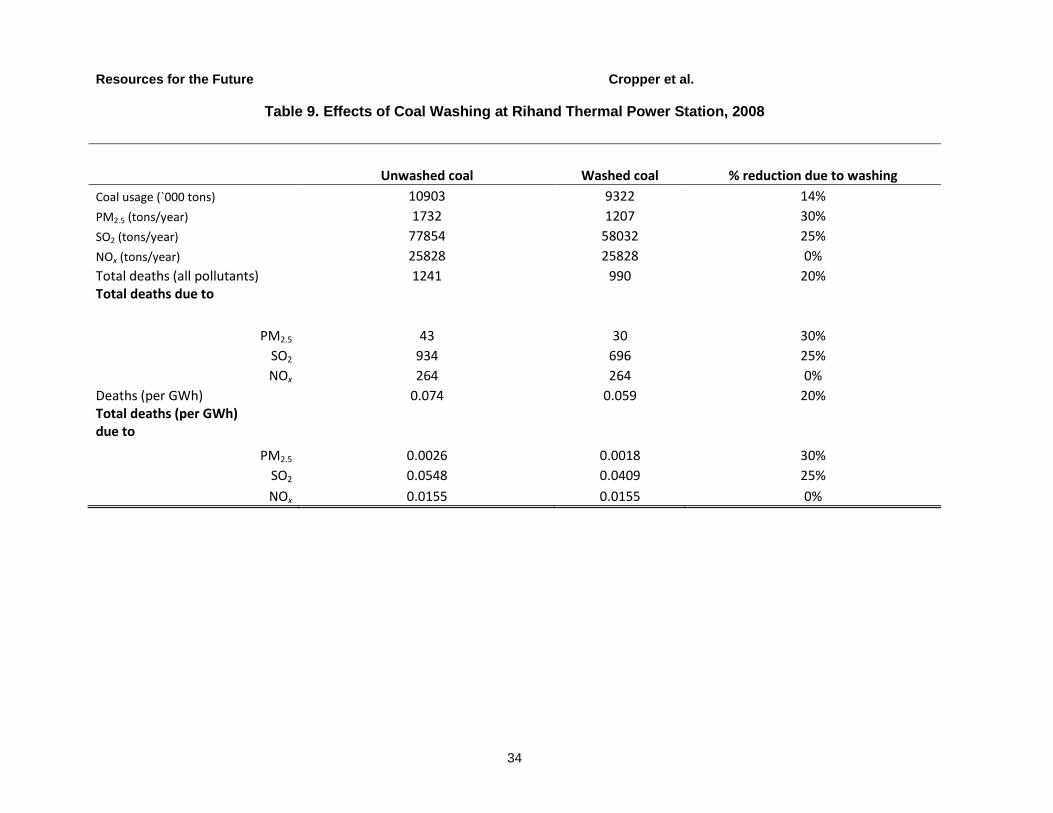
Resources for the Future Cropper et al.
34
Table 9. Effects of Coal Washing at Rihand Thermal Power Station, 2008
Unwashed coal Washed coal % reduction due to washing
Coal usage (`000 tons) 10903 9322 14%
PM2.5 (tons/year) 1732 1207 30%
SO2 (tons/year) 77854 58032 25%
NOx (tons/year) 25828 25828 0%
Total deaths (all pollutants) 1241 990 20% Total deaths due to
PM2.5 43 30 30%
SO2 934 696 25%
NOx 264 264 0%
Deaths (per GWh) 0.074 0.059 20% Total deaths (per GWh) due to
PM2.5 0.0026 0.0018 30%
SO2 0.0548 0.0409 25%
NOx 0.0155 0.0155 0%
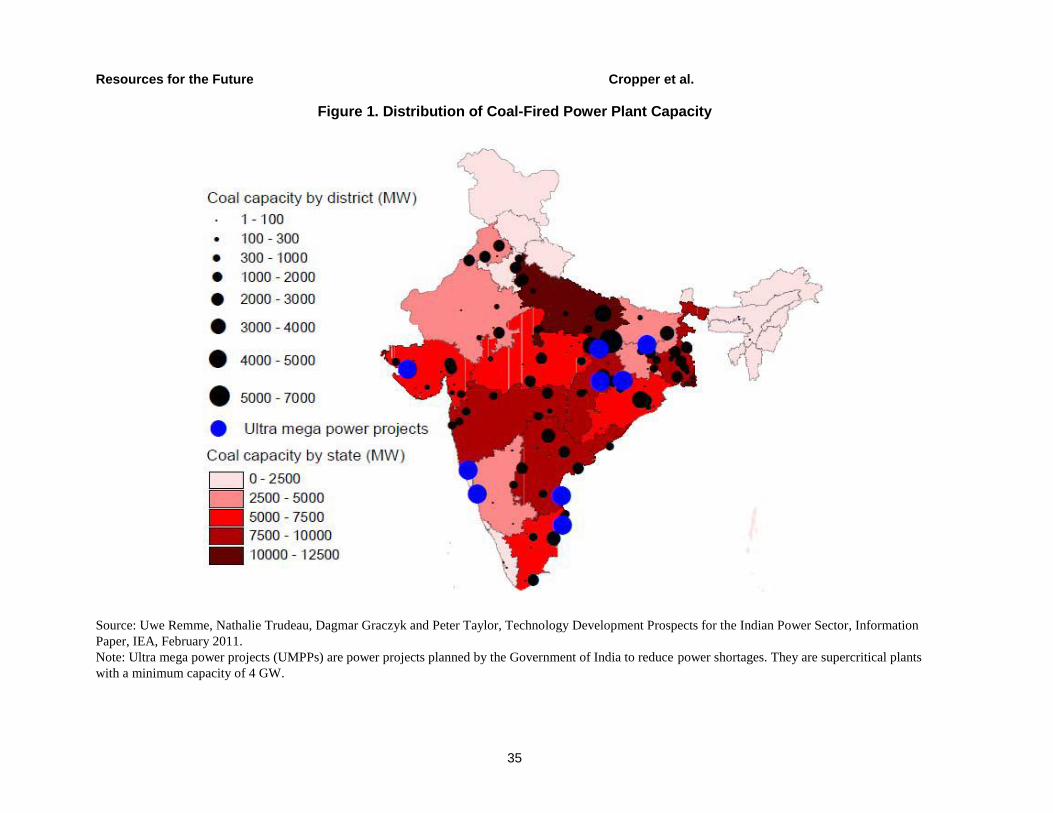
Resources for the Future Cropper et al.
35
Figure 1. Distribution of Coal-Fired Power Plant Capacity
Source: Uwe Remme, Nathalie Trudeau, Dagmar Graczyk and Peter Taylor, Technology Development Prospects for the Indian Power Sector, Information
Paper, IEA, February 2011.
Note: Ultra mega power projects (UMPPs) are power projects planned by the Government of India to reduce power shortages. They are supercritical plants
with a minimum capacity of 4 GW.