Embed Size (px)
Citation preview

vmiddot Tech Published by
Virginia Polytechnic Institute and State University
June 2004 Volume 5
Virginia Sea Grant College Program
International Journal of Recirculating Aquaculture Executive Editor SA Smith Dept of Biomedical Sciences and
Pathobiology Virginia-Maryland Regional College of Veterinary Medicine Virginia Tech
Managing Editor AI Correa Virginia Sea Grant College Program Virginia Tech Blacksburg Virginia
Executive Board GD Boardman Dept of Civil and Environmental Engineering College of Engineering Virginia Tech
CW Coale Dept of Agricultural and Applied Economics College of Agriculture and Life Sciences Virginia Tech
SR Craig Dept of Large Animal Clinical Sciences Virginia-Maryland Regional College of Veterinary Medicine Virginia Tech
GJ Flick Dept of Food Science and Technology College of Agriculture and Life Sciences Virginia Tech
EM Hallerman Dept of Fisheries and Wildlife Sciences College of Natural Resources Virginia Tech
ML Jahncke Virginia Seafood Agricultural Research and Extension Center Virginia Tech
D Kauffman Virginia Seafood Agricultural Research and Extension Center Virginia Tech
E McLean Dept of Fisheries and Wildlife Sciences College of Natural Resources Virginia Tech
D Taylor Dept of Agricultural and Applied Economics College of Agriculture and Life Sciences Virginia Tech
International Journal of
Recirculating Aquaculture
June2004 Volumes
copy Copyright 2004 published by Commercial Fish and Shellfish Technologies Program
Virginia Polytechnic Institute and State University Virginia Sea Grant
Blacksburg VA 24061 USA All rights reserved No part of this publication may be reproduced stored in a retrieval system or transmitted in any form or by any means electronic
electrostatic magnetic tape mechanical photocopying recording or otherwise without permission in writing from the publisher
VSG-04-09
Printed in the United States of America
ISSN 1547-917X
Table of Contents (Volume 5)
Introduction iv
Flatbed Scanning as a Novel Approach for Examining Lipid Distribution in Fish Comparison with MRI and Traditional Chemical Methods K Wille R Jain E McLean JS Goddard EJ Kaplan H Leven 1
Skinless V-Notched Fillet Yields of Tilapia Oreochromis SP Kirkup LS Marsh CW Coale Jr 19
Hematology and Blood Chemistry Reference Intervals for Yellow Perch (Percaftavescens) Raised in Recirculation Systems TC Hrubec SA Smith 29
Hatchery and Grow-out Performance of Sunshine Bass and Backcross Hybrid Striped Bass in Recirculating Aquaculture Systems SR Lindell B Delbos R Perham J Goldman EM Hallerman TO Brenden 43
Book Review
Fjnfisb and Shellfish Bacteriology Manual Tech-niques and Procedures Reviewed by R Cipriano 55
Subscriptions 57
Instructions for Authors 59
International Journal of Recirculating Aquaculture Volume 5 June 2004 111
A Dear Reader
V With this issue we have reached the five-year milestone in publishing the International Journal
of Recirculating Aquaculture We are now being listed with several major citation and abstracting services (such as AGRICOLA and CABI) making the JRA fully searchable by author title or subject Through our website www ijracom abstracts of papers published in the journal are readily available to aquaculturists academicians and researchers worldwide and reprints can be easily requested Also university and aquacultureagriculture libraries all over the world are now receiving the journal for inclusion in their journal collections thus making the JRA a truly international publication
We continue to encourage the submission of manuscripts and reports on all topics concerning recirculation aquaculture technology including water conservation system design and management waste management species selection and evaluation breeding and genetics larval rearing growth and nutrition fish health food and product quality food safety and marketing and economics This broad range of topics is intended to serve our diverse readership disseminating research and real-world experiences into a wider realm of utilization As more and more species are intensively cultured in recirculating aquaculture systems our journal will continue to present new technologies and research to our readers As always we encourage our readers to contact our production office with any suggestions comments or ideas they may have concerning the journal or its content Thank you for your continued support
Sincerely
etplusmnPhD Executive Editor IJRA
lV International Journal of Recirculating Aquaculture Volume 5 June 2004
Flatbed Scanning as a Novel Approach for Examining Lipid Distribution in Fish Comparison with MRI and Traditional Chemical Methods
K Wille1 R Jain2 E McLean1 JS Goddard3 EJ Kaplan4 H Leven2
1Aquaculture Center (0321) Virginia Polytechnic Institute and State University 1 Plantation Road Blacksburg VA 24061 USA
2Department of Radiology Sultan Qaboos University PO Box 50 Al-Khoud PC 123 Sultanate of Oman
3Department of Marine Science and Fisheries Sultan Qaboos University PO Box 50 Al-Khoud PC 123 Sultanate of Oman
4Department of Pathology Sultan Qaboos University PO Box 50 Al-Khoud PC 123 Sultanate of Oman
Corresponding authors e-mail emcleanvtedu
Keywords fat deposition product quality image analysis oil red 0 cutlet
International Journal of Recirculating Aquaculture 5 (2004) 1-17 All Rights Reserved copy Copyright 2004 by Virginia Tech and Virginia Sea Grant Blacksburg VA USA
Flatbed Scanning for Examining Lipid Distribution in Fish
ABSTRACT Depending upon species the concentration and distribution of lipid in fish flesh impacts both processing requirements and eating quality Dispersal of lipid within fish muscle may be manipulated by diet feeding strategy and through selective breeding Several methods are currently used to examine lipid deposition in fish but these are either arduous costly or reliant upon noxious chemicals The need exists for a rapid inexpensive and safe method for examining lipid distribution in fish flesh A technique that satisfies the preceding criteria was developed Fish cutlets were stained with oil red 0 scanned and the images saved in 600 dpi tiff format Oil red 0 was employed to differentiate muscle tissue from lipid Cutlets were examined using computer-assisted image analysis and lipid presence in each cutlet recorded in percent terms The results were compared to data generated from the same cutlets using Magnetic Resonance Imaging to separate muscle from lipid No differences were detected between methods with regards to lipid distribution which followed an anterior to posterior decline in the body Lipid dispersal did not differ with gender Estimates of total lipid in scanned images were identical to those recorded using chemical analysis
INTRODUCTION In fish the spatial distribution of body fat and in particular its dispersal through the muscle is important in determining flesh texture juiciness taste and odor (Johansson 2001) The ability to monitor and control lipid accumulation in aquacultured animals has become increasingly important due to the emergence of a progressively sophisticated and health-conscious consumer Traditionally techniques for determining the impact of genetic selection and husbandry manipulations upon quality traits such as muscle lipid accumulation include dissection and quantitative chemical analyses in combination with multiple samplings at designated spatial locations These methods are frequently arduous and costly (Rye 1991) and also require the use of hazardous chemicals Several alternative techniques have been examined in an effort to reduce dependence upon traditional methods and to speed the prediction of carcass composition Near Infrared Reflectance Analysis (NIRA) has been used in the inspection of fish carcass composition (Valdes et al 1989) but is limited in application because of the need to grind samples Gjerde (1987) examined the utility of Computerized Tomography (CT) with some
2 International Journal of Recirculating Aquaculture Volume 5 June 2004
Flatbed Scanning for Examining Lipid Distribution in Fish
success CT has since been employed in various studies to examine cutlet lipid and protein deposition in salmon (Rye 1991 Bjerkeng et al 1997 Einen et al 1998)
Other biomedical imaging techniques are also available that permit the non-invasive examination of the internal structures of animals In this regard Magnetic Resonance Imaging (MRI) in particular has proven exceptional due to its precision resolving power and general availability Although costly MRI has been employed to examine various aspects of seafood end-product quality These include studies upon trimethylamine oxide trimethylamine and dimethylamine presence (Howell et al 1996) and the impact of freeze-thawing on product deterioration (Nott et al 1999ab) MRI has also been exploited to examine liver lipid content in burbot (Lota iota) (Alanen et al 1991 Komu and Alanen 1994) An obvious extension of such investigations would be to evaluate the usefulness of MRI to map lipid deposition processes in fish flesh
Alternatives to costly medical imaging technologies and time-consuming and hazardous chemical analyses are nevertheless still needed to enable rapid on-site evaluation of the impact of breeding programs andor dietary treatments upon carcass characteristics R~nsholdt et al (2000) employed flatbed scanning techniques and computer-assisted image analysis to examine carcass composition of farmed trout These studies however involved manual image processing of cutlets that may have induced bias during analysis Removal of partiality can be achieved using automated image processing A requirement for automatic image evaluation of predominantly white-fleshed fish is a high contrast between parameters of interest for example lipid and muscle tissues One method of differentiating between these tissue types is to use biological stains In general most histochemical techniques have been developed for microscopic analyses or for the study of macroparasites Staining methods suitable for gross examination of whole body samples however are sparse
A number of lipid-soluble dyes are used for histochemical detection of fat with oil red 0 (ORO) being particularly suitable as it reveals lipids with an orange-red tint (Lillie 1944ab) An ability to highlight lipid-based fractions of for example a fish cutlet or steak permits automated image processing to the pixel level and hence eliminates analytical bias The objective of the present study was two-fold Firstly to develop an economical safe and easy-to-use technique with a capacity for on-site use that would enable examination of gross distribution of lipid in fish
International Journal of Recirculating Aquaculture Volume 5 June 2004 3
Flatbed Scanning for Examining Lipid Distribution in Fish
and secondly to compare the method developed against traditional chemical analysis and MRI
MATERIALS AND METHODS
Animals Eight tilapia Oreochromis aureus (4 males 4 females 1036plusmn431 mm and 185plusmn28 g) that had been fed an experimental diet (Table 1) for a period of eight weeks were sacrificed by anaesthetic overdose (MS 222 Sigma Chemical Co St Louis MO USA) and subsequently frozen (-18degC) until examination Each fish was used for MRI and flatbed scanning evaluations A duplicate number of animals (n = 8 4 male and 4 female 1043plusmn250 mm and 201plusmn15 g) were employed for chemical analysis
Image preparation
MRI image acquisition MRI images were obtained using a Siemens Magnetom Symphony (Siemens AG Munich Germany) imaging console connected to a 15 Tesla superconducting magnet (Siemens AG Munich Germany) Prior to MRI analysis animals were thawed and gutted Subsequently individual animals were embedded in gelatin to eliminate air-based artefacts during imaging Tl weighted and water saturated Tl weighted images (see Hornack (2002) for details Fig l slice thickness 5 mm) were achieved at a recovery delay (TR) of 400 and echo time (TE) of 15 Derived images were transferred from MRI film (enlarged 400) by scanning (hp ScanJet 4C Hewlett-Packard Palo Alto CA USA) and saving each image in 600 dpi tiff format For each animal nine images (Figures 1 and 2) were collected Immediately following MRI all fish were refrozen (-18degC)
Flatbed image acquisition Refrozen fish from the MRI analysis were sliced into cutlets using an industrial meat-slicer at the same points at which MRI images were acquired (Figs 1 and 2) Thawed cutlets were rapidly rinsed in 70 isopropanol and then stained using oil red 0 (Sigma Chemical Co St Louis MO USA) dissolved in isopropanol (999) for 20 min Subsequently the cutlets were rinsed of excess ORO in 70 isopropanol (45degC) for 15 min and finally re-hydrated in tap water (45degC) for 5 min
4 International Journal of Recirculating Aquaculture Volume 5 June 2004
Flatbed Scanning for Examining Lipid Distribution in Fish
Table 1 Composition and proximate analysis of experimental diet employed during the present study
Ingredient (g kg-1)
Fish meala 250
Soybean oilb 200
Wheat bran 145
Wheat flour 100
Corn starch 30
Corn oil 20
Cod liver oil 250
Vitamins and mineralsc 5
Proximate composition (g kg-1)
Total lipid 83
Crude protein 274
Ash 80
Moisture 144 bullAnchovy meal 663 crude protein hSolvent extracted 442 crude protein ltFrom Goddard and McLean (2001)
( ABCDEFGHI
Figure 1 Sketch illustrating where cutlets were taken from individualfishor MRl and flatbed scanning and image analysis
International Journal of Recirculating Aquaculture Volume 5 June 2004 5
Flatbed Scanning for Examining Lipid Distribution in Fish
) 71 -------
I
a y
MRI 5 --+ l __ __tgt__ -1 I
Figure 2 lllustration of the preparation of MRI and flatbed scanned images I) Animal embedding in gelatin 2) MRI analysis 3) MRI image acquisition 4) Scanning of MRIfilm and saving at 600 dpi resolution 5) Animals were refrozen 6) Slicing of frozen animals 7) Staining of cutlet segments using oil red 0 8) Scanning of stained cutlet segments (600 dpi) 9) Computerized analysis of acquired images
Rinsing and re-hydration of cutlets from individual fish was accomplished by placing the sample in a 250 ml lidded container under continuous shaking Finally the cutlets were gently wiped to remove excess fluid and placed on an overhead film (Pelikan Transparent film TF 80 Pelikan Holding AG Baar Switzerland) anterior-most side down scanned (hp ScanJet 4C) with an open lid under dark conditions (enlarged 400) and saved in 600 dpi tiff format
Image analysis Built in functions in MatLabreg v 52 (MathWorks Natick MA USA) were used to enable lipid analysis of stained images The program employed the red green blue (RGB) spectrum and was able to separate lipid from muscle using reference values (mean+- SD see Fig 3) down to the pixel level Resolved data was also evaluated in percentage and illustrative terms A separate program was developed in MatLabreg to enable lipid
International Journal of Recirculating Aquaculture Volume 5 June 2004
Flatbed Scanning for Examining Lipid Distribution in Fish
Flatbed scanning
Tl weighted MRI
H20sat Tl weighted
MRI
Original Image Mask Lipid Mask Meat Mask
Illustration of result
Figure] Illustration of the methods employed to examine lipid presence in flatbed scanned and MRI derived images of tilapia (see Methods text for more details)
analysis of the two types of MRI images (Fig 3) It also operated in the RGB spectrum but employed manually-separated reference images because both Tl weighted and water saturated Tl weighted MRI films were developed in gray scale Additionally since the resolving power of the MRI signal was affected by lipid concentration fat deposits in areas farther from the ventral region (belly) were less discrete and hence their analysis was more complex
The RGB spectrum Digital images consist of numerous dots termed pixels The number of pixels in a digital image is dependent upon image resolution which is commonly defined in dots per inch (dpi) Each pixel is assigned a binary value (0-1) according to tone eg black = 0 and white = I Digital images may be bitonal (black and white) grayscale or in color These image
International Journal of Recirculating Aquaculture Volume 5 June 2004
Flatbed Scanning for Examining Lipid Distribution in Fish
types differ in the number of bits used to define each pixel Whereas a bitonal pixel is defined by one bit grayscale pixels range between 2-8 bits and color pixels from 8-24 bits In a 24-bit color image bits are often separated into three 8-bit groups - viz red green or blue hues A combination of the bits defines additional colors MatLabreg works separately in all three hues with three bit values for each colorbit being defined In a color image therefore three values are employed one for each hue In contrast in grayscale different hues are discarded leaving only the intensity of the single color
Image appraisal MRI and flatbed (stained) images were examined for percent lipid presence in each cutlet An estimate of percent lipid for each fish was obtained using the following method cutlet surface area (A and a Fig 4) expressed in pixels and height (h set to 5 mm) was used for the determination of cutlet radius Cutlet volume was calculated using the formula for assessing the volume of a cone Estimated cutlet volume and total body lipid was calculated according to the following equations
Estimated cutlet volume (pixels)= 13 bull n x h bull (R2 +Rx r + r2 bull 100
Estimated body lipid()= Abull (VA IV T) + B bull (V 8 IV T) + + 1 bull (VI I v T)
Where percent lipid was A a 1 surface area was A B I VT was total cutlet volume in pixels and V A B I the estimated cutlet volume in pixels (A B I)
Flatbed images were appraised as follows (Fig 3) three masks were obtained using tools in Paint Shop Pro 60 (Jase Software Eden Prairie MN USA) Firstly the spinal column was identified and assigned the color black The remaining cutlet area was assigned the color white to provide a mask for analysis in MatLabreg which was then saved From
Figure 4 Illustration of the cone conversion method used to quantify cutlet lipid presence
International Journal of Recirculating Aquaculture Volume 5 June 2004
Flatbed Scanning for Examining Lipid Distribution in Fish
the original image areas that stained intensively red were assigned to white while the remainder were assigned to black thereby providing a lipid mask A meat mask was generated in a similar manner (Fig 3) The original image mask lipid mask and meat mask were identical in terms of size and location of the spinal column such that pixels referring to for example meat on the meat mask were similarly identified on the original image The four images were then analyzed in MatLabreg The lipid and meat masks provided mean and standard deviation of positively assigned pixels This enabled MatLabreg to analyze each pixel of the original image corresponding to the mask relative to the distance to mean and standard deviation in the RGB spectrum The following formula was applied within MatLabreg
d_meat=sqrt(((r(rrcc)-meat_red_m)meat_red_s)A2+((g(rrcc)-meat_ green_m)meat_green_s)A2 +((b(rrcc)-meat_blue_m)meat_blue_s)A2)
where d_meat was the overall distance calculated r(rrcc) the pixel value in the red spectra meat_red_m the mean value in the red spectra for pixels positively assigned to meat by the meat mask meat_red_s the standard deviation in the red spectra of the pixels positively assigned to meat by the meat mask etc A similar formula was used for calculating the distance according to the lipid mean and standard deviation for the same pixel Subsequently the pixel analyzed was assigned to either meat or lipid depending on which distance was the shortest MatLabreg provided details relating to lipidmeat and an illustration of the result
MRI images were analyzed as follows the Tl weighted MRI image was used to prepare a white mask covering the surface area of the cutlet but excluding the spinal column in Paint Shop Pro 60 This mask was used for analysis of both MRI image types Secondly for both MRI types lipid areas were assigned using tools in Paint Shop The lipid areas were assigned to white and the remainder to black and saved as a lipid mask Lipid or meat pixels were assigned manually Subsequently the original image mask and lipid mask were analyzed in MatLabreg which provided lipidmeat and an illustration of the result
Chemical analysis An additional eight animals were employed for the chemical quantification of lipid Individual fish were homogenized prior to lipid analysis using the method described by Bligh and Dyer (1957) All samples were analyzed in duplicate
International Journal of Recirculating Aquaculture Volume 5 June 2004
Flatbed Scanning for Examining Lipid Distribution in Fish
Statistical analyses Statistical analyses were performed using SPSS ver 100 (Data Description Inc Ithaca NY USA) The model applied for the 3 x 9 factorial design was as follows
Yijk = micro + Ai+ B ABij +eijk
where m was the true mean Ai the analysis method Bj the cutlet ABij the interaction of the fixed factors and finally eijk the residual effect Differences between treatment means were analyzed by three-way ANOVA and differences between treatments (Plt005) isolated using Tukeys test Estimated lipid percent of cutlet A-I of each animal was analyzed by one-way ANOVA (flatbed scanning Tl weighted and water saturated Tl weighted MRI)
RESULTS Table 2 summarizes percent lipid levels in individual cutlets as determined by image analysis of ORO stained cutlets and MRI (Tl weighted and water-saturated Tl) samples Animal gender had no effect upon lipid distribution in the sections examined regardless of method of analysis No differences (P gt 005) were discerned in cutlet lipid presence or in interactions between analytical technique and cutlet for any of the methods examined Fish exhibited a general anterior to posterior decrease in lipid presence with differences (P=0001) in the amount of lipid detected being distinguishable between cutlets (Table 2) The first three cutlets (A-C) of all fish expressed a higher (P lt 005) percentage of lipid than more posterior cuts (H and I) with cutlet I containing a lower (P lt 001) percent lipid than cutlets D-G Examination of sections D-H revealed equivalency in terms of percent lipid deposition (Table 2) A comparison of percent whole body lipid presence using imaging techniques and the Bligh and Dyer method did not reveal differences (gt005) between the methods (Table 3)
DISCUSSION Lipid distribution in fish varies with species muscle type and sampling point (Katikou et al 2002) and may be influenced by season feed type and feeding strategy (Jobling et al 1998 Johansen and Jobling 1998 Johansson et al 2000) Lipid presence in fish flesh is arguably the most important trait that influences total quality of the final product Lipids
10 International Journal of Recirculating Aquaculture Volume 5 June 2004
Flatbed Scanning for Examining Lipid Distribution in Fish
Table 2 Comparison of flatbed scanning and MRI techniques in determining lipid percentage per cutlet examined (see Fig 1) Statistical analysis for the 3 x 9 factorial design is indicated in the category columns No interaction between method and cutlet segment was demonstrated Separate one-way ANOVAfor differences in cutlets is noted in the respective column n = 8 per analysis P lt 005
Method
Cutlet no Flatbed analysisa T1 weighteda H20 saturated T1 a
A8 254plusmn1208 312plusmn1388 287plusmn1668
88 251plusmn141 8b 314plusmn2068 206plusmn1838
ca 190plusmn088abc 253plusmn181 8b 258plusmn2248
oab 144plusmn070abc 233plusmn1008b 278plusmn1978
Eab 151plusmn0778 bc 188plusmn104ab 213plusmn0568
pb 143plusmn059abc 242plusmn207ab 260plusmn1558
Gab 139plusmn105abc 190plusmn1268b 211plusmn1848
Hbc 103plusmn075bc 098plusmn117ab 100plusmn0988
1c 084plusmn048C 018plusmn025b 019plusmn0468
Table 3 Chemical analysis (n=6 Bligh and Dyer 1959) and estimates of lipid presence using flatbed Tl weighted and water saturated Tl MRI methods (n=8)
Bligh and Flatbed Water Method D~er anal~sis T1 weighted saturated T1 Lipid content I Estimated lipid 171plusmn0468 177plusmn0328 229plusmn1198 212plusmn0748
content
International Journal of Recirculating Aquaculture Volume 5 June 2004 11
Flatbed Scanning for Examining Lipid Distribution in Fish
impact the appearance flavor tenderness and juiciness of fresh and processed products (Rasmussen et al 2000 Johansson et al 2000 Lie 2001) Lipids are also the main component responsible for the accumulation of smoked and flavoringseasoning compounds that impart a final products flavor (Beltran et al 1991) The nutritional quality and quantity of lipid in fish flesh is of interest from a human health perspective since it has long been recognized that n-3 PUFA reduces the incidence of heart disease decreases risk of some cancers and may act to stimulate the immune system
Several studies have demonstrated the changes in fatty acid elasticity of fish flesh following dietary modifications (Viegas and Guzman 1998 Samuelsen et al 2001 Bell et al 2001) It is well established that lipid presence affects the technological quality of fish flesh from the processing perspective Lipids impact sliceability (McLean and Devlin 2000) fillet yield and trimming loss (Rasmussen et al 2000) as well as the salting and drying process during smoking (Cardinal et al 2001) and may play a role in fillet gaping (Lie 2001) Whole body lipid levels are also important in the bioaccumulation process (Stow et al 1997 Zhou et al 1999) and hence impact the safety of final products
A trend in the aquaculture feed industry has been to formulate diets that are high in lipid (gt 40) as a method to spare protein and reduce environmental impact (Cho and Bureau 2001) Potential negative aspects of such diets however are increased lipid accumulation and an overall decline in end product quality (Shearer 2001) A growing need exists to develop methods that enable safe and rapid assessment of lipid accumulation in the edible component of farmed fish Such methods could support research and development in the formulation of novel diets provide insights into lipid dynamics following application of various feeding strategies assist during selective breeding programs and provide a basis for on-farm product quality management
In pigmented species of fish such as the salmonids it is often possible to visually detect fat deposits within muscle tissues In contrast visual recognition of lipid deposits in white-fleshed animals remains problematic MRI provides the means to examine internal structures of animals non-destructively and permits separation of lipid from muscle tissues (Hornack 2002 Fig 3) In mammals including humans the kinetics and distribution of body fat (Kamel et al 2000 Fusch et al
12 International Journal of Recirculating Aquaculture Volume 5 June 2004
Flatbed Scanning for Examining Lipid Distribution in Fish
1999) has been examined by MRI Clearly similar studies with teleosts would provide great rewards with regards to understanding lipid dynamics over the life cycle and establishing the effects of different manipulations on depositional processes In the present study with tilapia MRI was able to distinguish lipid from muscle tissue in cutlets demonstrating a cranial-caudal decline in cutlet lipid presence which is in accord with chemical (Katikou et al 2001) and CT (Gjerde 1987 Rye 1991) analyses of salmonids Noteworthy in the present study was the lack of a difference in lipid presence or spatial distribution between genders
Irrespective of the resolving power of MRI and its companion medical imaging technologies however such equipment is sophisticated demanding and expensive In the practical sense medical imaging technologies are of limited value to aquaculture In contrast the simplicity of highlighting lipids using fat-soluble stains such as oil red 0 as used herein or alternatives such as Sudan red B Sudan black B and others however provides a rapid and inexpensive means of distinguishing and quantifying lipid deposits in edible flesh and viscera The described method can be adapted and applied to all species wherein muscle and lipid tissues are difficult to separate visually (eg in unpigmented fleshed animals) Preliminary studies with summer (Paralichthys dentatus) and southern (P lethostigma) flounders confirm the utility and general applicability of the method Furthermore use of stains such as Sudan black B would enable greater differentiation of lipid deposits even in pigmented species Differences nevertheless exist when employing lipid-soluble histochemical dyes for macro samples such as fish cutletssteaks fillets etc Specifically distinctions are met in incubation conditions which likely occur due to sample thickness When compared to MRI the flatbed scanning method provided identical results with respect to lipid distribution and percent cutlet lipid Moreover quantitative estimates of lipid presence using flatbed- and MRI-derived data duplicated lipid values calculated by traditional chemical methods Accordingly the histochemical staining-flatbed scanning technique provides a safe reproducible and economical method of isolating and monitoring whole body cutlet or fillet lipid presence The resolving power of this technique may be further enhanced using different or additional biological stains that are more specific The major drawback of the flatbed method when compared to MRI was the time required to prepare samples prior to computer-assisted analysis with individual fish requiring approximately 45 minutes In contrast with MRI multiple images of multiple specimens
International Journal of Recirculating Aquaculture Volume 5 June 2004 13
Flatbed Scanning for Examining Lipid Distribution in Fish
were acquired in a matter of minutes However the need to embed samples in gelatin to avoid artifacts in the MRI scan required overnight preparation demanding two person hours total Overall the time required for the preparation of the flatbed-scanned images was similar to that of traditional chemical analysis The analysis of both MRI and flatbed-scanned images (9 slices per fish) required approximately 4 hours per method However the results generated provided more detail than traditional chemical analysis The flatbed technique developed may prove useful in a wide range of basic and applied research
REFERENCES Alanen A Komu M Bondestam S Toikkanen S Determination of
Fat Content of Burbot (Lota Iota) Liver with Low Field MR Imaging (004 T) Physics in Medicine and Biology 1991 36 953-961
Bell JG McEvoy J Tocher DR McGhee F Campbell PJ Sargent JR Replacement of Fish Oil with Rapeseed Oil in Diets of Atlantic Salmon (Salmo salar) Affects Tissue Lipid Compositions and Hepatocyte Fatty Acid Metabolism Journal of Nutrition 2001 131 1535-1543
Beltran A Moral A The Effects of Fat Contents and Storage Temperature on the Storage Life of Smoked Sardine Fillets (Sardina pilchardus W) Prepared from Frozen Sardine Food Chemistry 1991 42 347-356
Bjerkeng B Refstie S Fjalestad KT Storebakken T R~dbotten M Roem AJ Quality Parameters of the Flesh of Atlantic Salmon (Salmo salar) as Affected by Dietary Fat Content and Full-Soybean Meal as a Partial Substitute for Fish Meal in the Diet Aquaculture 1997 157 297-309
Bligh EG Dyer WJ A Rapid Method of Total Lipid Extraction and Purification Canadian Journal of Biochemistry and Physiology 1959 37 910-917
Cardinal M Knockaert C Torrissen 0 Sigurgisladottir S M~rk~re T Thomassen M Vallet JL Relation of Smoking Parameters to the Yield Colour and Sensory Quality of Smoked Atlantic Salmon (Salmo salar) Food Research International 2001 34 537-550
14 International Journal of Recirculating Aquaculture Volume 5 June 2004
Flatbed Scanning for Examining Lipid Distribution in Fish
Cho CY Bureau D P A Review of Diet Formulation Strategies and Feeding Systems to Reduce Excretory and Feed Wastes in Aquaculture Aquaculture Research 2001 32 suppl 1 349-360
Einen 0 Waagan B Thomassen MS Starvation Prior to Slaughter in Atlantic Salmon (Salmo salar) I Effects on Weight Loss Body Shape Slaughter- and Fillet-Yield Proximate and Fatty Acid Composition Aquaculture 1998 166 85-104
Fusch C Slotboom J Fuehrer U Schumacher R Keisker A Zimmermann W Moessinger A Boesch C Blum J Neonatal Body Composition Dual-Energy X-Ray Absorptiometry Magnetic Resonance Imaging and Three-Dimensional Chemical Shift Imaging versus Chemical Analysis in Piglets Pediatric Research 1999 46 465-473
Gjerde B Predicting Carcass Composition of Rainbow Trout by Computerized Tomography Journal of Animal Breeding and Genetics 1987 104 121-136
Goddard JS McLean E Acid-Insoluble Ash as an Inert Reference Material for Digestibility Studies in Tilapia Oreochromis aureus Aquaculture 2001 194 93-98
Hornack JP The Basics of MRI httpwwwcisriteduhtbooksmri 2002
Howell N Shavila Y Grootveld M Williams S High-Resolution NMR and Magnetic Resonance Imaging (MRI) Studies on Fresh and Frozen Cod (Gadus morhua) and Haddock (Melanogrammus aeglefinus) Journal of the Science of Food and Agriculture 1996 72 49-56
Jobling M Johansen SJS Forshaug H Burkow LC JZ)rgensen EH Lipid Dynamics in Anadromous Arctic Charr Salvelinus alpinius (L) Seasonal Variations in Lipid Storage Depots and Lipid Class Composition Fish Physiology and Biochemistry 1998 18 225-240
Johansen SJS Jobling M The Influence of Feeding Regime on Growth and Slaughter Traits of Cage-Reared Atlantic Salmon Aquaculture International 1998 6 1-17
International Journal of Recirculating Aquaculture Volume 5 June 2004 15
Flatbed Scanning for Examining Lipid Distribution in Fish
Johansson L Eating Quality of Farmed Rainbow Trout ( Oncorhynchus mykiss) In Farmed Fish Quality Kestin S C and Warriss P D (Eds) 2001 Pages 76-88 Fishing News Books Osney Mead UK
Johansson L Kiessling A Kiessling K-H Berglund L Effects of Altered Ration Levels on Sensory Characteristics Lipid Content and Fatty Acid Composition of Rainbow Trout (Onchorhynchus mykiss) Food Quality and Preference 2000 11 247-254
Kamel EG McNeill G van Wijk MCW van Wijk MCW Change in Intra-Abdominal Adipose Tissue Volume during Weight Loss in Obese Men and Women Correlation between Magnetic Resonance Imaging and Anthropometric Measurements International Journal of Obesity 2000 24 607-613
Katikou P Highes SI Robb DHF Lipid Distribution within Atlantic Salmon (Salmo salar) Fillets Aquaculture 2001 202 89-99
Komu M Alanen A Magnetization Transfer in Fatty and Low-Fat Livers Physiological Measurement 1994 15 243-250
Lie 0 Flesh Quality - The Role of Nutrition Aquaculture Research 2001 32 suppl 1 341-348
Lillie RD Various Soluble Dyes as Fat Stains in the Supersaturated Isopropanol Technique Stain Technique 1994a 19 55-58
Lillie RD Study of Certain Oil Soluble Dyes for Use as Fat Stains Journal of Technical Methods 1994b 24 37-42
McLean E Devlin RH Application of Biotechnology to Enhance Growth of Salmonids and Other Fish In Recent Advances in Marine Biotechnology Fingerman M and Nagabhushnam R (Eds) 2000 Pages 17-55 Science Publishers Incorporated Enfield New Hampshire USA
Nott KP Evans SD and Hall LD Quantitative Magnetic Resonance Imaging of Fresh and Frozen-Thawed Trout Magnetic Resonance Imaging 1999a 17 445-455
Nott KP Evans SD and Hall LD The Effect of Freeze-Thawing on the Magnetic Resonance Imaging Parameters of Cod and Mackerel Lebensmittel Wissenschaft and Technologie 1999b 32 261-268
16 International Journal of Recirculating Aquaculture Volume 5 June 2004
Flatbed Scanning for Examining Lipid Distribution in Fish
Rasmussen RS Ostenfeld TH R~nsholdt B McLean E Manipulation of End-Product Quality in Rainbow Trout with Finishing Diets Aquaculture Nutrition 2000 6 17-23
R~nsholdt B Nielsen H Frergemand J McLean E Evaluation of Image Analysis as a Method for Examining Carcass Composition of Rainbow Trout Ribarstvo 2000 58 3-11
Rye M Predicition of Carcass Composition in Atlantic Salmon by Computerized Tomography Aquaculture 1991 99 35-48
Samuelsen T Isaksen M McLean E Influence of Dietary Recombinant Microbial Lipase on Performance Characteristics of Rainbow Trout Aquaculture 2001 194 161-171
Shearer KD The Effect of Diet Composition and Feeding Regime on the Proximate Composition of Farmed Fishes In Farmed Fish Quality Kestin SC and Warriss PD (Eds) 2001 Pages 31-41 Fishing News Books Osney Mead UK
Stow CA Jackson LJ Amrhein JF An Examination of the PCB Lipid Relationship among Individual Fish Canadian Journal of Fisheries and Aquatic Sciences 1997 54 1031-1038
Valdes EV Atkinson JL Hilton JW Leeson S Near Infrared Reflectance Analysis of Fat Protein and Gross Energy of Chicken and Rainbow Trout Carcasses Canadian Journal of Animal Science 1989 69 1087-1090
Viegas EMM Guzman EC Effect of Sources and Levels of Dietary Lipids on Growth Body Composition and Fatty Acids of the Tambaqui (Colossoma macropomum) World Aquaculture 1998 29
Zhou HY Cheung RYH Wong MH Bioaccumulation of Organochlorines in Freshwater Fish with Different Feeding Modes Cultured in Treated Wastewater Water Research 1999 33 2747-2756
International Journal of Recirculating Aquaculture Volume 5 June 2004 17
Skinless V-Notched Fillet Yields ofTilapia (Oreochromis)
SP Kirkup1 LS Marsh2 CW Coale Jr3
11774 Old Brook Rd Charlottesville VA 22901 USA
2Department of Biological Systems Engineering (0303) Virginia Polytechnic Institute and State University Blacksburg VA 24061 USA
3Department of Agricultural and Applied Economics (0401) Virginia Polytechnic Institute and State University Blacksburg VA 24061 USA
Corresponding authors e-mail marshesvtedu
Keywords tilapia Oreochromis fish fillet yield
International Journal of Recirculating Aquaculture 5 (2004) 19-27 All Rights Reserved copy Copyright 2004 by Virginia Tech and Virginia Sea Grant Blacksburg VA USA
International Journal of Recirculating Aquaculture Volume 5 June 2004 19
Fillet Yields of1ilapia (Oreochromis)
ABSTRACT White hybrid tilapia (Oreochromis) produced in an experiment that determined the effects of various management practices on growth rate and feed conversion ratios were weighed measured and filleted at the conclusion of the growth trials Regression analyses produced two models to predict fillet yields-one model that used the fish weight and length and a reduced model that used only fish weight While the full model produced a somewhat smaller error it was found to be impractical to use fish length to estimate fillet yield due to the difficulty in obtaining a length measurement The full model also produced unreasonable estimates when extended beyond the limits of the data set Using a paired t-test fillet yields of males and females of equal weights were tested and were not found to be significantly different This model provides a means of converting market price of tilapia fillets to a price for live fish once processing costs are considered
INTRODUCTION Marketed food commodities including fish undergo changes in product form before reaching the consumer The objective of changing the product form of a commodity is to add value to the product In the case of filleted fish products changing a whole fish to a filleted product enhances the value of the product but also significantly reduces its weight The producer is paid not for the live weight of the fish but for the final weight in commodity form Producers raising fish for the fillet market need a simple means of estimating fillet yield in order to make management decisions regarding what size of live fish to harvest
Market demand for various forms of tilapia has been created in large metropolitan areas of the United States and Canada by ethnic groups from regions including South and Central America Southeast Asia Africa China and the Philippines Although most of the tilapia consumed in the United States is imported as fresh or frozen fillets or frozen whole fish (Harvey 2000) certain ethnic groups prefer live fish for which they are willing to pay a significant premium High transportation and handling costs make importation of live tilapia into the United States prohibitively expensive and thus a domestic live tilapia industry has developed within the United States primarily using intensive recirculating aquaculture systems While the amount of tilapia produced domestically is rather small compared to that of catfish and trout according to the USDA
20 International Journal of Recirculating Aquaculture Volume 5 June 2004
Fillet Yields ofTilapia (Oreochromis)
(Harvey 2000) tilapia represents the second largest import of finfish into the United States on a live weight and value basis trailing only Atlantic salmon Hence there is ample evidence of a market for tilapia
Tilapia cannot survive in low ambient temperatures (Phipippart and Ruwet 1982) and therefore except for the southernmost regions they cannot be produced year-round in ponds in North America Production costs of tilapia raised in ponds have been estimated to range between $088 and $132kg (Fitzsimmons and Posadas 1997) compared to an estimated production cost of $279kg for recirculating aquaculture systems (Losordo and Westerman 1994) Because of the significantly higher cost of indoor temperature-controlled production domestic producers generally cannot compete economically with foreign pond-raised processed tilapia products which are relatively inexpensive to ship However they can compete for the live tilapia market due to the challenges and costs associated with transporting live fish
Many wholesalers require a minimum size for live tilapia producers report both 340 and 450 g (three-quarters and one pound) as minimum desired weights Producers are tempted to retain and grow out further fish that are too small to be marketed as live fish However research conducted at Virginia Tech indicates that as tilapia mature both the growth rate and feed-conversion efficiency decrease dramatically (Kirkup et al 2000) and that these decreases are primarily dependent on age rather than either size or culture conditions Therefore it might be more economical to fillet substandard fish rather than allowing these poor performers to grow to live-market size
Tilapia fillet yields are of interest to domestic producers for several reasons First fillet yield can be used to establish the value of live tilapia once the market price and processing handling and carcass disposal costs are known Secondly fillet yield and variation are of interest to food processors and restaurateurs who are interested in a specific size fillet or portion
In the spring and early summer of 1999 an experiment was conducted to investigate the effects of different temperature and feeding rates upon the growth and feed conversion efficiency of Rocky Mountain white tilapia As a result of the experiment there was large variation in size length and weight among the fish in the various treatments At the conclusion of the experiment the fish were weighed measured sexed filleted and the fillets were weighed
International Journal of Recirculating Aquaculture Volume 5 June 2004 21
Fillet Yields of Tilapia (Oreochromis)
MATERIALS AND METHODS The fish used for the experiment are commonly called Rocky Mountain White Tilapia although a best guess is that they are a white inter-specific species of the genus Oreochromis primarily 0 niloticus 0 aureus and 0 mossambicus This hybrid has been selectively bred at Blue Ridge Aquaculture Inc (Martinsville VA USA) for its color and growth rate The white hybrids are desirable in the live fish market because of their generally attractive external appearance This hybrid grows rapidly and has other physiological attributes that make it well suited to culture in high-density aquaculture systems Although predominantly white the fish ranged in color from a bright white to a bluish and golden white to a few that were colored a reddish brown As fry the fish were given methyltestosterone mixed with their feed to chemically sex reverse the females Prior to delivery to Virginia Tech the fish were graded twice at Blue Ridge Aquaculture Inc to obtain a relatively uniform size by removing the runts
The fish were raised in 6607 L (150 gallon) agricultural watering troughs (Rubbermaid Winchester VA USA) The experiment was a three (temperatures) by four (feeding levels) factorial design having two replicates The nominal culture temperatures were 26 29 and 32degC and the feeding levels for each temperature conducted four times a day were saturation feeding 87 73 and 60 of the daily saturation feed rate The average fish weight at the beginning of the experiment was approximately 53g and the growth experiment lasted 20 weeks At the conclusion of the experiment the fish were taken off feed for three days prior to harvesting The tanks were completely drained and the live fish from each tank were placed in an ice-filled chest The fish were kept on ice for several hours prior to being filleted to anesthetize them and increase rigor making them easier to fillet and reducing the amount of blood in the fillet Prior to processing the fish were weighed to the nearest gram using a digital scale and measured to the nearest millimeter using a measuring board Fish weighing 300g or more were then filleted smaller fish were dissected to determine sex but were not filleted A total of 407 fish were filleted As noted the fish used in this experiment were chemically sex reversed ie from female to male and thus during the filleting process only 10 were identified as females Of that 10 a disproportionate number of females did not reach the 300g minimum cut-off weight for filleting thus only 24 fish identified as females were filleted
22 International Journal of Recirculating Aquaculture Volume 5 June 2004
Fillet Yields ofTilapia (Oreochromis)
The filleting was conducted by two competent fish cutters with extensive experience in filleting tilapia for a small Midwestern tilapia producer The v-notched skinless filleting was primarily accomplished with electric carving knives One individual cut across the torso just behind the gill and then cut horizontally down along the backbone through the ribcage to the tail While still attached to the tail the side of the fish was then flipped over and another horizontal cut was made along the skin to separate the meat from the skin and scales The sex of the fish was then determined based upon the internal sex organs The procedure was repeated on the other side of the fish The other individual cut the ribcage out of the fillet with an electric knife and removed the pectoral fin with a v-shaped cut The combined weights of the fillets for each fish were determined to the nearest gram on a digital scale
RESULTS
Fillet Weight Model A mathematical model of the fillet weight (Wf) in grams was fitted using the linear regression procedure (SAS Cary NC USA) Considered in the model were polynomials of weight and length condition factor temperature and feeding rate sex and interaction terms of the primary factors Only fish weight (W) in grams and length (L) in millimeters were found to be significant at the 95 confidence level and the resulting model was Wr = 650 - 0403L + 0401 W with a coefficient of determination (r2) of 0913 The reduced model Wr = -167 + 0336W produced an r2 of 0906 The fillet weight versus fish weight data and the regression line are shown in Figure 1 It appears that weight is a
--middot Figure I Relationship between fish weight and total fillet weight
International Journal of Recirculating Aquaculture Volume 5 June 2004 23
Fillet Yields o1ilapia (Oreochromis)
very good predictor of fillet yield and that for a given weight shorter fatter fish produce a slightly higher yield Although losing some predictive power the reduced model is more appropriate for several reasons Fish length and weight are highly correlated and therefore most of the predictive capability of length can be accounted for in the weight measurement The large positive intercept and the large negative coefficient for length in the full model are intuitively illogical Beyond the limits of the data set the full model produces unreasonable predictions For example predicted fillet weight of fingerlings would exceed the entire weight of the fish On the other hand the coefficients of the reduced model are intuitively logical and produce reasonable estimates of the fillet weights even beyond the limits of the data collected For the reduced model the 95 confidence interval for they-intercept is -215 to -119 and the 95 confidence interval for the weight coefficient is 0326 to 0347 Considering the variation in yield introduced by the filleting process the linear correlation between fillet yield and weight is good
Effect of Sex on Fillet Yields As noted previously fillet yield is a function of size and on average the females were only 666 as heavy as their male counterparts for a given treatment The question to be answered is whether the fillet yields of males and females of similar weights are different Once this is known it can be determined whether unisex production should be priced differently than mixed-sex production As noted above gender was not a significant factor in the construction of the fillet model but a paired t-test is a stronger statistical test For each of the 24 filleted females a male was selected at random that had the same or nearly the same body weight A paired t-test was used to compare the fillet weights and fish lengths of equal-sized males and females At the p = 005 level the differences in fillet yields were not significant but the males were found to be significantly longer F tests were used to compare the variance of the fillet weights and the lengths At the p = 005 level no statistical difference could be detected in the variance of the fillet weights or lengths
24 International Journal of Recirculating Aquaculture Volume 5 June 2004
Fillet Yields ofTilapia (Oreochromis)
Table 1 Comparison of length weight fillet weight and yield of males and females of comparable weight
Length Fillet (mm) Weight (g) Weight (g) Yleld ()
Males Average 2670 3758 1087 029 (SD) 147 647 244 0024
Females Average 2618 3760 1103 029 (SD) 153 647 219 002
DISCUSSION Weight is a good predictor of fillet yield The full model regression formula that included both fish weight and fish length produced a model with slightly greater predictive power than the reduced model that used only fish weight and could thus be of interest from an academic perspective Its predictive power is only slightly better than that of the reduced model From a practical perspective weight is relatively easy to measure whereas length is not and thus for commercial applications the reduced model is a more valuable tool than the full model
The wholesale price per kilogram for tilapia is generally based upon fish weight-fish heavier than 600g bring a premium price those between approximately 350 and 600g an intermediate price and those less than 350g a lesser price (Fitzsimmons and Posadas 1997) The reduced model predicts yields of 288 and 308 for 350g and 600g fish respectively which would justify a price premium of approximately 7 based strictly upon the increase in yield but which does not include any reduction in processing costs The yields obtained from this experiment are lower than both the 33 yield figure cited as a rule of thumb by Fitzsimmons and Posadas (1997) and the average fillet yield of 335 from 0 niloticus averaging 2074g cited by Obanu and lkeme (1988) In contrast Clement and Lovell (1994) obtained only a 254 fillet yield from 0 niloticus that weighed an average of 585g Several factors could account for the discrepancies including tilapia species and the skill of the fish cutter However the largest source of variation is likely to be the methods and procedures used in filleting which unfortunately are generally not reported in the literature Variability introduced by fillet technique and skill of the cutter is not included in this model because only one set of cutters was used
International Journal of Recirculating Aquaculture Volume 5 June 2004 25
Fillet Yields of Tilapia (Oreochromis)
Fillet yield is important information for making management decisions in pricing fish products selecting species specifying feed rations and controlling production costs Muscle yield of fish species has a big impact on the profitability of the aquaculture firm and on the survival of a specific marketing channel The fish producer is the last claimant to the consumers market price for fish and fish products The more handlers there are operating in a marketing channel the smaller the margins for each handler Gross retail margins for fresh fish usually command between 30 and 50 of the total profit depending on the marketing season and the fish species Producers are accustomed to marketing whole fish while customers are used to purchasing fish fillets When the useable flesh is separated from the whole fish the result is the fillet and a by-product Typically these by-products of the fish filleting process do not have significant value and their production cost has already been factored into the fish value The higher the yield ratio of muscle to by-product and the higher the market price the greater the chance a producer has of receiving a higher return on the aquaculture product Documentation of fillet yields coupled with market price indicate the value of the fish products in a marketing channel The better the yield the better the survival of a species in the marketplace
ACKNOWLDEGEMENT This material is based upon work supported by the Cooperative State Research Education and Extension Service US Department of Agriculture under Project No VA135559
REFERENCES Clement S Lovell RT Comparison of Processing Yield and Nutrient
Composition of Cultured Nile Tilapia (Oreochromis niloticus) and Channel Catfish (Ictalurus punctatus) Aquaculture 1994 119 299-310
Fitzsimmons K Posadas BC Consumer Demand for Tilapia Products in the US and the Effects on Local Markets in Exporting Countries In Proceedings of the Fourth International Symposium on Tilapia in Aquaculture (Orlando FL USA) Fitsimmons K (Ed) 1997 NRAES-106 Natural Resource Agriculture and Engineering Service (NRAES) Ithaca NY USA
26 International Journal of Recirculating Aquaculture Volume 5 June 2004
Fillet Yields oTilapia (Oreochromis)
Harvey D 2000 Aquaculture Outlook Economic Research Service US Department of Agriculture (Pub LDP-AQS-12) Washington DC USA
Kirkup SP Marsh LS Libey GS Heath AG Coale CW Haugh CG Effects of Temperature and Feeding Rates upon Growth and Feed Conversion Ratios in Tilapia In Proceedings of the Third International Conference on Recirculating Aquaculture (Roanoke VA USA) Flick G J and Rakestraw T (Eds) 2000 Virginia Tech Blacksburg VA USA
Losordo TM Westerman PW An Analysis of Biological Economic and Engineering Factors Affecting the Cost of Fish Production in Recirculating Aquaculture Systems Journal of the World Aquaculture Society 1994 25193-203
Obanu ZA lkeme AI Processing Characteristics and Yield of Some Fishes of the River Niger in Nigeria In Proceedings of the FAQ Expert Consultation on Fish Technology in Africa (Abidjan Cote DIvoire) FAQ Fish Report 1988 Supplement No 400 pages 218-220
Phipippart J-Cl Ruwet J-Cl Ecology and Distribution of Tilapias In_ ICLARM Conference Proceedings 7 (Bellagio Italy 1980) Pullin RSV and Lowe-McConnell RH (Eds) 1982 International Center for Living Aquatic Resources Management (ICLARM Manila Philippines
HematPlogy and Blood Chemistry Reference Intervals for Yellow Perch (Percajlavescens) Raised in Recirculation Systems
TC Hrubec1 and SA Smith2
1Department of Biomedical Sciences E Via Virginia College of Osteopathic Medicine Blacksburg VA 24060 USA
2Department of Biomedical Sciences and Pathobiology (0442) Virginia-Maryland Regional College
of Veterinary Medicine Virginia Polytechnic Institute and State University Blacksburg VA 24061 USA
Corresponding author current address Department of Biomedical Sciences and Pathology (0442) Virginia-Maryland Regional College of
Veterinary Medicine Virginia Polytechnic Institute and State University Blacksburg VA 24061 USA E-mail thrubecvtedu
Keywords Yellow perch Perea hematology blood chemistry reference values plasma biochemistry
International Journal of Recirculating Aquaculture 5 (2004) 29-42 All Rights Reserved copy Copyright 2004 by Virginia Tech and Virginia Sea Grant Blacksburg VA USA
International Journal of Recirculating Aquaculture Volume 5 June 2004 29
Hematology and Blood Chemistry of Yellow Perch (Percaflavescens)
ABSTRACT Determination of hematology and blood plasma biochemistry values is routinely used to assess the health of wild and domestic animals Yellow perch (Percaflavescens) culture is a growing segment of the US aquaculture industry and tools are needed to monitor the health status of these fish This paper reports reference values for complete hematological and biochemistry profiles of normal healthy yellow perch raised in recirculation culture conditions The following hematologic values were determined packed cell volume plasma protein erythrocyte leukocyte lymphocyte neutrophil monocyte and thrombocyte numbers A description of leukocyte morphology is presented Additionally the following plasma biochemical values were determined total protein albumin globulin creatinine total bilirubin alkaline phosphatase aspartate aminotransferase sodium potassium chloride calcium phosphorus magnesium glucose and cholesterol Reference values for a specific population of fish need to be determined prior to utilizing diagnostic blood samples from individuals Developing diagnostic hematology for fishes can enhance yellow perch culture by providing a means for the early detection and identification of infectious disease and of sub-lethal conditions that may affect production performance
INTRODUCTION Yellow perch (Percaflavescens) are an important game fish throughout much of the Northeast and Midwestern United States and Canada Contamination of natural waters by pollutants and an increased consumer demand for fresh seafood has led to the aquaculture production of yellow perch The culture of yellow perch is a rapidly emerging segment of aquaculture in the United States (Schmitz 1999) and has great economic potential especially in recirculation aquaculture systems (Kelly 2000 Mallison 2000) As more producers cultivate yellow perch it will become increasingly important to accurately evaluate the health of these fish and to develop tools such as diagnostic hematology to monitor the health status of fish during their production cycle
Diagnostic evaluation of blood parameters has been used extensively for many mammalian avian and reptilian species The rapidly growing aquaculture industry will increasingly need to utilize information of this type in order to assess the health status of cultured fishes Unfortunately hematology use in aquaculture remains limited in part due to the lack of
30 International Journal of Recirculating Aquaculture Volume 5 June 2004
Hematology and Blood Chemistry of Yellow Perch (Percaflavescens)
reliable reference blood values for most fish species Accurate reference intervals have been developed for some species including hybrid striped bass and tilapia under different production settings (Hrubec et al 1996 1997ab 2000 2001 Hrubec and Smith 2000) and for trout (biochemistry only Wedemeyer and Nelson 1975) pacu (hematological only Tocidlowski et al 1997) and milkfish (Ram-Bhaskar and Srinivasa-Rao 1989)
Little is known about the blood response of yellow perch There are few studies that have previously measured blood values in yellow perch (Toneys and Coble 1980 Nelson et al 1988 Nelson and Mitchell 1992 van den Heuvel et al 2000) Only a few parameters such as hematocrit sodium and chloride were determined as most of these studies were toxicological in nature and evaluated changes in other body systems The objective of this study was to generate a complete comprehensive list of reference blood values for normal healthy yellow perch (Perea flavescens) raised to market size in a recirculation system for later use as a diagnostic tool This is the first paper to report full hematological and biochemical profiles for production yellow perch
MATERIALS AND METHODS
Juvenile yellow perch were stocked into production recirculation systems as fingerlings and reared through their production cycle indoors in 10219-L recirculation tanks with a rotating biological contactor filter and 10 freshwater exchange per day At the end of their production cycle when the fish were 17 months old approximately 250 fish were removed from the production system and placed in a smaller 2400-L circular tank with a slant tube clarifier and a trickle biofilter The smaller tank had a freshwater replacement rate of 15 per day The fish were placed in the smaller systems to allow for a more rapid and less stressful capture procedure The fish were acclimated to the new tanks for 3 weeks The photoperiod was approximately 14-h light and 10-h dark Fish were fed daily to satiation with a commercial pelleted diet (Rangen EXTR 400 40 protein 10 fat Rangen Inc Buhl ID USA) The following water quality parameters were determined daily temperature pH ammonia alkalinity hardness nitrite nitrate and dissolved oxygen Ranges for water quality over the duration of the study are shown in Table 1 and are representative of water quality observed daily in these tank systems
International Journal of Recirculating Aquaculture Volume 5 June 2004 31
Hematology and Blood Chemistry of Yellow Perch (Perea flavescens)
Table 1 Water quality parameters for yellow perch (Percaftavescens) reared in a recirculation culture system Values are means plusmn standard deviations for the parameters on the days that fish were bled for hematological and blood biochemical determinations and are representative of the daily water quality values in the system
Parameter For Hematology Fish For Chemistry Fish
Temperature (degC) 209 plusmn 001 207plusmn 11
pH 78plusmn01 79 plusmn 02
NH3 un-ionized (mgL) 0012 plusmn 0012 0011 plusmn 0005
N02-N (mgL) 0031 plusmn 0015 0043 plusmn 0043
N03-N (mgL) 60 plusmn 26 28 plusmn09
Alkalinity (mgL) 252 plusmn44 313 plusmn 48
Hardness (mgL) 399 plusmn 10 433 plusmn27
Dissolved Oxygen (mgL) 74plusmn05 74 plusmn03
Fish were netted rapidly and anesthetized in aerated tank water with buffered tricaine methanesulfonate (MS-222 Sigma Chemical Co St Louis MO USA) until they began to lose equilibrium approximately 20 seconds Individual fish were bled for either hematological determinations (23g needle 1-mL syringe) or for biochemical determinations (23g needle 3-mL syringe) in both cases blood was collected from the caudal vessels After blood samples were collected the fish were weighed measured and checked for external and internal pathologic lesions The sex of each fish was determined by internal observation of the gonads
Blood for hematological determinations was transferred to an ethylenediamine-tetraacetic acid (EDTA) treated pediatric blood tube and held on ice until analysis (lt 1 hour) Blood for biochemical determinations was collected into cold 3-mL heparinized blood tubes and centrifuged at 14000 x g immediately Plasma was collected and frozen at -10degC until analyzed The following analytes were determined in the plasma with an Olympus AU-400 (Olympus America Inc Melleville NY USA) automated clinical chemistry analyzer total protein albumin creatinine total bilirubin alkaline phosphatase (ALP) aspartate aminotransferase (AST) cholesterol glucose sodium potassium chloride phosphorus calcium and magnesium Globulin was calculated from the total protein value minus the albumin value
32 International Journal of Recirculating Aquaculture Volume 5 June 2004
Hematology and Blood Chemistry of Yellow Perch (Percaflavescens)
Hematological analytes were determined from the EDTA anticoagulated blood As we have observed for other fish species EDTA was superior to heparin for yellow perch blood both in preventing clot formation and preserving cellular morphology (Hrubec et al 1996 2000) Blood from the EDTA tube was drawn into microhematocrit tubes and the packed cell volume (PCV) determined after centrifugation at 10000 x g for 5 min Plasma protein was determined with a clinical refractometer using plasma from the microhematocrit tube The total erythrocyte and leukocyte-plus-thrombocyte counts were determined manually with a Neubauer hemacytometer using Natt-Herricks solution as a diluent stain (Natt and Herrick 1952) Blood smears made within 45 minutes of sample collection were stained with Wright-Geimsa stain and were used to determine the differential counts as follows Leukocytes and thrombocytes were identified and counted on the blood smears until 200 leukocytes and a variable number of thrombocytes were enumerated The percentages of each leukocyte type and of thrombocytes were multiplied by the total leukocyte-plus-thrombocyte number to give the final cell counts Thrombocyte numbers were subtracted from the leukocyte-plus-thrombocyte count to give the total leukocyte count This method of manually determining total leukocyte and differential counts has been recommended for use with avian (Zinkl 1986) and fish blood (Hrubec et al 1996 1997ab 2000 2001) as the nucleated red cells prevent accurate enumeration using automated analysis (Huffman and Arkoosh 1997) Slight thrombocyte clumping was observed on the hemacytometer for some individuals only fish with minimal thrombocyte clumping(lt 4 cells clumped) were used for the differential counts to ensure accuracy of the counts
Reference intervals were determined following the guidelines proposed by the National Committee for Clinical Laboratory Standards (NCCLS 1992) As suggested in these guidelines the data were checked for outliers using the 13 differencerange ratio and no outliers were identified The values were then ranked and the high and low 25 were discarded The range of the remaining values provided the reference interval
RESULTS AND DISCUSSION The physiologic and health status of an individual is reflected in the blood producing variations in hematological and blood biochemical values Clinical analysis of blood is a fundamental tool used in human
International Journal of Recirculating Aquaculture Volume 5 June 2004 3 3
Hematology and Blood Chemistry of Yellow Perch (Percaflavescens)
and veterinary medicine to diagnose and predict the outcome of disease and to monitor the effect of therapeutic nutritional and environmental management Blood analysis is not used extensively as a diagnostic tool in fish medicine partly due to the lack of reference intervals for various fish species and also because changes associated with specific diseases and metabolic disorders are not well characterized With sufficient background data clinical analysis of individual blood samples could detect infectious diseases metabolic disorders and sub-lethal disease states affecting production performance
Hematological and plasma biochemistry data from diseased individuals can be evaluated by direct comparison to a reference interval which is the appropriate range of variation in a blood parameter from a defined population of individuals under specific conditions The reference interval needs to be determined on a sufficient number of normal healthy individuals under similar production conditions using standardized analytical techniques (NCCLS 1992) When the deviation in a blood parameter is large enough to fall outside the reference interval it indicates the value may be aberrant and is most likely not due to individual variation for a given fish
Few previous studies have determined blood parameters for yellow perch (Toneys and Coble 1980 Nelson et al 1988 Nelson and Mitchell 1992 van den Heuvel et al 2000) These studies are of limited relevance as they were primarily toxicological studies and only a few blood parameters were determined and also because blood samples were collected and handled by differing methods prior to determination of the blood value Some of the capture (hook and line and gill netting) and blood collection methods (severing the caudal peduncle) used in these studies are also unsuitable for diagnostic blood samples as they result in significant alteration in the blood which will mask diseased states The study with the closest sampling procedure to that used in our experiment only presented selected blood chemistry values for yellow perch after 16 hours of moderate or exhaustive exercise (Nelson and Mitchell 1992) Therefore although the previous studies on yellow perch hematology are helpful in determining the effects of environmental factors and stress they have limited diagnostic utility and even prevent meaningful comparison with the data presented in this paper
The average mean weight of the yellow perch used for the hematological determinations was 125 +- 14g with a total length of 223 +- 08 cm For
34 International Journal of Recirculating Aquaculture Volume 5 June 2004
Hematology and Blood Chemistry of Yellow Perch (Percajlavescens)
the biochemical determinations the fish had a weight of 121 +- 15g and length of 226 +- 08 cm The results of the hematological determinations from 52 fish are listed in Table 2 Values for plasma chemistry reference intervals determined on 42 samples are listed in Table 3 Overall both the hematological and plasma chemistry values were similar to those reported previously for hybrid striped bass and tilapia reared in recirculation systems (Hrubec et al 1996 2000 Hrubec and Smith 2000) The striped bass and tilapia from production systems exhibited wider ranges in value for the different leukocyte types increased numbers of reticulocytes increased plasma and total protein values increased creatinine values and a decreased plasma chloride concentration as compared to fish in lower density recirculation tanks We did not compare blood values from the production yellow perch in this study to yellow perch maintained in low-density tank settings so were unable to determine if these same trends are apparent in yellow perch as well However based on our previous experience with fish hematological and plasma biochemical values there is an indication that these trends are occurring in yellow perch as well
Table 2 Hematological reference intervals for adult yellow perch (Perea flavescens) reared in a recirculation system
Analyte N Reference Interval Mean Stds1
PCV2 () 57 29-47 388 45
Plasma Protein (gdl) 57 60-82 67 06
Erythrocytes (x 106ml) 53 2160-3345 2737 0356
Leukocytes (ml) 53 52590-186490 113914 39086
Lymphocytes (ml)
Small 53 36800-153420 85630 31728
Large 53 3530-23 130 11602 5359
Neutrophils (ml) 53 1860-35950 12430 8837
Monocytes (ml) 53 670-12640 4252 2874
Thrombocytes (ml) 53 38270-118510 72972 21299 1Standard deviation 2Packed cell volume
International Journal of Recirculating Aquaculture Volume 5 June 2004 35
Hematology and Blood Chemistry of Yellow Perch (Perea flavescens)
Table 3 Plasma biochemical values for adult yellow perch (Percaftavescens) reared in a recirculation system
Analyte N Reference Interval Mean Stds1
Total Protein (gdl) 42 37-50 45 04
Albumin (gdl) 42 06-09 07 01
Globulin (gdl) 42 31-42 37 03
Creatinine (mgdi) 42 04-10 06 01
Total bilirubin (mgdi) 42 03-04 03 01
ALP2 (UI) 42 50-114 822 249
AST3 (UI) 42 2-29 85 64
Glucose (mgdi) 42 62-181 1000 350
Cholesterol (mgdi) 42 182-323 2440 330
Sodium (mEqI) 42 138-153 1470 40
Potassium (mEqI) 42 20-38 32 05
Chloride (mEqI) 42 119-133 1260 40
Calcium (mEqI) 42 86-120 103 13
Phosphorus (mEqI) 42 50-96 74 11
Magnesium (mEqI) 42 17-34 27 04 1 Standard deviation 2 Alkaline phosphatase 3 Aspartate aminotransferase (SGOT)
The blood cells present in the yellow perch were typical of teleost fish and included erythrocytes thrombocytes and leukocytes (Fig 1) Erythrocytes were oval to round with characteristic red cytoplasm and an elongate and centrally-located nucleus Immature erythrocytes or reticulocytes demonstrated a blue-purple tinge to the normal eosinophilic cytoplasm (Fig IA B C) The yellow perch had increased numbers of reticulocytes (included in the erythrocyte count) with approximately 7 to 10 per field at lOOx oil immersion compared to what we observe for most fish species The cause for the apparent reticulocytosis is not known but has been observed in other fish species exposed to elevated nitrite and nitrate (Grabda et al 1974 Hrubec et al 1996 2000 Hrubec and Smith 2000)
36 International Journal of Recirculating Aquaculture Volume 5 June 2004
Hematology and Blood Chemistry of Yellow Perch (Perea flavescens)
T bull middotmiddot ~~ - middot
N -
Figure I Characteristic blood cells from yellow perch reared in recirculation systems Blood smears were made with EDTA anticoagulated blood stained with Wrights Geimsa stain Cells are abbreviated as follows U - Large lymphocyte SL - small lymphocyte T - thrombocyte R - reticulocytes (immature erythrocyte) PC - plasma cell (activated lymphocyte) M- monocyte N-neutrophil The blue bar in frame A is Omm
International Journal of Recirculating Aquaculture Volume 5 June 2004 37
Hematology and Blood Chemistry of Yellow Perch (Percajlavescens)
The thrombocytes were slightly smaller than the erythrocytes (Fig IA) They had clear cytoplasm and were variable in shape being elongated pyriform oval or round Nuclear shape tended to follow cytoplasmic shape although oval and round thrombocyte nuclei occasionally were lobulated (Fig IB) as described for striped bass and tilapia (Hrubec et al 1996 2000)
Leukocytes made up the remainder of the cell types seen in the blood and included small and large lymphocytes neutrophils and monocytes No eosinophils or heterophils were observed Small lymphocytes were the smallest cell present with a rim of blue cytoplasm surrounding the round nucleus (Fig IA E F) Large lymphocytes had an abundant and darker blue cytoplasm and the nucleus was larger than observed in the small lymphocyte (Fig IA E) Plasma cells were occasionally observed with a classic open nucleus abundant dark blue cytoplasm and a clear cytoplasmic region adjacent to the nucleus presumably representing the Golgi as in mammalian plasma cells (Fig IC) Plasma cells were included in the large lymphocytes category for the differential counts
Neutrophils were the largest cell present in the blood (Fig ID E F) The cytoplasm of the neutrophil was a translucent grey containing no granules and infrequent vacuoles Cytoplasmic shape was round to angular as the cellular borders often appeared slightly adherent to adjacent erythrocytes distorting cellular shape Nuclear shape of the neutrophil varied from round to horseshoe shaped and frequently segmented into two prominent lobes connected by a thin nuclear bridge (Fig IF) Monocytes had abundant dark blue cytoplasm that was frequently vacuolated (Fig ID) The round to kidney-bean shaped monocyte nucleus was large with prominent chromatin clumping
Analysis of blood parameters can provide a wealth of information useful in analyzing the effects of disease and sub-optimal environmental conditions Providing reference intervals for healthy adult yellow perch reared in recirculation systems furnishes veterinarians and fish health professionals the foundation to develop diagnostic hematology for this species The number of studies that determine actual reference intervals for fish species is limited The majority of blood values determined for fishes are reported in the literature as a mean value with a standard deviation Historically reference intervals were determined as two standard deviations from the mean however this method is only valid when blood values follow a normal distribution It is incorrect to assume
38 International Journal of Recirculating Aquaculture Volume 5 June 2004
Hematology and Blood Chemistry of Yellow Perch (Percaflavescens)
that biological parameters are distributed normally therefore non-parametric methods should be used to accurately determine reference intervals (Reed et al 1971) Techniques to properly determine reference intervals have been established by the NCCLS (1992) and suggestions for their use and interpretation have been discussed (Lumsden 1998) As with mammalian species reference intervals need to be determined for different populations of fish within a single species as culture conditions and environmental variables affect blood values to the extent that they are outside the reference interval (Ram-Bhaskar and Srinivasa-Rao 1989 Hrubec et al 1996 1997ab 2000 2001) Although the reference range for some of the blood parameters appears large it is still possible to detect variation in hematologic values associated with pathological conditions (Hrubec et al 1997b and unpublished data)
Developing reference intervals is a necessary first step in determining which specific hematological changes can be associated with disease conditions As the field of fish hematology develops its usefulness to the aquaculture industry will increase Information derived by standardized non-lethal diagnostic assays will be needed to enhance the culture of yellow perch and other fish species Analysis of diagnostic blood samples can provide a means for early detection of infectious disease and assist in the identification of sub-lethal conditions affecting production performance This should allow for more specific timely and effective disease treatments in the future
ACKNOWLEDGEMENTS The authors wish to thank Mark Kidd of the Virginia Tech Aquaculture Center for his assistance with fish care and sampling
REFERENCES Grabda E Einszporn-Orecka T Felinska C Zbanyszek R
Experimental Methemoglobinemia in Rainbow Trout Acta Ichthyologica et Piscatoria 1974 4 43-71
Hrubec TC Smith SA Robertson JL Feldman B Veit HP Libey G Tinker MK Comparison of Hematologic Reference Intervals between Culture System and Type of Hybrid Striped Bass American Journal of Veterinary Research 1996 57 618-623
International Journal of Recirculating Aquaculture Volume 5 June 2004 3 9
Hematology and Blood Chemistry of Yellow Perch (Percajiavescens)
Hrubec TC Robertson JL Smith SA Effects of Temperature on Hematologic and Serum Biochemical Profiles of Hybrid Striped Bass (Morone chrysops x Morone saxatilis) American Journal of Veterinary Research 1997a 58 126-130
Hrubec TC Robertson JL Smith SA Effects of Ammonia and Nitrate Concentration on Hematologic and Serum Biochemical Profiles of Hybrid Striped Bass (Morone chrysops x Morone saxatilis) American Journal of Veterinary Research 1997b 58 131-135
Hrubec TC Smith SA Hematology and Plasma Chemistry Values for Production Tilapia ( Oreochromis hybrid) Raised in a Recirculation System International Journal of Recirculating Aquaculture 2000 J 5-14
Hrubec TC Cardinale JL Smith SA Hematology and Plasma Chemistry Reference Intervals for Cultured Tilapia ( Oreochromis hybrid) Veterinary Clinical Pathology 2000 29 7-12
Hrubec TC Smith SA Robertson JL Age Related Differences in Hematologic and Plasma Chemistry Analytes of Hybrid Striped Bass Morone chrysops x Morone saxatilis Veterinary Clinical Pathology 2001 30 8-15
Huffman PA Arkoosh MR Characteristics of Peripheral Blood Cells from Rainbow Trout Evaluated by Particle Counter Image Analysis and Hemocytometric Techniques Journal of Aquatic Animal Health 1997 9 239-248
Kelly AM Yellow Perch Culture in the United States Manna or Mania World Aquaculture 2000 31 4-17
Lumsden JH Normal or reference values Questions and Comments Veterinary Clinical Pathology 1998 27 102-106
Mallison JA 2000 A White Paper on the Status and Needs of Yellow Perch Aquaculture in the North Central Region North Central Regional Aquaculture Center Michigan State University E Lansing MI USA
Natt MP Herrick CA A New Blood Diluent for Counting Erythrocytes and Leukocytes of the Chicken Poultry Science 1952 31 735-738
40 International Journal of Recirculating Aquaculture Volume 5 June 2004
Hematology and Blood Chemistry of Yellow Perch (Percaflavescens)
NCCLS National Committee for Clinical Laboratory Standards 1992 How to Define Determine and Utilize Reference Intervals in the Clinical Laboratory Proposed Guidelines NCCLS Document C28-P Villanova PA USA
Nelson JA Mitchell GS Blood Chemistry Response to Acid in Yellow Perch (Perea flavescens) Comparison of Populations from Naturally Acidic and Neutral Environments Physiological Zoology 1992 65 493-514
Nelson JA Magnuson J J Chulkasem W Blood Oxygen Capacity Differences in Yellow Perch (Percaflavescens) from Northern Wisconsin Lakes Differing in pH Canadian Journal of Fisheries and Aquatic Sciences 1988 45 1699-1704
Ram-Bhaskar B Srinivasa-Rao K Influence of Environmental Variables on Hematology and Compendium of Normal Hematological Ranges of Milkfish Chanos chanos (Forskal) in Brackish Culture Aquaculture 1989 83 123-136
Reed AH Henry RJ Mason WB Influence of Statistical Method Used on the Resulting Estimate of Normal Range Clinical Chemistry 1971 17 275-284
Schmitz M 1999 Comparative Growth of All-Female Versus Mixed Sex Yellow Perch (Percaflavescens) in Recirculating Aquaculture Systems MS Thesis Virginia Tech Blacksburg VA USA
Toneys ML Coble DW Mortality Hematocrit Osmolality Electrolyte Regulation and Fat Depletion of Young-of-the-Year Freshwater Fishes under Simulated Winter Conditions Canadian Journal of Fisheries and Aquatic Science 1980 37 225-232
van den Heuvel MR Power M Richards J MacKinnon M Dixon DG Disease and Gill Lesions in Yellow Perch (Percaflavescens) Exposed to Oil Sands Mining-Associated Waters Ecotoxicology and Environmental Safety 2000 46 334-341
Wedemeyer GA Nelson NC Statistical Methods for Estimating Normal Blood Chemistry Ranges and Variance in Rainbow Trout (Salmo gairdneri) Shasta Strain Journal of the Fisheries Research Board of Canada 1975 32 551-554
International Journal of Recirculating Aquaculture Volume 5 June 2004 41
Hematology and Blood Chemistry of Yellow Perch (Percajlavescens)
Zinkl JG Avian Hematology In Schalms Veterinary Hematology (4th edition) Jain NC (Ed) 1986 Pages 256-260 Lippincott Williams amp Wilkins Philadelphia PA USA
42 International Journal of Recirculating Aquaculture Volume 5 June 2004
Hatchery and Grow-out Performance of Sunshine Bass and Backcross Hybrid Striped Bass in Recirculating Aquaculture Systems
SR Lindell1bull2 B Delbos1 R Perham1 J Goldman1 EM Hallerman3 TO Brenden3bull4
1 Fins Technology 15 Industrial Road Turners Falls MA 01376 USA
2Current address Marine Biological Laboratory Marine Resources Center 7 MBL Street Woods Hole MA 02543 USA
3Department of Fisheries and Wildlife Sciences (0321) Virginia Polytechnic Institute and State University Blacksburg VA 24061 USA
4Current address Institute of Fisheries Research University of Michigan 1109 N University Avenue Ann Arbor MI 41809 USA
Corresponding authors e-mail ehallermvtedu
Keywords striped bass performance aquaculture growth
International Journal of Recirculating Aquaculture 5 (2004) 43-54 All Rights Reserved copyCopyright 2004 by Virginia Tech and Virginia Sea Grant Blacksburg VA USA
International Journal of Recirculating Aquaculture Volume 5 June 2004 43
Performance of Sunshine Bass and Backcross Hybrid Striped Bass
ABSTRACT Previous research has suggested that backcross hybrid striped bass (BX sunshine bass female x striped bass male) perform as well as F 1 hybrid striped bass (sunshine bass white bass female x striped bass male) for many economically important traits We conducted trials to compare rearing and growth traits of selected backcross hybrid striped bass with hybrid striped bass (HSB) We spawned and reared larval BX fry in two hatchery cycles measured fry growth and performance and compared them to past performance of HSB fry We conducted a grow-out trial of commercially-available hybrid striped bass versus backcross hybrid striped bass in replicated tanks to phase II fingerling size (approximately lOOg) Compared to HSB in the hatchery phase backcross hybrid striped bass exhibited lower fertilization rate comparable swimbladder inflation rate shorter time-to-weaning lower survival comparable growth and comparable condition factor After 60 days HSB exhibited significantly better growth survival and feed conversion efficiency than BX However BX may have better potential market acceptance by virtue of having a lower condition factor appearing longer and less deep-bodied than HSB
INTRODUCTION Striped bass (Morone saxatilis) and its hybrids constitute a major sector of aquaculture in the United States with production of 105 million pounds in 2002 (Carlberg and Van Olst 2003) Commercially significant quantities of Morone stocks also are produced in Taiwan China and Israel Approximately 43 of Morone production occurs in tanks (Carlberg and Van Olst 2003) much of that in recirculating aquaculture systems (RAS) Private and government marketing experts estimate that US production could increase to 50 million pounds and $100 million in annual farm-gate revenue if market prices could be decreased only moderately (Halbrendt et al 1991) Production costs for HSB could be reduced by 12 if selective breeding can yield 20 faster growth rates (Losordo and Westerman 1994)
The majority of Marone production is not of striped bass but of its hybrids with white bass (M chrysops) because of their hardiness rapid growth rate and limited availability of female striped bass broodstock (reviewed by Harrell 1997) Further female WB are considered easier and more predictable to strip-spawn Hence most commercial production
44 International Journal of Recirculating Aquaculture Volume 5 June 2004
Performance of Sunshine Bass and Backcross Hybrid Striped Bass
is of sunshine bass the progeny of the white bass female x striped bass male interspecific cross Research has also been undertaken to evaluate the performance of second generation hybrids and backcrosses Several studies have suggested that the progeny of F 1 hybrid striped bass females backcrossed to striped bass males have merit for commercial production Jenkins et al (1998) compared the performance of backcross hybrids to F1 hybrid striped bass and striped bass to market size in a recirculating system At harvest no differences in growth rate or feed conversion were detected specific growth of BX was intermediate to those of the other stocks with survival lower Tomasso et al (1999) compared performance of F 1 and backcross hybrids between 20 and 90 grams for 56 days in tanks (Tomasso et al 1999) and observed similar survival growth and feed conversion rates among the hybrid types Detailed comparison of the hatchery performance of sunshine and BX hybrids is lacking We hypothesized that use of selected hybrid striped bass and striped bass for the backcross might yield a high-performance BX hybrid Should high performance be realized progressive fish farmers might utilize this approach by selecting the best F1 hybrid females from their own production stocks making the backcross by strip-spawning them and fertilizing the eggs with purchased milt from selectively bred striped bass males (Kerby 1983) thereby obtaining a high-performance production stock that because of selection on the maternal stock is suited to their particular farm conditions
In this study we evaluated the production potential of backcross (BX) hybrid striped bass (female sunshine bass x male striped bass) We compared the hatchery and grow-out performance of BX spawned from select broodstock and sunshine bass (HSB) of common genetic background Specifically we evaluated spawning success hatch rate growth survival and feed conversion efficiency through the first six months of life In order to benchmark our results we ran a trial in replicated tanks with HSB supplied by the most widely-used commercial source of fingerlings (Keo Fish Farms Keo AR USA) and compared their performance with our BX All fish were cultured within intensive controlled-environment recirculating aquaculture systems
International Journal of Recirculating Aquaculture Volume 5 June 2004 45
Performance of Sunshine Bass and Backcross Hybrid Striped Bass
MATERIALS AND METHODS In July 2001 we crossed 4 hybrid striped bass females to each of 4 striped bass males to produce 16 families of backcross hybrid striped bass Poor fertilization rates resulted in a low yield of fry from this spawn However there were enough fry to pool and conduct a pilot commercial-scale hatchery run Randomly-chosen samples from the resulting 4000 fingerlings were used for the grow-out trial
In October 2001 we spawned 3 female HSB with 2 male SB and eventually produced 7000 fingerlings While this was not enough to grow in commercial-scale systems we collected hatchery performance data to corroborate our JulyAugust experience with BX
Fertilized eggs were incubated in McDonald jars Upon hatch the larvae swam out of the hatching jar and into a 1900-L larval rearing tank Replicate larval rearing tanks were stocked with approximately 25 larvae per liter Tanks were maintained with recirculating water and surface oil-skimming pads for the first 5 to 7 days post-hatch until swim-bladder inflation was completed For the second week post-hatch larval rearing tanks were maintained static with gentle central aeration except for an exchange of about 30 of the tank water over the course of two hours each day During the second week post-hatch larvae were fed rotifers enriched with Algamac (Aquafauna BioMarine Inc Hawthorne CA USA) maintained at a density of 10ml By the end of the second week larvae were weaned from rotifers to Artemia nauplii By the end of the third week the larvae were typically weaned from enriched Artemia to artificial feed (Biokyowa Inc Girardeau MO USA) Weaned larvae were graded just once around 60 days post-hatch to remove the top 1 to 2 of larger fish responsible for cannibalism
In November 2001 we purchased lOg fingerlings that represent typical industry-standard HSB from Keo Fish Farms (Keo AR USA) These HSB closely matched the size and weight of our BX from the July spawn for the grow-out trial BX and HSB fingerlings were each stocked separately in triplicate 1900-L round tanks connected to the same recirculating system and reared at 23degC and a salinity of 1-3 ppt All six tanks were similarly stocked initially (approximately 1 kgm3) Fish were offered 80 of their expected ration via belt-feeders and hand-fed to satiation twice a day Approximately every 3 weeks length and weight samples were taken from a randomly-chosen 15 of each tanks
46 International Journal of Recirculating Aquaculture Volume 5 June 2004
Performance of Sunshine Bass and Backcross Hybrid Striped Bass
population At the conclusion of the project the tanks reached typical commercial densities of 5 to 9 kgm3bull
We quantified reproductive and hatchery performance of the three groups including fertilization rate swimbladder inflation rate days to weaning onto artificial feed (ie date of first ingestion to date that gt90 ingested artificial feed) survival estimates to approximately 60 days after hatch and to the end of the study feed conversion rate and monthly average weight and length The trial continued until mid-February 2002 when the HSB averaged approximately lOOg Results from previous years hatchery efforts with HSB using similar rearing protocols were used for comparative purposes
Both the hatchery and grow-out systems employed water recirculation technology including drum-filters fluidized-bed biofilters oxygenation ozonation and automated pH and temperature control that maintained high water-quality standards throughout the trials
Differences in fish weight between the hybrid types were analyzed as a repeated-measures general linear mixed model Residual (restricted) maximum likelihood was used to estimate the model parameters Initial fish biomass in each of the tanks and the amount of feed provided to each of the tanks were included in the model as covariates to assess the influence of these concomitant variables on differences in weight A first-order autoregressive covariance structure was assumed for the repeated-measurements of fish weight
Differences in fish survival at the end of the grow-out trial were analyzed as a general linear model with tanks serving as a blocking factor Because fish survivalmortality is a binary response and thus will violate an assumption of normality the significance of the test comparing survival between the hybrid types was obtained by randomization (number of randomizations= 1000) whereby the F-statistic of the original test was compared to F-statistics obtained by randomly allocating the survival mortality data to the different hybrid types The Type-I error rate for all statistical tests was set equal to 005
International Journal of Recirculating Aquaculture Volume 5 June 2004 47
Performance of Sunshine Bass and Backcross Hybrid Striped Bass
Table 1 Comparison of hatchery traits of backcross (BX) and Fl hybrid (HSB) striped bass for traits of economic interest
Traits of interest BX-HSB BX-HSB HSB HSB HSB
Female parent strain1 AR ARMD AR AR AR
Male parent strain1 MD FL MD FL MD MD FL MD Canada
Spawn date Oct-01 Jul-01 Mar-01 Oct-00 Jan-99
Fertilization 32 22 53 57
Swimbladder inflation 90 50 98 95
Weaning start (DAH)2bull3 24 21 17 22
Weaning end (DAH4 33 32 37 38
Mean wt (g) at 60 DAH 042 052 042 05
Survival to 60 DAH 7 740 104
Mean L (mm) at 30 DAH 133 11 1225
Mean L (mm) at 36 DAH 139 167
Mean L (mm) at 75 DAH 367 404 452
Mean Wt (g) at 75 DAH 074 081 12 0825 11
Condition factor at 1g 123E-05 118E-05 1Strain abbreviations AR=Arkansas R MD=Maryland FL=Florida 2DAH=Days after Hatch 3Weaning start marks the first introduction and ingestion of dry feed to replace live feeds 4Weaning end denotes the time when the transition to dry feeds is complete and live feeds are no longer utilized
RESULTS
Hatchery Trial Results A summary of performance for hatchery traits of production interest for BX and HSB is presented in Table 1
The fertilization rate for the BX eggs was lower than that which we typically found with HSB (22-32 vs 55) and considerably lower than our experience in 2000 when we conducted fertilization trials with BX (80)
Swimbladder inflation rate ranged from 50 in the first hatchery run to 90 in the second run We attribute the low rate in the first run to
48 International Journal of Recirculating Aquaculture Volume 5 June 2004
Performance of Sunshine Bass and Backcross Hybrid Striped Bass
surface-film and system management problems We showed in the second run that swimbladder inflation in BX was comparable to that typically attainable (gt90) for Morone fry
Time-to-weaning onto dry diets was shorter (10 days versus 18 days) and earlier (day 33 versus day 38) for BX than for HSB Survival of BX to 60 days after hatch (7) was lower than expected on the basis of previous experience with HSB (gt10) Mean weights for BX at 60 days after hatch in two hatchery runs (052 and 042g) was similar to those for HSB (042 and 05g) However HSB exhibited greater mean weight than BX at 75 days after hatch (l04 vs 077g)
Condition factor (K) of BX (123 + 009) was not significantly different from those of HSB (119 + 005) or striped bass (l13 + 003) at 1 gram mean weight
Frequencies of deformities for BX (lt2) were lower than those in earlier reports Bosworth et al (1997) reported deformities in 8 of BX and 4 ofHSB
Grow-out Trial Results Overall there was not a significant difference in weight between the hybrid types (F = 606 df = 13 P = 00907) however as evidenced in
100
80
60
40
20
--+- BX - Overall -0- HSB - Overall -ltgt- BX - Individual Tanks A middot middot middotbullmiddotmiddot middot HSB - Individual Tanks fi
fi ~o
12 Dec 2001 3 Jan 2002 24 Jan 2002 12 Feb 2002
Date Figure 1 Meanfish weight(plusmn 2 SE) at each time period for backcross hybrid striped bass (BX) and hybrid striped bass (HSB) Also shown is meanfish weight at each time periodor groups in individual tanks
International Journal of Recirculating Aquaculture Volume 5 June 2004 49
Performance of Sunshine Bass and Backcross Hybrid Striped Bass
Figure 1 there was a significant interaction on fish weight by hybrid type and time (F = 5157 df = 1587 P lt 00001) Using the slicing option available in SAS (SAS Institute 1999) we tested for differences in weight between the hybrid types for each time period and found that although weights of HSB and BX were not significantly different during the first two measurement periods (Time 1 F = 027 df = 1587 P = 06032 Time 2 F = 036 df = 1587 P = 05496) the hybrid types did differ in weight during the last measurement periods Specifically HSB were significantly heavier than BX on the 24th of January 2002 (F = 1061 df = 1 587 P = 00032) and the 12th of February 2002 (F = 3788 df = 1587 P lt 00001) Overall HSB had a specific growth rate of 268 per
Table 2 Mean weights of backcross hybrid striped bass (BX) and hybrid striped bass (HSB) over the course of a 3-month growth trial
Date BXTank5
Wt(g) SE
112101 1228
BXTank6 Wt(g) SE
1201
BX Tank 12 Wt(g) SE
1274
HSB Tank 13 HSB Tank14 HSB Tank 15 Wt(g) SE Wt(g) SE Wt(g) SE
1180 1016 1088
1211201 1744 102 1778 095 1658 096 1798 109 1752 118 1704 109
1 302 27 60 1 38 28 76 155 27 04 154 3306 157 3424 149 3414 211
1 2402 4196 252 4424 207 4882 299 6344 263 6192 326 6432 362
212102 6332 317 6763 334 6912 299 9474 473 9553 452 10500 388
Table 3 Comparison of survivalfeed conversion ratio (FCR) and condition factor at 60 grams for backcross hybrid striped bass (BX) and hybrid striped bass (HSB)
Cross Tank
Starting
Ending
Survival
BXS
160
136
85
BX 6 BX 12 HSB 13 HSB 14 HSB 15
160
138
86
161
137
85
178
177
99
179
173
97
180
179
99
Starting Biomass (g) 1964 1922 2051 2100 1819 1958
Ending Biomass (g) 8612 9334 9469 16770 16526 18795
Feed Fed(g) 12106 12135 11447 18041 17805 20463
FCR 182 164 154 123 121 122
Condition Factor 168E-05 166E-05 169E-05 194E-05 193E-05 208E-05
SE 353E-07 337E-07 424E-07 255E-07 327E-07 845E-07
50 International Journal of Recirculating Aquaculture Volume 5 June 2004
Performance of Sunshine Bass and Backcross Hybrid Striped Bass
day while BX had a specific growth rate of 205 per day Neither of the covariates included in the model were found to have a significant effect on weight differences (initial tank biomass F = 142 df = 1587 P = 02332 amount of feed F = 005 df = 1587 P = 08165)
Performance regarding key economic traits-survival feed conversion efficiency and condition factor-are summarized in Table 3 At the end of the grow-out trial survival of HSB was significantly greater than that of BX (F = 6216 df = 1 1014 P lt 00001) Feed conversion ratio was better for HSB (122) than for BX (166) Condition factors for BX were lower than those for HSB (l68 vs 198) meaning that BX appeared longer and less deep-bodied than HSB
DISCUSSION Our data showed that F1 HSB performed as well or better than BX for a range of hatchery- and grow-out-related traits
Hatchery traits Fertilization rates for backcross lots were approximately half that for HSB There was a wide variance for fertilization and hatch rates of eggs from HSB females Some of this variance may be due to differences in hatchery protocols (different hormone injections used strip vs tank spawning) at the commercial hatcheries where the data were collected (TIJ Smith personal communication) Poor hatch rates also may be attributable in part to hybrid breakdown that is to developmental incompatibilities among the genomes of the respective species when coadapted gene complexes are broken up at meiosis in the F1 (Hallerman 2003)
In the hatchery trial we hypothesize that the low swimbladder inflation rate for our J~ly fry resulted from offering first feed to the BX too early When rearing HSB and SB fry we typically wait until the yolk sac has been largely resorbed and the fry mostly have inflated their swimbladders before we introduce live feed This is because live feed can cause an oily film on the water surface that interferes with a frys successful ingestion of air bubbles necessary to inflate the swimbladder (Chapman et al 1988) The timing of swimbladder inflation varies with fry type and temperature with HSB typically inflating between 3 and 6 days after hatch and SB 6 to 9 days after hatch BX fry inflate their swimbladder at an intermediate time 5 to 8 days after hatch (DAH) Since for the July
International Journal of Recirculating Aquaculture Volume 5 June 2004 51
Performance of Sunshine Bass and Backcross Hybrid Striped Bass
spawn we introduced feed into their tanks at the time prescribed for HSB (at 5 DAH) BX fry may have had a reduced opportunity to inflate their swimbladders because of interference by a surface film with air contact In the October spawn we monitored swimbladder inflation more carefully and introduced live feed on day 7 after almost 90 of swimbladders were inflated The low swimbladder inflation rate in the July hatchery run of BX may have had a direct impact on survival Larvae without inflated swimbladders expend more energy swimming exhibit reduced growth rates are less tolerant of stress and often sink to the tank bottom and die (Van Heukelem et al 2000)
BX were weaned more quickly and earlier onto dry diets than HSB which may have helped contribute to their ability to match the size and weight of HSB at 60 DAH Earlier weaning has economic merit since dry diets are generally cheaper and easier to feed than brine shrimp
Grow-out traits After 60 days post-hatch the growth and other performance differences between BX and HSB became more evident HSB exhibited significantly better growth survival and feed conversion ratios
We hypothesized that backcross hybrid striped bass might grow as fast or faster than the standard commercially-available F 1 hybrid striped bass if high-performance HSB females were selected as broodstock Our data regarding performance in intensive tank systems did not support this hypothesis Rather our observations accord with the classical view that the high performance of some interspecific hybrids is largely due to heterosis and that because the heterosis shown by an F 2 or backcross hybrid is only half that shown in an F1 (Falconer and Mackay 1996 p 257) that advanced generation hybrids would not perform as well as F1
hybrids Indeed F 2 HSB previously showed low hatch rates low larval survival and high variability of growth rate (Smith and Jenkins 1984 Smith et al 1985) Our results suggest that the heterosis expressed in HSB for growth and performance was greater than the selective breeding advantage we employed by crossing high performance HSB females with male striped bass Apparently the additive genetic variance contributed by the HSB and striped bass selected for size-at-age could not make up for the loss of dominance variance
BX may have better potential market acceptance by virtue of having a lower condition factor appearing longer and less deep-bodied than HSB more
52 International Journal of Recirculating Aquaculture Volume 5 June 2004
Performance of Sunshine Bass and Backcross Hybrid Striped Bass
like striped bass that are more familiar in many markets Fins Technologys market experience has shown that the premium-priced live markets prefer longer leaner fish such as the backcross There is the possibility that because of later maturity backcross hybrid striped bass may grow to larger sizes than hybrid striped bass This is attractive because there is an unserviced demand for larger (1 kg+) fish that can provide portion-controlled 7-9 ounce fillets for the restaurant and retail markets
ACKNOWLEDGEMENTS This project was supported by US Department of Agriculture-Small Business Innovation Research Program Phase I Grant no 2001-00373 EMH is supported by the USDA-CSREES Hatch Program and the Commonwealth of Virginia Aquaculture Initiative
REFERENCES Bosworth BG Libey GS Notter DR Egg Larval and Fingerling
Traits of Crosses among Striped Bass White Bass and their Fl Hybrids Aquaculture 1997 154 201-217
Carlberg J Van Olst J US Production and Sales of Hybrid Striped Bass (1987-2002) 2003 httpaquanicorgsbgaHSBversion5ppt
Chapman DC Hubert WA Jackson UT Influence of Access to Air and of Salinity on Gas Bladder Inflation in Striped Bass Progressive Fish-Culturist 1988 50 23-27
Falconer DS Mackay TFC 1996 Introduction to Quantitative Genetics Fourth Edition Longman Group Ltd Harlow Essex UK
Halbrendt CK Wirth FF Vaughn GF Conjoint Analysis of the Mid-Atlantic Food-Fish Market for Farm-Raised HSB Southern Journal of Agricultural Economics 1991 23 155-163
Hallerman EM Coadaptation and Outbreeding Depression In Po_pulation Genetics Principles and Applications for Fisheries Scientists Hallerman E (Ed) 2004 American Fisheries Society Bethesda MD USA
Harrell RM Hybridization and Genetics Striped Bass and Other Morone Culture In Harrell RM (Ed) 1997 Pages 217-234 Elsevier Science Amsterdam
International Journal of Recirculating Aquaculture Volume 5 June 2004 53
Performance of Sunshine Bass and Backcross Hybrid Striped Bass
Jenkins WE Heyward LD Sr Smith TIJ Performance of Domesticated Striped Bass Marone saxatilis Palmetto Bass and Backcross Hybrid Striped Bass (Sunshine Bass Female x Striped Bass Male) Raised in a Tank Culture System Journal of the World Aquaculture Society 1998 29 505-509
Kerby JH Cryogenic Preservation of Sperm from Striped Bass Transactions of the American Fisheries Society 1983 112 86-91
Losordo TM Westerman P An Analysis of Biological Economic and Engineering Factors Affecting the Cost of Fish Production in Recirculating Aquaculture Systems Journal of the World Aquaculture Society 1994 25 193-203
SAS Institute 1999 The SAS System for Windows version 82 SAS Institute Cary NC USA
Smith TlJ Jenkins WE Controlled Spawning of Fl Hybrid Striped Bass (Marone saxatilis x M chrysops) and Rearing of F2 Progeny Journal of the World Mariculture Society 1984 15 147-161
Smith TlJ Jenkins WE Snevel JF Production Characteristics of Striped Bass (Marone saxatilis) and Fl - F2 hybrids (Marone saxatilis and M chrysops) Reared in Intensive Tank Systems Journal of the World Mariculture Society 1985 16 57-70
Tomasso JR Kempton CJ Gallman A Smith TlJ Comparative Production Characteristics of Sunshine Bass and Sunshine Bass x Striped Bass in Recirculating-Water Systems North American Journal of Aquaculture 1999 61 79-81
Van Heukelem WF Harrell RM Hughes SG Lindell SR Friedmann BR Optimal Conditions for Swimbladder Inflation in Striped Bass Larvae Reared in Intensive Systems Northeast Regional Aquaculture Center Publication No 00-006 (2000) 5 pages
54 International Journal of Recirculating Aquaculture Volume 5 June 2004
Book Review
Fjofish apd Shellfish Bacteriology Mapua) Techpjques apd Procedures KA Whitman with contributions by NG MacNair
Iowa State Press (Blackwell Publishing Professional) Ames IA USA (2004) 288 pages ISBN 0813819520 US $4999
Reviewed by Rocco C Cipriano United States Geological Survey National Fish Health Research Laboratory 11649 Leetown Road Kearneysville WV 25430 USA E-mail rocco_ciprianousgsgov
Despite the fact that several good texts have been published regarding the description and nature of bacterial pathogens in aquatic animals there remained a need for a comprehensive yet practical guide devoted to techniques and procedures used for bacterial identification Diagnosis and detection of fish and shellfish pathogens often requires reliance upon standard microbiological media tests and reagents for some bacteria but more specialized assays are required for many aquatic pathogens In the latter case the products necessary for such assays are not commercially available and must be produced in aquatic animal diagnostic facilities from their basic ingredients Often therefore the compositions of differential media and the conduct of certain tests for the primary isolation or detection of specific aquatic pathogens are only available by referencing the general body of published scientific literature Hence until now there has not been a single-source shelf-volume that combines standard microbiological procedures used for routine detection and identification of medically important bacteria with the specialized needs of the fisheries profession This manual however helps to fill that void
The manual stands as a reference suitable for professional aquatic biologists with backgrounds in microbiology veterinarians and students of aquatic animal health Its strength lies in its coverage of the subject matter regarding culture-based diagnosis and identification of bacteria associated with finfish bivalves and lobsters Sections on
International Journal of Recirculating Aquaculture 5 (2004) 55-56 All Rights Reserved copyCopyright 2004 by Virginia Tech and Virginia Sea Grant Blacksburg VA USA
International Journal of Recirculating Aquaculture Volume 5 June 2004 55
Book Review FiQish and ShelJfish Bacteriology Manualmiddot Techniques and Procedures
aseptic collection and shipment of samples qualitative and quantitative procedures for bacterial isolation staining techniques media and standard biological tests used for the cultivation and phentotypic characterization of pathogenic bacteria and antibiotic sensitivity testing provide sound background for the student or novice practitioner Particularly beneficial for anyone who is not experienced with aquatic microbial pathogens is the section listing principal organs media and appropriate incubation temperatures to be used as the most probable sources of isolation for the specific bacteria
More experienced professionals will find it helpful and convenient to have the descriptions and interpretations of differential media (eg Coomassie Brilliant Blue Agar for Aeromonas salmonicida Rimler-Shotts Agar for Aeromonas hydropila Cytophaga Agar Shieh and TYES for Flavobacterium spp and Edwardsiella ictaluri Agar and various other media for Renibacterium salmoninarum) listed in a single source The major identifying criteria that phenotypically characterize selected bacterial pathogens are also described in tabulated form Specialized tests such as the SIF test to detect covert infections nurse culture techniques for enhanced bacterial growth and assays for public health indicator organisms in bivalves are documented Sections covering serology immunoassay and non-cultured based molecular assays (eg polymerase chain reaction) are also presented but are not as completely summarized as those for bacterial isolation In summary the nature of this manual makes it appropriate for frequent use as a practical laboratory guide
56 International Journal of Recirculating Aquaculture Volume 5 June 2004
Subscription Information
International Journal of Recirculating Aquaculture
A publication ofVirginia Tech and the Virginia Sea Grant College Program
IJRA presents the latest developments in RAS-related research focusing on the areas of
Food Quality Pathology
Food Safety
Aquatic Medicine Breeding amp Genetics Waste Management
FishShellfish Growth amp Nutrition Recirculating Systems Mgmt Marketing amp Economics Water Conservation
Dont miss an issue of this informative peer-reviewed journal Subscribe now using your credit card by calling 540-231-2075 or by printing out a form at wwwcfastvteduijrahtml If you prefer you can also mail this form to the address below along with a check or money order
Name ----------------~ Address ----------------Line2 ------------------City ____________ State __ _ Country Postal Code ___________ _ Phone Fax -------- --------e-mail-----------------check _ 2 year ($25 US)
International Journal of Recirculating Aquaculture Food Science amp Technology Building (0418)
Virginia Polytechnic Institute and State University Blacksburg VA 24061
phone (540) 231-2075 fax (540) 231-9293 e-mail IJRAvtedu
International Journal of Recirculating Aquaculture Volume 5 June 2004 57
~ International Journal of ~ Recirculating Aquaculture A publication of Virginia Tech and the Virginia Sea Grant College Program
Instructions for Authors The International Journal of Recirculating Aquaculture (IJRA) encourages the submission of original high-quality papers on research in all aspects of recirculating aquaculture Papers will be peer-reviewed and evaluated for scientific merit relevance and for their usefulness in promoting the advancement of recirculating aquaculture Complete coherent projects are preferred Any related papers submitted together must be thoroughly cross-referenced All papers must be original meaning that the data and the information presented must be the work of the authors and can not have been published elsewhere Dual publication of a paper or data is possible only through the permission of the Editors of both journals THERE ARE NO PAGE CHARGES for IJRA submissions
INITIAL MANUSCRIPT SUBMISSION Manuscripts should be sent to Ms Angela Correa Managing Editor by mail using the address listed at the end of these instructions or by e-mail to (ijravtedu) Submit four (4) copies of each manuscript if regular mail is used All manuscripts must be in English Dot matrix type is not acceptable and all such submissions will be returned without review Each submission must include a cover letter stating that the paper contains original research and that the information has not been published elsewhere E-mailed submissions must be saved in doc format Be sure to include the names of colleagues who have already reviewed the work presented IJRA has two categories for submission 1 Articles which are complete in-depth scientific studies and 2 Notes which are short papers of limited scope Articles and notes will be critically reviewed by two or three experts as well as by the Managing Editor Submissions may be returned without peer review in cases where the Managing Editor determines that they are inappropriate for the journal of poor quality poorly written or fail to follow the journals style format
PREPARATION OF MANUSCRIPTS IJRA uses the latest editions of Websters New International Dictionary and Websters New Collegiate Dictionarv for standard spellings and word definitions All spelling will be in American English Foreign or science-related terminology that is unfamiliar and does not appear in these dictionaries will require an accompanying definition Acceptable scientific and common names of fishes are listed in A List of Common and Scientific Names of Fishes from the United States and Canada published by the American Fisheries Society Common names may be used throughout each paper but must be accompanied by a full scientific name when they first appear in a paper The author must use the full common name eg yellow perch not perch All foreign language words should be italicized in the manuscript
In the manuscript number each page sequentially and include the senior authors name next to the page number (eg Page 4 Jahncke) on each page Single-space all typed material including references Type size in the body of the text should be no larger than 12pts and no smaller than 10 pts Subsection headings should also be italicized in the manuscript Spell out one-digit numbers except when they are used with units of measure - eg six ponds 7 days
International Journal of Recirculating Aquaculture Volume 5 June 2004 59
Spell out any number that begins a sentence When two numbers occur sequentially in the text one of the numbers must be spelled out- eg In 1987 fifty fish were stocked Use commas in numbers of 1000 or more Use the 24-hour clock to describe time- eg 1300 not 100 pm
Keep footnotes to a minimum and number them sequentially throughout the paper All units of measurement must be reported via the metric system except in special circumstances (eg horsepower) Standard scientific abbreviations and symbols may be used without definition If the use of a symbol could cause confusion define the symbol the first time it is used On the final draft of a paper that has been accepted for publication Greek letters or other extraneous symbols that do not appear on a keyboard the name of the symbol should be noted where the symbol is used to help eliminate prepress errors Parts per million or milligrams per liter can be
-1 reported as either ppm or mgI but not as mgI
Commonly used aquaculture jargon can be used without defining the term - eg fry fingerling hapa Less commonly used jargon may also be used but terms should be defined the first time they are used Jargon from fields outside of aquaculture should also be defined the first time they are used Always place a zero to the left of a decimal point if the number is less than one this includes probability values - eg P = 005 not P = 05
COMPONENTS OF THE MANUSCRIPTS Articles and notes should include a title names of authors and their addresses abstract introduction materials and methods results discussion (or a combined results and discussion) conclusion (rarely) acknowledgements (if any) references figures and tables in that order Each section should start on a new page
Title - The title should accurately reflect the contents of the paper Brief concise titles are encouraged The title page must include the name(s) of the author(s) and all addresses
Abstract - The abstract should be a concise highlight of the results and conclusions Methodology should not be abstracted unless it is necessary to explain the results or unless the paper describes a new technique Abstracts should be less than 300 words
Introduction - The introduction should explain why the paper was written and why it should be read The introduction should condense the relevant information in the field that led the author to do the research The introduction is not a complete literature review and only the most relevant references should be cited The introduction should also contain a statement that describes the purpose or objective of the paper
Materials and Methods - The underlying goal of this section is to describe what was done so that others can repeat the experiment If previously published papers described a technique that was used they can be cited to prevent unnecessary repetition If the technique or process was modified the modification must be described so that others can repeat the process Experimental designs can be explained by use of figures if they will help clarify what was done If the experiment was a complicated one with many subparts subsections may be used to describe each subpart
Results - This section describes the data Proper use of tables and figures can simplify and help explain the results Statistical analysis of data is necessary unless differences are so obvious that statistical analysis is superfluous Although probability values of 005 and 001 are traditionally used each author is free to choose his or her own level of significance
60 International Journal of Recirculating Aquaculture Volume 5 June 2004
Discussion - This section should interpret the results and compare the results from this experiment to those found in similar research The section can also be used to speculate about the results to provide reasons for the trends and to suggest new ideas that can advance our understanding about aquaculture This section should not be a literature review section that merely compares results among several papers
Results and Discussion - Results and discussion sections can be combined In most cases this leads to a better paper because the integration of these sections leads to a more meaningful interpretation of data
Conclusion - This section should be used only when the results of an experiment lead to an unequivocal interpretation
Acknowledgements - This section should be used to thank organizations that supported the research monetarily and individuals who assisted in the research or preparation of the paper This section includes manuscript number designations for those institutions that assign such numbers
References - Select references with great care Unless the paper includes a literature review there is no need to reference every paper written about a subject Use only the most important ones
Figures and Tables - All figures andtables go after the references Figures always go before tables
Section headings (eg Materials and Methods) should be capitalized and in bold type Secondary headings should be balded and go flush left Tertiary headings are incorporated into the first paragraph of that subsection Tertiary headings are italicized and separated from the text by a double dash
In the text references are cited in one of two ways 1 Swingle (1959) evaluated two species of tilapia or 2 pond culture in Alabama began in the 1950s (Swingle 1959) When there are three or more authors list only the first in a citation and follow that with et al eg Smitherman et al (1983) reviewed catfish breeding work at Auburn University If the name of an institutional author is long it can be abbreviated in a citation eg Food and Agriculture Organization of the United Nations may be abbreviated as FAO When several citations are used in a single entry they are listed chronologically If you are citing two papers that were written by the same author(s) the name only has to appear once per citation followed by the years that designate the different papers Separate the years with a comma If you are citing two authors you must separate the citations with a semicolon (Smith 1975 1976 Jones 1976)
In the reference section the reference list is strictly alphabetical by last name of the senior author and then by initials if two authors have identical last names If an author has written more than one paper the following format should be followed All single authored papers go first followed by co-authored papers and then the papers that were written by three or more authors If an author has written more than one single-authored paper the papers are listed chronologically If an author has written more than one co-authored paper they are listed alphabetically by the second authors last name If a tandem has authored two or more papers the order is chronological Papers written by the same group of three or more authors should be listed chronologically
International Journal of Recirculating Aquaculture Volume 5 June 2004 61
The following format will be used when referencing various works
PAPERS Single-author papers
McGinty AS Effects of Size at Stocking on Competition and Growth of All-Male Tilapia Hybrids Journal of the World Aquaculture Society 1985 16 52-56
Multiple-author papers Tave D Smitherman RO Predicted Response to Selection for Early Growth in Tilapia nilotica Transactions of the American Fisheries Society 1980 109 439-445
If an author has published two or more papers in the same year follow the years with a letter to differentiate them eg Smith 1988a 1988b Use issue numbers only when each issue starts out with page 1 If pagination is consecutive throughout the volume omit the issue number Spell out journal names in their entirely without abbreviations
Papers in proceedings or in edited volumes Nicholson LC Woods LC Ill Woiwode JG Intensive Culture Techniques for the Striped Bass and its Hybrids In Culture and Propagation of Striped Bass and Its Hybrids Harrell RM Kerby JH Minton RV Eds 1990 American Fisheries Society Bethesda MD USA
Books and reportspublications from governmental or non-governmental bodies
Lovell T 1989 Nutrition and Feeding of Fish Van Nostrand Reinhold New York NY USA
Food and Agriculture Organization of the United Nations (FAO) Fisheries Department 1997 Review of the State of World Aquaculture No 886 FIRlC886 FAO Rome Italy
Theses and Dissertations
Easter CC 1992 Water Chemistry Characterization and Performance of a Recirculating Aquaculture System Producing Hybrid Striped Bass Masters thesis Virginia Polytechnic Institute and State University Blacksburg VA USA
Websites
Federation of European Aquaculture Producers (FEAP) European Eel Production (httpwwwfeaporgeelshtml) 2002
Page numbers for proceedings books theses and dissertations are unnecessary Government publications should be treated as if they were books but document numbers must be included THE ACCURACY OF REFERENCES IS THE SOLE RESPONSIBILITY OF THE AUTHORS MAKE SURE THAT CITATIONS AND REFERENCES MATCH
Tables - When creating a table decide what the purpose of the table is and what points are important then organize the table so that the main features can be easily understood The table heading should provide sufficient information for the table to be understood as an entity Keep footnotes to a minimum Each table goes on a separate page Tables must be camera ready TABLES WILL BE PRINTED AS IS AND WILL NOT BE TYPESET Figures - List all figure captions on separate pages Original artwork doesnt have to be submitted when a paper is first submitted for review but original artwork must accompany the final revised manuscript Good quality photocopies are acceptable when a manuscript
62 International Journal of Recirculating Aquaculture Volume 5 June 2004
is submitted for review Graphs and original artwork must be printed with a laser printer or done in pen and ink Dot-matrix figures are not acceptable Original artwork or high-contrast photographs are acceptable Label all figures on the back with a soft pencil name of senior author paper title and figure number
Photographs - Should be on glossy paper with good contrast Do not glue pictures to cardboard Color photographs can be printed but the additional cost of printing them will be charged to the author Label all photos on the back with a soft pencil name of senior author paper title and figure number
FINAL REVISED MANUSCRIPTS If using the mail submit two copies of the final revised manuscript including original artwork Submit either the original pen-and-ink drawings or laser-printed versions of the drawings In addition submit the manuscript on a disk (CD preferable) or by e-mail On the disk write the brand name of the computer or word processor the word processing program that was used (should be Microsoft Word) the title of your article and the file name NOTE Disk and hard copy must agree In case of discrepancies it is the policy of IJRA to follow hard copy An electronic version of the completed manuscript is needed in order to publish AUTHORS MAY NOT RECEIVE PAGE PROOFS Proofreading will be done by the Production Office of IJRA using the revised final version of the manuscript Therefore authors must be especially careful that no errors exist in the final revised version because in most cases no changes are possible after it is submitted
REPRINTS The senior author will receive two copies of the journal and a pdf file of the article for distribution and reprinting purposes The junior author(s) will also receive two copies of the journal issue These are sent several weeks after the journal is published and in circulation Requests for the pdf format of the article can only be made by the corresponding author
COPYRIGHT amp PERMISSIONS For permission to reprint articles that have appeared in IJRA please contact IJRA Copyright amp Permissions Food Science amp Technology Building (0418) Virginia Tech Blacksburg VA 24061 USA
COPYRIGHT TRANSFER If your manuscript is accepted for publication copyright ownership must be officially transferred to IJRA The Editors acceptance letter will include a form fully explaining this The form must be signed by all authors and the original returned to the Editor at this time Failure to return the copyright form in a timely fashion will result in delay in publication
Send your submissions to International Journal of Recirculating Aquaculture
AI Correa Managing Editor 27-B Food Science and Technology Building (0418) Virginia Polytechnic Institute and State University Blacksburg VA 24061 USA
If you have any questions please feel free to contact us Phone (540) 231-2075 Fax (540) 231-9293 e-mail ijravtedu
International Journal of Recirculating Aquaculture Volume 5 June 2004 63

Flatbed Scanning for Examining Lipid Distribution in Fish
) 71 -------
I
a y
MRI 5 --+ l __ __tgt__ -1 I
Figure 2 lllustration of the preparation of MRI and flatbed scanned images I) Animal embedding in gelatin 2) MRI analysis 3) MRI image acquisition 4) Scanning of MRIfilm and saving at 600 dpi resolution 5) Animals were refrozen 6) Slicing of frozen animals 7) Staining of cutlet segments using oil red 0 8) Scanning of stained cutlet segments (600 dpi) 9) Computerized analysis of acquired images
Rinsing and re-hydration of cutlets from individual fish was accomplished by placing the sample in a 250 ml lidded container under continuous shaking Finally the cutlets were gently wiped to remove excess fluid and placed on an overhead film (Pelikan Transparent film TF 80 Pelikan Holding AG Baar Switzerland) anterior-most side down scanned (hp ScanJet 4C) with an open lid under dark conditions (enlarged 400) and saved in 600 dpi tiff format
Image analysis Built in functions in MatLabreg v 52 (MathWorks Natick MA USA) were used to enable lipid analysis of stained images The program employed the red green blue (RGB) spectrum and was able to separate lipid from muscle using reference values (mean+- SD see Fig 3) down to the pixel level Resolved data was also evaluated in percentage and illustrative terms A separate program was developed in MatLabreg to enable lipid
International Journal of Recirculating Aquaculture Volume 5 June 2004
Flatbed Scanning for Examining Lipid Distribution in Fish
Flatbed scanning
Tl weighted MRI
H20sat Tl weighted
MRI
Original Image Mask Lipid Mask Meat Mask
Illustration of result
Figure] Illustration of the methods employed to examine lipid presence in flatbed scanned and MRI derived images of tilapia (see Methods text for more details)
analysis of the two types of MRI images (Fig 3) It also operated in the RGB spectrum but employed manually-separated reference images because both Tl weighted and water saturated Tl weighted MRI films were developed in gray scale Additionally since the resolving power of the MRI signal was affected by lipid concentration fat deposits in areas farther from the ventral region (belly) were less discrete and hence their analysis was more complex
The RGB spectrum Digital images consist of numerous dots termed pixels The number of pixels in a digital image is dependent upon image resolution which is commonly defined in dots per inch (dpi) Each pixel is assigned a binary value (0-1) according to tone eg black = 0 and white = I Digital images may be bitonal (black and white) grayscale or in color These image
International Journal of Recirculating Aquaculture Volume 5 June 2004
Flatbed Scanning for Examining Lipid Distribution in Fish
types differ in the number of bits used to define each pixel Whereas a bitonal pixel is defined by one bit grayscale pixels range between 2-8 bits and color pixels from 8-24 bits In a 24-bit color image bits are often separated into three 8-bit groups - viz red green or blue hues A combination of the bits defines additional colors MatLabreg works separately in all three hues with three bit values for each colorbit being defined In a color image therefore three values are employed one for each hue In contrast in grayscale different hues are discarded leaving only the intensity of the single color
Image appraisal MRI and flatbed (stained) images were examined for percent lipid presence in each cutlet An estimate of percent lipid for each fish was obtained using the following method cutlet surface area (A and a Fig 4) expressed in pixels and height (h set to 5 mm) was used for the determination of cutlet radius Cutlet volume was calculated using the formula for assessing the volume of a cone Estimated cutlet volume and total body lipid was calculated according to the following equations
Estimated cutlet volume (pixels)= 13 bull n x h bull (R2 +Rx r + r2 bull 100
Estimated body lipid()= Abull (VA IV T) + B bull (V 8 IV T) + + 1 bull (VI I v T)
Where percent lipid was A a 1 surface area was A B I VT was total cutlet volume in pixels and V A B I the estimated cutlet volume in pixels (A B I)
Flatbed images were appraised as follows (Fig 3) three masks were obtained using tools in Paint Shop Pro 60 (Jase Software Eden Prairie MN USA) Firstly the spinal column was identified and assigned the color black The remaining cutlet area was assigned the color white to provide a mask for analysis in MatLabreg which was then saved From
Figure 4 Illustration of the cone conversion method used to quantify cutlet lipid presence
International Journal of Recirculating Aquaculture Volume 5 June 2004
Flatbed Scanning for Examining Lipid Distribution in Fish
the original image areas that stained intensively red were assigned to white while the remainder were assigned to black thereby providing a lipid mask A meat mask was generated in a similar manner (Fig 3) The original image mask lipid mask and meat mask were identical in terms of size and location of the spinal column such that pixels referring to for example meat on the meat mask were similarly identified on the original image The four images were then analyzed in MatLabreg The lipid and meat masks provided mean and standard deviation of positively assigned pixels This enabled MatLabreg to analyze each pixel of the original image corresponding to the mask relative to the distance to mean and standard deviation in the RGB spectrum The following formula was applied within MatLabreg
d_meat=sqrt(((r(rrcc)-meat_red_m)meat_red_s)A2+((g(rrcc)-meat_ green_m)meat_green_s)A2 +((b(rrcc)-meat_blue_m)meat_blue_s)A2)
where d_meat was the overall distance calculated r(rrcc) the pixel value in the red spectra meat_red_m the mean value in the red spectra for pixels positively assigned to meat by the meat mask meat_red_s the standard deviation in the red spectra of the pixels positively assigned to meat by the meat mask etc A similar formula was used for calculating the distance according to the lipid mean and standard deviation for the same pixel Subsequently the pixel analyzed was assigned to either meat or lipid depending on which distance was the shortest MatLabreg provided details relating to lipidmeat and an illustration of the result
MRI images were analyzed as follows the Tl weighted MRI image was used to prepare a white mask covering the surface area of the cutlet but excluding the spinal column in Paint Shop Pro 60 This mask was used for analysis of both MRI image types Secondly for both MRI types lipid areas were assigned using tools in Paint Shop The lipid areas were assigned to white and the remainder to black and saved as a lipid mask Lipid or meat pixels were assigned manually Subsequently the original image mask and lipid mask were analyzed in MatLabreg which provided lipidmeat and an illustration of the result
Chemical analysis An additional eight animals were employed for the chemical quantification of lipid Individual fish were homogenized prior to lipid analysis using the method described by Bligh and Dyer (1957) All samples were analyzed in duplicate
International Journal of Recirculating Aquaculture Volume 5 June 2004
Flatbed Scanning for Examining Lipid Distribution in Fish
Statistical analyses Statistical analyses were performed using SPSS ver 100 (Data Description Inc Ithaca NY USA) The model applied for the 3 x 9 factorial design was as follows
Yijk = micro + Ai+ B ABij +eijk
where m was the true mean Ai the analysis method Bj the cutlet ABij the interaction of the fixed factors and finally eijk the residual effect Differences between treatment means were analyzed by three-way ANOVA and differences between treatments (Plt005) isolated using Tukeys test Estimated lipid percent of cutlet A-I of each animal was analyzed by one-way ANOVA (flatbed scanning Tl weighted and water saturated Tl weighted MRI)
RESULTS Table 2 summarizes percent lipid levels in individual cutlets as determined by image analysis of ORO stained cutlets and MRI (Tl weighted and water-saturated Tl) samples Animal gender had no effect upon lipid distribution in the sections examined regardless of method of analysis No differences (P gt 005) were discerned in cutlet lipid presence or in interactions between analytical technique and cutlet for any of the methods examined Fish exhibited a general anterior to posterior decrease in lipid presence with differences (P=0001) in the amount of lipid detected being distinguishable between cutlets (Table 2) The first three cutlets (A-C) of all fish expressed a higher (P lt 005) percentage of lipid than more posterior cuts (H and I) with cutlet I containing a lower (P lt 001) percent lipid than cutlets D-G Examination of sections D-H revealed equivalency in terms of percent lipid deposition (Table 2) A comparison of percent whole body lipid presence using imaging techniques and the Bligh and Dyer method did not reveal differences (gt005) between the methods (Table 3)
DISCUSSION Lipid distribution in fish varies with species muscle type and sampling point (Katikou et al 2002) and may be influenced by season feed type and feeding strategy (Jobling et al 1998 Johansen and Jobling 1998 Johansson et al 2000) Lipid presence in fish flesh is arguably the most important trait that influences total quality of the final product Lipids
10 International Journal of Recirculating Aquaculture Volume 5 June 2004
Flatbed Scanning for Examining Lipid Distribution in Fish
Table 2 Comparison of flatbed scanning and MRI techniques in determining lipid percentage per cutlet examined (see Fig 1) Statistical analysis for the 3 x 9 factorial design is indicated in the category columns No interaction between method and cutlet segment was demonstrated Separate one-way ANOVAfor differences in cutlets is noted in the respective column n = 8 per analysis P lt 005
Method
Cutlet no Flatbed analysisa T1 weighteda H20 saturated T1 a
A8 254plusmn1208 312plusmn1388 287plusmn1668
88 251plusmn141 8b 314plusmn2068 206plusmn1838
ca 190plusmn088abc 253plusmn181 8b 258plusmn2248
oab 144plusmn070abc 233plusmn1008b 278plusmn1978
Eab 151plusmn0778 bc 188plusmn104ab 213plusmn0568
pb 143plusmn059abc 242plusmn207ab 260plusmn1558
Gab 139plusmn105abc 190plusmn1268b 211plusmn1848
Hbc 103plusmn075bc 098plusmn117ab 100plusmn0988
1c 084plusmn048C 018plusmn025b 019plusmn0468
Table 3 Chemical analysis (n=6 Bligh and Dyer 1959) and estimates of lipid presence using flatbed Tl weighted and water saturated Tl MRI methods (n=8)
Bligh and Flatbed Water Method D~er anal~sis T1 weighted saturated T1 Lipid content I Estimated lipid 171plusmn0468 177plusmn0328 229plusmn1198 212plusmn0748
content
International Journal of Recirculating Aquaculture Volume 5 June 2004 11
Flatbed Scanning for Examining Lipid Distribution in Fish
impact the appearance flavor tenderness and juiciness of fresh and processed products (Rasmussen et al 2000 Johansson et al 2000 Lie 2001) Lipids are also the main component responsible for the accumulation of smoked and flavoringseasoning compounds that impart a final products flavor (Beltran et al 1991) The nutritional quality and quantity of lipid in fish flesh is of interest from a human health perspective since it has long been recognized that n-3 PUFA reduces the incidence of heart disease decreases risk of some cancers and may act to stimulate the immune system
Several studies have demonstrated the changes in fatty acid elasticity of fish flesh following dietary modifications (Viegas and Guzman 1998 Samuelsen et al 2001 Bell et al 2001) It is well established that lipid presence affects the technological quality of fish flesh from the processing perspective Lipids impact sliceability (McLean and Devlin 2000) fillet yield and trimming loss (Rasmussen et al 2000) as well as the salting and drying process during smoking (Cardinal et al 2001) and may play a role in fillet gaping (Lie 2001) Whole body lipid levels are also important in the bioaccumulation process (Stow et al 1997 Zhou et al 1999) and hence impact the safety of final products
A trend in the aquaculture feed industry has been to formulate diets that are high in lipid (gt 40) as a method to spare protein and reduce environmental impact (Cho and Bureau 2001) Potential negative aspects of such diets however are increased lipid accumulation and an overall decline in end product quality (Shearer 2001) A growing need exists to develop methods that enable safe and rapid assessment of lipid accumulation in the edible component of farmed fish Such methods could support research and development in the formulation of novel diets provide insights into lipid dynamics following application of various feeding strategies assist during selective breeding programs and provide a basis for on-farm product quality management
In pigmented species of fish such as the salmonids it is often possible to visually detect fat deposits within muscle tissues In contrast visual recognition of lipid deposits in white-fleshed animals remains problematic MRI provides the means to examine internal structures of animals non-destructively and permits separation of lipid from muscle tissues (Hornack 2002 Fig 3) In mammals including humans the kinetics and distribution of body fat (Kamel et al 2000 Fusch et al
12 International Journal of Recirculating Aquaculture Volume 5 June 2004
Flatbed Scanning for Examining Lipid Distribution in Fish
1999) has been examined by MRI Clearly similar studies with teleosts would provide great rewards with regards to understanding lipid dynamics over the life cycle and establishing the effects of different manipulations on depositional processes In the present study with tilapia MRI was able to distinguish lipid from muscle tissue in cutlets demonstrating a cranial-caudal decline in cutlet lipid presence which is in accord with chemical (Katikou et al 2001) and CT (Gjerde 1987 Rye 1991) analyses of salmonids Noteworthy in the present study was the lack of a difference in lipid presence or spatial distribution between genders
Irrespective of the resolving power of MRI and its companion medical imaging technologies however such equipment is sophisticated demanding and expensive In the practical sense medical imaging technologies are of limited value to aquaculture In contrast the simplicity of highlighting lipids using fat-soluble stains such as oil red 0 as used herein or alternatives such as Sudan red B Sudan black B and others however provides a rapid and inexpensive means of distinguishing and quantifying lipid deposits in edible flesh and viscera The described method can be adapted and applied to all species wherein muscle and lipid tissues are difficult to separate visually (eg in unpigmented fleshed animals) Preliminary studies with summer (Paralichthys dentatus) and southern (P lethostigma) flounders confirm the utility and general applicability of the method Furthermore use of stains such as Sudan black B would enable greater differentiation of lipid deposits even in pigmented species Differences nevertheless exist when employing lipid-soluble histochemical dyes for macro samples such as fish cutletssteaks fillets etc Specifically distinctions are met in incubation conditions which likely occur due to sample thickness When compared to MRI the flatbed scanning method provided identical results with respect to lipid distribution and percent cutlet lipid Moreover quantitative estimates of lipid presence using flatbed- and MRI-derived data duplicated lipid values calculated by traditional chemical methods Accordingly the histochemical staining-flatbed scanning technique provides a safe reproducible and economical method of isolating and monitoring whole body cutlet or fillet lipid presence The resolving power of this technique may be further enhanced using different or additional biological stains that are more specific The major drawback of the flatbed method when compared to MRI was the time required to prepare samples prior to computer-assisted analysis with individual fish requiring approximately 45 minutes In contrast with MRI multiple images of multiple specimens
International Journal of Recirculating Aquaculture Volume 5 June 2004 13
Flatbed Scanning for Examining Lipid Distribution in Fish
were acquired in a matter of minutes However the need to embed samples in gelatin to avoid artifacts in the MRI scan required overnight preparation demanding two person hours total Overall the time required for the preparation of the flatbed-scanned images was similar to that of traditional chemical analysis The analysis of both MRI and flatbed-scanned images (9 slices per fish) required approximately 4 hours per method However the results generated provided more detail than traditional chemical analysis The flatbed technique developed may prove useful in a wide range of basic and applied research
REFERENCES Alanen A Komu M Bondestam S Toikkanen S Determination of
Fat Content of Burbot (Lota Iota) Liver with Low Field MR Imaging (004 T) Physics in Medicine and Biology 1991 36 953-961
Bell JG McEvoy J Tocher DR McGhee F Campbell PJ Sargent JR Replacement of Fish Oil with Rapeseed Oil in Diets of Atlantic Salmon (Salmo salar) Affects Tissue Lipid Compositions and Hepatocyte Fatty Acid Metabolism Journal of Nutrition 2001 131 1535-1543
Beltran A Moral A The Effects of Fat Contents and Storage Temperature on the Storage Life of Smoked Sardine Fillets (Sardina pilchardus W) Prepared from Frozen Sardine Food Chemistry 1991 42 347-356
Bjerkeng B Refstie S Fjalestad KT Storebakken T R~dbotten M Roem AJ Quality Parameters of the Flesh of Atlantic Salmon (Salmo salar) as Affected by Dietary Fat Content and Full-Soybean Meal as a Partial Substitute for Fish Meal in the Diet Aquaculture 1997 157 297-309
Bligh EG Dyer WJ A Rapid Method of Total Lipid Extraction and Purification Canadian Journal of Biochemistry and Physiology 1959 37 910-917
Cardinal M Knockaert C Torrissen 0 Sigurgisladottir S M~rk~re T Thomassen M Vallet JL Relation of Smoking Parameters to the Yield Colour and Sensory Quality of Smoked Atlantic Salmon (Salmo salar) Food Research International 2001 34 537-550
14 International Journal of Recirculating Aquaculture Volume 5 June 2004
Flatbed Scanning for Examining Lipid Distribution in Fish
Cho CY Bureau D P A Review of Diet Formulation Strategies and Feeding Systems to Reduce Excretory and Feed Wastes in Aquaculture Aquaculture Research 2001 32 suppl 1 349-360
Einen 0 Waagan B Thomassen MS Starvation Prior to Slaughter in Atlantic Salmon (Salmo salar) I Effects on Weight Loss Body Shape Slaughter- and Fillet-Yield Proximate and Fatty Acid Composition Aquaculture 1998 166 85-104
Fusch C Slotboom J Fuehrer U Schumacher R Keisker A Zimmermann W Moessinger A Boesch C Blum J Neonatal Body Composition Dual-Energy X-Ray Absorptiometry Magnetic Resonance Imaging and Three-Dimensional Chemical Shift Imaging versus Chemical Analysis in Piglets Pediatric Research 1999 46 465-473
Gjerde B Predicting Carcass Composition of Rainbow Trout by Computerized Tomography Journal of Animal Breeding and Genetics 1987 104 121-136
Goddard JS McLean E Acid-Insoluble Ash as an Inert Reference Material for Digestibility Studies in Tilapia Oreochromis aureus Aquaculture 2001 194 93-98
Hornack JP The Basics of MRI httpwwwcisriteduhtbooksmri 2002
Howell N Shavila Y Grootveld M Williams S High-Resolution NMR and Magnetic Resonance Imaging (MRI) Studies on Fresh and Frozen Cod (Gadus morhua) and Haddock (Melanogrammus aeglefinus) Journal of the Science of Food and Agriculture 1996 72 49-56
Jobling M Johansen SJS Forshaug H Burkow LC JZ)rgensen EH Lipid Dynamics in Anadromous Arctic Charr Salvelinus alpinius (L) Seasonal Variations in Lipid Storage Depots and Lipid Class Composition Fish Physiology and Biochemistry 1998 18 225-240
Johansen SJS Jobling M The Influence of Feeding Regime on Growth and Slaughter Traits of Cage-Reared Atlantic Salmon Aquaculture International 1998 6 1-17
International Journal of Recirculating Aquaculture Volume 5 June 2004 15
Flatbed Scanning for Examining Lipid Distribution in Fish
Johansson L Eating Quality of Farmed Rainbow Trout ( Oncorhynchus mykiss) In Farmed Fish Quality Kestin S C and Warriss P D (Eds) 2001 Pages 76-88 Fishing News Books Osney Mead UK
Johansson L Kiessling A Kiessling K-H Berglund L Effects of Altered Ration Levels on Sensory Characteristics Lipid Content and Fatty Acid Composition of Rainbow Trout (Onchorhynchus mykiss) Food Quality and Preference 2000 11 247-254
Kamel EG McNeill G van Wijk MCW van Wijk MCW Change in Intra-Abdominal Adipose Tissue Volume during Weight Loss in Obese Men and Women Correlation between Magnetic Resonance Imaging and Anthropometric Measurements International Journal of Obesity 2000 24 607-613
Katikou P Highes SI Robb DHF Lipid Distribution within Atlantic Salmon (Salmo salar) Fillets Aquaculture 2001 202 89-99
Komu M Alanen A Magnetization Transfer in Fatty and Low-Fat Livers Physiological Measurement 1994 15 243-250
Lie 0 Flesh Quality - The Role of Nutrition Aquaculture Research 2001 32 suppl 1 341-348
Lillie RD Various Soluble Dyes as Fat Stains in the Supersaturated Isopropanol Technique Stain Technique 1994a 19 55-58
Lillie RD Study of Certain Oil Soluble Dyes for Use as Fat Stains Journal of Technical Methods 1994b 24 37-42
McLean E Devlin RH Application of Biotechnology to Enhance Growth of Salmonids and Other Fish In Recent Advances in Marine Biotechnology Fingerman M and Nagabhushnam R (Eds) 2000 Pages 17-55 Science Publishers Incorporated Enfield New Hampshire USA
Nott KP Evans SD and Hall LD Quantitative Magnetic Resonance Imaging of Fresh and Frozen-Thawed Trout Magnetic Resonance Imaging 1999a 17 445-455
Nott KP Evans SD and Hall LD The Effect of Freeze-Thawing on the Magnetic Resonance Imaging Parameters of Cod and Mackerel Lebensmittel Wissenschaft and Technologie 1999b 32 261-268
16 International Journal of Recirculating Aquaculture Volume 5 June 2004
Flatbed Scanning for Examining Lipid Distribution in Fish
Rasmussen RS Ostenfeld TH R~nsholdt B McLean E Manipulation of End-Product Quality in Rainbow Trout with Finishing Diets Aquaculture Nutrition 2000 6 17-23
R~nsholdt B Nielsen H Frergemand J McLean E Evaluation of Image Analysis as a Method for Examining Carcass Composition of Rainbow Trout Ribarstvo 2000 58 3-11
Rye M Predicition of Carcass Composition in Atlantic Salmon by Computerized Tomography Aquaculture 1991 99 35-48
Samuelsen T Isaksen M McLean E Influence of Dietary Recombinant Microbial Lipase on Performance Characteristics of Rainbow Trout Aquaculture 2001 194 161-171
Shearer KD The Effect of Diet Composition and Feeding Regime on the Proximate Composition of Farmed Fishes In Farmed Fish Quality Kestin SC and Warriss PD (Eds) 2001 Pages 31-41 Fishing News Books Osney Mead UK
Stow CA Jackson LJ Amrhein JF An Examination of the PCB Lipid Relationship among Individual Fish Canadian Journal of Fisheries and Aquatic Sciences 1997 54 1031-1038
Valdes EV Atkinson JL Hilton JW Leeson S Near Infrared Reflectance Analysis of Fat Protein and Gross Energy of Chicken and Rainbow Trout Carcasses Canadian Journal of Animal Science 1989 69 1087-1090
Viegas EMM Guzman EC Effect of Sources and Levels of Dietary Lipids on Growth Body Composition and Fatty Acids of the Tambaqui (Colossoma macropomum) World Aquaculture 1998 29
Zhou HY Cheung RYH Wong MH Bioaccumulation of Organochlorines in Freshwater Fish with Different Feeding Modes Cultured in Treated Wastewater Water Research 1999 33 2747-2756
International Journal of Recirculating Aquaculture Volume 5 June 2004 17
Skinless V-Notched Fillet Yields ofTilapia (Oreochromis)
SP Kirkup1 LS Marsh2 CW Coale Jr3
11774 Old Brook Rd Charlottesville VA 22901 USA
2Department of Biological Systems Engineering (0303) Virginia Polytechnic Institute and State University Blacksburg VA 24061 USA
3Department of Agricultural and Applied Economics (0401) Virginia Polytechnic Institute and State University Blacksburg VA 24061 USA
Corresponding authors e-mail marshesvtedu
Keywords tilapia Oreochromis fish fillet yield
International Journal of Recirculating Aquaculture 5 (2004) 19-27 All Rights Reserved copy Copyright 2004 by Virginia Tech and Virginia Sea Grant Blacksburg VA USA
International Journal of Recirculating Aquaculture Volume 5 June 2004 19
Fillet Yields of1ilapia (Oreochromis)
ABSTRACT White hybrid tilapia (Oreochromis) produced in an experiment that determined the effects of various management practices on growth rate and feed conversion ratios were weighed measured and filleted at the conclusion of the growth trials Regression analyses produced two models to predict fillet yields-one model that used the fish weight and length and a reduced model that used only fish weight While the full model produced a somewhat smaller error it was found to be impractical to use fish length to estimate fillet yield due to the difficulty in obtaining a length measurement The full model also produced unreasonable estimates when extended beyond the limits of the data set Using a paired t-test fillet yields of males and females of equal weights were tested and were not found to be significantly different This model provides a means of converting market price of tilapia fillets to a price for live fish once processing costs are considered
INTRODUCTION Marketed food commodities including fish undergo changes in product form before reaching the consumer The objective of changing the product form of a commodity is to add value to the product In the case of filleted fish products changing a whole fish to a filleted product enhances the value of the product but also significantly reduces its weight The producer is paid not for the live weight of the fish but for the final weight in commodity form Producers raising fish for the fillet market need a simple means of estimating fillet yield in order to make management decisions regarding what size of live fish to harvest
Market demand for various forms of tilapia has been created in large metropolitan areas of the United States and Canada by ethnic groups from regions including South and Central America Southeast Asia Africa China and the Philippines Although most of the tilapia consumed in the United States is imported as fresh or frozen fillets or frozen whole fish (Harvey 2000) certain ethnic groups prefer live fish for which they are willing to pay a significant premium High transportation and handling costs make importation of live tilapia into the United States prohibitively expensive and thus a domestic live tilapia industry has developed within the United States primarily using intensive recirculating aquaculture systems While the amount of tilapia produced domestically is rather small compared to that of catfish and trout according to the USDA
20 International Journal of Recirculating Aquaculture Volume 5 June 2004
Fillet Yields ofTilapia (Oreochromis)
(Harvey 2000) tilapia represents the second largest import of finfish into the United States on a live weight and value basis trailing only Atlantic salmon Hence there is ample evidence of a market for tilapia
Tilapia cannot survive in low ambient temperatures (Phipippart and Ruwet 1982) and therefore except for the southernmost regions they cannot be produced year-round in ponds in North America Production costs of tilapia raised in ponds have been estimated to range between $088 and $132kg (Fitzsimmons and Posadas 1997) compared to an estimated production cost of $279kg for recirculating aquaculture systems (Losordo and Westerman 1994) Because of the significantly higher cost of indoor temperature-controlled production domestic producers generally cannot compete economically with foreign pond-raised processed tilapia products which are relatively inexpensive to ship However they can compete for the live tilapia market due to the challenges and costs associated with transporting live fish
Many wholesalers require a minimum size for live tilapia producers report both 340 and 450 g (three-quarters and one pound) as minimum desired weights Producers are tempted to retain and grow out further fish that are too small to be marketed as live fish However research conducted at Virginia Tech indicates that as tilapia mature both the growth rate and feed-conversion efficiency decrease dramatically (Kirkup et al 2000) and that these decreases are primarily dependent on age rather than either size or culture conditions Therefore it might be more economical to fillet substandard fish rather than allowing these poor performers to grow to live-market size
Tilapia fillet yields are of interest to domestic producers for several reasons First fillet yield can be used to establish the value of live tilapia once the market price and processing handling and carcass disposal costs are known Secondly fillet yield and variation are of interest to food processors and restaurateurs who are interested in a specific size fillet or portion
In the spring and early summer of 1999 an experiment was conducted to investigate the effects of different temperature and feeding rates upon the growth and feed conversion efficiency of Rocky Mountain white tilapia As a result of the experiment there was large variation in size length and weight among the fish in the various treatments At the conclusion of the experiment the fish were weighed measured sexed filleted and the fillets were weighed
International Journal of Recirculating Aquaculture Volume 5 June 2004 21
Fillet Yields of Tilapia (Oreochromis)
MATERIALS AND METHODS The fish used for the experiment are commonly called Rocky Mountain White Tilapia although a best guess is that they are a white inter-specific species of the genus Oreochromis primarily 0 niloticus 0 aureus and 0 mossambicus This hybrid has been selectively bred at Blue Ridge Aquaculture Inc (Martinsville VA USA) for its color and growth rate The white hybrids are desirable in the live fish market because of their generally attractive external appearance This hybrid grows rapidly and has other physiological attributes that make it well suited to culture in high-density aquaculture systems Although predominantly white the fish ranged in color from a bright white to a bluish and golden white to a few that were colored a reddish brown As fry the fish were given methyltestosterone mixed with their feed to chemically sex reverse the females Prior to delivery to Virginia Tech the fish were graded twice at Blue Ridge Aquaculture Inc to obtain a relatively uniform size by removing the runts
The fish were raised in 6607 L (150 gallon) agricultural watering troughs (Rubbermaid Winchester VA USA) The experiment was a three (temperatures) by four (feeding levels) factorial design having two replicates The nominal culture temperatures were 26 29 and 32degC and the feeding levels for each temperature conducted four times a day were saturation feeding 87 73 and 60 of the daily saturation feed rate The average fish weight at the beginning of the experiment was approximately 53g and the growth experiment lasted 20 weeks At the conclusion of the experiment the fish were taken off feed for three days prior to harvesting The tanks were completely drained and the live fish from each tank were placed in an ice-filled chest The fish were kept on ice for several hours prior to being filleted to anesthetize them and increase rigor making them easier to fillet and reducing the amount of blood in the fillet Prior to processing the fish were weighed to the nearest gram using a digital scale and measured to the nearest millimeter using a measuring board Fish weighing 300g or more were then filleted smaller fish were dissected to determine sex but were not filleted A total of 407 fish were filleted As noted the fish used in this experiment were chemically sex reversed ie from female to male and thus during the filleting process only 10 were identified as females Of that 10 a disproportionate number of females did not reach the 300g minimum cut-off weight for filleting thus only 24 fish identified as females were filleted
22 International Journal of Recirculating Aquaculture Volume 5 June 2004
Fillet Yields ofTilapia (Oreochromis)
The filleting was conducted by two competent fish cutters with extensive experience in filleting tilapia for a small Midwestern tilapia producer The v-notched skinless filleting was primarily accomplished with electric carving knives One individual cut across the torso just behind the gill and then cut horizontally down along the backbone through the ribcage to the tail While still attached to the tail the side of the fish was then flipped over and another horizontal cut was made along the skin to separate the meat from the skin and scales The sex of the fish was then determined based upon the internal sex organs The procedure was repeated on the other side of the fish The other individual cut the ribcage out of the fillet with an electric knife and removed the pectoral fin with a v-shaped cut The combined weights of the fillets for each fish were determined to the nearest gram on a digital scale
RESULTS
Fillet Weight Model A mathematical model of the fillet weight (Wf) in grams was fitted using the linear regression procedure (SAS Cary NC USA) Considered in the model were polynomials of weight and length condition factor temperature and feeding rate sex and interaction terms of the primary factors Only fish weight (W) in grams and length (L) in millimeters were found to be significant at the 95 confidence level and the resulting model was Wr = 650 - 0403L + 0401 W with a coefficient of determination (r2) of 0913 The reduced model Wr = -167 + 0336W produced an r2 of 0906 The fillet weight versus fish weight data and the regression line are shown in Figure 1 It appears that weight is a
--middot Figure I Relationship between fish weight and total fillet weight
International Journal of Recirculating Aquaculture Volume 5 June 2004 23
Fillet Yields o1ilapia (Oreochromis)
very good predictor of fillet yield and that for a given weight shorter fatter fish produce a slightly higher yield Although losing some predictive power the reduced model is more appropriate for several reasons Fish length and weight are highly correlated and therefore most of the predictive capability of length can be accounted for in the weight measurement The large positive intercept and the large negative coefficient for length in the full model are intuitively illogical Beyond the limits of the data set the full model produces unreasonable predictions For example predicted fillet weight of fingerlings would exceed the entire weight of the fish On the other hand the coefficients of the reduced model are intuitively logical and produce reasonable estimates of the fillet weights even beyond the limits of the data collected For the reduced model the 95 confidence interval for they-intercept is -215 to -119 and the 95 confidence interval for the weight coefficient is 0326 to 0347 Considering the variation in yield introduced by the filleting process the linear correlation between fillet yield and weight is good
Effect of Sex on Fillet Yields As noted previously fillet yield is a function of size and on average the females were only 666 as heavy as their male counterparts for a given treatment The question to be answered is whether the fillet yields of males and females of similar weights are different Once this is known it can be determined whether unisex production should be priced differently than mixed-sex production As noted above gender was not a significant factor in the construction of the fillet model but a paired t-test is a stronger statistical test For each of the 24 filleted females a male was selected at random that had the same or nearly the same body weight A paired t-test was used to compare the fillet weights and fish lengths of equal-sized males and females At the p = 005 level the differences in fillet yields were not significant but the males were found to be significantly longer F tests were used to compare the variance of the fillet weights and the lengths At the p = 005 level no statistical difference could be detected in the variance of the fillet weights or lengths
24 International Journal of Recirculating Aquaculture Volume 5 June 2004
Fillet Yields ofTilapia (Oreochromis)
Table 1 Comparison of length weight fillet weight and yield of males and females of comparable weight
Length Fillet (mm) Weight (g) Weight (g) Yleld ()
Males Average 2670 3758 1087 029 (SD) 147 647 244 0024
Females Average 2618 3760 1103 029 (SD) 153 647 219 002
DISCUSSION Weight is a good predictor of fillet yield The full model regression formula that included both fish weight and fish length produced a model with slightly greater predictive power than the reduced model that used only fish weight and could thus be of interest from an academic perspective Its predictive power is only slightly better than that of the reduced model From a practical perspective weight is relatively easy to measure whereas length is not and thus for commercial applications the reduced model is a more valuable tool than the full model
The wholesale price per kilogram for tilapia is generally based upon fish weight-fish heavier than 600g bring a premium price those between approximately 350 and 600g an intermediate price and those less than 350g a lesser price (Fitzsimmons and Posadas 1997) The reduced model predicts yields of 288 and 308 for 350g and 600g fish respectively which would justify a price premium of approximately 7 based strictly upon the increase in yield but which does not include any reduction in processing costs The yields obtained from this experiment are lower than both the 33 yield figure cited as a rule of thumb by Fitzsimmons and Posadas (1997) and the average fillet yield of 335 from 0 niloticus averaging 2074g cited by Obanu and lkeme (1988) In contrast Clement and Lovell (1994) obtained only a 254 fillet yield from 0 niloticus that weighed an average of 585g Several factors could account for the discrepancies including tilapia species and the skill of the fish cutter However the largest source of variation is likely to be the methods and procedures used in filleting which unfortunately are generally not reported in the literature Variability introduced by fillet technique and skill of the cutter is not included in this model because only one set of cutters was used
International Journal of Recirculating Aquaculture Volume 5 June 2004 25
Fillet Yields of Tilapia (Oreochromis)
Fillet yield is important information for making management decisions in pricing fish products selecting species specifying feed rations and controlling production costs Muscle yield of fish species has a big impact on the profitability of the aquaculture firm and on the survival of a specific marketing channel The fish producer is the last claimant to the consumers market price for fish and fish products The more handlers there are operating in a marketing channel the smaller the margins for each handler Gross retail margins for fresh fish usually command between 30 and 50 of the total profit depending on the marketing season and the fish species Producers are accustomed to marketing whole fish while customers are used to purchasing fish fillets When the useable flesh is separated from the whole fish the result is the fillet and a by-product Typically these by-products of the fish filleting process do not have significant value and their production cost has already been factored into the fish value The higher the yield ratio of muscle to by-product and the higher the market price the greater the chance a producer has of receiving a higher return on the aquaculture product Documentation of fillet yields coupled with market price indicate the value of the fish products in a marketing channel The better the yield the better the survival of a species in the marketplace
ACKNOWLDEGEMENT This material is based upon work supported by the Cooperative State Research Education and Extension Service US Department of Agriculture under Project No VA135559
REFERENCES Clement S Lovell RT Comparison of Processing Yield and Nutrient
Composition of Cultured Nile Tilapia (Oreochromis niloticus) and Channel Catfish (Ictalurus punctatus) Aquaculture 1994 119 299-310
Fitzsimmons K Posadas BC Consumer Demand for Tilapia Products in the US and the Effects on Local Markets in Exporting Countries In Proceedings of the Fourth International Symposium on Tilapia in Aquaculture (Orlando FL USA) Fitsimmons K (Ed) 1997 NRAES-106 Natural Resource Agriculture and Engineering Service (NRAES) Ithaca NY USA
26 International Journal of Recirculating Aquaculture Volume 5 June 2004
Fillet Yields oTilapia (Oreochromis)
Harvey D 2000 Aquaculture Outlook Economic Research Service US Department of Agriculture (Pub LDP-AQS-12) Washington DC USA
Kirkup SP Marsh LS Libey GS Heath AG Coale CW Haugh CG Effects of Temperature and Feeding Rates upon Growth and Feed Conversion Ratios in Tilapia In Proceedings of the Third International Conference on Recirculating Aquaculture (Roanoke VA USA) Flick G J and Rakestraw T (Eds) 2000 Virginia Tech Blacksburg VA USA
Losordo TM Westerman PW An Analysis of Biological Economic and Engineering Factors Affecting the Cost of Fish Production in Recirculating Aquaculture Systems Journal of the World Aquaculture Society 1994 25193-203
Obanu ZA lkeme AI Processing Characteristics and Yield of Some Fishes of the River Niger in Nigeria In Proceedings of the FAQ Expert Consultation on Fish Technology in Africa (Abidjan Cote DIvoire) FAQ Fish Report 1988 Supplement No 400 pages 218-220
Phipippart J-Cl Ruwet J-Cl Ecology and Distribution of Tilapias In_ ICLARM Conference Proceedings 7 (Bellagio Italy 1980) Pullin RSV and Lowe-McConnell RH (Eds) 1982 International Center for Living Aquatic Resources Management (ICLARM Manila Philippines
HematPlogy and Blood Chemistry Reference Intervals for Yellow Perch (Percajlavescens) Raised in Recirculation Systems
TC Hrubec1 and SA Smith2
1Department of Biomedical Sciences E Via Virginia College of Osteopathic Medicine Blacksburg VA 24060 USA
2Department of Biomedical Sciences and Pathobiology (0442) Virginia-Maryland Regional College
of Veterinary Medicine Virginia Polytechnic Institute and State University Blacksburg VA 24061 USA
Corresponding author current address Department of Biomedical Sciences and Pathology (0442) Virginia-Maryland Regional College of
Veterinary Medicine Virginia Polytechnic Institute and State University Blacksburg VA 24061 USA E-mail thrubecvtedu
Keywords Yellow perch Perea hematology blood chemistry reference values plasma biochemistry
International Journal of Recirculating Aquaculture 5 (2004) 29-42 All Rights Reserved copy Copyright 2004 by Virginia Tech and Virginia Sea Grant Blacksburg VA USA
International Journal of Recirculating Aquaculture Volume 5 June 2004 29
Hematology and Blood Chemistry of Yellow Perch (Percaflavescens)
ABSTRACT Determination of hematology and blood plasma biochemistry values is routinely used to assess the health of wild and domestic animals Yellow perch (Percaflavescens) culture is a growing segment of the US aquaculture industry and tools are needed to monitor the health status of these fish This paper reports reference values for complete hematological and biochemistry profiles of normal healthy yellow perch raised in recirculation culture conditions The following hematologic values were determined packed cell volume plasma protein erythrocyte leukocyte lymphocyte neutrophil monocyte and thrombocyte numbers A description of leukocyte morphology is presented Additionally the following plasma biochemical values were determined total protein albumin globulin creatinine total bilirubin alkaline phosphatase aspartate aminotransferase sodium potassium chloride calcium phosphorus magnesium glucose and cholesterol Reference values for a specific population of fish need to be determined prior to utilizing diagnostic blood samples from individuals Developing diagnostic hematology for fishes can enhance yellow perch culture by providing a means for the early detection and identification of infectious disease and of sub-lethal conditions that may affect production performance
INTRODUCTION Yellow perch (Percaflavescens) are an important game fish throughout much of the Northeast and Midwestern United States and Canada Contamination of natural waters by pollutants and an increased consumer demand for fresh seafood has led to the aquaculture production of yellow perch The culture of yellow perch is a rapidly emerging segment of aquaculture in the United States (Schmitz 1999) and has great economic potential especially in recirculation aquaculture systems (Kelly 2000 Mallison 2000) As more producers cultivate yellow perch it will become increasingly important to accurately evaluate the health of these fish and to develop tools such as diagnostic hematology to monitor the health status of fish during their production cycle
Diagnostic evaluation of blood parameters has been used extensively for many mammalian avian and reptilian species The rapidly growing aquaculture industry will increasingly need to utilize information of this type in order to assess the health status of cultured fishes Unfortunately hematology use in aquaculture remains limited in part due to the lack of
30 International Journal of Recirculating Aquaculture Volume 5 June 2004
Hematology and Blood Chemistry of Yellow Perch (Percaflavescens)
reliable reference blood values for most fish species Accurate reference intervals have been developed for some species including hybrid striped bass and tilapia under different production settings (Hrubec et al 1996 1997ab 2000 2001 Hrubec and Smith 2000) and for trout (biochemistry only Wedemeyer and Nelson 1975) pacu (hematological only Tocidlowski et al 1997) and milkfish (Ram-Bhaskar and Srinivasa-Rao 1989)
Little is known about the blood response of yellow perch There are few studies that have previously measured blood values in yellow perch (Toneys and Coble 1980 Nelson et al 1988 Nelson and Mitchell 1992 van den Heuvel et al 2000) Only a few parameters such as hematocrit sodium and chloride were determined as most of these studies were toxicological in nature and evaluated changes in other body systems The objective of this study was to generate a complete comprehensive list of reference blood values for normal healthy yellow perch (Perea flavescens) raised to market size in a recirculation system for later use as a diagnostic tool This is the first paper to report full hematological and biochemical profiles for production yellow perch
MATERIALS AND METHODS
Juvenile yellow perch were stocked into production recirculation systems as fingerlings and reared through their production cycle indoors in 10219-L recirculation tanks with a rotating biological contactor filter and 10 freshwater exchange per day At the end of their production cycle when the fish were 17 months old approximately 250 fish were removed from the production system and placed in a smaller 2400-L circular tank with a slant tube clarifier and a trickle biofilter The smaller tank had a freshwater replacement rate of 15 per day The fish were placed in the smaller systems to allow for a more rapid and less stressful capture procedure The fish were acclimated to the new tanks for 3 weeks The photoperiod was approximately 14-h light and 10-h dark Fish were fed daily to satiation with a commercial pelleted diet (Rangen EXTR 400 40 protein 10 fat Rangen Inc Buhl ID USA) The following water quality parameters were determined daily temperature pH ammonia alkalinity hardness nitrite nitrate and dissolved oxygen Ranges for water quality over the duration of the study are shown in Table 1 and are representative of water quality observed daily in these tank systems
International Journal of Recirculating Aquaculture Volume 5 June 2004 31
Hematology and Blood Chemistry of Yellow Perch (Perea flavescens)
Table 1 Water quality parameters for yellow perch (Percaftavescens) reared in a recirculation culture system Values are means plusmn standard deviations for the parameters on the days that fish were bled for hematological and blood biochemical determinations and are representative of the daily water quality values in the system
Parameter For Hematology Fish For Chemistry Fish
Temperature (degC) 209 plusmn 001 207plusmn 11
pH 78plusmn01 79 plusmn 02
NH3 un-ionized (mgL) 0012 plusmn 0012 0011 plusmn 0005
N02-N (mgL) 0031 plusmn 0015 0043 plusmn 0043
N03-N (mgL) 60 plusmn 26 28 plusmn09
Alkalinity (mgL) 252 plusmn44 313 plusmn 48
Hardness (mgL) 399 plusmn 10 433 plusmn27
Dissolved Oxygen (mgL) 74plusmn05 74 plusmn03
Fish were netted rapidly and anesthetized in aerated tank water with buffered tricaine methanesulfonate (MS-222 Sigma Chemical Co St Louis MO USA) until they began to lose equilibrium approximately 20 seconds Individual fish were bled for either hematological determinations (23g needle 1-mL syringe) or for biochemical determinations (23g needle 3-mL syringe) in both cases blood was collected from the caudal vessels After blood samples were collected the fish were weighed measured and checked for external and internal pathologic lesions The sex of each fish was determined by internal observation of the gonads
Blood for hematological determinations was transferred to an ethylenediamine-tetraacetic acid (EDTA) treated pediatric blood tube and held on ice until analysis (lt 1 hour) Blood for biochemical determinations was collected into cold 3-mL heparinized blood tubes and centrifuged at 14000 x g immediately Plasma was collected and frozen at -10degC until analyzed The following analytes were determined in the plasma with an Olympus AU-400 (Olympus America Inc Melleville NY USA) automated clinical chemistry analyzer total protein albumin creatinine total bilirubin alkaline phosphatase (ALP) aspartate aminotransferase (AST) cholesterol glucose sodium potassium chloride phosphorus calcium and magnesium Globulin was calculated from the total protein value minus the albumin value
32 International Journal of Recirculating Aquaculture Volume 5 June 2004
Hematology and Blood Chemistry of Yellow Perch (Percaflavescens)
Hematological analytes were determined from the EDTA anticoagulated blood As we have observed for other fish species EDTA was superior to heparin for yellow perch blood both in preventing clot formation and preserving cellular morphology (Hrubec et al 1996 2000) Blood from the EDTA tube was drawn into microhematocrit tubes and the packed cell volume (PCV) determined after centrifugation at 10000 x g for 5 min Plasma protein was determined with a clinical refractometer using plasma from the microhematocrit tube The total erythrocyte and leukocyte-plus-thrombocyte counts were determined manually with a Neubauer hemacytometer using Natt-Herricks solution as a diluent stain (Natt and Herrick 1952) Blood smears made within 45 minutes of sample collection were stained with Wright-Geimsa stain and were used to determine the differential counts as follows Leukocytes and thrombocytes were identified and counted on the blood smears until 200 leukocytes and a variable number of thrombocytes were enumerated The percentages of each leukocyte type and of thrombocytes were multiplied by the total leukocyte-plus-thrombocyte number to give the final cell counts Thrombocyte numbers were subtracted from the leukocyte-plus-thrombocyte count to give the total leukocyte count This method of manually determining total leukocyte and differential counts has been recommended for use with avian (Zinkl 1986) and fish blood (Hrubec et al 1996 1997ab 2000 2001) as the nucleated red cells prevent accurate enumeration using automated analysis (Huffman and Arkoosh 1997) Slight thrombocyte clumping was observed on the hemacytometer for some individuals only fish with minimal thrombocyte clumping(lt 4 cells clumped) were used for the differential counts to ensure accuracy of the counts
Reference intervals were determined following the guidelines proposed by the National Committee for Clinical Laboratory Standards (NCCLS 1992) As suggested in these guidelines the data were checked for outliers using the 13 differencerange ratio and no outliers were identified The values were then ranked and the high and low 25 were discarded The range of the remaining values provided the reference interval
RESULTS AND DISCUSSION The physiologic and health status of an individual is reflected in the blood producing variations in hematological and blood biochemical values Clinical analysis of blood is a fundamental tool used in human
International Journal of Recirculating Aquaculture Volume 5 June 2004 3 3
Hematology and Blood Chemistry of Yellow Perch (Percaflavescens)
and veterinary medicine to diagnose and predict the outcome of disease and to monitor the effect of therapeutic nutritional and environmental management Blood analysis is not used extensively as a diagnostic tool in fish medicine partly due to the lack of reference intervals for various fish species and also because changes associated with specific diseases and metabolic disorders are not well characterized With sufficient background data clinical analysis of individual blood samples could detect infectious diseases metabolic disorders and sub-lethal disease states affecting production performance
Hematological and plasma biochemistry data from diseased individuals can be evaluated by direct comparison to a reference interval which is the appropriate range of variation in a blood parameter from a defined population of individuals under specific conditions The reference interval needs to be determined on a sufficient number of normal healthy individuals under similar production conditions using standardized analytical techniques (NCCLS 1992) When the deviation in a blood parameter is large enough to fall outside the reference interval it indicates the value may be aberrant and is most likely not due to individual variation for a given fish
Few previous studies have determined blood parameters for yellow perch (Toneys and Coble 1980 Nelson et al 1988 Nelson and Mitchell 1992 van den Heuvel et al 2000) These studies are of limited relevance as they were primarily toxicological studies and only a few blood parameters were determined and also because blood samples were collected and handled by differing methods prior to determination of the blood value Some of the capture (hook and line and gill netting) and blood collection methods (severing the caudal peduncle) used in these studies are also unsuitable for diagnostic blood samples as they result in significant alteration in the blood which will mask diseased states The study with the closest sampling procedure to that used in our experiment only presented selected blood chemistry values for yellow perch after 16 hours of moderate or exhaustive exercise (Nelson and Mitchell 1992) Therefore although the previous studies on yellow perch hematology are helpful in determining the effects of environmental factors and stress they have limited diagnostic utility and even prevent meaningful comparison with the data presented in this paper
The average mean weight of the yellow perch used for the hematological determinations was 125 +- 14g with a total length of 223 +- 08 cm For
34 International Journal of Recirculating Aquaculture Volume 5 June 2004
Hematology and Blood Chemistry of Yellow Perch (Percajlavescens)
the biochemical determinations the fish had a weight of 121 +- 15g and length of 226 +- 08 cm The results of the hematological determinations from 52 fish are listed in Table 2 Values for plasma chemistry reference intervals determined on 42 samples are listed in Table 3 Overall both the hematological and plasma chemistry values were similar to those reported previously for hybrid striped bass and tilapia reared in recirculation systems (Hrubec et al 1996 2000 Hrubec and Smith 2000) The striped bass and tilapia from production systems exhibited wider ranges in value for the different leukocyte types increased numbers of reticulocytes increased plasma and total protein values increased creatinine values and a decreased plasma chloride concentration as compared to fish in lower density recirculation tanks We did not compare blood values from the production yellow perch in this study to yellow perch maintained in low-density tank settings so were unable to determine if these same trends are apparent in yellow perch as well However based on our previous experience with fish hematological and plasma biochemical values there is an indication that these trends are occurring in yellow perch as well
Table 2 Hematological reference intervals for adult yellow perch (Perea flavescens) reared in a recirculation system
Analyte N Reference Interval Mean Stds1
PCV2 () 57 29-47 388 45
Plasma Protein (gdl) 57 60-82 67 06
Erythrocytes (x 106ml) 53 2160-3345 2737 0356
Leukocytes (ml) 53 52590-186490 113914 39086
Lymphocytes (ml)
Small 53 36800-153420 85630 31728
Large 53 3530-23 130 11602 5359
Neutrophils (ml) 53 1860-35950 12430 8837
Monocytes (ml) 53 670-12640 4252 2874
Thrombocytes (ml) 53 38270-118510 72972 21299 1Standard deviation 2Packed cell volume
International Journal of Recirculating Aquaculture Volume 5 June 2004 35
Hematology and Blood Chemistry of Yellow Perch (Perea flavescens)
Table 3 Plasma biochemical values for adult yellow perch (Percaftavescens) reared in a recirculation system
Analyte N Reference Interval Mean Stds1
Total Protein (gdl) 42 37-50 45 04
Albumin (gdl) 42 06-09 07 01
Globulin (gdl) 42 31-42 37 03
Creatinine (mgdi) 42 04-10 06 01
Total bilirubin (mgdi) 42 03-04 03 01
ALP2 (UI) 42 50-114 822 249
AST3 (UI) 42 2-29 85 64
Glucose (mgdi) 42 62-181 1000 350
Cholesterol (mgdi) 42 182-323 2440 330
Sodium (mEqI) 42 138-153 1470 40
Potassium (mEqI) 42 20-38 32 05
Chloride (mEqI) 42 119-133 1260 40
Calcium (mEqI) 42 86-120 103 13
Phosphorus (mEqI) 42 50-96 74 11
Magnesium (mEqI) 42 17-34 27 04 1 Standard deviation 2 Alkaline phosphatase 3 Aspartate aminotransferase (SGOT)
The blood cells present in the yellow perch were typical of teleost fish and included erythrocytes thrombocytes and leukocytes (Fig 1) Erythrocytes were oval to round with characteristic red cytoplasm and an elongate and centrally-located nucleus Immature erythrocytes or reticulocytes demonstrated a blue-purple tinge to the normal eosinophilic cytoplasm (Fig IA B C) The yellow perch had increased numbers of reticulocytes (included in the erythrocyte count) with approximately 7 to 10 per field at lOOx oil immersion compared to what we observe for most fish species The cause for the apparent reticulocytosis is not known but has been observed in other fish species exposed to elevated nitrite and nitrate (Grabda et al 1974 Hrubec et al 1996 2000 Hrubec and Smith 2000)
36 International Journal of Recirculating Aquaculture Volume 5 June 2004
Hematology and Blood Chemistry of Yellow Perch (Perea flavescens)
T bull middotmiddot ~~ - middot
N -
Figure I Characteristic blood cells from yellow perch reared in recirculation systems Blood smears were made with EDTA anticoagulated blood stained with Wrights Geimsa stain Cells are abbreviated as follows U - Large lymphocyte SL - small lymphocyte T - thrombocyte R - reticulocytes (immature erythrocyte) PC - plasma cell (activated lymphocyte) M- monocyte N-neutrophil The blue bar in frame A is Omm
International Journal of Recirculating Aquaculture Volume 5 June 2004 37
Hematology and Blood Chemistry of Yellow Perch (Percajlavescens)
The thrombocytes were slightly smaller than the erythrocytes (Fig IA) They had clear cytoplasm and were variable in shape being elongated pyriform oval or round Nuclear shape tended to follow cytoplasmic shape although oval and round thrombocyte nuclei occasionally were lobulated (Fig IB) as described for striped bass and tilapia (Hrubec et al 1996 2000)
Leukocytes made up the remainder of the cell types seen in the blood and included small and large lymphocytes neutrophils and monocytes No eosinophils or heterophils were observed Small lymphocytes were the smallest cell present with a rim of blue cytoplasm surrounding the round nucleus (Fig IA E F) Large lymphocytes had an abundant and darker blue cytoplasm and the nucleus was larger than observed in the small lymphocyte (Fig IA E) Plasma cells were occasionally observed with a classic open nucleus abundant dark blue cytoplasm and a clear cytoplasmic region adjacent to the nucleus presumably representing the Golgi as in mammalian plasma cells (Fig IC) Plasma cells were included in the large lymphocytes category for the differential counts
Neutrophils were the largest cell present in the blood (Fig ID E F) The cytoplasm of the neutrophil was a translucent grey containing no granules and infrequent vacuoles Cytoplasmic shape was round to angular as the cellular borders often appeared slightly adherent to adjacent erythrocytes distorting cellular shape Nuclear shape of the neutrophil varied from round to horseshoe shaped and frequently segmented into two prominent lobes connected by a thin nuclear bridge (Fig IF) Monocytes had abundant dark blue cytoplasm that was frequently vacuolated (Fig ID) The round to kidney-bean shaped monocyte nucleus was large with prominent chromatin clumping
Analysis of blood parameters can provide a wealth of information useful in analyzing the effects of disease and sub-optimal environmental conditions Providing reference intervals for healthy adult yellow perch reared in recirculation systems furnishes veterinarians and fish health professionals the foundation to develop diagnostic hematology for this species The number of studies that determine actual reference intervals for fish species is limited The majority of blood values determined for fishes are reported in the literature as a mean value with a standard deviation Historically reference intervals were determined as two standard deviations from the mean however this method is only valid when blood values follow a normal distribution It is incorrect to assume
38 International Journal of Recirculating Aquaculture Volume 5 June 2004
Hematology and Blood Chemistry of Yellow Perch (Percaflavescens)
that biological parameters are distributed normally therefore non-parametric methods should be used to accurately determine reference intervals (Reed et al 1971) Techniques to properly determine reference intervals have been established by the NCCLS (1992) and suggestions for their use and interpretation have been discussed (Lumsden 1998) As with mammalian species reference intervals need to be determined for different populations of fish within a single species as culture conditions and environmental variables affect blood values to the extent that they are outside the reference interval (Ram-Bhaskar and Srinivasa-Rao 1989 Hrubec et al 1996 1997ab 2000 2001) Although the reference range for some of the blood parameters appears large it is still possible to detect variation in hematologic values associated with pathological conditions (Hrubec et al 1997b and unpublished data)
Developing reference intervals is a necessary first step in determining which specific hematological changes can be associated with disease conditions As the field of fish hematology develops its usefulness to the aquaculture industry will increase Information derived by standardized non-lethal diagnostic assays will be needed to enhance the culture of yellow perch and other fish species Analysis of diagnostic blood samples can provide a means for early detection of infectious disease and assist in the identification of sub-lethal conditions affecting production performance This should allow for more specific timely and effective disease treatments in the future
ACKNOWLEDGEMENTS The authors wish to thank Mark Kidd of the Virginia Tech Aquaculture Center for his assistance with fish care and sampling
REFERENCES Grabda E Einszporn-Orecka T Felinska C Zbanyszek R
Experimental Methemoglobinemia in Rainbow Trout Acta Ichthyologica et Piscatoria 1974 4 43-71
Hrubec TC Smith SA Robertson JL Feldman B Veit HP Libey G Tinker MK Comparison of Hematologic Reference Intervals between Culture System and Type of Hybrid Striped Bass American Journal of Veterinary Research 1996 57 618-623
International Journal of Recirculating Aquaculture Volume 5 June 2004 3 9
Hematology and Blood Chemistry of Yellow Perch (Percajiavescens)
Hrubec TC Robertson JL Smith SA Effects of Temperature on Hematologic and Serum Biochemical Profiles of Hybrid Striped Bass (Morone chrysops x Morone saxatilis) American Journal of Veterinary Research 1997a 58 126-130
Hrubec TC Robertson JL Smith SA Effects of Ammonia and Nitrate Concentration on Hematologic and Serum Biochemical Profiles of Hybrid Striped Bass (Morone chrysops x Morone saxatilis) American Journal of Veterinary Research 1997b 58 131-135
Hrubec TC Smith SA Hematology and Plasma Chemistry Values for Production Tilapia ( Oreochromis hybrid) Raised in a Recirculation System International Journal of Recirculating Aquaculture 2000 J 5-14
Hrubec TC Cardinale JL Smith SA Hematology and Plasma Chemistry Reference Intervals for Cultured Tilapia ( Oreochromis hybrid) Veterinary Clinical Pathology 2000 29 7-12
Hrubec TC Smith SA Robertson JL Age Related Differences in Hematologic and Plasma Chemistry Analytes of Hybrid Striped Bass Morone chrysops x Morone saxatilis Veterinary Clinical Pathology 2001 30 8-15
Huffman PA Arkoosh MR Characteristics of Peripheral Blood Cells from Rainbow Trout Evaluated by Particle Counter Image Analysis and Hemocytometric Techniques Journal of Aquatic Animal Health 1997 9 239-248
Kelly AM Yellow Perch Culture in the United States Manna or Mania World Aquaculture 2000 31 4-17
Lumsden JH Normal or reference values Questions and Comments Veterinary Clinical Pathology 1998 27 102-106
Mallison JA 2000 A White Paper on the Status and Needs of Yellow Perch Aquaculture in the North Central Region North Central Regional Aquaculture Center Michigan State University E Lansing MI USA
Natt MP Herrick CA A New Blood Diluent for Counting Erythrocytes and Leukocytes of the Chicken Poultry Science 1952 31 735-738
40 International Journal of Recirculating Aquaculture Volume 5 June 2004
Hematology and Blood Chemistry of Yellow Perch (Percaflavescens)
NCCLS National Committee for Clinical Laboratory Standards 1992 How to Define Determine and Utilize Reference Intervals in the Clinical Laboratory Proposed Guidelines NCCLS Document C28-P Villanova PA USA
Nelson JA Mitchell GS Blood Chemistry Response to Acid in Yellow Perch (Perea flavescens) Comparison of Populations from Naturally Acidic and Neutral Environments Physiological Zoology 1992 65 493-514
Nelson JA Magnuson J J Chulkasem W Blood Oxygen Capacity Differences in Yellow Perch (Percaflavescens) from Northern Wisconsin Lakes Differing in pH Canadian Journal of Fisheries and Aquatic Sciences 1988 45 1699-1704
Ram-Bhaskar B Srinivasa-Rao K Influence of Environmental Variables on Hematology and Compendium of Normal Hematological Ranges of Milkfish Chanos chanos (Forskal) in Brackish Culture Aquaculture 1989 83 123-136
Reed AH Henry RJ Mason WB Influence of Statistical Method Used on the Resulting Estimate of Normal Range Clinical Chemistry 1971 17 275-284
Schmitz M 1999 Comparative Growth of All-Female Versus Mixed Sex Yellow Perch (Percaflavescens) in Recirculating Aquaculture Systems MS Thesis Virginia Tech Blacksburg VA USA
Toneys ML Coble DW Mortality Hematocrit Osmolality Electrolyte Regulation and Fat Depletion of Young-of-the-Year Freshwater Fishes under Simulated Winter Conditions Canadian Journal of Fisheries and Aquatic Science 1980 37 225-232
van den Heuvel MR Power M Richards J MacKinnon M Dixon DG Disease and Gill Lesions in Yellow Perch (Percaflavescens) Exposed to Oil Sands Mining-Associated Waters Ecotoxicology and Environmental Safety 2000 46 334-341
Wedemeyer GA Nelson NC Statistical Methods for Estimating Normal Blood Chemistry Ranges and Variance in Rainbow Trout (Salmo gairdneri) Shasta Strain Journal of the Fisheries Research Board of Canada 1975 32 551-554
International Journal of Recirculating Aquaculture Volume 5 June 2004 41
Hematology and Blood Chemistry of Yellow Perch (Percajlavescens)
Zinkl JG Avian Hematology In Schalms Veterinary Hematology (4th edition) Jain NC (Ed) 1986 Pages 256-260 Lippincott Williams amp Wilkins Philadelphia PA USA
42 International Journal of Recirculating Aquaculture Volume 5 June 2004
Hatchery and Grow-out Performance of Sunshine Bass and Backcross Hybrid Striped Bass in Recirculating Aquaculture Systems
SR Lindell1bull2 B Delbos1 R Perham1 J Goldman1 EM Hallerman3 TO Brenden3bull4
1 Fins Technology 15 Industrial Road Turners Falls MA 01376 USA
2Current address Marine Biological Laboratory Marine Resources Center 7 MBL Street Woods Hole MA 02543 USA
3Department of Fisheries and Wildlife Sciences (0321) Virginia Polytechnic Institute and State University Blacksburg VA 24061 USA
4Current address Institute of Fisheries Research University of Michigan 1109 N University Avenue Ann Arbor MI 41809 USA
Corresponding authors e-mail ehallermvtedu
Keywords striped bass performance aquaculture growth
International Journal of Recirculating Aquaculture 5 (2004) 43-54 All Rights Reserved copyCopyright 2004 by Virginia Tech and Virginia Sea Grant Blacksburg VA USA
International Journal of Recirculating Aquaculture Volume 5 June 2004 43
Performance of Sunshine Bass and Backcross Hybrid Striped Bass
ABSTRACT Previous research has suggested that backcross hybrid striped bass (BX sunshine bass female x striped bass male) perform as well as F 1 hybrid striped bass (sunshine bass white bass female x striped bass male) for many economically important traits We conducted trials to compare rearing and growth traits of selected backcross hybrid striped bass with hybrid striped bass (HSB) We spawned and reared larval BX fry in two hatchery cycles measured fry growth and performance and compared them to past performance of HSB fry We conducted a grow-out trial of commercially-available hybrid striped bass versus backcross hybrid striped bass in replicated tanks to phase II fingerling size (approximately lOOg) Compared to HSB in the hatchery phase backcross hybrid striped bass exhibited lower fertilization rate comparable swimbladder inflation rate shorter time-to-weaning lower survival comparable growth and comparable condition factor After 60 days HSB exhibited significantly better growth survival and feed conversion efficiency than BX However BX may have better potential market acceptance by virtue of having a lower condition factor appearing longer and less deep-bodied than HSB
INTRODUCTION Striped bass (Morone saxatilis) and its hybrids constitute a major sector of aquaculture in the United States with production of 105 million pounds in 2002 (Carlberg and Van Olst 2003) Commercially significant quantities of Morone stocks also are produced in Taiwan China and Israel Approximately 43 of Morone production occurs in tanks (Carlberg and Van Olst 2003) much of that in recirculating aquaculture systems (RAS) Private and government marketing experts estimate that US production could increase to 50 million pounds and $100 million in annual farm-gate revenue if market prices could be decreased only moderately (Halbrendt et al 1991) Production costs for HSB could be reduced by 12 if selective breeding can yield 20 faster growth rates (Losordo and Westerman 1994)
The majority of Marone production is not of striped bass but of its hybrids with white bass (M chrysops) because of their hardiness rapid growth rate and limited availability of female striped bass broodstock (reviewed by Harrell 1997) Further female WB are considered easier and more predictable to strip-spawn Hence most commercial production
44 International Journal of Recirculating Aquaculture Volume 5 June 2004
Performance of Sunshine Bass and Backcross Hybrid Striped Bass
is of sunshine bass the progeny of the white bass female x striped bass male interspecific cross Research has also been undertaken to evaluate the performance of second generation hybrids and backcrosses Several studies have suggested that the progeny of F 1 hybrid striped bass females backcrossed to striped bass males have merit for commercial production Jenkins et al (1998) compared the performance of backcross hybrids to F1 hybrid striped bass and striped bass to market size in a recirculating system At harvest no differences in growth rate or feed conversion were detected specific growth of BX was intermediate to those of the other stocks with survival lower Tomasso et al (1999) compared performance of F 1 and backcross hybrids between 20 and 90 grams for 56 days in tanks (Tomasso et al 1999) and observed similar survival growth and feed conversion rates among the hybrid types Detailed comparison of the hatchery performance of sunshine and BX hybrids is lacking We hypothesized that use of selected hybrid striped bass and striped bass for the backcross might yield a high-performance BX hybrid Should high performance be realized progressive fish farmers might utilize this approach by selecting the best F1 hybrid females from their own production stocks making the backcross by strip-spawning them and fertilizing the eggs with purchased milt from selectively bred striped bass males (Kerby 1983) thereby obtaining a high-performance production stock that because of selection on the maternal stock is suited to their particular farm conditions
In this study we evaluated the production potential of backcross (BX) hybrid striped bass (female sunshine bass x male striped bass) We compared the hatchery and grow-out performance of BX spawned from select broodstock and sunshine bass (HSB) of common genetic background Specifically we evaluated spawning success hatch rate growth survival and feed conversion efficiency through the first six months of life In order to benchmark our results we ran a trial in replicated tanks with HSB supplied by the most widely-used commercial source of fingerlings (Keo Fish Farms Keo AR USA) and compared their performance with our BX All fish were cultured within intensive controlled-environment recirculating aquaculture systems
International Journal of Recirculating Aquaculture Volume 5 June 2004 45
Performance of Sunshine Bass and Backcross Hybrid Striped Bass
MATERIALS AND METHODS In July 2001 we crossed 4 hybrid striped bass females to each of 4 striped bass males to produce 16 families of backcross hybrid striped bass Poor fertilization rates resulted in a low yield of fry from this spawn However there were enough fry to pool and conduct a pilot commercial-scale hatchery run Randomly-chosen samples from the resulting 4000 fingerlings were used for the grow-out trial
In October 2001 we spawned 3 female HSB with 2 male SB and eventually produced 7000 fingerlings While this was not enough to grow in commercial-scale systems we collected hatchery performance data to corroborate our JulyAugust experience with BX
Fertilized eggs were incubated in McDonald jars Upon hatch the larvae swam out of the hatching jar and into a 1900-L larval rearing tank Replicate larval rearing tanks were stocked with approximately 25 larvae per liter Tanks were maintained with recirculating water and surface oil-skimming pads for the first 5 to 7 days post-hatch until swim-bladder inflation was completed For the second week post-hatch larval rearing tanks were maintained static with gentle central aeration except for an exchange of about 30 of the tank water over the course of two hours each day During the second week post-hatch larvae were fed rotifers enriched with Algamac (Aquafauna BioMarine Inc Hawthorne CA USA) maintained at a density of 10ml By the end of the second week larvae were weaned from rotifers to Artemia nauplii By the end of the third week the larvae were typically weaned from enriched Artemia to artificial feed (Biokyowa Inc Girardeau MO USA) Weaned larvae were graded just once around 60 days post-hatch to remove the top 1 to 2 of larger fish responsible for cannibalism
In November 2001 we purchased lOg fingerlings that represent typical industry-standard HSB from Keo Fish Farms (Keo AR USA) These HSB closely matched the size and weight of our BX from the July spawn for the grow-out trial BX and HSB fingerlings were each stocked separately in triplicate 1900-L round tanks connected to the same recirculating system and reared at 23degC and a salinity of 1-3 ppt All six tanks were similarly stocked initially (approximately 1 kgm3) Fish were offered 80 of their expected ration via belt-feeders and hand-fed to satiation twice a day Approximately every 3 weeks length and weight samples were taken from a randomly-chosen 15 of each tanks
46 International Journal of Recirculating Aquaculture Volume 5 June 2004
Performance of Sunshine Bass and Backcross Hybrid Striped Bass
population At the conclusion of the project the tanks reached typical commercial densities of 5 to 9 kgm3bull
We quantified reproductive and hatchery performance of the three groups including fertilization rate swimbladder inflation rate days to weaning onto artificial feed (ie date of first ingestion to date that gt90 ingested artificial feed) survival estimates to approximately 60 days after hatch and to the end of the study feed conversion rate and monthly average weight and length The trial continued until mid-February 2002 when the HSB averaged approximately lOOg Results from previous years hatchery efforts with HSB using similar rearing protocols were used for comparative purposes
Both the hatchery and grow-out systems employed water recirculation technology including drum-filters fluidized-bed biofilters oxygenation ozonation and automated pH and temperature control that maintained high water-quality standards throughout the trials
Differences in fish weight between the hybrid types were analyzed as a repeated-measures general linear mixed model Residual (restricted) maximum likelihood was used to estimate the model parameters Initial fish biomass in each of the tanks and the amount of feed provided to each of the tanks were included in the model as covariates to assess the influence of these concomitant variables on differences in weight A first-order autoregressive covariance structure was assumed for the repeated-measurements of fish weight
Differences in fish survival at the end of the grow-out trial were analyzed as a general linear model with tanks serving as a blocking factor Because fish survivalmortality is a binary response and thus will violate an assumption of normality the significance of the test comparing survival between the hybrid types was obtained by randomization (number of randomizations= 1000) whereby the F-statistic of the original test was compared to F-statistics obtained by randomly allocating the survival mortality data to the different hybrid types The Type-I error rate for all statistical tests was set equal to 005
International Journal of Recirculating Aquaculture Volume 5 June 2004 47
Performance of Sunshine Bass and Backcross Hybrid Striped Bass
Table 1 Comparison of hatchery traits of backcross (BX) and Fl hybrid (HSB) striped bass for traits of economic interest
Traits of interest BX-HSB BX-HSB HSB HSB HSB
Female parent strain1 AR ARMD AR AR AR
Male parent strain1 MD FL MD FL MD MD FL MD Canada
Spawn date Oct-01 Jul-01 Mar-01 Oct-00 Jan-99
Fertilization 32 22 53 57
Swimbladder inflation 90 50 98 95
Weaning start (DAH)2bull3 24 21 17 22
Weaning end (DAH4 33 32 37 38
Mean wt (g) at 60 DAH 042 052 042 05
Survival to 60 DAH 7 740 104
Mean L (mm) at 30 DAH 133 11 1225
Mean L (mm) at 36 DAH 139 167
Mean L (mm) at 75 DAH 367 404 452
Mean Wt (g) at 75 DAH 074 081 12 0825 11
Condition factor at 1g 123E-05 118E-05 1Strain abbreviations AR=Arkansas R MD=Maryland FL=Florida 2DAH=Days after Hatch 3Weaning start marks the first introduction and ingestion of dry feed to replace live feeds 4Weaning end denotes the time when the transition to dry feeds is complete and live feeds are no longer utilized
RESULTS
Hatchery Trial Results A summary of performance for hatchery traits of production interest for BX and HSB is presented in Table 1
The fertilization rate for the BX eggs was lower than that which we typically found with HSB (22-32 vs 55) and considerably lower than our experience in 2000 when we conducted fertilization trials with BX (80)
Swimbladder inflation rate ranged from 50 in the first hatchery run to 90 in the second run We attribute the low rate in the first run to
48 International Journal of Recirculating Aquaculture Volume 5 June 2004
Performance of Sunshine Bass and Backcross Hybrid Striped Bass
surface-film and system management problems We showed in the second run that swimbladder inflation in BX was comparable to that typically attainable (gt90) for Morone fry
Time-to-weaning onto dry diets was shorter (10 days versus 18 days) and earlier (day 33 versus day 38) for BX than for HSB Survival of BX to 60 days after hatch (7) was lower than expected on the basis of previous experience with HSB (gt10) Mean weights for BX at 60 days after hatch in two hatchery runs (052 and 042g) was similar to those for HSB (042 and 05g) However HSB exhibited greater mean weight than BX at 75 days after hatch (l04 vs 077g)
Condition factor (K) of BX (123 + 009) was not significantly different from those of HSB (119 + 005) or striped bass (l13 + 003) at 1 gram mean weight
Frequencies of deformities for BX (lt2) were lower than those in earlier reports Bosworth et al (1997) reported deformities in 8 of BX and 4 ofHSB
Grow-out Trial Results Overall there was not a significant difference in weight between the hybrid types (F = 606 df = 13 P = 00907) however as evidenced in
100
80
60
40
20
--+- BX - Overall -0- HSB - Overall -ltgt- BX - Individual Tanks A middot middot middotbullmiddotmiddot middot HSB - Individual Tanks fi
fi ~o
12 Dec 2001 3 Jan 2002 24 Jan 2002 12 Feb 2002
Date Figure 1 Meanfish weight(plusmn 2 SE) at each time period for backcross hybrid striped bass (BX) and hybrid striped bass (HSB) Also shown is meanfish weight at each time periodor groups in individual tanks
International Journal of Recirculating Aquaculture Volume 5 June 2004 49
Performance of Sunshine Bass and Backcross Hybrid Striped Bass
Figure 1 there was a significant interaction on fish weight by hybrid type and time (F = 5157 df = 1587 P lt 00001) Using the slicing option available in SAS (SAS Institute 1999) we tested for differences in weight between the hybrid types for each time period and found that although weights of HSB and BX were not significantly different during the first two measurement periods (Time 1 F = 027 df = 1587 P = 06032 Time 2 F = 036 df = 1587 P = 05496) the hybrid types did differ in weight during the last measurement periods Specifically HSB were significantly heavier than BX on the 24th of January 2002 (F = 1061 df = 1 587 P = 00032) and the 12th of February 2002 (F = 3788 df = 1587 P lt 00001) Overall HSB had a specific growth rate of 268 per
Table 2 Mean weights of backcross hybrid striped bass (BX) and hybrid striped bass (HSB) over the course of a 3-month growth trial
Date BXTank5
Wt(g) SE
112101 1228
BXTank6 Wt(g) SE
1201
BX Tank 12 Wt(g) SE
1274
HSB Tank 13 HSB Tank14 HSB Tank 15 Wt(g) SE Wt(g) SE Wt(g) SE
1180 1016 1088
1211201 1744 102 1778 095 1658 096 1798 109 1752 118 1704 109
1 302 27 60 1 38 28 76 155 27 04 154 3306 157 3424 149 3414 211
1 2402 4196 252 4424 207 4882 299 6344 263 6192 326 6432 362
212102 6332 317 6763 334 6912 299 9474 473 9553 452 10500 388
Table 3 Comparison of survivalfeed conversion ratio (FCR) and condition factor at 60 grams for backcross hybrid striped bass (BX) and hybrid striped bass (HSB)
Cross Tank
Starting
Ending
Survival
BXS
160
136
85
BX 6 BX 12 HSB 13 HSB 14 HSB 15
160
138
86
161
137
85
178
177
99
179
173
97
180
179
99
Starting Biomass (g) 1964 1922 2051 2100 1819 1958
Ending Biomass (g) 8612 9334 9469 16770 16526 18795
Feed Fed(g) 12106 12135 11447 18041 17805 20463
FCR 182 164 154 123 121 122
Condition Factor 168E-05 166E-05 169E-05 194E-05 193E-05 208E-05
SE 353E-07 337E-07 424E-07 255E-07 327E-07 845E-07
50 International Journal of Recirculating Aquaculture Volume 5 June 2004
Performance of Sunshine Bass and Backcross Hybrid Striped Bass
day while BX had a specific growth rate of 205 per day Neither of the covariates included in the model were found to have a significant effect on weight differences (initial tank biomass F = 142 df = 1587 P = 02332 amount of feed F = 005 df = 1587 P = 08165)
Performance regarding key economic traits-survival feed conversion efficiency and condition factor-are summarized in Table 3 At the end of the grow-out trial survival of HSB was significantly greater than that of BX (F = 6216 df = 1 1014 P lt 00001) Feed conversion ratio was better for HSB (122) than for BX (166) Condition factors for BX were lower than those for HSB (l68 vs 198) meaning that BX appeared longer and less deep-bodied than HSB
DISCUSSION Our data showed that F1 HSB performed as well or better than BX for a range of hatchery- and grow-out-related traits
Hatchery traits Fertilization rates for backcross lots were approximately half that for HSB There was a wide variance for fertilization and hatch rates of eggs from HSB females Some of this variance may be due to differences in hatchery protocols (different hormone injections used strip vs tank spawning) at the commercial hatcheries where the data were collected (TIJ Smith personal communication) Poor hatch rates also may be attributable in part to hybrid breakdown that is to developmental incompatibilities among the genomes of the respective species when coadapted gene complexes are broken up at meiosis in the F1 (Hallerman 2003)
In the hatchery trial we hypothesize that the low swimbladder inflation rate for our J~ly fry resulted from offering first feed to the BX too early When rearing HSB and SB fry we typically wait until the yolk sac has been largely resorbed and the fry mostly have inflated their swimbladders before we introduce live feed This is because live feed can cause an oily film on the water surface that interferes with a frys successful ingestion of air bubbles necessary to inflate the swimbladder (Chapman et al 1988) The timing of swimbladder inflation varies with fry type and temperature with HSB typically inflating between 3 and 6 days after hatch and SB 6 to 9 days after hatch BX fry inflate their swimbladder at an intermediate time 5 to 8 days after hatch (DAH) Since for the July
International Journal of Recirculating Aquaculture Volume 5 June 2004 51
Performance of Sunshine Bass and Backcross Hybrid Striped Bass
spawn we introduced feed into their tanks at the time prescribed for HSB (at 5 DAH) BX fry may have had a reduced opportunity to inflate their swimbladders because of interference by a surface film with air contact In the October spawn we monitored swimbladder inflation more carefully and introduced live feed on day 7 after almost 90 of swimbladders were inflated The low swimbladder inflation rate in the July hatchery run of BX may have had a direct impact on survival Larvae without inflated swimbladders expend more energy swimming exhibit reduced growth rates are less tolerant of stress and often sink to the tank bottom and die (Van Heukelem et al 2000)
BX were weaned more quickly and earlier onto dry diets than HSB which may have helped contribute to their ability to match the size and weight of HSB at 60 DAH Earlier weaning has economic merit since dry diets are generally cheaper and easier to feed than brine shrimp
Grow-out traits After 60 days post-hatch the growth and other performance differences between BX and HSB became more evident HSB exhibited significantly better growth survival and feed conversion ratios
We hypothesized that backcross hybrid striped bass might grow as fast or faster than the standard commercially-available F 1 hybrid striped bass if high-performance HSB females were selected as broodstock Our data regarding performance in intensive tank systems did not support this hypothesis Rather our observations accord with the classical view that the high performance of some interspecific hybrids is largely due to heterosis and that because the heterosis shown by an F 2 or backcross hybrid is only half that shown in an F1 (Falconer and Mackay 1996 p 257) that advanced generation hybrids would not perform as well as F1
hybrids Indeed F 2 HSB previously showed low hatch rates low larval survival and high variability of growth rate (Smith and Jenkins 1984 Smith et al 1985) Our results suggest that the heterosis expressed in HSB for growth and performance was greater than the selective breeding advantage we employed by crossing high performance HSB females with male striped bass Apparently the additive genetic variance contributed by the HSB and striped bass selected for size-at-age could not make up for the loss of dominance variance
BX may have better potential market acceptance by virtue of having a lower condition factor appearing longer and less deep-bodied than HSB more
52 International Journal of Recirculating Aquaculture Volume 5 June 2004
Performance of Sunshine Bass and Backcross Hybrid Striped Bass
like striped bass that are more familiar in many markets Fins Technologys market experience has shown that the premium-priced live markets prefer longer leaner fish such as the backcross There is the possibility that because of later maturity backcross hybrid striped bass may grow to larger sizes than hybrid striped bass This is attractive because there is an unserviced demand for larger (1 kg+) fish that can provide portion-controlled 7-9 ounce fillets for the restaurant and retail markets
ACKNOWLEDGEMENTS This project was supported by US Department of Agriculture-Small Business Innovation Research Program Phase I Grant no 2001-00373 EMH is supported by the USDA-CSREES Hatch Program and the Commonwealth of Virginia Aquaculture Initiative
REFERENCES Bosworth BG Libey GS Notter DR Egg Larval and Fingerling
Traits of Crosses among Striped Bass White Bass and their Fl Hybrids Aquaculture 1997 154 201-217
Carlberg J Van Olst J US Production and Sales of Hybrid Striped Bass (1987-2002) 2003 httpaquanicorgsbgaHSBversion5ppt
Chapman DC Hubert WA Jackson UT Influence of Access to Air and of Salinity on Gas Bladder Inflation in Striped Bass Progressive Fish-Culturist 1988 50 23-27
Falconer DS Mackay TFC 1996 Introduction to Quantitative Genetics Fourth Edition Longman Group Ltd Harlow Essex UK
Halbrendt CK Wirth FF Vaughn GF Conjoint Analysis of the Mid-Atlantic Food-Fish Market for Farm-Raised HSB Southern Journal of Agricultural Economics 1991 23 155-163
Hallerman EM Coadaptation and Outbreeding Depression In Po_pulation Genetics Principles and Applications for Fisheries Scientists Hallerman E (Ed) 2004 American Fisheries Society Bethesda MD USA
Harrell RM Hybridization and Genetics Striped Bass and Other Morone Culture In Harrell RM (Ed) 1997 Pages 217-234 Elsevier Science Amsterdam
International Journal of Recirculating Aquaculture Volume 5 June 2004 53
Performance of Sunshine Bass and Backcross Hybrid Striped Bass
Jenkins WE Heyward LD Sr Smith TIJ Performance of Domesticated Striped Bass Marone saxatilis Palmetto Bass and Backcross Hybrid Striped Bass (Sunshine Bass Female x Striped Bass Male) Raised in a Tank Culture System Journal of the World Aquaculture Society 1998 29 505-509
Kerby JH Cryogenic Preservation of Sperm from Striped Bass Transactions of the American Fisheries Society 1983 112 86-91
Losordo TM Westerman P An Analysis of Biological Economic and Engineering Factors Affecting the Cost of Fish Production in Recirculating Aquaculture Systems Journal of the World Aquaculture Society 1994 25 193-203
SAS Institute 1999 The SAS System for Windows version 82 SAS Institute Cary NC USA
Smith TlJ Jenkins WE Controlled Spawning of Fl Hybrid Striped Bass (Marone saxatilis x M chrysops) and Rearing of F2 Progeny Journal of the World Mariculture Society 1984 15 147-161
Smith TlJ Jenkins WE Snevel JF Production Characteristics of Striped Bass (Marone saxatilis) and Fl - F2 hybrids (Marone saxatilis and M chrysops) Reared in Intensive Tank Systems Journal of the World Mariculture Society 1985 16 57-70
Tomasso JR Kempton CJ Gallman A Smith TlJ Comparative Production Characteristics of Sunshine Bass and Sunshine Bass x Striped Bass in Recirculating-Water Systems North American Journal of Aquaculture 1999 61 79-81
Van Heukelem WF Harrell RM Hughes SG Lindell SR Friedmann BR Optimal Conditions for Swimbladder Inflation in Striped Bass Larvae Reared in Intensive Systems Northeast Regional Aquaculture Center Publication No 00-006 (2000) 5 pages
54 International Journal of Recirculating Aquaculture Volume 5 June 2004
Book Review
Fjofish apd Shellfish Bacteriology Mapua) Techpjques apd Procedures KA Whitman with contributions by NG MacNair
Iowa State Press (Blackwell Publishing Professional) Ames IA USA (2004) 288 pages ISBN 0813819520 US $4999
Reviewed by Rocco C Cipriano United States Geological Survey National Fish Health Research Laboratory 11649 Leetown Road Kearneysville WV 25430 USA E-mail rocco_ciprianousgsgov
Despite the fact that several good texts have been published regarding the description and nature of bacterial pathogens in aquatic animals there remained a need for a comprehensive yet practical guide devoted to techniques and procedures used for bacterial identification Diagnosis and detection of fish and shellfish pathogens often requires reliance upon standard microbiological media tests and reagents for some bacteria but more specialized assays are required for many aquatic pathogens In the latter case the products necessary for such assays are not commercially available and must be produced in aquatic animal diagnostic facilities from their basic ingredients Often therefore the compositions of differential media and the conduct of certain tests for the primary isolation or detection of specific aquatic pathogens are only available by referencing the general body of published scientific literature Hence until now there has not been a single-source shelf-volume that combines standard microbiological procedures used for routine detection and identification of medically important bacteria with the specialized needs of the fisheries profession This manual however helps to fill that void
The manual stands as a reference suitable for professional aquatic biologists with backgrounds in microbiology veterinarians and students of aquatic animal health Its strength lies in its coverage of the subject matter regarding culture-based diagnosis and identification of bacteria associated with finfish bivalves and lobsters Sections on
International Journal of Recirculating Aquaculture 5 (2004) 55-56 All Rights Reserved copyCopyright 2004 by Virginia Tech and Virginia Sea Grant Blacksburg VA USA
International Journal of Recirculating Aquaculture Volume 5 June 2004 55
Book Review FiQish and ShelJfish Bacteriology Manualmiddot Techniques and Procedures
aseptic collection and shipment of samples qualitative and quantitative procedures for bacterial isolation staining techniques media and standard biological tests used for the cultivation and phentotypic characterization of pathogenic bacteria and antibiotic sensitivity testing provide sound background for the student or novice practitioner Particularly beneficial for anyone who is not experienced with aquatic microbial pathogens is the section listing principal organs media and appropriate incubation temperatures to be used as the most probable sources of isolation for the specific bacteria
More experienced professionals will find it helpful and convenient to have the descriptions and interpretations of differential media (eg Coomassie Brilliant Blue Agar for Aeromonas salmonicida Rimler-Shotts Agar for Aeromonas hydropila Cytophaga Agar Shieh and TYES for Flavobacterium spp and Edwardsiella ictaluri Agar and various other media for Renibacterium salmoninarum) listed in a single source The major identifying criteria that phenotypically characterize selected bacterial pathogens are also described in tabulated form Specialized tests such as the SIF test to detect covert infections nurse culture techniques for enhanced bacterial growth and assays for public health indicator organisms in bivalves are documented Sections covering serology immunoassay and non-cultured based molecular assays (eg polymerase chain reaction) are also presented but are not as completely summarized as those for bacterial isolation In summary the nature of this manual makes it appropriate for frequent use as a practical laboratory guide
56 International Journal of Recirculating Aquaculture Volume 5 June 2004
Subscription Information
International Journal of Recirculating Aquaculture
A publication ofVirginia Tech and the Virginia Sea Grant College Program
IJRA presents the latest developments in RAS-related research focusing on the areas of
Food Quality Pathology
Food Safety
Aquatic Medicine Breeding amp Genetics Waste Management
FishShellfish Growth amp Nutrition Recirculating Systems Mgmt Marketing amp Economics Water Conservation
Dont miss an issue of this informative peer-reviewed journal Subscribe now using your credit card by calling 540-231-2075 or by printing out a form at wwwcfastvteduijrahtml If you prefer you can also mail this form to the address below along with a check or money order
Name ----------------~ Address ----------------Line2 ------------------City ____________ State __ _ Country Postal Code ___________ _ Phone Fax -------- --------e-mail-----------------check _ 2 year ($25 US)
International Journal of Recirculating Aquaculture Food Science amp Technology Building (0418)
Virginia Polytechnic Institute and State University Blacksburg VA 24061
phone (540) 231-2075 fax (540) 231-9293 e-mail IJRAvtedu
International Journal of Recirculating Aquaculture Volume 5 June 2004 57
~ International Journal of ~ Recirculating Aquaculture A publication of Virginia Tech and the Virginia Sea Grant College Program
Instructions for Authors The International Journal of Recirculating Aquaculture (IJRA) encourages the submission of original high-quality papers on research in all aspects of recirculating aquaculture Papers will be peer-reviewed and evaluated for scientific merit relevance and for their usefulness in promoting the advancement of recirculating aquaculture Complete coherent projects are preferred Any related papers submitted together must be thoroughly cross-referenced All papers must be original meaning that the data and the information presented must be the work of the authors and can not have been published elsewhere Dual publication of a paper or data is possible only through the permission of the Editors of both journals THERE ARE NO PAGE CHARGES for IJRA submissions
INITIAL MANUSCRIPT SUBMISSION Manuscripts should be sent to Ms Angela Correa Managing Editor by mail using the address listed at the end of these instructions or by e-mail to (ijravtedu) Submit four (4) copies of each manuscript if regular mail is used All manuscripts must be in English Dot matrix type is not acceptable and all such submissions will be returned without review Each submission must include a cover letter stating that the paper contains original research and that the information has not been published elsewhere E-mailed submissions must be saved in doc format Be sure to include the names of colleagues who have already reviewed the work presented IJRA has two categories for submission 1 Articles which are complete in-depth scientific studies and 2 Notes which are short papers of limited scope Articles and notes will be critically reviewed by two or three experts as well as by the Managing Editor Submissions may be returned without peer review in cases where the Managing Editor determines that they are inappropriate for the journal of poor quality poorly written or fail to follow the journals style format
PREPARATION OF MANUSCRIPTS IJRA uses the latest editions of Websters New International Dictionary and Websters New Collegiate Dictionarv for standard spellings and word definitions All spelling will be in American English Foreign or science-related terminology that is unfamiliar and does not appear in these dictionaries will require an accompanying definition Acceptable scientific and common names of fishes are listed in A List of Common and Scientific Names of Fishes from the United States and Canada published by the American Fisheries Society Common names may be used throughout each paper but must be accompanied by a full scientific name when they first appear in a paper The author must use the full common name eg yellow perch not perch All foreign language words should be italicized in the manuscript
In the manuscript number each page sequentially and include the senior authors name next to the page number (eg Page 4 Jahncke) on each page Single-space all typed material including references Type size in the body of the text should be no larger than 12pts and no smaller than 10 pts Subsection headings should also be italicized in the manuscript Spell out one-digit numbers except when they are used with units of measure - eg six ponds 7 days
International Journal of Recirculating Aquaculture Volume 5 June 2004 59
Spell out any number that begins a sentence When two numbers occur sequentially in the text one of the numbers must be spelled out- eg In 1987 fifty fish were stocked Use commas in numbers of 1000 or more Use the 24-hour clock to describe time- eg 1300 not 100 pm
Keep footnotes to a minimum and number them sequentially throughout the paper All units of measurement must be reported via the metric system except in special circumstances (eg horsepower) Standard scientific abbreviations and symbols may be used without definition If the use of a symbol could cause confusion define the symbol the first time it is used On the final draft of a paper that has been accepted for publication Greek letters or other extraneous symbols that do not appear on a keyboard the name of the symbol should be noted where the symbol is used to help eliminate prepress errors Parts per million or milligrams per liter can be
-1 reported as either ppm or mgI but not as mgI
Commonly used aquaculture jargon can be used without defining the term - eg fry fingerling hapa Less commonly used jargon may also be used but terms should be defined the first time they are used Jargon from fields outside of aquaculture should also be defined the first time they are used Always place a zero to the left of a decimal point if the number is less than one this includes probability values - eg P = 005 not P = 05
COMPONENTS OF THE MANUSCRIPTS Articles and notes should include a title names of authors and their addresses abstract introduction materials and methods results discussion (or a combined results and discussion) conclusion (rarely) acknowledgements (if any) references figures and tables in that order Each section should start on a new page
Title - The title should accurately reflect the contents of the paper Brief concise titles are encouraged The title page must include the name(s) of the author(s) and all addresses
Abstract - The abstract should be a concise highlight of the results and conclusions Methodology should not be abstracted unless it is necessary to explain the results or unless the paper describes a new technique Abstracts should be less than 300 words
Introduction - The introduction should explain why the paper was written and why it should be read The introduction should condense the relevant information in the field that led the author to do the research The introduction is not a complete literature review and only the most relevant references should be cited The introduction should also contain a statement that describes the purpose or objective of the paper
Materials and Methods - The underlying goal of this section is to describe what was done so that others can repeat the experiment If previously published papers described a technique that was used they can be cited to prevent unnecessary repetition If the technique or process was modified the modification must be described so that others can repeat the process Experimental designs can be explained by use of figures if they will help clarify what was done If the experiment was a complicated one with many subparts subsections may be used to describe each subpart
Results - This section describes the data Proper use of tables and figures can simplify and help explain the results Statistical analysis of data is necessary unless differences are so obvious that statistical analysis is superfluous Although probability values of 005 and 001 are traditionally used each author is free to choose his or her own level of significance
60 International Journal of Recirculating Aquaculture Volume 5 June 2004
Discussion - This section should interpret the results and compare the results from this experiment to those found in similar research The section can also be used to speculate about the results to provide reasons for the trends and to suggest new ideas that can advance our understanding about aquaculture This section should not be a literature review section that merely compares results among several papers
Results and Discussion - Results and discussion sections can be combined In most cases this leads to a better paper because the integration of these sections leads to a more meaningful interpretation of data
Conclusion - This section should be used only when the results of an experiment lead to an unequivocal interpretation
Acknowledgements - This section should be used to thank organizations that supported the research monetarily and individuals who assisted in the research or preparation of the paper This section includes manuscript number designations for those institutions that assign such numbers
References - Select references with great care Unless the paper includes a literature review there is no need to reference every paper written about a subject Use only the most important ones
Figures and Tables - All figures andtables go after the references Figures always go before tables
Section headings (eg Materials and Methods) should be capitalized and in bold type Secondary headings should be balded and go flush left Tertiary headings are incorporated into the first paragraph of that subsection Tertiary headings are italicized and separated from the text by a double dash
In the text references are cited in one of two ways 1 Swingle (1959) evaluated two species of tilapia or 2 pond culture in Alabama began in the 1950s (Swingle 1959) When there are three or more authors list only the first in a citation and follow that with et al eg Smitherman et al (1983) reviewed catfish breeding work at Auburn University If the name of an institutional author is long it can be abbreviated in a citation eg Food and Agriculture Organization of the United Nations may be abbreviated as FAO When several citations are used in a single entry they are listed chronologically If you are citing two papers that were written by the same author(s) the name only has to appear once per citation followed by the years that designate the different papers Separate the years with a comma If you are citing two authors you must separate the citations with a semicolon (Smith 1975 1976 Jones 1976)
In the reference section the reference list is strictly alphabetical by last name of the senior author and then by initials if two authors have identical last names If an author has written more than one paper the following format should be followed All single authored papers go first followed by co-authored papers and then the papers that were written by three or more authors If an author has written more than one single-authored paper the papers are listed chronologically If an author has written more than one co-authored paper they are listed alphabetically by the second authors last name If a tandem has authored two or more papers the order is chronological Papers written by the same group of three or more authors should be listed chronologically
International Journal of Recirculating Aquaculture Volume 5 June 2004 61
The following format will be used when referencing various works
PAPERS Single-author papers
McGinty AS Effects of Size at Stocking on Competition and Growth of All-Male Tilapia Hybrids Journal of the World Aquaculture Society 1985 16 52-56
Multiple-author papers Tave D Smitherman RO Predicted Response to Selection for Early Growth in Tilapia nilotica Transactions of the American Fisheries Society 1980 109 439-445
If an author has published two or more papers in the same year follow the years with a letter to differentiate them eg Smith 1988a 1988b Use issue numbers only when each issue starts out with page 1 If pagination is consecutive throughout the volume omit the issue number Spell out journal names in their entirely without abbreviations
Papers in proceedings or in edited volumes Nicholson LC Woods LC Ill Woiwode JG Intensive Culture Techniques for the Striped Bass and its Hybrids In Culture and Propagation of Striped Bass and Its Hybrids Harrell RM Kerby JH Minton RV Eds 1990 American Fisheries Society Bethesda MD USA
Books and reportspublications from governmental or non-governmental bodies
Lovell T 1989 Nutrition and Feeding of Fish Van Nostrand Reinhold New York NY USA
Food and Agriculture Organization of the United Nations (FAO) Fisheries Department 1997 Review of the State of World Aquaculture No 886 FIRlC886 FAO Rome Italy
Theses and Dissertations
Easter CC 1992 Water Chemistry Characterization and Performance of a Recirculating Aquaculture System Producing Hybrid Striped Bass Masters thesis Virginia Polytechnic Institute and State University Blacksburg VA USA
Websites
Federation of European Aquaculture Producers (FEAP) European Eel Production (httpwwwfeaporgeelshtml) 2002
Page numbers for proceedings books theses and dissertations are unnecessary Government publications should be treated as if they were books but document numbers must be included THE ACCURACY OF REFERENCES IS THE SOLE RESPONSIBILITY OF THE AUTHORS MAKE SURE THAT CITATIONS AND REFERENCES MATCH
Tables - When creating a table decide what the purpose of the table is and what points are important then organize the table so that the main features can be easily understood The table heading should provide sufficient information for the table to be understood as an entity Keep footnotes to a minimum Each table goes on a separate page Tables must be camera ready TABLES WILL BE PRINTED AS IS AND WILL NOT BE TYPESET Figures - List all figure captions on separate pages Original artwork doesnt have to be submitted when a paper is first submitted for review but original artwork must accompany the final revised manuscript Good quality photocopies are acceptable when a manuscript
62 International Journal of Recirculating Aquaculture Volume 5 June 2004
is submitted for review Graphs and original artwork must be printed with a laser printer or done in pen and ink Dot-matrix figures are not acceptable Original artwork or high-contrast photographs are acceptable Label all figures on the back with a soft pencil name of senior author paper title and figure number
Photographs - Should be on glossy paper with good contrast Do not glue pictures to cardboard Color photographs can be printed but the additional cost of printing them will be charged to the author Label all photos on the back with a soft pencil name of senior author paper title and figure number
FINAL REVISED MANUSCRIPTS If using the mail submit two copies of the final revised manuscript including original artwork Submit either the original pen-and-ink drawings or laser-printed versions of the drawings In addition submit the manuscript on a disk (CD preferable) or by e-mail On the disk write the brand name of the computer or word processor the word processing program that was used (should be Microsoft Word) the title of your article and the file name NOTE Disk and hard copy must agree In case of discrepancies it is the policy of IJRA to follow hard copy An electronic version of the completed manuscript is needed in order to publish AUTHORS MAY NOT RECEIVE PAGE PROOFS Proofreading will be done by the Production Office of IJRA using the revised final version of the manuscript Therefore authors must be especially careful that no errors exist in the final revised version because in most cases no changes are possible after it is submitted
REPRINTS The senior author will receive two copies of the journal and a pdf file of the article for distribution and reprinting purposes The junior author(s) will also receive two copies of the journal issue These are sent several weeks after the journal is published and in circulation Requests for the pdf format of the article can only be made by the corresponding author
COPYRIGHT amp PERMISSIONS For permission to reprint articles that have appeared in IJRA please contact IJRA Copyright amp Permissions Food Science amp Technology Building (0418) Virginia Tech Blacksburg VA 24061 USA
COPYRIGHT TRANSFER If your manuscript is accepted for publication copyright ownership must be officially transferred to IJRA The Editors acceptance letter will include a form fully explaining this The form must be signed by all authors and the original returned to the Editor at this time Failure to return the copyright form in a timely fashion will result in delay in publication
Send your submissions to International Journal of Recirculating Aquaculture
AI Correa Managing Editor 27-B Food Science and Technology Building (0418) Virginia Polytechnic Institute and State University Blacksburg VA 24061 USA
If you have any questions please feel free to contact us Phone (540) 231-2075 Fax (540) 231-9293 e-mail ijravtedu
International Journal of Recirculating Aquaculture Volume 5 June 2004 63
Flatbed Scanning for Examining Lipid Distribution in Fish
Flatbed scanning
Tl weighted MRI
H20sat Tl weighted
MRI
Original Image Mask Lipid Mask Meat Mask
Illustration of result
Figure] Illustration of the methods employed to examine lipid presence in flatbed scanned and MRI derived images of tilapia (see Methods text for more details)
analysis of the two types of MRI images (Fig 3) It also operated in the RGB spectrum but employed manually-separated reference images because both Tl weighted and water saturated Tl weighted MRI films were developed in gray scale Additionally since the resolving power of the MRI signal was affected by lipid concentration fat deposits in areas farther from the ventral region (belly) were less discrete and hence their analysis was more complex
The RGB spectrum Digital images consist of numerous dots termed pixels The number of pixels in a digital image is dependent upon image resolution which is commonly defined in dots per inch (dpi) Each pixel is assigned a binary value (0-1) according to tone eg black = 0 and white = I Digital images may be bitonal (black and white) grayscale or in color These image
International Journal of Recirculating Aquaculture Volume 5 June 2004
Flatbed Scanning for Examining Lipid Distribution in Fish
types differ in the number of bits used to define each pixel Whereas a bitonal pixel is defined by one bit grayscale pixels range between 2-8 bits and color pixels from 8-24 bits In a 24-bit color image bits are often separated into three 8-bit groups - viz red green or blue hues A combination of the bits defines additional colors MatLabreg works separately in all three hues with three bit values for each colorbit being defined In a color image therefore three values are employed one for each hue In contrast in grayscale different hues are discarded leaving only the intensity of the single color
Image appraisal MRI and flatbed (stained) images were examined for percent lipid presence in each cutlet An estimate of percent lipid for each fish was obtained using the following method cutlet surface area (A and a Fig 4) expressed in pixels and height (h set to 5 mm) was used for the determination of cutlet radius Cutlet volume was calculated using the formula for assessing the volume of a cone Estimated cutlet volume and total body lipid was calculated according to the following equations
Estimated cutlet volume (pixels)= 13 bull n x h bull (R2 +Rx r + r2 bull 100
Estimated body lipid()= Abull (VA IV T) + B bull (V 8 IV T) + + 1 bull (VI I v T)
Where percent lipid was A a 1 surface area was A B I VT was total cutlet volume in pixels and V A B I the estimated cutlet volume in pixels (A B I)
Flatbed images were appraised as follows (Fig 3) three masks were obtained using tools in Paint Shop Pro 60 (Jase Software Eden Prairie MN USA) Firstly the spinal column was identified and assigned the color black The remaining cutlet area was assigned the color white to provide a mask for analysis in MatLabreg which was then saved From
Figure 4 Illustration of the cone conversion method used to quantify cutlet lipid presence
International Journal of Recirculating Aquaculture Volume 5 June 2004
Flatbed Scanning for Examining Lipid Distribution in Fish
the original image areas that stained intensively red were assigned to white while the remainder were assigned to black thereby providing a lipid mask A meat mask was generated in a similar manner (Fig 3) The original image mask lipid mask and meat mask were identical in terms of size and location of the spinal column such that pixels referring to for example meat on the meat mask were similarly identified on the original image The four images were then analyzed in MatLabreg The lipid and meat masks provided mean and standard deviation of positively assigned pixels This enabled MatLabreg to analyze each pixel of the original image corresponding to the mask relative to the distance to mean and standard deviation in the RGB spectrum The following formula was applied within MatLabreg
d_meat=sqrt(((r(rrcc)-meat_red_m)meat_red_s)A2+((g(rrcc)-meat_ green_m)meat_green_s)A2 +((b(rrcc)-meat_blue_m)meat_blue_s)A2)
where d_meat was the overall distance calculated r(rrcc) the pixel value in the red spectra meat_red_m the mean value in the red spectra for pixels positively assigned to meat by the meat mask meat_red_s the standard deviation in the red spectra of the pixels positively assigned to meat by the meat mask etc A similar formula was used for calculating the distance according to the lipid mean and standard deviation for the same pixel Subsequently the pixel analyzed was assigned to either meat or lipid depending on which distance was the shortest MatLabreg provided details relating to lipidmeat and an illustration of the result
MRI images were analyzed as follows the Tl weighted MRI image was used to prepare a white mask covering the surface area of the cutlet but excluding the spinal column in Paint Shop Pro 60 This mask was used for analysis of both MRI image types Secondly for both MRI types lipid areas were assigned using tools in Paint Shop The lipid areas were assigned to white and the remainder to black and saved as a lipid mask Lipid or meat pixels were assigned manually Subsequently the original image mask and lipid mask were analyzed in MatLabreg which provided lipidmeat and an illustration of the result
Chemical analysis An additional eight animals were employed for the chemical quantification of lipid Individual fish were homogenized prior to lipid analysis using the method described by Bligh and Dyer (1957) All samples were analyzed in duplicate
International Journal of Recirculating Aquaculture Volume 5 June 2004
Flatbed Scanning for Examining Lipid Distribution in Fish
Statistical analyses Statistical analyses were performed using SPSS ver 100 (Data Description Inc Ithaca NY USA) The model applied for the 3 x 9 factorial design was as follows
Yijk = micro + Ai+ B ABij +eijk
where m was the true mean Ai the analysis method Bj the cutlet ABij the interaction of the fixed factors and finally eijk the residual effect Differences between treatment means were analyzed by three-way ANOVA and differences between treatments (Plt005) isolated using Tukeys test Estimated lipid percent of cutlet A-I of each animal was analyzed by one-way ANOVA (flatbed scanning Tl weighted and water saturated Tl weighted MRI)
RESULTS Table 2 summarizes percent lipid levels in individual cutlets as determined by image analysis of ORO stained cutlets and MRI (Tl weighted and water-saturated Tl) samples Animal gender had no effect upon lipid distribution in the sections examined regardless of method of analysis No differences (P gt 005) were discerned in cutlet lipid presence or in interactions between analytical technique and cutlet for any of the methods examined Fish exhibited a general anterior to posterior decrease in lipid presence with differences (P=0001) in the amount of lipid detected being distinguishable between cutlets (Table 2) The first three cutlets (A-C) of all fish expressed a higher (P lt 005) percentage of lipid than more posterior cuts (H and I) with cutlet I containing a lower (P lt 001) percent lipid than cutlets D-G Examination of sections D-H revealed equivalency in terms of percent lipid deposition (Table 2) A comparison of percent whole body lipid presence using imaging techniques and the Bligh and Dyer method did not reveal differences (gt005) between the methods (Table 3)
DISCUSSION Lipid distribution in fish varies with species muscle type and sampling point (Katikou et al 2002) and may be influenced by season feed type and feeding strategy (Jobling et al 1998 Johansen and Jobling 1998 Johansson et al 2000) Lipid presence in fish flesh is arguably the most important trait that influences total quality of the final product Lipids
10 International Journal of Recirculating Aquaculture Volume 5 June 2004
Flatbed Scanning for Examining Lipid Distribution in Fish
Table 2 Comparison of flatbed scanning and MRI techniques in determining lipid percentage per cutlet examined (see Fig 1) Statistical analysis for the 3 x 9 factorial design is indicated in the category columns No interaction between method and cutlet segment was demonstrated Separate one-way ANOVAfor differences in cutlets is noted in the respective column n = 8 per analysis P lt 005
Method
Cutlet no Flatbed analysisa T1 weighteda H20 saturated T1 a
A8 254plusmn1208 312plusmn1388 287plusmn1668
88 251plusmn141 8b 314plusmn2068 206plusmn1838
ca 190plusmn088abc 253plusmn181 8b 258plusmn2248
oab 144plusmn070abc 233plusmn1008b 278plusmn1978
Eab 151plusmn0778 bc 188plusmn104ab 213plusmn0568
pb 143plusmn059abc 242plusmn207ab 260plusmn1558
Gab 139plusmn105abc 190plusmn1268b 211plusmn1848
Hbc 103plusmn075bc 098plusmn117ab 100plusmn0988
1c 084plusmn048C 018plusmn025b 019plusmn0468
Table 3 Chemical analysis (n=6 Bligh and Dyer 1959) and estimates of lipid presence using flatbed Tl weighted and water saturated Tl MRI methods (n=8)
Bligh and Flatbed Water Method D~er anal~sis T1 weighted saturated T1 Lipid content I Estimated lipid 171plusmn0468 177plusmn0328 229plusmn1198 212plusmn0748
content
International Journal of Recirculating Aquaculture Volume 5 June 2004 11
Flatbed Scanning for Examining Lipid Distribution in Fish
impact the appearance flavor tenderness and juiciness of fresh and processed products (Rasmussen et al 2000 Johansson et al 2000 Lie 2001) Lipids are also the main component responsible for the accumulation of smoked and flavoringseasoning compounds that impart a final products flavor (Beltran et al 1991) The nutritional quality and quantity of lipid in fish flesh is of interest from a human health perspective since it has long been recognized that n-3 PUFA reduces the incidence of heart disease decreases risk of some cancers and may act to stimulate the immune system
Several studies have demonstrated the changes in fatty acid elasticity of fish flesh following dietary modifications (Viegas and Guzman 1998 Samuelsen et al 2001 Bell et al 2001) It is well established that lipid presence affects the technological quality of fish flesh from the processing perspective Lipids impact sliceability (McLean and Devlin 2000) fillet yield and trimming loss (Rasmussen et al 2000) as well as the salting and drying process during smoking (Cardinal et al 2001) and may play a role in fillet gaping (Lie 2001) Whole body lipid levels are also important in the bioaccumulation process (Stow et al 1997 Zhou et al 1999) and hence impact the safety of final products
A trend in the aquaculture feed industry has been to formulate diets that are high in lipid (gt 40) as a method to spare protein and reduce environmental impact (Cho and Bureau 2001) Potential negative aspects of such diets however are increased lipid accumulation and an overall decline in end product quality (Shearer 2001) A growing need exists to develop methods that enable safe and rapid assessment of lipid accumulation in the edible component of farmed fish Such methods could support research and development in the formulation of novel diets provide insights into lipid dynamics following application of various feeding strategies assist during selective breeding programs and provide a basis for on-farm product quality management
In pigmented species of fish such as the salmonids it is often possible to visually detect fat deposits within muscle tissues In contrast visual recognition of lipid deposits in white-fleshed animals remains problematic MRI provides the means to examine internal structures of animals non-destructively and permits separation of lipid from muscle tissues (Hornack 2002 Fig 3) In mammals including humans the kinetics and distribution of body fat (Kamel et al 2000 Fusch et al
12 International Journal of Recirculating Aquaculture Volume 5 June 2004
Flatbed Scanning for Examining Lipid Distribution in Fish
1999) has been examined by MRI Clearly similar studies with teleosts would provide great rewards with regards to understanding lipid dynamics over the life cycle and establishing the effects of different manipulations on depositional processes In the present study with tilapia MRI was able to distinguish lipid from muscle tissue in cutlets demonstrating a cranial-caudal decline in cutlet lipid presence which is in accord with chemical (Katikou et al 2001) and CT (Gjerde 1987 Rye 1991) analyses of salmonids Noteworthy in the present study was the lack of a difference in lipid presence or spatial distribution between genders
Irrespective of the resolving power of MRI and its companion medical imaging technologies however such equipment is sophisticated demanding and expensive In the practical sense medical imaging technologies are of limited value to aquaculture In contrast the simplicity of highlighting lipids using fat-soluble stains such as oil red 0 as used herein or alternatives such as Sudan red B Sudan black B and others however provides a rapid and inexpensive means of distinguishing and quantifying lipid deposits in edible flesh and viscera The described method can be adapted and applied to all species wherein muscle and lipid tissues are difficult to separate visually (eg in unpigmented fleshed animals) Preliminary studies with summer (Paralichthys dentatus) and southern (P lethostigma) flounders confirm the utility and general applicability of the method Furthermore use of stains such as Sudan black B would enable greater differentiation of lipid deposits even in pigmented species Differences nevertheless exist when employing lipid-soluble histochemical dyes for macro samples such as fish cutletssteaks fillets etc Specifically distinctions are met in incubation conditions which likely occur due to sample thickness When compared to MRI the flatbed scanning method provided identical results with respect to lipid distribution and percent cutlet lipid Moreover quantitative estimates of lipid presence using flatbed- and MRI-derived data duplicated lipid values calculated by traditional chemical methods Accordingly the histochemical staining-flatbed scanning technique provides a safe reproducible and economical method of isolating and monitoring whole body cutlet or fillet lipid presence The resolving power of this technique may be further enhanced using different or additional biological stains that are more specific The major drawback of the flatbed method when compared to MRI was the time required to prepare samples prior to computer-assisted analysis with individual fish requiring approximately 45 minutes In contrast with MRI multiple images of multiple specimens
International Journal of Recirculating Aquaculture Volume 5 June 2004 13
Flatbed Scanning for Examining Lipid Distribution in Fish
were acquired in a matter of minutes However the need to embed samples in gelatin to avoid artifacts in the MRI scan required overnight preparation demanding two person hours total Overall the time required for the preparation of the flatbed-scanned images was similar to that of traditional chemical analysis The analysis of both MRI and flatbed-scanned images (9 slices per fish) required approximately 4 hours per method However the results generated provided more detail than traditional chemical analysis The flatbed technique developed may prove useful in a wide range of basic and applied research
REFERENCES Alanen A Komu M Bondestam S Toikkanen S Determination of
Fat Content of Burbot (Lota Iota) Liver with Low Field MR Imaging (004 T) Physics in Medicine and Biology 1991 36 953-961
Bell JG McEvoy J Tocher DR McGhee F Campbell PJ Sargent JR Replacement of Fish Oil with Rapeseed Oil in Diets of Atlantic Salmon (Salmo salar) Affects Tissue Lipid Compositions and Hepatocyte Fatty Acid Metabolism Journal of Nutrition 2001 131 1535-1543
Beltran A Moral A The Effects of Fat Contents and Storage Temperature on the Storage Life of Smoked Sardine Fillets (Sardina pilchardus W) Prepared from Frozen Sardine Food Chemistry 1991 42 347-356
Bjerkeng B Refstie S Fjalestad KT Storebakken T R~dbotten M Roem AJ Quality Parameters of the Flesh of Atlantic Salmon (Salmo salar) as Affected by Dietary Fat Content and Full-Soybean Meal as a Partial Substitute for Fish Meal in the Diet Aquaculture 1997 157 297-309
Bligh EG Dyer WJ A Rapid Method of Total Lipid Extraction and Purification Canadian Journal of Biochemistry and Physiology 1959 37 910-917
Cardinal M Knockaert C Torrissen 0 Sigurgisladottir S M~rk~re T Thomassen M Vallet JL Relation of Smoking Parameters to the Yield Colour and Sensory Quality of Smoked Atlantic Salmon (Salmo salar) Food Research International 2001 34 537-550
14 International Journal of Recirculating Aquaculture Volume 5 June 2004
Flatbed Scanning for Examining Lipid Distribution in Fish
Cho CY Bureau D P A Review of Diet Formulation Strategies and Feeding Systems to Reduce Excretory and Feed Wastes in Aquaculture Aquaculture Research 2001 32 suppl 1 349-360
Einen 0 Waagan B Thomassen MS Starvation Prior to Slaughter in Atlantic Salmon (Salmo salar) I Effects on Weight Loss Body Shape Slaughter- and Fillet-Yield Proximate and Fatty Acid Composition Aquaculture 1998 166 85-104
Fusch C Slotboom J Fuehrer U Schumacher R Keisker A Zimmermann W Moessinger A Boesch C Blum J Neonatal Body Composition Dual-Energy X-Ray Absorptiometry Magnetic Resonance Imaging and Three-Dimensional Chemical Shift Imaging versus Chemical Analysis in Piglets Pediatric Research 1999 46 465-473
Gjerde B Predicting Carcass Composition of Rainbow Trout by Computerized Tomography Journal of Animal Breeding and Genetics 1987 104 121-136
Goddard JS McLean E Acid-Insoluble Ash as an Inert Reference Material for Digestibility Studies in Tilapia Oreochromis aureus Aquaculture 2001 194 93-98
Hornack JP The Basics of MRI httpwwwcisriteduhtbooksmri 2002
Howell N Shavila Y Grootveld M Williams S High-Resolution NMR and Magnetic Resonance Imaging (MRI) Studies on Fresh and Frozen Cod (Gadus morhua) and Haddock (Melanogrammus aeglefinus) Journal of the Science of Food and Agriculture 1996 72 49-56
Jobling M Johansen SJS Forshaug H Burkow LC JZ)rgensen EH Lipid Dynamics in Anadromous Arctic Charr Salvelinus alpinius (L) Seasonal Variations in Lipid Storage Depots and Lipid Class Composition Fish Physiology and Biochemistry 1998 18 225-240
Johansen SJS Jobling M The Influence of Feeding Regime on Growth and Slaughter Traits of Cage-Reared Atlantic Salmon Aquaculture International 1998 6 1-17
International Journal of Recirculating Aquaculture Volume 5 June 2004 15
Flatbed Scanning for Examining Lipid Distribution in Fish
Johansson L Eating Quality of Farmed Rainbow Trout ( Oncorhynchus mykiss) In Farmed Fish Quality Kestin S C and Warriss P D (Eds) 2001 Pages 76-88 Fishing News Books Osney Mead UK
Johansson L Kiessling A Kiessling K-H Berglund L Effects of Altered Ration Levels on Sensory Characteristics Lipid Content and Fatty Acid Composition of Rainbow Trout (Onchorhynchus mykiss) Food Quality and Preference 2000 11 247-254
Kamel EG McNeill G van Wijk MCW van Wijk MCW Change in Intra-Abdominal Adipose Tissue Volume during Weight Loss in Obese Men and Women Correlation between Magnetic Resonance Imaging and Anthropometric Measurements International Journal of Obesity 2000 24 607-613
Katikou P Highes SI Robb DHF Lipid Distribution within Atlantic Salmon (Salmo salar) Fillets Aquaculture 2001 202 89-99
Komu M Alanen A Magnetization Transfer in Fatty and Low-Fat Livers Physiological Measurement 1994 15 243-250
Lie 0 Flesh Quality - The Role of Nutrition Aquaculture Research 2001 32 suppl 1 341-348
Lillie RD Various Soluble Dyes as Fat Stains in the Supersaturated Isopropanol Technique Stain Technique 1994a 19 55-58
Lillie RD Study of Certain Oil Soluble Dyes for Use as Fat Stains Journal of Technical Methods 1994b 24 37-42
McLean E Devlin RH Application of Biotechnology to Enhance Growth of Salmonids and Other Fish In Recent Advances in Marine Biotechnology Fingerman M and Nagabhushnam R (Eds) 2000 Pages 17-55 Science Publishers Incorporated Enfield New Hampshire USA
Nott KP Evans SD and Hall LD Quantitative Magnetic Resonance Imaging of Fresh and Frozen-Thawed Trout Magnetic Resonance Imaging 1999a 17 445-455
Nott KP Evans SD and Hall LD The Effect of Freeze-Thawing on the Magnetic Resonance Imaging Parameters of Cod and Mackerel Lebensmittel Wissenschaft and Technologie 1999b 32 261-268
16 International Journal of Recirculating Aquaculture Volume 5 June 2004
Flatbed Scanning for Examining Lipid Distribution in Fish
Rasmussen RS Ostenfeld TH R~nsholdt B McLean E Manipulation of End-Product Quality in Rainbow Trout with Finishing Diets Aquaculture Nutrition 2000 6 17-23
R~nsholdt B Nielsen H Frergemand J McLean E Evaluation of Image Analysis as a Method for Examining Carcass Composition of Rainbow Trout Ribarstvo 2000 58 3-11
Rye M Predicition of Carcass Composition in Atlantic Salmon by Computerized Tomography Aquaculture 1991 99 35-48
Samuelsen T Isaksen M McLean E Influence of Dietary Recombinant Microbial Lipase on Performance Characteristics of Rainbow Trout Aquaculture 2001 194 161-171
Shearer KD The Effect of Diet Composition and Feeding Regime on the Proximate Composition of Farmed Fishes In Farmed Fish Quality Kestin SC and Warriss PD (Eds) 2001 Pages 31-41 Fishing News Books Osney Mead UK
Stow CA Jackson LJ Amrhein JF An Examination of the PCB Lipid Relationship among Individual Fish Canadian Journal of Fisheries and Aquatic Sciences 1997 54 1031-1038
Valdes EV Atkinson JL Hilton JW Leeson S Near Infrared Reflectance Analysis of Fat Protein and Gross Energy of Chicken and Rainbow Trout Carcasses Canadian Journal of Animal Science 1989 69 1087-1090
Viegas EMM Guzman EC Effect of Sources and Levels of Dietary Lipids on Growth Body Composition and Fatty Acids of the Tambaqui (Colossoma macropomum) World Aquaculture 1998 29
Zhou HY Cheung RYH Wong MH Bioaccumulation of Organochlorines in Freshwater Fish with Different Feeding Modes Cultured in Treated Wastewater Water Research 1999 33 2747-2756
International Journal of Recirculating Aquaculture Volume 5 June 2004 17
Skinless V-Notched Fillet Yields ofTilapia (Oreochromis)
SP Kirkup1 LS Marsh2 CW Coale Jr3
11774 Old Brook Rd Charlottesville VA 22901 USA
2Department of Biological Systems Engineering (0303) Virginia Polytechnic Institute and State University Blacksburg VA 24061 USA
3Department of Agricultural and Applied Economics (0401) Virginia Polytechnic Institute and State University Blacksburg VA 24061 USA
Corresponding authors e-mail marshesvtedu
Keywords tilapia Oreochromis fish fillet yield
International Journal of Recirculating Aquaculture 5 (2004) 19-27 All Rights Reserved copy Copyright 2004 by Virginia Tech and Virginia Sea Grant Blacksburg VA USA
International Journal of Recirculating Aquaculture Volume 5 June 2004 19
Fillet Yields of1ilapia (Oreochromis)
ABSTRACT White hybrid tilapia (Oreochromis) produced in an experiment that determined the effects of various management practices on growth rate and feed conversion ratios were weighed measured and filleted at the conclusion of the growth trials Regression analyses produced two models to predict fillet yields-one model that used the fish weight and length and a reduced model that used only fish weight While the full model produced a somewhat smaller error it was found to be impractical to use fish length to estimate fillet yield due to the difficulty in obtaining a length measurement The full model also produced unreasonable estimates when extended beyond the limits of the data set Using a paired t-test fillet yields of males and females of equal weights were tested and were not found to be significantly different This model provides a means of converting market price of tilapia fillets to a price for live fish once processing costs are considered
INTRODUCTION Marketed food commodities including fish undergo changes in product form before reaching the consumer The objective of changing the product form of a commodity is to add value to the product In the case of filleted fish products changing a whole fish to a filleted product enhances the value of the product but also significantly reduces its weight The producer is paid not for the live weight of the fish but for the final weight in commodity form Producers raising fish for the fillet market need a simple means of estimating fillet yield in order to make management decisions regarding what size of live fish to harvest
Market demand for various forms of tilapia has been created in large metropolitan areas of the United States and Canada by ethnic groups from regions including South and Central America Southeast Asia Africa China and the Philippines Although most of the tilapia consumed in the United States is imported as fresh or frozen fillets or frozen whole fish (Harvey 2000) certain ethnic groups prefer live fish for which they are willing to pay a significant premium High transportation and handling costs make importation of live tilapia into the United States prohibitively expensive and thus a domestic live tilapia industry has developed within the United States primarily using intensive recirculating aquaculture systems While the amount of tilapia produced domestically is rather small compared to that of catfish and trout according to the USDA
20 International Journal of Recirculating Aquaculture Volume 5 June 2004
Fillet Yields ofTilapia (Oreochromis)
(Harvey 2000) tilapia represents the second largest import of finfish into the United States on a live weight and value basis trailing only Atlantic salmon Hence there is ample evidence of a market for tilapia
Tilapia cannot survive in low ambient temperatures (Phipippart and Ruwet 1982) and therefore except for the southernmost regions they cannot be produced year-round in ponds in North America Production costs of tilapia raised in ponds have been estimated to range between $088 and $132kg (Fitzsimmons and Posadas 1997) compared to an estimated production cost of $279kg for recirculating aquaculture systems (Losordo and Westerman 1994) Because of the significantly higher cost of indoor temperature-controlled production domestic producers generally cannot compete economically with foreign pond-raised processed tilapia products which are relatively inexpensive to ship However they can compete for the live tilapia market due to the challenges and costs associated with transporting live fish
Many wholesalers require a minimum size for live tilapia producers report both 340 and 450 g (three-quarters and one pound) as minimum desired weights Producers are tempted to retain and grow out further fish that are too small to be marketed as live fish However research conducted at Virginia Tech indicates that as tilapia mature both the growth rate and feed-conversion efficiency decrease dramatically (Kirkup et al 2000) and that these decreases are primarily dependent on age rather than either size or culture conditions Therefore it might be more economical to fillet substandard fish rather than allowing these poor performers to grow to live-market size
Tilapia fillet yields are of interest to domestic producers for several reasons First fillet yield can be used to establish the value of live tilapia once the market price and processing handling and carcass disposal costs are known Secondly fillet yield and variation are of interest to food processors and restaurateurs who are interested in a specific size fillet or portion
In the spring and early summer of 1999 an experiment was conducted to investigate the effects of different temperature and feeding rates upon the growth and feed conversion efficiency of Rocky Mountain white tilapia As a result of the experiment there was large variation in size length and weight among the fish in the various treatments At the conclusion of the experiment the fish were weighed measured sexed filleted and the fillets were weighed
International Journal of Recirculating Aquaculture Volume 5 June 2004 21
Fillet Yields of Tilapia (Oreochromis)
MATERIALS AND METHODS The fish used for the experiment are commonly called Rocky Mountain White Tilapia although a best guess is that they are a white inter-specific species of the genus Oreochromis primarily 0 niloticus 0 aureus and 0 mossambicus This hybrid has been selectively bred at Blue Ridge Aquaculture Inc (Martinsville VA USA) for its color and growth rate The white hybrids are desirable in the live fish market because of their generally attractive external appearance This hybrid grows rapidly and has other physiological attributes that make it well suited to culture in high-density aquaculture systems Although predominantly white the fish ranged in color from a bright white to a bluish and golden white to a few that were colored a reddish brown As fry the fish were given methyltestosterone mixed with their feed to chemically sex reverse the females Prior to delivery to Virginia Tech the fish were graded twice at Blue Ridge Aquaculture Inc to obtain a relatively uniform size by removing the runts
The fish were raised in 6607 L (150 gallon) agricultural watering troughs (Rubbermaid Winchester VA USA) The experiment was a three (temperatures) by four (feeding levels) factorial design having two replicates The nominal culture temperatures were 26 29 and 32degC and the feeding levels for each temperature conducted four times a day were saturation feeding 87 73 and 60 of the daily saturation feed rate The average fish weight at the beginning of the experiment was approximately 53g and the growth experiment lasted 20 weeks At the conclusion of the experiment the fish were taken off feed for three days prior to harvesting The tanks were completely drained and the live fish from each tank were placed in an ice-filled chest The fish were kept on ice for several hours prior to being filleted to anesthetize them and increase rigor making them easier to fillet and reducing the amount of blood in the fillet Prior to processing the fish were weighed to the nearest gram using a digital scale and measured to the nearest millimeter using a measuring board Fish weighing 300g or more were then filleted smaller fish were dissected to determine sex but were not filleted A total of 407 fish were filleted As noted the fish used in this experiment were chemically sex reversed ie from female to male and thus during the filleting process only 10 were identified as females Of that 10 a disproportionate number of females did not reach the 300g minimum cut-off weight for filleting thus only 24 fish identified as females were filleted
22 International Journal of Recirculating Aquaculture Volume 5 June 2004
Fillet Yields ofTilapia (Oreochromis)
The filleting was conducted by two competent fish cutters with extensive experience in filleting tilapia for a small Midwestern tilapia producer The v-notched skinless filleting was primarily accomplished with electric carving knives One individual cut across the torso just behind the gill and then cut horizontally down along the backbone through the ribcage to the tail While still attached to the tail the side of the fish was then flipped over and another horizontal cut was made along the skin to separate the meat from the skin and scales The sex of the fish was then determined based upon the internal sex organs The procedure was repeated on the other side of the fish The other individual cut the ribcage out of the fillet with an electric knife and removed the pectoral fin with a v-shaped cut The combined weights of the fillets for each fish were determined to the nearest gram on a digital scale
RESULTS
Fillet Weight Model A mathematical model of the fillet weight (Wf) in grams was fitted using the linear regression procedure (SAS Cary NC USA) Considered in the model were polynomials of weight and length condition factor temperature and feeding rate sex and interaction terms of the primary factors Only fish weight (W) in grams and length (L) in millimeters were found to be significant at the 95 confidence level and the resulting model was Wr = 650 - 0403L + 0401 W with a coefficient of determination (r2) of 0913 The reduced model Wr = -167 + 0336W produced an r2 of 0906 The fillet weight versus fish weight data and the regression line are shown in Figure 1 It appears that weight is a
--middot Figure I Relationship between fish weight and total fillet weight
International Journal of Recirculating Aquaculture Volume 5 June 2004 23
Fillet Yields o1ilapia (Oreochromis)
very good predictor of fillet yield and that for a given weight shorter fatter fish produce a slightly higher yield Although losing some predictive power the reduced model is more appropriate for several reasons Fish length and weight are highly correlated and therefore most of the predictive capability of length can be accounted for in the weight measurement The large positive intercept and the large negative coefficient for length in the full model are intuitively illogical Beyond the limits of the data set the full model produces unreasonable predictions For example predicted fillet weight of fingerlings would exceed the entire weight of the fish On the other hand the coefficients of the reduced model are intuitively logical and produce reasonable estimates of the fillet weights even beyond the limits of the data collected For the reduced model the 95 confidence interval for they-intercept is -215 to -119 and the 95 confidence interval for the weight coefficient is 0326 to 0347 Considering the variation in yield introduced by the filleting process the linear correlation between fillet yield and weight is good
Effect of Sex on Fillet Yields As noted previously fillet yield is a function of size and on average the females were only 666 as heavy as their male counterparts for a given treatment The question to be answered is whether the fillet yields of males and females of similar weights are different Once this is known it can be determined whether unisex production should be priced differently than mixed-sex production As noted above gender was not a significant factor in the construction of the fillet model but a paired t-test is a stronger statistical test For each of the 24 filleted females a male was selected at random that had the same or nearly the same body weight A paired t-test was used to compare the fillet weights and fish lengths of equal-sized males and females At the p = 005 level the differences in fillet yields were not significant but the males were found to be significantly longer F tests were used to compare the variance of the fillet weights and the lengths At the p = 005 level no statistical difference could be detected in the variance of the fillet weights or lengths
24 International Journal of Recirculating Aquaculture Volume 5 June 2004
Fillet Yields ofTilapia (Oreochromis)
Table 1 Comparison of length weight fillet weight and yield of males and females of comparable weight
Length Fillet (mm) Weight (g) Weight (g) Yleld ()
Males Average 2670 3758 1087 029 (SD) 147 647 244 0024
Females Average 2618 3760 1103 029 (SD) 153 647 219 002
DISCUSSION Weight is a good predictor of fillet yield The full model regression formula that included both fish weight and fish length produced a model with slightly greater predictive power than the reduced model that used only fish weight and could thus be of interest from an academic perspective Its predictive power is only slightly better than that of the reduced model From a practical perspective weight is relatively easy to measure whereas length is not and thus for commercial applications the reduced model is a more valuable tool than the full model
The wholesale price per kilogram for tilapia is generally based upon fish weight-fish heavier than 600g bring a premium price those between approximately 350 and 600g an intermediate price and those less than 350g a lesser price (Fitzsimmons and Posadas 1997) The reduced model predicts yields of 288 and 308 for 350g and 600g fish respectively which would justify a price premium of approximately 7 based strictly upon the increase in yield but which does not include any reduction in processing costs The yields obtained from this experiment are lower than both the 33 yield figure cited as a rule of thumb by Fitzsimmons and Posadas (1997) and the average fillet yield of 335 from 0 niloticus averaging 2074g cited by Obanu and lkeme (1988) In contrast Clement and Lovell (1994) obtained only a 254 fillet yield from 0 niloticus that weighed an average of 585g Several factors could account for the discrepancies including tilapia species and the skill of the fish cutter However the largest source of variation is likely to be the methods and procedures used in filleting which unfortunately are generally not reported in the literature Variability introduced by fillet technique and skill of the cutter is not included in this model because only one set of cutters was used
International Journal of Recirculating Aquaculture Volume 5 June 2004 25
Fillet Yields of Tilapia (Oreochromis)
Fillet yield is important information for making management decisions in pricing fish products selecting species specifying feed rations and controlling production costs Muscle yield of fish species has a big impact on the profitability of the aquaculture firm and on the survival of a specific marketing channel The fish producer is the last claimant to the consumers market price for fish and fish products The more handlers there are operating in a marketing channel the smaller the margins for each handler Gross retail margins for fresh fish usually command between 30 and 50 of the total profit depending on the marketing season and the fish species Producers are accustomed to marketing whole fish while customers are used to purchasing fish fillets When the useable flesh is separated from the whole fish the result is the fillet and a by-product Typically these by-products of the fish filleting process do not have significant value and their production cost has already been factored into the fish value The higher the yield ratio of muscle to by-product and the higher the market price the greater the chance a producer has of receiving a higher return on the aquaculture product Documentation of fillet yields coupled with market price indicate the value of the fish products in a marketing channel The better the yield the better the survival of a species in the marketplace
ACKNOWLDEGEMENT This material is based upon work supported by the Cooperative State Research Education and Extension Service US Department of Agriculture under Project No VA135559
REFERENCES Clement S Lovell RT Comparison of Processing Yield and Nutrient
Composition of Cultured Nile Tilapia (Oreochromis niloticus) and Channel Catfish (Ictalurus punctatus) Aquaculture 1994 119 299-310
Fitzsimmons K Posadas BC Consumer Demand for Tilapia Products in the US and the Effects on Local Markets in Exporting Countries In Proceedings of the Fourth International Symposium on Tilapia in Aquaculture (Orlando FL USA) Fitsimmons K (Ed) 1997 NRAES-106 Natural Resource Agriculture and Engineering Service (NRAES) Ithaca NY USA
26 International Journal of Recirculating Aquaculture Volume 5 June 2004
Fillet Yields oTilapia (Oreochromis)
Harvey D 2000 Aquaculture Outlook Economic Research Service US Department of Agriculture (Pub LDP-AQS-12) Washington DC USA
Kirkup SP Marsh LS Libey GS Heath AG Coale CW Haugh CG Effects of Temperature and Feeding Rates upon Growth and Feed Conversion Ratios in Tilapia In Proceedings of the Third International Conference on Recirculating Aquaculture (Roanoke VA USA) Flick G J and Rakestraw T (Eds) 2000 Virginia Tech Blacksburg VA USA
Losordo TM Westerman PW An Analysis of Biological Economic and Engineering Factors Affecting the Cost of Fish Production in Recirculating Aquaculture Systems Journal of the World Aquaculture Society 1994 25193-203
Obanu ZA lkeme AI Processing Characteristics and Yield of Some Fishes of the River Niger in Nigeria In Proceedings of the FAQ Expert Consultation on Fish Technology in Africa (Abidjan Cote DIvoire) FAQ Fish Report 1988 Supplement No 400 pages 218-220
Phipippart J-Cl Ruwet J-Cl Ecology and Distribution of Tilapias In_ ICLARM Conference Proceedings 7 (Bellagio Italy 1980) Pullin RSV and Lowe-McConnell RH (Eds) 1982 International Center for Living Aquatic Resources Management (ICLARM Manila Philippines
HematPlogy and Blood Chemistry Reference Intervals for Yellow Perch (Percajlavescens) Raised in Recirculation Systems
TC Hrubec1 and SA Smith2
1Department of Biomedical Sciences E Via Virginia College of Osteopathic Medicine Blacksburg VA 24060 USA
2Department of Biomedical Sciences and Pathobiology (0442) Virginia-Maryland Regional College
of Veterinary Medicine Virginia Polytechnic Institute and State University Blacksburg VA 24061 USA
Corresponding author current address Department of Biomedical Sciences and Pathology (0442) Virginia-Maryland Regional College of
Veterinary Medicine Virginia Polytechnic Institute and State University Blacksburg VA 24061 USA E-mail thrubecvtedu
Keywords Yellow perch Perea hematology blood chemistry reference values plasma biochemistry
International Journal of Recirculating Aquaculture 5 (2004) 29-42 All Rights Reserved copy Copyright 2004 by Virginia Tech and Virginia Sea Grant Blacksburg VA USA
International Journal of Recirculating Aquaculture Volume 5 June 2004 29
Hematology and Blood Chemistry of Yellow Perch (Percaflavescens)
ABSTRACT Determination of hematology and blood plasma biochemistry values is routinely used to assess the health of wild and domestic animals Yellow perch (Percaflavescens) culture is a growing segment of the US aquaculture industry and tools are needed to monitor the health status of these fish This paper reports reference values for complete hematological and biochemistry profiles of normal healthy yellow perch raised in recirculation culture conditions The following hematologic values were determined packed cell volume plasma protein erythrocyte leukocyte lymphocyte neutrophil monocyte and thrombocyte numbers A description of leukocyte morphology is presented Additionally the following plasma biochemical values were determined total protein albumin globulin creatinine total bilirubin alkaline phosphatase aspartate aminotransferase sodium potassium chloride calcium phosphorus magnesium glucose and cholesterol Reference values for a specific population of fish need to be determined prior to utilizing diagnostic blood samples from individuals Developing diagnostic hematology for fishes can enhance yellow perch culture by providing a means for the early detection and identification of infectious disease and of sub-lethal conditions that may affect production performance
INTRODUCTION Yellow perch (Percaflavescens) are an important game fish throughout much of the Northeast and Midwestern United States and Canada Contamination of natural waters by pollutants and an increased consumer demand for fresh seafood has led to the aquaculture production of yellow perch The culture of yellow perch is a rapidly emerging segment of aquaculture in the United States (Schmitz 1999) and has great economic potential especially in recirculation aquaculture systems (Kelly 2000 Mallison 2000) As more producers cultivate yellow perch it will become increasingly important to accurately evaluate the health of these fish and to develop tools such as diagnostic hematology to monitor the health status of fish during their production cycle
Diagnostic evaluation of blood parameters has been used extensively for many mammalian avian and reptilian species The rapidly growing aquaculture industry will increasingly need to utilize information of this type in order to assess the health status of cultured fishes Unfortunately hematology use in aquaculture remains limited in part due to the lack of
30 International Journal of Recirculating Aquaculture Volume 5 June 2004
Hematology and Blood Chemistry of Yellow Perch (Percaflavescens)
reliable reference blood values for most fish species Accurate reference intervals have been developed for some species including hybrid striped bass and tilapia under different production settings (Hrubec et al 1996 1997ab 2000 2001 Hrubec and Smith 2000) and for trout (biochemistry only Wedemeyer and Nelson 1975) pacu (hematological only Tocidlowski et al 1997) and milkfish (Ram-Bhaskar and Srinivasa-Rao 1989)
Little is known about the blood response of yellow perch There are few studies that have previously measured blood values in yellow perch (Toneys and Coble 1980 Nelson et al 1988 Nelson and Mitchell 1992 van den Heuvel et al 2000) Only a few parameters such as hematocrit sodium and chloride were determined as most of these studies were toxicological in nature and evaluated changes in other body systems The objective of this study was to generate a complete comprehensive list of reference blood values for normal healthy yellow perch (Perea flavescens) raised to market size in a recirculation system for later use as a diagnostic tool This is the first paper to report full hematological and biochemical profiles for production yellow perch
MATERIALS AND METHODS
Juvenile yellow perch were stocked into production recirculation systems as fingerlings and reared through their production cycle indoors in 10219-L recirculation tanks with a rotating biological contactor filter and 10 freshwater exchange per day At the end of their production cycle when the fish were 17 months old approximately 250 fish were removed from the production system and placed in a smaller 2400-L circular tank with a slant tube clarifier and a trickle biofilter The smaller tank had a freshwater replacement rate of 15 per day The fish were placed in the smaller systems to allow for a more rapid and less stressful capture procedure The fish were acclimated to the new tanks for 3 weeks The photoperiod was approximately 14-h light and 10-h dark Fish were fed daily to satiation with a commercial pelleted diet (Rangen EXTR 400 40 protein 10 fat Rangen Inc Buhl ID USA) The following water quality parameters were determined daily temperature pH ammonia alkalinity hardness nitrite nitrate and dissolved oxygen Ranges for water quality over the duration of the study are shown in Table 1 and are representative of water quality observed daily in these tank systems
International Journal of Recirculating Aquaculture Volume 5 June 2004 31
Hematology and Blood Chemistry of Yellow Perch (Perea flavescens)
Table 1 Water quality parameters for yellow perch (Percaftavescens) reared in a recirculation culture system Values are means plusmn standard deviations for the parameters on the days that fish were bled for hematological and blood biochemical determinations and are representative of the daily water quality values in the system
Parameter For Hematology Fish For Chemistry Fish
Temperature (degC) 209 plusmn 001 207plusmn 11
pH 78plusmn01 79 plusmn 02
NH3 un-ionized (mgL) 0012 plusmn 0012 0011 plusmn 0005
N02-N (mgL) 0031 plusmn 0015 0043 plusmn 0043
N03-N (mgL) 60 plusmn 26 28 plusmn09
Alkalinity (mgL) 252 plusmn44 313 plusmn 48
Hardness (mgL) 399 plusmn 10 433 plusmn27
Dissolved Oxygen (mgL) 74plusmn05 74 plusmn03
Fish were netted rapidly and anesthetized in aerated tank water with buffered tricaine methanesulfonate (MS-222 Sigma Chemical Co St Louis MO USA) until they began to lose equilibrium approximately 20 seconds Individual fish were bled for either hematological determinations (23g needle 1-mL syringe) or for biochemical determinations (23g needle 3-mL syringe) in both cases blood was collected from the caudal vessels After blood samples were collected the fish were weighed measured and checked for external and internal pathologic lesions The sex of each fish was determined by internal observation of the gonads
Blood for hematological determinations was transferred to an ethylenediamine-tetraacetic acid (EDTA) treated pediatric blood tube and held on ice until analysis (lt 1 hour) Blood for biochemical determinations was collected into cold 3-mL heparinized blood tubes and centrifuged at 14000 x g immediately Plasma was collected and frozen at -10degC until analyzed The following analytes were determined in the plasma with an Olympus AU-400 (Olympus America Inc Melleville NY USA) automated clinical chemistry analyzer total protein albumin creatinine total bilirubin alkaline phosphatase (ALP) aspartate aminotransferase (AST) cholesterol glucose sodium potassium chloride phosphorus calcium and magnesium Globulin was calculated from the total protein value minus the albumin value
32 International Journal of Recirculating Aquaculture Volume 5 June 2004
Hematology and Blood Chemistry of Yellow Perch (Percaflavescens)
Hematological analytes were determined from the EDTA anticoagulated blood As we have observed for other fish species EDTA was superior to heparin for yellow perch blood both in preventing clot formation and preserving cellular morphology (Hrubec et al 1996 2000) Blood from the EDTA tube was drawn into microhematocrit tubes and the packed cell volume (PCV) determined after centrifugation at 10000 x g for 5 min Plasma protein was determined with a clinical refractometer using plasma from the microhematocrit tube The total erythrocyte and leukocyte-plus-thrombocyte counts were determined manually with a Neubauer hemacytometer using Natt-Herricks solution as a diluent stain (Natt and Herrick 1952) Blood smears made within 45 minutes of sample collection were stained with Wright-Geimsa stain and were used to determine the differential counts as follows Leukocytes and thrombocytes were identified and counted on the blood smears until 200 leukocytes and a variable number of thrombocytes were enumerated The percentages of each leukocyte type and of thrombocytes were multiplied by the total leukocyte-plus-thrombocyte number to give the final cell counts Thrombocyte numbers were subtracted from the leukocyte-plus-thrombocyte count to give the total leukocyte count This method of manually determining total leukocyte and differential counts has been recommended for use with avian (Zinkl 1986) and fish blood (Hrubec et al 1996 1997ab 2000 2001) as the nucleated red cells prevent accurate enumeration using automated analysis (Huffman and Arkoosh 1997) Slight thrombocyte clumping was observed on the hemacytometer for some individuals only fish with minimal thrombocyte clumping(lt 4 cells clumped) were used for the differential counts to ensure accuracy of the counts
Reference intervals were determined following the guidelines proposed by the National Committee for Clinical Laboratory Standards (NCCLS 1992) As suggested in these guidelines the data were checked for outliers using the 13 differencerange ratio and no outliers were identified The values were then ranked and the high and low 25 were discarded The range of the remaining values provided the reference interval
RESULTS AND DISCUSSION The physiologic and health status of an individual is reflected in the blood producing variations in hematological and blood biochemical values Clinical analysis of blood is a fundamental tool used in human
International Journal of Recirculating Aquaculture Volume 5 June 2004 3 3
Hematology and Blood Chemistry of Yellow Perch (Percaflavescens)
and veterinary medicine to diagnose and predict the outcome of disease and to monitor the effect of therapeutic nutritional and environmental management Blood analysis is not used extensively as a diagnostic tool in fish medicine partly due to the lack of reference intervals for various fish species and also because changes associated with specific diseases and metabolic disorders are not well characterized With sufficient background data clinical analysis of individual blood samples could detect infectious diseases metabolic disorders and sub-lethal disease states affecting production performance
Hematological and plasma biochemistry data from diseased individuals can be evaluated by direct comparison to a reference interval which is the appropriate range of variation in a blood parameter from a defined population of individuals under specific conditions The reference interval needs to be determined on a sufficient number of normal healthy individuals under similar production conditions using standardized analytical techniques (NCCLS 1992) When the deviation in a blood parameter is large enough to fall outside the reference interval it indicates the value may be aberrant and is most likely not due to individual variation for a given fish
Few previous studies have determined blood parameters for yellow perch (Toneys and Coble 1980 Nelson et al 1988 Nelson and Mitchell 1992 van den Heuvel et al 2000) These studies are of limited relevance as they were primarily toxicological studies and only a few blood parameters were determined and also because blood samples were collected and handled by differing methods prior to determination of the blood value Some of the capture (hook and line and gill netting) and blood collection methods (severing the caudal peduncle) used in these studies are also unsuitable for diagnostic blood samples as they result in significant alteration in the blood which will mask diseased states The study with the closest sampling procedure to that used in our experiment only presented selected blood chemistry values for yellow perch after 16 hours of moderate or exhaustive exercise (Nelson and Mitchell 1992) Therefore although the previous studies on yellow perch hematology are helpful in determining the effects of environmental factors and stress they have limited diagnostic utility and even prevent meaningful comparison with the data presented in this paper
The average mean weight of the yellow perch used for the hematological determinations was 125 +- 14g with a total length of 223 +- 08 cm For
34 International Journal of Recirculating Aquaculture Volume 5 June 2004
Hematology and Blood Chemistry of Yellow Perch (Percajlavescens)
the biochemical determinations the fish had a weight of 121 +- 15g and length of 226 +- 08 cm The results of the hematological determinations from 52 fish are listed in Table 2 Values for plasma chemistry reference intervals determined on 42 samples are listed in Table 3 Overall both the hematological and plasma chemistry values were similar to those reported previously for hybrid striped bass and tilapia reared in recirculation systems (Hrubec et al 1996 2000 Hrubec and Smith 2000) The striped bass and tilapia from production systems exhibited wider ranges in value for the different leukocyte types increased numbers of reticulocytes increased plasma and total protein values increased creatinine values and a decreased plasma chloride concentration as compared to fish in lower density recirculation tanks We did not compare blood values from the production yellow perch in this study to yellow perch maintained in low-density tank settings so were unable to determine if these same trends are apparent in yellow perch as well However based on our previous experience with fish hematological and plasma biochemical values there is an indication that these trends are occurring in yellow perch as well
Table 2 Hematological reference intervals for adult yellow perch (Perea flavescens) reared in a recirculation system
Analyte N Reference Interval Mean Stds1
PCV2 () 57 29-47 388 45
Plasma Protein (gdl) 57 60-82 67 06
Erythrocytes (x 106ml) 53 2160-3345 2737 0356
Leukocytes (ml) 53 52590-186490 113914 39086
Lymphocytes (ml)
Small 53 36800-153420 85630 31728
Large 53 3530-23 130 11602 5359
Neutrophils (ml) 53 1860-35950 12430 8837
Monocytes (ml) 53 670-12640 4252 2874
Thrombocytes (ml) 53 38270-118510 72972 21299 1Standard deviation 2Packed cell volume
International Journal of Recirculating Aquaculture Volume 5 June 2004 35
Hematology and Blood Chemistry of Yellow Perch (Perea flavescens)
Table 3 Plasma biochemical values for adult yellow perch (Percaftavescens) reared in a recirculation system
Analyte N Reference Interval Mean Stds1
Total Protein (gdl) 42 37-50 45 04
Albumin (gdl) 42 06-09 07 01
Globulin (gdl) 42 31-42 37 03
Creatinine (mgdi) 42 04-10 06 01
Total bilirubin (mgdi) 42 03-04 03 01
ALP2 (UI) 42 50-114 822 249
AST3 (UI) 42 2-29 85 64
Glucose (mgdi) 42 62-181 1000 350
Cholesterol (mgdi) 42 182-323 2440 330
Sodium (mEqI) 42 138-153 1470 40
Potassium (mEqI) 42 20-38 32 05
Chloride (mEqI) 42 119-133 1260 40
Calcium (mEqI) 42 86-120 103 13
Phosphorus (mEqI) 42 50-96 74 11
Magnesium (mEqI) 42 17-34 27 04 1 Standard deviation 2 Alkaline phosphatase 3 Aspartate aminotransferase (SGOT)
The blood cells present in the yellow perch were typical of teleost fish and included erythrocytes thrombocytes and leukocytes (Fig 1) Erythrocytes were oval to round with characteristic red cytoplasm and an elongate and centrally-located nucleus Immature erythrocytes or reticulocytes demonstrated a blue-purple tinge to the normal eosinophilic cytoplasm (Fig IA B C) The yellow perch had increased numbers of reticulocytes (included in the erythrocyte count) with approximately 7 to 10 per field at lOOx oil immersion compared to what we observe for most fish species The cause for the apparent reticulocytosis is not known but has been observed in other fish species exposed to elevated nitrite and nitrate (Grabda et al 1974 Hrubec et al 1996 2000 Hrubec and Smith 2000)
36 International Journal of Recirculating Aquaculture Volume 5 June 2004
Hematology and Blood Chemistry of Yellow Perch (Perea flavescens)
T bull middotmiddot ~~ - middot
N -
Figure I Characteristic blood cells from yellow perch reared in recirculation systems Blood smears were made with EDTA anticoagulated blood stained with Wrights Geimsa stain Cells are abbreviated as follows U - Large lymphocyte SL - small lymphocyte T - thrombocyte R - reticulocytes (immature erythrocyte) PC - plasma cell (activated lymphocyte) M- monocyte N-neutrophil The blue bar in frame A is Omm
International Journal of Recirculating Aquaculture Volume 5 June 2004 37
Hematology and Blood Chemistry of Yellow Perch (Percajlavescens)
The thrombocytes were slightly smaller than the erythrocytes (Fig IA) They had clear cytoplasm and were variable in shape being elongated pyriform oval or round Nuclear shape tended to follow cytoplasmic shape although oval and round thrombocyte nuclei occasionally were lobulated (Fig IB) as described for striped bass and tilapia (Hrubec et al 1996 2000)
Leukocytes made up the remainder of the cell types seen in the blood and included small and large lymphocytes neutrophils and monocytes No eosinophils or heterophils were observed Small lymphocytes were the smallest cell present with a rim of blue cytoplasm surrounding the round nucleus (Fig IA E F) Large lymphocytes had an abundant and darker blue cytoplasm and the nucleus was larger than observed in the small lymphocyte (Fig IA E) Plasma cells were occasionally observed with a classic open nucleus abundant dark blue cytoplasm and a clear cytoplasmic region adjacent to the nucleus presumably representing the Golgi as in mammalian plasma cells (Fig IC) Plasma cells were included in the large lymphocytes category for the differential counts
Neutrophils were the largest cell present in the blood (Fig ID E F) The cytoplasm of the neutrophil was a translucent grey containing no granules and infrequent vacuoles Cytoplasmic shape was round to angular as the cellular borders often appeared slightly adherent to adjacent erythrocytes distorting cellular shape Nuclear shape of the neutrophil varied from round to horseshoe shaped and frequently segmented into two prominent lobes connected by a thin nuclear bridge (Fig IF) Monocytes had abundant dark blue cytoplasm that was frequently vacuolated (Fig ID) The round to kidney-bean shaped monocyte nucleus was large with prominent chromatin clumping
Analysis of blood parameters can provide a wealth of information useful in analyzing the effects of disease and sub-optimal environmental conditions Providing reference intervals for healthy adult yellow perch reared in recirculation systems furnishes veterinarians and fish health professionals the foundation to develop diagnostic hematology for this species The number of studies that determine actual reference intervals for fish species is limited The majority of blood values determined for fishes are reported in the literature as a mean value with a standard deviation Historically reference intervals were determined as two standard deviations from the mean however this method is only valid when blood values follow a normal distribution It is incorrect to assume
38 International Journal of Recirculating Aquaculture Volume 5 June 2004
Hematology and Blood Chemistry of Yellow Perch (Percaflavescens)
that biological parameters are distributed normally therefore non-parametric methods should be used to accurately determine reference intervals (Reed et al 1971) Techniques to properly determine reference intervals have been established by the NCCLS (1992) and suggestions for their use and interpretation have been discussed (Lumsden 1998) As with mammalian species reference intervals need to be determined for different populations of fish within a single species as culture conditions and environmental variables affect blood values to the extent that they are outside the reference interval (Ram-Bhaskar and Srinivasa-Rao 1989 Hrubec et al 1996 1997ab 2000 2001) Although the reference range for some of the blood parameters appears large it is still possible to detect variation in hematologic values associated with pathological conditions (Hrubec et al 1997b and unpublished data)
Developing reference intervals is a necessary first step in determining which specific hematological changes can be associated with disease conditions As the field of fish hematology develops its usefulness to the aquaculture industry will increase Information derived by standardized non-lethal diagnostic assays will be needed to enhance the culture of yellow perch and other fish species Analysis of diagnostic blood samples can provide a means for early detection of infectious disease and assist in the identification of sub-lethal conditions affecting production performance This should allow for more specific timely and effective disease treatments in the future
ACKNOWLEDGEMENTS The authors wish to thank Mark Kidd of the Virginia Tech Aquaculture Center for his assistance with fish care and sampling
REFERENCES Grabda E Einszporn-Orecka T Felinska C Zbanyszek R
Experimental Methemoglobinemia in Rainbow Trout Acta Ichthyologica et Piscatoria 1974 4 43-71
Hrubec TC Smith SA Robertson JL Feldman B Veit HP Libey G Tinker MK Comparison of Hematologic Reference Intervals between Culture System and Type of Hybrid Striped Bass American Journal of Veterinary Research 1996 57 618-623
International Journal of Recirculating Aquaculture Volume 5 June 2004 3 9
Hematology and Blood Chemistry of Yellow Perch (Percajiavescens)
Hrubec TC Robertson JL Smith SA Effects of Temperature on Hematologic and Serum Biochemical Profiles of Hybrid Striped Bass (Morone chrysops x Morone saxatilis) American Journal of Veterinary Research 1997a 58 126-130
Hrubec TC Robertson JL Smith SA Effects of Ammonia and Nitrate Concentration on Hematologic and Serum Biochemical Profiles of Hybrid Striped Bass (Morone chrysops x Morone saxatilis) American Journal of Veterinary Research 1997b 58 131-135
Hrubec TC Smith SA Hematology and Plasma Chemistry Values for Production Tilapia ( Oreochromis hybrid) Raised in a Recirculation System International Journal of Recirculating Aquaculture 2000 J 5-14
Hrubec TC Cardinale JL Smith SA Hematology and Plasma Chemistry Reference Intervals for Cultured Tilapia ( Oreochromis hybrid) Veterinary Clinical Pathology 2000 29 7-12
Hrubec TC Smith SA Robertson JL Age Related Differences in Hematologic and Plasma Chemistry Analytes of Hybrid Striped Bass Morone chrysops x Morone saxatilis Veterinary Clinical Pathology 2001 30 8-15
Huffman PA Arkoosh MR Characteristics of Peripheral Blood Cells from Rainbow Trout Evaluated by Particle Counter Image Analysis and Hemocytometric Techniques Journal of Aquatic Animal Health 1997 9 239-248
Kelly AM Yellow Perch Culture in the United States Manna or Mania World Aquaculture 2000 31 4-17
Lumsden JH Normal or reference values Questions and Comments Veterinary Clinical Pathology 1998 27 102-106
Mallison JA 2000 A White Paper on the Status and Needs of Yellow Perch Aquaculture in the North Central Region North Central Regional Aquaculture Center Michigan State University E Lansing MI USA
Natt MP Herrick CA A New Blood Diluent for Counting Erythrocytes and Leukocytes of the Chicken Poultry Science 1952 31 735-738
40 International Journal of Recirculating Aquaculture Volume 5 June 2004
Hematology and Blood Chemistry of Yellow Perch (Percaflavescens)
NCCLS National Committee for Clinical Laboratory Standards 1992 How to Define Determine and Utilize Reference Intervals in the Clinical Laboratory Proposed Guidelines NCCLS Document C28-P Villanova PA USA
Nelson JA Mitchell GS Blood Chemistry Response to Acid in Yellow Perch (Perea flavescens) Comparison of Populations from Naturally Acidic and Neutral Environments Physiological Zoology 1992 65 493-514
Nelson JA Magnuson J J Chulkasem W Blood Oxygen Capacity Differences in Yellow Perch (Percaflavescens) from Northern Wisconsin Lakes Differing in pH Canadian Journal of Fisheries and Aquatic Sciences 1988 45 1699-1704
Ram-Bhaskar B Srinivasa-Rao K Influence of Environmental Variables on Hematology and Compendium of Normal Hematological Ranges of Milkfish Chanos chanos (Forskal) in Brackish Culture Aquaculture 1989 83 123-136
Reed AH Henry RJ Mason WB Influence of Statistical Method Used on the Resulting Estimate of Normal Range Clinical Chemistry 1971 17 275-284
Schmitz M 1999 Comparative Growth of All-Female Versus Mixed Sex Yellow Perch (Percaflavescens) in Recirculating Aquaculture Systems MS Thesis Virginia Tech Blacksburg VA USA
Toneys ML Coble DW Mortality Hematocrit Osmolality Electrolyte Regulation and Fat Depletion of Young-of-the-Year Freshwater Fishes under Simulated Winter Conditions Canadian Journal of Fisheries and Aquatic Science 1980 37 225-232
van den Heuvel MR Power M Richards J MacKinnon M Dixon DG Disease and Gill Lesions in Yellow Perch (Percaflavescens) Exposed to Oil Sands Mining-Associated Waters Ecotoxicology and Environmental Safety 2000 46 334-341
Wedemeyer GA Nelson NC Statistical Methods for Estimating Normal Blood Chemistry Ranges and Variance in Rainbow Trout (Salmo gairdneri) Shasta Strain Journal of the Fisheries Research Board of Canada 1975 32 551-554
International Journal of Recirculating Aquaculture Volume 5 June 2004 41
Hematology and Blood Chemistry of Yellow Perch (Percajlavescens)
Zinkl JG Avian Hematology In Schalms Veterinary Hematology (4th edition) Jain NC (Ed) 1986 Pages 256-260 Lippincott Williams amp Wilkins Philadelphia PA USA
42 International Journal of Recirculating Aquaculture Volume 5 June 2004
Hatchery and Grow-out Performance of Sunshine Bass and Backcross Hybrid Striped Bass in Recirculating Aquaculture Systems
SR Lindell1bull2 B Delbos1 R Perham1 J Goldman1 EM Hallerman3 TO Brenden3bull4
1 Fins Technology 15 Industrial Road Turners Falls MA 01376 USA
2Current address Marine Biological Laboratory Marine Resources Center 7 MBL Street Woods Hole MA 02543 USA
3Department of Fisheries and Wildlife Sciences (0321) Virginia Polytechnic Institute and State University Blacksburg VA 24061 USA
4Current address Institute of Fisheries Research University of Michigan 1109 N University Avenue Ann Arbor MI 41809 USA
Corresponding authors e-mail ehallermvtedu
Keywords striped bass performance aquaculture growth
International Journal of Recirculating Aquaculture 5 (2004) 43-54 All Rights Reserved copyCopyright 2004 by Virginia Tech and Virginia Sea Grant Blacksburg VA USA
International Journal of Recirculating Aquaculture Volume 5 June 2004 43
Performance of Sunshine Bass and Backcross Hybrid Striped Bass
ABSTRACT Previous research has suggested that backcross hybrid striped bass (BX sunshine bass female x striped bass male) perform as well as F 1 hybrid striped bass (sunshine bass white bass female x striped bass male) for many economically important traits We conducted trials to compare rearing and growth traits of selected backcross hybrid striped bass with hybrid striped bass (HSB) We spawned and reared larval BX fry in two hatchery cycles measured fry growth and performance and compared them to past performance of HSB fry We conducted a grow-out trial of commercially-available hybrid striped bass versus backcross hybrid striped bass in replicated tanks to phase II fingerling size (approximately lOOg) Compared to HSB in the hatchery phase backcross hybrid striped bass exhibited lower fertilization rate comparable swimbladder inflation rate shorter time-to-weaning lower survival comparable growth and comparable condition factor After 60 days HSB exhibited significantly better growth survival and feed conversion efficiency than BX However BX may have better potential market acceptance by virtue of having a lower condition factor appearing longer and less deep-bodied than HSB
INTRODUCTION Striped bass (Morone saxatilis) and its hybrids constitute a major sector of aquaculture in the United States with production of 105 million pounds in 2002 (Carlberg and Van Olst 2003) Commercially significant quantities of Morone stocks also are produced in Taiwan China and Israel Approximately 43 of Morone production occurs in tanks (Carlberg and Van Olst 2003) much of that in recirculating aquaculture systems (RAS) Private and government marketing experts estimate that US production could increase to 50 million pounds and $100 million in annual farm-gate revenue if market prices could be decreased only moderately (Halbrendt et al 1991) Production costs for HSB could be reduced by 12 if selective breeding can yield 20 faster growth rates (Losordo and Westerman 1994)
The majority of Marone production is not of striped bass but of its hybrids with white bass (M chrysops) because of their hardiness rapid growth rate and limited availability of female striped bass broodstock (reviewed by Harrell 1997) Further female WB are considered easier and more predictable to strip-spawn Hence most commercial production
44 International Journal of Recirculating Aquaculture Volume 5 June 2004
Performance of Sunshine Bass and Backcross Hybrid Striped Bass
is of sunshine bass the progeny of the white bass female x striped bass male interspecific cross Research has also been undertaken to evaluate the performance of second generation hybrids and backcrosses Several studies have suggested that the progeny of F 1 hybrid striped bass females backcrossed to striped bass males have merit for commercial production Jenkins et al (1998) compared the performance of backcross hybrids to F1 hybrid striped bass and striped bass to market size in a recirculating system At harvest no differences in growth rate or feed conversion were detected specific growth of BX was intermediate to those of the other stocks with survival lower Tomasso et al (1999) compared performance of F 1 and backcross hybrids between 20 and 90 grams for 56 days in tanks (Tomasso et al 1999) and observed similar survival growth and feed conversion rates among the hybrid types Detailed comparison of the hatchery performance of sunshine and BX hybrids is lacking We hypothesized that use of selected hybrid striped bass and striped bass for the backcross might yield a high-performance BX hybrid Should high performance be realized progressive fish farmers might utilize this approach by selecting the best F1 hybrid females from their own production stocks making the backcross by strip-spawning them and fertilizing the eggs with purchased milt from selectively bred striped bass males (Kerby 1983) thereby obtaining a high-performance production stock that because of selection on the maternal stock is suited to their particular farm conditions
In this study we evaluated the production potential of backcross (BX) hybrid striped bass (female sunshine bass x male striped bass) We compared the hatchery and grow-out performance of BX spawned from select broodstock and sunshine bass (HSB) of common genetic background Specifically we evaluated spawning success hatch rate growth survival and feed conversion efficiency through the first six months of life In order to benchmark our results we ran a trial in replicated tanks with HSB supplied by the most widely-used commercial source of fingerlings (Keo Fish Farms Keo AR USA) and compared their performance with our BX All fish were cultured within intensive controlled-environment recirculating aquaculture systems
International Journal of Recirculating Aquaculture Volume 5 June 2004 45
Performance of Sunshine Bass and Backcross Hybrid Striped Bass
MATERIALS AND METHODS In July 2001 we crossed 4 hybrid striped bass females to each of 4 striped bass males to produce 16 families of backcross hybrid striped bass Poor fertilization rates resulted in a low yield of fry from this spawn However there were enough fry to pool and conduct a pilot commercial-scale hatchery run Randomly-chosen samples from the resulting 4000 fingerlings were used for the grow-out trial
In October 2001 we spawned 3 female HSB with 2 male SB and eventually produced 7000 fingerlings While this was not enough to grow in commercial-scale systems we collected hatchery performance data to corroborate our JulyAugust experience with BX
Fertilized eggs were incubated in McDonald jars Upon hatch the larvae swam out of the hatching jar and into a 1900-L larval rearing tank Replicate larval rearing tanks were stocked with approximately 25 larvae per liter Tanks were maintained with recirculating water and surface oil-skimming pads for the first 5 to 7 days post-hatch until swim-bladder inflation was completed For the second week post-hatch larval rearing tanks were maintained static with gentle central aeration except for an exchange of about 30 of the tank water over the course of two hours each day During the second week post-hatch larvae were fed rotifers enriched with Algamac (Aquafauna BioMarine Inc Hawthorne CA USA) maintained at a density of 10ml By the end of the second week larvae were weaned from rotifers to Artemia nauplii By the end of the third week the larvae were typically weaned from enriched Artemia to artificial feed (Biokyowa Inc Girardeau MO USA) Weaned larvae were graded just once around 60 days post-hatch to remove the top 1 to 2 of larger fish responsible for cannibalism
In November 2001 we purchased lOg fingerlings that represent typical industry-standard HSB from Keo Fish Farms (Keo AR USA) These HSB closely matched the size and weight of our BX from the July spawn for the grow-out trial BX and HSB fingerlings were each stocked separately in triplicate 1900-L round tanks connected to the same recirculating system and reared at 23degC and a salinity of 1-3 ppt All six tanks were similarly stocked initially (approximately 1 kgm3) Fish were offered 80 of their expected ration via belt-feeders and hand-fed to satiation twice a day Approximately every 3 weeks length and weight samples were taken from a randomly-chosen 15 of each tanks
46 International Journal of Recirculating Aquaculture Volume 5 June 2004
Performance of Sunshine Bass and Backcross Hybrid Striped Bass
population At the conclusion of the project the tanks reached typical commercial densities of 5 to 9 kgm3bull
We quantified reproductive and hatchery performance of the three groups including fertilization rate swimbladder inflation rate days to weaning onto artificial feed (ie date of first ingestion to date that gt90 ingested artificial feed) survival estimates to approximately 60 days after hatch and to the end of the study feed conversion rate and monthly average weight and length The trial continued until mid-February 2002 when the HSB averaged approximately lOOg Results from previous years hatchery efforts with HSB using similar rearing protocols were used for comparative purposes
Both the hatchery and grow-out systems employed water recirculation technology including drum-filters fluidized-bed biofilters oxygenation ozonation and automated pH and temperature control that maintained high water-quality standards throughout the trials
Differences in fish weight between the hybrid types were analyzed as a repeated-measures general linear mixed model Residual (restricted) maximum likelihood was used to estimate the model parameters Initial fish biomass in each of the tanks and the amount of feed provided to each of the tanks were included in the model as covariates to assess the influence of these concomitant variables on differences in weight A first-order autoregressive covariance structure was assumed for the repeated-measurements of fish weight
Differences in fish survival at the end of the grow-out trial were analyzed as a general linear model with tanks serving as a blocking factor Because fish survivalmortality is a binary response and thus will violate an assumption of normality the significance of the test comparing survival between the hybrid types was obtained by randomization (number of randomizations= 1000) whereby the F-statistic of the original test was compared to F-statistics obtained by randomly allocating the survival mortality data to the different hybrid types The Type-I error rate for all statistical tests was set equal to 005
International Journal of Recirculating Aquaculture Volume 5 June 2004 47
Performance of Sunshine Bass and Backcross Hybrid Striped Bass
Table 1 Comparison of hatchery traits of backcross (BX) and Fl hybrid (HSB) striped bass for traits of economic interest
Traits of interest BX-HSB BX-HSB HSB HSB HSB
Female parent strain1 AR ARMD AR AR AR
Male parent strain1 MD FL MD FL MD MD FL MD Canada
Spawn date Oct-01 Jul-01 Mar-01 Oct-00 Jan-99
Fertilization 32 22 53 57
Swimbladder inflation 90 50 98 95
Weaning start (DAH)2bull3 24 21 17 22
Weaning end (DAH4 33 32 37 38
Mean wt (g) at 60 DAH 042 052 042 05
Survival to 60 DAH 7 740 104
Mean L (mm) at 30 DAH 133 11 1225
Mean L (mm) at 36 DAH 139 167
Mean L (mm) at 75 DAH 367 404 452
Mean Wt (g) at 75 DAH 074 081 12 0825 11
Condition factor at 1g 123E-05 118E-05 1Strain abbreviations AR=Arkansas R MD=Maryland FL=Florida 2DAH=Days after Hatch 3Weaning start marks the first introduction and ingestion of dry feed to replace live feeds 4Weaning end denotes the time when the transition to dry feeds is complete and live feeds are no longer utilized
RESULTS
Hatchery Trial Results A summary of performance for hatchery traits of production interest for BX and HSB is presented in Table 1
The fertilization rate for the BX eggs was lower than that which we typically found with HSB (22-32 vs 55) and considerably lower than our experience in 2000 when we conducted fertilization trials with BX (80)
Swimbladder inflation rate ranged from 50 in the first hatchery run to 90 in the second run We attribute the low rate in the first run to
48 International Journal of Recirculating Aquaculture Volume 5 June 2004
Performance of Sunshine Bass and Backcross Hybrid Striped Bass
surface-film and system management problems We showed in the second run that swimbladder inflation in BX was comparable to that typically attainable (gt90) for Morone fry
Time-to-weaning onto dry diets was shorter (10 days versus 18 days) and earlier (day 33 versus day 38) for BX than for HSB Survival of BX to 60 days after hatch (7) was lower than expected on the basis of previous experience with HSB (gt10) Mean weights for BX at 60 days after hatch in two hatchery runs (052 and 042g) was similar to those for HSB (042 and 05g) However HSB exhibited greater mean weight than BX at 75 days after hatch (l04 vs 077g)
Condition factor (K) of BX (123 + 009) was not significantly different from those of HSB (119 + 005) or striped bass (l13 + 003) at 1 gram mean weight
Frequencies of deformities for BX (lt2) were lower than those in earlier reports Bosworth et al (1997) reported deformities in 8 of BX and 4 ofHSB
Grow-out Trial Results Overall there was not a significant difference in weight between the hybrid types (F = 606 df = 13 P = 00907) however as evidenced in
100
80
60
40
20
--+- BX - Overall -0- HSB - Overall -ltgt- BX - Individual Tanks A middot middot middotbullmiddotmiddot middot HSB - Individual Tanks fi
fi ~o
12 Dec 2001 3 Jan 2002 24 Jan 2002 12 Feb 2002
Date Figure 1 Meanfish weight(plusmn 2 SE) at each time period for backcross hybrid striped bass (BX) and hybrid striped bass (HSB) Also shown is meanfish weight at each time periodor groups in individual tanks
International Journal of Recirculating Aquaculture Volume 5 June 2004 49
Performance of Sunshine Bass and Backcross Hybrid Striped Bass
Figure 1 there was a significant interaction on fish weight by hybrid type and time (F = 5157 df = 1587 P lt 00001) Using the slicing option available in SAS (SAS Institute 1999) we tested for differences in weight between the hybrid types for each time period and found that although weights of HSB and BX were not significantly different during the first two measurement periods (Time 1 F = 027 df = 1587 P = 06032 Time 2 F = 036 df = 1587 P = 05496) the hybrid types did differ in weight during the last measurement periods Specifically HSB were significantly heavier than BX on the 24th of January 2002 (F = 1061 df = 1 587 P = 00032) and the 12th of February 2002 (F = 3788 df = 1587 P lt 00001) Overall HSB had a specific growth rate of 268 per
Table 2 Mean weights of backcross hybrid striped bass (BX) and hybrid striped bass (HSB) over the course of a 3-month growth trial
Date BXTank5
Wt(g) SE
112101 1228
BXTank6 Wt(g) SE
1201
BX Tank 12 Wt(g) SE
1274
HSB Tank 13 HSB Tank14 HSB Tank 15 Wt(g) SE Wt(g) SE Wt(g) SE
1180 1016 1088
1211201 1744 102 1778 095 1658 096 1798 109 1752 118 1704 109
1 302 27 60 1 38 28 76 155 27 04 154 3306 157 3424 149 3414 211
1 2402 4196 252 4424 207 4882 299 6344 263 6192 326 6432 362
212102 6332 317 6763 334 6912 299 9474 473 9553 452 10500 388
Table 3 Comparison of survivalfeed conversion ratio (FCR) and condition factor at 60 grams for backcross hybrid striped bass (BX) and hybrid striped bass (HSB)
Cross Tank
Starting
Ending
Survival
BXS
160
136
85
BX 6 BX 12 HSB 13 HSB 14 HSB 15
160
138
86
161
137
85
178
177
99
179
173
97
180
179
99
Starting Biomass (g) 1964 1922 2051 2100 1819 1958
Ending Biomass (g) 8612 9334 9469 16770 16526 18795
Feed Fed(g) 12106 12135 11447 18041 17805 20463
FCR 182 164 154 123 121 122
Condition Factor 168E-05 166E-05 169E-05 194E-05 193E-05 208E-05
SE 353E-07 337E-07 424E-07 255E-07 327E-07 845E-07
50 International Journal of Recirculating Aquaculture Volume 5 June 2004
Performance of Sunshine Bass and Backcross Hybrid Striped Bass
day while BX had a specific growth rate of 205 per day Neither of the covariates included in the model were found to have a significant effect on weight differences (initial tank biomass F = 142 df = 1587 P = 02332 amount of feed F = 005 df = 1587 P = 08165)
Performance regarding key economic traits-survival feed conversion efficiency and condition factor-are summarized in Table 3 At the end of the grow-out trial survival of HSB was significantly greater than that of BX (F = 6216 df = 1 1014 P lt 00001) Feed conversion ratio was better for HSB (122) than for BX (166) Condition factors for BX were lower than those for HSB (l68 vs 198) meaning that BX appeared longer and less deep-bodied than HSB
DISCUSSION Our data showed that F1 HSB performed as well or better than BX for a range of hatchery- and grow-out-related traits
Hatchery traits Fertilization rates for backcross lots were approximately half that for HSB There was a wide variance for fertilization and hatch rates of eggs from HSB females Some of this variance may be due to differences in hatchery protocols (different hormone injections used strip vs tank spawning) at the commercial hatcheries where the data were collected (TIJ Smith personal communication) Poor hatch rates also may be attributable in part to hybrid breakdown that is to developmental incompatibilities among the genomes of the respective species when coadapted gene complexes are broken up at meiosis in the F1 (Hallerman 2003)
In the hatchery trial we hypothesize that the low swimbladder inflation rate for our J~ly fry resulted from offering first feed to the BX too early When rearing HSB and SB fry we typically wait until the yolk sac has been largely resorbed and the fry mostly have inflated their swimbladders before we introduce live feed This is because live feed can cause an oily film on the water surface that interferes with a frys successful ingestion of air bubbles necessary to inflate the swimbladder (Chapman et al 1988) The timing of swimbladder inflation varies with fry type and temperature with HSB typically inflating between 3 and 6 days after hatch and SB 6 to 9 days after hatch BX fry inflate their swimbladder at an intermediate time 5 to 8 days after hatch (DAH) Since for the July
International Journal of Recirculating Aquaculture Volume 5 June 2004 51
Performance of Sunshine Bass and Backcross Hybrid Striped Bass
spawn we introduced feed into their tanks at the time prescribed for HSB (at 5 DAH) BX fry may have had a reduced opportunity to inflate their swimbladders because of interference by a surface film with air contact In the October spawn we monitored swimbladder inflation more carefully and introduced live feed on day 7 after almost 90 of swimbladders were inflated The low swimbladder inflation rate in the July hatchery run of BX may have had a direct impact on survival Larvae without inflated swimbladders expend more energy swimming exhibit reduced growth rates are less tolerant of stress and often sink to the tank bottom and die (Van Heukelem et al 2000)
BX were weaned more quickly and earlier onto dry diets than HSB which may have helped contribute to their ability to match the size and weight of HSB at 60 DAH Earlier weaning has economic merit since dry diets are generally cheaper and easier to feed than brine shrimp
Grow-out traits After 60 days post-hatch the growth and other performance differences between BX and HSB became more evident HSB exhibited significantly better growth survival and feed conversion ratios
We hypothesized that backcross hybrid striped bass might grow as fast or faster than the standard commercially-available F 1 hybrid striped bass if high-performance HSB females were selected as broodstock Our data regarding performance in intensive tank systems did not support this hypothesis Rather our observations accord with the classical view that the high performance of some interspecific hybrids is largely due to heterosis and that because the heterosis shown by an F 2 or backcross hybrid is only half that shown in an F1 (Falconer and Mackay 1996 p 257) that advanced generation hybrids would not perform as well as F1
hybrids Indeed F 2 HSB previously showed low hatch rates low larval survival and high variability of growth rate (Smith and Jenkins 1984 Smith et al 1985) Our results suggest that the heterosis expressed in HSB for growth and performance was greater than the selective breeding advantage we employed by crossing high performance HSB females with male striped bass Apparently the additive genetic variance contributed by the HSB and striped bass selected for size-at-age could not make up for the loss of dominance variance
BX may have better potential market acceptance by virtue of having a lower condition factor appearing longer and less deep-bodied than HSB more
52 International Journal of Recirculating Aquaculture Volume 5 June 2004
Performance of Sunshine Bass and Backcross Hybrid Striped Bass
like striped bass that are more familiar in many markets Fins Technologys market experience has shown that the premium-priced live markets prefer longer leaner fish such as the backcross There is the possibility that because of later maturity backcross hybrid striped bass may grow to larger sizes than hybrid striped bass This is attractive because there is an unserviced demand for larger (1 kg+) fish that can provide portion-controlled 7-9 ounce fillets for the restaurant and retail markets
ACKNOWLEDGEMENTS This project was supported by US Department of Agriculture-Small Business Innovation Research Program Phase I Grant no 2001-00373 EMH is supported by the USDA-CSREES Hatch Program and the Commonwealth of Virginia Aquaculture Initiative
REFERENCES Bosworth BG Libey GS Notter DR Egg Larval and Fingerling
Traits of Crosses among Striped Bass White Bass and their Fl Hybrids Aquaculture 1997 154 201-217
Carlberg J Van Olst J US Production and Sales of Hybrid Striped Bass (1987-2002) 2003 httpaquanicorgsbgaHSBversion5ppt
Chapman DC Hubert WA Jackson UT Influence of Access to Air and of Salinity on Gas Bladder Inflation in Striped Bass Progressive Fish-Culturist 1988 50 23-27
Falconer DS Mackay TFC 1996 Introduction to Quantitative Genetics Fourth Edition Longman Group Ltd Harlow Essex UK
Halbrendt CK Wirth FF Vaughn GF Conjoint Analysis of the Mid-Atlantic Food-Fish Market for Farm-Raised HSB Southern Journal of Agricultural Economics 1991 23 155-163
Hallerman EM Coadaptation and Outbreeding Depression In Po_pulation Genetics Principles and Applications for Fisheries Scientists Hallerman E (Ed) 2004 American Fisheries Society Bethesda MD USA
Harrell RM Hybridization and Genetics Striped Bass and Other Morone Culture In Harrell RM (Ed) 1997 Pages 217-234 Elsevier Science Amsterdam
International Journal of Recirculating Aquaculture Volume 5 June 2004 53
Performance of Sunshine Bass and Backcross Hybrid Striped Bass
Jenkins WE Heyward LD Sr Smith TIJ Performance of Domesticated Striped Bass Marone saxatilis Palmetto Bass and Backcross Hybrid Striped Bass (Sunshine Bass Female x Striped Bass Male) Raised in a Tank Culture System Journal of the World Aquaculture Society 1998 29 505-509
Kerby JH Cryogenic Preservation of Sperm from Striped Bass Transactions of the American Fisheries Society 1983 112 86-91
Losordo TM Westerman P An Analysis of Biological Economic and Engineering Factors Affecting the Cost of Fish Production in Recirculating Aquaculture Systems Journal of the World Aquaculture Society 1994 25 193-203
SAS Institute 1999 The SAS System for Windows version 82 SAS Institute Cary NC USA
Smith TlJ Jenkins WE Controlled Spawning of Fl Hybrid Striped Bass (Marone saxatilis x M chrysops) and Rearing of F2 Progeny Journal of the World Mariculture Society 1984 15 147-161
Smith TlJ Jenkins WE Snevel JF Production Characteristics of Striped Bass (Marone saxatilis) and Fl - F2 hybrids (Marone saxatilis and M chrysops) Reared in Intensive Tank Systems Journal of the World Mariculture Society 1985 16 57-70
Tomasso JR Kempton CJ Gallman A Smith TlJ Comparative Production Characteristics of Sunshine Bass and Sunshine Bass x Striped Bass in Recirculating-Water Systems North American Journal of Aquaculture 1999 61 79-81
Van Heukelem WF Harrell RM Hughes SG Lindell SR Friedmann BR Optimal Conditions for Swimbladder Inflation in Striped Bass Larvae Reared in Intensive Systems Northeast Regional Aquaculture Center Publication No 00-006 (2000) 5 pages
54 International Journal of Recirculating Aquaculture Volume 5 June 2004
Book Review
Fjofish apd Shellfish Bacteriology Mapua) Techpjques apd Procedures KA Whitman with contributions by NG MacNair
Iowa State Press (Blackwell Publishing Professional) Ames IA USA (2004) 288 pages ISBN 0813819520 US $4999
Reviewed by Rocco C Cipriano United States Geological Survey National Fish Health Research Laboratory 11649 Leetown Road Kearneysville WV 25430 USA E-mail rocco_ciprianousgsgov
Despite the fact that several good texts have been published regarding the description and nature of bacterial pathogens in aquatic animals there remained a need for a comprehensive yet practical guide devoted to techniques and procedures used for bacterial identification Diagnosis and detection of fish and shellfish pathogens often requires reliance upon standard microbiological media tests and reagents for some bacteria but more specialized assays are required for many aquatic pathogens In the latter case the products necessary for such assays are not commercially available and must be produced in aquatic animal diagnostic facilities from their basic ingredients Often therefore the compositions of differential media and the conduct of certain tests for the primary isolation or detection of specific aquatic pathogens are only available by referencing the general body of published scientific literature Hence until now there has not been a single-source shelf-volume that combines standard microbiological procedures used for routine detection and identification of medically important bacteria with the specialized needs of the fisheries profession This manual however helps to fill that void
The manual stands as a reference suitable for professional aquatic biologists with backgrounds in microbiology veterinarians and students of aquatic animal health Its strength lies in its coverage of the subject matter regarding culture-based diagnosis and identification of bacteria associated with finfish bivalves and lobsters Sections on
International Journal of Recirculating Aquaculture 5 (2004) 55-56 All Rights Reserved copyCopyright 2004 by Virginia Tech and Virginia Sea Grant Blacksburg VA USA
International Journal of Recirculating Aquaculture Volume 5 June 2004 55
Book Review FiQish and ShelJfish Bacteriology Manualmiddot Techniques and Procedures
aseptic collection and shipment of samples qualitative and quantitative procedures for bacterial isolation staining techniques media and standard biological tests used for the cultivation and phentotypic characterization of pathogenic bacteria and antibiotic sensitivity testing provide sound background for the student or novice practitioner Particularly beneficial for anyone who is not experienced with aquatic microbial pathogens is the section listing principal organs media and appropriate incubation temperatures to be used as the most probable sources of isolation for the specific bacteria
More experienced professionals will find it helpful and convenient to have the descriptions and interpretations of differential media (eg Coomassie Brilliant Blue Agar for Aeromonas salmonicida Rimler-Shotts Agar for Aeromonas hydropila Cytophaga Agar Shieh and TYES for Flavobacterium spp and Edwardsiella ictaluri Agar and various other media for Renibacterium salmoninarum) listed in a single source The major identifying criteria that phenotypically characterize selected bacterial pathogens are also described in tabulated form Specialized tests such as the SIF test to detect covert infections nurse culture techniques for enhanced bacterial growth and assays for public health indicator organisms in bivalves are documented Sections covering serology immunoassay and non-cultured based molecular assays (eg polymerase chain reaction) are also presented but are not as completely summarized as those for bacterial isolation In summary the nature of this manual makes it appropriate for frequent use as a practical laboratory guide
56 International Journal of Recirculating Aquaculture Volume 5 June 2004
Subscription Information
International Journal of Recirculating Aquaculture
A publication ofVirginia Tech and the Virginia Sea Grant College Program
IJRA presents the latest developments in RAS-related research focusing on the areas of
Food Quality Pathology
Food Safety
Aquatic Medicine Breeding amp Genetics Waste Management
FishShellfish Growth amp Nutrition Recirculating Systems Mgmt Marketing amp Economics Water Conservation
Dont miss an issue of this informative peer-reviewed journal Subscribe now using your credit card by calling 540-231-2075 or by printing out a form at wwwcfastvteduijrahtml If you prefer you can also mail this form to the address below along with a check or money order
Name ----------------~ Address ----------------Line2 ------------------City ____________ State __ _ Country Postal Code ___________ _ Phone Fax -------- --------e-mail-----------------check _ 2 year ($25 US)
International Journal of Recirculating Aquaculture Food Science amp Technology Building (0418)
Virginia Polytechnic Institute and State University Blacksburg VA 24061
phone (540) 231-2075 fax (540) 231-9293 e-mail IJRAvtedu
International Journal of Recirculating Aquaculture Volume 5 June 2004 57
~ International Journal of ~ Recirculating Aquaculture A publication of Virginia Tech and the Virginia Sea Grant College Program
Instructions for Authors The International Journal of Recirculating Aquaculture (IJRA) encourages the submission of original high-quality papers on research in all aspects of recirculating aquaculture Papers will be peer-reviewed and evaluated for scientific merit relevance and for their usefulness in promoting the advancement of recirculating aquaculture Complete coherent projects are preferred Any related papers submitted together must be thoroughly cross-referenced All papers must be original meaning that the data and the information presented must be the work of the authors and can not have been published elsewhere Dual publication of a paper or data is possible only through the permission of the Editors of both journals THERE ARE NO PAGE CHARGES for IJRA submissions
INITIAL MANUSCRIPT SUBMISSION Manuscripts should be sent to Ms Angela Correa Managing Editor by mail using the address listed at the end of these instructions or by e-mail to (ijravtedu) Submit four (4) copies of each manuscript if regular mail is used All manuscripts must be in English Dot matrix type is not acceptable and all such submissions will be returned without review Each submission must include a cover letter stating that the paper contains original research and that the information has not been published elsewhere E-mailed submissions must be saved in doc format Be sure to include the names of colleagues who have already reviewed the work presented IJRA has two categories for submission 1 Articles which are complete in-depth scientific studies and 2 Notes which are short papers of limited scope Articles and notes will be critically reviewed by two or three experts as well as by the Managing Editor Submissions may be returned without peer review in cases where the Managing Editor determines that they are inappropriate for the journal of poor quality poorly written or fail to follow the journals style format
PREPARATION OF MANUSCRIPTS IJRA uses the latest editions of Websters New International Dictionary and Websters New Collegiate Dictionarv for standard spellings and word definitions All spelling will be in American English Foreign or science-related terminology that is unfamiliar and does not appear in these dictionaries will require an accompanying definition Acceptable scientific and common names of fishes are listed in A List of Common and Scientific Names of Fishes from the United States and Canada published by the American Fisheries Society Common names may be used throughout each paper but must be accompanied by a full scientific name when they first appear in a paper The author must use the full common name eg yellow perch not perch All foreign language words should be italicized in the manuscript
In the manuscript number each page sequentially and include the senior authors name next to the page number (eg Page 4 Jahncke) on each page Single-space all typed material including references Type size in the body of the text should be no larger than 12pts and no smaller than 10 pts Subsection headings should also be italicized in the manuscript Spell out one-digit numbers except when they are used with units of measure - eg six ponds 7 days
International Journal of Recirculating Aquaculture Volume 5 June 2004 59
Spell out any number that begins a sentence When two numbers occur sequentially in the text one of the numbers must be spelled out- eg In 1987 fifty fish were stocked Use commas in numbers of 1000 or more Use the 24-hour clock to describe time- eg 1300 not 100 pm
Keep footnotes to a minimum and number them sequentially throughout the paper All units of measurement must be reported via the metric system except in special circumstances (eg horsepower) Standard scientific abbreviations and symbols may be used without definition If the use of a symbol could cause confusion define the symbol the first time it is used On the final draft of a paper that has been accepted for publication Greek letters or other extraneous symbols that do not appear on a keyboard the name of the symbol should be noted where the symbol is used to help eliminate prepress errors Parts per million or milligrams per liter can be
-1 reported as either ppm or mgI but not as mgI
Commonly used aquaculture jargon can be used without defining the term - eg fry fingerling hapa Less commonly used jargon may also be used but terms should be defined the first time they are used Jargon from fields outside of aquaculture should also be defined the first time they are used Always place a zero to the left of a decimal point if the number is less than one this includes probability values - eg P = 005 not P = 05
COMPONENTS OF THE MANUSCRIPTS Articles and notes should include a title names of authors and their addresses abstract introduction materials and methods results discussion (or a combined results and discussion) conclusion (rarely) acknowledgements (if any) references figures and tables in that order Each section should start on a new page
Title - The title should accurately reflect the contents of the paper Brief concise titles are encouraged The title page must include the name(s) of the author(s) and all addresses
Abstract - The abstract should be a concise highlight of the results and conclusions Methodology should not be abstracted unless it is necessary to explain the results or unless the paper describes a new technique Abstracts should be less than 300 words
Introduction - The introduction should explain why the paper was written and why it should be read The introduction should condense the relevant information in the field that led the author to do the research The introduction is not a complete literature review and only the most relevant references should be cited The introduction should also contain a statement that describes the purpose or objective of the paper
Materials and Methods - The underlying goal of this section is to describe what was done so that others can repeat the experiment If previously published papers described a technique that was used they can be cited to prevent unnecessary repetition If the technique or process was modified the modification must be described so that others can repeat the process Experimental designs can be explained by use of figures if they will help clarify what was done If the experiment was a complicated one with many subparts subsections may be used to describe each subpart
Results - This section describes the data Proper use of tables and figures can simplify and help explain the results Statistical analysis of data is necessary unless differences are so obvious that statistical analysis is superfluous Although probability values of 005 and 001 are traditionally used each author is free to choose his or her own level of significance
60 International Journal of Recirculating Aquaculture Volume 5 June 2004
Discussion - This section should interpret the results and compare the results from this experiment to those found in similar research The section can also be used to speculate about the results to provide reasons for the trends and to suggest new ideas that can advance our understanding about aquaculture This section should not be a literature review section that merely compares results among several papers
Results and Discussion - Results and discussion sections can be combined In most cases this leads to a better paper because the integration of these sections leads to a more meaningful interpretation of data
Conclusion - This section should be used only when the results of an experiment lead to an unequivocal interpretation
Acknowledgements - This section should be used to thank organizations that supported the research monetarily and individuals who assisted in the research or preparation of the paper This section includes manuscript number designations for those institutions that assign such numbers
References - Select references with great care Unless the paper includes a literature review there is no need to reference every paper written about a subject Use only the most important ones
Figures and Tables - All figures andtables go after the references Figures always go before tables
Section headings (eg Materials and Methods) should be capitalized and in bold type Secondary headings should be balded and go flush left Tertiary headings are incorporated into the first paragraph of that subsection Tertiary headings are italicized and separated from the text by a double dash
In the text references are cited in one of two ways 1 Swingle (1959) evaluated two species of tilapia or 2 pond culture in Alabama began in the 1950s (Swingle 1959) When there are three or more authors list only the first in a citation and follow that with et al eg Smitherman et al (1983) reviewed catfish breeding work at Auburn University If the name of an institutional author is long it can be abbreviated in a citation eg Food and Agriculture Organization of the United Nations may be abbreviated as FAO When several citations are used in a single entry they are listed chronologically If you are citing two papers that were written by the same author(s) the name only has to appear once per citation followed by the years that designate the different papers Separate the years with a comma If you are citing two authors you must separate the citations with a semicolon (Smith 1975 1976 Jones 1976)
In the reference section the reference list is strictly alphabetical by last name of the senior author and then by initials if two authors have identical last names If an author has written more than one paper the following format should be followed All single authored papers go first followed by co-authored papers and then the papers that were written by three or more authors If an author has written more than one single-authored paper the papers are listed chronologically If an author has written more than one co-authored paper they are listed alphabetically by the second authors last name If a tandem has authored two or more papers the order is chronological Papers written by the same group of three or more authors should be listed chronologically
International Journal of Recirculating Aquaculture Volume 5 June 2004 61
The following format will be used when referencing various works
PAPERS Single-author papers
McGinty AS Effects of Size at Stocking on Competition and Growth of All-Male Tilapia Hybrids Journal of the World Aquaculture Society 1985 16 52-56
Multiple-author papers Tave D Smitherman RO Predicted Response to Selection for Early Growth in Tilapia nilotica Transactions of the American Fisheries Society 1980 109 439-445
If an author has published two or more papers in the same year follow the years with a letter to differentiate them eg Smith 1988a 1988b Use issue numbers only when each issue starts out with page 1 If pagination is consecutive throughout the volume omit the issue number Spell out journal names in their entirely without abbreviations
Papers in proceedings or in edited volumes Nicholson LC Woods LC Ill Woiwode JG Intensive Culture Techniques for the Striped Bass and its Hybrids In Culture and Propagation of Striped Bass and Its Hybrids Harrell RM Kerby JH Minton RV Eds 1990 American Fisheries Society Bethesda MD USA
Books and reportspublications from governmental or non-governmental bodies
Lovell T 1989 Nutrition and Feeding of Fish Van Nostrand Reinhold New York NY USA
Food and Agriculture Organization of the United Nations (FAO) Fisheries Department 1997 Review of the State of World Aquaculture No 886 FIRlC886 FAO Rome Italy
Theses and Dissertations
Easter CC 1992 Water Chemistry Characterization and Performance of a Recirculating Aquaculture System Producing Hybrid Striped Bass Masters thesis Virginia Polytechnic Institute and State University Blacksburg VA USA
Websites
Federation of European Aquaculture Producers (FEAP) European Eel Production (httpwwwfeaporgeelshtml) 2002
Page numbers for proceedings books theses and dissertations are unnecessary Government publications should be treated as if they were books but document numbers must be included THE ACCURACY OF REFERENCES IS THE SOLE RESPONSIBILITY OF THE AUTHORS MAKE SURE THAT CITATIONS AND REFERENCES MATCH
Tables - When creating a table decide what the purpose of the table is and what points are important then organize the table so that the main features can be easily understood The table heading should provide sufficient information for the table to be understood as an entity Keep footnotes to a minimum Each table goes on a separate page Tables must be camera ready TABLES WILL BE PRINTED AS IS AND WILL NOT BE TYPESET Figures - List all figure captions on separate pages Original artwork doesnt have to be submitted when a paper is first submitted for review but original artwork must accompany the final revised manuscript Good quality photocopies are acceptable when a manuscript
62 International Journal of Recirculating Aquaculture Volume 5 June 2004
is submitted for review Graphs and original artwork must be printed with a laser printer or done in pen and ink Dot-matrix figures are not acceptable Original artwork or high-contrast photographs are acceptable Label all figures on the back with a soft pencil name of senior author paper title and figure number
Photographs - Should be on glossy paper with good contrast Do not glue pictures to cardboard Color photographs can be printed but the additional cost of printing them will be charged to the author Label all photos on the back with a soft pencil name of senior author paper title and figure number
FINAL REVISED MANUSCRIPTS If using the mail submit two copies of the final revised manuscript including original artwork Submit either the original pen-and-ink drawings or laser-printed versions of the drawings In addition submit the manuscript on a disk (CD preferable) or by e-mail On the disk write the brand name of the computer or word processor the word processing program that was used (should be Microsoft Word) the title of your article and the file name NOTE Disk and hard copy must agree In case of discrepancies it is the policy of IJRA to follow hard copy An electronic version of the completed manuscript is needed in order to publish AUTHORS MAY NOT RECEIVE PAGE PROOFS Proofreading will be done by the Production Office of IJRA using the revised final version of the manuscript Therefore authors must be especially careful that no errors exist in the final revised version because in most cases no changes are possible after it is submitted
REPRINTS The senior author will receive two copies of the journal and a pdf file of the article for distribution and reprinting purposes The junior author(s) will also receive two copies of the journal issue These are sent several weeks after the journal is published and in circulation Requests for the pdf format of the article can only be made by the corresponding author
COPYRIGHT amp PERMISSIONS For permission to reprint articles that have appeared in IJRA please contact IJRA Copyright amp Permissions Food Science amp Technology Building (0418) Virginia Tech Blacksburg VA 24061 USA
COPYRIGHT TRANSFER If your manuscript is accepted for publication copyright ownership must be officially transferred to IJRA The Editors acceptance letter will include a form fully explaining this The form must be signed by all authors and the original returned to the Editor at this time Failure to return the copyright form in a timely fashion will result in delay in publication
Send your submissions to International Journal of Recirculating Aquaculture
AI Correa Managing Editor 27-B Food Science and Technology Building (0418) Virginia Polytechnic Institute and State University Blacksburg VA 24061 USA
If you have any questions please feel free to contact us Phone (540) 231-2075 Fax (540) 231-9293 e-mail ijravtedu
International Journal of Recirculating Aquaculture Volume 5 June 2004 63

Flatbed Scanning for Examining Lipid Distribution in Fish
Rasmussen RS Ostenfeld TH R~nsholdt B McLean E Manipulation of End-Product Quality in Rainbow Trout with Finishing Diets Aquaculture Nutrition 2000 6 17-23
R~nsholdt B Nielsen H Frergemand J McLean E Evaluation of Image Analysis as a Method for Examining Carcass Composition of Rainbow Trout Ribarstvo 2000 58 3-11
Rye M Predicition of Carcass Composition in Atlantic Salmon by Computerized Tomography Aquaculture 1991 99 35-48
Samuelsen T Isaksen M McLean E Influence of Dietary Recombinant Microbial Lipase on Performance Characteristics of Rainbow Trout Aquaculture 2001 194 161-171
Shearer KD The Effect of Diet Composition and Feeding Regime on the Proximate Composition of Farmed Fishes In Farmed Fish Quality Kestin SC and Warriss PD (Eds) 2001 Pages 31-41 Fishing News Books Osney Mead UK
Stow CA Jackson LJ Amrhein JF An Examination of the PCB Lipid Relationship among Individual Fish Canadian Journal of Fisheries and Aquatic Sciences 1997 54 1031-1038
Valdes EV Atkinson JL Hilton JW Leeson S Near Infrared Reflectance Analysis of Fat Protein and Gross Energy of Chicken and Rainbow Trout Carcasses Canadian Journal of Animal Science 1989 69 1087-1090
Viegas EMM Guzman EC Effect of Sources and Levels of Dietary Lipids on Growth Body Composition and Fatty Acids of the Tambaqui (Colossoma macropomum) World Aquaculture 1998 29
Zhou HY Cheung RYH Wong MH Bioaccumulation of Organochlorines in Freshwater Fish with Different Feeding Modes Cultured in Treated Wastewater Water Research 1999 33 2747-2756
International Journal of Recirculating Aquaculture Volume 5 June 2004 17
Skinless V-Notched Fillet Yields ofTilapia (Oreochromis)
SP Kirkup1 LS Marsh2 CW Coale Jr3
11774 Old Brook Rd Charlottesville VA 22901 USA
2Department of Biological Systems Engineering (0303) Virginia Polytechnic Institute and State University Blacksburg VA 24061 USA
3Department of Agricultural and Applied Economics (0401) Virginia Polytechnic Institute and State University Blacksburg VA 24061 USA
Corresponding authors e-mail marshesvtedu
Keywords tilapia Oreochromis fish fillet yield
International Journal of Recirculating Aquaculture 5 (2004) 19-27 All Rights Reserved copy Copyright 2004 by Virginia Tech and Virginia Sea Grant Blacksburg VA USA
International Journal of Recirculating Aquaculture Volume 5 June 2004 19
Fillet Yields of1ilapia (Oreochromis)
ABSTRACT White hybrid tilapia (Oreochromis) produced in an experiment that determined the effects of various management practices on growth rate and feed conversion ratios were weighed measured and filleted at the conclusion of the growth trials Regression analyses produced two models to predict fillet yields-one model that used the fish weight and length and a reduced model that used only fish weight While the full model produced a somewhat smaller error it was found to be impractical to use fish length to estimate fillet yield due to the difficulty in obtaining a length measurement The full model also produced unreasonable estimates when extended beyond the limits of the data set Using a paired t-test fillet yields of males and females of equal weights were tested and were not found to be significantly different This model provides a means of converting market price of tilapia fillets to a price for live fish once processing costs are considered
INTRODUCTION Marketed food commodities including fish undergo changes in product form before reaching the consumer The objective of changing the product form of a commodity is to add value to the product In the case of filleted fish products changing a whole fish to a filleted product enhances the value of the product but also significantly reduces its weight The producer is paid not for the live weight of the fish but for the final weight in commodity form Producers raising fish for the fillet market need a simple means of estimating fillet yield in order to make management decisions regarding what size of live fish to harvest
Market demand for various forms of tilapia has been created in large metropolitan areas of the United States and Canada by ethnic groups from regions including South and Central America Southeast Asia Africa China and the Philippines Although most of the tilapia consumed in the United States is imported as fresh or frozen fillets or frozen whole fish (Harvey 2000) certain ethnic groups prefer live fish for which they are willing to pay a significant premium High transportation and handling costs make importation of live tilapia into the United States prohibitively expensive and thus a domestic live tilapia industry has developed within the United States primarily using intensive recirculating aquaculture systems While the amount of tilapia produced domestically is rather small compared to that of catfish and trout according to the USDA
20 International Journal of Recirculating Aquaculture Volume 5 June 2004
Fillet Yields ofTilapia (Oreochromis)
(Harvey 2000) tilapia represents the second largest import of finfish into the United States on a live weight and value basis trailing only Atlantic salmon Hence there is ample evidence of a market for tilapia
Tilapia cannot survive in low ambient temperatures (Phipippart and Ruwet 1982) and therefore except for the southernmost regions they cannot be produced year-round in ponds in North America Production costs of tilapia raised in ponds have been estimated to range between $088 and $132kg (Fitzsimmons and Posadas 1997) compared to an estimated production cost of $279kg for recirculating aquaculture systems (Losordo and Westerman 1994) Because of the significantly higher cost of indoor temperature-controlled production domestic producers generally cannot compete economically with foreign pond-raised processed tilapia products which are relatively inexpensive to ship However they can compete for the live tilapia market due to the challenges and costs associated with transporting live fish
Many wholesalers require a minimum size for live tilapia producers report both 340 and 450 g (three-quarters and one pound) as minimum desired weights Producers are tempted to retain and grow out further fish that are too small to be marketed as live fish However research conducted at Virginia Tech indicates that as tilapia mature both the growth rate and feed-conversion efficiency decrease dramatically (Kirkup et al 2000) and that these decreases are primarily dependent on age rather than either size or culture conditions Therefore it might be more economical to fillet substandard fish rather than allowing these poor performers to grow to live-market size
Tilapia fillet yields are of interest to domestic producers for several reasons First fillet yield can be used to establish the value of live tilapia once the market price and processing handling and carcass disposal costs are known Secondly fillet yield and variation are of interest to food processors and restaurateurs who are interested in a specific size fillet or portion
In the spring and early summer of 1999 an experiment was conducted to investigate the effects of different temperature and feeding rates upon the growth and feed conversion efficiency of Rocky Mountain white tilapia As a result of the experiment there was large variation in size length and weight among the fish in the various treatments At the conclusion of the experiment the fish were weighed measured sexed filleted and the fillets were weighed
International Journal of Recirculating Aquaculture Volume 5 June 2004 21
Fillet Yields of Tilapia (Oreochromis)
MATERIALS AND METHODS The fish used for the experiment are commonly called Rocky Mountain White Tilapia although a best guess is that they are a white inter-specific species of the genus Oreochromis primarily 0 niloticus 0 aureus and 0 mossambicus This hybrid has been selectively bred at Blue Ridge Aquaculture Inc (Martinsville VA USA) for its color and growth rate The white hybrids are desirable in the live fish market because of their generally attractive external appearance This hybrid grows rapidly and has other physiological attributes that make it well suited to culture in high-density aquaculture systems Although predominantly white the fish ranged in color from a bright white to a bluish and golden white to a few that were colored a reddish brown As fry the fish were given methyltestosterone mixed with their feed to chemically sex reverse the females Prior to delivery to Virginia Tech the fish were graded twice at Blue Ridge Aquaculture Inc to obtain a relatively uniform size by removing the runts
The fish were raised in 6607 L (150 gallon) agricultural watering troughs (Rubbermaid Winchester VA USA) The experiment was a three (temperatures) by four (feeding levels) factorial design having two replicates The nominal culture temperatures were 26 29 and 32degC and the feeding levels for each temperature conducted four times a day were saturation feeding 87 73 and 60 of the daily saturation feed rate The average fish weight at the beginning of the experiment was approximately 53g and the growth experiment lasted 20 weeks At the conclusion of the experiment the fish were taken off feed for three days prior to harvesting The tanks were completely drained and the live fish from each tank were placed in an ice-filled chest The fish were kept on ice for several hours prior to being filleted to anesthetize them and increase rigor making them easier to fillet and reducing the amount of blood in the fillet Prior to processing the fish were weighed to the nearest gram using a digital scale and measured to the nearest millimeter using a measuring board Fish weighing 300g or more were then filleted smaller fish were dissected to determine sex but were not filleted A total of 407 fish were filleted As noted the fish used in this experiment were chemically sex reversed ie from female to male and thus during the filleting process only 10 were identified as females Of that 10 a disproportionate number of females did not reach the 300g minimum cut-off weight for filleting thus only 24 fish identified as females were filleted
22 International Journal of Recirculating Aquaculture Volume 5 June 2004
Fillet Yields ofTilapia (Oreochromis)
The filleting was conducted by two competent fish cutters with extensive experience in filleting tilapia for a small Midwestern tilapia producer The v-notched skinless filleting was primarily accomplished with electric carving knives One individual cut across the torso just behind the gill and then cut horizontally down along the backbone through the ribcage to the tail While still attached to the tail the side of the fish was then flipped over and another horizontal cut was made along the skin to separate the meat from the skin and scales The sex of the fish was then determined based upon the internal sex organs The procedure was repeated on the other side of the fish The other individual cut the ribcage out of the fillet with an electric knife and removed the pectoral fin with a v-shaped cut The combined weights of the fillets for each fish were determined to the nearest gram on a digital scale
RESULTS
Fillet Weight Model A mathematical model of the fillet weight (Wf) in grams was fitted using the linear regression procedure (SAS Cary NC USA) Considered in the model were polynomials of weight and length condition factor temperature and feeding rate sex and interaction terms of the primary factors Only fish weight (W) in grams and length (L) in millimeters were found to be significant at the 95 confidence level and the resulting model was Wr = 650 - 0403L + 0401 W with a coefficient of determination (r2) of 0913 The reduced model Wr = -167 + 0336W produced an r2 of 0906 The fillet weight versus fish weight data and the regression line are shown in Figure 1 It appears that weight is a
--middot Figure I Relationship between fish weight and total fillet weight
International Journal of Recirculating Aquaculture Volume 5 June 2004 23
Fillet Yields o1ilapia (Oreochromis)
very good predictor of fillet yield and that for a given weight shorter fatter fish produce a slightly higher yield Although losing some predictive power the reduced model is more appropriate for several reasons Fish length and weight are highly correlated and therefore most of the predictive capability of length can be accounted for in the weight measurement The large positive intercept and the large negative coefficient for length in the full model are intuitively illogical Beyond the limits of the data set the full model produces unreasonable predictions For example predicted fillet weight of fingerlings would exceed the entire weight of the fish On the other hand the coefficients of the reduced model are intuitively logical and produce reasonable estimates of the fillet weights even beyond the limits of the data collected For the reduced model the 95 confidence interval for they-intercept is -215 to -119 and the 95 confidence interval for the weight coefficient is 0326 to 0347 Considering the variation in yield introduced by the filleting process the linear correlation between fillet yield and weight is good
Effect of Sex on Fillet Yields As noted previously fillet yield is a function of size and on average the females were only 666 as heavy as their male counterparts for a given treatment The question to be answered is whether the fillet yields of males and females of similar weights are different Once this is known it can be determined whether unisex production should be priced differently than mixed-sex production As noted above gender was not a significant factor in the construction of the fillet model but a paired t-test is a stronger statistical test For each of the 24 filleted females a male was selected at random that had the same or nearly the same body weight A paired t-test was used to compare the fillet weights and fish lengths of equal-sized males and females At the p = 005 level the differences in fillet yields were not significant but the males were found to be significantly longer F tests were used to compare the variance of the fillet weights and the lengths At the p = 005 level no statistical difference could be detected in the variance of the fillet weights or lengths
24 International Journal of Recirculating Aquaculture Volume 5 June 2004
Fillet Yields ofTilapia (Oreochromis)
Table 1 Comparison of length weight fillet weight and yield of males and females of comparable weight
Length Fillet (mm) Weight (g) Weight (g) Yleld ()
Males Average 2670 3758 1087 029 (SD) 147 647 244 0024
Females Average 2618 3760 1103 029 (SD) 153 647 219 002
DISCUSSION Weight is a good predictor of fillet yield The full model regression formula that included both fish weight and fish length produced a model with slightly greater predictive power than the reduced model that used only fish weight and could thus be of interest from an academic perspective Its predictive power is only slightly better than that of the reduced model From a practical perspective weight is relatively easy to measure whereas length is not and thus for commercial applications the reduced model is a more valuable tool than the full model
The wholesale price per kilogram for tilapia is generally based upon fish weight-fish heavier than 600g bring a premium price those between approximately 350 and 600g an intermediate price and those less than 350g a lesser price (Fitzsimmons and Posadas 1997) The reduced model predicts yields of 288 and 308 for 350g and 600g fish respectively which would justify a price premium of approximately 7 based strictly upon the increase in yield but which does not include any reduction in processing costs The yields obtained from this experiment are lower than both the 33 yield figure cited as a rule of thumb by Fitzsimmons and Posadas (1997) and the average fillet yield of 335 from 0 niloticus averaging 2074g cited by Obanu and lkeme (1988) In contrast Clement and Lovell (1994) obtained only a 254 fillet yield from 0 niloticus that weighed an average of 585g Several factors could account for the discrepancies including tilapia species and the skill of the fish cutter However the largest source of variation is likely to be the methods and procedures used in filleting which unfortunately are generally not reported in the literature Variability introduced by fillet technique and skill of the cutter is not included in this model because only one set of cutters was used
International Journal of Recirculating Aquaculture Volume 5 June 2004 25
Fillet Yields of Tilapia (Oreochromis)
Fillet yield is important information for making management decisions in pricing fish products selecting species specifying feed rations and controlling production costs Muscle yield of fish species has a big impact on the profitability of the aquaculture firm and on the survival of a specific marketing channel The fish producer is the last claimant to the consumers market price for fish and fish products The more handlers there are operating in a marketing channel the smaller the margins for each handler Gross retail margins for fresh fish usually command between 30 and 50 of the total profit depending on the marketing season and the fish species Producers are accustomed to marketing whole fish while customers are used to purchasing fish fillets When the useable flesh is separated from the whole fish the result is the fillet and a by-product Typically these by-products of the fish filleting process do not have significant value and their production cost has already been factored into the fish value The higher the yield ratio of muscle to by-product and the higher the market price the greater the chance a producer has of receiving a higher return on the aquaculture product Documentation of fillet yields coupled with market price indicate the value of the fish products in a marketing channel The better the yield the better the survival of a species in the marketplace
ACKNOWLDEGEMENT This material is based upon work supported by the Cooperative State Research Education and Extension Service US Department of Agriculture under Project No VA135559
REFERENCES Clement S Lovell RT Comparison of Processing Yield and Nutrient
Composition of Cultured Nile Tilapia (Oreochromis niloticus) and Channel Catfish (Ictalurus punctatus) Aquaculture 1994 119 299-310
Fitzsimmons K Posadas BC Consumer Demand for Tilapia Products in the US and the Effects on Local Markets in Exporting Countries In Proceedings of the Fourth International Symposium on Tilapia in Aquaculture (Orlando FL USA) Fitsimmons K (Ed) 1997 NRAES-106 Natural Resource Agriculture and Engineering Service (NRAES) Ithaca NY USA
26 International Journal of Recirculating Aquaculture Volume 5 June 2004
Fillet Yields oTilapia (Oreochromis)
Harvey D 2000 Aquaculture Outlook Economic Research Service US Department of Agriculture (Pub LDP-AQS-12) Washington DC USA
Kirkup SP Marsh LS Libey GS Heath AG Coale CW Haugh CG Effects of Temperature and Feeding Rates upon Growth and Feed Conversion Ratios in Tilapia In Proceedings of the Third International Conference on Recirculating Aquaculture (Roanoke VA USA) Flick G J and Rakestraw T (Eds) 2000 Virginia Tech Blacksburg VA USA
Losordo TM Westerman PW An Analysis of Biological Economic and Engineering Factors Affecting the Cost of Fish Production in Recirculating Aquaculture Systems Journal of the World Aquaculture Society 1994 25193-203
Obanu ZA lkeme AI Processing Characteristics and Yield of Some Fishes of the River Niger in Nigeria In Proceedings of the FAQ Expert Consultation on Fish Technology in Africa (Abidjan Cote DIvoire) FAQ Fish Report 1988 Supplement No 400 pages 218-220
Phipippart J-Cl Ruwet J-Cl Ecology and Distribution of Tilapias In_ ICLARM Conference Proceedings 7 (Bellagio Italy 1980) Pullin RSV and Lowe-McConnell RH (Eds) 1982 International Center for Living Aquatic Resources Management (ICLARM Manila Philippines
HematPlogy and Blood Chemistry Reference Intervals for Yellow Perch (Percajlavescens) Raised in Recirculation Systems
TC Hrubec1 and SA Smith2
1Department of Biomedical Sciences E Via Virginia College of Osteopathic Medicine Blacksburg VA 24060 USA
2Department of Biomedical Sciences and Pathobiology (0442) Virginia-Maryland Regional College
of Veterinary Medicine Virginia Polytechnic Institute and State University Blacksburg VA 24061 USA
Corresponding author current address Department of Biomedical Sciences and Pathology (0442) Virginia-Maryland Regional College of
Veterinary Medicine Virginia Polytechnic Institute and State University Blacksburg VA 24061 USA E-mail thrubecvtedu
Keywords Yellow perch Perea hematology blood chemistry reference values plasma biochemistry
International Journal of Recirculating Aquaculture 5 (2004) 29-42 All Rights Reserved copy Copyright 2004 by Virginia Tech and Virginia Sea Grant Blacksburg VA USA
International Journal of Recirculating Aquaculture Volume 5 June 2004 29
Hematology and Blood Chemistry of Yellow Perch (Percaflavescens)
ABSTRACT Determination of hematology and blood plasma biochemistry values is routinely used to assess the health of wild and domestic animals Yellow perch (Percaflavescens) culture is a growing segment of the US aquaculture industry and tools are needed to monitor the health status of these fish This paper reports reference values for complete hematological and biochemistry profiles of normal healthy yellow perch raised in recirculation culture conditions The following hematologic values were determined packed cell volume plasma protein erythrocyte leukocyte lymphocyte neutrophil monocyte and thrombocyte numbers A description of leukocyte morphology is presented Additionally the following plasma biochemical values were determined total protein albumin globulin creatinine total bilirubin alkaline phosphatase aspartate aminotransferase sodium potassium chloride calcium phosphorus magnesium glucose and cholesterol Reference values for a specific population of fish need to be determined prior to utilizing diagnostic blood samples from individuals Developing diagnostic hematology for fishes can enhance yellow perch culture by providing a means for the early detection and identification of infectious disease and of sub-lethal conditions that may affect production performance
INTRODUCTION Yellow perch (Percaflavescens) are an important game fish throughout much of the Northeast and Midwestern United States and Canada Contamination of natural waters by pollutants and an increased consumer demand for fresh seafood has led to the aquaculture production of yellow perch The culture of yellow perch is a rapidly emerging segment of aquaculture in the United States (Schmitz 1999) and has great economic potential especially in recirculation aquaculture systems (Kelly 2000 Mallison 2000) As more producers cultivate yellow perch it will become increasingly important to accurately evaluate the health of these fish and to develop tools such as diagnostic hematology to monitor the health status of fish during their production cycle
Diagnostic evaluation of blood parameters has been used extensively for many mammalian avian and reptilian species The rapidly growing aquaculture industry will increasingly need to utilize information of this type in order to assess the health status of cultured fishes Unfortunately hematology use in aquaculture remains limited in part due to the lack of
30 International Journal of Recirculating Aquaculture Volume 5 June 2004
Hematology and Blood Chemistry of Yellow Perch (Percaflavescens)
reliable reference blood values for most fish species Accurate reference intervals have been developed for some species including hybrid striped bass and tilapia under different production settings (Hrubec et al 1996 1997ab 2000 2001 Hrubec and Smith 2000) and for trout (biochemistry only Wedemeyer and Nelson 1975) pacu (hematological only Tocidlowski et al 1997) and milkfish (Ram-Bhaskar and Srinivasa-Rao 1989)
Little is known about the blood response of yellow perch There are few studies that have previously measured blood values in yellow perch (Toneys and Coble 1980 Nelson et al 1988 Nelson and Mitchell 1992 van den Heuvel et al 2000) Only a few parameters such as hematocrit sodium and chloride were determined as most of these studies were toxicological in nature and evaluated changes in other body systems The objective of this study was to generate a complete comprehensive list of reference blood values for normal healthy yellow perch (Perea flavescens) raised to market size in a recirculation system for later use as a diagnostic tool This is the first paper to report full hematological and biochemical profiles for production yellow perch
MATERIALS AND METHODS
Juvenile yellow perch were stocked into production recirculation systems as fingerlings and reared through their production cycle indoors in 10219-L recirculation tanks with a rotating biological contactor filter and 10 freshwater exchange per day At the end of their production cycle when the fish were 17 months old approximately 250 fish were removed from the production system and placed in a smaller 2400-L circular tank with a slant tube clarifier and a trickle biofilter The smaller tank had a freshwater replacement rate of 15 per day The fish were placed in the smaller systems to allow for a more rapid and less stressful capture procedure The fish were acclimated to the new tanks for 3 weeks The photoperiod was approximately 14-h light and 10-h dark Fish were fed daily to satiation with a commercial pelleted diet (Rangen EXTR 400 40 protein 10 fat Rangen Inc Buhl ID USA) The following water quality parameters were determined daily temperature pH ammonia alkalinity hardness nitrite nitrate and dissolved oxygen Ranges for water quality over the duration of the study are shown in Table 1 and are representative of water quality observed daily in these tank systems
International Journal of Recirculating Aquaculture Volume 5 June 2004 31
Hematology and Blood Chemistry of Yellow Perch (Perea flavescens)
Table 1 Water quality parameters for yellow perch (Percaftavescens) reared in a recirculation culture system Values are means plusmn standard deviations for the parameters on the days that fish were bled for hematological and blood biochemical determinations and are representative of the daily water quality values in the system
Parameter For Hematology Fish For Chemistry Fish
Temperature (degC) 209 plusmn 001 207plusmn 11
pH 78plusmn01 79 plusmn 02
NH3 un-ionized (mgL) 0012 plusmn 0012 0011 plusmn 0005
N02-N (mgL) 0031 plusmn 0015 0043 plusmn 0043
N03-N (mgL) 60 plusmn 26 28 plusmn09
Alkalinity (mgL) 252 plusmn44 313 plusmn 48
Hardness (mgL) 399 plusmn 10 433 plusmn27
Dissolved Oxygen (mgL) 74plusmn05 74 plusmn03
Fish were netted rapidly and anesthetized in aerated tank water with buffered tricaine methanesulfonate (MS-222 Sigma Chemical Co St Louis MO USA) until they began to lose equilibrium approximately 20 seconds Individual fish were bled for either hematological determinations (23g needle 1-mL syringe) or for biochemical determinations (23g needle 3-mL syringe) in both cases blood was collected from the caudal vessels After blood samples were collected the fish were weighed measured and checked for external and internal pathologic lesions The sex of each fish was determined by internal observation of the gonads
Blood for hematological determinations was transferred to an ethylenediamine-tetraacetic acid (EDTA) treated pediatric blood tube and held on ice until analysis (lt 1 hour) Blood for biochemical determinations was collected into cold 3-mL heparinized blood tubes and centrifuged at 14000 x g immediately Plasma was collected and frozen at -10degC until analyzed The following analytes were determined in the plasma with an Olympus AU-400 (Olympus America Inc Melleville NY USA) automated clinical chemistry analyzer total protein albumin creatinine total bilirubin alkaline phosphatase (ALP) aspartate aminotransferase (AST) cholesterol glucose sodium potassium chloride phosphorus calcium and magnesium Globulin was calculated from the total protein value minus the albumin value
32 International Journal of Recirculating Aquaculture Volume 5 June 2004
Hematology and Blood Chemistry of Yellow Perch (Percaflavescens)
Hematological analytes were determined from the EDTA anticoagulated blood As we have observed for other fish species EDTA was superior to heparin for yellow perch blood both in preventing clot formation and preserving cellular morphology (Hrubec et al 1996 2000) Blood from the EDTA tube was drawn into microhematocrit tubes and the packed cell volume (PCV) determined after centrifugation at 10000 x g for 5 min Plasma protein was determined with a clinical refractometer using plasma from the microhematocrit tube The total erythrocyte and leukocyte-plus-thrombocyte counts were determined manually with a Neubauer hemacytometer using Natt-Herricks solution as a diluent stain (Natt and Herrick 1952) Blood smears made within 45 minutes of sample collection were stained with Wright-Geimsa stain and were used to determine the differential counts as follows Leukocytes and thrombocytes were identified and counted on the blood smears until 200 leukocytes and a variable number of thrombocytes were enumerated The percentages of each leukocyte type and of thrombocytes were multiplied by the total leukocyte-plus-thrombocyte number to give the final cell counts Thrombocyte numbers were subtracted from the leukocyte-plus-thrombocyte count to give the total leukocyte count This method of manually determining total leukocyte and differential counts has been recommended for use with avian (Zinkl 1986) and fish blood (Hrubec et al 1996 1997ab 2000 2001) as the nucleated red cells prevent accurate enumeration using automated analysis (Huffman and Arkoosh 1997) Slight thrombocyte clumping was observed on the hemacytometer for some individuals only fish with minimal thrombocyte clumping(lt 4 cells clumped) were used for the differential counts to ensure accuracy of the counts
Reference intervals were determined following the guidelines proposed by the National Committee for Clinical Laboratory Standards (NCCLS 1992) As suggested in these guidelines the data were checked for outliers using the 13 differencerange ratio and no outliers were identified The values were then ranked and the high and low 25 were discarded The range of the remaining values provided the reference interval
RESULTS AND DISCUSSION The physiologic and health status of an individual is reflected in the blood producing variations in hematological and blood biochemical values Clinical analysis of blood is a fundamental tool used in human
International Journal of Recirculating Aquaculture Volume 5 June 2004 3 3
Hematology and Blood Chemistry of Yellow Perch (Percaflavescens)
and veterinary medicine to diagnose and predict the outcome of disease and to monitor the effect of therapeutic nutritional and environmental management Blood analysis is not used extensively as a diagnostic tool in fish medicine partly due to the lack of reference intervals for various fish species and also because changes associated with specific diseases and metabolic disorders are not well characterized With sufficient background data clinical analysis of individual blood samples could detect infectious diseases metabolic disorders and sub-lethal disease states affecting production performance
Hematological and plasma biochemistry data from diseased individuals can be evaluated by direct comparison to a reference interval which is the appropriate range of variation in a blood parameter from a defined population of individuals under specific conditions The reference interval needs to be determined on a sufficient number of normal healthy individuals under similar production conditions using standardized analytical techniques (NCCLS 1992) When the deviation in a blood parameter is large enough to fall outside the reference interval it indicates the value may be aberrant and is most likely not due to individual variation for a given fish
Few previous studies have determined blood parameters for yellow perch (Toneys and Coble 1980 Nelson et al 1988 Nelson and Mitchell 1992 van den Heuvel et al 2000) These studies are of limited relevance as they were primarily toxicological studies and only a few blood parameters were determined and also because blood samples were collected and handled by differing methods prior to determination of the blood value Some of the capture (hook and line and gill netting) and blood collection methods (severing the caudal peduncle) used in these studies are also unsuitable for diagnostic blood samples as they result in significant alteration in the blood which will mask diseased states The study with the closest sampling procedure to that used in our experiment only presented selected blood chemistry values for yellow perch after 16 hours of moderate or exhaustive exercise (Nelson and Mitchell 1992) Therefore although the previous studies on yellow perch hematology are helpful in determining the effects of environmental factors and stress they have limited diagnostic utility and even prevent meaningful comparison with the data presented in this paper
The average mean weight of the yellow perch used for the hematological determinations was 125 +- 14g with a total length of 223 +- 08 cm For
34 International Journal of Recirculating Aquaculture Volume 5 June 2004
Hematology and Blood Chemistry of Yellow Perch (Percajlavescens)
the biochemical determinations the fish had a weight of 121 +- 15g and length of 226 +- 08 cm The results of the hematological determinations from 52 fish are listed in Table 2 Values for plasma chemistry reference intervals determined on 42 samples are listed in Table 3 Overall both the hematological and plasma chemistry values were similar to those reported previously for hybrid striped bass and tilapia reared in recirculation systems (Hrubec et al 1996 2000 Hrubec and Smith 2000) The striped bass and tilapia from production systems exhibited wider ranges in value for the different leukocyte types increased numbers of reticulocytes increased plasma and total protein values increased creatinine values and a decreased plasma chloride concentration as compared to fish in lower density recirculation tanks We did not compare blood values from the production yellow perch in this study to yellow perch maintained in low-density tank settings so were unable to determine if these same trends are apparent in yellow perch as well However based on our previous experience with fish hematological and plasma biochemical values there is an indication that these trends are occurring in yellow perch as well
Table 2 Hematological reference intervals for adult yellow perch (Perea flavescens) reared in a recirculation system
Analyte N Reference Interval Mean Stds1
PCV2 () 57 29-47 388 45
Plasma Protein (gdl) 57 60-82 67 06
Erythrocytes (x 106ml) 53 2160-3345 2737 0356
Leukocytes (ml) 53 52590-186490 113914 39086
Lymphocytes (ml)
Small 53 36800-153420 85630 31728
Large 53 3530-23 130 11602 5359
Neutrophils (ml) 53 1860-35950 12430 8837
Monocytes (ml) 53 670-12640 4252 2874
Thrombocytes (ml) 53 38270-118510 72972 21299 1Standard deviation 2Packed cell volume
International Journal of Recirculating Aquaculture Volume 5 June 2004 35
Hematology and Blood Chemistry of Yellow Perch (Perea flavescens)
Table 3 Plasma biochemical values for adult yellow perch (Percaftavescens) reared in a recirculation system
Analyte N Reference Interval Mean Stds1
Total Protein (gdl) 42 37-50 45 04
Albumin (gdl) 42 06-09 07 01
Globulin (gdl) 42 31-42 37 03
Creatinine (mgdi) 42 04-10 06 01
Total bilirubin (mgdi) 42 03-04 03 01
ALP2 (UI) 42 50-114 822 249
AST3 (UI) 42 2-29 85 64
Glucose (mgdi) 42 62-181 1000 350
Cholesterol (mgdi) 42 182-323 2440 330
Sodium (mEqI) 42 138-153 1470 40
Potassium (mEqI) 42 20-38 32 05
Chloride (mEqI) 42 119-133 1260 40
Calcium (mEqI) 42 86-120 103 13
Phosphorus (mEqI) 42 50-96 74 11
Magnesium (mEqI) 42 17-34 27 04 1 Standard deviation 2 Alkaline phosphatase 3 Aspartate aminotransferase (SGOT)
The blood cells present in the yellow perch were typical of teleost fish and included erythrocytes thrombocytes and leukocytes (Fig 1) Erythrocytes were oval to round with characteristic red cytoplasm and an elongate and centrally-located nucleus Immature erythrocytes or reticulocytes demonstrated a blue-purple tinge to the normal eosinophilic cytoplasm (Fig IA B C) The yellow perch had increased numbers of reticulocytes (included in the erythrocyte count) with approximately 7 to 10 per field at lOOx oil immersion compared to what we observe for most fish species The cause for the apparent reticulocytosis is not known but has been observed in other fish species exposed to elevated nitrite and nitrate (Grabda et al 1974 Hrubec et al 1996 2000 Hrubec and Smith 2000)
36 International Journal of Recirculating Aquaculture Volume 5 June 2004
Hematology and Blood Chemistry of Yellow Perch (Perea flavescens)
T bull middotmiddot ~~ - middot
N -
Figure I Characteristic blood cells from yellow perch reared in recirculation systems Blood smears were made with EDTA anticoagulated blood stained with Wrights Geimsa stain Cells are abbreviated as follows U - Large lymphocyte SL - small lymphocyte T - thrombocyte R - reticulocytes (immature erythrocyte) PC - plasma cell (activated lymphocyte) M- monocyte N-neutrophil The blue bar in frame A is Omm
International Journal of Recirculating Aquaculture Volume 5 June 2004 37
Hematology and Blood Chemistry of Yellow Perch (Percajlavescens)
The thrombocytes were slightly smaller than the erythrocytes (Fig IA) They had clear cytoplasm and were variable in shape being elongated pyriform oval or round Nuclear shape tended to follow cytoplasmic shape although oval and round thrombocyte nuclei occasionally were lobulated (Fig IB) as described for striped bass and tilapia (Hrubec et al 1996 2000)
Leukocytes made up the remainder of the cell types seen in the blood and included small and large lymphocytes neutrophils and monocytes No eosinophils or heterophils were observed Small lymphocytes were the smallest cell present with a rim of blue cytoplasm surrounding the round nucleus (Fig IA E F) Large lymphocytes had an abundant and darker blue cytoplasm and the nucleus was larger than observed in the small lymphocyte (Fig IA E) Plasma cells were occasionally observed with a classic open nucleus abundant dark blue cytoplasm and a clear cytoplasmic region adjacent to the nucleus presumably representing the Golgi as in mammalian plasma cells (Fig IC) Plasma cells were included in the large lymphocytes category for the differential counts
Neutrophils were the largest cell present in the blood (Fig ID E F) The cytoplasm of the neutrophil was a translucent grey containing no granules and infrequent vacuoles Cytoplasmic shape was round to angular as the cellular borders often appeared slightly adherent to adjacent erythrocytes distorting cellular shape Nuclear shape of the neutrophil varied from round to horseshoe shaped and frequently segmented into two prominent lobes connected by a thin nuclear bridge (Fig IF) Monocytes had abundant dark blue cytoplasm that was frequently vacuolated (Fig ID) The round to kidney-bean shaped monocyte nucleus was large with prominent chromatin clumping
Analysis of blood parameters can provide a wealth of information useful in analyzing the effects of disease and sub-optimal environmental conditions Providing reference intervals for healthy adult yellow perch reared in recirculation systems furnishes veterinarians and fish health professionals the foundation to develop diagnostic hematology for this species The number of studies that determine actual reference intervals for fish species is limited The majority of blood values determined for fishes are reported in the literature as a mean value with a standard deviation Historically reference intervals were determined as two standard deviations from the mean however this method is only valid when blood values follow a normal distribution It is incorrect to assume
38 International Journal of Recirculating Aquaculture Volume 5 June 2004
Hematology and Blood Chemistry of Yellow Perch (Percaflavescens)
that biological parameters are distributed normally therefore non-parametric methods should be used to accurately determine reference intervals (Reed et al 1971) Techniques to properly determine reference intervals have been established by the NCCLS (1992) and suggestions for their use and interpretation have been discussed (Lumsden 1998) As with mammalian species reference intervals need to be determined for different populations of fish within a single species as culture conditions and environmental variables affect blood values to the extent that they are outside the reference interval (Ram-Bhaskar and Srinivasa-Rao 1989 Hrubec et al 1996 1997ab 2000 2001) Although the reference range for some of the blood parameters appears large it is still possible to detect variation in hematologic values associated with pathological conditions (Hrubec et al 1997b and unpublished data)
Developing reference intervals is a necessary first step in determining which specific hematological changes can be associated with disease conditions As the field of fish hematology develops its usefulness to the aquaculture industry will increase Information derived by standardized non-lethal diagnostic assays will be needed to enhance the culture of yellow perch and other fish species Analysis of diagnostic blood samples can provide a means for early detection of infectious disease and assist in the identification of sub-lethal conditions affecting production performance This should allow for more specific timely and effective disease treatments in the future
ACKNOWLEDGEMENTS The authors wish to thank Mark Kidd of the Virginia Tech Aquaculture Center for his assistance with fish care and sampling
REFERENCES Grabda E Einszporn-Orecka T Felinska C Zbanyszek R
Experimental Methemoglobinemia in Rainbow Trout Acta Ichthyologica et Piscatoria 1974 4 43-71
Hrubec TC Smith SA Robertson JL Feldman B Veit HP Libey G Tinker MK Comparison of Hematologic Reference Intervals between Culture System and Type of Hybrid Striped Bass American Journal of Veterinary Research 1996 57 618-623
International Journal of Recirculating Aquaculture Volume 5 June 2004 3 9
Hematology and Blood Chemistry of Yellow Perch (Percajiavescens)
Hrubec TC Robertson JL Smith SA Effects of Temperature on Hematologic and Serum Biochemical Profiles of Hybrid Striped Bass (Morone chrysops x Morone saxatilis) American Journal of Veterinary Research 1997a 58 126-130
Hrubec TC Robertson JL Smith SA Effects of Ammonia and Nitrate Concentration on Hematologic and Serum Biochemical Profiles of Hybrid Striped Bass (Morone chrysops x Morone saxatilis) American Journal of Veterinary Research 1997b 58 131-135
Hrubec TC Smith SA Hematology and Plasma Chemistry Values for Production Tilapia ( Oreochromis hybrid) Raised in a Recirculation System International Journal of Recirculating Aquaculture 2000 J 5-14
Hrubec TC Cardinale JL Smith SA Hematology and Plasma Chemistry Reference Intervals for Cultured Tilapia ( Oreochromis hybrid) Veterinary Clinical Pathology 2000 29 7-12
Hrubec TC Smith SA Robertson JL Age Related Differences in Hematologic and Plasma Chemistry Analytes of Hybrid Striped Bass Morone chrysops x Morone saxatilis Veterinary Clinical Pathology 2001 30 8-15
Huffman PA Arkoosh MR Characteristics of Peripheral Blood Cells from Rainbow Trout Evaluated by Particle Counter Image Analysis and Hemocytometric Techniques Journal of Aquatic Animal Health 1997 9 239-248
Kelly AM Yellow Perch Culture in the United States Manna or Mania World Aquaculture 2000 31 4-17
Lumsden JH Normal or reference values Questions and Comments Veterinary Clinical Pathology 1998 27 102-106
Mallison JA 2000 A White Paper on the Status and Needs of Yellow Perch Aquaculture in the North Central Region North Central Regional Aquaculture Center Michigan State University E Lansing MI USA
Natt MP Herrick CA A New Blood Diluent for Counting Erythrocytes and Leukocytes of the Chicken Poultry Science 1952 31 735-738
40 International Journal of Recirculating Aquaculture Volume 5 June 2004
Hematology and Blood Chemistry of Yellow Perch (Percaflavescens)
NCCLS National Committee for Clinical Laboratory Standards 1992 How to Define Determine and Utilize Reference Intervals in the Clinical Laboratory Proposed Guidelines NCCLS Document C28-P Villanova PA USA
Nelson JA Mitchell GS Blood Chemistry Response to Acid in Yellow Perch (Perea flavescens) Comparison of Populations from Naturally Acidic and Neutral Environments Physiological Zoology 1992 65 493-514
Nelson JA Magnuson J J Chulkasem W Blood Oxygen Capacity Differences in Yellow Perch (Percaflavescens) from Northern Wisconsin Lakes Differing in pH Canadian Journal of Fisheries and Aquatic Sciences 1988 45 1699-1704
Ram-Bhaskar B Srinivasa-Rao K Influence of Environmental Variables on Hematology and Compendium of Normal Hematological Ranges of Milkfish Chanos chanos (Forskal) in Brackish Culture Aquaculture 1989 83 123-136
Reed AH Henry RJ Mason WB Influence of Statistical Method Used on the Resulting Estimate of Normal Range Clinical Chemistry 1971 17 275-284
Schmitz M 1999 Comparative Growth of All-Female Versus Mixed Sex Yellow Perch (Percaflavescens) in Recirculating Aquaculture Systems MS Thesis Virginia Tech Blacksburg VA USA
Toneys ML Coble DW Mortality Hematocrit Osmolality Electrolyte Regulation and Fat Depletion of Young-of-the-Year Freshwater Fishes under Simulated Winter Conditions Canadian Journal of Fisheries and Aquatic Science 1980 37 225-232
van den Heuvel MR Power M Richards J MacKinnon M Dixon DG Disease and Gill Lesions in Yellow Perch (Percaflavescens) Exposed to Oil Sands Mining-Associated Waters Ecotoxicology and Environmental Safety 2000 46 334-341
Wedemeyer GA Nelson NC Statistical Methods for Estimating Normal Blood Chemistry Ranges and Variance in Rainbow Trout (Salmo gairdneri) Shasta Strain Journal of the Fisheries Research Board of Canada 1975 32 551-554
International Journal of Recirculating Aquaculture Volume 5 June 2004 41
Hematology and Blood Chemistry of Yellow Perch (Percajlavescens)
Zinkl JG Avian Hematology In Schalms Veterinary Hematology (4th edition) Jain NC (Ed) 1986 Pages 256-260 Lippincott Williams amp Wilkins Philadelphia PA USA
42 International Journal of Recirculating Aquaculture Volume 5 June 2004
Hatchery and Grow-out Performance of Sunshine Bass and Backcross Hybrid Striped Bass in Recirculating Aquaculture Systems
SR Lindell1bull2 B Delbos1 R Perham1 J Goldman1 EM Hallerman3 TO Brenden3bull4
1 Fins Technology 15 Industrial Road Turners Falls MA 01376 USA
2Current address Marine Biological Laboratory Marine Resources Center 7 MBL Street Woods Hole MA 02543 USA
3Department of Fisheries and Wildlife Sciences (0321) Virginia Polytechnic Institute and State University Blacksburg VA 24061 USA
4Current address Institute of Fisheries Research University of Michigan 1109 N University Avenue Ann Arbor MI 41809 USA
Corresponding authors e-mail ehallermvtedu
Keywords striped bass performance aquaculture growth
International Journal of Recirculating Aquaculture 5 (2004) 43-54 All Rights Reserved copyCopyright 2004 by Virginia Tech and Virginia Sea Grant Blacksburg VA USA
International Journal of Recirculating Aquaculture Volume 5 June 2004 43
Performance of Sunshine Bass and Backcross Hybrid Striped Bass
ABSTRACT Previous research has suggested that backcross hybrid striped bass (BX sunshine bass female x striped bass male) perform as well as F 1 hybrid striped bass (sunshine bass white bass female x striped bass male) for many economically important traits We conducted trials to compare rearing and growth traits of selected backcross hybrid striped bass with hybrid striped bass (HSB) We spawned and reared larval BX fry in two hatchery cycles measured fry growth and performance and compared them to past performance of HSB fry We conducted a grow-out trial of commercially-available hybrid striped bass versus backcross hybrid striped bass in replicated tanks to phase II fingerling size (approximately lOOg) Compared to HSB in the hatchery phase backcross hybrid striped bass exhibited lower fertilization rate comparable swimbladder inflation rate shorter time-to-weaning lower survival comparable growth and comparable condition factor After 60 days HSB exhibited significantly better growth survival and feed conversion efficiency than BX However BX may have better potential market acceptance by virtue of having a lower condition factor appearing longer and less deep-bodied than HSB
INTRODUCTION Striped bass (Morone saxatilis) and its hybrids constitute a major sector of aquaculture in the United States with production of 105 million pounds in 2002 (Carlberg and Van Olst 2003) Commercially significant quantities of Morone stocks also are produced in Taiwan China and Israel Approximately 43 of Morone production occurs in tanks (Carlberg and Van Olst 2003) much of that in recirculating aquaculture systems (RAS) Private and government marketing experts estimate that US production could increase to 50 million pounds and $100 million in annual farm-gate revenue if market prices could be decreased only moderately (Halbrendt et al 1991) Production costs for HSB could be reduced by 12 if selective breeding can yield 20 faster growth rates (Losordo and Westerman 1994)
The majority of Marone production is not of striped bass but of its hybrids with white bass (M chrysops) because of their hardiness rapid growth rate and limited availability of female striped bass broodstock (reviewed by Harrell 1997) Further female WB are considered easier and more predictable to strip-spawn Hence most commercial production
44 International Journal of Recirculating Aquaculture Volume 5 June 2004
Performance of Sunshine Bass and Backcross Hybrid Striped Bass
is of sunshine bass the progeny of the white bass female x striped bass male interspecific cross Research has also been undertaken to evaluate the performance of second generation hybrids and backcrosses Several studies have suggested that the progeny of F 1 hybrid striped bass females backcrossed to striped bass males have merit for commercial production Jenkins et al (1998) compared the performance of backcross hybrids to F1 hybrid striped bass and striped bass to market size in a recirculating system At harvest no differences in growth rate or feed conversion were detected specific growth of BX was intermediate to those of the other stocks with survival lower Tomasso et al (1999) compared performance of F 1 and backcross hybrids between 20 and 90 grams for 56 days in tanks (Tomasso et al 1999) and observed similar survival growth and feed conversion rates among the hybrid types Detailed comparison of the hatchery performance of sunshine and BX hybrids is lacking We hypothesized that use of selected hybrid striped bass and striped bass for the backcross might yield a high-performance BX hybrid Should high performance be realized progressive fish farmers might utilize this approach by selecting the best F1 hybrid females from their own production stocks making the backcross by strip-spawning them and fertilizing the eggs with purchased milt from selectively bred striped bass males (Kerby 1983) thereby obtaining a high-performance production stock that because of selection on the maternal stock is suited to their particular farm conditions
In this study we evaluated the production potential of backcross (BX) hybrid striped bass (female sunshine bass x male striped bass) We compared the hatchery and grow-out performance of BX spawned from select broodstock and sunshine bass (HSB) of common genetic background Specifically we evaluated spawning success hatch rate growth survival and feed conversion efficiency through the first six months of life In order to benchmark our results we ran a trial in replicated tanks with HSB supplied by the most widely-used commercial source of fingerlings (Keo Fish Farms Keo AR USA) and compared their performance with our BX All fish were cultured within intensive controlled-environment recirculating aquaculture systems
International Journal of Recirculating Aquaculture Volume 5 June 2004 45
Performance of Sunshine Bass and Backcross Hybrid Striped Bass
MATERIALS AND METHODS In July 2001 we crossed 4 hybrid striped bass females to each of 4 striped bass males to produce 16 families of backcross hybrid striped bass Poor fertilization rates resulted in a low yield of fry from this spawn However there were enough fry to pool and conduct a pilot commercial-scale hatchery run Randomly-chosen samples from the resulting 4000 fingerlings were used for the grow-out trial
In October 2001 we spawned 3 female HSB with 2 male SB and eventually produced 7000 fingerlings While this was not enough to grow in commercial-scale systems we collected hatchery performance data to corroborate our JulyAugust experience with BX
Fertilized eggs were incubated in McDonald jars Upon hatch the larvae swam out of the hatching jar and into a 1900-L larval rearing tank Replicate larval rearing tanks were stocked with approximately 25 larvae per liter Tanks were maintained with recirculating water and surface oil-skimming pads for the first 5 to 7 days post-hatch until swim-bladder inflation was completed For the second week post-hatch larval rearing tanks were maintained static with gentle central aeration except for an exchange of about 30 of the tank water over the course of two hours each day During the second week post-hatch larvae were fed rotifers enriched with Algamac (Aquafauna BioMarine Inc Hawthorne CA USA) maintained at a density of 10ml By the end of the second week larvae were weaned from rotifers to Artemia nauplii By the end of the third week the larvae were typically weaned from enriched Artemia to artificial feed (Biokyowa Inc Girardeau MO USA) Weaned larvae were graded just once around 60 days post-hatch to remove the top 1 to 2 of larger fish responsible for cannibalism
In November 2001 we purchased lOg fingerlings that represent typical industry-standard HSB from Keo Fish Farms (Keo AR USA) These HSB closely matched the size and weight of our BX from the July spawn for the grow-out trial BX and HSB fingerlings were each stocked separately in triplicate 1900-L round tanks connected to the same recirculating system and reared at 23degC and a salinity of 1-3 ppt All six tanks were similarly stocked initially (approximately 1 kgm3) Fish were offered 80 of their expected ration via belt-feeders and hand-fed to satiation twice a day Approximately every 3 weeks length and weight samples were taken from a randomly-chosen 15 of each tanks
46 International Journal of Recirculating Aquaculture Volume 5 June 2004
Performance of Sunshine Bass and Backcross Hybrid Striped Bass
population At the conclusion of the project the tanks reached typical commercial densities of 5 to 9 kgm3bull
We quantified reproductive and hatchery performance of the three groups including fertilization rate swimbladder inflation rate days to weaning onto artificial feed (ie date of first ingestion to date that gt90 ingested artificial feed) survival estimates to approximately 60 days after hatch and to the end of the study feed conversion rate and monthly average weight and length The trial continued until mid-February 2002 when the HSB averaged approximately lOOg Results from previous years hatchery efforts with HSB using similar rearing protocols were used for comparative purposes
Both the hatchery and grow-out systems employed water recirculation technology including drum-filters fluidized-bed biofilters oxygenation ozonation and automated pH and temperature control that maintained high water-quality standards throughout the trials
Differences in fish weight between the hybrid types were analyzed as a repeated-measures general linear mixed model Residual (restricted) maximum likelihood was used to estimate the model parameters Initial fish biomass in each of the tanks and the amount of feed provided to each of the tanks were included in the model as covariates to assess the influence of these concomitant variables on differences in weight A first-order autoregressive covariance structure was assumed for the repeated-measurements of fish weight
Differences in fish survival at the end of the grow-out trial were analyzed as a general linear model with tanks serving as a blocking factor Because fish survivalmortality is a binary response and thus will violate an assumption of normality the significance of the test comparing survival between the hybrid types was obtained by randomization (number of randomizations= 1000) whereby the F-statistic of the original test was compared to F-statistics obtained by randomly allocating the survival mortality data to the different hybrid types The Type-I error rate for all statistical tests was set equal to 005
International Journal of Recirculating Aquaculture Volume 5 June 2004 47
Performance of Sunshine Bass and Backcross Hybrid Striped Bass
Table 1 Comparison of hatchery traits of backcross (BX) and Fl hybrid (HSB) striped bass for traits of economic interest
Traits of interest BX-HSB BX-HSB HSB HSB HSB
Female parent strain1 AR ARMD AR AR AR
Male parent strain1 MD FL MD FL MD MD FL MD Canada
Spawn date Oct-01 Jul-01 Mar-01 Oct-00 Jan-99
Fertilization 32 22 53 57
Swimbladder inflation 90 50 98 95
Weaning start (DAH)2bull3 24 21 17 22
Weaning end (DAH4 33 32 37 38
Mean wt (g) at 60 DAH 042 052 042 05
Survival to 60 DAH 7 740 104
Mean L (mm) at 30 DAH 133 11 1225
Mean L (mm) at 36 DAH 139 167
Mean L (mm) at 75 DAH 367 404 452
Mean Wt (g) at 75 DAH 074 081 12 0825 11
Condition factor at 1g 123E-05 118E-05 1Strain abbreviations AR=Arkansas R MD=Maryland FL=Florida 2DAH=Days after Hatch 3Weaning start marks the first introduction and ingestion of dry feed to replace live feeds 4Weaning end denotes the time when the transition to dry feeds is complete and live feeds are no longer utilized
RESULTS
Hatchery Trial Results A summary of performance for hatchery traits of production interest for BX and HSB is presented in Table 1
The fertilization rate for the BX eggs was lower than that which we typically found with HSB (22-32 vs 55) and considerably lower than our experience in 2000 when we conducted fertilization trials with BX (80)
Swimbladder inflation rate ranged from 50 in the first hatchery run to 90 in the second run We attribute the low rate in the first run to
48 International Journal of Recirculating Aquaculture Volume 5 June 2004
Performance of Sunshine Bass and Backcross Hybrid Striped Bass
surface-film and system management problems We showed in the second run that swimbladder inflation in BX was comparable to that typically attainable (gt90) for Morone fry
Time-to-weaning onto dry diets was shorter (10 days versus 18 days) and earlier (day 33 versus day 38) for BX than for HSB Survival of BX to 60 days after hatch (7) was lower than expected on the basis of previous experience with HSB (gt10) Mean weights for BX at 60 days after hatch in two hatchery runs (052 and 042g) was similar to those for HSB (042 and 05g) However HSB exhibited greater mean weight than BX at 75 days after hatch (l04 vs 077g)
Condition factor (K) of BX (123 + 009) was not significantly different from those of HSB (119 + 005) or striped bass (l13 + 003) at 1 gram mean weight
Frequencies of deformities for BX (lt2) were lower than those in earlier reports Bosworth et al (1997) reported deformities in 8 of BX and 4 ofHSB
Grow-out Trial Results Overall there was not a significant difference in weight between the hybrid types (F = 606 df = 13 P = 00907) however as evidenced in
100
80
60
40
20
--+- BX - Overall -0- HSB - Overall -ltgt- BX - Individual Tanks A middot middot middotbullmiddotmiddot middot HSB - Individual Tanks fi
fi ~o
12 Dec 2001 3 Jan 2002 24 Jan 2002 12 Feb 2002
Date Figure 1 Meanfish weight(plusmn 2 SE) at each time period for backcross hybrid striped bass (BX) and hybrid striped bass (HSB) Also shown is meanfish weight at each time periodor groups in individual tanks
International Journal of Recirculating Aquaculture Volume 5 June 2004 49
Performance of Sunshine Bass and Backcross Hybrid Striped Bass
Figure 1 there was a significant interaction on fish weight by hybrid type and time (F = 5157 df = 1587 P lt 00001) Using the slicing option available in SAS (SAS Institute 1999) we tested for differences in weight between the hybrid types for each time period and found that although weights of HSB and BX were not significantly different during the first two measurement periods (Time 1 F = 027 df = 1587 P = 06032 Time 2 F = 036 df = 1587 P = 05496) the hybrid types did differ in weight during the last measurement periods Specifically HSB were significantly heavier than BX on the 24th of January 2002 (F = 1061 df = 1 587 P = 00032) and the 12th of February 2002 (F = 3788 df = 1587 P lt 00001) Overall HSB had a specific growth rate of 268 per
Table 2 Mean weights of backcross hybrid striped bass (BX) and hybrid striped bass (HSB) over the course of a 3-month growth trial
Date BXTank5
Wt(g) SE
112101 1228
BXTank6 Wt(g) SE
1201
BX Tank 12 Wt(g) SE
1274
HSB Tank 13 HSB Tank14 HSB Tank 15 Wt(g) SE Wt(g) SE Wt(g) SE
1180 1016 1088
1211201 1744 102 1778 095 1658 096 1798 109 1752 118 1704 109
1 302 27 60 1 38 28 76 155 27 04 154 3306 157 3424 149 3414 211
1 2402 4196 252 4424 207 4882 299 6344 263 6192 326 6432 362
212102 6332 317 6763 334 6912 299 9474 473 9553 452 10500 388
Table 3 Comparison of survivalfeed conversion ratio (FCR) and condition factor at 60 grams for backcross hybrid striped bass (BX) and hybrid striped bass (HSB)
Cross Tank
Starting
Ending
Survival
BXS
160
136
85
BX 6 BX 12 HSB 13 HSB 14 HSB 15
160
138
86
161
137
85
178
177
99
179
173
97
180
179
99
Starting Biomass (g) 1964 1922 2051 2100 1819 1958
Ending Biomass (g) 8612 9334 9469 16770 16526 18795
Feed Fed(g) 12106 12135 11447 18041 17805 20463
FCR 182 164 154 123 121 122
Condition Factor 168E-05 166E-05 169E-05 194E-05 193E-05 208E-05
SE 353E-07 337E-07 424E-07 255E-07 327E-07 845E-07
50 International Journal of Recirculating Aquaculture Volume 5 June 2004
Performance of Sunshine Bass and Backcross Hybrid Striped Bass
day while BX had a specific growth rate of 205 per day Neither of the covariates included in the model were found to have a significant effect on weight differences (initial tank biomass F = 142 df = 1587 P = 02332 amount of feed F = 005 df = 1587 P = 08165)
Performance regarding key economic traits-survival feed conversion efficiency and condition factor-are summarized in Table 3 At the end of the grow-out trial survival of HSB was significantly greater than that of BX (F = 6216 df = 1 1014 P lt 00001) Feed conversion ratio was better for HSB (122) than for BX (166) Condition factors for BX were lower than those for HSB (l68 vs 198) meaning that BX appeared longer and less deep-bodied than HSB
DISCUSSION Our data showed that F1 HSB performed as well or better than BX for a range of hatchery- and grow-out-related traits
Hatchery traits Fertilization rates for backcross lots were approximately half that for HSB There was a wide variance for fertilization and hatch rates of eggs from HSB females Some of this variance may be due to differences in hatchery protocols (different hormone injections used strip vs tank spawning) at the commercial hatcheries where the data were collected (TIJ Smith personal communication) Poor hatch rates also may be attributable in part to hybrid breakdown that is to developmental incompatibilities among the genomes of the respective species when coadapted gene complexes are broken up at meiosis in the F1 (Hallerman 2003)
In the hatchery trial we hypothesize that the low swimbladder inflation rate for our J~ly fry resulted from offering first feed to the BX too early When rearing HSB and SB fry we typically wait until the yolk sac has been largely resorbed and the fry mostly have inflated their swimbladders before we introduce live feed This is because live feed can cause an oily film on the water surface that interferes with a frys successful ingestion of air bubbles necessary to inflate the swimbladder (Chapman et al 1988) The timing of swimbladder inflation varies with fry type and temperature with HSB typically inflating between 3 and 6 days after hatch and SB 6 to 9 days after hatch BX fry inflate their swimbladder at an intermediate time 5 to 8 days after hatch (DAH) Since for the July
International Journal of Recirculating Aquaculture Volume 5 June 2004 51
Performance of Sunshine Bass and Backcross Hybrid Striped Bass
spawn we introduced feed into their tanks at the time prescribed for HSB (at 5 DAH) BX fry may have had a reduced opportunity to inflate their swimbladders because of interference by a surface film with air contact In the October spawn we monitored swimbladder inflation more carefully and introduced live feed on day 7 after almost 90 of swimbladders were inflated The low swimbladder inflation rate in the July hatchery run of BX may have had a direct impact on survival Larvae without inflated swimbladders expend more energy swimming exhibit reduced growth rates are less tolerant of stress and often sink to the tank bottom and die (Van Heukelem et al 2000)
BX were weaned more quickly and earlier onto dry diets than HSB which may have helped contribute to their ability to match the size and weight of HSB at 60 DAH Earlier weaning has economic merit since dry diets are generally cheaper and easier to feed than brine shrimp
Grow-out traits After 60 days post-hatch the growth and other performance differences between BX and HSB became more evident HSB exhibited significantly better growth survival and feed conversion ratios
We hypothesized that backcross hybrid striped bass might grow as fast or faster than the standard commercially-available F 1 hybrid striped bass if high-performance HSB females were selected as broodstock Our data regarding performance in intensive tank systems did not support this hypothesis Rather our observations accord with the classical view that the high performance of some interspecific hybrids is largely due to heterosis and that because the heterosis shown by an F 2 or backcross hybrid is only half that shown in an F1 (Falconer and Mackay 1996 p 257) that advanced generation hybrids would not perform as well as F1
hybrids Indeed F 2 HSB previously showed low hatch rates low larval survival and high variability of growth rate (Smith and Jenkins 1984 Smith et al 1985) Our results suggest that the heterosis expressed in HSB for growth and performance was greater than the selective breeding advantage we employed by crossing high performance HSB females with male striped bass Apparently the additive genetic variance contributed by the HSB and striped bass selected for size-at-age could not make up for the loss of dominance variance
BX may have better potential market acceptance by virtue of having a lower condition factor appearing longer and less deep-bodied than HSB more
52 International Journal of Recirculating Aquaculture Volume 5 June 2004
Performance of Sunshine Bass and Backcross Hybrid Striped Bass
like striped bass that are more familiar in many markets Fins Technologys market experience has shown that the premium-priced live markets prefer longer leaner fish such as the backcross There is the possibility that because of later maturity backcross hybrid striped bass may grow to larger sizes than hybrid striped bass This is attractive because there is an unserviced demand for larger (1 kg+) fish that can provide portion-controlled 7-9 ounce fillets for the restaurant and retail markets
ACKNOWLEDGEMENTS This project was supported by US Department of Agriculture-Small Business Innovation Research Program Phase I Grant no 2001-00373 EMH is supported by the USDA-CSREES Hatch Program and the Commonwealth of Virginia Aquaculture Initiative
REFERENCES Bosworth BG Libey GS Notter DR Egg Larval and Fingerling
Traits of Crosses among Striped Bass White Bass and their Fl Hybrids Aquaculture 1997 154 201-217
Carlberg J Van Olst J US Production and Sales of Hybrid Striped Bass (1987-2002) 2003 httpaquanicorgsbgaHSBversion5ppt
Chapman DC Hubert WA Jackson UT Influence of Access to Air and of Salinity on Gas Bladder Inflation in Striped Bass Progressive Fish-Culturist 1988 50 23-27
Falconer DS Mackay TFC 1996 Introduction to Quantitative Genetics Fourth Edition Longman Group Ltd Harlow Essex UK
Halbrendt CK Wirth FF Vaughn GF Conjoint Analysis of the Mid-Atlantic Food-Fish Market for Farm-Raised HSB Southern Journal of Agricultural Economics 1991 23 155-163
Hallerman EM Coadaptation and Outbreeding Depression In Po_pulation Genetics Principles and Applications for Fisheries Scientists Hallerman E (Ed) 2004 American Fisheries Society Bethesda MD USA
Harrell RM Hybridization and Genetics Striped Bass and Other Morone Culture In Harrell RM (Ed) 1997 Pages 217-234 Elsevier Science Amsterdam
International Journal of Recirculating Aquaculture Volume 5 June 2004 53
Performance of Sunshine Bass and Backcross Hybrid Striped Bass
Jenkins WE Heyward LD Sr Smith TIJ Performance of Domesticated Striped Bass Marone saxatilis Palmetto Bass and Backcross Hybrid Striped Bass (Sunshine Bass Female x Striped Bass Male) Raised in a Tank Culture System Journal of the World Aquaculture Society 1998 29 505-509
Kerby JH Cryogenic Preservation of Sperm from Striped Bass Transactions of the American Fisheries Society 1983 112 86-91
Losordo TM Westerman P An Analysis of Biological Economic and Engineering Factors Affecting the Cost of Fish Production in Recirculating Aquaculture Systems Journal of the World Aquaculture Society 1994 25 193-203
SAS Institute 1999 The SAS System for Windows version 82 SAS Institute Cary NC USA
Smith TlJ Jenkins WE Controlled Spawning of Fl Hybrid Striped Bass (Marone saxatilis x M chrysops) and Rearing of F2 Progeny Journal of the World Mariculture Society 1984 15 147-161
Smith TlJ Jenkins WE Snevel JF Production Characteristics of Striped Bass (Marone saxatilis) and Fl - F2 hybrids (Marone saxatilis and M chrysops) Reared in Intensive Tank Systems Journal of the World Mariculture Society 1985 16 57-70
Tomasso JR Kempton CJ Gallman A Smith TlJ Comparative Production Characteristics of Sunshine Bass and Sunshine Bass x Striped Bass in Recirculating-Water Systems North American Journal of Aquaculture 1999 61 79-81
Van Heukelem WF Harrell RM Hughes SG Lindell SR Friedmann BR Optimal Conditions for Swimbladder Inflation in Striped Bass Larvae Reared in Intensive Systems Northeast Regional Aquaculture Center Publication No 00-006 (2000) 5 pages
54 International Journal of Recirculating Aquaculture Volume 5 June 2004
Book Review
Fjofish apd Shellfish Bacteriology Mapua) Techpjques apd Procedures KA Whitman with contributions by NG MacNair
Iowa State Press (Blackwell Publishing Professional) Ames IA USA (2004) 288 pages ISBN 0813819520 US $4999
Reviewed by Rocco C Cipriano United States Geological Survey National Fish Health Research Laboratory 11649 Leetown Road Kearneysville WV 25430 USA E-mail rocco_ciprianousgsgov
Despite the fact that several good texts have been published regarding the description and nature of bacterial pathogens in aquatic animals there remained a need for a comprehensive yet practical guide devoted to techniques and procedures used for bacterial identification Diagnosis and detection of fish and shellfish pathogens often requires reliance upon standard microbiological media tests and reagents for some bacteria but more specialized assays are required for many aquatic pathogens In the latter case the products necessary for such assays are not commercially available and must be produced in aquatic animal diagnostic facilities from their basic ingredients Often therefore the compositions of differential media and the conduct of certain tests for the primary isolation or detection of specific aquatic pathogens are only available by referencing the general body of published scientific literature Hence until now there has not been a single-source shelf-volume that combines standard microbiological procedures used for routine detection and identification of medically important bacteria with the specialized needs of the fisheries profession This manual however helps to fill that void
The manual stands as a reference suitable for professional aquatic biologists with backgrounds in microbiology veterinarians and students of aquatic animal health Its strength lies in its coverage of the subject matter regarding culture-based diagnosis and identification of bacteria associated with finfish bivalves and lobsters Sections on
International Journal of Recirculating Aquaculture 5 (2004) 55-56 All Rights Reserved copyCopyright 2004 by Virginia Tech and Virginia Sea Grant Blacksburg VA USA
International Journal of Recirculating Aquaculture Volume 5 June 2004 55
Book Review FiQish and ShelJfish Bacteriology Manualmiddot Techniques and Procedures
aseptic collection and shipment of samples qualitative and quantitative procedures for bacterial isolation staining techniques media and standard biological tests used for the cultivation and phentotypic characterization of pathogenic bacteria and antibiotic sensitivity testing provide sound background for the student or novice practitioner Particularly beneficial for anyone who is not experienced with aquatic microbial pathogens is the section listing principal organs media and appropriate incubation temperatures to be used as the most probable sources of isolation for the specific bacteria
More experienced professionals will find it helpful and convenient to have the descriptions and interpretations of differential media (eg Coomassie Brilliant Blue Agar for Aeromonas salmonicida Rimler-Shotts Agar for Aeromonas hydropila Cytophaga Agar Shieh and TYES for Flavobacterium spp and Edwardsiella ictaluri Agar and various other media for Renibacterium salmoninarum) listed in a single source The major identifying criteria that phenotypically characterize selected bacterial pathogens are also described in tabulated form Specialized tests such as the SIF test to detect covert infections nurse culture techniques for enhanced bacterial growth and assays for public health indicator organisms in bivalves are documented Sections covering serology immunoassay and non-cultured based molecular assays (eg polymerase chain reaction) are also presented but are not as completely summarized as those for bacterial isolation In summary the nature of this manual makes it appropriate for frequent use as a practical laboratory guide
56 International Journal of Recirculating Aquaculture Volume 5 June 2004
Subscription Information
International Journal of Recirculating Aquaculture
A publication ofVirginia Tech and the Virginia Sea Grant College Program
IJRA presents the latest developments in RAS-related research focusing on the areas of
Food Quality Pathology
Food Safety
Aquatic Medicine Breeding amp Genetics Waste Management
FishShellfish Growth amp Nutrition Recirculating Systems Mgmt Marketing amp Economics Water Conservation
Dont miss an issue of this informative peer-reviewed journal Subscribe now using your credit card by calling 540-231-2075 or by printing out a form at wwwcfastvteduijrahtml If you prefer you can also mail this form to the address below along with a check or money order
Name ----------------~ Address ----------------Line2 ------------------City ____________ State __ _ Country Postal Code ___________ _ Phone Fax -------- --------e-mail-----------------check _ 2 year ($25 US)
International Journal of Recirculating Aquaculture Food Science amp Technology Building (0418)
Virginia Polytechnic Institute and State University Blacksburg VA 24061
phone (540) 231-2075 fax (540) 231-9293 e-mail IJRAvtedu
International Journal of Recirculating Aquaculture Volume 5 June 2004 57
~ International Journal of ~ Recirculating Aquaculture A publication of Virginia Tech and the Virginia Sea Grant College Program
Instructions for Authors The International Journal of Recirculating Aquaculture (IJRA) encourages the submission of original high-quality papers on research in all aspects of recirculating aquaculture Papers will be peer-reviewed and evaluated for scientific merit relevance and for their usefulness in promoting the advancement of recirculating aquaculture Complete coherent projects are preferred Any related papers submitted together must be thoroughly cross-referenced All papers must be original meaning that the data and the information presented must be the work of the authors and can not have been published elsewhere Dual publication of a paper or data is possible only through the permission of the Editors of both journals THERE ARE NO PAGE CHARGES for IJRA submissions
INITIAL MANUSCRIPT SUBMISSION Manuscripts should be sent to Ms Angela Correa Managing Editor by mail using the address listed at the end of these instructions or by e-mail to (ijravtedu) Submit four (4) copies of each manuscript if regular mail is used All manuscripts must be in English Dot matrix type is not acceptable and all such submissions will be returned without review Each submission must include a cover letter stating that the paper contains original research and that the information has not been published elsewhere E-mailed submissions must be saved in doc format Be sure to include the names of colleagues who have already reviewed the work presented IJRA has two categories for submission 1 Articles which are complete in-depth scientific studies and 2 Notes which are short papers of limited scope Articles and notes will be critically reviewed by two or three experts as well as by the Managing Editor Submissions may be returned without peer review in cases where the Managing Editor determines that they are inappropriate for the journal of poor quality poorly written or fail to follow the journals style format
PREPARATION OF MANUSCRIPTS IJRA uses the latest editions of Websters New International Dictionary and Websters New Collegiate Dictionarv for standard spellings and word definitions All spelling will be in American English Foreign or science-related terminology that is unfamiliar and does not appear in these dictionaries will require an accompanying definition Acceptable scientific and common names of fishes are listed in A List of Common and Scientific Names of Fishes from the United States and Canada published by the American Fisheries Society Common names may be used throughout each paper but must be accompanied by a full scientific name when they first appear in a paper The author must use the full common name eg yellow perch not perch All foreign language words should be italicized in the manuscript
In the manuscript number each page sequentially and include the senior authors name next to the page number (eg Page 4 Jahncke) on each page Single-space all typed material including references Type size in the body of the text should be no larger than 12pts and no smaller than 10 pts Subsection headings should also be italicized in the manuscript Spell out one-digit numbers except when they are used with units of measure - eg six ponds 7 days
International Journal of Recirculating Aquaculture Volume 5 June 2004 59
Spell out any number that begins a sentence When two numbers occur sequentially in the text one of the numbers must be spelled out- eg In 1987 fifty fish were stocked Use commas in numbers of 1000 or more Use the 24-hour clock to describe time- eg 1300 not 100 pm
Keep footnotes to a minimum and number them sequentially throughout the paper All units of measurement must be reported via the metric system except in special circumstances (eg horsepower) Standard scientific abbreviations and symbols may be used without definition If the use of a symbol could cause confusion define the symbol the first time it is used On the final draft of a paper that has been accepted for publication Greek letters or other extraneous symbols that do not appear on a keyboard the name of the symbol should be noted where the symbol is used to help eliminate prepress errors Parts per million or milligrams per liter can be
-1 reported as either ppm or mgI but not as mgI
Commonly used aquaculture jargon can be used without defining the term - eg fry fingerling hapa Less commonly used jargon may also be used but terms should be defined the first time they are used Jargon from fields outside of aquaculture should also be defined the first time they are used Always place a zero to the left of a decimal point if the number is less than one this includes probability values - eg P = 005 not P = 05
COMPONENTS OF THE MANUSCRIPTS Articles and notes should include a title names of authors and their addresses abstract introduction materials and methods results discussion (or a combined results and discussion) conclusion (rarely) acknowledgements (if any) references figures and tables in that order Each section should start on a new page
Title - The title should accurately reflect the contents of the paper Brief concise titles are encouraged The title page must include the name(s) of the author(s) and all addresses
Abstract - The abstract should be a concise highlight of the results and conclusions Methodology should not be abstracted unless it is necessary to explain the results or unless the paper describes a new technique Abstracts should be less than 300 words
Introduction - The introduction should explain why the paper was written and why it should be read The introduction should condense the relevant information in the field that led the author to do the research The introduction is not a complete literature review and only the most relevant references should be cited The introduction should also contain a statement that describes the purpose or objective of the paper
Materials and Methods - The underlying goal of this section is to describe what was done so that others can repeat the experiment If previously published papers described a technique that was used they can be cited to prevent unnecessary repetition If the technique or process was modified the modification must be described so that others can repeat the process Experimental designs can be explained by use of figures if they will help clarify what was done If the experiment was a complicated one with many subparts subsections may be used to describe each subpart
Results - This section describes the data Proper use of tables and figures can simplify and help explain the results Statistical analysis of data is necessary unless differences are so obvious that statistical analysis is superfluous Although probability values of 005 and 001 are traditionally used each author is free to choose his or her own level of significance
60 International Journal of Recirculating Aquaculture Volume 5 June 2004
Discussion - This section should interpret the results and compare the results from this experiment to those found in similar research The section can also be used to speculate about the results to provide reasons for the trends and to suggest new ideas that can advance our understanding about aquaculture This section should not be a literature review section that merely compares results among several papers
Results and Discussion - Results and discussion sections can be combined In most cases this leads to a better paper because the integration of these sections leads to a more meaningful interpretation of data
Conclusion - This section should be used only when the results of an experiment lead to an unequivocal interpretation
Acknowledgements - This section should be used to thank organizations that supported the research monetarily and individuals who assisted in the research or preparation of the paper This section includes manuscript number designations for those institutions that assign such numbers
References - Select references with great care Unless the paper includes a literature review there is no need to reference every paper written about a subject Use only the most important ones
Figures and Tables - All figures andtables go after the references Figures always go before tables
Section headings (eg Materials and Methods) should be capitalized and in bold type Secondary headings should be balded and go flush left Tertiary headings are incorporated into the first paragraph of that subsection Tertiary headings are italicized and separated from the text by a double dash
In the text references are cited in one of two ways 1 Swingle (1959) evaluated two species of tilapia or 2 pond culture in Alabama began in the 1950s (Swingle 1959) When there are three or more authors list only the first in a citation and follow that with et al eg Smitherman et al (1983) reviewed catfish breeding work at Auburn University If the name of an institutional author is long it can be abbreviated in a citation eg Food and Agriculture Organization of the United Nations may be abbreviated as FAO When several citations are used in a single entry they are listed chronologically If you are citing two papers that were written by the same author(s) the name only has to appear once per citation followed by the years that designate the different papers Separate the years with a comma If you are citing two authors you must separate the citations with a semicolon (Smith 1975 1976 Jones 1976)
In the reference section the reference list is strictly alphabetical by last name of the senior author and then by initials if two authors have identical last names If an author has written more than one paper the following format should be followed All single authored papers go first followed by co-authored papers and then the papers that were written by three or more authors If an author has written more than one single-authored paper the papers are listed chronologically If an author has written more than one co-authored paper they are listed alphabetically by the second authors last name If a tandem has authored two or more papers the order is chronological Papers written by the same group of three or more authors should be listed chronologically
International Journal of Recirculating Aquaculture Volume 5 June 2004 61
The following format will be used when referencing various works
PAPERS Single-author papers
McGinty AS Effects of Size at Stocking on Competition and Growth of All-Male Tilapia Hybrids Journal of the World Aquaculture Society 1985 16 52-56
Multiple-author papers Tave D Smitherman RO Predicted Response to Selection for Early Growth in Tilapia nilotica Transactions of the American Fisheries Society 1980 109 439-445
If an author has published two or more papers in the same year follow the years with a letter to differentiate them eg Smith 1988a 1988b Use issue numbers only when each issue starts out with page 1 If pagination is consecutive throughout the volume omit the issue number Spell out journal names in their entirely without abbreviations
Papers in proceedings or in edited volumes Nicholson LC Woods LC Ill Woiwode JG Intensive Culture Techniques for the Striped Bass and its Hybrids In Culture and Propagation of Striped Bass and Its Hybrids Harrell RM Kerby JH Minton RV Eds 1990 American Fisheries Society Bethesda MD USA
Books and reportspublications from governmental or non-governmental bodies
Lovell T 1989 Nutrition and Feeding of Fish Van Nostrand Reinhold New York NY USA
Food and Agriculture Organization of the United Nations (FAO) Fisheries Department 1997 Review of the State of World Aquaculture No 886 FIRlC886 FAO Rome Italy
Theses and Dissertations
Easter CC 1992 Water Chemistry Characterization and Performance of a Recirculating Aquaculture System Producing Hybrid Striped Bass Masters thesis Virginia Polytechnic Institute and State University Blacksburg VA USA
Websites
Federation of European Aquaculture Producers (FEAP) European Eel Production (httpwwwfeaporgeelshtml) 2002
Page numbers for proceedings books theses and dissertations are unnecessary Government publications should be treated as if they were books but document numbers must be included THE ACCURACY OF REFERENCES IS THE SOLE RESPONSIBILITY OF THE AUTHORS MAKE SURE THAT CITATIONS AND REFERENCES MATCH
Tables - When creating a table decide what the purpose of the table is and what points are important then organize the table so that the main features can be easily understood The table heading should provide sufficient information for the table to be understood as an entity Keep footnotes to a minimum Each table goes on a separate page Tables must be camera ready TABLES WILL BE PRINTED AS IS AND WILL NOT BE TYPESET Figures - List all figure captions on separate pages Original artwork doesnt have to be submitted when a paper is first submitted for review but original artwork must accompany the final revised manuscript Good quality photocopies are acceptable when a manuscript
62 International Journal of Recirculating Aquaculture Volume 5 June 2004
is submitted for review Graphs and original artwork must be printed with a laser printer or done in pen and ink Dot-matrix figures are not acceptable Original artwork or high-contrast photographs are acceptable Label all figures on the back with a soft pencil name of senior author paper title and figure number
Photographs - Should be on glossy paper with good contrast Do not glue pictures to cardboard Color photographs can be printed but the additional cost of printing them will be charged to the author Label all photos on the back with a soft pencil name of senior author paper title and figure number
FINAL REVISED MANUSCRIPTS If using the mail submit two copies of the final revised manuscript including original artwork Submit either the original pen-and-ink drawings or laser-printed versions of the drawings In addition submit the manuscript on a disk (CD preferable) or by e-mail On the disk write the brand name of the computer or word processor the word processing program that was used (should be Microsoft Word) the title of your article and the file name NOTE Disk and hard copy must agree In case of discrepancies it is the policy of IJRA to follow hard copy An electronic version of the completed manuscript is needed in order to publish AUTHORS MAY NOT RECEIVE PAGE PROOFS Proofreading will be done by the Production Office of IJRA using the revised final version of the manuscript Therefore authors must be especially careful that no errors exist in the final revised version because in most cases no changes are possible after it is submitted
REPRINTS The senior author will receive two copies of the journal and a pdf file of the article for distribution and reprinting purposes The junior author(s) will also receive two copies of the journal issue These are sent several weeks after the journal is published and in circulation Requests for the pdf format of the article can only be made by the corresponding author
COPYRIGHT amp PERMISSIONS For permission to reprint articles that have appeared in IJRA please contact IJRA Copyright amp Permissions Food Science amp Technology Building (0418) Virginia Tech Blacksburg VA 24061 USA
COPYRIGHT TRANSFER If your manuscript is accepted for publication copyright ownership must be officially transferred to IJRA The Editors acceptance letter will include a form fully explaining this The form must be signed by all authors and the original returned to the Editor at this time Failure to return the copyright form in a timely fashion will result in delay in publication
Send your submissions to International Journal of Recirculating Aquaculture
AI Correa Managing Editor 27-B Food Science and Technology Building (0418) Virginia Polytechnic Institute and State University Blacksburg VA 24061 USA
If you have any questions please feel free to contact us Phone (540) 231-2075 Fax (540) 231-9293 e-mail ijravtedu
International Journal of Recirculating Aquaculture Volume 5 June 2004 63

Fillet Yields ofTilapia (Oreochromis)
(Harvey 2000) tilapia represents the second largest import of finfish into the United States on a live weight and value basis trailing only Atlantic salmon Hence there is ample evidence of a market for tilapia
Tilapia cannot survive in low ambient temperatures (Phipippart and Ruwet 1982) and therefore except for the southernmost regions they cannot be produced year-round in ponds in North America Production costs of tilapia raised in ponds have been estimated to range between $088 and $132kg (Fitzsimmons and Posadas 1997) compared to an estimated production cost of $279kg for recirculating aquaculture systems (Losordo and Westerman 1994) Because of the significantly higher cost of indoor temperature-controlled production domestic producers generally cannot compete economically with foreign pond-raised processed tilapia products which are relatively inexpensive to ship However they can compete for the live tilapia market due to the challenges and costs associated with transporting live fish
Many wholesalers require a minimum size for live tilapia producers report both 340 and 450 g (three-quarters and one pound) as minimum desired weights Producers are tempted to retain and grow out further fish that are too small to be marketed as live fish However research conducted at Virginia Tech indicates that as tilapia mature both the growth rate and feed-conversion efficiency decrease dramatically (Kirkup et al 2000) and that these decreases are primarily dependent on age rather than either size or culture conditions Therefore it might be more economical to fillet substandard fish rather than allowing these poor performers to grow to live-market size
Tilapia fillet yields are of interest to domestic producers for several reasons First fillet yield can be used to establish the value of live tilapia once the market price and processing handling and carcass disposal costs are known Secondly fillet yield and variation are of interest to food processors and restaurateurs who are interested in a specific size fillet or portion
In the spring and early summer of 1999 an experiment was conducted to investigate the effects of different temperature and feeding rates upon the growth and feed conversion efficiency of Rocky Mountain white tilapia As a result of the experiment there was large variation in size length and weight among the fish in the various treatments At the conclusion of the experiment the fish were weighed measured sexed filleted and the fillets were weighed
International Journal of Recirculating Aquaculture Volume 5 June 2004 21
Fillet Yields of Tilapia (Oreochromis)
MATERIALS AND METHODS The fish used for the experiment are commonly called Rocky Mountain White Tilapia although a best guess is that they are a white inter-specific species of the genus Oreochromis primarily 0 niloticus 0 aureus and 0 mossambicus This hybrid has been selectively bred at Blue Ridge Aquaculture Inc (Martinsville VA USA) for its color and growth rate The white hybrids are desirable in the live fish market because of their generally attractive external appearance This hybrid grows rapidly and has other physiological attributes that make it well suited to culture in high-density aquaculture systems Although predominantly white the fish ranged in color from a bright white to a bluish and golden white to a few that were colored a reddish brown As fry the fish were given methyltestosterone mixed with their feed to chemically sex reverse the females Prior to delivery to Virginia Tech the fish were graded twice at Blue Ridge Aquaculture Inc to obtain a relatively uniform size by removing the runts
The fish were raised in 6607 L (150 gallon) agricultural watering troughs (Rubbermaid Winchester VA USA) The experiment was a three (temperatures) by four (feeding levels) factorial design having two replicates The nominal culture temperatures were 26 29 and 32degC and the feeding levels for each temperature conducted four times a day were saturation feeding 87 73 and 60 of the daily saturation feed rate The average fish weight at the beginning of the experiment was approximately 53g and the growth experiment lasted 20 weeks At the conclusion of the experiment the fish were taken off feed for three days prior to harvesting The tanks were completely drained and the live fish from each tank were placed in an ice-filled chest The fish were kept on ice for several hours prior to being filleted to anesthetize them and increase rigor making them easier to fillet and reducing the amount of blood in the fillet Prior to processing the fish were weighed to the nearest gram using a digital scale and measured to the nearest millimeter using a measuring board Fish weighing 300g or more were then filleted smaller fish were dissected to determine sex but were not filleted A total of 407 fish were filleted As noted the fish used in this experiment were chemically sex reversed ie from female to male and thus during the filleting process only 10 were identified as females Of that 10 a disproportionate number of females did not reach the 300g minimum cut-off weight for filleting thus only 24 fish identified as females were filleted
22 International Journal of Recirculating Aquaculture Volume 5 June 2004
Fillet Yields ofTilapia (Oreochromis)
The filleting was conducted by two competent fish cutters with extensive experience in filleting tilapia for a small Midwestern tilapia producer The v-notched skinless filleting was primarily accomplished with electric carving knives One individual cut across the torso just behind the gill and then cut horizontally down along the backbone through the ribcage to the tail While still attached to the tail the side of the fish was then flipped over and another horizontal cut was made along the skin to separate the meat from the skin and scales The sex of the fish was then determined based upon the internal sex organs The procedure was repeated on the other side of the fish The other individual cut the ribcage out of the fillet with an electric knife and removed the pectoral fin with a v-shaped cut The combined weights of the fillets for each fish were determined to the nearest gram on a digital scale
RESULTS
Fillet Weight Model A mathematical model of the fillet weight (Wf) in grams was fitted using the linear regression procedure (SAS Cary NC USA) Considered in the model were polynomials of weight and length condition factor temperature and feeding rate sex and interaction terms of the primary factors Only fish weight (W) in grams and length (L) in millimeters were found to be significant at the 95 confidence level and the resulting model was Wr = 650 - 0403L + 0401 W with a coefficient of determination (r2) of 0913 The reduced model Wr = -167 + 0336W produced an r2 of 0906 The fillet weight versus fish weight data and the regression line are shown in Figure 1 It appears that weight is a
--middot Figure I Relationship between fish weight and total fillet weight
International Journal of Recirculating Aquaculture Volume 5 June 2004 23
Fillet Yields o1ilapia (Oreochromis)
very good predictor of fillet yield and that for a given weight shorter fatter fish produce a slightly higher yield Although losing some predictive power the reduced model is more appropriate for several reasons Fish length and weight are highly correlated and therefore most of the predictive capability of length can be accounted for in the weight measurement The large positive intercept and the large negative coefficient for length in the full model are intuitively illogical Beyond the limits of the data set the full model produces unreasonable predictions For example predicted fillet weight of fingerlings would exceed the entire weight of the fish On the other hand the coefficients of the reduced model are intuitively logical and produce reasonable estimates of the fillet weights even beyond the limits of the data collected For the reduced model the 95 confidence interval for they-intercept is -215 to -119 and the 95 confidence interval for the weight coefficient is 0326 to 0347 Considering the variation in yield introduced by the filleting process the linear correlation between fillet yield and weight is good
Effect of Sex on Fillet Yields As noted previously fillet yield is a function of size and on average the females were only 666 as heavy as their male counterparts for a given treatment The question to be answered is whether the fillet yields of males and females of similar weights are different Once this is known it can be determined whether unisex production should be priced differently than mixed-sex production As noted above gender was not a significant factor in the construction of the fillet model but a paired t-test is a stronger statistical test For each of the 24 filleted females a male was selected at random that had the same or nearly the same body weight A paired t-test was used to compare the fillet weights and fish lengths of equal-sized males and females At the p = 005 level the differences in fillet yields were not significant but the males were found to be significantly longer F tests were used to compare the variance of the fillet weights and the lengths At the p = 005 level no statistical difference could be detected in the variance of the fillet weights or lengths
24 International Journal of Recirculating Aquaculture Volume 5 June 2004
Fillet Yields ofTilapia (Oreochromis)
Table 1 Comparison of length weight fillet weight and yield of males and females of comparable weight
Length Fillet (mm) Weight (g) Weight (g) Yleld ()
Males Average 2670 3758 1087 029 (SD) 147 647 244 0024
Females Average 2618 3760 1103 029 (SD) 153 647 219 002
DISCUSSION Weight is a good predictor of fillet yield The full model regression formula that included both fish weight and fish length produced a model with slightly greater predictive power than the reduced model that used only fish weight and could thus be of interest from an academic perspective Its predictive power is only slightly better than that of the reduced model From a practical perspective weight is relatively easy to measure whereas length is not and thus for commercial applications the reduced model is a more valuable tool than the full model
The wholesale price per kilogram for tilapia is generally based upon fish weight-fish heavier than 600g bring a premium price those between approximately 350 and 600g an intermediate price and those less than 350g a lesser price (Fitzsimmons and Posadas 1997) The reduced model predicts yields of 288 and 308 for 350g and 600g fish respectively which would justify a price premium of approximately 7 based strictly upon the increase in yield but which does not include any reduction in processing costs The yields obtained from this experiment are lower than both the 33 yield figure cited as a rule of thumb by Fitzsimmons and Posadas (1997) and the average fillet yield of 335 from 0 niloticus averaging 2074g cited by Obanu and lkeme (1988) In contrast Clement and Lovell (1994) obtained only a 254 fillet yield from 0 niloticus that weighed an average of 585g Several factors could account for the discrepancies including tilapia species and the skill of the fish cutter However the largest source of variation is likely to be the methods and procedures used in filleting which unfortunately are generally not reported in the literature Variability introduced by fillet technique and skill of the cutter is not included in this model because only one set of cutters was used
International Journal of Recirculating Aquaculture Volume 5 June 2004 25
Fillet Yields of Tilapia (Oreochromis)
Fillet yield is important information for making management decisions in pricing fish products selecting species specifying feed rations and controlling production costs Muscle yield of fish species has a big impact on the profitability of the aquaculture firm and on the survival of a specific marketing channel The fish producer is the last claimant to the consumers market price for fish and fish products The more handlers there are operating in a marketing channel the smaller the margins for each handler Gross retail margins for fresh fish usually command between 30 and 50 of the total profit depending on the marketing season and the fish species Producers are accustomed to marketing whole fish while customers are used to purchasing fish fillets When the useable flesh is separated from the whole fish the result is the fillet and a by-product Typically these by-products of the fish filleting process do not have significant value and their production cost has already been factored into the fish value The higher the yield ratio of muscle to by-product and the higher the market price the greater the chance a producer has of receiving a higher return on the aquaculture product Documentation of fillet yields coupled with market price indicate the value of the fish products in a marketing channel The better the yield the better the survival of a species in the marketplace
ACKNOWLDEGEMENT This material is based upon work supported by the Cooperative State Research Education and Extension Service US Department of Agriculture under Project No VA135559
REFERENCES Clement S Lovell RT Comparison of Processing Yield and Nutrient
Composition of Cultured Nile Tilapia (Oreochromis niloticus) and Channel Catfish (Ictalurus punctatus) Aquaculture 1994 119 299-310
Fitzsimmons K Posadas BC Consumer Demand for Tilapia Products in the US and the Effects on Local Markets in Exporting Countries In Proceedings of the Fourth International Symposium on Tilapia in Aquaculture (Orlando FL USA) Fitsimmons K (Ed) 1997 NRAES-106 Natural Resource Agriculture and Engineering Service (NRAES) Ithaca NY USA
26 International Journal of Recirculating Aquaculture Volume 5 June 2004
Fillet Yields oTilapia (Oreochromis)
Harvey D 2000 Aquaculture Outlook Economic Research Service US Department of Agriculture (Pub LDP-AQS-12) Washington DC USA
Kirkup SP Marsh LS Libey GS Heath AG Coale CW Haugh CG Effects of Temperature and Feeding Rates upon Growth and Feed Conversion Ratios in Tilapia In Proceedings of the Third International Conference on Recirculating Aquaculture (Roanoke VA USA) Flick G J and Rakestraw T (Eds) 2000 Virginia Tech Blacksburg VA USA
Losordo TM Westerman PW An Analysis of Biological Economic and Engineering Factors Affecting the Cost of Fish Production in Recirculating Aquaculture Systems Journal of the World Aquaculture Society 1994 25193-203
Obanu ZA lkeme AI Processing Characteristics and Yield of Some Fishes of the River Niger in Nigeria In Proceedings of the FAQ Expert Consultation on Fish Technology in Africa (Abidjan Cote DIvoire) FAQ Fish Report 1988 Supplement No 400 pages 218-220
Phipippart J-Cl Ruwet J-Cl Ecology and Distribution of Tilapias In_ ICLARM Conference Proceedings 7 (Bellagio Italy 1980) Pullin RSV and Lowe-McConnell RH (Eds) 1982 International Center for Living Aquatic Resources Management (ICLARM Manila Philippines
HematPlogy and Blood Chemistry Reference Intervals for Yellow Perch (Percajlavescens) Raised in Recirculation Systems
TC Hrubec1 and SA Smith2
1Department of Biomedical Sciences E Via Virginia College of Osteopathic Medicine Blacksburg VA 24060 USA
2Department of Biomedical Sciences and Pathobiology (0442) Virginia-Maryland Regional College
of Veterinary Medicine Virginia Polytechnic Institute and State University Blacksburg VA 24061 USA
Corresponding author current address Department of Biomedical Sciences and Pathology (0442) Virginia-Maryland Regional College of
Veterinary Medicine Virginia Polytechnic Institute and State University Blacksburg VA 24061 USA E-mail thrubecvtedu
Keywords Yellow perch Perea hematology blood chemistry reference values plasma biochemistry
International Journal of Recirculating Aquaculture 5 (2004) 29-42 All Rights Reserved copy Copyright 2004 by Virginia Tech and Virginia Sea Grant Blacksburg VA USA
International Journal of Recirculating Aquaculture Volume 5 June 2004 29
Hematology and Blood Chemistry of Yellow Perch (Percaflavescens)
ABSTRACT Determination of hematology and blood plasma biochemistry values is routinely used to assess the health of wild and domestic animals Yellow perch (Percaflavescens) culture is a growing segment of the US aquaculture industry and tools are needed to monitor the health status of these fish This paper reports reference values for complete hematological and biochemistry profiles of normal healthy yellow perch raised in recirculation culture conditions The following hematologic values were determined packed cell volume plasma protein erythrocyte leukocyte lymphocyte neutrophil monocyte and thrombocyte numbers A description of leukocyte morphology is presented Additionally the following plasma biochemical values were determined total protein albumin globulin creatinine total bilirubin alkaline phosphatase aspartate aminotransferase sodium potassium chloride calcium phosphorus magnesium glucose and cholesterol Reference values for a specific population of fish need to be determined prior to utilizing diagnostic blood samples from individuals Developing diagnostic hematology for fishes can enhance yellow perch culture by providing a means for the early detection and identification of infectious disease and of sub-lethal conditions that may affect production performance
INTRODUCTION Yellow perch (Percaflavescens) are an important game fish throughout much of the Northeast and Midwestern United States and Canada Contamination of natural waters by pollutants and an increased consumer demand for fresh seafood has led to the aquaculture production of yellow perch The culture of yellow perch is a rapidly emerging segment of aquaculture in the United States (Schmitz 1999) and has great economic potential especially in recirculation aquaculture systems (Kelly 2000 Mallison 2000) As more producers cultivate yellow perch it will become increasingly important to accurately evaluate the health of these fish and to develop tools such as diagnostic hematology to monitor the health status of fish during their production cycle
Diagnostic evaluation of blood parameters has been used extensively for many mammalian avian and reptilian species The rapidly growing aquaculture industry will increasingly need to utilize information of this type in order to assess the health status of cultured fishes Unfortunately hematology use in aquaculture remains limited in part due to the lack of
30 International Journal of Recirculating Aquaculture Volume 5 June 2004
Hematology and Blood Chemistry of Yellow Perch (Percaflavescens)
reliable reference blood values for most fish species Accurate reference intervals have been developed for some species including hybrid striped bass and tilapia under different production settings (Hrubec et al 1996 1997ab 2000 2001 Hrubec and Smith 2000) and for trout (biochemistry only Wedemeyer and Nelson 1975) pacu (hematological only Tocidlowski et al 1997) and milkfish (Ram-Bhaskar and Srinivasa-Rao 1989)
Little is known about the blood response of yellow perch There are few studies that have previously measured blood values in yellow perch (Toneys and Coble 1980 Nelson et al 1988 Nelson and Mitchell 1992 van den Heuvel et al 2000) Only a few parameters such as hematocrit sodium and chloride were determined as most of these studies were toxicological in nature and evaluated changes in other body systems The objective of this study was to generate a complete comprehensive list of reference blood values for normal healthy yellow perch (Perea flavescens) raised to market size in a recirculation system for later use as a diagnostic tool This is the first paper to report full hematological and biochemical profiles for production yellow perch
MATERIALS AND METHODS
Juvenile yellow perch were stocked into production recirculation systems as fingerlings and reared through their production cycle indoors in 10219-L recirculation tanks with a rotating biological contactor filter and 10 freshwater exchange per day At the end of their production cycle when the fish were 17 months old approximately 250 fish were removed from the production system and placed in a smaller 2400-L circular tank with a slant tube clarifier and a trickle biofilter The smaller tank had a freshwater replacement rate of 15 per day The fish were placed in the smaller systems to allow for a more rapid and less stressful capture procedure The fish were acclimated to the new tanks for 3 weeks The photoperiod was approximately 14-h light and 10-h dark Fish were fed daily to satiation with a commercial pelleted diet (Rangen EXTR 400 40 protein 10 fat Rangen Inc Buhl ID USA) The following water quality parameters were determined daily temperature pH ammonia alkalinity hardness nitrite nitrate and dissolved oxygen Ranges for water quality over the duration of the study are shown in Table 1 and are representative of water quality observed daily in these tank systems
International Journal of Recirculating Aquaculture Volume 5 June 2004 31
Hematology and Blood Chemistry of Yellow Perch (Perea flavescens)
Table 1 Water quality parameters for yellow perch (Percaftavescens) reared in a recirculation culture system Values are means plusmn standard deviations for the parameters on the days that fish were bled for hematological and blood biochemical determinations and are representative of the daily water quality values in the system
Parameter For Hematology Fish For Chemistry Fish
Temperature (degC) 209 plusmn 001 207plusmn 11
pH 78plusmn01 79 plusmn 02
NH3 un-ionized (mgL) 0012 plusmn 0012 0011 plusmn 0005
N02-N (mgL) 0031 plusmn 0015 0043 plusmn 0043
N03-N (mgL) 60 plusmn 26 28 plusmn09
Alkalinity (mgL) 252 plusmn44 313 plusmn 48
Hardness (mgL) 399 plusmn 10 433 plusmn27
Dissolved Oxygen (mgL) 74plusmn05 74 plusmn03
Fish were netted rapidly and anesthetized in aerated tank water with buffered tricaine methanesulfonate (MS-222 Sigma Chemical Co St Louis MO USA) until they began to lose equilibrium approximately 20 seconds Individual fish were bled for either hematological determinations (23g needle 1-mL syringe) or for biochemical determinations (23g needle 3-mL syringe) in both cases blood was collected from the caudal vessels After blood samples were collected the fish were weighed measured and checked for external and internal pathologic lesions The sex of each fish was determined by internal observation of the gonads
Blood for hematological determinations was transferred to an ethylenediamine-tetraacetic acid (EDTA) treated pediatric blood tube and held on ice until analysis (lt 1 hour) Blood for biochemical determinations was collected into cold 3-mL heparinized blood tubes and centrifuged at 14000 x g immediately Plasma was collected and frozen at -10degC until analyzed The following analytes were determined in the plasma with an Olympus AU-400 (Olympus America Inc Melleville NY USA) automated clinical chemistry analyzer total protein albumin creatinine total bilirubin alkaline phosphatase (ALP) aspartate aminotransferase (AST) cholesterol glucose sodium potassium chloride phosphorus calcium and magnesium Globulin was calculated from the total protein value minus the albumin value
32 International Journal of Recirculating Aquaculture Volume 5 June 2004
Hematology and Blood Chemistry of Yellow Perch (Percaflavescens)
Hematological analytes were determined from the EDTA anticoagulated blood As we have observed for other fish species EDTA was superior to heparin for yellow perch blood both in preventing clot formation and preserving cellular morphology (Hrubec et al 1996 2000) Blood from the EDTA tube was drawn into microhematocrit tubes and the packed cell volume (PCV) determined after centrifugation at 10000 x g for 5 min Plasma protein was determined with a clinical refractometer using plasma from the microhematocrit tube The total erythrocyte and leukocyte-plus-thrombocyte counts were determined manually with a Neubauer hemacytometer using Natt-Herricks solution as a diluent stain (Natt and Herrick 1952) Blood smears made within 45 minutes of sample collection were stained with Wright-Geimsa stain and were used to determine the differential counts as follows Leukocytes and thrombocytes were identified and counted on the blood smears until 200 leukocytes and a variable number of thrombocytes were enumerated The percentages of each leukocyte type and of thrombocytes were multiplied by the total leukocyte-plus-thrombocyte number to give the final cell counts Thrombocyte numbers were subtracted from the leukocyte-plus-thrombocyte count to give the total leukocyte count This method of manually determining total leukocyte and differential counts has been recommended for use with avian (Zinkl 1986) and fish blood (Hrubec et al 1996 1997ab 2000 2001) as the nucleated red cells prevent accurate enumeration using automated analysis (Huffman and Arkoosh 1997) Slight thrombocyte clumping was observed on the hemacytometer for some individuals only fish with minimal thrombocyte clumping(lt 4 cells clumped) were used for the differential counts to ensure accuracy of the counts
Reference intervals were determined following the guidelines proposed by the National Committee for Clinical Laboratory Standards (NCCLS 1992) As suggested in these guidelines the data were checked for outliers using the 13 differencerange ratio and no outliers were identified The values were then ranked and the high and low 25 were discarded The range of the remaining values provided the reference interval
RESULTS AND DISCUSSION The physiologic and health status of an individual is reflected in the blood producing variations in hematological and blood biochemical values Clinical analysis of blood is a fundamental tool used in human
International Journal of Recirculating Aquaculture Volume 5 June 2004 3 3
Hematology and Blood Chemistry of Yellow Perch (Percaflavescens)
and veterinary medicine to diagnose and predict the outcome of disease and to monitor the effect of therapeutic nutritional and environmental management Blood analysis is not used extensively as a diagnostic tool in fish medicine partly due to the lack of reference intervals for various fish species and also because changes associated with specific diseases and metabolic disorders are not well characterized With sufficient background data clinical analysis of individual blood samples could detect infectious diseases metabolic disorders and sub-lethal disease states affecting production performance
Hematological and plasma biochemistry data from diseased individuals can be evaluated by direct comparison to a reference interval which is the appropriate range of variation in a blood parameter from a defined population of individuals under specific conditions The reference interval needs to be determined on a sufficient number of normal healthy individuals under similar production conditions using standardized analytical techniques (NCCLS 1992) When the deviation in a blood parameter is large enough to fall outside the reference interval it indicates the value may be aberrant and is most likely not due to individual variation for a given fish
Few previous studies have determined blood parameters for yellow perch (Toneys and Coble 1980 Nelson et al 1988 Nelson and Mitchell 1992 van den Heuvel et al 2000) These studies are of limited relevance as they were primarily toxicological studies and only a few blood parameters were determined and also because blood samples were collected and handled by differing methods prior to determination of the blood value Some of the capture (hook and line and gill netting) and blood collection methods (severing the caudal peduncle) used in these studies are also unsuitable for diagnostic blood samples as they result in significant alteration in the blood which will mask diseased states The study with the closest sampling procedure to that used in our experiment only presented selected blood chemistry values for yellow perch after 16 hours of moderate or exhaustive exercise (Nelson and Mitchell 1992) Therefore although the previous studies on yellow perch hematology are helpful in determining the effects of environmental factors and stress they have limited diagnostic utility and even prevent meaningful comparison with the data presented in this paper
The average mean weight of the yellow perch used for the hematological determinations was 125 +- 14g with a total length of 223 +- 08 cm For
34 International Journal of Recirculating Aquaculture Volume 5 June 2004
Hematology and Blood Chemistry of Yellow Perch (Percajlavescens)
the biochemical determinations the fish had a weight of 121 +- 15g and length of 226 +- 08 cm The results of the hematological determinations from 52 fish are listed in Table 2 Values for plasma chemistry reference intervals determined on 42 samples are listed in Table 3 Overall both the hematological and plasma chemistry values were similar to those reported previously for hybrid striped bass and tilapia reared in recirculation systems (Hrubec et al 1996 2000 Hrubec and Smith 2000) The striped bass and tilapia from production systems exhibited wider ranges in value for the different leukocyte types increased numbers of reticulocytes increased plasma and total protein values increased creatinine values and a decreased plasma chloride concentration as compared to fish in lower density recirculation tanks We did not compare blood values from the production yellow perch in this study to yellow perch maintained in low-density tank settings so were unable to determine if these same trends are apparent in yellow perch as well However based on our previous experience with fish hematological and plasma biochemical values there is an indication that these trends are occurring in yellow perch as well
Table 2 Hematological reference intervals for adult yellow perch (Perea flavescens) reared in a recirculation system
Analyte N Reference Interval Mean Stds1
PCV2 () 57 29-47 388 45
Plasma Protein (gdl) 57 60-82 67 06
Erythrocytes (x 106ml) 53 2160-3345 2737 0356
Leukocytes (ml) 53 52590-186490 113914 39086
Lymphocytes (ml)
Small 53 36800-153420 85630 31728
Large 53 3530-23 130 11602 5359
Neutrophils (ml) 53 1860-35950 12430 8837
Monocytes (ml) 53 670-12640 4252 2874
Thrombocytes (ml) 53 38270-118510 72972 21299 1Standard deviation 2Packed cell volume
International Journal of Recirculating Aquaculture Volume 5 June 2004 35
Hematology and Blood Chemistry of Yellow Perch (Perea flavescens)
Table 3 Plasma biochemical values for adult yellow perch (Percaftavescens) reared in a recirculation system
Analyte N Reference Interval Mean Stds1
Total Protein (gdl) 42 37-50 45 04
Albumin (gdl) 42 06-09 07 01
Globulin (gdl) 42 31-42 37 03
Creatinine (mgdi) 42 04-10 06 01
Total bilirubin (mgdi) 42 03-04 03 01
ALP2 (UI) 42 50-114 822 249
AST3 (UI) 42 2-29 85 64
Glucose (mgdi) 42 62-181 1000 350
Cholesterol (mgdi) 42 182-323 2440 330
Sodium (mEqI) 42 138-153 1470 40
Potassium (mEqI) 42 20-38 32 05
Chloride (mEqI) 42 119-133 1260 40
Calcium (mEqI) 42 86-120 103 13
Phosphorus (mEqI) 42 50-96 74 11
Magnesium (mEqI) 42 17-34 27 04 1 Standard deviation 2 Alkaline phosphatase 3 Aspartate aminotransferase (SGOT)
The blood cells present in the yellow perch were typical of teleost fish and included erythrocytes thrombocytes and leukocytes (Fig 1) Erythrocytes were oval to round with characteristic red cytoplasm and an elongate and centrally-located nucleus Immature erythrocytes or reticulocytes demonstrated a blue-purple tinge to the normal eosinophilic cytoplasm (Fig IA B C) The yellow perch had increased numbers of reticulocytes (included in the erythrocyte count) with approximately 7 to 10 per field at lOOx oil immersion compared to what we observe for most fish species The cause for the apparent reticulocytosis is not known but has been observed in other fish species exposed to elevated nitrite and nitrate (Grabda et al 1974 Hrubec et al 1996 2000 Hrubec and Smith 2000)
36 International Journal of Recirculating Aquaculture Volume 5 June 2004
Hematology and Blood Chemistry of Yellow Perch (Perea flavescens)
T bull middotmiddot ~~ - middot
N -
Figure I Characteristic blood cells from yellow perch reared in recirculation systems Blood smears were made with EDTA anticoagulated blood stained with Wrights Geimsa stain Cells are abbreviated as follows U - Large lymphocyte SL - small lymphocyte T - thrombocyte R - reticulocytes (immature erythrocyte) PC - plasma cell (activated lymphocyte) M- monocyte N-neutrophil The blue bar in frame A is Omm
International Journal of Recirculating Aquaculture Volume 5 June 2004 37
Hematology and Blood Chemistry of Yellow Perch (Percajlavescens)
The thrombocytes were slightly smaller than the erythrocytes (Fig IA) They had clear cytoplasm and were variable in shape being elongated pyriform oval or round Nuclear shape tended to follow cytoplasmic shape although oval and round thrombocyte nuclei occasionally were lobulated (Fig IB) as described for striped bass and tilapia (Hrubec et al 1996 2000)
Leukocytes made up the remainder of the cell types seen in the blood and included small and large lymphocytes neutrophils and monocytes No eosinophils or heterophils were observed Small lymphocytes were the smallest cell present with a rim of blue cytoplasm surrounding the round nucleus (Fig IA E F) Large lymphocytes had an abundant and darker blue cytoplasm and the nucleus was larger than observed in the small lymphocyte (Fig IA E) Plasma cells were occasionally observed with a classic open nucleus abundant dark blue cytoplasm and a clear cytoplasmic region adjacent to the nucleus presumably representing the Golgi as in mammalian plasma cells (Fig IC) Plasma cells were included in the large lymphocytes category for the differential counts
Neutrophils were the largest cell present in the blood (Fig ID E F) The cytoplasm of the neutrophil was a translucent grey containing no granules and infrequent vacuoles Cytoplasmic shape was round to angular as the cellular borders often appeared slightly adherent to adjacent erythrocytes distorting cellular shape Nuclear shape of the neutrophil varied from round to horseshoe shaped and frequently segmented into two prominent lobes connected by a thin nuclear bridge (Fig IF) Monocytes had abundant dark blue cytoplasm that was frequently vacuolated (Fig ID) The round to kidney-bean shaped monocyte nucleus was large with prominent chromatin clumping
Analysis of blood parameters can provide a wealth of information useful in analyzing the effects of disease and sub-optimal environmental conditions Providing reference intervals for healthy adult yellow perch reared in recirculation systems furnishes veterinarians and fish health professionals the foundation to develop diagnostic hematology for this species The number of studies that determine actual reference intervals for fish species is limited The majority of blood values determined for fishes are reported in the literature as a mean value with a standard deviation Historically reference intervals were determined as two standard deviations from the mean however this method is only valid when blood values follow a normal distribution It is incorrect to assume
38 International Journal of Recirculating Aquaculture Volume 5 June 2004
Hematology and Blood Chemistry of Yellow Perch (Percaflavescens)
that biological parameters are distributed normally therefore non-parametric methods should be used to accurately determine reference intervals (Reed et al 1971) Techniques to properly determine reference intervals have been established by the NCCLS (1992) and suggestions for their use and interpretation have been discussed (Lumsden 1998) As with mammalian species reference intervals need to be determined for different populations of fish within a single species as culture conditions and environmental variables affect blood values to the extent that they are outside the reference interval (Ram-Bhaskar and Srinivasa-Rao 1989 Hrubec et al 1996 1997ab 2000 2001) Although the reference range for some of the blood parameters appears large it is still possible to detect variation in hematologic values associated with pathological conditions (Hrubec et al 1997b and unpublished data)
Developing reference intervals is a necessary first step in determining which specific hematological changes can be associated with disease conditions As the field of fish hematology develops its usefulness to the aquaculture industry will increase Information derived by standardized non-lethal diagnostic assays will be needed to enhance the culture of yellow perch and other fish species Analysis of diagnostic blood samples can provide a means for early detection of infectious disease and assist in the identification of sub-lethal conditions affecting production performance This should allow for more specific timely and effective disease treatments in the future
ACKNOWLEDGEMENTS The authors wish to thank Mark Kidd of the Virginia Tech Aquaculture Center for his assistance with fish care and sampling
REFERENCES Grabda E Einszporn-Orecka T Felinska C Zbanyszek R
Experimental Methemoglobinemia in Rainbow Trout Acta Ichthyologica et Piscatoria 1974 4 43-71
Hrubec TC Smith SA Robertson JL Feldman B Veit HP Libey G Tinker MK Comparison of Hematologic Reference Intervals between Culture System and Type of Hybrid Striped Bass American Journal of Veterinary Research 1996 57 618-623
International Journal of Recirculating Aquaculture Volume 5 June 2004 3 9
Hematology and Blood Chemistry of Yellow Perch (Percajiavescens)
Hrubec TC Robertson JL Smith SA Effects of Temperature on Hematologic and Serum Biochemical Profiles of Hybrid Striped Bass (Morone chrysops x Morone saxatilis) American Journal of Veterinary Research 1997a 58 126-130
Hrubec TC Robertson JL Smith SA Effects of Ammonia and Nitrate Concentration on Hematologic and Serum Biochemical Profiles of Hybrid Striped Bass (Morone chrysops x Morone saxatilis) American Journal of Veterinary Research 1997b 58 131-135
Hrubec TC Smith SA Hematology and Plasma Chemistry Values for Production Tilapia ( Oreochromis hybrid) Raised in a Recirculation System International Journal of Recirculating Aquaculture 2000 J 5-14
Hrubec TC Cardinale JL Smith SA Hematology and Plasma Chemistry Reference Intervals for Cultured Tilapia ( Oreochromis hybrid) Veterinary Clinical Pathology 2000 29 7-12
Hrubec TC Smith SA Robertson JL Age Related Differences in Hematologic and Plasma Chemistry Analytes of Hybrid Striped Bass Morone chrysops x Morone saxatilis Veterinary Clinical Pathology 2001 30 8-15
Huffman PA Arkoosh MR Characteristics of Peripheral Blood Cells from Rainbow Trout Evaluated by Particle Counter Image Analysis and Hemocytometric Techniques Journal of Aquatic Animal Health 1997 9 239-248
Kelly AM Yellow Perch Culture in the United States Manna or Mania World Aquaculture 2000 31 4-17
Lumsden JH Normal or reference values Questions and Comments Veterinary Clinical Pathology 1998 27 102-106
Mallison JA 2000 A White Paper on the Status and Needs of Yellow Perch Aquaculture in the North Central Region North Central Regional Aquaculture Center Michigan State University E Lansing MI USA
Natt MP Herrick CA A New Blood Diluent for Counting Erythrocytes and Leukocytes of the Chicken Poultry Science 1952 31 735-738
40 International Journal of Recirculating Aquaculture Volume 5 June 2004
Hematology and Blood Chemistry of Yellow Perch (Percaflavescens)
NCCLS National Committee for Clinical Laboratory Standards 1992 How to Define Determine and Utilize Reference Intervals in the Clinical Laboratory Proposed Guidelines NCCLS Document C28-P Villanova PA USA
Nelson JA Mitchell GS Blood Chemistry Response to Acid in Yellow Perch (Perea flavescens) Comparison of Populations from Naturally Acidic and Neutral Environments Physiological Zoology 1992 65 493-514
Nelson JA Magnuson J J Chulkasem W Blood Oxygen Capacity Differences in Yellow Perch (Percaflavescens) from Northern Wisconsin Lakes Differing in pH Canadian Journal of Fisheries and Aquatic Sciences 1988 45 1699-1704
Ram-Bhaskar B Srinivasa-Rao K Influence of Environmental Variables on Hematology and Compendium of Normal Hematological Ranges of Milkfish Chanos chanos (Forskal) in Brackish Culture Aquaculture 1989 83 123-136
Reed AH Henry RJ Mason WB Influence of Statistical Method Used on the Resulting Estimate of Normal Range Clinical Chemistry 1971 17 275-284
Schmitz M 1999 Comparative Growth of All-Female Versus Mixed Sex Yellow Perch (Percaflavescens) in Recirculating Aquaculture Systems MS Thesis Virginia Tech Blacksburg VA USA
Toneys ML Coble DW Mortality Hematocrit Osmolality Electrolyte Regulation and Fat Depletion of Young-of-the-Year Freshwater Fishes under Simulated Winter Conditions Canadian Journal of Fisheries and Aquatic Science 1980 37 225-232
van den Heuvel MR Power M Richards J MacKinnon M Dixon DG Disease and Gill Lesions in Yellow Perch (Percaflavescens) Exposed to Oil Sands Mining-Associated Waters Ecotoxicology and Environmental Safety 2000 46 334-341
Wedemeyer GA Nelson NC Statistical Methods for Estimating Normal Blood Chemistry Ranges and Variance in Rainbow Trout (Salmo gairdneri) Shasta Strain Journal of the Fisheries Research Board of Canada 1975 32 551-554
International Journal of Recirculating Aquaculture Volume 5 June 2004 41
Hematology and Blood Chemistry of Yellow Perch (Percajlavescens)
Zinkl JG Avian Hematology In Schalms Veterinary Hematology (4th edition) Jain NC (Ed) 1986 Pages 256-260 Lippincott Williams amp Wilkins Philadelphia PA USA
42 International Journal of Recirculating Aquaculture Volume 5 June 2004
Hatchery and Grow-out Performance of Sunshine Bass and Backcross Hybrid Striped Bass in Recirculating Aquaculture Systems
SR Lindell1bull2 B Delbos1 R Perham1 J Goldman1 EM Hallerman3 TO Brenden3bull4
1 Fins Technology 15 Industrial Road Turners Falls MA 01376 USA
2Current address Marine Biological Laboratory Marine Resources Center 7 MBL Street Woods Hole MA 02543 USA
3Department of Fisheries and Wildlife Sciences (0321) Virginia Polytechnic Institute and State University Blacksburg VA 24061 USA
4Current address Institute of Fisheries Research University of Michigan 1109 N University Avenue Ann Arbor MI 41809 USA
Corresponding authors e-mail ehallermvtedu
Keywords striped bass performance aquaculture growth
International Journal of Recirculating Aquaculture 5 (2004) 43-54 All Rights Reserved copyCopyright 2004 by Virginia Tech and Virginia Sea Grant Blacksburg VA USA
International Journal of Recirculating Aquaculture Volume 5 June 2004 43
Performance of Sunshine Bass and Backcross Hybrid Striped Bass
ABSTRACT Previous research has suggested that backcross hybrid striped bass (BX sunshine bass female x striped bass male) perform as well as F 1 hybrid striped bass (sunshine bass white bass female x striped bass male) for many economically important traits We conducted trials to compare rearing and growth traits of selected backcross hybrid striped bass with hybrid striped bass (HSB) We spawned and reared larval BX fry in two hatchery cycles measured fry growth and performance and compared them to past performance of HSB fry We conducted a grow-out trial of commercially-available hybrid striped bass versus backcross hybrid striped bass in replicated tanks to phase II fingerling size (approximately lOOg) Compared to HSB in the hatchery phase backcross hybrid striped bass exhibited lower fertilization rate comparable swimbladder inflation rate shorter time-to-weaning lower survival comparable growth and comparable condition factor After 60 days HSB exhibited significantly better growth survival and feed conversion efficiency than BX However BX may have better potential market acceptance by virtue of having a lower condition factor appearing longer and less deep-bodied than HSB
INTRODUCTION Striped bass (Morone saxatilis) and its hybrids constitute a major sector of aquaculture in the United States with production of 105 million pounds in 2002 (Carlberg and Van Olst 2003) Commercially significant quantities of Morone stocks also are produced in Taiwan China and Israel Approximately 43 of Morone production occurs in tanks (Carlberg and Van Olst 2003) much of that in recirculating aquaculture systems (RAS) Private and government marketing experts estimate that US production could increase to 50 million pounds and $100 million in annual farm-gate revenue if market prices could be decreased only moderately (Halbrendt et al 1991) Production costs for HSB could be reduced by 12 if selective breeding can yield 20 faster growth rates (Losordo and Westerman 1994)
The majority of Marone production is not of striped bass but of its hybrids with white bass (M chrysops) because of their hardiness rapid growth rate and limited availability of female striped bass broodstock (reviewed by Harrell 1997) Further female WB are considered easier and more predictable to strip-spawn Hence most commercial production
44 International Journal of Recirculating Aquaculture Volume 5 June 2004
Performance of Sunshine Bass and Backcross Hybrid Striped Bass
is of sunshine bass the progeny of the white bass female x striped bass male interspecific cross Research has also been undertaken to evaluate the performance of second generation hybrids and backcrosses Several studies have suggested that the progeny of F 1 hybrid striped bass females backcrossed to striped bass males have merit for commercial production Jenkins et al (1998) compared the performance of backcross hybrids to F1 hybrid striped bass and striped bass to market size in a recirculating system At harvest no differences in growth rate or feed conversion were detected specific growth of BX was intermediate to those of the other stocks with survival lower Tomasso et al (1999) compared performance of F 1 and backcross hybrids between 20 and 90 grams for 56 days in tanks (Tomasso et al 1999) and observed similar survival growth and feed conversion rates among the hybrid types Detailed comparison of the hatchery performance of sunshine and BX hybrids is lacking We hypothesized that use of selected hybrid striped bass and striped bass for the backcross might yield a high-performance BX hybrid Should high performance be realized progressive fish farmers might utilize this approach by selecting the best F1 hybrid females from their own production stocks making the backcross by strip-spawning them and fertilizing the eggs with purchased milt from selectively bred striped bass males (Kerby 1983) thereby obtaining a high-performance production stock that because of selection on the maternal stock is suited to their particular farm conditions
In this study we evaluated the production potential of backcross (BX) hybrid striped bass (female sunshine bass x male striped bass) We compared the hatchery and grow-out performance of BX spawned from select broodstock and sunshine bass (HSB) of common genetic background Specifically we evaluated spawning success hatch rate growth survival and feed conversion efficiency through the first six months of life In order to benchmark our results we ran a trial in replicated tanks with HSB supplied by the most widely-used commercial source of fingerlings (Keo Fish Farms Keo AR USA) and compared their performance with our BX All fish were cultured within intensive controlled-environment recirculating aquaculture systems
International Journal of Recirculating Aquaculture Volume 5 June 2004 45
Performance of Sunshine Bass and Backcross Hybrid Striped Bass
MATERIALS AND METHODS In July 2001 we crossed 4 hybrid striped bass females to each of 4 striped bass males to produce 16 families of backcross hybrid striped bass Poor fertilization rates resulted in a low yield of fry from this spawn However there were enough fry to pool and conduct a pilot commercial-scale hatchery run Randomly-chosen samples from the resulting 4000 fingerlings were used for the grow-out trial
In October 2001 we spawned 3 female HSB with 2 male SB and eventually produced 7000 fingerlings While this was not enough to grow in commercial-scale systems we collected hatchery performance data to corroborate our JulyAugust experience with BX
Fertilized eggs were incubated in McDonald jars Upon hatch the larvae swam out of the hatching jar and into a 1900-L larval rearing tank Replicate larval rearing tanks were stocked with approximately 25 larvae per liter Tanks were maintained with recirculating water and surface oil-skimming pads for the first 5 to 7 days post-hatch until swim-bladder inflation was completed For the second week post-hatch larval rearing tanks were maintained static with gentle central aeration except for an exchange of about 30 of the tank water over the course of two hours each day During the second week post-hatch larvae were fed rotifers enriched with Algamac (Aquafauna BioMarine Inc Hawthorne CA USA) maintained at a density of 10ml By the end of the second week larvae were weaned from rotifers to Artemia nauplii By the end of the third week the larvae were typically weaned from enriched Artemia to artificial feed (Biokyowa Inc Girardeau MO USA) Weaned larvae were graded just once around 60 days post-hatch to remove the top 1 to 2 of larger fish responsible for cannibalism
In November 2001 we purchased lOg fingerlings that represent typical industry-standard HSB from Keo Fish Farms (Keo AR USA) These HSB closely matched the size and weight of our BX from the July spawn for the grow-out trial BX and HSB fingerlings were each stocked separately in triplicate 1900-L round tanks connected to the same recirculating system and reared at 23degC and a salinity of 1-3 ppt All six tanks were similarly stocked initially (approximately 1 kgm3) Fish were offered 80 of their expected ration via belt-feeders and hand-fed to satiation twice a day Approximately every 3 weeks length and weight samples were taken from a randomly-chosen 15 of each tanks
46 International Journal of Recirculating Aquaculture Volume 5 June 2004
Performance of Sunshine Bass and Backcross Hybrid Striped Bass
population At the conclusion of the project the tanks reached typical commercial densities of 5 to 9 kgm3bull
We quantified reproductive and hatchery performance of the three groups including fertilization rate swimbladder inflation rate days to weaning onto artificial feed (ie date of first ingestion to date that gt90 ingested artificial feed) survival estimates to approximately 60 days after hatch and to the end of the study feed conversion rate and monthly average weight and length The trial continued until mid-February 2002 when the HSB averaged approximately lOOg Results from previous years hatchery efforts with HSB using similar rearing protocols were used for comparative purposes
Both the hatchery and grow-out systems employed water recirculation technology including drum-filters fluidized-bed biofilters oxygenation ozonation and automated pH and temperature control that maintained high water-quality standards throughout the trials
Differences in fish weight between the hybrid types were analyzed as a repeated-measures general linear mixed model Residual (restricted) maximum likelihood was used to estimate the model parameters Initial fish biomass in each of the tanks and the amount of feed provided to each of the tanks were included in the model as covariates to assess the influence of these concomitant variables on differences in weight A first-order autoregressive covariance structure was assumed for the repeated-measurements of fish weight
Differences in fish survival at the end of the grow-out trial were analyzed as a general linear model with tanks serving as a blocking factor Because fish survivalmortality is a binary response and thus will violate an assumption of normality the significance of the test comparing survival between the hybrid types was obtained by randomization (number of randomizations= 1000) whereby the F-statistic of the original test was compared to F-statistics obtained by randomly allocating the survival mortality data to the different hybrid types The Type-I error rate for all statistical tests was set equal to 005
International Journal of Recirculating Aquaculture Volume 5 June 2004 47
Performance of Sunshine Bass and Backcross Hybrid Striped Bass
Table 1 Comparison of hatchery traits of backcross (BX) and Fl hybrid (HSB) striped bass for traits of economic interest
Traits of interest BX-HSB BX-HSB HSB HSB HSB
Female parent strain1 AR ARMD AR AR AR
Male parent strain1 MD FL MD FL MD MD FL MD Canada
Spawn date Oct-01 Jul-01 Mar-01 Oct-00 Jan-99
Fertilization 32 22 53 57
Swimbladder inflation 90 50 98 95
Weaning start (DAH)2bull3 24 21 17 22
Weaning end (DAH4 33 32 37 38
Mean wt (g) at 60 DAH 042 052 042 05
Survival to 60 DAH 7 740 104
Mean L (mm) at 30 DAH 133 11 1225
Mean L (mm) at 36 DAH 139 167
Mean L (mm) at 75 DAH 367 404 452
Mean Wt (g) at 75 DAH 074 081 12 0825 11
Condition factor at 1g 123E-05 118E-05 1Strain abbreviations AR=Arkansas R MD=Maryland FL=Florida 2DAH=Days after Hatch 3Weaning start marks the first introduction and ingestion of dry feed to replace live feeds 4Weaning end denotes the time when the transition to dry feeds is complete and live feeds are no longer utilized
RESULTS
Hatchery Trial Results A summary of performance for hatchery traits of production interest for BX and HSB is presented in Table 1
The fertilization rate for the BX eggs was lower than that which we typically found with HSB (22-32 vs 55) and considerably lower than our experience in 2000 when we conducted fertilization trials with BX (80)
Swimbladder inflation rate ranged from 50 in the first hatchery run to 90 in the second run We attribute the low rate in the first run to
48 International Journal of Recirculating Aquaculture Volume 5 June 2004
Performance of Sunshine Bass and Backcross Hybrid Striped Bass
surface-film and system management problems We showed in the second run that swimbladder inflation in BX was comparable to that typically attainable (gt90) for Morone fry
Time-to-weaning onto dry diets was shorter (10 days versus 18 days) and earlier (day 33 versus day 38) for BX than for HSB Survival of BX to 60 days after hatch (7) was lower than expected on the basis of previous experience with HSB (gt10) Mean weights for BX at 60 days after hatch in two hatchery runs (052 and 042g) was similar to those for HSB (042 and 05g) However HSB exhibited greater mean weight than BX at 75 days after hatch (l04 vs 077g)
Condition factor (K) of BX (123 + 009) was not significantly different from those of HSB (119 + 005) or striped bass (l13 + 003) at 1 gram mean weight
Frequencies of deformities for BX (lt2) were lower than those in earlier reports Bosworth et al (1997) reported deformities in 8 of BX and 4 ofHSB
Grow-out Trial Results Overall there was not a significant difference in weight between the hybrid types (F = 606 df = 13 P = 00907) however as evidenced in
100
80
60
40
20
--+- BX - Overall -0- HSB - Overall -ltgt- BX - Individual Tanks A middot middot middotbullmiddotmiddot middot HSB - Individual Tanks fi
fi ~o
12 Dec 2001 3 Jan 2002 24 Jan 2002 12 Feb 2002
Date Figure 1 Meanfish weight(plusmn 2 SE) at each time period for backcross hybrid striped bass (BX) and hybrid striped bass (HSB) Also shown is meanfish weight at each time periodor groups in individual tanks
International Journal of Recirculating Aquaculture Volume 5 June 2004 49
Performance of Sunshine Bass and Backcross Hybrid Striped Bass
Figure 1 there was a significant interaction on fish weight by hybrid type and time (F = 5157 df = 1587 P lt 00001) Using the slicing option available in SAS (SAS Institute 1999) we tested for differences in weight between the hybrid types for each time period and found that although weights of HSB and BX were not significantly different during the first two measurement periods (Time 1 F = 027 df = 1587 P = 06032 Time 2 F = 036 df = 1587 P = 05496) the hybrid types did differ in weight during the last measurement periods Specifically HSB were significantly heavier than BX on the 24th of January 2002 (F = 1061 df = 1 587 P = 00032) and the 12th of February 2002 (F = 3788 df = 1587 P lt 00001) Overall HSB had a specific growth rate of 268 per
Table 2 Mean weights of backcross hybrid striped bass (BX) and hybrid striped bass (HSB) over the course of a 3-month growth trial
Date BXTank5
Wt(g) SE
112101 1228
BXTank6 Wt(g) SE
1201
BX Tank 12 Wt(g) SE
1274
HSB Tank 13 HSB Tank14 HSB Tank 15 Wt(g) SE Wt(g) SE Wt(g) SE
1180 1016 1088
1211201 1744 102 1778 095 1658 096 1798 109 1752 118 1704 109
1 302 27 60 1 38 28 76 155 27 04 154 3306 157 3424 149 3414 211
1 2402 4196 252 4424 207 4882 299 6344 263 6192 326 6432 362
212102 6332 317 6763 334 6912 299 9474 473 9553 452 10500 388
Table 3 Comparison of survivalfeed conversion ratio (FCR) and condition factor at 60 grams for backcross hybrid striped bass (BX) and hybrid striped bass (HSB)
Cross Tank
Starting
Ending
Survival
BXS
160
136
85
BX 6 BX 12 HSB 13 HSB 14 HSB 15
160
138
86
161
137
85
178
177
99
179
173
97
180
179
99
Starting Biomass (g) 1964 1922 2051 2100 1819 1958
Ending Biomass (g) 8612 9334 9469 16770 16526 18795
Feed Fed(g) 12106 12135 11447 18041 17805 20463
FCR 182 164 154 123 121 122
Condition Factor 168E-05 166E-05 169E-05 194E-05 193E-05 208E-05
SE 353E-07 337E-07 424E-07 255E-07 327E-07 845E-07
50 International Journal of Recirculating Aquaculture Volume 5 June 2004
Performance of Sunshine Bass and Backcross Hybrid Striped Bass
day while BX had a specific growth rate of 205 per day Neither of the covariates included in the model were found to have a significant effect on weight differences (initial tank biomass F = 142 df = 1587 P = 02332 amount of feed F = 005 df = 1587 P = 08165)
Performance regarding key economic traits-survival feed conversion efficiency and condition factor-are summarized in Table 3 At the end of the grow-out trial survival of HSB was significantly greater than that of BX (F = 6216 df = 1 1014 P lt 00001) Feed conversion ratio was better for HSB (122) than for BX (166) Condition factors for BX were lower than those for HSB (l68 vs 198) meaning that BX appeared longer and less deep-bodied than HSB
DISCUSSION Our data showed that F1 HSB performed as well or better than BX for a range of hatchery- and grow-out-related traits
Hatchery traits Fertilization rates for backcross lots were approximately half that for HSB There was a wide variance for fertilization and hatch rates of eggs from HSB females Some of this variance may be due to differences in hatchery protocols (different hormone injections used strip vs tank spawning) at the commercial hatcheries where the data were collected (TIJ Smith personal communication) Poor hatch rates also may be attributable in part to hybrid breakdown that is to developmental incompatibilities among the genomes of the respective species when coadapted gene complexes are broken up at meiosis in the F1 (Hallerman 2003)
In the hatchery trial we hypothesize that the low swimbladder inflation rate for our J~ly fry resulted from offering first feed to the BX too early When rearing HSB and SB fry we typically wait until the yolk sac has been largely resorbed and the fry mostly have inflated their swimbladders before we introduce live feed This is because live feed can cause an oily film on the water surface that interferes with a frys successful ingestion of air bubbles necessary to inflate the swimbladder (Chapman et al 1988) The timing of swimbladder inflation varies with fry type and temperature with HSB typically inflating between 3 and 6 days after hatch and SB 6 to 9 days after hatch BX fry inflate their swimbladder at an intermediate time 5 to 8 days after hatch (DAH) Since for the July
International Journal of Recirculating Aquaculture Volume 5 June 2004 51
Performance of Sunshine Bass and Backcross Hybrid Striped Bass
spawn we introduced feed into their tanks at the time prescribed for HSB (at 5 DAH) BX fry may have had a reduced opportunity to inflate their swimbladders because of interference by a surface film with air contact In the October spawn we monitored swimbladder inflation more carefully and introduced live feed on day 7 after almost 90 of swimbladders were inflated The low swimbladder inflation rate in the July hatchery run of BX may have had a direct impact on survival Larvae without inflated swimbladders expend more energy swimming exhibit reduced growth rates are less tolerant of stress and often sink to the tank bottom and die (Van Heukelem et al 2000)
BX were weaned more quickly and earlier onto dry diets than HSB which may have helped contribute to their ability to match the size and weight of HSB at 60 DAH Earlier weaning has economic merit since dry diets are generally cheaper and easier to feed than brine shrimp
Grow-out traits After 60 days post-hatch the growth and other performance differences between BX and HSB became more evident HSB exhibited significantly better growth survival and feed conversion ratios
We hypothesized that backcross hybrid striped bass might grow as fast or faster than the standard commercially-available F 1 hybrid striped bass if high-performance HSB females were selected as broodstock Our data regarding performance in intensive tank systems did not support this hypothesis Rather our observations accord with the classical view that the high performance of some interspecific hybrids is largely due to heterosis and that because the heterosis shown by an F 2 or backcross hybrid is only half that shown in an F1 (Falconer and Mackay 1996 p 257) that advanced generation hybrids would not perform as well as F1
hybrids Indeed F 2 HSB previously showed low hatch rates low larval survival and high variability of growth rate (Smith and Jenkins 1984 Smith et al 1985) Our results suggest that the heterosis expressed in HSB for growth and performance was greater than the selective breeding advantage we employed by crossing high performance HSB females with male striped bass Apparently the additive genetic variance contributed by the HSB and striped bass selected for size-at-age could not make up for the loss of dominance variance
BX may have better potential market acceptance by virtue of having a lower condition factor appearing longer and less deep-bodied than HSB more
52 International Journal of Recirculating Aquaculture Volume 5 June 2004
Performance of Sunshine Bass and Backcross Hybrid Striped Bass
like striped bass that are more familiar in many markets Fins Technologys market experience has shown that the premium-priced live markets prefer longer leaner fish such as the backcross There is the possibility that because of later maturity backcross hybrid striped bass may grow to larger sizes than hybrid striped bass This is attractive because there is an unserviced demand for larger (1 kg+) fish that can provide portion-controlled 7-9 ounce fillets for the restaurant and retail markets
ACKNOWLEDGEMENTS This project was supported by US Department of Agriculture-Small Business Innovation Research Program Phase I Grant no 2001-00373 EMH is supported by the USDA-CSREES Hatch Program and the Commonwealth of Virginia Aquaculture Initiative
REFERENCES Bosworth BG Libey GS Notter DR Egg Larval and Fingerling
Traits of Crosses among Striped Bass White Bass and their Fl Hybrids Aquaculture 1997 154 201-217
Carlberg J Van Olst J US Production and Sales of Hybrid Striped Bass (1987-2002) 2003 httpaquanicorgsbgaHSBversion5ppt
Chapman DC Hubert WA Jackson UT Influence of Access to Air and of Salinity on Gas Bladder Inflation in Striped Bass Progressive Fish-Culturist 1988 50 23-27
Falconer DS Mackay TFC 1996 Introduction to Quantitative Genetics Fourth Edition Longman Group Ltd Harlow Essex UK
Halbrendt CK Wirth FF Vaughn GF Conjoint Analysis of the Mid-Atlantic Food-Fish Market for Farm-Raised HSB Southern Journal of Agricultural Economics 1991 23 155-163
Hallerman EM Coadaptation and Outbreeding Depression In Po_pulation Genetics Principles and Applications for Fisheries Scientists Hallerman E (Ed) 2004 American Fisheries Society Bethesda MD USA
Harrell RM Hybridization and Genetics Striped Bass and Other Morone Culture In Harrell RM (Ed) 1997 Pages 217-234 Elsevier Science Amsterdam
International Journal of Recirculating Aquaculture Volume 5 June 2004 53
Performance of Sunshine Bass and Backcross Hybrid Striped Bass
Jenkins WE Heyward LD Sr Smith TIJ Performance of Domesticated Striped Bass Marone saxatilis Palmetto Bass and Backcross Hybrid Striped Bass (Sunshine Bass Female x Striped Bass Male) Raised in a Tank Culture System Journal of the World Aquaculture Society 1998 29 505-509
Kerby JH Cryogenic Preservation of Sperm from Striped Bass Transactions of the American Fisheries Society 1983 112 86-91
Losordo TM Westerman P An Analysis of Biological Economic and Engineering Factors Affecting the Cost of Fish Production in Recirculating Aquaculture Systems Journal of the World Aquaculture Society 1994 25 193-203
SAS Institute 1999 The SAS System for Windows version 82 SAS Institute Cary NC USA
Smith TlJ Jenkins WE Controlled Spawning of Fl Hybrid Striped Bass (Marone saxatilis x M chrysops) and Rearing of F2 Progeny Journal of the World Mariculture Society 1984 15 147-161
Smith TlJ Jenkins WE Snevel JF Production Characteristics of Striped Bass (Marone saxatilis) and Fl - F2 hybrids (Marone saxatilis and M chrysops) Reared in Intensive Tank Systems Journal of the World Mariculture Society 1985 16 57-70
Tomasso JR Kempton CJ Gallman A Smith TlJ Comparative Production Characteristics of Sunshine Bass and Sunshine Bass x Striped Bass in Recirculating-Water Systems North American Journal of Aquaculture 1999 61 79-81
Van Heukelem WF Harrell RM Hughes SG Lindell SR Friedmann BR Optimal Conditions for Swimbladder Inflation in Striped Bass Larvae Reared in Intensive Systems Northeast Regional Aquaculture Center Publication No 00-006 (2000) 5 pages
54 International Journal of Recirculating Aquaculture Volume 5 June 2004
Book Review
Fjofish apd Shellfish Bacteriology Mapua) Techpjques apd Procedures KA Whitman with contributions by NG MacNair
Iowa State Press (Blackwell Publishing Professional) Ames IA USA (2004) 288 pages ISBN 0813819520 US $4999
Reviewed by Rocco C Cipriano United States Geological Survey National Fish Health Research Laboratory 11649 Leetown Road Kearneysville WV 25430 USA E-mail rocco_ciprianousgsgov
Despite the fact that several good texts have been published regarding the description and nature of bacterial pathogens in aquatic animals there remained a need for a comprehensive yet practical guide devoted to techniques and procedures used for bacterial identification Diagnosis and detection of fish and shellfish pathogens often requires reliance upon standard microbiological media tests and reagents for some bacteria but more specialized assays are required for many aquatic pathogens In the latter case the products necessary for such assays are not commercially available and must be produced in aquatic animal diagnostic facilities from their basic ingredients Often therefore the compositions of differential media and the conduct of certain tests for the primary isolation or detection of specific aquatic pathogens are only available by referencing the general body of published scientific literature Hence until now there has not been a single-source shelf-volume that combines standard microbiological procedures used for routine detection and identification of medically important bacteria with the specialized needs of the fisheries profession This manual however helps to fill that void
The manual stands as a reference suitable for professional aquatic biologists with backgrounds in microbiology veterinarians and students of aquatic animal health Its strength lies in its coverage of the subject matter regarding culture-based diagnosis and identification of bacteria associated with finfish bivalves and lobsters Sections on
International Journal of Recirculating Aquaculture 5 (2004) 55-56 All Rights Reserved copyCopyright 2004 by Virginia Tech and Virginia Sea Grant Blacksburg VA USA
International Journal of Recirculating Aquaculture Volume 5 June 2004 55
Book Review FiQish and ShelJfish Bacteriology Manualmiddot Techniques and Procedures
aseptic collection and shipment of samples qualitative and quantitative procedures for bacterial isolation staining techniques media and standard biological tests used for the cultivation and phentotypic characterization of pathogenic bacteria and antibiotic sensitivity testing provide sound background for the student or novice practitioner Particularly beneficial for anyone who is not experienced with aquatic microbial pathogens is the section listing principal organs media and appropriate incubation temperatures to be used as the most probable sources of isolation for the specific bacteria
More experienced professionals will find it helpful and convenient to have the descriptions and interpretations of differential media (eg Coomassie Brilliant Blue Agar for Aeromonas salmonicida Rimler-Shotts Agar for Aeromonas hydropila Cytophaga Agar Shieh and TYES for Flavobacterium spp and Edwardsiella ictaluri Agar and various other media for Renibacterium salmoninarum) listed in a single source The major identifying criteria that phenotypically characterize selected bacterial pathogens are also described in tabulated form Specialized tests such as the SIF test to detect covert infections nurse culture techniques for enhanced bacterial growth and assays for public health indicator organisms in bivalves are documented Sections covering serology immunoassay and non-cultured based molecular assays (eg polymerase chain reaction) are also presented but are not as completely summarized as those for bacterial isolation In summary the nature of this manual makes it appropriate for frequent use as a practical laboratory guide
56 International Journal of Recirculating Aquaculture Volume 5 June 2004
Subscription Information
International Journal of Recirculating Aquaculture
A publication ofVirginia Tech and the Virginia Sea Grant College Program
IJRA presents the latest developments in RAS-related research focusing on the areas of
Food Quality Pathology
Food Safety
Aquatic Medicine Breeding amp Genetics Waste Management
FishShellfish Growth amp Nutrition Recirculating Systems Mgmt Marketing amp Economics Water Conservation
Dont miss an issue of this informative peer-reviewed journal Subscribe now using your credit card by calling 540-231-2075 or by printing out a form at wwwcfastvteduijrahtml If you prefer you can also mail this form to the address below along with a check or money order
Name ----------------~ Address ----------------Line2 ------------------City ____________ State __ _ Country Postal Code ___________ _ Phone Fax -------- --------e-mail-----------------check _ 2 year ($25 US)
International Journal of Recirculating Aquaculture Food Science amp Technology Building (0418)
Virginia Polytechnic Institute and State University Blacksburg VA 24061
phone (540) 231-2075 fax (540) 231-9293 e-mail IJRAvtedu
International Journal of Recirculating Aquaculture Volume 5 June 2004 57
~ International Journal of ~ Recirculating Aquaculture A publication of Virginia Tech and the Virginia Sea Grant College Program
Instructions for Authors The International Journal of Recirculating Aquaculture (IJRA) encourages the submission of original high-quality papers on research in all aspects of recirculating aquaculture Papers will be peer-reviewed and evaluated for scientific merit relevance and for their usefulness in promoting the advancement of recirculating aquaculture Complete coherent projects are preferred Any related papers submitted together must be thoroughly cross-referenced All papers must be original meaning that the data and the information presented must be the work of the authors and can not have been published elsewhere Dual publication of a paper or data is possible only through the permission of the Editors of both journals THERE ARE NO PAGE CHARGES for IJRA submissions
INITIAL MANUSCRIPT SUBMISSION Manuscripts should be sent to Ms Angela Correa Managing Editor by mail using the address listed at the end of these instructions or by e-mail to (ijravtedu) Submit four (4) copies of each manuscript if regular mail is used All manuscripts must be in English Dot matrix type is not acceptable and all such submissions will be returned without review Each submission must include a cover letter stating that the paper contains original research and that the information has not been published elsewhere E-mailed submissions must be saved in doc format Be sure to include the names of colleagues who have already reviewed the work presented IJRA has two categories for submission 1 Articles which are complete in-depth scientific studies and 2 Notes which are short papers of limited scope Articles and notes will be critically reviewed by two or three experts as well as by the Managing Editor Submissions may be returned without peer review in cases where the Managing Editor determines that they are inappropriate for the journal of poor quality poorly written or fail to follow the journals style format
PREPARATION OF MANUSCRIPTS IJRA uses the latest editions of Websters New International Dictionary and Websters New Collegiate Dictionarv for standard spellings and word definitions All spelling will be in American English Foreign or science-related terminology that is unfamiliar and does not appear in these dictionaries will require an accompanying definition Acceptable scientific and common names of fishes are listed in A List of Common and Scientific Names of Fishes from the United States and Canada published by the American Fisheries Society Common names may be used throughout each paper but must be accompanied by a full scientific name when they first appear in a paper The author must use the full common name eg yellow perch not perch All foreign language words should be italicized in the manuscript
In the manuscript number each page sequentially and include the senior authors name next to the page number (eg Page 4 Jahncke) on each page Single-space all typed material including references Type size in the body of the text should be no larger than 12pts and no smaller than 10 pts Subsection headings should also be italicized in the manuscript Spell out one-digit numbers except when they are used with units of measure - eg six ponds 7 days
International Journal of Recirculating Aquaculture Volume 5 June 2004 59
Spell out any number that begins a sentence When two numbers occur sequentially in the text one of the numbers must be spelled out- eg In 1987 fifty fish were stocked Use commas in numbers of 1000 or more Use the 24-hour clock to describe time- eg 1300 not 100 pm
Keep footnotes to a minimum and number them sequentially throughout the paper All units of measurement must be reported via the metric system except in special circumstances (eg horsepower) Standard scientific abbreviations and symbols may be used without definition If the use of a symbol could cause confusion define the symbol the first time it is used On the final draft of a paper that has been accepted for publication Greek letters or other extraneous symbols that do not appear on a keyboard the name of the symbol should be noted where the symbol is used to help eliminate prepress errors Parts per million or milligrams per liter can be
-1 reported as either ppm or mgI but not as mgI
Commonly used aquaculture jargon can be used without defining the term - eg fry fingerling hapa Less commonly used jargon may also be used but terms should be defined the first time they are used Jargon from fields outside of aquaculture should also be defined the first time they are used Always place a zero to the left of a decimal point if the number is less than one this includes probability values - eg P = 005 not P = 05
COMPONENTS OF THE MANUSCRIPTS Articles and notes should include a title names of authors and their addresses abstract introduction materials and methods results discussion (or a combined results and discussion) conclusion (rarely) acknowledgements (if any) references figures and tables in that order Each section should start on a new page
Title - The title should accurately reflect the contents of the paper Brief concise titles are encouraged The title page must include the name(s) of the author(s) and all addresses
Abstract - The abstract should be a concise highlight of the results and conclusions Methodology should not be abstracted unless it is necessary to explain the results or unless the paper describes a new technique Abstracts should be less than 300 words
Introduction - The introduction should explain why the paper was written and why it should be read The introduction should condense the relevant information in the field that led the author to do the research The introduction is not a complete literature review and only the most relevant references should be cited The introduction should also contain a statement that describes the purpose or objective of the paper
Materials and Methods - The underlying goal of this section is to describe what was done so that others can repeat the experiment If previously published papers described a technique that was used they can be cited to prevent unnecessary repetition If the technique or process was modified the modification must be described so that others can repeat the process Experimental designs can be explained by use of figures if they will help clarify what was done If the experiment was a complicated one with many subparts subsections may be used to describe each subpart
Results - This section describes the data Proper use of tables and figures can simplify and help explain the results Statistical analysis of data is necessary unless differences are so obvious that statistical analysis is superfluous Although probability values of 005 and 001 are traditionally used each author is free to choose his or her own level of significance
60 International Journal of Recirculating Aquaculture Volume 5 June 2004
Discussion - This section should interpret the results and compare the results from this experiment to those found in similar research The section can also be used to speculate about the results to provide reasons for the trends and to suggest new ideas that can advance our understanding about aquaculture This section should not be a literature review section that merely compares results among several papers
Results and Discussion - Results and discussion sections can be combined In most cases this leads to a better paper because the integration of these sections leads to a more meaningful interpretation of data
Conclusion - This section should be used only when the results of an experiment lead to an unequivocal interpretation
Acknowledgements - This section should be used to thank organizations that supported the research monetarily and individuals who assisted in the research or preparation of the paper This section includes manuscript number designations for those institutions that assign such numbers
References - Select references with great care Unless the paper includes a literature review there is no need to reference every paper written about a subject Use only the most important ones
Figures and Tables - All figures andtables go after the references Figures always go before tables
Section headings (eg Materials and Methods) should be capitalized and in bold type Secondary headings should be balded and go flush left Tertiary headings are incorporated into the first paragraph of that subsection Tertiary headings are italicized and separated from the text by a double dash
In the text references are cited in one of two ways 1 Swingle (1959) evaluated two species of tilapia or 2 pond culture in Alabama began in the 1950s (Swingle 1959) When there are three or more authors list only the first in a citation and follow that with et al eg Smitherman et al (1983) reviewed catfish breeding work at Auburn University If the name of an institutional author is long it can be abbreviated in a citation eg Food and Agriculture Organization of the United Nations may be abbreviated as FAO When several citations are used in a single entry they are listed chronologically If you are citing two papers that were written by the same author(s) the name only has to appear once per citation followed by the years that designate the different papers Separate the years with a comma If you are citing two authors you must separate the citations with a semicolon (Smith 1975 1976 Jones 1976)
In the reference section the reference list is strictly alphabetical by last name of the senior author and then by initials if two authors have identical last names If an author has written more than one paper the following format should be followed All single authored papers go first followed by co-authored papers and then the papers that were written by three or more authors If an author has written more than one single-authored paper the papers are listed chronologically If an author has written more than one co-authored paper they are listed alphabetically by the second authors last name If a tandem has authored two or more papers the order is chronological Papers written by the same group of three or more authors should be listed chronologically
International Journal of Recirculating Aquaculture Volume 5 June 2004 61
The following format will be used when referencing various works
PAPERS Single-author papers
McGinty AS Effects of Size at Stocking on Competition and Growth of All-Male Tilapia Hybrids Journal of the World Aquaculture Society 1985 16 52-56
Multiple-author papers Tave D Smitherman RO Predicted Response to Selection for Early Growth in Tilapia nilotica Transactions of the American Fisheries Society 1980 109 439-445
If an author has published two or more papers in the same year follow the years with a letter to differentiate them eg Smith 1988a 1988b Use issue numbers only when each issue starts out with page 1 If pagination is consecutive throughout the volume omit the issue number Spell out journal names in their entirely without abbreviations
Papers in proceedings or in edited volumes Nicholson LC Woods LC Ill Woiwode JG Intensive Culture Techniques for the Striped Bass and its Hybrids In Culture and Propagation of Striped Bass and Its Hybrids Harrell RM Kerby JH Minton RV Eds 1990 American Fisheries Society Bethesda MD USA
Books and reportspublications from governmental or non-governmental bodies
Lovell T 1989 Nutrition and Feeding of Fish Van Nostrand Reinhold New York NY USA
Food and Agriculture Organization of the United Nations (FAO) Fisheries Department 1997 Review of the State of World Aquaculture No 886 FIRlC886 FAO Rome Italy
Theses and Dissertations
Easter CC 1992 Water Chemistry Characterization and Performance of a Recirculating Aquaculture System Producing Hybrid Striped Bass Masters thesis Virginia Polytechnic Institute and State University Blacksburg VA USA
Websites
Federation of European Aquaculture Producers (FEAP) European Eel Production (httpwwwfeaporgeelshtml) 2002
Page numbers for proceedings books theses and dissertations are unnecessary Government publications should be treated as if they were books but document numbers must be included THE ACCURACY OF REFERENCES IS THE SOLE RESPONSIBILITY OF THE AUTHORS MAKE SURE THAT CITATIONS AND REFERENCES MATCH
Tables - When creating a table decide what the purpose of the table is and what points are important then organize the table so that the main features can be easily understood The table heading should provide sufficient information for the table to be understood as an entity Keep footnotes to a minimum Each table goes on a separate page Tables must be camera ready TABLES WILL BE PRINTED AS IS AND WILL NOT BE TYPESET Figures - List all figure captions on separate pages Original artwork doesnt have to be submitted when a paper is first submitted for review but original artwork must accompany the final revised manuscript Good quality photocopies are acceptable when a manuscript
62 International Journal of Recirculating Aquaculture Volume 5 June 2004
is submitted for review Graphs and original artwork must be printed with a laser printer or done in pen and ink Dot-matrix figures are not acceptable Original artwork or high-contrast photographs are acceptable Label all figures on the back with a soft pencil name of senior author paper title and figure number
Photographs - Should be on glossy paper with good contrast Do not glue pictures to cardboard Color photographs can be printed but the additional cost of printing them will be charged to the author Label all photos on the back with a soft pencil name of senior author paper title and figure number
FINAL REVISED MANUSCRIPTS If using the mail submit two copies of the final revised manuscript including original artwork Submit either the original pen-and-ink drawings or laser-printed versions of the drawings In addition submit the manuscript on a disk (CD preferable) or by e-mail On the disk write the brand name of the computer or word processor the word processing program that was used (should be Microsoft Word) the title of your article and the file name NOTE Disk and hard copy must agree In case of discrepancies it is the policy of IJRA to follow hard copy An electronic version of the completed manuscript is needed in order to publish AUTHORS MAY NOT RECEIVE PAGE PROOFS Proofreading will be done by the Production Office of IJRA using the revised final version of the manuscript Therefore authors must be especially careful that no errors exist in the final revised version because in most cases no changes are possible after it is submitted
REPRINTS The senior author will receive two copies of the journal and a pdf file of the article for distribution and reprinting purposes The junior author(s) will also receive two copies of the journal issue These are sent several weeks after the journal is published and in circulation Requests for the pdf format of the article can only be made by the corresponding author
COPYRIGHT amp PERMISSIONS For permission to reprint articles that have appeared in IJRA please contact IJRA Copyright amp Permissions Food Science amp Technology Building (0418) Virginia Tech Blacksburg VA 24061 USA
COPYRIGHT TRANSFER If your manuscript is accepted for publication copyright ownership must be officially transferred to IJRA The Editors acceptance letter will include a form fully explaining this The form must be signed by all authors and the original returned to the Editor at this time Failure to return the copyright form in a timely fashion will result in delay in publication
Send your submissions to International Journal of Recirculating Aquaculture
AI Correa Managing Editor 27-B Food Science and Technology Building (0418) Virginia Polytechnic Institute and State University Blacksburg VA 24061 USA
If you have any questions please feel free to contact us Phone (540) 231-2075 Fax (540) 231-9293 e-mail ijravtedu
International Journal of Recirculating Aquaculture Volume 5 June 2004 63

Fillet Yields of Tilapia (Oreochromis)
MATERIALS AND METHODS The fish used for the experiment are commonly called Rocky Mountain White Tilapia although a best guess is that they are a white inter-specific species of the genus Oreochromis primarily 0 niloticus 0 aureus and 0 mossambicus This hybrid has been selectively bred at Blue Ridge Aquaculture Inc (Martinsville VA USA) for its color and growth rate The white hybrids are desirable in the live fish market because of their generally attractive external appearance This hybrid grows rapidly and has other physiological attributes that make it well suited to culture in high-density aquaculture systems Although predominantly white the fish ranged in color from a bright white to a bluish and golden white to a few that were colored a reddish brown As fry the fish were given methyltestosterone mixed with their feed to chemically sex reverse the females Prior to delivery to Virginia Tech the fish were graded twice at Blue Ridge Aquaculture Inc to obtain a relatively uniform size by removing the runts
The fish were raised in 6607 L (150 gallon) agricultural watering troughs (Rubbermaid Winchester VA USA) The experiment was a three (temperatures) by four (feeding levels) factorial design having two replicates The nominal culture temperatures were 26 29 and 32degC and the feeding levels for each temperature conducted four times a day were saturation feeding 87 73 and 60 of the daily saturation feed rate The average fish weight at the beginning of the experiment was approximately 53g and the growth experiment lasted 20 weeks At the conclusion of the experiment the fish were taken off feed for three days prior to harvesting The tanks were completely drained and the live fish from each tank were placed in an ice-filled chest The fish were kept on ice for several hours prior to being filleted to anesthetize them and increase rigor making them easier to fillet and reducing the amount of blood in the fillet Prior to processing the fish were weighed to the nearest gram using a digital scale and measured to the nearest millimeter using a measuring board Fish weighing 300g or more were then filleted smaller fish were dissected to determine sex but were not filleted A total of 407 fish were filleted As noted the fish used in this experiment were chemically sex reversed ie from female to male and thus during the filleting process only 10 were identified as females Of that 10 a disproportionate number of females did not reach the 300g minimum cut-off weight for filleting thus only 24 fish identified as females were filleted
22 International Journal of Recirculating Aquaculture Volume 5 June 2004
Fillet Yields ofTilapia (Oreochromis)
The filleting was conducted by two competent fish cutters with extensive experience in filleting tilapia for a small Midwestern tilapia producer The v-notched skinless filleting was primarily accomplished with electric carving knives One individual cut across the torso just behind the gill and then cut horizontally down along the backbone through the ribcage to the tail While still attached to the tail the side of the fish was then flipped over and another horizontal cut was made along the skin to separate the meat from the skin and scales The sex of the fish was then determined based upon the internal sex organs The procedure was repeated on the other side of the fish The other individual cut the ribcage out of the fillet with an electric knife and removed the pectoral fin with a v-shaped cut The combined weights of the fillets for each fish were determined to the nearest gram on a digital scale
RESULTS
Fillet Weight Model A mathematical model of the fillet weight (Wf) in grams was fitted using the linear regression procedure (SAS Cary NC USA) Considered in the model were polynomials of weight and length condition factor temperature and feeding rate sex and interaction terms of the primary factors Only fish weight (W) in grams and length (L) in millimeters were found to be significant at the 95 confidence level and the resulting model was Wr = 650 - 0403L + 0401 W with a coefficient of determination (r2) of 0913 The reduced model Wr = -167 + 0336W produced an r2 of 0906 The fillet weight versus fish weight data and the regression line are shown in Figure 1 It appears that weight is a
--middot Figure I Relationship between fish weight and total fillet weight
International Journal of Recirculating Aquaculture Volume 5 June 2004 23
Fillet Yields o1ilapia (Oreochromis)
very good predictor of fillet yield and that for a given weight shorter fatter fish produce a slightly higher yield Although losing some predictive power the reduced model is more appropriate for several reasons Fish length and weight are highly correlated and therefore most of the predictive capability of length can be accounted for in the weight measurement The large positive intercept and the large negative coefficient for length in the full model are intuitively illogical Beyond the limits of the data set the full model produces unreasonable predictions For example predicted fillet weight of fingerlings would exceed the entire weight of the fish On the other hand the coefficients of the reduced model are intuitively logical and produce reasonable estimates of the fillet weights even beyond the limits of the data collected For the reduced model the 95 confidence interval for they-intercept is -215 to -119 and the 95 confidence interval for the weight coefficient is 0326 to 0347 Considering the variation in yield introduced by the filleting process the linear correlation between fillet yield and weight is good
Effect of Sex on Fillet Yields As noted previously fillet yield is a function of size and on average the females were only 666 as heavy as their male counterparts for a given treatment The question to be answered is whether the fillet yields of males and females of similar weights are different Once this is known it can be determined whether unisex production should be priced differently than mixed-sex production As noted above gender was not a significant factor in the construction of the fillet model but a paired t-test is a stronger statistical test For each of the 24 filleted females a male was selected at random that had the same or nearly the same body weight A paired t-test was used to compare the fillet weights and fish lengths of equal-sized males and females At the p = 005 level the differences in fillet yields were not significant but the males were found to be significantly longer F tests were used to compare the variance of the fillet weights and the lengths At the p = 005 level no statistical difference could be detected in the variance of the fillet weights or lengths
24 International Journal of Recirculating Aquaculture Volume 5 June 2004
Fillet Yields ofTilapia (Oreochromis)
Table 1 Comparison of length weight fillet weight and yield of males and females of comparable weight
Length Fillet (mm) Weight (g) Weight (g) Yleld ()
Males Average 2670 3758 1087 029 (SD) 147 647 244 0024
Females Average 2618 3760 1103 029 (SD) 153 647 219 002
DISCUSSION Weight is a good predictor of fillet yield The full model regression formula that included both fish weight and fish length produced a model with slightly greater predictive power than the reduced model that used only fish weight and could thus be of interest from an academic perspective Its predictive power is only slightly better than that of the reduced model From a practical perspective weight is relatively easy to measure whereas length is not and thus for commercial applications the reduced model is a more valuable tool than the full model
The wholesale price per kilogram for tilapia is generally based upon fish weight-fish heavier than 600g bring a premium price those between approximately 350 and 600g an intermediate price and those less than 350g a lesser price (Fitzsimmons and Posadas 1997) The reduced model predicts yields of 288 and 308 for 350g and 600g fish respectively which would justify a price premium of approximately 7 based strictly upon the increase in yield but which does not include any reduction in processing costs The yields obtained from this experiment are lower than both the 33 yield figure cited as a rule of thumb by Fitzsimmons and Posadas (1997) and the average fillet yield of 335 from 0 niloticus averaging 2074g cited by Obanu and lkeme (1988) In contrast Clement and Lovell (1994) obtained only a 254 fillet yield from 0 niloticus that weighed an average of 585g Several factors could account for the discrepancies including tilapia species and the skill of the fish cutter However the largest source of variation is likely to be the methods and procedures used in filleting which unfortunately are generally not reported in the literature Variability introduced by fillet technique and skill of the cutter is not included in this model because only one set of cutters was used
International Journal of Recirculating Aquaculture Volume 5 June 2004 25
Fillet Yields of Tilapia (Oreochromis)
Fillet yield is important information for making management decisions in pricing fish products selecting species specifying feed rations and controlling production costs Muscle yield of fish species has a big impact on the profitability of the aquaculture firm and on the survival of a specific marketing channel The fish producer is the last claimant to the consumers market price for fish and fish products The more handlers there are operating in a marketing channel the smaller the margins for each handler Gross retail margins for fresh fish usually command between 30 and 50 of the total profit depending on the marketing season and the fish species Producers are accustomed to marketing whole fish while customers are used to purchasing fish fillets When the useable flesh is separated from the whole fish the result is the fillet and a by-product Typically these by-products of the fish filleting process do not have significant value and their production cost has already been factored into the fish value The higher the yield ratio of muscle to by-product and the higher the market price the greater the chance a producer has of receiving a higher return on the aquaculture product Documentation of fillet yields coupled with market price indicate the value of the fish products in a marketing channel The better the yield the better the survival of a species in the marketplace
ACKNOWLDEGEMENT This material is based upon work supported by the Cooperative State Research Education and Extension Service US Department of Agriculture under Project No VA135559
REFERENCES Clement S Lovell RT Comparison of Processing Yield and Nutrient
Composition of Cultured Nile Tilapia (Oreochromis niloticus) and Channel Catfish (Ictalurus punctatus) Aquaculture 1994 119 299-310
Fitzsimmons K Posadas BC Consumer Demand for Tilapia Products in the US and the Effects on Local Markets in Exporting Countries In Proceedings of the Fourth International Symposium on Tilapia in Aquaculture (Orlando FL USA) Fitsimmons K (Ed) 1997 NRAES-106 Natural Resource Agriculture and Engineering Service (NRAES) Ithaca NY USA
26 International Journal of Recirculating Aquaculture Volume 5 June 2004
Fillet Yields oTilapia (Oreochromis)
Harvey D 2000 Aquaculture Outlook Economic Research Service US Department of Agriculture (Pub LDP-AQS-12) Washington DC USA
Kirkup SP Marsh LS Libey GS Heath AG Coale CW Haugh CG Effects of Temperature and Feeding Rates upon Growth and Feed Conversion Ratios in Tilapia In Proceedings of the Third International Conference on Recirculating Aquaculture (Roanoke VA USA) Flick G J and Rakestraw T (Eds) 2000 Virginia Tech Blacksburg VA USA
Losordo TM Westerman PW An Analysis of Biological Economic and Engineering Factors Affecting the Cost of Fish Production in Recirculating Aquaculture Systems Journal of the World Aquaculture Society 1994 25193-203
Obanu ZA lkeme AI Processing Characteristics and Yield of Some Fishes of the River Niger in Nigeria In Proceedings of the FAQ Expert Consultation on Fish Technology in Africa (Abidjan Cote DIvoire) FAQ Fish Report 1988 Supplement No 400 pages 218-220
Phipippart J-Cl Ruwet J-Cl Ecology and Distribution of Tilapias In_ ICLARM Conference Proceedings 7 (Bellagio Italy 1980) Pullin RSV and Lowe-McConnell RH (Eds) 1982 International Center for Living Aquatic Resources Management (ICLARM Manila Philippines
HematPlogy and Blood Chemistry Reference Intervals for Yellow Perch (Percajlavescens) Raised in Recirculation Systems
TC Hrubec1 and SA Smith2
1Department of Biomedical Sciences E Via Virginia College of Osteopathic Medicine Blacksburg VA 24060 USA
2Department of Biomedical Sciences and Pathobiology (0442) Virginia-Maryland Regional College
of Veterinary Medicine Virginia Polytechnic Institute and State University Blacksburg VA 24061 USA
Corresponding author current address Department of Biomedical Sciences and Pathology (0442) Virginia-Maryland Regional College of
Veterinary Medicine Virginia Polytechnic Institute and State University Blacksburg VA 24061 USA E-mail thrubecvtedu
Keywords Yellow perch Perea hematology blood chemistry reference values plasma biochemistry
International Journal of Recirculating Aquaculture 5 (2004) 29-42 All Rights Reserved copy Copyright 2004 by Virginia Tech and Virginia Sea Grant Blacksburg VA USA
International Journal of Recirculating Aquaculture Volume 5 June 2004 29
Hematology and Blood Chemistry of Yellow Perch (Percaflavescens)
ABSTRACT Determination of hematology and blood plasma biochemistry values is routinely used to assess the health of wild and domestic animals Yellow perch (Percaflavescens) culture is a growing segment of the US aquaculture industry and tools are needed to monitor the health status of these fish This paper reports reference values for complete hematological and biochemistry profiles of normal healthy yellow perch raised in recirculation culture conditions The following hematologic values were determined packed cell volume plasma protein erythrocyte leukocyte lymphocyte neutrophil monocyte and thrombocyte numbers A description of leukocyte morphology is presented Additionally the following plasma biochemical values were determined total protein albumin globulin creatinine total bilirubin alkaline phosphatase aspartate aminotransferase sodium potassium chloride calcium phosphorus magnesium glucose and cholesterol Reference values for a specific population of fish need to be determined prior to utilizing diagnostic blood samples from individuals Developing diagnostic hematology for fishes can enhance yellow perch culture by providing a means for the early detection and identification of infectious disease and of sub-lethal conditions that may affect production performance
INTRODUCTION Yellow perch (Percaflavescens) are an important game fish throughout much of the Northeast and Midwestern United States and Canada Contamination of natural waters by pollutants and an increased consumer demand for fresh seafood has led to the aquaculture production of yellow perch The culture of yellow perch is a rapidly emerging segment of aquaculture in the United States (Schmitz 1999) and has great economic potential especially in recirculation aquaculture systems (Kelly 2000 Mallison 2000) As more producers cultivate yellow perch it will become increasingly important to accurately evaluate the health of these fish and to develop tools such as diagnostic hematology to monitor the health status of fish during their production cycle
Diagnostic evaluation of blood parameters has been used extensively for many mammalian avian and reptilian species The rapidly growing aquaculture industry will increasingly need to utilize information of this type in order to assess the health status of cultured fishes Unfortunately hematology use in aquaculture remains limited in part due to the lack of
30 International Journal of Recirculating Aquaculture Volume 5 June 2004
Hematology and Blood Chemistry of Yellow Perch (Percaflavescens)
reliable reference blood values for most fish species Accurate reference intervals have been developed for some species including hybrid striped bass and tilapia under different production settings (Hrubec et al 1996 1997ab 2000 2001 Hrubec and Smith 2000) and for trout (biochemistry only Wedemeyer and Nelson 1975) pacu (hematological only Tocidlowski et al 1997) and milkfish (Ram-Bhaskar and Srinivasa-Rao 1989)
Little is known about the blood response of yellow perch There are few studies that have previously measured blood values in yellow perch (Toneys and Coble 1980 Nelson et al 1988 Nelson and Mitchell 1992 van den Heuvel et al 2000) Only a few parameters such as hematocrit sodium and chloride were determined as most of these studies were toxicological in nature and evaluated changes in other body systems The objective of this study was to generate a complete comprehensive list of reference blood values for normal healthy yellow perch (Perea flavescens) raised to market size in a recirculation system for later use as a diagnostic tool This is the first paper to report full hematological and biochemical profiles for production yellow perch
MATERIALS AND METHODS
Juvenile yellow perch were stocked into production recirculation systems as fingerlings and reared through their production cycle indoors in 10219-L recirculation tanks with a rotating biological contactor filter and 10 freshwater exchange per day At the end of their production cycle when the fish were 17 months old approximately 250 fish were removed from the production system and placed in a smaller 2400-L circular tank with a slant tube clarifier and a trickle biofilter The smaller tank had a freshwater replacement rate of 15 per day The fish were placed in the smaller systems to allow for a more rapid and less stressful capture procedure The fish were acclimated to the new tanks for 3 weeks The photoperiod was approximately 14-h light and 10-h dark Fish were fed daily to satiation with a commercial pelleted diet (Rangen EXTR 400 40 protein 10 fat Rangen Inc Buhl ID USA) The following water quality parameters were determined daily temperature pH ammonia alkalinity hardness nitrite nitrate and dissolved oxygen Ranges for water quality over the duration of the study are shown in Table 1 and are representative of water quality observed daily in these tank systems
International Journal of Recirculating Aquaculture Volume 5 June 2004 31
Hematology and Blood Chemistry of Yellow Perch (Perea flavescens)
Table 1 Water quality parameters for yellow perch (Percaftavescens) reared in a recirculation culture system Values are means plusmn standard deviations for the parameters on the days that fish were bled for hematological and blood biochemical determinations and are representative of the daily water quality values in the system
Parameter For Hematology Fish For Chemistry Fish
Temperature (degC) 209 plusmn 001 207plusmn 11
pH 78plusmn01 79 plusmn 02
NH3 un-ionized (mgL) 0012 plusmn 0012 0011 plusmn 0005
N02-N (mgL) 0031 plusmn 0015 0043 plusmn 0043
N03-N (mgL) 60 plusmn 26 28 plusmn09
Alkalinity (mgL) 252 plusmn44 313 plusmn 48
Hardness (mgL) 399 plusmn 10 433 plusmn27
Dissolved Oxygen (mgL) 74plusmn05 74 plusmn03
Fish were netted rapidly and anesthetized in aerated tank water with buffered tricaine methanesulfonate (MS-222 Sigma Chemical Co St Louis MO USA) until they began to lose equilibrium approximately 20 seconds Individual fish were bled for either hematological determinations (23g needle 1-mL syringe) or for biochemical determinations (23g needle 3-mL syringe) in both cases blood was collected from the caudal vessels After blood samples were collected the fish were weighed measured and checked for external and internal pathologic lesions The sex of each fish was determined by internal observation of the gonads
Blood for hematological determinations was transferred to an ethylenediamine-tetraacetic acid (EDTA) treated pediatric blood tube and held on ice until analysis (lt 1 hour) Blood for biochemical determinations was collected into cold 3-mL heparinized blood tubes and centrifuged at 14000 x g immediately Plasma was collected and frozen at -10degC until analyzed The following analytes were determined in the plasma with an Olympus AU-400 (Olympus America Inc Melleville NY USA) automated clinical chemistry analyzer total protein albumin creatinine total bilirubin alkaline phosphatase (ALP) aspartate aminotransferase (AST) cholesterol glucose sodium potassium chloride phosphorus calcium and magnesium Globulin was calculated from the total protein value minus the albumin value
32 International Journal of Recirculating Aquaculture Volume 5 June 2004
Hematology and Blood Chemistry of Yellow Perch (Percaflavescens)
Hematological analytes were determined from the EDTA anticoagulated blood As we have observed for other fish species EDTA was superior to heparin for yellow perch blood both in preventing clot formation and preserving cellular morphology (Hrubec et al 1996 2000) Blood from the EDTA tube was drawn into microhematocrit tubes and the packed cell volume (PCV) determined after centrifugation at 10000 x g for 5 min Plasma protein was determined with a clinical refractometer using plasma from the microhematocrit tube The total erythrocyte and leukocyte-plus-thrombocyte counts were determined manually with a Neubauer hemacytometer using Natt-Herricks solution as a diluent stain (Natt and Herrick 1952) Blood smears made within 45 minutes of sample collection were stained with Wright-Geimsa stain and were used to determine the differential counts as follows Leukocytes and thrombocytes were identified and counted on the blood smears until 200 leukocytes and a variable number of thrombocytes were enumerated The percentages of each leukocyte type and of thrombocytes were multiplied by the total leukocyte-plus-thrombocyte number to give the final cell counts Thrombocyte numbers were subtracted from the leukocyte-plus-thrombocyte count to give the total leukocyte count This method of manually determining total leukocyte and differential counts has been recommended for use with avian (Zinkl 1986) and fish blood (Hrubec et al 1996 1997ab 2000 2001) as the nucleated red cells prevent accurate enumeration using automated analysis (Huffman and Arkoosh 1997) Slight thrombocyte clumping was observed on the hemacytometer for some individuals only fish with minimal thrombocyte clumping(lt 4 cells clumped) were used for the differential counts to ensure accuracy of the counts
Reference intervals were determined following the guidelines proposed by the National Committee for Clinical Laboratory Standards (NCCLS 1992) As suggested in these guidelines the data were checked for outliers using the 13 differencerange ratio and no outliers were identified The values were then ranked and the high and low 25 were discarded The range of the remaining values provided the reference interval
RESULTS AND DISCUSSION The physiologic and health status of an individual is reflected in the blood producing variations in hematological and blood biochemical values Clinical analysis of blood is a fundamental tool used in human
International Journal of Recirculating Aquaculture Volume 5 June 2004 3 3
Hematology and Blood Chemistry of Yellow Perch (Percaflavescens)
and veterinary medicine to diagnose and predict the outcome of disease and to monitor the effect of therapeutic nutritional and environmental management Blood analysis is not used extensively as a diagnostic tool in fish medicine partly due to the lack of reference intervals for various fish species and also because changes associated with specific diseases and metabolic disorders are not well characterized With sufficient background data clinical analysis of individual blood samples could detect infectious diseases metabolic disorders and sub-lethal disease states affecting production performance
Hematological and plasma biochemistry data from diseased individuals can be evaluated by direct comparison to a reference interval which is the appropriate range of variation in a blood parameter from a defined population of individuals under specific conditions The reference interval needs to be determined on a sufficient number of normal healthy individuals under similar production conditions using standardized analytical techniques (NCCLS 1992) When the deviation in a blood parameter is large enough to fall outside the reference interval it indicates the value may be aberrant and is most likely not due to individual variation for a given fish
Few previous studies have determined blood parameters for yellow perch (Toneys and Coble 1980 Nelson et al 1988 Nelson and Mitchell 1992 van den Heuvel et al 2000) These studies are of limited relevance as they were primarily toxicological studies and only a few blood parameters were determined and also because blood samples were collected and handled by differing methods prior to determination of the blood value Some of the capture (hook and line and gill netting) and blood collection methods (severing the caudal peduncle) used in these studies are also unsuitable for diagnostic blood samples as they result in significant alteration in the blood which will mask diseased states The study with the closest sampling procedure to that used in our experiment only presented selected blood chemistry values for yellow perch after 16 hours of moderate or exhaustive exercise (Nelson and Mitchell 1992) Therefore although the previous studies on yellow perch hematology are helpful in determining the effects of environmental factors and stress they have limited diagnostic utility and even prevent meaningful comparison with the data presented in this paper
The average mean weight of the yellow perch used for the hematological determinations was 125 +- 14g with a total length of 223 +- 08 cm For
34 International Journal of Recirculating Aquaculture Volume 5 June 2004
Hematology and Blood Chemistry of Yellow Perch (Percajlavescens)
the biochemical determinations the fish had a weight of 121 +- 15g and length of 226 +- 08 cm The results of the hematological determinations from 52 fish are listed in Table 2 Values for plasma chemistry reference intervals determined on 42 samples are listed in Table 3 Overall both the hematological and plasma chemistry values were similar to those reported previously for hybrid striped bass and tilapia reared in recirculation systems (Hrubec et al 1996 2000 Hrubec and Smith 2000) The striped bass and tilapia from production systems exhibited wider ranges in value for the different leukocyte types increased numbers of reticulocytes increased plasma and total protein values increased creatinine values and a decreased plasma chloride concentration as compared to fish in lower density recirculation tanks We did not compare blood values from the production yellow perch in this study to yellow perch maintained in low-density tank settings so were unable to determine if these same trends are apparent in yellow perch as well However based on our previous experience with fish hematological and plasma biochemical values there is an indication that these trends are occurring in yellow perch as well
Table 2 Hematological reference intervals for adult yellow perch (Perea flavescens) reared in a recirculation system
Analyte N Reference Interval Mean Stds1
PCV2 () 57 29-47 388 45
Plasma Protein (gdl) 57 60-82 67 06
Erythrocytes (x 106ml) 53 2160-3345 2737 0356
Leukocytes (ml) 53 52590-186490 113914 39086
Lymphocytes (ml)
Small 53 36800-153420 85630 31728
Large 53 3530-23 130 11602 5359
Neutrophils (ml) 53 1860-35950 12430 8837
Monocytes (ml) 53 670-12640 4252 2874
Thrombocytes (ml) 53 38270-118510 72972 21299 1Standard deviation 2Packed cell volume
International Journal of Recirculating Aquaculture Volume 5 June 2004 35
Hematology and Blood Chemistry of Yellow Perch (Perea flavescens)
Table 3 Plasma biochemical values for adult yellow perch (Percaftavescens) reared in a recirculation system
Analyte N Reference Interval Mean Stds1
Total Protein (gdl) 42 37-50 45 04
Albumin (gdl) 42 06-09 07 01
Globulin (gdl) 42 31-42 37 03
Creatinine (mgdi) 42 04-10 06 01
Total bilirubin (mgdi) 42 03-04 03 01
ALP2 (UI) 42 50-114 822 249
AST3 (UI) 42 2-29 85 64
Glucose (mgdi) 42 62-181 1000 350
Cholesterol (mgdi) 42 182-323 2440 330
Sodium (mEqI) 42 138-153 1470 40
Potassium (mEqI) 42 20-38 32 05
Chloride (mEqI) 42 119-133 1260 40
Calcium (mEqI) 42 86-120 103 13
Phosphorus (mEqI) 42 50-96 74 11
Magnesium (mEqI) 42 17-34 27 04 1 Standard deviation 2 Alkaline phosphatase 3 Aspartate aminotransferase (SGOT)
The blood cells present in the yellow perch were typical of teleost fish and included erythrocytes thrombocytes and leukocytes (Fig 1) Erythrocytes were oval to round with characteristic red cytoplasm and an elongate and centrally-located nucleus Immature erythrocytes or reticulocytes demonstrated a blue-purple tinge to the normal eosinophilic cytoplasm (Fig IA B C) The yellow perch had increased numbers of reticulocytes (included in the erythrocyte count) with approximately 7 to 10 per field at lOOx oil immersion compared to what we observe for most fish species The cause for the apparent reticulocytosis is not known but has been observed in other fish species exposed to elevated nitrite and nitrate (Grabda et al 1974 Hrubec et al 1996 2000 Hrubec and Smith 2000)
36 International Journal of Recirculating Aquaculture Volume 5 June 2004
Hematology and Blood Chemistry of Yellow Perch (Perea flavescens)
T bull middotmiddot ~~ - middot
N -
Figure I Characteristic blood cells from yellow perch reared in recirculation systems Blood smears were made with EDTA anticoagulated blood stained with Wrights Geimsa stain Cells are abbreviated as follows U - Large lymphocyte SL - small lymphocyte T - thrombocyte R - reticulocytes (immature erythrocyte) PC - plasma cell (activated lymphocyte) M- monocyte N-neutrophil The blue bar in frame A is Omm
International Journal of Recirculating Aquaculture Volume 5 June 2004 37
Hematology and Blood Chemistry of Yellow Perch (Percajlavescens)
The thrombocytes were slightly smaller than the erythrocytes (Fig IA) They had clear cytoplasm and were variable in shape being elongated pyriform oval or round Nuclear shape tended to follow cytoplasmic shape although oval and round thrombocyte nuclei occasionally were lobulated (Fig IB) as described for striped bass and tilapia (Hrubec et al 1996 2000)
Leukocytes made up the remainder of the cell types seen in the blood and included small and large lymphocytes neutrophils and monocytes No eosinophils or heterophils were observed Small lymphocytes were the smallest cell present with a rim of blue cytoplasm surrounding the round nucleus (Fig IA E F) Large lymphocytes had an abundant and darker blue cytoplasm and the nucleus was larger than observed in the small lymphocyte (Fig IA E) Plasma cells were occasionally observed with a classic open nucleus abundant dark blue cytoplasm and a clear cytoplasmic region adjacent to the nucleus presumably representing the Golgi as in mammalian plasma cells (Fig IC) Plasma cells were included in the large lymphocytes category for the differential counts
Neutrophils were the largest cell present in the blood (Fig ID E F) The cytoplasm of the neutrophil was a translucent grey containing no granules and infrequent vacuoles Cytoplasmic shape was round to angular as the cellular borders often appeared slightly adherent to adjacent erythrocytes distorting cellular shape Nuclear shape of the neutrophil varied from round to horseshoe shaped and frequently segmented into two prominent lobes connected by a thin nuclear bridge (Fig IF) Monocytes had abundant dark blue cytoplasm that was frequently vacuolated (Fig ID) The round to kidney-bean shaped monocyte nucleus was large with prominent chromatin clumping
Analysis of blood parameters can provide a wealth of information useful in analyzing the effects of disease and sub-optimal environmental conditions Providing reference intervals for healthy adult yellow perch reared in recirculation systems furnishes veterinarians and fish health professionals the foundation to develop diagnostic hematology for this species The number of studies that determine actual reference intervals for fish species is limited The majority of blood values determined for fishes are reported in the literature as a mean value with a standard deviation Historically reference intervals were determined as two standard deviations from the mean however this method is only valid when blood values follow a normal distribution It is incorrect to assume
38 International Journal of Recirculating Aquaculture Volume 5 June 2004
Hematology and Blood Chemistry of Yellow Perch (Percaflavescens)
that biological parameters are distributed normally therefore non-parametric methods should be used to accurately determine reference intervals (Reed et al 1971) Techniques to properly determine reference intervals have been established by the NCCLS (1992) and suggestions for their use and interpretation have been discussed (Lumsden 1998) As with mammalian species reference intervals need to be determined for different populations of fish within a single species as culture conditions and environmental variables affect blood values to the extent that they are outside the reference interval (Ram-Bhaskar and Srinivasa-Rao 1989 Hrubec et al 1996 1997ab 2000 2001) Although the reference range for some of the blood parameters appears large it is still possible to detect variation in hematologic values associated with pathological conditions (Hrubec et al 1997b and unpublished data)
Developing reference intervals is a necessary first step in determining which specific hematological changes can be associated with disease conditions As the field of fish hematology develops its usefulness to the aquaculture industry will increase Information derived by standardized non-lethal diagnostic assays will be needed to enhance the culture of yellow perch and other fish species Analysis of diagnostic blood samples can provide a means for early detection of infectious disease and assist in the identification of sub-lethal conditions affecting production performance This should allow for more specific timely and effective disease treatments in the future
ACKNOWLEDGEMENTS The authors wish to thank Mark Kidd of the Virginia Tech Aquaculture Center for his assistance with fish care and sampling
REFERENCES Grabda E Einszporn-Orecka T Felinska C Zbanyszek R
Experimental Methemoglobinemia in Rainbow Trout Acta Ichthyologica et Piscatoria 1974 4 43-71
Hrubec TC Smith SA Robertson JL Feldman B Veit HP Libey G Tinker MK Comparison of Hematologic Reference Intervals between Culture System and Type of Hybrid Striped Bass American Journal of Veterinary Research 1996 57 618-623
International Journal of Recirculating Aquaculture Volume 5 June 2004 3 9
Hematology and Blood Chemistry of Yellow Perch (Percajiavescens)
Hrubec TC Robertson JL Smith SA Effects of Temperature on Hematologic and Serum Biochemical Profiles of Hybrid Striped Bass (Morone chrysops x Morone saxatilis) American Journal of Veterinary Research 1997a 58 126-130
Hrubec TC Robertson JL Smith SA Effects of Ammonia and Nitrate Concentration on Hematologic and Serum Biochemical Profiles of Hybrid Striped Bass (Morone chrysops x Morone saxatilis) American Journal of Veterinary Research 1997b 58 131-135
Hrubec TC Smith SA Hematology and Plasma Chemistry Values for Production Tilapia ( Oreochromis hybrid) Raised in a Recirculation System International Journal of Recirculating Aquaculture 2000 J 5-14
Hrubec TC Cardinale JL Smith SA Hematology and Plasma Chemistry Reference Intervals for Cultured Tilapia ( Oreochromis hybrid) Veterinary Clinical Pathology 2000 29 7-12
Hrubec TC Smith SA Robertson JL Age Related Differences in Hematologic and Plasma Chemistry Analytes of Hybrid Striped Bass Morone chrysops x Morone saxatilis Veterinary Clinical Pathology 2001 30 8-15
Huffman PA Arkoosh MR Characteristics of Peripheral Blood Cells from Rainbow Trout Evaluated by Particle Counter Image Analysis and Hemocytometric Techniques Journal of Aquatic Animal Health 1997 9 239-248
Kelly AM Yellow Perch Culture in the United States Manna or Mania World Aquaculture 2000 31 4-17
Lumsden JH Normal or reference values Questions and Comments Veterinary Clinical Pathology 1998 27 102-106
Mallison JA 2000 A White Paper on the Status and Needs of Yellow Perch Aquaculture in the North Central Region North Central Regional Aquaculture Center Michigan State University E Lansing MI USA
Natt MP Herrick CA A New Blood Diluent for Counting Erythrocytes and Leukocytes of the Chicken Poultry Science 1952 31 735-738
40 International Journal of Recirculating Aquaculture Volume 5 June 2004
Hematology and Blood Chemistry of Yellow Perch (Percaflavescens)
NCCLS National Committee for Clinical Laboratory Standards 1992 How to Define Determine and Utilize Reference Intervals in the Clinical Laboratory Proposed Guidelines NCCLS Document C28-P Villanova PA USA
Nelson JA Mitchell GS Blood Chemistry Response to Acid in Yellow Perch (Perea flavescens) Comparison of Populations from Naturally Acidic and Neutral Environments Physiological Zoology 1992 65 493-514
Nelson JA Magnuson J J Chulkasem W Blood Oxygen Capacity Differences in Yellow Perch (Percaflavescens) from Northern Wisconsin Lakes Differing in pH Canadian Journal of Fisheries and Aquatic Sciences 1988 45 1699-1704
Ram-Bhaskar B Srinivasa-Rao K Influence of Environmental Variables on Hematology and Compendium of Normal Hematological Ranges of Milkfish Chanos chanos (Forskal) in Brackish Culture Aquaculture 1989 83 123-136
Reed AH Henry RJ Mason WB Influence of Statistical Method Used on the Resulting Estimate of Normal Range Clinical Chemistry 1971 17 275-284
Schmitz M 1999 Comparative Growth of All-Female Versus Mixed Sex Yellow Perch (Percaflavescens) in Recirculating Aquaculture Systems MS Thesis Virginia Tech Blacksburg VA USA
Toneys ML Coble DW Mortality Hematocrit Osmolality Electrolyte Regulation and Fat Depletion of Young-of-the-Year Freshwater Fishes under Simulated Winter Conditions Canadian Journal of Fisheries and Aquatic Science 1980 37 225-232
van den Heuvel MR Power M Richards J MacKinnon M Dixon DG Disease and Gill Lesions in Yellow Perch (Percaflavescens) Exposed to Oil Sands Mining-Associated Waters Ecotoxicology and Environmental Safety 2000 46 334-341
Wedemeyer GA Nelson NC Statistical Methods for Estimating Normal Blood Chemistry Ranges and Variance in Rainbow Trout (Salmo gairdneri) Shasta Strain Journal of the Fisheries Research Board of Canada 1975 32 551-554
International Journal of Recirculating Aquaculture Volume 5 June 2004 41
Hematology and Blood Chemistry of Yellow Perch (Percajlavescens)
Zinkl JG Avian Hematology In Schalms Veterinary Hematology (4th edition) Jain NC (Ed) 1986 Pages 256-260 Lippincott Williams amp Wilkins Philadelphia PA USA
42 International Journal of Recirculating Aquaculture Volume 5 June 2004
Hatchery and Grow-out Performance of Sunshine Bass and Backcross Hybrid Striped Bass in Recirculating Aquaculture Systems
SR Lindell1bull2 B Delbos1 R Perham1 J Goldman1 EM Hallerman3 TO Brenden3bull4
1 Fins Technology 15 Industrial Road Turners Falls MA 01376 USA
2Current address Marine Biological Laboratory Marine Resources Center 7 MBL Street Woods Hole MA 02543 USA
3Department of Fisheries and Wildlife Sciences (0321) Virginia Polytechnic Institute and State University Blacksburg VA 24061 USA
4Current address Institute of Fisheries Research University of Michigan 1109 N University Avenue Ann Arbor MI 41809 USA
Corresponding authors e-mail ehallermvtedu
Keywords striped bass performance aquaculture growth
International Journal of Recirculating Aquaculture 5 (2004) 43-54 All Rights Reserved copyCopyright 2004 by Virginia Tech and Virginia Sea Grant Blacksburg VA USA
International Journal of Recirculating Aquaculture Volume 5 June 2004 43
Performance of Sunshine Bass and Backcross Hybrid Striped Bass
ABSTRACT Previous research has suggested that backcross hybrid striped bass (BX sunshine bass female x striped bass male) perform as well as F 1 hybrid striped bass (sunshine bass white bass female x striped bass male) for many economically important traits We conducted trials to compare rearing and growth traits of selected backcross hybrid striped bass with hybrid striped bass (HSB) We spawned and reared larval BX fry in two hatchery cycles measured fry growth and performance and compared them to past performance of HSB fry We conducted a grow-out trial of commercially-available hybrid striped bass versus backcross hybrid striped bass in replicated tanks to phase II fingerling size (approximately lOOg) Compared to HSB in the hatchery phase backcross hybrid striped bass exhibited lower fertilization rate comparable swimbladder inflation rate shorter time-to-weaning lower survival comparable growth and comparable condition factor After 60 days HSB exhibited significantly better growth survival and feed conversion efficiency than BX However BX may have better potential market acceptance by virtue of having a lower condition factor appearing longer and less deep-bodied than HSB
INTRODUCTION Striped bass (Morone saxatilis) and its hybrids constitute a major sector of aquaculture in the United States with production of 105 million pounds in 2002 (Carlberg and Van Olst 2003) Commercially significant quantities of Morone stocks also are produced in Taiwan China and Israel Approximately 43 of Morone production occurs in tanks (Carlberg and Van Olst 2003) much of that in recirculating aquaculture systems (RAS) Private and government marketing experts estimate that US production could increase to 50 million pounds and $100 million in annual farm-gate revenue if market prices could be decreased only moderately (Halbrendt et al 1991) Production costs for HSB could be reduced by 12 if selective breeding can yield 20 faster growth rates (Losordo and Westerman 1994)
The majority of Marone production is not of striped bass but of its hybrids with white bass (M chrysops) because of their hardiness rapid growth rate and limited availability of female striped bass broodstock (reviewed by Harrell 1997) Further female WB are considered easier and more predictable to strip-spawn Hence most commercial production
44 International Journal of Recirculating Aquaculture Volume 5 June 2004
Performance of Sunshine Bass and Backcross Hybrid Striped Bass
is of sunshine bass the progeny of the white bass female x striped bass male interspecific cross Research has also been undertaken to evaluate the performance of second generation hybrids and backcrosses Several studies have suggested that the progeny of F 1 hybrid striped bass females backcrossed to striped bass males have merit for commercial production Jenkins et al (1998) compared the performance of backcross hybrids to F1 hybrid striped bass and striped bass to market size in a recirculating system At harvest no differences in growth rate or feed conversion were detected specific growth of BX was intermediate to those of the other stocks with survival lower Tomasso et al (1999) compared performance of F 1 and backcross hybrids between 20 and 90 grams for 56 days in tanks (Tomasso et al 1999) and observed similar survival growth and feed conversion rates among the hybrid types Detailed comparison of the hatchery performance of sunshine and BX hybrids is lacking We hypothesized that use of selected hybrid striped bass and striped bass for the backcross might yield a high-performance BX hybrid Should high performance be realized progressive fish farmers might utilize this approach by selecting the best F1 hybrid females from their own production stocks making the backcross by strip-spawning them and fertilizing the eggs with purchased milt from selectively bred striped bass males (Kerby 1983) thereby obtaining a high-performance production stock that because of selection on the maternal stock is suited to their particular farm conditions
In this study we evaluated the production potential of backcross (BX) hybrid striped bass (female sunshine bass x male striped bass) We compared the hatchery and grow-out performance of BX spawned from select broodstock and sunshine bass (HSB) of common genetic background Specifically we evaluated spawning success hatch rate growth survival and feed conversion efficiency through the first six months of life In order to benchmark our results we ran a trial in replicated tanks with HSB supplied by the most widely-used commercial source of fingerlings (Keo Fish Farms Keo AR USA) and compared their performance with our BX All fish were cultured within intensive controlled-environment recirculating aquaculture systems
International Journal of Recirculating Aquaculture Volume 5 June 2004 45
Performance of Sunshine Bass and Backcross Hybrid Striped Bass
MATERIALS AND METHODS In July 2001 we crossed 4 hybrid striped bass females to each of 4 striped bass males to produce 16 families of backcross hybrid striped bass Poor fertilization rates resulted in a low yield of fry from this spawn However there were enough fry to pool and conduct a pilot commercial-scale hatchery run Randomly-chosen samples from the resulting 4000 fingerlings were used for the grow-out trial
In October 2001 we spawned 3 female HSB with 2 male SB and eventually produced 7000 fingerlings While this was not enough to grow in commercial-scale systems we collected hatchery performance data to corroborate our JulyAugust experience with BX
Fertilized eggs were incubated in McDonald jars Upon hatch the larvae swam out of the hatching jar and into a 1900-L larval rearing tank Replicate larval rearing tanks were stocked with approximately 25 larvae per liter Tanks were maintained with recirculating water and surface oil-skimming pads for the first 5 to 7 days post-hatch until swim-bladder inflation was completed For the second week post-hatch larval rearing tanks were maintained static with gentle central aeration except for an exchange of about 30 of the tank water over the course of two hours each day During the second week post-hatch larvae were fed rotifers enriched with Algamac (Aquafauna BioMarine Inc Hawthorne CA USA) maintained at a density of 10ml By the end of the second week larvae were weaned from rotifers to Artemia nauplii By the end of the third week the larvae were typically weaned from enriched Artemia to artificial feed (Biokyowa Inc Girardeau MO USA) Weaned larvae were graded just once around 60 days post-hatch to remove the top 1 to 2 of larger fish responsible for cannibalism
In November 2001 we purchased lOg fingerlings that represent typical industry-standard HSB from Keo Fish Farms (Keo AR USA) These HSB closely matched the size and weight of our BX from the July spawn for the grow-out trial BX and HSB fingerlings were each stocked separately in triplicate 1900-L round tanks connected to the same recirculating system and reared at 23degC and a salinity of 1-3 ppt All six tanks were similarly stocked initially (approximately 1 kgm3) Fish were offered 80 of their expected ration via belt-feeders and hand-fed to satiation twice a day Approximately every 3 weeks length and weight samples were taken from a randomly-chosen 15 of each tanks
46 International Journal of Recirculating Aquaculture Volume 5 June 2004
Performance of Sunshine Bass and Backcross Hybrid Striped Bass
population At the conclusion of the project the tanks reached typical commercial densities of 5 to 9 kgm3bull
We quantified reproductive and hatchery performance of the three groups including fertilization rate swimbladder inflation rate days to weaning onto artificial feed (ie date of first ingestion to date that gt90 ingested artificial feed) survival estimates to approximately 60 days after hatch and to the end of the study feed conversion rate and monthly average weight and length The trial continued until mid-February 2002 when the HSB averaged approximately lOOg Results from previous years hatchery efforts with HSB using similar rearing protocols were used for comparative purposes
Both the hatchery and grow-out systems employed water recirculation technology including drum-filters fluidized-bed biofilters oxygenation ozonation and automated pH and temperature control that maintained high water-quality standards throughout the trials
Differences in fish weight between the hybrid types were analyzed as a repeated-measures general linear mixed model Residual (restricted) maximum likelihood was used to estimate the model parameters Initial fish biomass in each of the tanks and the amount of feed provided to each of the tanks were included in the model as covariates to assess the influence of these concomitant variables on differences in weight A first-order autoregressive covariance structure was assumed for the repeated-measurements of fish weight
Differences in fish survival at the end of the grow-out trial were analyzed as a general linear model with tanks serving as a blocking factor Because fish survivalmortality is a binary response and thus will violate an assumption of normality the significance of the test comparing survival between the hybrid types was obtained by randomization (number of randomizations= 1000) whereby the F-statistic of the original test was compared to F-statistics obtained by randomly allocating the survival mortality data to the different hybrid types The Type-I error rate for all statistical tests was set equal to 005
International Journal of Recirculating Aquaculture Volume 5 June 2004 47
Performance of Sunshine Bass and Backcross Hybrid Striped Bass
Table 1 Comparison of hatchery traits of backcross (BX) and Fl hybrid (HSB) striped bass for traits of economic interest
Traits of interest BX-HSB BX-HSB HSB HSB HSB
Female parent strain1 AR ARMD AR AR AR
Male parent strain1 MD FL MD FL MD MD FL MD Canada
Spawn date Oct-01 Jul-01 Mar-01 Oct-00 Jan-99
Fertilization 32 22 53 57
Swimbladder inflation 90 50 98 95
Weaning start (DAH)2bull3 24 21 17 22
Weaning end (DAH4 33 32 37 38
Mean wt (g) at 60 DAH 042 052 042 05
Survival to 60 DAH 7 740 104
Mean L (mm) at 30 DAH 133 11 1225
Mean L (mm) at 36 DAH 139 167
Mean L (mm) at 75 DAH 367 404 452
Mean Wt (g) at 75 DAH 074 081 12 0825 11
Condition factor at 1g 123E-05 118E-05 1Strain abbreviations AR=Arkansas R MD=Maryland FL=Florida 2DAH=Days after Hatch 3Weaning start marks the first introduction and ingestion of dry feed to replace live feeds 4Weaning end denotes the time when the transition to dry feeds is complete and live feeds are no longer utilized
RESULTS
Hatchery Trial Results A summary of performance for hatchery traits of production interest for BX and HSB is presented in Table 1
The fertilization rate for the BX eggs was lower than that which we typically found with HSB (22-32 vs 55) and considerably lower than our experience in 2000 when we conducted fertilization trials with BX (80)
Swimbladder inflation rate ranged from 50 in the first hatchery run to 90 in the second run We attribute the low rate in the first run to
48 International Journal of Recirculating Aquaculture Volume 5 June 2004
Performance of Sunshine Bass and Backcross Hybrid Striped Bass
surface-film and system management problems We showed in the second run that swimbladder inflation in BX was comparable to that typically attainable (gt90) for Morone fry
Time-to-weaning onto dry diets was shorter (10 days versus 18 days) and earlier (day 33 versus day 38) for BX than for HSB Survival of BX to 60 days after hatch (7) was lower than expected on the basis of previous experience with HSB (gt10) Mean weights for BX at 60 days after hatch in two hatchery runs (052 and 042g) was similar to those for HSB (042 and 05g) However HSB exhibited greater mean weight than BX at 75 days after hatch (l04 vs 077g)
Condition factor (K) of BX (123 + 009) was not significantly different from those of HSB (119 + 005) or striped bass (l13 + 003) at 1 gram mean weight
Frequencies of deformities for BX (lt2) were lower than those in earlier reports Bosworth et al (1997) reported deformities in 8 of BX and 4 ofHSB
Grow-out Trial Results Overall there was not a significant difference in weight between the hybrid types (F = 606 df = 13 P = 00907) however as evidenced in
100
80
60
40
20
--+- BX - Overall -0- HSB - Overall -ltgt- BX - Individual Tanks A middot middot middotbullmiddotmiddot middot HSB - Individual Tanks fi
fi ~o
12 Dec 2001 3 Jan 2002 24 Jan 2002 12 Feb 2002
Date Figure 1 Meanfish weight(plusmn 2 SE) at each time period for backcross hybrid striped bass (BX) and hybrid striped bass (HSB) Also shown is meanfish weight at each time periodor groups in individual tanks
International Journal of Recirculating Aquaculture Volume 5 June 2004 49
Performance of Sunshine Bass and Backcross Hybrid Striped Bass
Figure 1 there was a significant interaction on fish weight by hybrid type and time (F = 5157 df = 1587 P lt 00001) Using the slicing option available in SAS (SAS Institute 1999) we tested for differences in weight between the hybrid types for each time period and found that although weights of HSB and BX were not significantly different during the first two measurement periods (Time 1 F = 027 df = 1587 P = 06032 Time 2 F = 036 df = 1587 P = 05496) the hybrid types did differ in weight during the last measurement periods Specifically HSB were significantly heavier than BX on the 24th of January 2002 (F = 1061 df = 1 587 P = 00032) and the 12th of February 2002 (F = 3788 df = 1587 P lt 00001) Overall HSB had a specific growth rate of 268 per
Table 2 Mean weights of backcross hybrid striped bass (BX) and hybrid striped bass (HSB) over the course of a 3-month growth trial
Date BXTank5
Wt(g) SE
112101 1228
BXTank6 Wt(g) SE
1201
BX Tank 12 Wt(g) SE
1274
HSB Tank 13 HSB Tank14 HSB Tank 15 Wt(g) SE Wt(g) SE Wt(g) SE
1180 1016 1088
1211201 1744 102 1778 095 1658 096 1798 109 1752 118 1704 109
1 302 27 60 1 38 28 76 155 27 04 154 3306 157 3424 149 3414 211
1 2402 4196 252 4424 207 4882 299 6344 263 6192 326 6432 362
212102 6332 317 6763 334 6912 299 9474 473 9553 452 10500 388
Table 3 Comparison of survivalfeed conversion ratio (FCR) and condition factor at 60 grams for backcross hybrid striped bass (BX) and hybrid striped bass (HSB)
Cross Tank
Starting
Ending
Survival
BXS
160
136
85
BX 6 BX 12 HSB 13 HSB 14 HSB 15
160
138
86
161
137
85
178
177
99
179
173
97
180
179
99
Starting Biomass (g) 1964 1922 2051 2100 1819 1958
Ending Biomass (g) 8612 9334 9469 16770 16526 18795
Feed Fed(g) 12106 12135 11447 18041 17805 20463
FCR 182 164 154 123 121 122
Condition Factor 168E-05 166E-05 169E-05 194E-05 193E-05 208E-05
SE 353E-07 337E-07 424E-07 255E-07 327E-07 845E-07
50 International Journal of Recirculating Aquaculture Volume 5 June 2004
Performance of Sunshine Bass and Backcross Hybrid Striped Bass
day while BX had a specific growth rate of 205 per day Neither of the covariates included in the model were found to have a significant effect on weight differences (initial tank biomass F = 142 df = 1587 P = 02332 amount of feed F = 005 df = 1587 P = 08165)
Performance regarding key economic traits-survival feed conversion efficiency and condition factor-are summarized in Table 3 At the end of the grow-out trial survival of HSB was significantly greater than that of BX (F = 6216 df = 1 1014 P lt 00001) Feed conversion ratio was better for HSB (122) than for BX (166) Condition factors for BX were lower than those for HSB (l68 vs 198) meaning that BX appeared longer and less deep-bodied than HSB
DISCUSSION Our data showed that F1 HSB performed as well or better than BX for a range of hatchery- and grow-out-related traits
Hatchery traits Fertilization rates for backcross lots were approximately half that for HSB There was a wide variance for fertilization and hatch rates of eggs from HSB females Some of this variance may be due to differences in hatchery protocols (different hormone injections used strip vs tank spawning) at the commercial hatcheries where the data were collected (TIJ Smith personal communication) Poor hatch rates also may be attributable in part to hybrid breakdown that is to developmental incompatibilities among the genomes of the respective species when coadapted gene complexes are broken up at meiosis in the F1 (Hallerman 2003)
In the hatchery trial we hypothesize that the low swimbladder inflation rate for our J~ly fry resulted from offering first feed to the BX too early When rearing HSB and SB fry we typically wait until the yolk sac has been largely resorbed and the fry mostly have inflated their swimbladders before we introduce live feed This is because live feed can cause an oily film on the water surface that interferes with a frys successful ingestion of air bubbles necessary to inflate the swimbladder (Chapman et al 1988) The timing of swimbladder inflation varies with fry type and temperature with HSB typically inflating between 3 and 6 days after hatch and SB 6 to 9 days after hatch BX fry inflate their swimbladder at an intermediate time 5 to 8 days after hatch (DAH) Since for the July
International Journal of Recirculating Aquaculture Volume 5 June 2004 51
Performance of Sunshine Bass and Backcross Hybrid Striped Bass
spawn we introduced feed into their tanks at the time prescribed for HSB (at 5 DAH) BX fry may have had a reduced opportunity to inflate their swimbladders because of interference by a surface film with air contact In the October spawn we monitored swimbladder inflation more carefully and introduced live feed on day 7 after almost 90 of swimbladders were inflated The low swimbladder inflation rate in the July hatchery run of BX may have had a direct impact on survival Larvae without inflated swimbladders expend more energy swimming exhibit reduced growth rates are less tolerant of stress and often sink to the tank bottom and die (Van Heukelem et al 2000)
BX were weaned more quickly and earlier onto dry diets than HSB which may have helped contribute to their ability to match the size and weight of HSB at 60 DAH Earlier weaning has economic merit since dry diets are generally cheaper and easier to feed than brine shrimp
Grow-out traits After 60 days post-hatch the growth and other performance differences between BX and HSB became more evident HSB exhibited significantly better growth survival and feed conversion ratios
We hypothesized that backcross hybrid striped bass might grow as fast or faster than the standard commercially-available F 1 hybrid striped bass if high-performance HSB females were selected as broodstock Our data regarding performance in intensive tank systems did not support this hypothesis Rather our observations accord with the classical view that the high performance of some interspecific hybrids is largely due to heterosis and that because the heterosis shown by an F 2 or backcross hybrid is only half that shown in an F1 (Falconer and Mackay 1996 p 257) that advanced generation hybrids would not perform as well as F1
hybrids Indeed F 2 HSB previously showed low hatch rates low larval survival and high variability of growth rate (Smith and Jenkins 1984 Smith et al 1985) Our results suggest that the heterosis expressed in HSB for growth and performance was greater than the selective breeding advantage we employed by crossing high performance HSB females with male striped bass Apparently the additive genetic variance contributed by the HSB and striped bass selected for size-at-age could not make up for the loss of dominance variance
BX may have better potential market acceptance by virtue of having a lower condition factor appearing longer and less deep-bodied than HSB more
52 International Journal of Recirculating Aquaculture Volume 5 June 2004
Performance of Sunshine Bass and Backcross Hybrid Striped Bass
like striped bass that are more familiar in many markets Fins Technologys market experience has shown that the premium-priced live markets prefer longer leaner fish such as the backcross There is the possibility that because of later maturity backcross hybrid striped bass may grow to larger sizes than hybrid striped bass This is attractive because there is an unserviced demand for larger (1 kg+) fish that can provide portion-controlled 7-9 ounce fillets for the restaurant and retail markets
ACKNOWLEDGEMENTS This project was supported by US Department of Agriculture-Small Business Innovation Research Program Phase I Grant no 2001-00373 EMH is supported by the USDA-CSREES Hatch Program and the Commonwealth of Virginia Aquaculture Initiative
REFERENCES Bosworth BG Libey GS Notter DR Egg Larval and Fingerling
Traits of Crosses among Striped Bass White Bass and their Fl Hybrids Aquaculture 1997 154 201-217
Carlberg J Van Olst J US Production and Sales of Hybrid Striped Bass (1987-2002) 2003 httpaquanicorgsbgaHSBversion5ppt
Chapman DC Hubert WA Jackson UT Influence of Access to Air and of Salinity on Gas Bladder Inflation in Striped Bass Progressive Fish-Culturist 1988 50 23-27
Falconer DS Mackay TFC 1996 Introduction to Quantitative Genetics Fourth Edition Longman Group Ltd Harlow Essex UK
Halbrendt CK Wirth FF Vaughn GF Conjoint Analysis of the Mid-Atlantic Food-Fish Market for Farm-Raised HSB Southern Journal of Agricultural Economics 1991 23 155-163
Hallerman EM Coadaptation and Outbreeding Depression In Po_pulation Genetics Principles and Applications for Fisheries Scientists Hallerman E (Ed) 2004 American Fisheries Society Bethesda MD USA
Harrell RM Hybridization and Genetics Striped Bass and Other Morone Culture In Harrell RM (Ed) 1997 Pages 217-234 Elsevier Science Amsterdam
International Journal of Recirculating Aquaculture Volume 5 June 2004 53
Performance of Sunshine Bass and Backcross Hybrid Striped Bass
Jenkins WE Heyward LD Sr Smith TIJ Performance of Domesticated Striped Bass Marone saxatilis Palmetto Bass and Backcross Hybrid Striped Bass (Sunshine Bass Female x Striped Bass Male) Raised in a Tank Culture System Journal of the World Aquaculture Society 1998 29 505-509
Kerby JH Cryogenic Preservation of Sperm from Striped Bass Transactions of the American Fisheries Society 1983 112 86-91
Losordo TM Westerman P An Analysis of Biological Economic and Engineering Factors Affecting the Cost of Fish Production in Recirculating Aquaculture Systems Journal of the World Aquaculture Society 1994 25 193-203
SAS Institute 1999 The SAS System for Windows version 82 SAS Institute Cary NC USA
Smith TlJ Jenkins WE Controlled Spawning of Fl Hybrid Striped Bass (Marone saxatilis x M chrysops) and Rearing of F2 Progeny Journal of the World Mariculture Society 1984 15 147-161
Smith TlJ Jenkins WE Snevel JF Production Characteristics of Striped Bass (Marone saxatilis) and Fl - F2 hybrids (Marone saxatilis and M chrysops) Reared in Intensive Tank Systems Journal of the World Mariculture Society 1985 16 57-70
Tomasso JR Kempton CJ Gallman A Smith TlJ Comparative Production Characteristics of Sunshine Bass and Sunshine Bass x Striped Bass in Recirculating-Water Systems North American Journal of Aquaculture 1999 61 79-81
Van Heukelem WF Harrell RM Hughes SG Lindell SR Friedmann BR Optimal Conditions for Swimbladder Inflation in Striped Bass Larvae Reared in Intensive Systems Northeast Regional Aquaculture Center Publication No 00-006 (2000) 5 pages
54 International Journal of Recirculating Aquaculture Volume 5 June 2004
Book Review
Fjofish apd Shellfish Bacteriology Mapua) Techpjques apd Procedures KA Whitman with contributions by NG MacNair
Iowa State Press (Blackwell Publishing Professional) Ames IA USA (2004) 288 pages ISBN 0813819520 US $4999
Reviewed by Rocco C Cipriano United States Geological Survey National Fish Health Research Laboratory 11649 Leetown Road Kearneysville WV 25430 USA E-mail rocco_ciprianousgsgov
Despite the fact that several good texts have been published regarding the description and nature of bacterial pathogens in aquatic animals there remained a need for a comprehensive yet practical guide devoted to techniques and procedures used for bacterial identification Diagnosis and detection of fish and shellfish pathogens often requires reliance upon standard microbiological media tests and reagents for some bacteria but more specialized assays are required for many aquatic pathogens In the latter case the products necessary for such assays are not commercially available and must be produced in aquatic animal diagnostic facilities from their basic ingredients Often therefore the compositions of differential media and the conduct of certain tests for the primary isolation or detection of specific aquatic pathogens are only available by referencing the general body of published scientific literature Hence until now there has not been a single-source shelf-volume that combines standard microbiological procedures used for routine detection and identification of medically important bacteria with the specialized needs of the fisheries profession This manual however helps to fill that void
The manual stands as a reference suitable for professional aquatic biologists with backgrounds in microbiology veterinarians and students of aquatic animal health Its strength lies in its coverage of the subject matter regarding culture-based diagnosis and identification of bacteria associated with finfish bivalves and lobsters Sections on
International Journal of Recirculating Aquaculture 5 (2004) 55-56 All Rights Reserved copyCopyright 2004 by Virginia Tech and Virginia Sea Grant Blacksburg VA USA
International Journal of Recirculating Aquaculture Volume 5 June 2004 55
Book Review FiQish and ShelJfish Bacteriology Manualmiddot Techniques and Procedures
aseptic collection and shipment of samples qualitative and quantitative procedures for bacterial isolation staining techniques media and standard biological tests used for the cultivation and phentotypic characterization of pathogenic bacteria and antibiotic sensitivity testing provide sound background for the student or novice practitioner Particularly beneficial for anyone who is not experienced with aquatic microbial pathogens is the section listing principal organs media and appropriate incubation temperatures to be used as the most probable sources of isolation for the specific bacteria
More experienced professionals will find it helpful and convenient to have the descriptions and interpretations of differential media (eg Coomassie Brilliant Blue Agar for Aeromonas salmonicida Rimler-Shotts Agar for Aeromonas hydropila Cytophaga Agar Shieh and TYES for Flavobacterium spp and Edwardsiella ictaluri Agar and various other media for Renibacterium salmoninarum) listed in a single source The major identifying criteria that phenotypically characterize selected bacterial pathogens are also described in tabulated form Specialized tests such as the SIF test to detect covert infections nurse culture techniques for enhanced bacterial growth and assays for public health indicator organisms in bivalves are documented Sections covering serology immunoassay and non-cultured based molecular assays (eg polymerase chain reaction) are also presented but are not as completely summarized as those for bacterial isolation In summary the nature of this manual makes it appropriate for frequent use as a practical laboratory guide
56 International Journal of Recirculating Aquaculture Volume 5 June 2004
Subscription Information
International Journal of Recirculating Aquaculture
A publication ofVirginia Tech and the Virginia Sea Grant College Program
IJRA presents the latest developments in RAS-related research focusing on the areas of
Food Quality Pathology
Food Safety
Aquatic Medicine Breeding amp Genetics Waste Management
FishShellfish Growth amp Nutrition Recirculating Systems Mgmt Marketing amp Economics Water Conservation
Dont miss an issue of this informative peer-reviewed journal Subscribe now using your credit card by calling 540-231-2075 or by printing out a form at wwwcfastvteduijrahtml If you prefer you can also mail this form to the address below along with a check or money order
Name ----------------~ Address ----------------Line2 ------------------City ____________ State __ _ Country Postal Code ___________ _ Phone Fax -------- --------e-mail-----------------check _ 2 year ($25 US)
International Journal of Recirculating Aquaculture Food Science amp Technology Building (0418)
Virginia Polytechnic Institute and State University Blacksburg VA 24061
phone (540) 231-2075 fax (540) 231-9293 e-mail IJRAvtedu
International Journal of Recirculating Aquaculture Volume 5 June 2004 57
~ International Journal of ~ Recirculating Aquaculture A publication of Virginia Tech and the Virginia Sea Grant College Program
Instructions for Authors The International Journal of Recirculating Aquaculture (IJRA) encourages the submission of original high-quality papers on research in all aspects of recirculating aquaculture Papers will be peer-reviewed and evaluated for scientific merit relevance and for their usefulness in promoting the advancement of recirculating aquaculture Complete coherent projects are preferred Any related papers submitted together must be thoroughly cross-referenced All papers must be original meaning that the data and the information presented must be the work of the authors and can not have been published elsewhere Dual publication of a paper or data is possible only through the permission of the Editors of both journals THERE ARE NO PAGE CHARGES for IJRA submissions
INITIAL MANUSCRIPT SUBMISSION Manuscripts should be sent to Ms Angela Correa Managing Editor by mail using the address listed at the end of these instructions or by e-mail to (ijravtedu) Submit four (4) copies of each manuscript if regular mail is used All manuscripts must be in English Dot matrix type is not acceptable and all such submissions will be returned without review Each submission must include a cover letter stating that the paper contains original research and that the information has not been published elsewhere E-mailed submissions must be saved in doc format Be sure to include the names of colleagues who have already reviewed the work presented IJRA has two categories for submission 1 Articles which are complete in-depth scientific studies and 2 Notes which are short papers of limited scope Articles and notes will be critically reviewed by two or three experts as well as by the Managing Editor Submissions may be returned without peer review in cases where the Managing Editor determines that they are inappropriate for the journal of poor quality poorly written or fail to follow the journals style format
PREPARATION OF MANUSCRIPTS IJRA uses the latest editions of Websters New International Dictionary and Websters New Collegiate Dictionarv for standard spellings and word definitions All spelling will be in American English Foreign or science-related terminology that is unfamiliar and does not appear in these dictionaries will require an accompanying definition Acceptable scientific and common names of fishes are listed in A List of Common and Scientific Names of Fishes from the United States and Canada published by the American Fisheries Society Common names may be used throughout each paper but must be accompanied by a full scientific name when they first appear in a paper The author must use the full common name eg yellow perch not perch All foreign language words should be italicized in the manuscript
In the manuscript number each page sequentially and include the senior authors name next to the page number (eg Page 4 Jahncke) on each page Single-space all typed material including references Type size in the body of the text should be no larger than 12pts and no smaller than 10 pts Subsection headings should also be italicized in the manuscript Spell out one-digit numbers except when they are used with units of measure - eg six ponds 7 days
International Journal of Recirculating Aquaculture Volume 5 June 2004 59
Spell out any number that begins a sentence When two numbers occur sequentially in the text one of the numbers must be spelled out- eg In 1987 fifty fish were stocked Use commas in numbers of 1000 or more Use the 24-hour clock to describe time- eg 1300 not 100 pm
Keep footnotes to a minimum and number them sequentially throughout the paper All units of measurement must be reported via the metric system except in special circumstances (eg horsepower) Standard scientific abbreviations and symbols may be used without definition If the use of a symbol could cause confusion define the symbol the first time it is used On the final draft of a paper that has been accepted for publication Greek letters or other extraneous symbols that do not appear on a keyboard the name of the symbol should be noted where the symbol is used to help eliminate prepress errors Parts per million or milligrams per liter can be
-1 reported as either ppm or mgI but not as mgI
Commonly used aquaculture jargon can be used without defining the term - eg fry fingerling hapa Less commonly used jargon may also be used but terms should be defined the first time they are used Jargon from fields outside of aquaculture should also be defined the first time they are used Always place a zero to the left of a decimal point if the number is less than one this includes probability values - eg P = 005 not P = 05
COMPONENTS OF THE MANUSCRIPTS Articles and notes should include a title names of authors and their addresses abstract introduction materials and methods results discussion (or a combined results and discussion) conclusion (rarely) acknowledgements (if any) references figures and tables in that order Each section should start on a new page
Title - The title should accurately reflect the contents of the paper Brief concise titles are encouraged The title page must include the name(s) of the author(s) and all addresses
Abstract - The abstract should be a concise highlight of the results and conclusions Methodology should not be abstracted unless it is necessary to explain the results or unless the paper describes a new technique Abstracts should be less than 300 words
Introduction - The introduction should explain why the paper was written and why it should be read The introduction should condense the relevant information in the field that led the author to do the research The introduction is not a complete literature review and only the most relevant references should be cited The introduction should also contain a statement that describes the purpose or objective of the paper
Materials and Methods - The underlying goal of this section is to describe what was done so that others can repeat the experiment If previously published papers described a technique that was used they can be cited to prevent unnecessary repetition If the technique or process was modified the modification must be described so that others can repeat the process Experimental designs can be explained by use of figures if they will help clarify what was done If the experiment was a complicated one with many subparts subsections may be used to describe each subpart
Results - This section describes the data Proper use of tables and figures can simplify and help explain the results Statistical analysis of data is necessary unless differences are so obvious that statistical analysis is superfluous Although probability values of 005 and 001 are traditionally used each author is free to choose his or her own level of significance
60 International Journal of Recirculating Aquaculture Volume 5 June 2004
Discussion - This section should interpret the results and compare the results from this experiment to those found in similar research The section can also be used to speculate about the results to provide reasons for the trends and to suggest new ideas that can advance our understanding about aquaculture This section should not be a literature review section that merely compares results among several papers
Results and Discussion - Results and discussion sections can be combined In most cases this leads to a better paper because the integration of these sections leads to a more meaningful interpretation of data
Conclusion - This section should be used only when the results of an experiment lead to an unequivocal interpretation
Acknowledgements - This section should be used to thank organizations that supported the research monetarily and individuals who assisted in the research or preparation of the paper This section includes manuscript number designations for those institutions that assign such numbers
References - Select references with great care Unless the paper includes a literature review there is no need to reference every paper written about a subject Use only the most important ones
Figures and Tables - All figures andtables go after the references Figures always go before tables
Section headings (eg Materials and Methods) should be capitalized and in bold type Secondary headings should be balded and go flush left Tertiary headings are incorporated into the first paragraph of that subsection Tertiary headings are italicized and separated from the text by a double dash
In the text references are cited in one of two ways 1 Swingle (1959) evaluated two species of tilapia or 2 pond culture in Alabama began in the 1950s (Swingle 1959) When there are three or more authors list only the first in a citation and follow that with et al eg Smitherman et al (1983) reviewed catfish breeding work at Auburn University If the name of an institutional author is long it can be abbreviated in a citation eg Food and Agriculture Organization of the United Nations may be abbreviated as FAO When several citations are used in a single entry they are listed chronologically If you are citing two papers that were written by the same author(s) the name only has to appear once per citation followed by the years that designate the different papers Separate the years with a comma If you are citing two authors you must separate the citations with a semicolon (Smith 1975 1976 Jones 1976)
In the reference section the reference list is strictly alphabetical by last name of the senior author and then by initials if two authors have identical last names If an author has written more than one paper the following format should be followed All single authored papers go first followed by co-authored papers and then the papers that were written by three or more authors If an author has written more than one single-authored paper the papers are listed chronologically If an author has written more than one co-authored paper they are listed alphabetically by the second authors last name If a tandem has authored two or more papers the order is chronological Papers written by the same group of three or more authors should be listed chronologically
International Journal of Recirculating Aquaculture Volume 5 June 2004 61
The following format will be used when referencing various works
PAPERS Single-author papers
McGinty AS Effects of Size at Stocking on Competition and Growth of All-Male Tilapia Hybrids Journal of the World Aquaculture Society 1985 16 52-56
Multiple-author papers Tave D Smitherman RO Predicted Response to Selection for Early Growth in Tilapia nilotica Transactions of the American Fisheries Society 1980 109 439-445
If an author has published two or more papers in the same year follow the years with a letter to differentiate them eg Smith 1988a 1988b Use issue numbers only when each issue starts out with page 1 If pagination is consecutive throughout the volume omit the issue number Spell out journal names in their entirely without abbreviations
Papers in proceedings or in edited volumes Nicholson LC Woods LC Ill Woiwode JG Intensive Culture Techniques for the Striped Bass and its Hybrids In Culture and Propagation of Striped Bass and Its Hybrids Harrell RM Kerby JH Minton RV Eds 1990 American Fisheries Society Bethesda MD USA
Books and reportspublications from governmental or non-governmental bodies
Lovell T 1989 Nutrition and Feeding of Fish Van Nostrand Reinhold New York NY USA
Food and Agriculture Organization of the United Nations (FAO) Fisheries Department 1997 Review of the State of World Aquaculture No 886 FIRlC886 FAO Rome Italy
Theses and Dissertations
Easter CC 1992 Water Chemistry Characterization and Performance of a Recirculating Aquaculture System Producing Hybrid Striped Bass Masters thesis Virginia Polytechnic Institute and State University Blacksburg VA USA
Websites
Federation of European Aquaculture Producers (FEAP) European Eel Production (httpwwwfeaporgeelshtml) 2002
Page numbers for proceedings books theses and dissertations are unnecessary Government publications should be treated as if they were books but document numbers must be included THE ACCURACY OF REFERENCES IS THE SOLE RESPONSIBILITY OF THE AUTHORS MAKE SURE THAT CITATIONS AND REFERENCES MATCH
Tables - When creating a table decide what the purpose of the table is and what points are important then organize the table so that the main features can be easily understood The table heading should provide sufficient information for the table to be understood as an entity Keep footnotes to a minimum Each table goes on a separate page Tables must be camera ready TABLES WILL BE PRINTED AS IS AND WILL NOT BE TYPESET Figures - List all figure captions on separate pages Original artwork doesnt have to be submitted when a paper is first submitted for review but original artwork must accompany the final revised manuscript Good quality photocopies are acceptable when a manuscript
62 International Journal of Recirculating Aquaculture Volume 5 June 2004
is submitted for review Graphs and original artwork must be printed with a laser printer or done in pen and ink Dot-matrix figures are not acceptable Original artwork or high-contrast photographs are acceptable Label all figures on the back with a soft pencil name of senior author paper title and figure number
Photographs - Should be on glossy paper with good contrast Do not glue pictures to cardboard Color photographs can be printed but the additional cost of printing them will be charged to the author Label all photos on the back with a soft pencil name of senior author paper title and figure number
FINAL REVISED MANUSCRIPTS If using the mail submit two copies of the final revised manuscript including original artwork Submit either the original pen-and-ink drawings or laser-printed versions of the drawings In addition submit the manuscript on a disk (CD preferable) or by e-mail On the disk write the brand name of the computer or word processor the word processing program that was used (should be Microsoft Word) the title of your article and the file name NOTE Disk and hard copy must agree In case of discrepancies it is the policy of IJRA to follow hard copy An electronic version of the completed manuscript is needed in order to publish AUTHORS MAY NOT RECEIVE PAGE PROOFS Proofreading will be done by the Production Office of IJRA using the revised final version of the manuscript Therefore authors must be especially careful that no errors exist in the final revised version because in most cases no changes are possible after it is submitted
REPRINTS The senior author will receive two copies of the journal and a pdf file of the article for distribution and reprinting purposes The junior author(s) will also receive two copies of the journal issue These are sent several weeks after the journal is published and in circulation Requests for the pdf format of the article can only be made by the corresponding author
COPYRIGHT amp PERMISSIONS For permission to reprint articles that have appeared in IJRA please contact IJRA Copyright amp Permissions Food Science amp Technology Building (0418) Virginia Tech Blacksburg VA 24061 USA
COPYRIGHT TRANSFER If your manuscript is accepted for publication copyright ownership must be officially transferred to IJRA The Editors acceptance letter will include a form fully explaining this The form must be signed by all authors and the original returned to the Editor at this time Failure to return the copyright form in a timely fashion will result in delay in publication
Send your submissions to International Journal of Recirculating Aquaculture
AI Correa Managing Editor 27-B Food Science and Technology Building (0418) Virginia Polytechnic Institute and State University Blacksburg VA 24061 USA
If you have any questions please feel free to contact us Phone (540) 231-2075 Fax (540) 231-9293 e-mail ijravtedu
International Journal of Recirculating Aquaculture Volume 5 June 2004 63

Fillet Yields ofTilapia (Oreochromis)
The filleting was conducted by two competent fish cutters with extensive experience in filleting tilapia for a small Midwestern tilapia producer The v-notched skinless filleting was primarily accomplished with electric carving knives One individual cut across the torso just behind the gill and then cut horizontally down along the backbone through the ribcage to the tail While still attached to the tail the side of the fish was then flipped over and another horizontal cut was made along the skin to separate the meat from the skin and scales The sex of the fish was then determined based upon the internal sex organs The procedure was repeated on the other side of the fish The other individual cut the ribcage out of the fillet with an electric knife and removed the pectoral fin with a v-shaped cut The combined weights of the fillets for each fish were determined to the nearest gram on a digital scale
RESULTS
Fillet Weight Model A mathematical model of the fillet weight (Wf) in grams was fitted using the linear regression procedure (SAS Cary NC USA) Considered in the model were polynomials of weight and length condition factor temperature and feeding rate sex and interaction terms of the primary factors Only fish weight (W) in grams and length (L) in millimeters were found to be significant at the 95 confidence level and the resulting model was Wr = 650 - 0403L + 0401 W with a coefficient of determination (r2) of 0913 The reduced model Wr = -167 + 0336W produced an r2 of 0906 The fillet weight versus fish weight data and the regression line are shown in Figure 1 It appears that weight is a
--middot Figure I Relationship between fish weight and total fillet weight
International Journal of Recirculating Aquaculture Volume 5 June 2004 23
Fillet Yields o1ilapia (Oreochromis)
very good predictor of fillet yield and that for a given weight shorter fatter fish produce a slightly higher yield Although losing some predictive power the reduced model is more appropriate for several reasons Fish length and weight are highly correlated and therefore most of the predictive capability of length can be accounted for in the weight measurement The large positive intercept and the large negative coefficient for length in the full model are intuitively illogical Beyond the limits of the data set the full model produces unreasonable predictions For example predicted fillet weight of fingerlings would exceed the entire weight of the fish On the other hand the coefficients of the reduced model are intuitively logical and produce reasonable estimates of the fillet weights even beyond the limits of the data collected For the reduced model the 95 confidence interval for they-intercept is -215 to -119 and the 95 confidence interval for the weight coefficient is 0326 to 0347 Considering the variation in yield introduced by the filleting process the linear correlation between fillet yield and weight is good
Effect of Sex on Fillet Yields As noted previously fillet yield is a function of size and on average the females were only 666 as heavy as their male counterparts for a given treatment The question to be answered is whether the fillet yields of males and females of similar weights are different Once this is known it can be determined whether unisex production should be priced differently than mixed-sex production As noted above gender was not a significant factor in the construction of the fillet model but a paired t-test is a stronger statistical test For each of the 24 filleted females a male was selected at random that had the same or nearly the same body weight A paired t-test was used to compare the fillet weights and fish lengths of equal-sized males and females At the p = 005 level the differences in fillet yields were not significant but the males were found to be significantly longer F tests were used to compare the variance of the fillet weights and the lengths At the p = 005 level no statistical difference could be detected in the variance of the fillet weights or lengths
24 International Journal of Recirculating Aquaculture Volume 5 June 2004
Fillet Yields ofTilapia (Oreochromis)
Table 1 Comparison of length weight fillet weight and yield of males and females of comparable weight
Length Fillet (mm) Weight (g) Weight (g) Yleld ()
Males Average 2670 3758 1087 029 (SD) 147 647 244 0024
Females Average 2618 3760 1103 029 (SD) 153 647 219 002
DISCUSSION Weight is a good predictor of fillet yield The full model regression formula that included both fish weight and fish length produced a model with slightly greater predictive power than the reduced model that used only fish weight and could thus be of interest from an academic perspective Its predictive power is only slightly better than that of the reduced model From a practical perspective weight is relatively easy to measure whereas length is not and thus for commercial applications the reduced model is a more valuable tool than the full model
The wholesale price per kilogram for tilapia is generally based upon fish weight-fish heavier than 600g bring a premium price those between approximately 350 and 600g an intermediate price and those less than 350g a lesser price (Fitzsimmons and Posadas 1997) The reduced model predicts yields of 288 and 308 for 350g and 600g fish respectively which would justify a price premium of approximately 7 based strictly upon the increase in yield but which does not include any reduction in processing costs The yields obtained from this experiment are lower than both the 33 yield figure cited as a rule of thumb by Fitzsimmons and Posadas (1997) and the average fillet yield of 335 from 0 niloticus averaging 2074g cited by Obanu and lkeme (1988) In contrast Clement and Lovell (1994) obtained only a 254 fillet yield from 0 niloticus that weighed an average of 585g Several factors could account for the discrepancies including tilapia species and the skill of the fish cutter However the largest source of variation is likely to be the methods and procedures used in filleting which unfortunately are generally not reported in the literature Variability introduced by fillet technique and skill of the cutter is not included in this model because only one set of cutters was used
International Journal of Recirculating Aquaculture Volume 5 June 2004 25
Fillet Yields of Tilapia (Oreochromis)
Fillet yield is important information for making management decisions in pricing fish products selecting species specifying feed rations and controlling production costs Muscle yield of fish species has a big impact on the profitability of the aquaculture firm and on the survival of a specific marketing channel The fish producer is the last claimant to the consumers market price for fish and fish products The more handlers there are operating in a marketing channel the smaller the margins for each handler Gross retail margins for fresh fish usually command between 30 and 50 of the total profit depending on the marketing season and the fish species Producers are accustomed to marketing whole fish while customers are used to purchasing fish fillets When the useable flesh is separated from the whole fish the result is the fillet and a by-product Typically these by-products of the fish filleting process do not have significant value and their production cost has already been factored into the fish value The higher the yield ratio of muscle to by-product and the higher the market price the greater the chance a producer has of receiving a higher return on the aquaculture product Documentation of fillet yields coupled with market price indicate the value of the fish products in a marketing channel The better the yield the better the survival of a species in the marketplace
ACKNOWLDEGEMENT This material is based upon work supported by the Cooperative State Research Education and Extension Service US Department of Agriculture under Project No VA135559
REFERENCES Clement S Lovell RT Comparison of Processing Yield and Nutrient
Composition of Cultured Nile Tilapia (Oreochromis niloticus) and Channel Catfish (Ictalurus punctatus) Aquaculture 1994 119 299-310
Fitzsimmons K Posadas BC Consumer Demand for Tilapia Products in the US and the Effects on Local Markets in Exporting Countries In Proceedings of the Fourth International Symposium on Tilapia in Aquaculture (Orlando FL USA) Fitsimmons K (Ed) 1997 NRAES-106 Natural Resource Agriculture and Engineering Service (NRAES) Ithaca NY USA
26 International Journal of Recirculating Aquaculture Volume 5 June 2004
Fillet Yields oTilapia (Oreochromis)
Harvey D 2000 Aquaculture Outlook Economic Research Service US Department of Agriculture (Pub LDP-AQS-12) Washington DC USA
Kirkup SP Marsh LS Libey GS Heath AG Coale CW Haugh CG Effects of Temperature and Feeding Rates upon Growth and Feed Conversion Ratios in Tilapia In Proceedings of the Third International Conference on Recirculating Aquaculture (Roanoke VA USA) Flick G J and Rakestraw T (Eds) 2000 Virginia Tech Blacksburg VA USA
Losordo TM Westerman PW An Analysis of Biological Economic and Engineering Factors Affecting the Cost of Fish Production in Recirculating Aquaculture Systems Journal of the World Aquaculture Society 1994 25193-203
Obanu ZA lkeme AI Processing Characteristics and Yield of Some Fishes of the River Niger in Nigeria In Proceedings of the FAQ Expert Consultation on Fish Technology in Africa (Abidjan Cote DIvoire) FAQ Fish Report 1988 Supplement No 400 pages 218-220
Phipippart J-Cl Ruwet J-Cl Ecology and Distribution of Tilapias In_ ICLARM Conference Proceedings 7 (Bellagio Italy 1980) Pullin RSV and Lowe-McConnell RH (Eds) 1982 International Center for Living Aquatic Resources Management (ICLARM Manila Philippines
HematPlogy and Blood Chemistry Reference Intervals for Yellow Perch (Percajlavescens) Raised in Recirculation Systems
TC Hrubec1 and SA Smith2
1Department of Biomedical Sciences E Via Virginia College of Osteopathic Medicine Blacksburg VA 24060 USA
2Department of Biomedical Sciences and Pathobiology (0442) Virginia-Maryland Regional College
of Veterinary Medicine Virginia Polytechnic Institute and State University Blacksburg VA 24061 USA
Corresponding author current address Department of Biomedical Sciences and Pathology (0442) Virginia-Maryland Regional College of
Veterinary Medicine Virginia Polytechnic Institute and State University Blacksburg VA 24061 USA E-mail thrubecvtedu
Keywords Yellow perch Perea hematology blood chemistry reference values plasma biochemistry
International Journal of Recirculating Aquaculture 5 (2004) 29-42 All Rights Reserved copy Copyright 2004 by Virginia Tech and Virginia Sea Grant Blacksburg VA USA
International Journal of Recirculating Aquaculture Volume 5 June 2004 29
Hematology and Blood Chemistry of Yellow Perch (Percaflavescens)
ABSTRACT Determination of hematology and blood plasma biochemistry values is routinely used to assess the health of wild and domestic animals Yellow perch (Percaflavescens) culture is a growing segment of the US aquaculture industry and tools are needed to monitor the health status of these fish This paper reports reference values for complete hematological and biochemistry profiles of normal healthy yellow perch raised in recirculation culture conditions The following hematologic values were determined packed cell volume plasma protein erythrocyte leukocyte lymphocyte neutrophil monocyte and thrombocyte numbers A description of leukocyte morphology is presented Additionally the following plasma biochemical values were determined total protein albumin globulin creatinine total bilirubin alkaline phosphatase aspartate aminotransferase sodium potassium chloride calcium phosphorus magnesium glucose and cholesterol Reference values for a specific population of fish need to be determined prior to utilizing diagnostic blood samples from individuals Developing diagnostic hematology for fishes can enhance yellow perch culture by providing a means for the early detection and identification of infectious disease and of sub-lethal conditions that may affect production performance
INTRODUCTION Yellow perch (Percaflavescens) are an important game fish throughout much of the Northeast and Midwestern United States and Canada Contamination of natural waters by pollutants and an increased consumer demand for fresh seafood has led to the aquaculture production of yellow perch The culture of yellow perch is a rapidly emerging segment of aquaculture in the United States (Schmitz 1999) and has great economic potential especially in recirculation aquaculture systems (Kelly 2000 Mallison 2000) As more producers cultivate yellow perch it will become increasingly important to accurately evaluate the health of these fish and to develop tools such as diagnostic hematology to monitor the health status of fish during their production cycle
Diagnostic evaluation of blood parameters has been used extensively for many mammalian avian and reptilian species The rapidly growing aquaculture industry will increasingly need to utilize information of this type in order to assess the health status of cultured fishes Unfortunately hematology use in aquaculture remains limited in part due to the lack of
30 International Journal of Recirculating Aquaculture Volume 5 June 2004
Hematology and Blood Chemistry of Yellow Perch (Percaflavescens)
reliable reference blood values for most fish species Accurate reference intervals have been developed for some species including hybrid striped bass and tilapia under different production settings (Hrubec et al 1996 1997ab 2000 2001 Hrubec and Smith 2000) and for trout (biochemistry only Wedemeyer and Nelson 1975) pacu (hematological only Tocidlowski et al 1997) and milkfish (Ram-Bhaskar and Srinivasa-Rao 1989)
Little is known about the blood response of yellow perch There are few studies that have previously measured blood values in yellow perch (Toneys and Coble 1980 Nelson et al 1988 Nelson and Mitchell 1992 van den Heuvel et al 2000) Only a few parameters such as hematocrit sodium and chloride were determined as most of these studies were toxicological in nature and evaluated changes in other body systems The objective of this study was to generate a complete comprehensive list of reference blood values for normal healthy yellow perch (Perea flavescens) raised to market size in a recirculation system for later use as a diagnostic tool This is the first paper to report full hematological and biochemical profiles for production yellow perch
MATERIALS AND METHODS
Juvenile yellow perch were stocked into production recirculation systems as fingerlings and reared through their production cycle indoors in 10219-L recirculation tanks with a rotating biological contactor filter and 10 freshwater exchange per day At the end of their production cycle when the fish were 17 months old approximately 250 fish were removed from the production system and placed in a smaller 2400-L circular tank with a slant tube clarifier and a trickle biofilter The smaller tank had a freshwater replacement rate of 15 per day The fish were placed in the smaller systems to allow for a more rapid and less stressful capture procedure The fish were acclimated to the new tanks for 3 weeks The photoperiod was approximately 14-h light and 10-h dark Fish were fed daily to satiation with a commercial pelleted diet (Rangen EXTR 400 40 protein 10 fat Rangen Inc Buhl ID USA) The following water quality parameters were determined daily temperature pH ammonia alkalinity hardness nitrite nitrate and dissolved oxygen Ranges for water quality over the duration of the study are shown in Table 1 and are representative of water quality observed daily in these tank systems
International Journal of Recirculating Aquaculture Volume 5 June 2004 31
Hematology and Blood Chemistry of Yellow Perch (Perea flavescens)
Table 1 Water quality parameters for yellow perch (Percaftavescens) reared in a recirculation culture system Values are means plusmn standard deviations for the parameters on the days that fish were bled for hematological and blood biochemical determinations and are representative of the daily water quality values in the system
Parameter For Hematology Fish For Chemistry Fish
Temperature (degC) 209 plusmn 001 207plusmn 11
pH 78plusmn01 79 plusmn 02
NH3 un-ionized (mgL) 0012 plusmn 0012 0011 plusmn 0005
N02-N (mgL) 0031 plusmn 0015 0043 plusmn 0043
N03-N (mgL) 60 plusmn 26 28 plusmn09
Alkalinity (mgL) 252 plusmn44 313 plusmn 48
Hardness (mgL) 399 plusmn 10 433 plusmn27
Dissolved Oxygen (mgL) 74plusmn05 74 plusmn03
Fish were netted rapidly and anesthetized in aerated tank water with buffered tricaine methanesulfonate (MS-222 Sigma Chemical Co St Louis MO USA) until they began to lose equilibrium approximately 20 seconds Individual fish were bled for either hematological determinations (23g needle 1-mL syringe) or for biochemical determinations (23g needle 3-mL syringe) in both cases blood was collected from the caudal vessels After blood samples were collected the fish were weighed measured and checked for external and internal pathologic lesions The sex of each fish was determined by internal observation of the gonads
Blood for hematological determinations was transferred to an ethylenediamine-tetraacetic acid (EDTA) treated pediatric blood tube and held on ice until analysis (lt 1 hour) Blood for biochemical determinations was collected into cold 3-mL heparinized blood tubes and centrifuged at 14000 x g immediately Plasma was collected and frozen at -10degC until analyzed The following analytes were determined in the plasma with an Olympus AU-400 (Olympus America Inc Melleville NY USA) automated clinical chemistry analyzer total protein albumin creatinine total bilirubin alkaline phosphatase (ALP) aspartate aminotransferase (AST) cholesterol glucose sodium potassium chloride phosphorus calcium and magnesium Globulin was calculated from the total protein value minus the albumin value
32 International Journal of Recirculating Aquaculture Volume 5 June 2004
Hematology and Blood Chemistry of Yellow Perch (Percaflavescens)
Hematological analytes were determined from the EDTA anticoagulated blood As we have observed for other fish species EDTA was superior to heparin for yellow perch blood both in preventing clot formation and preserving cellular morphology (Hrubec et al 1996 2000) Blood from the EDTA tube was drawn into microhematocrit tubes and the packed cell volume (PCV) determined after centrifugation at 10000 x g for 5 min Plasma protein was determined with a clinical refractometer using plasma from the microhematocrit tube The total erythrocyte and leukocyte-plus-thrombocyte counts were determined manually with a Neubauer hemacytometer using Natt-Herricks solution as a diluent stain (Natt and Herrick 1952) Blood smears made within 45 minutes of sample collection were stained with Wright-Geimsa stain and were used to determine the differential counts as follows Leukocytes and thrombocytes were identified and counted on the blood smears until 200 leukocytes and a variable number of thrombocytes were enumerated The percentages of each leukocyte type and of thrombocytes were multiplied by the total leukocyte-plus-thrombocyte number to give the final cell counts Thrombocyte numbers were subtracted from the leukocyte-plus-thrombocyte count to give the total leukocyte count This method of manually determining total leukocyte and differential counts has been recommended for use with avian (Zinkl 1986) and fish blood (Hrubec et al 1996 1997ab 2000 2001) as the nucleated red cells prevent accurate enumeration using automated analysis (Huffman and Arkoosh 1997) Slight thrombocyte clumping was observed on the hemacytometer for some individuals only fish with minimal thrombocyte clumping(lt 4 cells clumped) were used for the differential counts to ensure accuracy of the counts
Reference intervals were determined following the guidelines proposed by the National Committee for Clinical Laboratory Standards (NCCLS 1992) As suggested in these guidelines the data were checked for outliers using the 13 differencerange ratio and no outliers were identified The values were then ranked and the high and low 25 were discarded The range of the remaining values provided the reference interval
RESULTS AND DISCUSSION The physiologic and health status of an individual is reflected in the blood producing variations in hematological and blood biochemical values Clinical analysis of blood is a fundamental tool used in human
International Journal of Recirculating Aquaculture Volume 5 June 2004 3 3
Hematology and Blood Chemistry of Yellow Perch (Percaflavescens)
and veterinary medicine to diagnose and predict the outcome of disease and to monitor the effect of therapeutic nutritional and environmental management Blood analysis is not used extensively as a diagnostic tool in fish medicine partly due to the lack of reference intervals for various fish species and also because changes associated with specific diseases and metabolic disorders are not well characterized With sufficient background data clinical analysis of individual blood samples could detect infectious diseases metabolic disorders and sub-lethal disease states affecting production performance
Hematological and plasma biochemistry data from diseased individuals can be evaluated by direct comparison to a reference interval which is the appropriate range of variation in a blood parameter from a defined population of individuals under specific conditions The reference interval needs to be determined on a sufficient number of normal healthy individuals under similar production conditions using standardized analytical techniques (NCCLS 1992) When the deviation in a blood parameter is large enough to fall outside the reference interval it indicates the value may be aberrant and is most likely not due to individual variation for a given fish
Few previous studies have determined blood parameters for yellow perch (Toneys and Coble 1980 Nelson et al 1988 Nelson and Mitchell 1992 van den Heuvel et al 2000) These studies are of limited relevance as they were primarily toxicological studies and only a few blood parameters were determined and also because blood samples were collected and handled by differing methods prior to determination of the blood value Some of the capture (hook and line and gill netting) and blood collection methods (severing the caudal peduncle) used in these studies are also unsuitable for diagnostic blood samples as they result in significant alteration in the blood which will mask diseased states The study with the closest sampling procedure to that used in our experiment only presented selected blood chemistry values for yellow perch after 16 hours of moderate or exhaustive exercise (Nelson and Mitchell 1992) Therefore although the previous studies on yellow perch hematology are helpful in determining the effects of environmental factors and stress they have limited diagnostic utility and even prevent meaningful comparison with the data presented in this paper
The average mean weight of the yellow perch used for the hematological determinations was 125 +- 14g with a total length of 223 +- 08 cm For
34 International Journal of Recirculating Aquaculture Volume 5 June 2004
Hematology and Blood Chemistry of Yellow Perch (Percajlavescens)
the biochemical determinations the fish had a weight of 121 +- 15g and length of 226 +- 08 cm The results of the hematological determinations from 52 fish are listed in Table 2 Values for plasma chemistry reference intervals determined on 42 samples are listed in Table 3 Overall both the hematological and plasma chemistry values were similar to those reported previously for hybrid striped bass and tilapia reared in recirculation systems (Hrubec et al 1996 2000 Hrubec and Smith 2000) The striped bass and tilapia from production systems exhibited wider ranges in value for the different leukocyte types increased numbers of reticulocytes increased plasma and total protein values increased creatinine values and a decreased plasma chloride concentration as compared to fish in lower density recirculation tanks We did not compare blood values from the production yellow perch in this study to yellow perch maintained in low-density tank settings so were unable to determine if these same trends are apparent in yellow perch as well However based on our previous experience with fish hematological and plasma biochemical values there is an indication that these trends are occurring in yellow perch as well
Table 2 Hematological reference intervals for adult yellow perch (Perea flavescens) reared in a recirculation system
Analyte N Reference Interval Mean Stds1
PCV2 () 57 29-47 388 45
Plasma Protein (gdl) 57 60-82 67 06
Erythrocytes (x 106ml) 53 2160-3345 2737 0356
Leukocytes (ml) 53 52590-186490 113914 39086
Lymphocytes (ml)
Small 53 36800-153420 85630 31728
Large 53 3530-23 130 11602 5359
Neutrophils (ml) 53 1860-35950 12430 8837
Monocytes (ml) 53 670-12640 4252 2874
Thrombocytes (ml) 53 38270-118510 72972 21299 1Standard deviation 2Packed cell volume
International Journal of Recirculating Aquaculture Volume 5 June 2004 35
Hematology and Blood Chemistry of Yellow Perch (Perea flavescens)
Table 3 Plasma biochemical values for adult yellow perch (Percaftavescens) reared in a recirculation system
Analyte N Reference Interval Mean Stds1
Total Protein (gdl) 42 37-50 45 04
Albumin (gdl) 42 06-09 07 01
Globulin (gdl) 42 31-42 37 03
Creatinine (mgdi) 42 04-10 06 01
Total bilirubin (mgdi) 42 03-04 03 01
ALP2 (UI) 42 50-114 822 249
AST3 (UI) 42 2-29 85 64
Glucose (mgdi) 42 62-181 1000 350
Cholesterol (mgdi) 42 182-323 2440 330
Sodium (mEqI) 42 138-153 1470 40
Potassium (mEqI) 42 20-38 32 05
Chloride (mEqI) 42 119-133 1260 40
Calcium (mEqI) 42 86-120 103 13
Phosphorus (mEqI) 42 50-96 74 11
Magnesium (mEqI) 42 17-34 27 04 1 Standard deviation 2 Alkaline phosphatase 3 Aspartate aminotransferase (SGOT)
The blood cells present in the yellow perch were typical of teleost fish and included erythrocytes thrombocytes and leukocytes (Fig 1) Erythrocytes were oval to round with characteristic red cytoplasm and an elongate and centrally-located nucleus Immature erythrocytes or reticulocytes demonstrated a blue-purple tinge to the normal eosinophilic cytoplasm (Fig IA B C) The yellow perch had increased numbers of reticulocytes (included in the erythrocyte count) with approximately 7 to 10 per field at lOOx oil immersion compared to what we observe for most fish species The cause for the apparent reticulocytosis is not known but has been observed in other fish species exposed to elevated nitrite and nitrate (Grabda et al 1974 Hrubec et al 1996 2000 Hrubec and Smith 2000)
36 International Journal of Recirculating Aquaculture Volume 5 June 2004
Hematology and Blood Chemistry of Yellow Perch (Perea flavescens)
T bull middotmiddot ~~ - middot
N -
Figure I Characteristic blood cells from yellow perch reared in recirculation systems Blood smears were made with EDTA anticoagulated blood stained with Wrights Geimsa stain Cells are abbreviated as follows U - Large lymphocyte SL - small lymphocyte T - thrombocyte R - reticulocytes (immature erythrocyte) PC - plasma cell (activated lymphocyte) M- monocyte N-neutrophil The blue bar in frame A is Omm
International Journal of Recirculating Aquaculture Volume 5 June 2004 37
Hematology and Blood Chemistry of Yellow Perch (Percajlavescens)
The thrombocytes were slightly smaller than the erythrocytes (Fig IA) They had clear cytoplasm and were variable in shape being elongated pyriform oval or round Nuclear shape tended to follow cytoplasmic shape although oval and round thrombocyte nuclei occasionally were lobulated (Fig IB) as described for striped bass and tilapia (Hrubec et al 1996 2000)
Leukocytes made up the remainder of the cell types seen in the blood and included small and large lymphocytes neutrophils and monocytes No eosinophils or heterophils were observed Small lymphocytes were the smallest cell present with a rim of blue cytoplasm surrounding the round nucleus (Fig IA E F) Large lymphocytes had an abundant and darker blue cytoplasm and the nucleus was larger than observed in the small lymphocyte (Fig IA E) Plasma cells were occasionally observed with a classic open nucleus abundant dark blue cytoplasm and a clear cytoplasmic region adjacent to the nucleus presumably representing the Golgi as in mammalian plasma cells (Fig IC) Plasma cells were included in the large lymphocytes category for the differential counts
Neutrophils were the largest cell present in the blood (Fig ID E F) The cytoplasm of the neutrophil was a translucent grey containing no granules and infrequent vacuoles Cytoplasmic shape was round to angular as the cellular borders often appeared slightly adherent to adjacent erythrocytes distorting cellular shape Nuclear shape of the neutrophil varied from round to horseshoe shaped and frequently segmented into two prominent lobes connected by a thin nuclear bridge (Fig IF) Monocytes had abundant dark blue cytoplasm that was frequently vacuolated (Fig ID) The round to kidney-bean shaped monocyte nucleus was large with prominent chromatin clumping
Analysis of blood parameters can provide a wealth of information useful in analyzing the effects of disease and sub-optimal environmental conditions Providing reference intervals for healthy adult yellow perch reared in recirculation systems furnishes veterinarians and fish health professionals the foundation to develop diagnostic hematology for this species The number of studies that determine actual reference intervals for fish species is limited The majority of blood values determined for fishes are reported in the literature as a mean value with a standard deviation Historically reference intervals were determined as two standard deviations from the mean however this method is only valid when blood values follow a normal distribution It is incorrect to assume
38 International Journal of Recirculating Aquaculture Volume 5 June 2004
Hematology and Blood Chemistry of Yellow Perch (Percaflavescens)
that biological parameters are distributed normally therefore non-parametric methods should be used to accurately determine reference intervals (Reed et al 1971) Techniques to properly determine reference intervals have been established by the NCCLS (1992) and suggestions for their use and interpretation have been discussed (Lumsden 1998) As with mammalian species reference intervals need to be determined for different populations of fish within a single species as culture conditions and environmental variables affect blood values to the extent that they are outside the reference interval (Ram-Bhaskar and Srinivasa-Rao 1989 Hrubec et al 1996 1997ab 2000 2001) Although the reference range for some of the blood parameters appears large it is still possible to detect variation in hematologic values associated with pathological conditions (Hrubec et al 1997b and unpublished data)
Developing reference intervals is a necessary first step in determining which specific hematological changes can be associated with disease conditions As the field of fish hematology develops its usefulness to the aquaculture industry will increase Information derived by standardized non-lethal diagnostic assays will be needed to enhance the culture of yellow perch and other fish species Analysis of diagnostic blood samples can provide a means for early detection of infectious disease and assist in the identification of sub-lethal conditions affecting production performance This should allow for more specific timely and effective disease treatments in the future
ACKNOWLEDGEMENTS The authors wish to thank Mark Kidd of the Virginia Tech Aquaculture Center for his assistance with fish care and sampling
REFERENCES Grabda E Einszporn-Orecka T Felinska C Zbanyszek R
Experimental Methemoglobinemia in Rainbow Trout Acta Ichthyologica et Piscatoria 1974 4 43-71
Hrubec TC Smith SA Robertson JL Feldman B Veit HP Libey G Tinker MK Comparison of Hematologic Reference Intervals between Culture System and Type of Hybrid Striped Bass American Journal of Veterinary Research 1996 57 618-623
International Journal of Recirculating Aquaculture Volume 5 June 2004 3 9
Hematology and Blood Chemistry of Yellow Perch (Percajiavescens)
Hrubec TC Robertson JL Smith SA Effects of Temperature on Hematologic and Serum Biochemical Profiles of Hybrid Striped Bass (Morone chrysops x Morone saxatilis) American Journal of Veterinary Research 1997a 58 126-130
Hrubec TC Robertson JL Smith SA Effects of Ammonia and Nitrate Concentration on Hematologic and Serum Biochemical Profiles of Hybrid Striped Bass (Morone chrysops x Morone saxatilis) American Journal of Veterinary Research 1997b 58 131-135
Hrubec TC Smith SA Hematology and Plasma Chemistry Values for Production Tilapia ( Oreochromis hybrid) Raised in a Recirculation System International Journal of Recirculating Aquaculture 2000 J 5-14
Hrubec TC Cardinale JL Smith SA Hematology and Plasma Chemistry Reference Intervals for Cultured Tilapia ( Oreochromis hybrid) Veterinary Clinical Pathology 2000 29 7-12
Hrubec TC Smith SA Robertson JL Age Related Differences in Hematologic and Plasma Chemistry Analytes of Hybrid Striped Bass Morone chrysops x Morone saxatilis Veterinary Clinical Pathology 2001 30 8-15
Huffman PA Arkoosh MR Characteristics of Peripheral Blood Cells from Rainbow Trout Evaluated by Particle Counter Image Analysis and Hemocytometric Techniques Journal of Aquatic Animal Health 1997 9 239-248
Kelly AM Yellow Perch Culture in the United States Manna or Mania World Aquaculture 2000 31 4-17
Lumsden JH Normal or reference values Questions and Comments Veterinary Clinical Pathology 1998 27 102-106
Mallison JA 2000 A White Paper on the Status and Needs of Yellow Perch Aquaculture in the North Central Region North Central Regional Aquaculture Center Michigan State University E Lansing MI USA
Natt MP Herrick CA A New Blood Diluent for Counting Erythrocytes and Leukocytes of the Chicken Poultry Science 1952 31 735-738
40 International Journal of Recirculating Aquaculture Volume 5 June 2004
Hematology and Blood Chemistry of Yellow Perch (Percaflavescens)
NCCLS National Committee for Clinical Laboratory Standards 1992 How to Define Determine and Utilize Reference Intervals in the Clinical Laboratory Proposed Guidelines NCCLS Document C28-P Villanova PA USA
Nelson JA Mitchell GS Blood Chemistry Response to Acid in Yellow Perch (Perea flavescens) Comparison of Populations from Naturally Acidic and Neutral Environments Physiological Zoology 1992 65 493-514
Nelson JA Magnuson J J Chulkasem W Blood Oxygen Capacity Differences in Yellow Perch (Percaflavescens) from Northern Wisconsin Lakes Differing in pH Canadian Journal of Fisheries and Aquatic Sciences 1988 45 1699-1704
Ram-Bhaskar B Srinivasa-Rao K Influence of Environmental Variables on Hematology and Compendium of Normal Hematological Ranges of Milkfish Chanos chanos (Forskal) in Brackish Culture Aquaculture 1989 83 123-136
Reed AH Henry RJ Mason WB Influence of Statistical Method Used on the Resulting Estimate of Normal Range Clinical Chemistry 1971 17 275-284
Schmitz M 1999 Comparative Growth of All-Female Versus Mixed Sex Yellow Perch (Percaflavescens) in Recirculating Aquaculture Systems MS Thesis Virginia Tech Blacksburg VA USA
Toneys ML Coble DW Mortality Hematocrit Osmolality Electrolyte Regulation and Fat Depletion of Young-of-the-Year Freshwater Fishes under Simulated Winter Conditions Canadian Journal of Fisheries and Aquatic Science 1980 37 225-232
van den Heuvel MR Power M Richards J MacKinnon M Dixon DG Disease and Gill Lesions in Yellow Perch (Percaflavescens) Exposed to Oil Sands Mining-Associated Waters Ecotoxicology and Environmental Safety 2000 46 334-341
Wedemeyer GA Nelson NC Statistical Methods for Estimating Normal Blood Chemistry Ranges and Variance in Rainbow Trout (Salmo gairdneri) Shasta Strain Journal of the Fisheries Research Board of Canada 1975 32 551-554
International Journal of Recirculating Aquaculture Volume 5 June 2004 41
Hematology and Blood Chemistry of Yellow Perch (Percajlavescens)
Zinkl JG Avian Hematology In Schalms Veterinary Hematology (4th edition) Jain NC (Ed) 1986 Pages 256-260 Lippincott Williams amp Wilkins Philadelphia PA USA
42 International Journal of Recirculating Aquaculture Volume 5 June 2004
Hatchery and Grow-out Performance of Sunshine Bass and Backcross Hybrid Striped Bass in Recirculating Aquaculture Systems
SR Lindell1bull2 B Delbos1 R Perham1 J Goldman1 EM Hallerman3 TO Brenden3bull4
1 Fins Technology 15 Industrial Road Turners Falls MA 01376 USA
2Current address Marine Biological Laboratory Marine Resources Center 7 MBL Street Woods Hole MA 02543 USA
3Department of Fisheries and Wildlife Sciences (0321) Virginia Polytechnic Institute and State University Blacksburg VA 24061 USA
4Current address Institute of Fisheries Research University of Michigan 1109 N University Avenue Ann Arbor MI 41809 USA
Corresponding authors e-mail ehallermvtedu
Keywords striped bass performance aquaculture growth
International Journal of Recirculating Aquaculture 5 (2004) 43-54 All Rights Reserved copyCopyright 2004 by Virginia Tech and Virginia Sea Grant Blacksburg VA USA
International Journal of Recirculating Aquaculture Volume 5 June 2004 43
Performance of Sunshine Bass and Backcross Hybrid Striped Bass
ABSTRACT Previous research has suggested that backcross hybrid striped bass (BX sunshine bass female x striped bass male) perform as well as F 1 hybrid striped bass (sunshine bass white bass female x striped bass male) for many economically important traits We conducted trials to compare rearing and growth traits of selected backcross hybrid striped bass with hybrid striped bass (HSB) We spawned and reared larval BX fry in two hatchery cycles measured fry growth and performance and compared them to past performance of HSB fry We conducted a grow-out trial of commercially-available hybrid striped bass versus backcross hybrid striped bass in replicated tanks to phase II fingerling size (approximately lOOg) Compared to HSB in the hatchery phase backcross hybrid striped bass exhibited lower fertilization rate comparable swimbladder inflation rate shorter time-to-weaning lower survival comparable growth and comparable condition factor After 60 days HSB exhibited significantly better growth survival and feed conversion efficiency than BX However BX may have better potential market acceptance by virtue of having a lower condition factor appearing longer and less deep-bodied than HSB
INTRODUCTION Striped bass (Morone saxatilis) and its hybrids constitute a major sector of aquaculture in the United States with production of 105 million pounds in 2002 (Carlberg and Van Olst 2003) Commercially significant quantities of Morone stocks also are produced in Taiwan China and Israel Approximately 43 of Morone production occurs in tanks (Carlberg and Van Olst 2003) much of that in recirculating aquaculture systems (RAS) Private and government marketing experts estimate that US production could increase to 50 million pounds and $100 million in annual farm-gate revenue if market prices could be decreased only moderately (Halbrendt et al 1991) Production costs for HSB could be reduced by 12 if selective breeding can yield 20 faster growth rates (Losordo and Westerman 1994)
The majority of Marone production is not of striped bass but of its hybrids with white bass (M chrysops) because of their hardiness rapid growth rate and limited availability of female striped bass broodstock (reviewed by Harrell 1997) Further female WB are considered easier and more predictable to strip-spawn Hence most commercial production
44 International Journal of Recirculating Aquaculture Volume 5 June 2004
Performance of Sunshine Bass and Backcross Hybrid Striped Bass
is of sunshine bass the progeny of the white bass female x striped bass male interspecific cross Research has also been undertaken to evaluate the performance of second generation hybrids and backcrosses Several studies have suggested that the progeny of F 1 hybrid striped bass females backcrossed to striped bass males have merit for commercial production Jenkins et al (1998) compared the performance of backcross hybrids to F1 hybrid striped bass and striped bass to market size in a recirculating system At harvest no differences in growth rate or feed conversion were detected specific growth of BX was intermediate to those of the other stocks with survival lower Tomasso et al (1999) compared performance of F 1 and backcross hybrids between 20 and 90 grams for 56 days in tanks (Tomasso et al 1999) and observed similar survival growth and feed conversion rates among the hybrid types Detailed comparison of the hatchery performance of sunshine and BX hybrids is lacking We hypothesized that use of selected hybrid striped bass and striped bass for the backcross might yield a high-performance BX hybrid Should high performance be realized progressive fish farmers might utilize this approach by selecting the best F1 hybrid females from their own production stocks making the backcross by strip-spawning them and fertilizing the eggs with purchased milt from selectively bred striped bass males (Kerby 1983) thereby obtaining a high-performance production stock that because of selection on the maternal stock is suited to their particular farm conditions
In this study we evaluated the production potential of backcross (BX) hybrid striped bass (female sunshine bass x male striped bass) We compared the hatchery and grow-out performance of BX spawned from select broodstock and sunshine bass (HSB) of common genetic background Specifically we evaluated spawning success hatch rate growth survival and feed conversion efficiency through the first six months of life In order to benchmark our results we ran a trial in replicated tanks with HSB supplied by the most widely-used commercial source of fingerlings (Keo Fish Farms Keo AR USA) and compared their performance with our BX All fish were cultured within intensive controlled-environment recirculating aquaculture systems
International Journal of Recirculating Aquaculture Volume 5 June 2004 45
Performance of Sunshine Bass and Backcross Hybrid Striped Bass
MATERIALS AND METHODS In July 2001 we crossed 4 hybrid striped bass females to each of 4 striped bass males to produce 16 families of backcross hybrid striped bass Poor fertilization rates resulted in a low yield of fry from this spawn However there were enough fry to pool and conduct a pilot commercial-scale hatchery run Randomly-chosen samples from the resulting 4000 fingerlings were used for the grow-out trial
In October 2001 we spawned 3 female HSB with 2 male SB and eventually produced 7000 fingerlings While this was not enough to grow in commercial-scale systems we collected hatchery performance data to corroborate our JulyAugust experience with BX
Fertilized eggs were incubated in McDonald jars Upon hatch the larvae swam out of the hatching jar and into a 1900-L larval rearing tank Replicate larval rearing tanks were stocked with approximately 25 larvae per liter Tanks were maintained with recirculating water and surface oil-skimming pads for the first 5 to 7 days post-hatch until swim-bladder inflation was completed For the second week post-hatch larval rearing tanks were maintained static with gentle central aeration except for an exchange of about 30 of the tank water over the course of two hours each day During the second week post-hatch larvae were fed rotifers enriched with Algamac (Aquafauna BioMarine Inc Hawthorne CA USA) maintained at a density of 10ml By the end of the second week larvae were weaned from rotifers to Artemia nauplii By the end of the third week the larvae were typically weaned from enriched Artemia to artificial feed (Biokyowa Inc Girardeau MO USA) Weaned larvae were graded just once around 60 days post-hatch to remove the top 1 to 2 of larger fish responsible for cannibalism
In November 2001 we purchased lOg fingerlings that represent typical industry-standard HSB from Keo Fish Farms (Keo AR USA) These HSB closely matched the size and weight of our BX from the July spawn for the grow-out trial BX and HSB fingerlings were each stocked separately in triplicate 1900-L round tanks connected to the same recirculating system and reared at 23degC and a salinity of 1-3 ppt All six tanks were similarly stocked initially (approximately 1 kgm3) Fish were offered 80 of their expected ration via belt-feeders and hand-fed to satiation twice a day Approximately every 3 weeks length and weight samples were taken from a randomly-chosen 15 of each tanks
46 International Journal of Recirculating Aquaculture Volume 5 June 2004
Performance of Sunshine Bass and Backcross Hybrid Striped Bass
population At the conclusion of the project the tanks reached typical commercial densities of 5 to 9 kgm3bull
We quantified reproductive and hatchery performance of the three groups including fertilization rate swimbladder inflation rate days to weaning onto artificial feed (ie date of first ingestion to date that gt90 ingested artificial feed) survival estimates to approximately 60 days after hatch and to the end of the study feed conversion rate and monthly average weight and length The trial continued until mid-February 2002 when the HSB averaged approximately lOOg Results from previous years hatchery efforts with HSB using similar rearing protocols were used for comparative purposes
Both the hatchery and grow-out systems employed water recirculation technology including drum-filters fluidized-bed biofilters oxygenation ozonation and automated pH and temperature control that maintained high water-quality standards throughout the trials
Differences in fish weight between the hybrid types were analyzed as a repeated-measures general linear mixed model Residual (restricted) maximum likelihood was used to estimate the model parameters Initial fish biomass in each of the tanks and the amount of feed provided to each of the tanks were included in the model as covariates to assess the influence of these concomitant variables on differences in weight A first-order autoregressive covariance structure was assumed for the repeated-measurements of fish weight
Differences in fish survival at the end of the grow-out trial were analyzed as a general linear model with tanks serving as a blocking factor Because fish survivalmortality is a binary response and thus will violate an assumption of normality the significance of the test comparing survival between the hybrid types was obtained by randomization (number of randomizations= 1000) whereby the F-statistic of the original test was compared to F-statistics obtained by randomly allocating the survival mortality data to the different hybrid types The Type-I error rate for all statistical tests was set equal to 005
International Journal of Recirculating Aquaculture Volume 5 June 2004 47
Performance of Sunshine Bass and Backcross Hybrid Striped Bass
Table 1 Comparison of hatchery traits of backcross (BX) and Fl hybrid (HSB) striped bass for traits of economic interest
Traits of interest BX-HSB BX-HSB HSB HSB HSB
Female parent strain1 AR ARMD AR AR AR
Male parent strain1 MD FL MD FL MD MD FL MD Canada
Spawn date Oct-01 Jul-01 Mar-01 Oct-00 Jan-99
Fertilization 32 22 53 57
Swimbladder inflation 90 50 98 95
Weaning start (DAH)2bull3 24 21 17 22
Weaning end (DAH4 33 32 37 38
Mean wt (g) at 60 DAH 042 052 042 05
Survival to 60 DAH 7 740 104
Mean L (mm) at 30 DAH 133 11 1225
Mean L (mm) at 36 DAH 139 167
Mean L (mm) at 75 DAH 367 404 452
Mean Wt (g) at 75 DAH 074 081 12 0825 11
Condition factor at 1g 123E-05 118E-05 1Strain abbreviations AR=Arkansas R MD=Maryland FL=Florida 2DAH=Days after Hatch 3Weaning start marks the first introduction and ingestion of dry feed to replace live feeds 4Weaning end denotes the time when the transition to dry feeds is complete and live feeds are no longer utilized
RESULTS
Hatchery Trial Results A summary of performance for hatchery traits of production interest for BX and HSB is presented in Table 1
The fertilization rate for the BX eggs was lower than that which we typically found with HSB (22-32 vs 55) and considerably lower than our experience in 2000 when we conducted fertilization trials with BX (80)
Swimbladder inflation rate ranged from 50 in the first hatchery run to 90 in the second run We attribute the low rate in the first run to
48 International Journal of Recirculating Aquaculture Volume 5 June 2004
Performance of Sunshine Bass and Backcross Hybrid Striped Bass
surface-film and system management problems We showed in the second run that swimbladder inflation in BX was comparable to that typically attainable (gt90) for Morone fry
Time-to-weaning onto dry diets was shorter (10 days versus 18 days) and earlier (day 33 versus day 38) for BX than for HSB Survival of BX to 60 days after hatch (7) was lower than expected on the basis of previous experience with HSB (gt10) Mean weights for BX at 60 days after hatch in two hatchery runs (052 and 042g) was similar to those for HSB (042 and 05g) However HSB exhibited greater mean weight than BX at 75 days after hatch (l04 vs 077g)
Condition factor (K) of BX (123 + 009) was not significantly different from those of HSB (119 + 005) or striped bass (l13 + 003) at 1 gram mean weight
Frequencies of deformities for BX (lt2) were lower than those in earlier reports Bosworth et al (1997) reported deformities in 8 of BX and 4 ofHSB
Grow-out Trial Results Overall there was not a significant difference in weight between the hybrid types (F = 606 df = 13 P = 00907) however as evidenced in
100
80
60
40
20
--+- BX - Overall -0- HSB - Overall -ltgt- BX - Individual Tanks A middot middot middotbullmiddotmiddot middot HSB - Individual Tanks fi
fi ~o
12 Dec 2001 3 Jan 2002 24 Jan 2002 12 Feb 2002
Date Figure 1 Meanfish weight(plusmn 2 SE) at each time period for backcross hybrid striped bass (BX) and hybrid striped bass (HSB) Also shown is meanfish weight at each time periodor groups in individual tanks
International Journal of Recirculating Aquaculture Volume 5 June 2004 49
Performance of Sunshine Bass and Backcross Hybrid Striped Bass
Figure 1 there was a significant interaction on fish weight by hybrid type and time (F = 5157 df = 1587 P lt 00001) Using the slicing option available in SAS (SAS Institute 1999) we tested for differences in weight between the hybrid types for each time period and found that although weights of HSB and BX were not significantly different during the first two measurement periods (Time 1 F = 027 df = 1587 P = 06032 Time 2 F = 036 df = 1587 P = 05496) the hybrid types did differ in weight during the last measurement periods Specifically HSB were significantly heavier than BX on the 24th of January 2002 (F = 1061 df = 1 587 P = 00032) and the 12th of February 2002 (F = 3788 df = 1587 P lt 00001) Overall HSB had a specific growth rate of 268 per
Table 2 Mean weights of backcross hybrid striped bass (BX) and hybrid striped bass (HSB) over the course of a 3-month growth trial
Date BXTank5
Wt(g) SE
112101 1228
BXTank6 Wt(g) SE
1201
BX Tank 12 Wt(g) SE
1274
HSB Tank 13 HSB Tank14 HSB Tank 15 Wt(g) SE Wt(g) SE Wt(g) SE
1180 1016 1088
1211201 1744 102 1778 095 1658 096 1798 109 1752 118 1704 109
1 302 27 60 1 38 28 76 155 27 04 154 3306 157 3424 149 3414 211
1 2402 4196 252 4424 207 4882 299 6344 263 6192 326 6432 362
212102 6332 317 6763 334 6912 299 9474 473 9553 452 10500 388
Table 3 Comparison of survivalfeed conversion ratio (FCR) and condition factor at 60 grams for backcross hybrid striped bass (BX) and hybrid striped bass (HSB)
Cross Tank
Starting
Ending
Survival
BXS
160
136
85
BX 6 BX 12 HSB 13 HSB 14 HSB 15
160
138
86
161
137
85
178
177
99
179
173
97
180
179
99
Starting Biomass (g) 1964 1922 2051 2100 1819 1958
Ending Biomass (g) 8612 9334 9469 16770 16526 18795
Feed Fed(g) 12106 12135 11447 18041 17805 20463
FCR 182 164 154 123 121 122
Condition Factor 168E-05 166E-05 169E-05 194E-05 193E-05 208E-05
SE 353E-07 337E-07 424E-07 255E-07 327E-07 845E-07
50 International Journal of Recirculating Aquaculture Volume 5 June 2004
Performance of Sunshine Bass and Backcross Hybrid Striped Bass
day while BX had a specific growth rate of 205 per day Neither of the covariates included in the model were found to have a significant effect on weight differences (initial tank biomass F = 142 df = 1587 P = 02332 amount of feed F = 005 df = 1587 P = 08165)
Performance regarding key economic traits-survival feed conversion efficiency and condition factor-are summarized in Table 3 At the end of the grow-out trial survival of HSB was significantly greater than that of BX (F = 6216 df = 1 1014 P lt 00001) Feed conversion ratio was better for HSB (122) than for BX (166) Condition factors for BX were lower than those for HSB (l68 vs 198) meaning that BX appeared longer and less deep-bodied than HSB
DISCUSSION Our data showed that F1 HSB performed as well or better than BX for a range of hatchery- and grow-out-related traits
Hatchery traits Fertilization rates for backcross lots were approximately half that for HSB There was a wide variance for fertilization and hatch rates of eggs from HSB females Some of this variance may be due to differences in hatchery protocols (different hormone injections used strip vs tank spawning) at the commercial hatcheries where the data were collected (TIJ Smith personal communication) Poor hatch rates also may be attributable in part to hybrid breakdown that is to developmental incompatibilities among the genomes of the respective species when coadapted gene complexes are broken up at meiosis in the F1 (Hallerman 2003)
In the hatchery trial we hypothesize that the low swimbladder inflation rate for our J~ly fry resulted from offering first feed to the BX too early When rearing HSB and SB fry we typically wait until the yolk sac has been largely resorbed and the fry mostly have inflated their swimbladders before we introduce live feed This is because live feed can cause an oily film on the water surface that interferes with a frys successful ingestion of air bubbles necessary to inflate the swimbladder (Chapman et al 1988) The timing of swimbladder inflation varies with fry type and temperature with HSB typically inflating between 3 and 6 days after hatch and SB 6 to 9 days after hatch BX fry inflate their swimbladder at an intermediate time 5 to 8 days after hatch (DAH) Since for the July
International Journal of Recirculating Aquaculture Volume 5 June 2004 51
Performance of Sunshine Bass and Backcross Hybrid Striped Bass
spawn we introduced feed into their tanks at the time prescribed for HSB (at 5 DAH) BX fry may have had a reduced opportunity to inflate their swimbladders because of interference by a surface film with air contact In the October spawn we monitored swimbladder inflation more carefully and introduced live feed on day 7 after almost 90 of swimbladders were inflated The low swimbladder inflation rate in the July hatchery run of BX may have had a direct impact on survival Larvae without inflated swimbladders expend more energy swimming exhibit reduced growth rates are less tolerant of stress and often sink to the tank bottom and die (Van Heukelem et al 2000)
BX were weaned more quickly and earlier onto dry diets than HSB which may have helped contribute to their ability to match the size and weight of HSB at 60 DAH Earlier weaning has economic merit since dry diets are generally cheaper and easier to feed than brine shrimp
Grow-out traits After 60 days post-hatch the growth and other performance differences between BX and HSB became more evident HSB exhibited significantly better growth survival and feed conversion ratios
We hypothesized that backcross hybrid striped bass might grow as fast or faster than the standard commercially-available F 1 hybrid striped bass if high-performance HSB females were selected as broodstock Our data regarding performance in intensive tank systems did not support this hypothesis Rather our observations accord with the classical view that the high performance of some interspecific hybrids is largely due to heterosis and that because the heterosis shown by an F 2 or backcross hybrid is only half that shown in an F1 (Falconer and Mackay 1996 p 257) that advanced generation hybrids would not perform as well as F1
hybrids Indeed F 2 HSB previously showed low hatch rates low larval survival and high variability of growth rate (Smith and Jenkins 1984 Smith et al 1985) Our results suggest that the heterosis expressed in HSB for growth and performance was greater than the selective breeding advantage we employed by crossing high performance HSB females with male striped bass Apparently the additive genetic variance contributed by the HSB and striped bass selected for size-at-age could not make up for the loss of dominance variance
BX may have better potential market acceptance by virtue of having a lower condition factor appearing longer and less deep-bodied than HSB more
52 International Journal of Recirculating Aquaculture Volume 5 June 2004
Performance of Sunshine Bass and Backcross Hybrid Striped Bass
like striped bass that are more familiar in many markets Fins Technologys market experience has shown that the premium-priced live markets prefer longer leaner fish such as the backcross There is the possibility that because of later maturity backcross hybrid striped bass may grow to larger sizes than hybrid striped bass This is attractive because there is an unserviced demand for larger (1 kg+) fish that can provide portion-controlled 7-9 ounce fillets for the restaurant and retail markets
ACKNOWLEDGEMENTS This project was supported by US Department of Agriculture-Small Business Innovation Research Program Phase I Grant no 2001-00373 EMH is supported by the USDA-CSREES Hatch Program and the Commonwealth of Virginia Aquaculture Initiative
REFERENCES Bosworth BG Libey GS Notter DR Egg Larval and Fingerling
Traits of Crosses among Striped Bass White Bass and their Fl Hybrids Aquaculture 1997 154 201-217
Carlberg J Van Olst J US Production and Sales of Hybrid Striped Bass (1987-2002) 2003 httpaquanicorgsbgaHSBversion5ppt
Chapman DC Hubert WA Jackson UT Influence of Access to Air and of Salinity on Gas Bladder Inflation in Striped Bass Progressive Fish-Culturist 1988 50 23-27
Falconer DS Mackay TFC 1996 Introduction to Quantitative Genetics Fourth Edition Longman Group Ltd Harlow Essex UK
Halbrendt CK Wirth FF Vaughn GF Conjoint Analysis of the Mid-Atlantic Food-Fish Market for Farm-Raised HSB Southern Journal of Agricultural Economics 1991 23 155-163
Hallerman EM Coadaptation and Outbreeding Depression In Po_pulation Genetics Principles and Applications for Fisheries Scientists Hallerman E (Ed) 2004 American Fisheries Society Bethesda MD USA
Harrell RM Hybridization and Genetics Striped Bass and Other Morone Culture In Harrell RM (Ed) 1997 Pages 217-234 Elsevier Science Amsterdam
International Journal of Recirculating Aquaculture Volume 5 June 2004 53
Performance of Sunshine Bass and Backcross Hybrid Striped Bass
Jenkins WE Heyward LD Sr Smith TIJ Performance of Domesticated Striped Bass Marone saxatilis Palmetto Bass and Backcross Hybrid Striped Bass (Sunshine Bass Female x Striped Bass Male) Raised in a Tank Culture System Journal of the World Aquaculture Society 1998 29 505-509
Kerby JH Cryogenic Preservation of Sperm from Striped Bass Transactions of the American Fisheries Society 1983 112 86-91
Losordo TM Westerman P An Analysis of Biological Economic and Engineering Factors Affecting the Cost of Fish Production in Recirculating Aquaculture Systems Journal of the World Aquaculture Society 1994 25 193-203
SAS Institute 1999 The SAS System for Windows version 82 SAS Institute Cary NC USA
Smith TlJ Jenkins WE Controlled Spawning of Fl Hybrid Striped Bass (Marone saxatilis x M chrysops) and Rearing of F2 Progeny Journal of the World Mariculture Society 1984 15 147-161
Smith TlJ Jenkins WE Snevel JF Production Characteristics of Striped Bass (Marone saxatilis) and Fl - F2 hybrids (Marone saxatilis and M chrysops) Reared in Intensive Tank Systems Journal of the World Mariculture Society 1985 16 57-70
Tomasso JR Kempton CJ Gallman A Smith TlJ Comparative Production Characteristics of Sunshine Bass and Sunshine Bass x Striped Bass in Recirculating-Water Systems North American Journal of Aquaculture 1999 61 79-81
Van Heukelem WF Harrell RM Hughes SG Lindell SR Friedmann BR Optimal Conditions for Swimbladder Inflation in Striped Bass Larvae Reared in Intensive Systems Northeast Regional Aquaculture Center Publication No 00-006 (2000) 5 pages
54 International Journal of Recirculating Aquaculture Volume 5 June 2004
Book Review
Fjofish apd Shellfish Bacteriology Mapua) Techpjques apd Procedures KA Whitman with contributions by NG MacNair
Iowa State Press (Blackwell Publishing Professional) Ames IA USA (2004) 288 pages ISBN 0813819520 US $4999
Reviewed by Rocco C Cipriano United States Geological Survey National Fish Health Research Laboratory 11649 Leetown Road Kearneysville WV 25430 USA E-mail rocco_ciprianousgsgov
Despite the fact that several good texts have been published regarding the description and nature of bacterial pathogens in aquatic animals there remained a need for a comprehensive yet practical guide devoted to techniques and procedures used for bacterial identification Diagnosis and detection of fish and shellfish pathogens often requires reliance upon standard microbiological media tests and reagents for some bacteria but more specialized assays are required for many aquatic pathogens In the latter case the products necessary for such assays are not commercially available and must be produced in aquatic animal diagnostic facilities from their basic ingredients Often therefore the compositions of differential media and the conduct of certain tests for the primary isolation or detection of specific aquatic pathogens are only available by referencing the general body of published scientific literature Hence until now there has not been a single-source shelf-volume that combines standard microbiological procedures used for routine detection and identification of medically important bacteria with the specialized needs of the fisheries profession This manual however helps to fill that void
The manual stands as a reference suitable for professional aquatic biologists with backgrounds in microbiology veterinarians and students of aquatic animal health Its strength lies in its coverage of the subject matter regarding culture-based diagnosis and identification of bacteria associated with finfish bivalves and lobsters Sections on
International Journal of Recirculating Aquaculture 5 (2004) 55-56 All Rights Reserved copyCopyright 2004 by Virginia Tech and Virginia Sea Grant Blacksburg VA USA
International Journal of Recirculating Aquaculture Volume 5 June 2004 55
Book Review FiQish and ShelJfish Bacteriology Manualmiddot Techniques and Procedures
aseptic collection and shipment of samples qualitative and quantitative procedures for bacterial isolation staining techniques media and standard biological tests used for the cultivation and phentotypic characterization of pathogenic bacteria and antibiotic sensitivity testing provide sound background for the student or novice practitioner Particularly beneficial for anyone who is not experienced with aquatic microbial pathogens is the section listing principal organs media and appropriate incubation temperatures to be used as the most probable sources of isolation for the specific bacteria
More experienced professionals will find it helpful and convenient to have the descriptions and interpretations of differential media (eg Coomassie Brilliant Blue Agar for Aeromonas salmonicida Rimler-Shotts Agar for Aeromonas hydropila Cytophaga Agar Shieh and TYES for Flavobacterium spp and Edwardsiella ictaluri Agar and various other media for Renibacterium salmoninarum) listed in a single source The major identifying criteria that phenotypically characterize selected bacterial pathogens are also described in tabulated form Specialized tests such as the SIF test to detect covert infections nurse culture techniques for enhanced bacterial growth and assays for public health indicator organisms in bivalves are documented Sections covering serology immunoassay and non-cultured based molecular assays (eg polymerase chain reaction) are also presented but are not as completely summarized as those for bacterial isolation In summary the nature of this manual makes it appropriate for frequent use as a practical laboratory guide
56 International Journal of Recirculating Aquaculture Volume 5 June 2004
Subscription Information
International Journal of Recirculating Aquaculture
A publication ofVirginia Tech and the Virginia Sea Grant College Program
IJRA presents the latest developments in RAS-related research focusing on the areas of
Food Quality Pathology
Food Safety
Aquatic Medicine Breeding amp Genetics Waste Management
FishShellfish Growth amp Nutrition Recirculating Systems Mgmt Marketing amp Economics Water Conservation
Dont miss an issue of this informative peer-reviewed journal Subscribe now using your credit card by calling 540-231-2075 or by printing out a form at wwwcfastvteduijrahtml If you prefer you can also mail this form to the address below along with a check or money order
Name ----------------~ Address ----------------Line2 ------------------City ____________ State __ _ Country Postal Code ___________ _ Phone Fax -------- --------e-mail-----------------check _ 2 year ($25 US)
International Journal of Recirculating Aquaculture Food Science amp Technology Building (0418)
Virginia Polytechnic Institute and State University Blacksburg VA 24061
phone (540) 231-2075 fax (540) 231-9293 e-mail IJRAvtedu
International Journal of Recirculating Aquaculture Volume 5 June 2004 57
~ International Journal of ~ Recirculating Aquaculture A publication of Virginia Tech and the Virginia Sea Grant College Program
Instructions for Authors The International Journal of Recirculating Aquaculture (IJRA) encourages the submission of original high-quality papers on research in all aspects of recirculating aquaculture Papers will be peer-reviewed and evaluated for scientific merit relevance and for their usefulness in promoting the advancement of recirculating aquaculture Complete coherent projects are preferred Any related papers submitted together must be thoroughly cross-referenced All papers must be original meaning that the data and the information presented must be the work of the authors and can not have been published elsewhere Dual publication of a paper or data is possible only through the permission of the Editors of both journals THERE ARE NO PAGE CHARGES for IJRA submissions
INITIAL MANUSCRIPT SUBMISSION Manuscripts should be sent to Ms Angela Correa Managing Editor by mail using the address listed at the end of these instructions or by e-mail to (ijravtedu) Submit four (4) copies of each manuscript if regular mail is used All manuscripts must be in English Dot matrix type is not acceptable and all such submissions will be returned without review Each submission must include a cover letter stating that the paper contains original research and that the information has not been published elsewhere E-mailed submissions must be saved in doc format Be sure to include the names of colleagues who have already reviewed the work presented IJRA has two categories for submission 1 Articles which are complete in-depth scientific studies and 2 Notes which are short papers of limited scope Articles and notes will be critically reviewed by two or three experts as well as by the Managing Editor Submissions may be returned without peer review in cases where the Managing Editor determines that they are inappropriate for the journal of poor quality poorly written or fail to follow the journals style format
PREPARATION OF MANUSCRIPTS IJRA uses the latest editions of Websters New International Dictionary and Websters New Collegiate Dictionarv for standard spellings and word definitions All spelling will be in American English Foreign or science-related terminology that is unfamiliar and does not appear in these dictionaries will require an accompanying definition Acceptable scientific and common names of fishes are listed in A List of Common and Scientific Names of Fishes from the United States and Canada published by the American Fisheries Society Common names may be used throughout each paper but must be accompanied by a full scientific name when they first appear in a paper The author must use the full common name eg yellow perch not perch All foreign language words should be italicized in the manuscript
In the manuscript number each page sequentially and include the senior authors name next to the page number (eg Page 4 Jahncke) on each page Single-space all typed material including references Type size in the body of the text should be no larger than 12pts and no smaller than 10 pts Subsection headings should also be italicized in the manuscript Spell out one-digit numbers except when they are used with units of measure - eg six ponds 7 days
International Journal of Recirculating Aquaculture Volume 5 June 2004 59
Spell out any number that begins a sentence When two numbers occur sequentially in the text one of the numbers must be spelled out- eg In 1987 fifty fish were stocked Use commas in numbers of 1000 or more Use the 24-hour clock to describe time- eg 1300 not 100 pm
Keep footnotes to a minimum and number them sequentially throughout the paper All units of measurement must be reported via the metric system except in special circumstances (eg horsepower) Standard scientific abbreviations and symbols may be used without definition If the use of a symbol could cause confusion define the symbol the first time it is used On the final draft of a paper that has been accepted for publication Greek letters or other extraneous symbols that do not appear on a keyboard the name of the symbol should be noted where the symbol is used to help eliminate prepress errors Parts per million or milligrams per liter can be
-1 reported as either ppm or mgI but not as mgI
Commonly used aquaculture jargon can be used without defining the term - eg fry fingerling hapa Less commonly used jargon may also be used but terms should be defined the first time they are used Jargon from fields outside of aquaculture should also be defined the first time they are used Always place a zero to the left of a decimal point if the number is less than one this includes probability values - eg P = 005 not P = 05
COMPONENTS OF THE MANUSCRIPTS Articles and notes should include a title names of authors and their addresses abstract introduction materials and methods results discussion (or a combined results and discussion) conclusion (rarely) acknowledgements (if any) references figures and tables in that order Each section should start on a new page
Title - The title should accurately reflect the contents of the paper Brief concise titles are encouraged The title page must include the name(s) of the author(s) and all addresses
Abstract - The abstract should be a concise highlight of the results and conclusions Methodology should not be abstracted unless it is necessary to explain the results or unless the paper describes a new technique Abstracts should be less than 300 words
Introduction - The introduction should explain why the paper was written and why it should be read The introduction should condense the relevant information in the field that led the author to do the research The introduction is not a complete literature review and only the most relevant references should be cited The introduction should also contain a statement that describes the purpose or objective of the paper
Materials and Methods - The underlying goal of this section is to describe what was done so that others can repeat the experiment If previously published papers described a technique that was used they can be cited to prevent unnecessary repetition If the technique or process was modified the modification must be described so that others can repeat the process Experimental designs can be explained by use of figures if they will help clarify what was done If the experiment was a complicated one with many subparts subsections may be used to describe each subpart
Results - This section describes the data Proper use of tables and figures can simplify and help explain the results Statistical analysis of data is necessary unless differences are so obvious that statistical analysis is superfluous Although probability values of 005 and 001 are traditionally used each author is free to choose his or her own level of significance
60 International Journal of Recirculating Aquaculture Volume 5 June 2004
Discussion - This section should interpret the results and compare the results from this experiment to those found in similar research The section can also be used to speculate about the results to provide reasons for the trends and to suggest new ideas that can advance our understanding about aquaculture This section should not be a literature review section that merely compares results among several papers
Results and Discussion - Results and discussion sections can be combined In most cases this leads to a better paper because the integration of these sections leads to a more meaningful interpretation of data
Conclusion - This section should be used only when the results of an experiment lead to an unequivocal interpretation
Acknowledgements - This section should be used to thank organizations that supported the research monetarily and individuals who assisted in the research or preparation of the paper This section includes manuscript number designations for those institutions that assign such numbers
References - Select references with great care Unless the paper includes a literature review there is no need to reference every paper written about a subject Use only the most important ones
Figures and Tables - All figures andtables go after the references Figures always go before tables
Section headings (eg Materials and Methods) should be capitalized and in bold type Secondary headings should be balded and go flush left Tertiary headings are incorporated into the first paragraph of that subsection Tertiary headings are italicized and separated from the text by a double dash
In the text references are cited in one of two ways 1 Swingle (1959) evaluated two species of tilapia or 2 pond culture in Alabama began in the 1950s (Swingle 1959) When there are three or more authors list only the first in a citation and follow that with et al eg Smitherman et al (1983) reviewed catfish breeding work at Auburn University If the name of an institutional author is long it can be abbreviated in a citation eg Food and Agriculture Organization of the United Nations may be abbreviated as FAO When several citations are used in a single entry they are listed chronologically If you are citing two papers that were written by the same author(s) the name only has to appear once per citation followed by the years that designate the different papers Separate the years with a comma If you are citing two authors you must separate the citations with a semicolon (Smith 1975 1976 Jones 1976)
In the reference section the reference list is strictly alphabetical by last name of the senior author and then by initials if two authors have identical last names If an author has written more than one paper the following format should be followed All single authored papers go first followed by co-authored papers and then the papers that were written by three or more authors If an author has written more than one single-authored paper the papers are listed chronologically If an author has written more than one co-authored paper they are listed alphabetically by the second authors last name If a tandem has authored two or more papers the order is chronological Papers written by the same group of three or more authors should be listed chronologically
International Journal of Recirculating Aquaculture Volume 5 June 2004 61
The following format will be used when referencing various works
PAPERS Single-author papers
McGinty AS Effects of Size at Stocking on Competition and Growth of All-Male Tilapia Hybrids Journal of the World Aquaculture Society 1985 16 52-56
Multiple-author papers Tave D Smitherman RO Predicted Response to Selection for Early Growth in Tilapia nilotica Transactions of the American Fisheries Society 1980 109 439-445
If an author has published two or more papers in the same year follow the years with a letter to differentiate them eg Smith 1988a 1988b Use issue numbers only when each issue starts out with page 1 If pagination is consecutive throughout the volume omit the issue number Spell out journal names in their entirely without abbreviations
Papers in proceedings or in edited volumes Nicholson LC Woods LC Ill Woiwode JG Intensive Culture Techniques for the Striped Bass and its Hybrids In Culture and Propagation of Striped Bass and Its Hybrids Harrell RM Kerby JH Minton RV Eds 1990 American Fisheries Society Bethesda MD USA
Books and reportspublications from governmental or non-governmental bodies
Lovell T 1989 Nutrition and Feeding of Fish Van Nostrand Reinhold New York NY USA
Food and Agriculture Organization of the United Nations (FAO) Fisheries Department 1997 Review of the State of World Aquaculture No 886 FIRlC886 FAO Rome Italy
Theses and Dissertations
Easter CC 1992 Water Chemistry Characterization and Performance of a Recirculating Aquaculture System Producing Hybrid Striped Bass Masters thesis Virginia Polytechnic Institute and State University Blacksburg VA USA
Websites
Federation of European Aquaculture Producers (FEAP) European Eel Production (httpwwwfeaporgeelshtml) 2002
Page numbers for proceedings books theses and dissertations are unnecessary Government publications should be treated as if they were books but document numbers must be included THE ACCURACY OF REFERENCES IS THE SOLE RESPONSIBILITY OF THE AUTHORS MAKE SURE THAT CITATIONS AND REFERENCES MATCH
Tables - When creating a table decide what the purpose of the table is and what points are important then organize the table so that the main features can be easily understood The table heading should provide sufficient information for the table to be understood as an entity Keep footnotes to a minimum Each table goes on a separate page Tables must be camera ready TABLES WILL BE PRINTED AS IS AND WILL NOT BE TYPESET Figures - List all figure captions on separate pages Original artwork doesnt have to be submitted when a paper is first submitted for review but original artwork must accompany the final revised manuscript Good quality photocopies are acceptable when a manuscript
62 International Journal of Recirculating Aquaculture Volume 5 June 2004
is submitted for review Graphs and original artwork must be printed with a laser printer or done in pen and ink Dot-matrix figures are not acceptable Original artwork or high-contrast photographs are acceptable Label all figures on the back with a soft pencil name of senior author paper title and figure number
Photographs - Should be on glossy paper with good contrast Do not glue pictures to cardboard Color photographs can be printed but the additional cost of printing them will be charged to the author Label all photos on the back with a soft pencil name of senior author paper title and figure number
FINAL REVISED MANUSCRIPTS If using the mail submit two copies of the final revised manuscript including original artwork Submit either the original pen-and-ink drawings or laser-printed versions of the drawings In addition submit the manuscript on a disk (CD preferable) or by e-mail On the disk write the brand name of the computer or word processor the word processing program that was used (should be Microsoft Word) the title of your article and the file name NOTE Disk and hard copy must agree In case of discrepancies it is the policy of IJRA to follow hard copy An electronic version of the completed manuscript is needed in order to publish AUTHORS MAY NOT RECEIVE PAGE PROOFS Proofreading will be done by the Production Office of IJRA using the revised final version of the manuscript Therefore authors must be especially careful that no errors exist in the final revised version because in most cases no changes are possible after it is submitted
REPRINTS The senior author will receive two copies of the journal and a pdf file of the article for distribution and reprinting purposes The junior author(s) will also receive two copies of the journal issue These are sent several weeks after the journal is published and in circulation Requests for the pdf format of the article can only be made by the corresponding author
COPYRIGHT amp PERMISSIONS For permission to reprint articles that have appeared in IJRA please contact IJRA Copyright amp Permissions Food Science amp Technology Building (0418) Virginia Tech Blacksburg VA 24061 USA
COPYRIGHT TRANSFER If your manuscript is accepted for publication copyright ownership must be officially transferred to IJRA The Editors acceptance letter will include a form fully explaining this The form must be signed by all authors and the original returned to the Editor at this time Failure to return the copyright form in a timely fashion will result in delay in publication
Send your submissions to International Journal of Recirculating Aquaculture
AI Correa Managing Editor 27-B Food Science and Technology Building (0418) Virginia Polytechnic Institute and State University Blacksburg VA 24061 USA
If you have any questions please feel free to contact us Phone (540) 231-2075 Fax (540) 231-9293 e-mail ijravtedu
International Journal of Recirculating Aquaculture Volume 5 June 2004 63

Hematology and Blood Chemistry of Yellow Perch (Percaflavescens)
reliable reference blood values for most fish species Accurate reference intervals have been developed for some species including hybrid striped bass and tilapia under different production settings (Hrubec et al 1996 1997ab 2000 2001 Hrubec and Smith 2000) and for trout (biochemistry only Wedemeyer and Nelson 1975) pacu (hematological only Tocidlowski et al 1997) and milkfish (Ram-Bhaskar and Srinivasa-Rao 1989)
Little is known about the blood response of yellow perch There are few studies that have previously measured blood values in yellow perch (Toneys and Coble 1980 Nelson et al 1988 Nelson and Mitchell 1992 van den Heuvel et al 2000) Only a few parameters such as hematocrit sodium and chloride were determined as most of these studies were toxicological in nature and evaluated changes in other body systems The objective of this study was to generate a complete comprehensive list of reference blood values for normal healthy yellow perch (Perea flavescens) raised to market size in a recirculation system for later use as a diagnostic tool This is the first paper to report full hematological and biochemical profiles for production yellow perch
MATERIALS AND METHODS
Juvenile yellow perch were stocked into production recirculation systems as fingerlings and reared through their production cycle indoors in 10219-L recirculation tanks with a rotating biological contactor filter and 10 freshwater exchange per day At the end of their production cycle when the fish were 17 months old approximately 250 fish were removed from the production system and placed in a smaller 2400-L circular tank with a slant tube clarifier and a trickle biofilter The smaller tank had a freshwater replacement rate of 15 per day The fish were placed in the smaller systems to allow for a more rapid and less stressful capture procedure The fish were acclimated to the new tanks for 3 weeks The photoperiod was approximately 14-h light and 10-h dark Fish were fed daily to satiation with a commercial pelleted diet (Rangen EXTR 400 40 protein 10 fat Rangen Inc Buhl ID USA) The following water quality parameters were determined daily temperature pH ammonia alkalinity hardness nitrite nitrate and dissolved oxygen Ranges for water quality over the duration of the study are shown in Table 1 and are representative of water quality observed daily in these tank systems
International Journal of Recirculating Aquaculture Volume 5 June 2004 31
Hematology and Blood Chemistry of Yellow Perch (Perea flavescens)
Table 1 Water quality parameters for yellow perch (Percaftavescens) reared in a recirculation culture system Values are means plusmn standard deviations for the parameters on the days that fish were bled for hematological and blood biochemical determinations and are representative of the daily water quality values in the system
Parameter For Hematology Fish For Chemistry Fish
Temperature (degC) 209 plusmn 001 207plusmn 11
pH 78plusmn01 79 plusmn 02
NH3 un-ionized (mgL) 0012 plusmn 0012 0011 plusmn 0005
N02-N (mgL) 0031 plusmn 0015 0043 plusmn 0043
N03-N (mgL) 60 plusmn 26 28 plusmn09
Alkalinity (mgL) 252 plusmn44 313 plusmn 48
Hardness (mgL) 399 plusmn 10 433 plusmn27
Dissolved Oxygen (mgL) 74plusmn05 74 plusmn03
Fish were netted rapidly and anesthetized in aerated tank water with buffered tricaine methanesulfonate (MS-222 Sigma Chemical Co St Louis MO USA) until they began to lose equilibrium approximately 20 seconds Individual fish were bled for either hematological determinations (23g needle 1-mL syringe) or for biochemical determinations (23g needle 3-mL syringe) in both cases blood was collected from the caudal vessels After blood samples were collected the fish were weighed measured and checked for external and internal pathologic lesions The sex of each fish was determined by internal observation of the gonads
Blood for hematological determinations was transferred to an ethylenediamine-tetraacetic acid (EDTA) treated pediatric blood tube and held on ice until analysis (lt 1 hour) Blood for biochemical determinations was collected into cold 3-mL heparinized blood tubes and centrifuged at 14000 x g immediately Plasma was collected and frozen at -10degC until analyzed The following analytes were determined in the plasma with an Olympus AU-400 (Olympus America Inc Melleville NY USA) automated clinical chemistry analyzer total protein albumin creatinine total bilirubin alkaline phosphatase (ALP) aspartate aminotransferase (AST) cholesterol glucose sodium potassium chloride phosphorus calcium and magnesium Globulin was calculated from the total protein value minus the albumin value
32 International Journal of Recirculating Aquaculture Volume 5 June 2004
Hematology and Blood Chemistry of Yellow Perch (Percaflavescens)
Hematological analytes were determined from the EDTA anticoagulated blood As we have observed for other fish species EDTA was superior to heparin for yellow perch blood both in preventing clot formation and preserving cellular morphology (Hrubec et al 1996 2000) Blood from the EDTA tube was drawn into microhematocrit tubes and the packed cell volume (PCV) determined after centrifugation at 10000 x g for 5 min Plasma protein was determined with a clinical refractometer using plasma from the microhematocrit tube The total erythrocyte and leukocyte-plus-thrombocyte counts were determined manually with a Neubauer hemacytometer using Natt-Herricks solution as a diluent stain (Natt and Herrick 1952) Blood smears made within 45 minutes of sample collection were stained with Wright-Geimsa stain and were used to determine the differential counts as follows Leukocytes and thrombocytes were identified and counted on the blood smears until 200 leukocytes and a variable number of thrombocytes were enumerated The percentages of each leukocyte type and of thrombocytes were multiplied by the total leukocyte-plus-thrombocyte number to give the final cell counts Thrombocyte numbers were subtracted from the leukocyte-plus-thrombocyte count to give the total leukocyte count This method of manually determining total leukocyte and differential counts has been recommended for use with avian (Zinkl 1986) and fish blood (Hrubec et al 1996 1997ab 2000 2001) as the nucleated red cells prevent accurate enumeration using automated analysis (Huffman and Arkoosh 1997) Slight thrombocyte clumping was observed on the hemacytometer for some individuals only fish with minimal thrombocyte clumping(lt 4 cells clumped) were used for the differential counts to ensure accuracy of the counts
Reference intervals were determined following the guidelines proposed by the National Committee for Clinical Laboratory Standards (NCCLS 1992) As suggested in these guidelines the data were checked for outliers using the 13 differencerange ratio and no outliers were identified The values were then ranked and the high and low 25 were discarded The range of the remaining values provided the reference interval
RESULTS AND DISCUSSION The physiologic and health status of an individual is reflected in the blood producing variations in hematological and blood biochemical values Clinical analysis of blood is a fundamental tool used in human
International Journal of Recirculating Aquaculture Volume 5 June 2004 3 3
Hematology and Blood Chemistry of Yellow Perch (Percaflavescens)
and veterinary medicine to diagnose and predict the outcome of disease and to monitor the effect of therapeutic nutritional and environmental management Blood analysis is not used extensively as a diagnostic tool in fish medicine partly due to the lack of reference intervals for various fish species and also because changes associated with specific diseases and metabolic disorders are not well characterized With sufficient background data clinical analysis of individual blood samples could detect infectious diseases metabolic disorders and sub-lethal disease states affecting production performance
Hematological and plasma biochemistry data from diseased individuals can be evaluated by direct comparison to a reference interval which is the appropriate range of variation in a blood parameter from a defined population of individuals under specific conditions The reference interval needs to be determined on a sufficient number of normal healthy individuals under similar production conditions using standardized analytical techniques (NCCLS 1992) When the deviation in a blood parameter is large enough to fall outside the reference interval it indicates the value may be aberrant and is most likely not due to individual variation for a given fish
Few previous studies have determined blood parameters for yellow perch (Toneys and Coble 1980 Nelson et al 1988 Nelson and Mitchell 1992 van den Heuvel et al 2000) These studies are of limited relevance as they were primarily toxicological studies and only a few blood parameters were determined and also because blood samples were collected and handled by differing methods prior to determination of the blood value Some of the capture (hook and line and gill netting) and blood collection methods (severing the caudal peduncle) used in these studies are also unsuitable for diagnostic blood samples as they result in significant alteration in the blood which will mask diseased states The study with the closest sampling procedure to that used in our experiment only presented selected blood chemistry values for yellow perch after 16 hours of moderate or exhaustive exercise (Nelson and Mitchell 1992) Therefore although the previous studies on yellow perch hematology are helpful in determining the effects of environmental factors and stress they have limited diagnostic utility and even prevent meaningful comparison with the data presented in this paper
The average mean weight of the yellow perch used for the hematological determinations was 125 +- 14g with a total length of 223 +- 08 cm For
34 International Journal of Recirculating Aquaculture Volume 5 June 2004
Hematology and Blood Chemistry of Yellow Perch (Percajlavescens)
the biochemical determinations the fish had a weight of 121 +- 15g and length of 226 +- 08 cm The results of the hematological determinations from 52 fish are listed in Table 2 Values for plasma chemistry reference intervals determined on 42 samples are listed in Table 3 Overall both the hematological and plasma chemistry values were similar to those reported previously for hybrid striped bass and tilapia reared in recirculation systems (Hrubec et al 1996 2000 Hrubec and Smith 2000) The striped bass and tilapia from production systems exhibited wider ranges in value for the different leukocyte types increased numbers of reticulocytes increased plasma and total protein values increased creatinine values and a decreased plasma chloride concentration as compared to fish in lower density recirculation tanks We did not compare blood values from the production yellow perch in this study to yellow perch maintained in low-density tank settings so were unable to determine if these same trends are apparent in yellow perch as well However based on our previous experience with fish hematological and plasma biochemical values there is an indication that these trends are occurring in yellow perch as well
Table 2 Hematological reference intervals for adult yellow perch (Perea flavescens) reared in a recirculation system
Analyte N Reference Interval Mean Stds1
PCV2 () 57 29-47 388 45
Plasma Protein (gdl) 57 60-82 67 06
Erythrocytes (x 106ml) 53 2160-3345 2737 0356
Leukocytes (ml) 53 52590-186490 113914 39086
Lymphocytes (ml)
Small 53 36800-153420 85630 31728
Large 53 3530-23 130 11602 5359
Neutrophils (ml) 53 1860-35950 12430 8837
Monocytes (ml) 53 670-12640 4252 2874
Thrombocytes (ml) 53 38270-118510 72972 21299 1Standard deviation 2Packed cell volume
International Journal of Recirculating Aquaculture Volume 5 June 2004 35
Hematology and Blood Chemistry of Yellow Perch (Perea flavescens)
Table 3 Plasma biochemical values for adult yellow perch (Percaftavescens) reared in a recirculation system
Analyte N Reference Interval Mean Stds1
Total Protein (gdl) 42 37-50 45 04
Albumin (gdl) 42 06-09 07 01
Globulin (gdl) 42 31-42 37 03
Creatinine (mgdi) 42 04-10 06 01
Total bilirubin (mgdi) 42 03-04 03 01
ALP2 (UI) 42 50-114 822 249
AST3 (UI) 42 2-29 85 64
Glucose (mgdi) 42 62-181 1000 350
Cholesterol (mgdi) 42 182-323 2440 330
Sodium (mEqI) 42 138-153 1470 40
Potassium (mEqI) 42 20-38 32 05
Chloride (mEqI) 42 119-133 1260 40
Calcium (mEqI) 42 86-120 103 13
Phosphorus (mEqI) 42 50-96 74 11
Magnesium (mEqI) 42 17-34 27 04 1 Standard deviation 2 Alkaline phosphatase 3 Aspartate aminotransferase (SGOT)
The blood cells present in the yellow perch were typical of teleost fish and included erythrocytes thrombocytes and leukocytes (Fig 1) Erythrocytes were oval to round with characteristic red cytoplasm and an elongate and centrally-located nucleus Immature erythrocytes or reticulocytes demonstrated a blue-purple tinge to the normal eosinophilic cytoplasm (Fig IA B C) The yellow perch had increased numbers of reticulocytes (included in the erythrocyte count) with approximately 7 to 10 per field at lOOx oil immersion compared to what we observe for most fish species The cause for the apparent reticulocytosis is not known but has been observed in other fish species exposed to elevated nitrite and nitrate (Grabda et al 1974 Hrubec et al 1996 2000 Hrubec and Smith 2000)
36 International Journal of Recirculating Aquaculture Volume 5 June 2004
Hematology and Blood Chemistry of Yellow Perch (Perea flavescens)
T bull middotmiddot ~~ - middot
N -
Figure I Characteristic blood cells from yellow perch reared in recirculation systems Blood smears were made with EDTA anticoagulated blood stained with Wrights Geimsa stain Cells are abbreviated as follows U - Large lymphocyte SL - small lymphocyte T - thrombocyte R - reticulocytes (immature erythrocyte) PC - plasma cell (activated lymphocyte) M- monocyte N-neutrophil The blue bar in frame A is Omm
International Journal of Recirculating Aquaculture Volume 5 June 2004 37
Hematology and Blood Chemistry of Yellow Perch (Percajlavescens)
The thrombocytes were slightly smaller than the erythrocytes (Fig IA) They had clear cytoplasm and were variable in shape being elongated pyriform oval or round Nuclear shape tended to follow cytoplasmic shape although oval and round thrombocyte nuclei occasionally were lobulated (Fig IB) as described for striped bass and tilapia (Hrubec et al 1996 2000)
Leukocytes made up the remainder of the cell types seen in the blood and included small and large lymphocytes neutrophils and monocytes No eosinophils or heterophils were observed Small lymphocytes were the smallest cell present with a rim of blue cytoplasm surrounding the round nucleus (Fig IA E F) Large lymphocytes had an abundant and darker blue cytoplasm and the nucleus was larger than observed in the small lymphocyte (Fig IA E) Plasma cells were occasionally observed with a classic open nucleus abundant dark blue cytoplasm and a clear cytoplasmic region adjacent to the nucleus presumably representing the Golgi as in mammalian plasma cells (Fig IC) Plasma cells were included in the large lymphocytes category for the differential counts
Neutrophils were the largest cell present in the blood (Fig ID E F) The cytoplasm of the neutrophil was a translucent grey containing no granules and infrequent vacuoles Cytoplasmic shape was round to angular as the cellular borders often appeared slightly adherent to adjacent erythrocytes distorting cellular shape Nuclear shape of the neutrophil varied from round to horseshoe shaped and frequently segmented into two prominent lobes connected by a thin nuclear bridge (Fig IF) Monocytes had abundant dark blue cytoplasm that was frequently vacuolated (Fig ID) The round to kidney-bean shaped monocyte nucleus was large with prominent chromatin clumping
Analysis of blood parameters can provide a wealth of information useful in analyzing the effects of disease and sub-optimal environmental conditions Providing reference intervals for healthy adult yellow perch reared in recirculation systems furnishes veterinarians and fish health professionals the foundation to develop diagnostic hematology for this species The number of studies that determine actual reference intervals for fish species is limited The majority of blood values determined for fishes are reported in the literature as a mean value with a standard deviation Historically reference intervals were determined as two standard deviations from the mean however this method is only valid when blood values follow a normal distribution It is incorrect to assume
38 International Journal of Recirculating Aquaculture Volume 5 June 2004
Hematology and Blood Chemistry of Yellow Perch (Percaflavescens)
that biological parameters are distributed normally therefore non-parametric methods should be used to accurately determine reference intervals (Reed et al 1971) Techniques to properly determine reference intervals have been established by the NCCLS (1992) and suggestions for their use and interpretation have been discussed (Lumsden 1998) As with mammalian species reference intervals need to be determined for different populations of fish within a single species as culture conditions and environmental variables affect blood values to the extent that they are outside the reference interval (Ram-Bhaskar and Srinivasa-Rao 1989 Hrubec et al 1996 1997ab 2000 2001) Although the reference range for some of the blood parameters appears large it is still possible to detect variation in hematologic values associated with pathological conditions (Hrubec et al 1997b and unpublished data)
Developing reference intervals is a necessary first step in determining which specific hematological changes can be associated with disease conditions As the field of fish hematology develops its usefulness to the aquaculture industry will increase Information derived by standardized non-lethal diagnostic assays will be needed to enhance the culture of yellow perch and other fish species Analysis of diagnostic blood samples can provide a means for early detection of infectious disease and assist in the identification of sub-lethal conditions affecting production performance This should allow for more specific timely and effective disease treatments in the future
ACKNOWLEDGEMENTS The authors wish to thank Mark Kidd of the Virginia Tech Aquaculture Center for his assistance with fish care and sampling
REFERENCES Grabda E Einszporn-Orecka T Felinska C Zbanyszek R
Experimental Methemoglobinemia in Rainbow Trout Acta Ichthyologica et Piscatoria 1974 4 43-71
Hrubec TC Smith SA Robertson JL Feldman B Veit HP Libey G Tinker MK Comparison of Hematologic Reference Intervals between Culture System and Type of Hybrid Striped Bass American Journal of Veterinary Research 1996 57 618-623
International Journal of Recirculating Aquaculture Volume 5 June 2004 3 9
Hematology and Blood Chemistry of Yellow Perch (Percajiavescens)
Hrubec TC Robertson JL Smith SA Effects of Temperature on Hematologic and Serum Biochemical Profiles of Hybrid Striped Bass (Morone chrysops x Morone saxatilis) American Journal of Veterinary Research 1997a 58 126-130
Hrubec TC Robertson JL Smith SA Effects of Ammonia and Nitrate Concentration on Hematologic and Serum Biochemical Profiles of Hybrid Striped Bass (Morone chrysops x Morone saxatilis) American Journal of Veterinary Research 1997b 58 131-135
Hrubec TC Smith SA Hematology and Plasma Chemistry Values for Production Tilapia ( Oreochromis hybrid) Raised in a Recirculation System International Journal of Recirculating Aquaculture 2000 J 5-14
Hrubec TC Cardinale JL Smith SA Hematology and Plasma Chemistry Reference Intervals for Cultured Tilapia ( Oreochromis hybrid) Veterinary Clinical Pathology 2000 29 7-12
Hrubec TC Smith SA Robertson JL Age Related Differences in Hematologic and Plasma Chemistry Analytes of Hybrid Striped Bass Morone chrysops x Morone saxatilis Veterinary Clinical Pathology 2001 30 8-15
Huffman PA Arkoosh MR Characteristics of Peripheral Blood Cells from Rainbow Trout Evaluated by Particle Counter Image Analysis and Hemocytometric Techniques Journal of Aquatic Animal Health 1997 9 239-248
Kelly AM Yellow Perch Culture in the United States Manna or Mania World Aquaculture 2000 31 4-17
Lumsden JH Normal or reference values Questions and Comments Veterinary Clinical Pathology 1998 27 102-106
Mallison JA 2000 A White Paper on the Status and Needs of Yellow Perch Aquaculture in the North Central Region North Central Regional Aquaculture Center Michigan State University E Lansing MI USA
Natt MP Herrick CA A New Blood Diluent for Counting Erythrocytes and Leukocytes of the Chicken Poultry Science 1952 31 735-738
40 International Journal of Recirculating Aquaculture Volume 5 June 2004
Hematology and Blood Chemistry of Yellow Perch (Percaflavescens)
NCCLS National Committee for Clinical Laboratory Standards 1992 How to Define Determine and Utilize Reference Intervals in the Clinical Laboratory Proposed Guidelines NCCLS Document C28-P Villanova PA USA
Nelson JA Mitchell GS Blood Chemistry Response to Acid in Yellow Perch (Perea flavescens) Comparison of Populations from Naturally Acidic and Neutral Environments Physiological Zoology 1992 65 493-514
Nelson JA Magnuson J J Chulkasem W Blood Oxygen Capacity Differences in Yellow Perch (Percaflavescens) from Northern Wisconsin Lakes Differing in pH Canadian Journal of Fisheries and Aquatic Sciences 1988 45 1699-1704
Ram-Bhaskar B Srinivasa-Rao K Influence of Environmental Variables on Hematology and Compendium of Normal Hematological Ranges of Milkfish Chanos chanos (Forskal) in Brackish Culture Aquaculture 1989 83 123-136
Reed AH Henry RJ Mason WB Influence of Statistical Method Used on the Resulting Estimate of Normal Range Clinical Chemistry 1971 17 275-284
Schmitz M 1999 Comparative Growth of All-Female Versus Mixed Sex Yellow Perch (Percaflavescens) in Recirculating Aquaculture Systems MS Thesis Virginia Tech Blacksburg VA USA
Toneys ML Coble DW Mortality Hematocrit Osmolality Electrolyte Regulation and Fat Depletion of Young-of-the-Year Freshwater Fishes under Simulated Winter Conditions Canadian Journal of Fisheries and Aquatic Science 1980 37 225-232
van den Heuvel MR Power M Richards J MacKinnon M Dixon DG Disease and Gill Lesions in Yellow Perch (Percaflavescens) Exposed to Oil Sands Mining-Associated Waters Ecotoxicology and Environmental Safety 2000 46 334-341
Wedemeyer GA Nelson NC Statistical Methods for Estimating Normal Blood Chemistry Ranges and Variance in Rainbow Trout (Salmo gairdneri) Shasta Strain Journal of the Fisheries Research Board of Canada 1975 32 551-554
International Journal of Recirculating Aquaculture Volume 5 June 2004 41
Hematology and Blood Chemistry of Yellow Perch (Percajlavescens)
Zinkl JG Avian Hematology In Schalms Veterinary Hematology (4th edition) Jain NC (Ed) 1986 Pages 256-260 Lippincott Williams amp Wilkins Philadelphia PA USA
42 International Journal of Recirculating Aquaculture Volume 5 June 2004
Hatchery and Grow-out Performance of Sunshine Bass and Backcross Hybrid Striped Bass in Recirculating Aquaculture Systems
SR Lindell1bull2 B Delbos1 R Perham1 J Goldman1 EM Hallerman3 TO Brenden3bull4
1 Fins Technology 15 Industrial Road Turners Falls MA 01376 USA
2Current address Marine Biological Laboratory Marine Resources Center 7 MBL Street Woods Hole MA 02543 USA
3Department of Fisheries and Wildlife Sciences (0321) Virginia Polytechnic Institute and State University Blacksburg VA 24061 USA
4Current address Institute of Fisheries Research University of Michigan 1109 N University Avenue Ann Arbor MI 41809 USA
Corresponding authors e-mail ehallermvtedu
Keywords striped bass performance aquaculture growth
International Journal of Recirculating Aquaculture 5 (2004) 43-54 All Rights Reserved copyCopyright 2004 by Virginia Tech and Virginia Sea Grant Blacksburg VA USA
International Journal of Recirculating Aquaculture Volume 5 June 2004 43
Performance of Sunshine Bass and Backcross Hybrid Striped Bass
ABSTRACT Previous research has suggested that backcross hybrid striped bass (BX sunshine bass female x striped bass male) perform as well as F 1 hybrid striped bass (sunshine bass white bass female x striped bass male) for many economically important traits We conducted trials to compare rearing and growth traits of selected backcross hybrid striped bass with hybrid striped bass (HSB) We spawned and reared larval BX fry in two hatchery cycles measured fry growth and performance and compared them to past performance of HSB fry We conducted a grow-out trial of commercially-available hybrid striped bass versus backcross hybrid striped bass in replicated tanks to phase II fingerling size (approximately lOOg) Compared to HSB in the hatchery phase backcross hybrid striped bass exhibited lower fertilization rate comparable swimbladder inflation rate shorter time-to-weaning lower survival comparable growth and comparable condition factor After 60 days HSB exhibited significantly better growth survival and feed conversion efficiency than BX However BX may have better potential market acceptance by virtue of having a lower condition factor appearing longer and less deep-bodied than HSB
INTRODUCTION Striped bass (Morone saxatilis) and its hybrids constitute a major sector of aquaculture in the United States with production of 105 million pounds in 2002 (Carlberg and Van Olst 2003) Commercially significant quantities of Morone stocks also are produced in Taiwan China and Israel Approximately 43 of Morone production occurs in tanks (Carlberg and Van Olst 2003) much of that in recirculating aquaculture systems (RAS) Private and government marketing experts estimate that US production could increase to 50 million pounds and $100 million in annual farm-gate revenue if market prices could be decreased only moderately (Halbrendt et al 1991) Production costs for HSB could be reduced by 12 if selective breeding can yield 20 faster growth rates (Losordo and Westerman 1994)
The majority of Marone production is not of striped bass but of its hybrids with white bass (M chrysops) because of their hardiness rapid growth rate and limited availability of female striped bass broodstock (reviewed by Harrell 1997) Further female WB are considered easier and more predictable to strip-spawn Hence most commercial production
44 International Journal of Recirculating Aquaculture Volume 5 June 2004
Performance of Sunshine Bass and Backcross Hybrid Striped Bass
is of sunshine bass the progeny of the white bass female x striped bass male interspecific cross Research has also been undertaken to evaluate the performance of second generation hybrids and backcrosses Several studies have suggested that the progeny of F 1 hybrid striped bass females backcrossed to striped bass males have merit for commercial production Jenkins et al (1998) compared the performance of backcross hybrids to F1 hybrid striped bass and striped bass to market size in a recirculating system At harvest no differences in growth rate or feed conversion were detected specific growth of BX was intermediate to those of the other stocks with survival lower Tomasso et al (1999) compared performance of F 1 and backcross hybrids between 20 and 90 grams for 56 days in tanks (Tomasso et al 1999) and observed similar survival growth and feed conversion rates among the hybrid types Detailed comparison of the hatchery performance of sunshine and BX hybrids is lacking We hypothesized that use of selected hybrid striped bass and striped bass for the backcross might yield a high-performance BX hybrid Should high performance be realized progressive fish farmers might utilize this approach by selecting the best F1 hybrid females from their own production stocks making the backcross by strip-spawning them and fertilizing the eggs with purchased milt from selectively bred striped bass males (Kerby 1983) thereby obtaining a high-performance production stock that because of selection on the maternal stock is suited to their particular farm conditions
In this study we evaluated the production potential of backcross (BX) hybrid striped bass (female sunshine bass x male striped bass) We compared the hatchery and grow-out performance of BX spawned from select broodstock and sunshine bass (HSB) of common genetic background Specifically we evaluated spawning success hatch rate growth survival and feed conversion efficiency through the first six months of life In order to benchmark our results we ran a trial in replicated tanks with HSB supplied by the most widely-used commercial source of fingerlings (Keo Fish Farms Keo AR USA) and compared their performance with our BX All fish were cultured within intensive controlled-environment recirculating aquaculture systems
International Journal of Recirculating Aquaculture Volume 5 June 2004 45
Performance of Sunshine Bass and Backcross Hybrid Striped Bass
MATERIALS AND METHODS In July 2001 we crossed 4 hybrid striped bass females to each of 4 striped bass males to produce 16 families of backcross hybrid striped bass Poor fertilization rates resulted in a low yield of fry from this spawn However there were enough fry to pool and conduct a pilot commercial-scale hatchery run Randomly-chosen samples from the resulting 4000 fingerlings were used for the grow-out trial
In October 2001 we spawned 3 female HSB with 2 male SB and eventually produced 7000 fingerlings While this was not enough to grow in commercial-scale systems we collected hatchery performance data to corroborate our JulyAugust experience with BX
Fertilized eggs were incubated in McDonald jars Upon hatch the larvae swam out of the hatching jar and into a 1900-L larval rearing tank Replicate larval rearing tanks were stocked with approximately 25 larvae per liter Tanks were maintained with recirculating water and surface oil-skimming pads for the first 5 to 7 days post-hatch until swim-bladder inflation was completed For the second week post-hatch larval rearing tanks were maintained static with gentle central aeration except for an exchange of about 30 of the tank water over the course of two hours each day During the second week post-hatch larvae were fed rotifers enriched with Algamac (Aquafauna BioMarine Inc Hawthorne CA USA) maintained at a density of 10ml By the end of the second week larvae were weaned from rotifers to Artemia nauplii By the end of the third week the larvae were typically weaned from enriched Artemia to artificial feed (Biokyowa Inc Girardeau MO USA) Weaned larvae were graded just once around 60 days post-hatch to remove the top 1 to 2 of larger fish responsible for cannibalism
In November 2001 we purchased lOg fingerlings that represent typical industry-standard HSB from Keo Fish Farms (Keo AR USA) These HSB closely matched the size and weight of our BX from the July spawn for the grow-out trial BX and HSB fingerlings were each stocked separately in triplicate 1900-L round tanks connected to the same recirculating system and reared at 23degC and a salinity of 1-3 ppt All six tanks were similarly stocked initially (approximately 1 kgm3) Fish were offered 80 of their expected ration via belt-feeders and hand-fed to satiation twice a day Approximately every 3 weeks length and weight samples were taken from a randomly-chosen 15 of each tanks
46 International Journal of Recirculating Aquaculture Volume 5 June 2004
Performance of Sunshine Bass and Backcross Hybrid Striped Bass
population At the conclusion of the project the tanks reached typical commercial densities of 5 to 9 kgm3bull
We quantified reproductive and hatchery performance of the three groups including fertilization rate swimbladder inflation rate days to weaning onto artificial feed (ie date of first ingestion to date that gt90 ingested artificial feed) survival estimates to approximately 60 days after hatch and to the end of the study feed conversion rate and monthly average weight and length The trial continued until mid-February 2002 when the HSB averaged approximately lOOg Results from previous years hatchery efforts with HSB using similar rearing protocols were used for comparative purposes
Both the hatchery and grow-out systems employed water recirculation technology including drum-filters fluidized-bed biofilters oxygenation ozonation and automated pH and temperature control that maintained high water-quality standards throughout the trials
Differences in fish weight between the hybrid types were analyzed as a repeated-measures general linear mixed model Residual (restricted) maximum likelihood was used to estimate the model parameters Initial fish biomass in each of the tanks and the amount of feed provided to each of the tanks were included in the model as covariates to assess the influence of these concomitant variables on differences in weight A first-order autoregressive covariance structure was assumed for the repeated-measurements of fish weight
Differences in fish survival at the end of the grow-out trial were analyzed as a general linear model with tanks serving as a blocking factor Because fish survivalmortality is a binary response and thus will violate an assumption of normality the significance of the test comparing survival between the hybrid types was obtained by randomization (number of randomizations= 1000) whereby the F-statistic of the original test was compared to F-statistics obtained by randomly allocating the survival mortality data to the different hybrid types The Type-I error rate for all statistical tests was set equal to 005
International Journal of Recirculating Aquaculture Volume 5 June 2004 47
Performance of Sunshine Bass and Backcross Hybrid Striped Bass
Table 1 Comparison of hatchery traits of backcross (BX) and Fl hybrid (HSB) striped bass for traits of economic interest
Traits of interest BX-HSB BX-HSB HSB HSB HSB
Female parent strain1 AR ARMD AR AR AR
Male parent strain1 MD FL MD FL MD MD FL MD Canada
Spawn date Oct-01 Jul-01 Mar-01 Oct-00 Jan-99
Fertilization 32 22 53 57
Swimbladder inflation 90 50 98 95
Weaning start (DAH)2bull3 24 21 17 22
Weaning end (DAH4 33 32 37 38
Mean wt (g) at 60 DAH 042 052 042 05
Survival to 60 DAH 7 740 104
Mean L (mm) at 30 DAH 133 11 1225
Mean L (mm) at 36 DAH 139 167
Mean L (mm) at 75 DAH 367 404 452
Mean Wt (g) at 75 DAH 074 081 12 0825 11
Condition factor at 1g 123E-05 118E-05 1Strain abbreviations AR=Arkansas R MD=Maryland FL=Florida 2DAH=Days after Hatch 3Weaning start marks the first introduction and ingestion of dry feed to replace live feeds 4Weaning end denotes the time when the transition to dry feeds is complete and live feeds are no longer utilized
RESULTS
Hatchery Trial Results A summary of performance for hatchery traits of production interest for BX and HSB is presented in Table 1
The fertilization rate for the BX eggs was lower than that which we typically found with HSB (22-32 vs 55) and considerably lower than our experience in 2000 when we conducted fertilization trials with BX (80)
Swimbladder inflation rate ranged from 50 in the first hatchery run to 90 in the second run We attribute the low rate in the first run to
48 International Journal of Recirculating Aquaculture Volume 5 June 2004
Performance of Sunshine Bass and Backcross Hybrid Striped Bass
surface-film and system management problems We showed in the second run that swimbladder inflation in BX was comparable to that typically attainable (gt90) for Morone fry
Time-to-weaning onto dry diets was shorter (10 days versus 18 days) and earlier (day 33 versus day 38) for BX than for HSB Survival of BX to 60 days after hatch (7) was lower than expected on the basis of previous experience with HSB (gt10) Mean weights for BX at 60 days after hatch in two hatchery runs (052 and 042g) was similar to those for HSB (042 and 05g) However HSB exhibited greater mean weight than BX at 75 days after hatch (l04 vs 077g)
Condition factor (K) of BX (123 + 009) was not significantly different from those of HSB (119 + 005) or striped bass (l13 + 003) at 1 gram mean weight
Frequencies of deformities for BX (lt2) were lower than those in earlier reports Bosworth et al (1997) reported deformities in 8 of BX and 4 ofHSB
Grow-out Trial Results Overall there was not a significant difference in weight between the hybrid types (F = 606 df = 13 P = 00907) however as evidenced in
100
80
60
40
20
--+- BX - Overall -0- HSB - Overall -ltgt- BX - Individual Tanks A middot middot middotbullmiddotmiddot middot HSB - Individual Tanks fi
fi ~o
12 Dec 2001 3 Jan 2002 24 Jan 2002 12 Feb 2002
Date Figure 1 Meanfish weight(plusmn 2 SE) at each time period for backcross hybrid striped bass (BX) and hybrid striped bass (HSB) Also shown is meanfish weight at each time periodor groups in individual tanks
International Journal of Recirculating Aquaculture Volume 5 June 2004 49
Performance of Sunshine Bass and Backcross Hybrid Striped Bass
Figure 1 there was a significant interaction on fish weight by hybrid type and time (F = 5157 df = 1587 P lt 00001) Using the slicing option available in SAS (SAS Institute 1999) we tested for differences in weight between the hybrid types for each time period and found that although weights of HSB and BX were not significantly different during the first two measurement periods (Time 1 F = 027 df = 1587 P = 06032 Time 2 F = 036 df = 1587 P = 05496) the hybrid types did differ in weight during the last measurement periods Specifically HSB were significantly heavier than BX on the 24th of January 2002 (F = 1061 df = 1 587 P = 00032) and the 12th of February 2002 (F = 3788 df = 1587 P lt 00001) Overall HSB had a specific growth rate of 268 per
Table 2 Mean weights of backcross hybrid striped bass (BX) and hybrid striped bass (HSB) over the course of a 3-month growth trial
Date BXTank5
Wt(g) SE
112101 1228
BXTank6 Wt(g) SE
1201
BX Tank 12 Wt(g) SE
1274
HSB Tank 13 HSB Tank14 HSB Tank 15 Wt(g) SE Wt(g) SE Wt(g) SE
1180 1016 1088
1211201 1744 102 1778 095 1658 096 1798 109 1752 118 1704 109
1 302 27 60 1 38 28 76 155 27 04 154 3306 157 3424 149 3414 211
1 2402 4196 252 4424 207 4882 299 6344 263 6192 326 6432 362
212102 6332 317 6763 334 6912 299 9474 473 9553 452 10500 388
Table 3 Comparison of survivalfeed conversion ratio (FCR) and condition factor at 60 grams for backcross hybrid striped bass (BX) and hybrid striped bass (HSB)
Cross Tank
Starting
Ending
Survival
BXS
160
136
85
BX 6 BX 12 HSB 13 HSB 14 HSB 15
160
138
86
161
137
85
178
177
99
179
173
97
180
179
99
Starting Biomass (g) 1964 1922 2051 2100 1819 1958
Ending Biomass (g) 8612 9334 9469 16770 16526 18795
Feed Fed(g) 12106 12135 11447 18041 17805 20463
FCR 182 164 154 123 121 122
Condition Factor 168E-05 166E-05 169E-05 194E-05 193E-05 208E-05
SE 353E-07 337E-07 424E-07 255E-07 327E-07 845E-07
50 International Journal of Recirculating Aquaculture Volume 5 June 2004
Performance of Sunshine Bass and Backcross Hybrid Striped Bass
day while BX had a specific growth rate of 205 per day Neither of the covariates included in the model were found to have a significant effect on weight differences (initial tank biomass F = 142 df = 1587 P = 02332 amount of feed F = 005 df = 1587 P = 08165)
Performance regarding key economic traits-survival feed conversion efficiency and condition factor-are summarized in Table 3 At the end of the grow-out trial survival of HSB was significantly greater than that of BX (F = 6216 df = 1 1014 P lt 00001) Feed conversion ratio was better for HSB (122) than for BX (166) Condition factors for BX were lower than those for HSB (l68 vs 198) meaning that BX appeared longer and less deep-bodied than HSB
DISCUSSION Our data showed that F1 HSB performed as well or better than BX for a range of hatchery- and grow-out-related traits
Hatchery traits Fertilization rates for backcross lots were approximately half that for HSB There was a wide variance for fertilization and hatch rates of eggs from HSB females Some of this variance may be due to differences in hatchery protocols (different hormone injections used strip vs tank spawning) at the commercial hatcheries where the data were collected (TIJ Smith personal communication) Poor hatch rates also may be attributable in part to hybrid breakdown that is to developmental incompatibilities among the genomes of the respective species when coadapted gene complexes are broken up at meiosis in the F1 (Hallerman 2003)
In the hatchery trial we hypothesize that the low swimbladder inflation rate for our J~ly fry resulted from offering first feed to the BX too early When rearing HSB and SB fry we typically wait until the yolk sac has been largely resorbed and the fry mostly have inflated their swimbladders before we introduce live feed This is because live feed can cause an oily film on the water surface that interferes with a frys successful ingestion of air bubbles necessary to inflate the swimbladder (Chapman et al 1988) The timing of swimbladder inflation varies with fry type and temperature with HSB typically inflating between 3 and 6 days after hatch and SB 6 to 9 days after hatch BX fry inflate their swimbladder at an intermediate time 5 to 8 days after hatch (DAH) Since for the July
International Journal of Recirculating Aquaculture Volume 5 June 2004 51
Performance of Sunshine Bass and Backcross Hybrid Striped Bass
spawn we introduced feed into their tanks at the time prescribed for HSB (at 5 DAH) BX fry may have had a reduced opportunity to inflate their swimbladders because of interference by a surface film with air contact In the October spawn we monitored swimbladder inflation more carefully and introduced live feed on day 7 after almost 90 of swimbladders were inflated The low swimbladder inflation rate in the July hatchery run of BX may have had a direct impact on survival Larvae without inflated swimbladders expend more energy swimming exhibit reduced growth rates are less tolerant of stress and often sink to the tank bottom and die (Van Heukelem et al 2000)
BX were weaned more quickly and earlier onto dry diets than HSB which may have helped contribute to their ability to match the size and weight of HSB at 60 DAH Earlier weaning has economic merit since dry diets are generally cheaper and easier to feed than brine shrimp
Grow-out traits After 60 days post-hatch the growth and other performance differences between BX and HSB became more evident HSB exhibited significantly better growth survival and feed conversion ratios
We hypothesized that backcross hybrid striped bass might grow as fast or faster than the standard commercially-available F 1 hybrid striped bass if high-performance HSB females were selected as broodstock Our data regarding performance in intensive tank systems did not support this hypothesis Rather our observations accord with the classical view that the high performance of some interspecific hybrids is largely due to heterosis and that because the heterosis shown by an F 2 or backcross hybrid is only half that shown in an F1 (Falconer and Mackay 1996 p 257) that advanced generation hybrids would not perform as well as F1
hybrids Indeed F 2 HSB previously showed low hatch rates low larval survival and high variability of growth rate (Smith and Jenkins 1984 Smith et al 1985) Our results suggest that the heterosis expressed in HSB for growth and performance was greater than the selective breeding advantage we employed by crossing high performance HSB females with male striped bass Apparently the additive genetic variance contributed by the HSB and striped bass selected for size-at-age could not make up for the loss of dominance variance
BX may have better potential market acceptance by virtue of having a lower condition factor appearing longer and less deep-bodied than HSB more
52 International Journal of Recirculating Aquaculture Volume 5 June 2004
Performance of Sunshine Bass and Backcross Hybrid Striped Bass
like striped bass that are more familiar in many markets Fins Technologys market experience has shown that the premium-priced live markets prefer longer leaner fish such as the backcross There is the possibility that because of later maturity backcross hybrid striped bass may grow to larger sizes than hybrid striped bass This is attractive because there is an unserviced demand for larger (1 kg+) fish that can provide portion-controlled 7-9 ounce fillets for the restaurant and retail markets
ACKNOWLEDGEMENTS This project was supported by US Department of Agriculture-Small Business Innovation Research Program Phase I Grant no 2001-00373 EMH is supported by the USDA-CSREES Hatch Program and the Commonwealth of Virginia Aquaculture Initiative
REFERENCES Bosworth BG Libey GS Notter DR Egg Larval and Fingerling
Traits of Crosses among Striped Bass White Bass and their Fl Hybrids Aquaculture 1997 154 201-217
Carlberg J Van Olst J US Production and Sales of Hybrid Striped Bass (1987-2002) 2003 httpaquanicorgsbgaHSBversion5ppt
Chapman DC Hubert WA Jackson UT Influence of Access to Air and of Salinity on Gas Bladder Inflation in Striped Bass Progressive Fish-Culturist 1988 50 23-27
Falconer DS Mackay TFC 1996 Introduction to Quantitative Genetics Fourth Edition Longman Group Ltd Harlow Essex UK
Halbrendt CK Wirth FF Vaughn GF Conjoint Analysis of the Mid-Atlantic Food-Fish Market for Farm-Raised HSB Southern Journal of Agricultural Economics 1991 23 155-163
Hallerman EM Coadaptation and Outbreeding Depression In Po_pulation Genetics Principles and Applications for Fisheries Scientists Hallerman E (Ed) 2004 American Fisheries Society Bethesda MD USA
Harrell RM Hybridization and Genetics Striped Bass and Other Morone Culture In Harrell RM (Ed) 1997 Pages 217-234 Elsevier Science Amsterdam
International Journal of Recirculating Aquaculture Volume 5 June 2004 53
Performance of Sunshine Bass and Backcross Hybrid Striped Bass
Jenkins WE Heyward LD Sr Smith TIJ Performance of Domesticated Striped Bass Marone saxatilis Palmetto Bass and Backcross Hybrid Striped Bass (Sunshine Bass Female x Striped Bass Male) Raised in a Tank Culture System Journal of the World Aquaculture Society 1998 29 505-509
Kerby JH Cryogenic Preservation of Sperm from Striped Bass Transactions of the American Fisheries Society 1983 112 86-91
Losordo TM Westerman P An Analysis of Biological Economic and Engineering Factors Affecting the Cost of Fish Production in Recirculating Aquaculture Systems Journal of the World Aquaculture Society 1994 25 193-203
SAS Institute 1999 The SAS System for Windows version 82 SAS Institute Cary NC USA
Smith TlJ Jenkins WE Controlled Spawning of Fl Hybrid Striped Bass (Marone saxatilis x M chrysops) and Rearing of F2 Progeny Journal of the World Mariculture Society 1984 15 147-161
Smith TlJ Jenkins WE Snevel JF Production Characteristics of Striped Bass (Marone saxatilis) and Fl - F2 hybrids (Marone saxatilis and M chrysops) Reared in Intensive Tank Systems Journal of the World Mariculture Society 1985 16 57-70
Tomasso JR Kempton CJ Gallman A Smith TlJ Comparative Production Characteristics of Sunshine Bass and Sunshine Bass x Striped Bass in Recirculating-Water Systems North American Journal of Aquaculture 1999 61 79-81
Van Heukelem WF Harrell RM Hughes SG Lindell SR Friedmann BR Optimal Conditions for Swimbladder Inflation in Striped Bass Larvae Reared in Intensive Systems Northeast Regional Aquaculture Center Publication No 00-006 (2000) 5 pages
54 International Journal of Recirculating Aquaculture Volume 5 June 2004
Book Review
Fjofish apd Shellfish Bacteriology Mapua) Techpjques apd Procedures KA Whitman with contributions by NG MacNair
Iowa State Press (Blackwell Publishing Professional) Ames IA USA (2004) 288 pages ISBN 0813819520 US $4999
Reviewed by Rocco C Cipriano United States Geological Survey National Fish Health Research Laboratory 11649 Leetown Road Kearneysville WV 25430 USA E-mail rocco_ciprianousgsgov
Despite the fact that several good texts have been published regarding the description and nature of bacterial pathogens in aquatic animals there remained a need for a comprehensive yet practical guide devoted to techniques and procedures used for bacterial identification Diagnosis and detection of fish and shellfish pathogens often requires reliance upon standard microbiological media tests and reagents for some bacteria but more specialized assays are required for many aquatic pathogens In the latter case the products necessary for such assays are not commercially available and must be produced in aquatic animal diagnostic facilities from their basic ingredients Often therefore the compositions of differential media and the conduct of certain tests for the primary isolation or detection of specific aquatic pathogens are only available by referencing the general body of published scientific literature Hence until now there has not been a single-source shelf-volume that combines standard microbiological procedures used for routine detection and identification of medically important bacteria with the specialized needs of the fisheries profession This manual however helps to fill that void
The manual stands as a reference suitable for professional aquatic biologists with backgrounds in microbiology veterinarians and students of aquatic animal health Its strength lies in its coverage of the subject matter regarding culture-based diagnosis and identification of bacteria associated with finfish bivalves and lobsters Sections on
International Journal of Recirculating Aquaculture 5 (2004) 55-56 All Rights Reserved copyCopyright 2004 by Virginia Tech and Virginia Sea Grant Blacksburg VA USA
International Journal of Recirculating Aquaculture Volume 5 June 2004 55
Book Review FiQish and ShelJfish Bacteriology Manualmiddot Techniques and Procedures
aseptic collection and shipment of samples qualitative and quantitative procedures for bacterial isolation staining techniques media and standard biological tests used for the cultivation and phentotypic characterization of pathogenic bacteria and antibiotic sensitivity testing provide sound background for the student or novice practitioner Particularly beneficial for anyone who is not experienced with aquatic microbial pathogens is the section listing principal organs media and appropriate incubation temperatures to be used as the most probable sources of isolation for the specific bacteria
More experienced professionals will find it helpful and convenient to have the descriptions and interpretations of differential media (eg Coomassie Brilliant Blue Agar for Aeromonas salmonicida Rimler-Shotts Agar for Aeromonas hydropila Cytophaga Agar Shieh and TYES for Flavobacterium spp and Edwardsiella ictaluri Agar and various other media for Renibacterium salmoninarum) listed in a single source The major identifying criteria that phenotypically characterize selected bacterial pathogens are also described in tabulated form Specialized tests such as the SIF test to detect covert infections nurse culture techniques for enhanced bacterial growth and assays for public health indicator organisms in bivalves are documented Sections covering serology immunoassay and non-cultured based molecular assays (eg polymerase chain reaction) are also presented but are not as completely summarized as those for bacterial isolation In summary the nature of this manual makes it appropriate for frequent use as a practical laboratory guide
56 International Journal of Recirculating Aquaculture Volume 5 June 2004
Subscription Information
International Journal of Recirculating Aquaculture
A publication ofVirginia Tech and the Virginia Sea Grant College Program
IJRA presents the latest developments in RAS-related research focusing on the areas of
Food Quality Pathology
Food Safety
Aquatic Medicine Breeding amp Genetics Waste Management
FishShellfish Growth amp Nutrition Recirculating Systems Mgmt Marketing amp Economics Water Conservation
Dont miss an issue of this informative peer-reviewed journal Subscribe now using your credit card by calling 540-231-2075 or by printing out a form at wwwcfastvteduijrahtml If you prefer you can also mail this form to the address below along with a check or money order
Name ----------------~ Address ----------------Line2 ------------------City ____________ State __ _ Country Postal Code ___________ _ Phone Fax -------- --------e-mail-----------------check _ 2 year ($25 US)
International Journal of Recirculating Aquaculture Food Science amp Technology Building (0418)
Virginia Polytechnic Institute and State University Blacksburg VA 24061
phone (540) 231-2075 fax (540) 231-9293 e-mail IJRAvtedu
International Journal of Recirculating Aquaculture Volume 5 June 2004 57
~ International Journal of ~ Recirculating Aquaculture A publication of Virginia Tech and the Virginia Sea Grant College Program
Instructions for Authors The International Journal of Recirculating Aquaculture (IJRA) encourages the submission of original high-quality papers on research in all aspects of recirculating aquaculture Papers will be peer-reviewed and evaluated for scientific merit relevance and for their usefulness in promoting the advancement of recirculating aquaculture Complete coherent projects are preferred Any related papers submitted together must be thoroughly cross-referenced All papers must be original meaning that the data and the information presented must be the work of the authors and can not have been published elsewhere Dual publication of a paper or data is possible only through the permission of the Editors of both journals THERE ARE NO PAGE CHARGES for IJRA submissions
INITIAL MANUSCRIPT SUBMISSION Manuscripts should be sent to Ms Angela Correa Managing Editor by mail using the address listed at the end of these instructions or by e-mail to (ijravtedu) Submit four (4) copies of each manuscript if regular mail is used All manuscripts must be in English Dot matrix type is not acceptable and all such submissions will be returned without review Each submission must include a cover letter stating that the paper contains original research and that the information has not been published elsewhere E-mailed submissions must be saved in doc format Be sure to include the names of colleagues who have already reviewed the work presented IJRA has two categories for submission 1 Articles which are complete in-depth scientific studies and 2 Notes which are short papers of limited scope Articles and notes will be critically reviewed by two or three experts as well as by the Managing Editor Submissions may be returned without peer review in cases where the Managing Editor determines that they are inappropriate for the journal of poor quality poorly written or fail to follow the journals style format
PREPARATION OF MANUSCRIPTS IJRA uses the latest editions of Websters New International Dictionary and Websters New Collegiate Dictionarv for standard spellings and word definitions All spelling will be in American English Foreign or science-related terminology that is unfamiliar and does not appear in these dictionaries will require an accompanying definition Acceptable scientific and common names of fishes are listed in A List of Common and Scientific Names of Fishes from the United States and Canada published by the American Fisheries Society Common names may be used throughout each paper but must be accompanied by a full scientific name when they first appear in a paper The author must use the full common name eg yellow perch not perch All foreign language words should be italicized in the manuscript
In the manuscript number each page sequentially and include the senior authors name next to the page number (eg Page 4 Jahncke) on each page Single-space all typed material including references Type size in the body of the text should be no larger than 12pts and no smaller than 10 pts Subsection headings should also be italicized in the manuscript Spell out one-digit numbers except when they are used with units of measure - eg six ponds 7 days
International Journal of Recirculating Aquaculture Volume 5 June 2004 59
Spell out any number that begins a sentence When two numbers occur sequentially in the text one of the numbers must be spelled out- eg In 1987 fifty fish were stocked Use commas in numbers of 1000 or more Use the 24-hour clock to describe time- eg 1300 not 100 pm
Keep footnotes to a minimum and number them sequentially throughout the paper All units of measurement must be reported via the metric system except in special circumstances (eg horsepower) Standard scientific abbreviations and symbols may be used without definition If the use of a symbol could cause confusion define the symbol the first time it is used On the final draft of a paper that has been accepted for publication Greek letters or other extraneous symbols that do not appear on a keyboard the name of the symbol should be noted where the symbol is used to help eliminate prepress errors Parts per million or milligrams per liter can be
-1 reported as either ppm or mgI but not as mgI
Commonly used aquaculture jargon can be used without defining the term - eg fry fingerling hapa Less commonly used jargon may also be used but terms should be defined the first time they are used Jargon from fields outside of aquaculture should also be defined the first time they are used Always place a zero to the left of a decimal point if the number is less than one this includes probability values - eg P = 005 not P = 05
COMPONENTS OF THE MANUSCRIPTS Articles and notes should include a title names of authors and their addresses abstract introduction materials and methods results discussion (or a combined results and discussion) conclusion (rarely) acknowledgements (if any) references figures and tables in that order Each section should start on a new page
Title - The title should accurately reflect the contents of the paper Brief concise titles are encouraged The title page must include the name(s) of the author(s) and all addresses
Abstract - The abstract should be a concise highlight of the results and conclusions Methodology should not be abstracted unless it is necessary to explain the results or unless the paper describes a new technique Abstracts should be less than 300 words
Introduction - The introduction should explain why the paper was written and why it should be read The introduction should condense the relevant information in the field that led the author to do the research The introduction is not a complete literature review and only the most relevant references should be cited The introduction should also contain a statement that describes the purpose or objective of the paper
Materials and Methods - The underlying goal of this section is to describe what was done so that others can repeat the experiment If previously published papers described a technique that was used they can be cited to prevent unnecessary repetition If the technique or process was modified the modification must be described so that others can repeat the process Experimental designs can be explained by use of figures if they will help clarify what was done If the experiment was a complicated one with many subparts subsections may be used to describe each subpart
Results - This section describes the data Proper use of tables and figures can simplify and help explain the results Statistical analysis of data is necessary unless differences are so obvious that statistical analysis is superfluous Although probability values of 005 and 001 are traditionally used each author is free to choose his or her own level of significance
60 International Journal of Recirculating Aquaculture Volume 5 June 2004
Discussion - This section should interpret the results and compare the results from this experiment to those found in similar research The section can also be used to speculate about the results to provide reasons for the trends and to suggest new ideas that can advance our understanding about aquaculture This section should not be a literature review section that merely compares results among several papers
Results and Discussion - Results and discussion sections can be combined In most cases this leads to a better paper because the integration of these sections leads to a more meaningful interpretation of data
Conclusion - This section should be used only when the results of an experiment lead to an unequivocal interpretation
Acknowledgements - This section should be used to thank organizations that supported the research monetarily and individuals who assisted in the research or preparation of the paper This section includes manuscript number designations for those institutions that assign such numbers
References - Select references with great care Unless the paper includes a literature review there is no need to reference every paper written about a subject Use only the most important ones
Figures and Tables - All figures andtables go after the references Figures always go before tables
Section headings (eg Materials and Methods) should be capitalized and in bold type Secondary headings should be balded and go flush left Tertiary headings are incorporated into the first paragraph of that subsection Tertiary headings are italicized and separated from the text by a double dash
In the text references are cited in one of two ways 1 Swingle (1959) evaluated two species of tilapia or 2 pond culture in Alabama began in the 1950s (Swingle 1959) When there are three or more authors list only the first in a citation and follow that with et al eg Smitherman et al (1983) reviewed catfish breeding work at Auburn University If the name of an institutional author is long it can be abbreviated in a citation eg Food and Agriculture Organization of the United Nations may be abbreviated as FAO When several citations are used in a single entry they are listed chronologically If you are citing two papers that were written by the same author(s) the name only has to appear once per citation followed by the years that designate the different papers Separate the years with a comma If you are citing two authors you must separate the citations with a semicolon (Smith 1975 1976 Jones 1976)
In the reference section the reference list is strictly alphabetical by last name of the senior author and then by initials if two authors have identical last names If an author has written more than one paper the following format should be followed All single authored papers go first followed by co-authored papers and then the papers that were written by three or more authors If an author has written more than one single-authored paper the papers are listed chronologically If an author has written more than one co-authored paper they are listed alphabetically by the second authors last name If a tandem has authored two or more papers the order is chronological Papers written by the same group of three or more authors should be listed chronologically
International Journal of Recirculating Aquaculture Volume 5 June 2004 61
The following format will be used when referencing various works
PAPERS Single-author papers
McGinty AS Effects of Size at Stocking on Competition and Growth of All-Male Tilapia Hybrids Journal of the World Aquaculture Society 1985 16 52-56
Multiple-author papers Tave D Smitherman RO Predicted Response to Selection for Early Growth in Tilapia nilotica Transactions of the American Fisheries Society 1980 109 439-445
If an author has published two or more papers in the same year follow the years with a letter to differentiate them eg Smith 1988a 1988b Use issue numbers only when each issue starts out with page 1 If pagination is consecutive throughout the volume omit the issue number Spell out journal names in their entirely without abbreviations
Papers in proceedings or in edited volumes Nicholson LC Woods LC Ill Woiwode JG Intensive Culture Techniques for the Striped Bass and its Hybrids In Culture and Propagation of Striped Bass and Its Hybrids Harrell RM Kerby JH Minton RV Eds 1990 American Fisheries Society Bethesda MD USA
Books and reportspublications from governmental or non-governmental bodies
Lovell T 1989 Nutrition and Feeding of Fish Van Nostrand Reinhold New York NY USA
Food and Agriculture Organization of the United Nations (FAO) Fisheries Department 1997 Review of the State of World Aquaculture No 886 FIRlC886 FAO Rome Italy
Theses and Dissertations
Easter CC 1992 Water Chemistry Characterization and Performance of a Recirculating Aquaculture System Producing Hybrid Striped Bass Masters thesis Virginia Polytechnic Institute and State University Blacksburg VA USA
Websites
Federation of European Aquaculture Producers (FEAP) European Eel Production (httpwwwfeaporgeelshtml) 2002
Page numbers for proceedings books theses and dissertations are unnecessary Government publications should be treated as if they were books but document numbers must be included THE ACCURACY OF REFERENCES IS THE SOLE RESPONSIBILITY OF THE AUTHORS MAKE SURE THAT CITATIONS AND REFERENCES MATCH
Tables - When creating a table decide what the purpose of the table is and what points are important then organize the table so that the main features can be easily understood The table heading should provide sufficient information for the table to be understood as an entity Keep footnotes to a minimum Each table goes on a separate page Tables must be camera ready TABLES WILL BE PRINTED AS IS AND WILL NOT BE TYPESET Figures - List all figure captions on separate pages Original artwork doesnt have to be submitted when a paper is first submitted for review but original artwork must accompany the final revised manuscript Good quality photocopies are acceptable when a manuscript
62 International Journal of Recirculating Aquaculture Volume 5 June 2004
is submitted for review Graphs and original artwork must be printed with a laser printer or done in pen and ink Dot-matrix figures are not acceptable Original artwork or high-contrast photographs are acceptable Label all figures on the back with a soft pencil name of senior author paper title and figure number
Photographs - Should be on glossy paper with good contrast Do not glue pictures to cardboard Color photographs can be printed but the additional cost of printing them will be charged to the author Label all photos on the back with a soft pencil name of senior author paper title and figure number
FINAL REVISED MANUSCRIPTS If using the mail submit two copies of the final revised manuscript including original artwork Submit either the original pen-and-ink drawings or laser-printed versions of the drawings In addition submit the manuscript on a disk (CD preferable) or by e-mail On the disk write the brand name of the computer or word processor the word processing program that was used (should be Microsoft Word) the title of your article and the file name NOTE Disk and hard copy must agree In case of discrepancies it is the policy of IJRA to follow hard copy An electronic version of the completed manuscript is needed in order to publish AUTHORS MAY NOT RECEIVE PAGE PROOFS Proofreading will be done by the Production Office of IJRA using the revised final version of the manuscript Therefore authors must be especially careful that no errors exist in the final revised version because in most cases no changes are possible after it is submitted
REPRINTS The senior author will receive two copies of the journal and a pdf file of the article for distribution and reprinting purposes The junior author(s) will also receive two copies of the journal issue These are sent several weeks after the journal is published and in circulation Requests for the pdf format of the article can only be made by the corresponding author
COPYRIGHT amp PERMISSIONS For permission to reprint articles that have appeared in IJRA please contact IJRA Copyright amp Permissions Food Science amp Technology Building (0418) Virginia Tech Blacksburg VA 24061 USA
COPYRIGHT TRANSFER If your manuscript is accepted for publication copyright ownership must be officially transferred to IJRA The Editors acceptance letter will include a form fully explaining this The form must be signed by all authors and the original returned to the Editor at this time Failure to return the copyright form in a timely fashion will result in delay in publication
Send your submissions to International Journal of Recirculating Aquaculture
AI Correa Managing Editor 27-B Food Science and Technology Building (0418) Virginia Polytechnic Institute and State University Blacksburg VA 24061 USA
If you have any questions please feel free to contact us Phone (540) 231-2075 Fax (540) 231-9293 e-mail ijravtedu
International Journal of Recirculating Aquaculture Volume 5 June 2004 63

Hematology and Blood Chemistry of Yellow Perch (Perea flavescens)
Table 1 Water quality parameters for yellow perch (Percaftavescens) reared in a recirculation culture system Values are means plusmn standard deviations for the parameters on the days that fish were bled for hematological and blood biochemical determinations and are representative of the daily water quality values in the system
Parameter For Hematology Fish For Chemistry Fish
Temperature (degC) 209 plusmn 001 207plusmn 11
pH 78plusmn01 79 plusmn 02
NH3 un-ionized (mgL) 0012 plusmn 0012 0011 plusmn 0005
N02-N (mgL) 0031 plusmn 0015 0043 plusmn 0043
N03-N (mgL) 60 plusmn 26 28 plusmn09
Alkalinity (mgL) 252 plusmn44 313 plusmn 48
Hardness (mgL) 399 plusmn 10 433 plusmn27
Dissolved Oxygen (mgL) 74plusmn05 74 plusmn03
Fish were netted rapidly and anesthetized in aerated tank water with buffered tricaine methanesulfonate (MS-222 Sigma Chemical Co St Louis MO USA) until they began to lose equilibrium approximately 20 seconds Individual fish were bled for either hematological determinations (23g needle 1-mL syringe) or for biochemical determinations (23g needle 3-mL syringe) in both cases blood was collected from the caudal vessels After blood samples were collected the fish were weighed measured and checked for external and internal pathologic lesions The sex of each fish was determined by internal observation of the gonads
Blood for hematological determinations was transferred to an ethylenediamine-tetraacetic acid (EDTA) treated pediatric blood tube and held on ice until analysis (lt 1 hour) Blood for biochemical determinations was collected into cold 3-mL heparinized blood tubes and centrifuged at 14000 x g immediately Plasma was collected and frozen at -10degC until analyzed The following analytes were determined in the plasma with an Olympus AU-400 (Olympus America Inc Melleville NY USA) automated clinical chemistry analyzer total protein albumin creatinine total bilirubin alkaline phosphatase (ALP) aspartate aminotransferase (AST) cholesterol glucose sodium potassium chloride phosphorus calcium and magnesium Globulin was calculated from the total protein value minus the albumin value
32 International Journal of Recirculating Aquaculture Volume 5 June 2004
Hematology and Blood Chemistry of Yellow Perch (Percaflavescens)
Hematological analytes were determined from the EDTA anticoagulated blood As we have observed for other fish species EDTA was superior to heparin for yellow perch blood both in preventing clot formation and preserving cellular morphology (Hrubec et al 1996 2000) Blood from the EDTA tube was drawn into microhematocrit tubes and the packed cell volume (PCV) determined after centrifugation at 10000 x g for 5 min Plasma protein was determined with a clinical refractometer using plasma from the microhematocrit tube The total erythrocyte and leukocyte-plus-thrombocyte counts were determined manually with a Neubauer hemacytometer using Natt-Herricks solution as a diluent stain (Natt and Herrick 1952) Blood smears made within 45 minutes of sample collection were stained with Wright-Geimsa stain and were used to determine the differential counts as follows Leukocytes and thrombocytes were identified and counted on the blood smears until 200 leukocytes and a variable number of thrombocytes were enumerated The percentages of each leukocyte type and of thrombocytes were multiplied by the total leukocyte-plus-thrombocyte number to give the final cell counts Thrombocyte numbers were subtracted from the leukocyte-plus-thrombocyte count to give the total leukocyte count This method of manually determining total leukocyte and differential counts has been recommended for use with avian (Zinkl 1986) and fish blood (Hrubec et al 1996 1997ab 2000 2001) as the nucleated red cells prevent accurate enumeration using automated analysis (Huffman and Arkoosh 1997) Slight thrombocyte clumping was observed on the hemacytometer for some individuals only fish with minimal thrombocyte clumping(lt 4 cells clumped) were used for the differential counts to ensure accuracy of the counts
Reference intervals were determined following the guidelines proposed by the National Committee for Clinical Laboratory Standards (NCCLS 1992) As suggested in these guidelines the data were checked for outliers using the 13 differencerange ratio and no outliers were identified The values were then ranked and the high and low 25 were discarded The range of the remaining values provided the reference interval
RESULTS AND DISCUSSION The physiologic and health status of an individual is reflected in the blood producing variations in hematological and blood biochemical values Clinical analysis of blood is a fundamental tool used in human
International Journal of Recirculating Aquaculture Volume 5 June 2004 3 3
Hematology and Blood Chemistry of Yellow Perch (Percaflavescens)
and veterinary medicine to diagnose and predict the outcome of disease and to monitor the effect of therapeutic nutritional and environmental management Blood analysis is not used extensively as a diagnostic tool in fish medicine partly due to the lack of reference intervals for various fish species and also because changes associated with specific diseases and metabolic disorders are not well characterized With sufficient background data clinical analysis of individual blood samples could detect infectious diseases metabolic disorders and sub-lethal disease states affecting production performance
Hematological and plasma biochemistry data from diseased individuals can be evaluated by direct comparison to a reference interval which is the appropriate range of variation in a blood parameter from a defined population of individuals under specific conditions The reference interval needs to be determined on a sufficient number of normal healthy individuals under similar production conditions using standardized analytical techniques (NCCLS 1992) When the deviation in a blood parameter is large enough to fall outside the reference interval it indicates the value may be aberrant and is most likely not due to individual variation for a given fish
Few previous studies have determined blood parameters for yellow perch (Toneys and Coble 1980 Nelson et al 1988 Nelson and Mitchell 1992 van den Heuvel et al 2000) These studies are of limited relevance as they were primarily toxicological studies and only a few blood parameters were determined and also because blood samples were collected and handled by differing methods prior to determination of the blood value Some of the capture (hook and line and gill netting) and blood collection methods (severing the caudal peduncle) used in these studies are also unsuitable for diagnostic blood samples as they result in significant alteration in the blood which will mask diseased states The study with the closest sampling procedure to that used in our experiment only presented selected blood chemistry values for yellow perch after 16 hours of moderate or exhaustive exercise (Nelson and Mitchell 1992) Therefore although the previous studies on yellow perch hematology are helpful in determining the effects of environmental factors and stress they have limited diagnostic utility and even prevent meaningful comparison with the data presented in this paper
The average mean weight of the yellow perch used for the hematological determinations was 125 +- 14g with a total length of 223 +- 08 cm For
34 International Journal of Recirculating Aquaculture Volume 5 June 2004
Hematology and Blood Chemistry of Yellow Perch (Percajlavescens)
the biochemical determinations the fish had a weight of 121 +- 15g and length of 226 +- 08 cm The results of the hematological determinations from 52 fish are listed in Table 2 Values for plasma chemistry reference intervals determined on 42 samples are listed in Table 3 Overall both the hematological and plasma chemistry values were similar to those reported previously for hybrid striped bass and tilapia reared in recirculation systems (Hrubec et al 1996 2000 Hrubec and Smith 2000) The striped bass and tilapia from production systems exhibited wider ranges in value for the different leukocyte types increased numbers of reticulocytes increased plasma and total protein values increased creatinine values and a decreased plasma chloride concentration as compared to fish in lower density recirculation tanks We did not compare blood values from the production yellow perch in this study to yellow perch maintained in low-density tank settings so were unable to determine if these same trends are apparent in yellow perch as well However based on our previous experience with fish hematological and plasma biochemical values there is an indication that these trends are occurring in yellow perch as well
Table 2 Hematological reference intervals for adult yellow perch (Perea flavescens) reared in a recirculation system
Analyte N Reference Interval Mean Stds1
PCV2 () 57 29-47 388 45
Plasma Protein (gdl) 57 60-82 67 06
Erythrocytes (x 106ml) 53 2160-3345 2737 0356
Leukocytes (ml) 53 52590-186490 113914 39086
Lymphocytes (ml)
Small 53 36800-153420 85630 31728
Large 53 3530-23 130 11602 5359
Neutrophils (ml) 53 1860-35950 12430 8837
Monocytes (ml) 53 670-12640 4252 2874
Thrombocytes (ml) 53 38270-118510 72972 21299 1Standard deviation 2Packed cell volume
International Journal of Recirculating Aquaculture Volume 5 June 2004 35
Hematology and Blood Chemistry of Yellow Perch (Perea flavescens)
Table 3 Plasma biochemical values for adult yellow perch (Percaftavescens) reared in a recirculation system
Analyte N Reference Interval Mean Stds1
Total Protein (gdl) 42 37-50 45 04
Albumin (gdl) 42 06-09 07 01
Globulin (gdl) 42 31-42 37 03
Creatinine (mgdi) 42 04-10 06 01
Total bilirubin (mgdi) 42 03-04 03 01
ALP2 (UI) 42 50-114 822 249
AST3 (UI) 42 2-29 85 64
Glucose (mgdi) 42 62-181 1000 350
Cholesterol (mgdi) 42 182-323 2440 330
Sodium (mEqI) 42 138-153 1470 40
Potassium (mEqI) 42 20-38 32 05
Chloride (mEqI) 42 119-133 1260 40
Calcium (mEqI) 42 86-120 103 13
Phosphorus (mEqI) 42 50-96 74 11
Magnesium (mEqI) 42 17-34 27 04 1 Standard deviation 2 Alkaline phosphatase 3 Aspartate aminotransferase (SGOT)
The blood cells present in the yellow perch were typical of teleost fish and included erythrocytes thrombocytes and leukocytes (Fig 1) Erythrocytes were oval to round with characteristic red cytoplasm and an elongate and centrally-located nucleus Immature erythrocytes or reticulocytes demonstrated a blue-purple tinge to the normal eosinophilic cytoplasm (Fig IA B C) The yellow perch had increased numbers of reticulocytes (included in the erythrocyte count) with approximately 7 to 10 per field at lOOx oil immersion compared to what we observe for most fish species The cause for the apparent reticulocytosis is not known but has been observed in other fish species exposed to elevated nitrite and nitrate (Grabda et al 1974 Hrubec et al 1996 2000 Hrubec and Smith 2000)
36 International Journal of Recirculating Aquaculture Volume 5 June 2004
Hematology and Blood Chemistry of Yellow Perch (Perea flavescens)
T bull middotmiddot ~~ - middot
N -
Figure I Characteristic blood cells from yellow perch reared in recirculation systems Blood smears were made with EDTA anticoagulated blood stained with Wrights Geimsa stain Cells are abbreviated as follows U - Large lymphocyte SL - small lymphocyte T - thrombocyte R - reticulocytes (immature erythrocyte) PC - plasma cell (activated lymphocyte) M- monocyte N-neutrophil The blue bar in frame A is Omm
International Journal of Recirculating Aquaculture Volume 5 June 2004 37
Hematology and Blood Chemistry of Yellow Perch (Percajlavescens)
The thrombocytes were slightly smaller than the erythrocytes (Fig IA) They had clear cytoplasm and were variable in shape being elongated pyriform oval or round Nuclear shape tended to follow cytoplasmic shape although oval and round thrombocyte nuclei occasionally were lobulated (Fig IB) as described for striped bass and tilapia (Hrubec et al 1996 2000)
Leukocytes made up the remainder of the cell types seen in the blood and included small and large lymphocytes neutrophils and monocytes No eosinophils or heterophils were observed Small lymphocytes were the smallest cell present with a rim of blue cytoplasm surrounding the round nucleus (Fig IA E F) Large lymphocytes had an abundant and darker blue cytoplasm and the nucleus was larger than observed in the small lymphocyte (Fig IA E) Plasma cells were occasionally observed with a classic open nucleus abundant dark blue cytoplasm and a clear cytoplasmic region adjacent to the nucleus presumably representing the Golgi as in mammalian plasma cells (Fig IC) Plasma cells were included in the large lymphocytes category for the differential counts
Neutrophils were the largest cell present in the blood (Fig ID E F) The cytoplasm of the neutrophil was a translucent grey containing no granules and infrequent vacuoles Cytoplasmic shape was round to angular as the cellular borders often appeared slightly adherent to adjacent erythrocytes distorting cellular shape Nuclear shape of the neutrophil varied from round to horseshoe shaped and frequently segmented into two prominent lobes connected by a thin nuclear bridge (Fig IF) Monocytes had abundant dark blue cytoplasm that was frequently vacuolated (Fig ID) The round to kidney-bean shaped monocyte nucleus was large with prominent chromatin clumping
Analysis of blood parameters can provide a wealth of information useful in analyzing the effects of disease and sub-optimal environmental conditions Providing reference intervals for healthy adult yellow perch reared in recirculation systems furnishes veterinarians and fish health professionals the foundation to develop diagnostic hematology for this species The number of studies that determine actual reference intervals for fish species is limited The majority of blood values determined for fishes are reported in the literature as a mean value with a standard deviation Historically reference intervals were determined as two standard deviations from the mean however this method is only valid when blood values follow a normal distribution It is incorrect to assume
38 International Journal of Recirculating Aquaculture Volume 5 June 2004
Hematology and Blood Chemistry of Yellow Perch (Percaflavescens)
that biological parameters are distributed normally therefore non-parametric methods should be used to accurately determine reference intervals (Reed et al 1971) Techniques to properly determine reference intervals have been established by the NCCLS (1992) and suggestions for their use and interpretation have been discussed (Lumsden 1998) As with mammalian species reference intervals need to be determined for different populations of fish within a single species as culture conditions and environmental variables affect blood values to the extent that they are outside the reference interval (Ram-Bhaskar and Srinivasa-Rao 1989 Hrubec et al 1996 1997ab 2000 2001) Although the reference range for some of the blood parameters appears large it is still possible to detect variation in hematologic values associated with pathological conditions (Hrubec et al 1997b and unpublished data)
Developing reference intervals is a necessary first step in determining which specific hematological changes can be associated with disease conditions As the field of fish hematology develops its usefulness to the aquaculture industry will increase Information derived by standardized non-lethal diagnostic assays will be needed to enhance the culture of yellow perch and other fish species Analysis of diagnostic blood samples can provide a means for early detection of infectious disease and assist in the identification of sub-lethal conditions affecting production performance This should allow for more specific timely and effective disease treatments in the future
ACKNOWLEDGEMENTS The authors wish to thank Mark Kidd of the Virginia Tech Aquaculture Center for his assistance with fish care and sampling
REFERENCES Grabda E Einszporn-Orecka T Felinska C Zbanyszek R
Experimental Methemoglobinemia in Rainbow Trout Acta Ichthyologica et Piscatoria 1974 4 43-71
Hrubec TC Smith SA Robertson JL Feldman B Veit HP Libey G Tinker MK Comparison of Hematologic Reference Intervals between Culture System and Type of Hybrid Striped Bass American Journal of Veterinary Research 1996 57 618-623
International Journal of Recirculating Aquaculture Volume 5 June 2004 3 9
Hematology and Blood Chemistry of Yellow Perch (Percajiavescens)
Hrubec TC Robertson JL Smith SA Effects of Temperature on Hematologic and Serum Biochemical Profiles of Hybrid Striped Bass (Morone chrysops x Morone saxatilis) American Journal of Veterinary Research 1997a 58 126-130
Hrubec TC Robertson JL Smith SA Effects of Ammonia and Nitrate Concentration on Hematologic and Serum Biochemical Profiles of Hybrid Striped Bass (Morone chrysops x Morone saxatilis) American Journal of Veterinary Research 1997b 58 131-135
Hrubec TC Smith SA Hematology and Plasma Chemistry Values for Production Tilapia ( Oreochromis hybrid) Raised in a Recirculation System International Journal of Recirculating Aquaculture 2000 J 5-14
Hrubec TC Cardinale JL Smith SA Hematology and Plasma Chemistry Reference Intervals for Cultured Tilapia ( Oreochromis hybrid) Veterinary Clinical Pathology 2000 29 7-12
Hrubec TC Smith SA Robertson JL Age Related Differences in Hematologic and Plasma Chemistry Analytes of Hybrid Striped Bass Morone chrysops x Morone saxatilis Veterinary Clinical Pathology 2001 30 8-15
Huffman PA Arkoosh MR Characteristics of Peripheral Blood Cells from Rainbow Trout Evaluated by Particle Counter Image Analysis and Hemocytometric Techniques Journal of Aquatic Animal Health 1997 9 239-248
Kelly AM Yellow Perch Culture in the United States Manna or Mania World Aquaculture 2000 31 4-17
Lumsden JH Normal or reference values Questions and Comments Veterinary Clinical Pathology 1998 27 102-106
Mallison JA 2000 A White Paper on the Status and Needs of Yellow Perch Aquaculture in the North Central Region North Central Regional Aquaculture Center Michigan State University E Lansing MI USA
Natt MP Herrick CA A New Blood Diluent for Counting Erythrocytes and Leukocytes of the Chicken Poultry Science 1952 31 735-738
40 International Journal of Recirculating Aquaculture Volume 5 June 2004
Hematology and Blood Chemistry of Yellow Perch (Percaflavescens)
NCCLS National Committee for Clinical Laboratory Standards 1992 How to Define Determine and Utilize Reference Intervals in the Clinical Laboratory Proposed Guidelines NCCLS Document C28-P Villanova PA USA
Nelson JA Mitchell GS Blood Chemistry Response to Acid in Yellow Perch (Perea flavescens) Comparison of Populations from Naturally Acidic and Neutral Environments Physiological Zoology 1992 65 493-514
Nelson JA Magnuson J J Chulkasem W Blood Oxygen Capacity Differences in Yellow Perch (Percaflavescens) from Northern Wisconsin Lakes Differing in pH Canadian Journal of Fisheries and Aquatic Sciences 1988 45 1699-1704
Ram-Bhaskar B Srinivasa-Rao K Influence of Environmental Variables on Hematology and Compendium of Normal Hematological Ranges of Milkfish Chanos chanos (Forskal) in Brackish Culture Aquaculture 1989 83 123-136
Reed AH Henry RJ Mason WB Influence of Statistical Method Used on the Resulting Estimate of Normal Range Clinical Chemistry 1971 17 275-284
Schmitz M 1999 Comparative Growth of All-Female Versus Mixed Sex Yellow Perch (Percaflavescens) in Recirculating Aquaculture Systems MS Thesis Virginia Tech Blacksburg VA USA
Toneys ML Coble DW Mortality Hematocrit Osmolality Electrolyte Regulation and Fat Depletion of Young-of-the-Year Freshwater Fishes under Simulated Winter Conditions Canadian Journal of Fisheries and Aquatic Science 1980 37 225-232
van den Heuvel MR Power M Richards J MacKinnon M Dixon DG Disease and Gill Lesions in Yellow Perch (Percaflavescens) Exposed to Oil Sands Mining-Associated Waters Ecotoxicology and Environmental Safety 2000 46 334-341
Wedemeyer GA Nelson NC Statistical Methods for Estimating Normal Blood Chemistry Ranges and Variance in Rainbow Trout (Salmo gairdneri) Shasta Strain Journal of the Fisheries Research Board of Canada 1975 32 551-554
International Journal of Recirculating Aquaculture Volume 5 June 2004 41
Hematology and Blood Chemistry of Yellow Perch (Percajlavescens)
Zinkl JG Avian Hematology In Schalms Veterinary Hematology (4th edition) Jain NC (Ed) 1986 Pages 256-260 Lippincott Williams amp Wilkins Philadelphia PA USA
42 International Journal of Recirculating Aquaculture Volume 5 June 2004
Hatchery and Grow-out Performance of Sunshine Bass and Backcross Hybrid Striped Bass in Recirculating Aquaculture Systems
SR Lindell1bull2 B Delbos1 R Perham1 J Goldman1 EM Hallerman3 TO Brenden3bull4
1 Fins Technology 15 Industrial Road Turners Falls MA 01376 USA
2Current address Marine Biological Laboratory Marine Resources Center 7 MBL Street Woods Hole MA 02543 USA
3Department of Fisheries and Wildlife Sciences (0321) Virginia Polytechnic Institute and State University Blacksburg VA 24061 USA
4Current address Institute of Fisheries Research University of Michigan 1109 N University Avenue Ann Arbor MI 41809 USA
Corresponding authors e-mail ehallermvtedu
Keywords striped bass performance aquaculture growth
International Journal of Recirculating Aquaculture 5 (2004) 43-54 All Rights Reserved copyCopyright 2004 by Virginia Tech and Virginia Sea Grant Blacksburg VA USA
International Journal of Recirculating Aquaculture Volume 5 June 2004 43
Performance of Sunshine Bass and Backcross Hybrid Striped Bass
ABSTRACT Previous research has suggested that backcross hybrid striped bass (BX sunshine bass female x striped bass male) perform as well as F 1 hybrid striped bass (sunshine bass white bass female x striped bass male) for many economically important traits We conducted trials to compare rearing and growth traits of selected backcross hybrid striped bass with hybrid striped bass (HSB) We spawned and reared larval BX fry in two hatchery cycles measured fry growth and performance and compared them to past performance of HSB fry We conducted a grow-out trial of commercially-available hybrid striped bass versus backcross hybrid striped bass in replicated tanks to phase II fingerling size (approximately lOOg) Compared to HSB in the hatchery phase backcross hybrid striped bass exhibited lower fertilization rate comparable swimbladder inflation rate shorter time-to-weaning lower survival comparable growth and comparable condition factor After 60 days HSB exhibited significantly better growth survival and feed conversion efficiency than BX However BX may have better potential market acceptance by virtue of having a lower condition factor appearing longer and less deep-bodied than HSB
INTRODUCTION Striped bass (Morone saxatilis) and its hybrids constitute a major sector of aquaculture in the United States with production of 105 million pounds in 2002 (Carlberg and Van Olst 2003) Commercially significant quantities of Morone stocks also are produced in Taiwan China and Israel Approximately 43 of Morone production occurs in tanks (Carlberg and Van Olst 2003) much of that in recirculating aquaculture systems (RAS) Private and government marketing experts estimate that US production could increase to 50 million pounds and $100 million in annual farm-gate revenue if market prices could be decreased only moderately (Halbrendt et al 1991) Production costs for HSB could be reduced by 12 if selective breeding can yield 20 faster growth rates (Losordo and Westerman 1994)
The majority of Marone production is not of striped bass but of its hybrids with white bass (M chrysops) because of their hardiness rapid growth rate and limited availability of female striped bass broodstock (reviewed by Harrell 1997) Further female WB are considered easier and more predictable to strip-spawn Hence most commercial production
44 International Journal of Recirculating Aquaculture Volume 5 June 2004
Performance of Sunshine Bass and Backcross Hybrid Striped Bass
is of sunshine bass the progeny of the white bass female x striped bass male interspecific cross Research has also been undertaken to evaluate the performance of second generation hybrids and backcrosses Several studies have suggested that the progeny of F 1 hybrid striped bass females backcrossed to striped bass males have merit for commercial production Jenkins et al (1998) compared the performance of backcross hybrids to F1 hybrid striped bass and striped bass to market size in a recirculating system At harvest no differences in growth rate or feed conversion were detected specific growth of BX was intermediate to those of the other stocks with survival lower Tomasso et al (1999) compared performance of F 1 and backcross hybrids between 20 and 90 grams for 56 days in tanks (Tomasso et al 1999) and observed similar survival growth and feed conversion rates among the hybrid types Detailed comparison of the hatchery performance of sunshine and BX hybrids is lacking We hypothesized that use of selected hybrid striped bass and striped bass for the backcross might yield a high-performance BX hybrid Should high performance be realized progressive fish farmers might utilize this approach by selecting the best F1 hybrid females from their own production stocks making the backcross by strip-spawning them and fertilizing the eggs with purchased milt from selectively bred striped bass males (Kerby 1983) thereby obtaining a high-performance production stock that because of selection on the maternal stock is suited to their particular farm conditions
In this study we evaluated the production potential of backcross (BX) hybrid striped bass (female sunshine bass x male striped bass) We compared the hatchery and grow-out performance of BX spawned from select broodstock and sunshine bass (HSB) of common genetic background Specifically we evaluated spawning success hatch rate growth survival and feed conversion efficiency through the first six months of life In order to benchmark our results we ran a trial in replicated tanks with HSB supplied by the most widely-used commercial source of fingerlings (Keo Fish Farms Keo AR USA) and compared their performance with our BX All fish were cultured within intensive controlled-environment recirculating aquaculture systems
International Journal of Recirculating Aquaculture Volume 5 June 2004 45
Performance of Sunshine Bass and Backcross Hybrid Striped Bass
MATERIALS AND METHODS In July 2001 we crossed 4 hybrid striped bass females to each of 4 striped bass males to produce 16 families of backcross hybrid striped bass Poor fertilization rates resulted in a low yield of fry from this spawn However there were enough fry to pool and conduct a pilot commercial-scale hatchery run Randomly-chosen samples from the resulting 4000 fingerlings were used for the grow-out trial
In October 2001 we spawned 3 female HSB with 2 male SB and eventually produced 7000 fingerlings While this was not enough to grow in commercial-scale systems we collected hatchery performance data to corroborate our JulyAugust experience with BX
Fertilized eggs were incubated in McDonald jars Upon hatch the larvae swam out of the hatching jar and into a 1900-L larval rearing tank Replicate larval rearing tanks were stocked with approximately 25 larvae per liter Tanks were maintained with recirculating water and surface oil-skimming pads for the first 5 to 7 days post-hatch until swim-bladder inflation was completed For the second week post-hatch larval rearing tanks were maintained static with gentle central aeration except for an exchange of about 30 of the tank water over the course of two hours each day During the second week post-hatch larvae were fed rotifers enriched with Algamac (Aquafauna BioMarine Inc Hawthorne CA USA) maintained at a density of 10ml By the end of the second week larvae were weaned from rotifers to Artemia nauplii By the end of the third week the larvae were typically weaned from enriched Artemia to artificial feed (Biokyowa Inc Girardeau MO USA) Weaned larvae were graded just once around 60 days post-hatch to remove the top 1 to 2 of larger fish responsible for cannibalism
In November 2001 we purchased lOg fingerlings that represent typical industry-standard HSB from Keo Fish Farms (Keo AR USA) These HSB closely matched the size and weight of our BX from the July spawn for the grow-out trial BX and HSB fingerlings were each stocked separately in triplicate 1900-L round tanks connected to the same recirculating system and reared at 23degC and a salinity of 1-3 ppt All six tanks were similarly stocked initially (approximately 1 kgm3) Fish were offered 80 of their expected ration via belt-feeders and hand-fed to satiation twice a day Approximately every 3 weeks length and weight samples were taken from a randomly-chosen 15 of each tanks
46 International Journal of Recirculating Aquaculture Volume 5 June 2004
Performance of Sunshine Bass and Backcross Hybrid Striped Bass
population At the conclusion of the project the tanks reached typical commercial densities of 5 to 9 kgm3bull
We quantified reproductive and hatchery performance of the three groups including fertilization rate swimbladder inflation rate days to weaning onto artificial feed (ie date of first ingestion to date that gt90 ingested artificial feed) survival estimates to approximately 60 days after hatch and to the end of the study feed conversion rate and monthly average weight and length The trial continued until mid-February 2002 when the HSB averaged approximately lOOg Results from previous years hatchery efforts with HSB using similar rearing protocols were used for comparative purposes
Both the hatchery and grow-out systems employed water recirculation technology including drum-filters fluidized-bed biofilters oxygenation ozonation and automated pH and temperature control that maintained high water-quality standards throughout the trials
Differences in fish weight between the hybrid types were analyzed as a repeated-measures general linear mixed model Residual (restricted) maximum likelihood was used to estimate the model parameters Initial fish biomass in each of the tanks and the amount of feed provided to each of the tanks were included in the model as covariates to assess the influence of these concomitant variables on differences in weight A first-order autoregressive covariance structure was assumed for the repeated-measurements of fish weight
Differences in fish survival at the end of the grow-out trial were analyzed as a general linear model with tanks serving as a blocking factor Because fish survivalmortality is a binary response and thus will violate an assumption of normality the significance of the test comparing survival between the hybrid types was obtained by randomization (number of randomizations= 1000) whereby the F-statistic of the original test was compared to F-statistics obtained by randomly allocating the survival mortality data to the different hybrid types The Type-I error rate for all statistical tests was set equal to 005
International Journal of Recirculating Aquaculture Volume 5 June 2004 47
Performance of Sunshine Bass and Backcross Hybrid Striped Bass
Table 1 Comparison of hatchery traits of backcross (BX) and Fl hybrid (HSB) striped bass for traits of economic interest
Traits of interest BX-HSB BX-HSB HSB HSB HSB
Female parent strain1 AR ARMD AR AR AR
Male parent strain1 MD FL MD FL MD MD FL MD Canada
Spawn date Oct-01 Jul-01 Mar-01 Oct-00 Jan-99
Fertilization 32 22 53 57
Swimbladder inflation 90 50 98 95
Weaning start (DAH)2bull3 24 21 17 22
Weaning end (DAH4 33 32 37 38
Mean wt (g) at 60 DAH 042 052 042 05
Survival to 60 DAH 7 740 104
Mean L (mm) at 30 DAH 133 11 1225
Mean L (mm) at 36 DAH 139 167
Mean L (mm) at 75 DAH 367 404 452
Mean Wt (g) at 75 DAH 074 081 12 0825 11
Condition factor at 1g 123E-05 118E-05 1Strain abbreviations AR=Arkansas R MD=Maryland FL=Florida 2DAH=Days after Hatch 3Weaning start marks the first introduction and ingestion of dry feed to replace live feeds 4Weaning end denotes the time when the transition to dry feeds is complete and live feeds are no longer utilized
RESULTS
Hatchery Trial Results A summary of performance for hatchery traits of production interest for BX and HSB is presented in Table 1
The fertilization rate for the BX eggs was lower than that which we typically found with HSB (22-32 vs 55) and considerably lower than our experience in 2000 when we conducted fertilization trials with BX (80)
Swimbladder inflation rate ranged from 50 in the first hatchery run to 90 in the second run We attribute the low rate in the first run to
48 International Journal of Recirculating Aquaculture Volume 5 June 2004
Performance of Sunshine Bass and Backcross Hybrid Striped Bass
surface-film and system management problems We showed in the second run that swimbladder inflation in BX was comparable to that typically attainable (gt90) for Morone fry
Time-to-weaning onto dry diets was shorter (10 days versus 18 days) and earlier (day 33 versus day 38) for BX than for HSB Survival of BX to 60 days after hatch (7) was lower than expected on the basis of previous experience with HSB (gt10) Mean weights for BX at 60 days after hatch in two hatchery runs (052 and 042g) was similar to those for HSB (042 and 05g) However HSB exhibited greater mean weight than BX at 75 days after hatch (l04 vs 077g)
Condition factor (K) of BX (123 + 009) was not significantly different from those of HSB (119 + 005) or striped bass (l13 + 003) at 1 gram mean weight
Frequencies of deformities for BX (lt2) were lower than those in earlier reports Bosworth et al (1997) reported deformities in 8 of BX and 4 ofHSB
Grow-out Trial Results Overall there was not a significant difference in weight between the hybrid types (F = 606 df = 13 P = 00907) however as evidenced in
100
80
60
40
20
--+- BX - Overall -0- HSB - Overall -ltgt- BX - Individual Tanks A middot middot middotbullmiddotmiddot middot HSB - Individual Tanks fi
fi ~o
12 Dec 2001 3 Jan 2002 24 Jan 2002 12 Feb 2002
Date Figure 1 Meanfish weight(plusmn 2 SE) at each time period for backcross hybrid striped bass (BX) and hybrid striped bass (HSB) Also shown is meanfish weight at each time periodor groups in individual tanks
International Journal of Recirculating Aquaculture Volume 5 June 2004 49
Performance of Sunshine Bass and Backcross Hybrid Striped Bass
Figure 1 there was a significant interaction on fish weight by hybrid type and time (F = 5157 df = 1587 P lt 00001) Using the slicing option available in SAS (SAS Institute 1999) we tested for differences in weight between the hybrid types for each time period and found that although weights of HSB and BX were not significantly different during the first two measurement periods (Time 1 F = 027 df = 1587 P = 06032 Time 2 F = 036 df = 1587 P = 05496) the hybrid types did differ in weight during the last measurement periods Specifically HSB were significantly heavier than BX on the 24th of January 2002 (F = 1061 df = 1 587 P = 00032) and the 12th of February 2002 (F = 3788 df = 1587 P lt 00001) Overall HSB had a specific growth rate of 268 per
Table 2 Mean weights of backcross hybrid striped bass (BX) and hybrid striped bass (HSB) over the course of a 3-month growth trial
Date BXTank5
Wt(g) SE
112101 1228
BXTank6 Wt(g) SE
1201
BX Tank 12 Wt(g) SE
1274
HSB Tank 13 HSB Tank14 HSB Tank 15 Wt(g) SE Wt(g) SE Wt(g) SE
1180 1016 1088
1211201 1744 102 1778 095 1658 096 1798 109 1752 118 1704 109
1 302 27 60 1 38 28 76 155 27 04 154 3306 157 3424 149 3414 211
1 2402 4196 252 4424 207 4882 299 6344 263 6192 326 6432 362
212102 6332 317 6763 334 6912 299 9474 473 9553 452 10500 388
Table 3 Comparison of survivalfeed conversion ratio (FCR) and condition factor at 60 grams for backcross hybrid striped bass (BX) and hybrid striped bass (HSB)
Cross Tank
Starting
Ending
Survival
BXS
160
136
85
BX 6 BX 12 HSB 13 HSB 14 HSB 15
160
138
86
161
137
85
178
177
99
179
173
97
180
179
99
Starting Biomass (g) 1964 1922 2051 2100 1819 1958
Ending Biomass (g) 8612 9334 9469 16770 16526 18795
Feed Fed(g) 12106 12135 11447 18041 17805 20463
FCR 182 164 154 123 121 122
Condition Factor 168E-05 166E-05 169E-05 194E-05 193E-05 208E-05
SE 353E-07 337E-07 424E-07 255E-07 327E-07 845E-07
50 International Journal of Recirculating Aquaculture Volume 5 June 2004
Performance of Sunshine Bass and Backcross Hybrid Striped Bass
day while BX had a specific growth rate of 205 per day Neither of the covariates included in the model were found to have a significant effect on weight differences (initial tank biomass F = 142 df = 1587 P = 02332 amount of feed F = 005 df = 1587 P = 08165)
Performance regarding key economic traits-survival feed conversion efficiency and condition factor-are summarized in Table 3 At the end of the grow-out trial survival of HSB was significantly greater than that of BX (F = 6216 df = 1 1014 P lt 00001) Feed conversion ratio was better for HSB (122) than for BX (166) Condition factors for BX were lower than those for HSB (l68 vs 198) meaning that BX appeared longer and less deep-bodied than HSB
DISCUSSION Our data showed that F1 HSB performed as well or better than BX for a range of hatchery- and grow-out-related traits
Hatchery traits Fertilization rates for backcross lots were approximately half that for HSB There was a wide variance for fertilization and hatch rates of eggs from HSB females Some of this variance may be due to differences in hatchery protocols (different hormone injections used strip vs tank spawning) at the commercial hatcheries where the data were collected (TIJ Smith personal communication) Poor hatch rates also may be attributable in part to hybrid breakdown that is to developmental incompatibilities among the genomes of the respective species when coadapted gene complexes are broken up at meiosis in the F1 (Hallerman 2003)
In the hatchery trial we hypothesize that the low swimbladder inflation rate for our J~ly fry resulted from offering first feed to the BX too early When rearing HSB and SB fry we typically wait until the yolk sac has been largely resorbed and the fry mostly have inflated their swimbladders before we introduce live feed This is because live feed can cause an oily film on the water surface that interferes with a frys successful ingestion of air bubbles necessary to inflate the swimbladder (Chapman et al 1988) The timing of swimbladder inflation varies with fry type and temperature with HSB typically inflating between 3 and 6 days after hatch and SB 6 to 9 days after hatch BX fry inflate their swimbladder at an intermediate time 5 to 8 days after hatch (DAH) Since for the July
International Journal of Recirculating Aquaculture Volume 5 June 2004 51
Performance of Sunshine Bass and Backcross Hybrid Striped Bass
spawn we introduced feed into their tanks at the time prescribed for HSB (at 5 DAH) BX fry may have had a reduced opportunity to inflate their swimbladders because of interference by a surface film with air contact In the October spawn we monitored swimbladder inflation more carefully and introduced live feed on day 7 after almost 90 of swimbladders were inflated The low swimbladder inflation rate in the July hatchery run of BX may have had a direct impact on survival Larvae without inflated swimbladders expend more energy swimming exhibit reduced growth rates are less tolerant of stress and often sink to the tank bottom and die (Van Heukelem et al 2000)
BX were weaned more quickly and earlier onto dry diets than HSB which may have helped contribute to their ability to match the size and weight of HSB at 60 DAH Earlier weaning has economic merit since dry diets are generally cheaper and easier to feed than brine shrimp
Grow-out traits After 60 days post-hatch the growth and other performance differences between BX and HSB became more evident HSB exhibited significantly better growth survival and feed conversion ratios
We hypothesized that backcross hybrid striped bass might grow as fast or faster than the standard commercially-available F 1 hybrid striped bass if high-performance HSB females were selected as broodstock Our data regarding performance in intensive tank systems did not support this hypothesis Rather our observations accord with the classical view that the high performance of some interspecific hybrids is largely due to heterosis and that because the heterosis shown by an F 2 or backcross hybrid is only half that shown in an F1 (Falconer and Mackay 1996 p 257) that advanced generation hybrids would not perform as well as F1
hybrids Indeed F 2 HSB previously showed low hatch rates low larval survival and high variability of growth rate (Smith and Jenkins 1984 Smith et al 1985) Our results suggest that the heterosis expressed in HSB for growth and performance was greater than the selective breeding advantage we employed by crossing high performance HSB females with male striped bass Apparently the additive genetic variance contributed by the HSB and striped bass selected for size-at-age could not make up for the loss of dominance variance
BX may have better potential market acceptance by virtue of having a lower condition factor appearing longer and less deep-bodied than HSB more
52 International Journal of Recirculating Aquaculture Volume 5 June 2004
Performance of Sunshine Bass and Backcross Hybrid Striped Bass
like striped bass that are more familiar in many markets Fins Technologys market experience has shown that the premium-priced live markets prefer longer leaner fish such as the backcross There is the possibility that because of later maturity backcross hybrid striped bass may grow to larger sizes than hybrid striped bass This is attractive because there is an unserviced demand for larger (1 kg+) fish that can provide portion-controlled 7-9 ounce fillets for the restaurant and retail markets
ACKNOWLEDGEMENTS This project was supported by US Department of Agriculture-Small Business Innovation Research Program Phase I Grant no 2001-00373 EMH is supported by the USDA-CSREES Hatch Program and the Commonwealth of Virginia Aquaculture Initiative
REFERENCES Bosworth BG Libey GS Notter DR Egg Larval and Fingerling
Traits of Crosses among Striped Bass White Bass and their Fl Hybrids Aquaculture 1997 154 201-217
Carlberg J Van Olst J US Production and Sales of Hybrid Striped Bass (1987-2002) 2003 httpaquanicorgsbgaHSBversion5ppt
Chapman DC Hubert WA Jackson UT Influence of Access to Air and of Salinity on Gas Bladder Inflation in Striped Bass Progressive Fish-Culturist 1988 50 23-27
Falconer DS Mackay TFC 1996 Introduction to Quantitative Genetics Fourth Edition Longman Group Ltd Harlow Essex UK
Halbrendt CK Wirth FF Vaughn GF Conjoint Analysis of the Mid-Atlantic Food-Fish Market for Farm-Raised HSB Southern Journal of Agricultural Economics 1991 23 155-163
Hallerman EM Coadaptation and Outbreeding Depression In Po_pulation Genetics Principles and Applications for Fisheries Scientists Hallerman E (Ed) 2004 American Fisheries Society Bethesda MD USA
Harrell RM Hybridization and Genetics Striped Bass and Other Morone Culture In Harrell RM (Ed) 1997 Pages 217-234 Elsevier Science Amsterdam
International Journal of Recirculating Aquaculture Volume 5 June 2004 53
Performance of Sunshine Bass and Backcross Hybrid Striped Bass
Jenkins WE Heyward LD Sr Smith TIJ Performance of Domesticated Striped Bass Marone saxatilis Palmetto Bass and Backcross Hybrid Striped Bass (Sunshine Bass Female x Striped Bass Male) Raised in a Tank Culture System Journal of the World Aquaculture Society 1998 29 505-509
Kerby JH Cryogenic Preservation of Sperm from Striped Bass Transactions of the American Fisheries Society 1983 112 86-91
Losordo TM Westerman P An Analysis of Biological Economic and Engineering Factors Affecting the Cost of Fish Production in Recirculating Aquaculture Systems Journal of the World Aquaculture Society 1994 25 193-203
SAS Institute 1999 The SAS System for Windows version 82 SAS Institute Cary NC USA
Smith TlJ Jenkins WE Controlled Spawning of Fl Hybrid Striped Bass (Marone saxatilis x M chrysops) and Rearing of F2 Progeny Journal of the World Mariculture Society 1984 15 147-161
Smith TlJ Jenkins WE Snevel JF Production Characteristics of Striped Bass (Marone saxatilis) and Fl - F2 hybrids (Marone saxatilis and M chrysops) Reared in Intensive Tank Systems Journal of the World Mariculture Society 1985 16 57-70
Tomasso JR Kempton CJ Gallman A Smith TlJ Comparative Production Characteristics of Sunshine Bass and Sunshine Bass x Striped Bass in Recirculating-Water Systems North American Journal of Aquaculture 1999 61 79-81
Van Heukelem WF Harrell RM Hughes SG Lindell SR Friedmann BR Optimal Conditions for Swimbladder Inflation in Striped Bass Larvae Reared in Intensive Systems Northeast Regional Aquaculture Center Publication No 00-006 (2000) 5 pages
54 International Journal of Recirculating Aquaculture Volume 5 June 2004
Book Review
Fjofish apd Shellfish Bacteriology Mapua) Techpjques apd Procedures KA Whitman with contributions by NG MacNair
Iowa State Press (Blackwell Publishing Professional) Ames IA USA (2004) 288 pages ISBN 0813819520 US $4999
Reviewed by Rocco C Cipriano United States Geological Survey National Fish Health Research Laboratory 11649 Leetown Road Kearneysville WV 25430 USA E-mail rocco_ciprianousgsgov
Despite the fact that several good texts have been published regarding the description and nature of bacterial pathogens in aquatic animals there remained a need for a comprehensive yet practical guide devoted to techniques and procedures used for bacterial identification Diagnosis and detection of fish and shellfish pathogens often requires reliance upon standard microbiological media tests and reagents for some bacteria but more specialized assays are required for many aquatic pathogens In the latter case the products necessary for such assays are not commercially available and must be produced in aquatic animal diagnostic facilities from their basic ingredients Often therefore the compositions of differential media and the conduct of certain tests for the primary isolation or detection of specific aquatic pathogens are only available by referencing the general body of published scientific literature Hence until now there has not been a single-source shelf-volume that combines standard microbiological procedures used for routine detection and identification of medically important bacteria with the specialized needs of the fisheries profession This manual however helps to fill that void
The manual stands as a reference suitable for professional aquatic biologists with backgrounds in microbiology veterinarians and students of aquatic animal health Its strength lies in its coverage of the subject matter regarding culture-based diagnosis and identification of bacteria associated with finfish bivalves and lobsters Sections on
International Journal of Recirculating Aquaculture 5 (2004) 55-56 All Rights Reserved copyCopyright 2004 by Virginia Tech and Virginia Sea Grant Blacksburg VA USA
International Journal of Recirculating Aquaculture Volume 5 June 2004 55
Book Review FiQish and ShelJfish Bacteriology Manualmiddot Techniques and Procedures
aseptic collection and shipment of samples qualitative and quantitative procedures for bacterial isolation staining techniques media and standard biological tests used for the cultivation and phentotypic characterization of pathogenic bacteria and antibiotic sensitivity testing provide sound background for the student or novice practitioner Particularly beneficial for anyone who is not experienced with aquatic microbial pathogens is the section listing principal organs media and appropriate incubation temperatures to be used as the most probable sources of isolation for the specific bacteria
More experienced professionals will find it helpful and convenient to have the descriptions and interpretations of differential media (eg Coomassie Brilliant Blue Agar for Aeromonas salmonicida Rimler-Shotts Agar for Aeromonas hydropila Cytophaga Agar Shieh and TYES for Flavobacterium spp and Edwardsiella ictaluri Agar and various other media for Renibacterium salmoninarum) listed in a single source The major identifying criteria that phenotypically characterize selected bacterial pathogens are also described in tabulated form Specialized tests such as the SIF test to detect covert infections nurse culture techniques for enhanced bacterial growth and assays for public health indicator organisms in bivalves are documented Sections covering serology immunoassay and non-cultured based molecular assays (eg polymerase chain reaction) are also presented but are not as completely summarized as those for bacterial isolation In summary the nature of this manual makes it appropriate for frequent use as a practical laboratory guide
56 International Journal of Recirculating Aquaculture Volume 5 June 2004
Subscription Information
International Journal of Recirculating Aquaculture
A publication ofVirginia Tech and the Virginia Sea Grant College Program
IJRA presents the latest developments in RAS-related research focusing on the areas of
Food Quality Pathology
Food Safety
Aquatic Medicine Breeding amp Genetics Waste Management
FishShellfish Growth amp Nutrition Recirculating Systems Mgmt Marketing amp Economics Water Conservation
Dont miss an issue of this informative peer-reviewed journal Subscribe now using your credit card by calling 540-231-2075 or by printing out a form at wwwcfastvteduijrahtml If you prefer you can also mail this form to the address below along with a check or money order
Name ----------------~ Address ----------------Line2 ------------------City ____________ State __ _ Country Postal Code ___________ _ Phone Fax -------- --------e-mail-----------------check _ 2 year ($25 US)
International Journal of Recirculating Aquaculture Food Science amp Technology Building (0418)
Virginia Polytechnic Institute and State University Blacksburg VA 24061
phone (540) 231-2075 fax (540) 231-9293 e-mail IJRAvtedu
International Journal of Recirculating Aquaculture Volume 5 June 2004 57
~ International Journal of ~ Recirculating Aquaculture A publication of Virginia Tech and the Virginia Sea Grant College Program
Instructions for Authors The International Journal of Recirculating Aquaculture (IJRA) encourages the submission of original high-quality papers on research in all aspects of recirculating aquaculture Papers will be peer-reviewed and evaluated for scientific merit relevance and for their usefulness in promoting the advancement of recirculating aquaculture Complete coherent projects are preferred Any related papers submitted together must be thoroughly cross-referenced All papers must be original meaning that the data and the information presented must be the work of the authors and can not have been published elsewhere Dual publication of a paper or data is possible only through the permission of the Editors of both journals THERE ARE NO PAGE CHARGES for IJRA submissions
INITIAL MANUSCRIPT SUBMISSION Manuscripts should be sent to Ms Angela Correa Managing Editor by mail using the address listed at the end of these instructions or by e-mail to (ijravtedu) Submit four (4) copies of each manuscript if regular mail is used All manuscripts must be in English Dot matrix type is not acceptable and all such submissions will be returned without review Each submission must include a cover letter stating that the paper contains original research and that the information has not been published elsewhere E-mailed submissions must be saved in doc format Be sure to include the names of colleagues who have already reviewed the work presented IJRA has two categories for submission 1 Articles which are complete in-depth scientific studies and 2 Notes which are short papers of limited scope Articles and notes will be critically reviewed by two or three experts as well as by the Managing Editor Submissions may be returned without peer review in cases where the Managing Editor determines that they are inappropriate for the journal of poor quality poorly written or fail to follow the journals style format
PREPARATION OF MANUSCRIPTS IJRA uses the latest editions of Websters New International Dictionary and Websters New Collegiate Dictionarv for standard spellings and word definitions All spelling will be in American English Foreign or science-related terminology that is unfamiliar and does not appear in these dictionaries will require an accompanying definition Acceptable scientific and common names of fishes are listed in A List of Common and Scientific Names of Fishes from the United States and Canada published by the American Fisheries Society Common names may be used throughout each paper but must be accompanied by a full scientific name when they first appear in a paper The author must use the full common name eg yellow perch not perch All foreign language words should be italicized in the manuscript
In the manuscript number each page sequentially and include the senior authors name next to the page number (eg Page 4 Jahncke) on each page Single-space all typed material including references Type size in the body of the text should be no larger than 12pts and no smaller than 10 pts Subsection headings should also be italicized in the manuscript Spell out one-digit numbers except when they are used with units of measure - eg six ponds 7 days
International Journal of Recirculating Aquaculture Volume 5 June 2004 59
Spell out any number that begins a sentence When two numbers occur sequentially in the text one of the numbers must be spelled out- eg In 1987 fifty fish were stocked Use commas in numbers of 1000 or more Use the 24-hour clock to describe time- eg 1300 not 100 pm
Keep footnotes to a minimum and number them sequentially throughout the paper All units of measurement must be reported via the metric system except in special circumstances (eg horsepower) Standard scientific abbreviations and symbols may be used without definition If the use of a symbol could cause confusion define the symbol the first time it is used On the final draft of a paper that has been accepted for publication Greek letters or other extraneous symbols that do not appear on a keyboard the name of the symbol should be noted where the symbol is used to help eliminate prepress errors Parts per million or milligrams per liter can be
-1 reported as either ppm or mgI but not as mgI
Commonly used aquaculture jargon can be used without defining the term - eg fry fingerling hapa Less commonly used jargon may also be used but terms should be defined the first time they are used Jargon from fields outside of aquaculture should also be defined the first time they are used Always place a zero to the left of a decimal point if the number is less than one this includes probability values - eg P = 005 not P = 05
COMPONENTS OF THE MANUSCRIPTS Articles and notes should include a title names of authors and their addresses abstract introduction materials and methods results discussion (or a combined results and discussion) conclusion (rarely) acknowledgements (if any) references figures and tables in that order Each section should start on a new page
Title - The title should accurately reflect the contents of the paper Brief concise titles are encouraged The title page must include the name(s) of the author(s) and all addresses
Abstract - The abstract should be a concise highlight of the results and conclusions Methodology should not be abstracted unless it is necessary to explain the results or unless the paper describes a new technique Abstracts should be less than 300 words
Introduction - The introduction should explain why the paper was written and why it should be read The introduction should condense the relevant information in the field that led the author to do the research The introduction is not a complete literature review and only the most relevant references should be cited The introduction should also contain a statement that describes the purpose or objective of the paper
Materials and Methods - The underlying goal of this section is to describe what was done so that others can repeat the experiment If previously published papers described a technique that was used they can be cited to prevent unnecessary repetition If the technique or process was modified the modification must be described so that others can repeat the process Experimental designs can be explained by use of figures if they will help clarify what was done If the experiment was a complicated one with many subparts subsections may be used to describe each subpart
Results - This section describes the data Proper use of tables and figures can simplify and help explain the results Statistical analysis of data is necessary unless differences are so obvious that statistical analysis is superfluous Although probability values of 005 and 001 are traditionally used each author is free to choose his or her own level of significance
60 International Journal of Recirculating Aquaculture Volume 5 June 2004
Discussion - This section should interpret the results and compare the results from this experiment to those found in similar research The section can also be used to speculate about the results to provide reasons for the trends and to suggest new ideas that can advance our understanding about aquaculture This section should not be a literature review section that merely compares results among several papers
Results and Discussion - Results and discussion sections can be combined In most cases this leads to a better paper because the integration of these sections leads to a more meaningful interpretation of data
Conclusion - This section should be used only when the results of an experiment lead to an unequivocal interpretation
Acknowledgements - This section should be used to thank organizations that supported the research monetarily and individuals who assisted in the research or preparation of the paper This section includes manuscript number designations for those institutions that assign such numbers
References - Select references with great care Unless the paper includes a literature review there is no need to reference every paper written about a subject Use only the most important ones
Figures and Tables - All figures andtables go after the references Figures always go before tables
Section headings (eg Materials and Methods) should be capitalized and in bold type Secondary headings should be balded and go flush left Tertiary headings are incorporated into the first paragraph of that subsection Tertiary headings are italicized and separated from the text by a double dash
In the text references are cited in one of two ways 1 Swingle (1959) evaluated two species of tilapia or 2 pond culture in Alabama began in the 1950s (Swingle 1959) When there are three or more authors list only the first in a citation and follow that with et al eg Smitherman et al (1983) reviewed catfish breeding work at Auburn University If the name of an institutional author is long it can be abbreviated in a citation eg Food and Agriculture Organization of the United Nations may be abbreviated as FAO When several citations are used in a single entry they are listed chronologically If you are citing two papers that were written by the same author(s) the name only has to appear once per citation followed by the years that designate the different papers Separate the years with a comma If you are citing two authors you must separate the citations with a semicolon (Smith 1975 1976 Jones 1976)
In the reference section the reference list is strictly alphabetical by last name of the senior author and then by initials if two authors have identical last names If an author has written more than one paper the following format should be followed All single authored papers go first followed by co-authored papers and then the papers that were written by three or more authors If an author has written more than one single-authored paper the papers are listed chronologically If an author has written more than one co-authored paper they are listed alphabetically by the second authors last name If a tandem has authored two or more papers the order is chronological Papers written by the same group of three or more authors should be listed chronologically
International Journal of Recirculating Aquaculture Volume 5 June 2004 61
The following format will be used when referencing various works
PAPERS Single-author papers
McGinty AS Effects of Size at Stocking on Competition and Growth of All-Male Tilapia Hybrids Journal of the World Aquaculture Society 1985 16 52-56
Multiple-author papers Tave D Smitherman RO Predicted Response to Selection for Early Growth in Tilapia nilotica Transactions of the American Fisheries Society 1980 109 439-445
If an author has published two or more papers in the same year follow the years with a letter to differentiate them eg Smith 1988a 1988b Use issue numbers only when each issue starts out with page 1 If pagination is consecutive throughout the volume omit the issue number Spell out journal names in their entirely without abbreviations
Papers in proceedings or in edited volumes Nicholson LC Woods LC Ill Woiwode JG Intensive Culture Techniques for the Striped Bass and its Hybrids In Culture and Propagation of Striped Bass and Its Hybrids Harrell RM Kerby JH Minton RV Eds 1990 American Fisheries Society Bethesda MD USA
Books and reportspublications from governmental or non-governmental bodies
Lovell T 1989 Nutrition and Feeding of Fish Van Nostrand Reinhold New York NY USA
Food and Agriculture Organization of the United Nations (FAO) Fisheries Department 1997 Review of the State of World Aquaculture No 886 FIRlC886 FAO Rome Italy
Theses and Dissertations
Easter CC 1992 Water Chemistry Characterization and Performance of a Recirculating Aquaculture System Producing Hybrid Striped Bass Masters thesis Virginia Polytechnic Institute and State University Blacksburg VA USA
Websites
Federation of European Aquaculture Producers (FEAP) European Eel Production (httpwwwfeaporgeelshtml) 2002
Page numbers for proceedings books theses and dissertations are unnecessary Government publications should be treated as if they were books but document numbers must be included THE ACCURACY OF REFERENCES IS THE SOLE RESPONSIBILITY OF THE AUTHORS MAKE SURE THAT CITATIONS AND REFERENCES MATCH
Tables - When creating a table decide what the purpose of the table is and what points are important then organize the table so that the main features can be easily understood The table heading should provide sufficient information for the table to be understood as an entity Keep footnotes to a minimum Each table goes on a separate page Tables must be camera ready TABLES WILL BE PRINTED AS IS AND WILL NOT BE TYPESET Figures - List all figure captions on separate pages Original artwork doesnt have to be submitted when a paper is first submitted for review but original artwork must accompany the final revised manuscript Good quality photocopies are acceptable when a manuscript
62 International Journal of Recirculating Aquaculture Volume 5 June 2004
is submitted for review Graphs and original artwork must be printed with a laser printer or done in pen and ink Dot-matrix figures are not acceptable Original artwork or high-contrast photographs are acceptable Label all figures on the back with a soft pencil name of senior author paper title and figure number
Photographs - Should be on glossy paper with good contrast Do not glue pictures to cardboard Color photographs can be printed but the additional cost of printing them will be charged to the author Label all photos on the back with a soft pencil name of senior author paper title and figure number
FINAL REVISED MANUSCRIPTS If using the mail submit two copies of the final revised manuscript including original artwork Submit either the original pen-and-ink drawings or laser-printed versions of the drawings In addition submit the manuscript on a disk (CD preferable) or by e-mail On the disk write the brand name of the computer or word processor the word processing program that was used (should be Microsoft Word) the title of your article and the file name NOTE Disk and hard copy must agree In case of discrepancies it is the policy of IJRA to follow hard copy An electronic version of the completed manuscript is needed in order to publish AUTHORS MAY NOT RECEIVE PAGE PROOFS Proofreading will be done by the Production Office of IJRA using the revised final version of the manuscript Therefore authors must be especially careful that no errors exist in the final revised version because in most cases no changes are possible after it is submitted
REPRINTS The senior author will receive two copies of the journal and a pdf file of the article for distribution and reprinting purposes The junior author(s) will also receive two copies of the journal issue These are sent several weeks after the journal is published and in circulation Requests for the pdf format of the article can only be made by the corresponding author
COPYRIGHT amp PERMISSIONS For permission to reprint articles that have appeared in IJRA please contact IJRA Copyright amp Permissions Food Science amp Technology Building (0418) Virginia Tech Blacksburg VA 24061 USA
COPYRIGHT TRANSFER If your manuscript is accepted for publication copyright ownership must be officially transferred to IJRA The Editors acceptance letter will include a form fully explaining this The form must be signed by all authors and the original returned to the Editor at this time Failure to return the copyright form in a timely fashion will result in delay in publication
Send your submissions to International Journal of Recirculating Aquaculture
AI Correa Managing Editor 27-B Food Science and Technology Building (0418) Virginia Polytechnic Institute and State University Blacksburg VA 24061 USA
If you have any questions please feel free to contact us Phone (540) 231-2075 Fax (540) 231-9293 e-mail ijravtedu
International Journal of Recirculating Aquaculture Volume 5 June 2004 63

Hematology and Blood Chemistry of Yellow Perch (Percaflavescens)
Hematological analytes were determined from the EDTA anticoagulated blood As we have observed for other fish species EDTA was superior to heparin for yellow perch blood both in preventing clot formation and preserving cellular morphology (Hrubec et al 1996 2000) Blood from the EDTA tube was drawn into microhematocrit tubes and the packed cell volume (PCV) determined after centrifugation at 10000 x g for 5 min Plasma protein was determined with a clinical refractometer using plasma from the microhematocrit tube The total erythrocyte and leukocyte-plus-thrombocyte counts were determined manually with a Neubauer hemacytometer using Natt-Herricks solution as a diluent stain (Natt and Herrick 1952) Blood smears made within 45 minutes of sample collection were stained with Wright-Geimsa stain and were used to determine the differential counts as follows Leukocytes and thrombocytes were identified and counted on the blood smears until 200 leukocytes and a variable number of thrombocytes were enumerated The percentages of each leukocyte type and of thrombocytes were multiplied by the total leukocyte-plus-thrombocyte number to give the final cell counts Thrombocyte numbers were subtracted from the leukocyte-plus-thrombocyte count to give the total leukocyte count This method of manually determining total leukocyte and differential counts has been recommended for use with avian (Zinkl 1986) and fish blood (Hrubec et al 1996 1997ab 2000 2001) as the nucleated red cells prevent accurate enumeration using automated analysis (Huffman and Arkoosh 1997) Slight thrombocyte clumping was observed on the hemacytometer for some individuals only fish with minimal thrombocyte clumping(lt 4 cells clumped) were used for the differential counts to ensure accuracy of the counts
Reference intervals were determined following the guidelines proposed by the National Committee for Clinical Laboratory Standards (NCCLS 1992) As suggested in these guidelines the data were checked for outliers using the 13 differencerange ratio and no outliers were identified The values were then ranked and the high and low 25 were discarded The range of the remaining values provided the reference interval
RESULTS AND DISCUSSION The physiologic and health status of an individual is reflected in the blood producing variations in hematological and blood biochemical values Clinical analysis of blood is a fundamental tool used in human
International Journal of Recirculating Aquaculture Volume 5 June 2004 3 3
Hematology and Blood Chemistry of Yellow Perch (Percaflavescens)
and veterinary medicine to diagnose and predict the outcome of disease and to monitor the effect of therapeutic nutritional and environmental management Blood analysis is not used extensively as a diagnostic tool in fish medicine partly due to the lack of reference intervals for various fish species and also because changes associated with specific diseases and metabolic disorders are not well characterized With sufficient background data clinical analysis of individual blood samples could detect infectious diseases metabolic disorders and sub-lethal disease states affecting production performance
Hematological and plasma biochemistry data from diseased individuals can be evaluated by direct comparison to a reference interval which is the appropriate range of variation in a blood parameter from a defined population of individuals under specific conditions The reference interval needs to be determined on a sufficient number of normal healthy individuals under similar production conditions using standardized analytical techniques (NCCLS 1992) When the deviation in a blood parameter is large enough to fall outside the reference interval it indicates the value may be aberrant and is most likely not due to individual variation for a given fish
Few previous studies have determined blood parameters for yellow perch (Toneys and Coble 1980 Nelson et al 1988 Nelson and Mitchell 1992 van den Heuvel et al 2000) These studies are of limited relevance as they were primarily toxicological studies and only a few blood parameters were determined and also because blood samples were collected and handled by differing methods prior to determination of the blood value Some of the capture (hook and line and gill netting) and blood collection methods (severing the caudal peduncle) used in these studies are also unsuitable for diagnostic blood samples as they result in significant alteration in the blood which will mask diseased states The study with the closest sampling procedure to that used in our experiment only presented selected blood chemistry values for yellow perch after 16 hours of moderate or exhaustive exercise (Nelson and Mitchell 1992) Therefore although the previous studies on yellow perch hematology are helpful in determining the effects of environmental factors and stress they have limited diagnostic utility and even prevent meaningful comparison with the data presented in this paper
The average mean weight of the yellow perch used for the hematological determinations was 125 +- 14g with a total length of 223 +- 08 cm For
34 International Journal of Recirculating Aquaculture Volume 5 June 2004
Hematology and Blood Chemistry of Yellow Perch (Percajlavescens)
the biochemical determinations the fish had a weight of 121 +- 15g and length of 226 +- 08 cm The results of the hematological determinations from 52 fish are listed in Table 2 Values for plasma chemistry reference intervals determined on 42 samples are listed in Table 3 Overall both the hematological and plasma chemistry values were similar to those reported previously for hybrid striped bass and tilapia reared in recirculation systems (Hrubec et al 1996 2000 Hrubec and Smith 2000) The striped bass and tilapia from production systems exhibited wider ranges in value for the different leukocyte types increased numbers of reticulocytes increased plasma and total protein values increased creatinine values and a decreased plasma chloride concentration as compared to fish in lower density recirculation tanks We did not compare blood values from the production yellow perch in this study to yellow perch maintained in low-density tank settings so were unable to determine if these same trends are apparent in yellow perch as well However based on our previous experience with fish hematological and plasma biochemical values there is an indication that these trends are occurring in yellow perch as well
Table 2 Hematological reference intervals for adult yellow perch (Perea flavescens) reared in a recirculation system
Analyte N Reference Interval Mean Stds1
PCV2 () 57 29-47 388 45
Plasma Protein (gdl) 57 60-82 67 06
Erythrocytes (x 106ml) 53 2160-3345 2737 0356
Leukocytes (ml) 53 52590-186490 113914 39086
Lymphocytes (ml)
Small 53 36800-153420 85630 31728
Large 53 3530-23 130 11602 5359
Neutrophils (ml) 53 1860-35950 12430 8837
Monocytes (ml) 53 670-12640 4252 2874
Thrombocytes (ml) 53 38270-118510 72972 21299 1Standard deviation 2Packed cell volume
International Journal of Recirculating Aquaculture Volume 5 June 2004 35
Hematology and Blood Chemistry of Yellow Perch (Perea flavescens)
Table 3 Plasma biochemical values for adult yellow perch (Percaftavescens) reared in a recirculation system
Analyte N Reference Interval Mean Stds1
Total Protein (gdl) 42 37-50 45 04
Albumin (gdl) 42 06-09 07 01
Globulin (gdl) 42 31-42 37 03
Creatinine (mgdi) 42 04-10 06 01
Total bilirubin (mgdi) 42 03-04 03 01
ALP2 (UI) 42 50-114 822 249
AST3 (UI) 42 2-29 85 64
Glucose (mgdi) 42 62-181 1000 350
Cholesterol (mgdi) 42 182-323 2440 330
Sodium (mEqI) 42 138-153 1470 40
Potassium (mEqI) 42 20-38 32 05
Chloride (mEqI) 42 119-133 1260 40
Calcium (mEqI) 42 86-120 103 13
Phosphorus (mEqI) 42 50-96 74 11
Magnesium (mEqI) 42 17-34 27 04 1 Standard deviation 2 Alkaline phosphatase 3 Aspartate aminotransferase (SGOT)
The blood cells present in the yellow perch were typical of teleost fish and included erythrocytes thrombocytes and leukocytes (Fig 1) Erythrocytes were oval to round with characteristic red cytoplasm and an elongate and centrally-located nucleus Immature erythrocytes or reticulocytes demonstrated a blue-purple tinge to the normal eosinophilic cytoplasm (Fig IA B C) The yellow perch had increased numbers of reticulocytes (included in the erythrocyte count) with approximately 7 to 10 per field at lOOx oil immersion compared to what we observe for most fish species The cause for the apparent reticulocytosis is not known but has been observed in other fish species exposed to elevated nitrite and nitrate (Grabda et al 1974 Hrubec et al 1996 2000 Hrubec and Smith 2000)
36 International Journal of Recirculating Aquaculture Volume 5 June 2004
Hematology and Blood Chemistry of Yellow Perch (Perea flavescens)
T bull middotmiddot ~~ - middot
N -
Figure I Characteristic blood cells from yellow perch reared in recirculation systems Blood smears were made with EDTA anticoagulated blood stained with Wrights Geimsa stain Cells are abbreviated as follows U - Large lymphocyte SL - small lymphocyte T - thrombocyte R - reticulocytes (immature erythrocyte) PC - plasma cell (activated lymphocyte) M- monocyte N-neutrophil The blue bar in frame A is Omm
International Journal of Recirculating Aquaculture Volume 5 June 2004 37
Hematology and Blood Chemistry of Yellow Perch (Percajlavescens)
The thrombocytes were slightly smaller than the erythrocytes (Fig IA) They had clear cytoplasm and were variable in shape being elongated pyriform oval or round Nuclear shape tended to follow cytoplasmic shape although oval and round thrombocyte nuclei occasionally were lobulated (Fig IB) as described for striped bass and tilapia (Hrubec et al 1996 2000)
Leukocytes made up the remainder of the cell types seen in the blood and included small and large lymphocytes neutrophils and monocytes No eosinophils or heterophils were observed Small lymphocytes were the smallest cell present with a rim of blue cytoplasm surrounding the round nucleus (Fig IA E F) Large lymphocytes had an abundant and darker blue cytoplasm and the nucleus was larger than observed in the small lymphocyte (Fig IA E) Plasma cells were occasionally observed with a classic open nucleus abundant dark blue cytoplasm and a clear cytoplasmic region adjacent to the nucleus presumably representing the Golgi as in mammalian plasma cells (Fig IC) Plasma cells were included in the large lymphocytes category for the differential counts
Neutrophils were the largest cell present in the blood (Fig ID E F) The cytoplasm of the neutrophil was a translucent grey containing no granules and infrequent vacuoles Cytoplasmic shape was round to angular as the cellular borders often appeared slightly adherent to adjacent erythrocytes distorting cellular shape Nuclear shape of the neutrophil varied from round to horseshoe shaped and frequently segmented into two prominent lobes connected by a thin nuclear bridge (Fig IF) Monocytes had abundant dark blue cytoplasm that was frequently vacuolated (Fig ID) The round to kidney-bean shaped monocyte nucleus was large with prominent chromatin clumping
Analysis of blood parameters can provide a wealth of information useful in analyzing the effects of disease and sub-optimal environmental conditions Providing reference intervals for healthy adult yellow perch reared in recirculation systems furnishes veterinarians and fish health professionals the foundation to develop diagnostic hematology for this species The number of studies that determine actual reference intervals for fish species is limited The majority of blood values determined for fishes are reported in the literature as a mean value with a standard deviation Historically reference intervals were determined as two standard deviations from the mean however this method is only valid when blood values follow a normal distribution It is incorrect to assume
38 International Journal of Recirculating Aquaculture Volume 5 June 2004
Hematology and Blood Chemistry of Yellow Perch (Percaflavescens)
that biological parameters are distributed normally therefore non-parametric methods should be used to accurately determine reference intervals (Reed et al 1971) Techniques to properly determine reference intervals have been established by the NCCLS (1992) and suggestions for their use and interpretation have been discussed (Lumsden 1998) As with mammalian species reference intervals need to be determined for different populations of fish within a single species as culture conditions and environmental variables affect blood values to the extent that they are outside the reference interval (Ram-Bhaskar and Srinivasa-Rao 1989 Hrubec et al 1996 1997ab 2000 2001) Although the reference range for some of the blood parameters appears large it is still possible to detect variation in hematologic values associated with pathological conditions (Hrubec et al 1997b and unpublished data)
Developing reference intervals is a necessary first step in determining which specific hematological changes can be associated with disease conditions As the field of fish hematology develops its usefulness to the aquaculture industry will increase Information derived by standardized non-lethal diagnostic assays will be needed to enhance the culture of yellow perch and other fish species Analysis of diagnostic blood samples can provide a means for early detection of infectious disease and assist in the identification of sub-lethal conditions affecting production performance This should allow for more specific timely and effective disease treatments in the future
ACKNOWLEDGEMENTS The authors wish to thank Mark Kidd of the Virginia Tech Aquaculture Center for his assistance with fish care and sampling
REFERENCES Grabda E Einszporn-Orecka T Felinska C Zbanyszek R
Experimental Methemoglobinemia in Rainbow Trout Acta Ichthyologica et Piscatoria 1974 4 43-71
Hrubec TC Smith SA Robertson JL Feldman B Veit HP Libey G Tinker MK Comparison of Hematologic Reference Intervals between Culture System and Type of Hybrid Striped Bass American Journal of Veterinary Research 1996 57 618-623
International Journal of Recirculating Aquaculture Volume 5 June 2004 3 9
Hematology and Blood Chemistry of Yellow Perch (Percajiavescens)
Hrubec TC Robertson JL Smith SA Effects of Temperature on Hematologic and Serum Biochemical Profiles of Hybrid Striped Bass (Morone chrysops x Morone saxatilis) American Journal of Veterinary Research 1997a 58 126-130
Hrubec TC Robertson JL Smith SA Effects of Ammonia and Nitrate Concentration on Hematologic and Serum Biochemical Profiles of Hybrid Striped Bass (Morone chrysops x Morone saxatilis) American Journal of Veterinary Research 1997b 58 131-135
Hrubec TC Smith SA Hematology and Plasma Chemistry Values for Production Tilapia ( Oreochromis hybrid) Raised in a Recirculation System International Journal of Recirculating Aquaculture 2000 J 5-14
Hrubec TC Cardinale JL Smith SA Hematology and Plasma Chemistry Reference Intervals for Cultured Tilapia ( Oreochromis hybrid) Veterinary Clinical Pathology 2000 29 7-12
Hrubec TC Smith SA Robertson JL Age Related Differences in Hematologic and Plasma Chemistry Analytes of Hybrid Striped Bass Morone chrysops x Morone saxatilis Veterinary Clinical Pathology 2001 30 8-15
Huffman PA Arkoosh MR Characteristics of Peripheral Blood Cells from Rainbow Trout Evaluated by Particle Counter Image Analysis and Hemocytometric Techniques Journal of Aquatic Animal Health 1997 9 239-248
Kelly AM Yellow Perch Culture in the United States Manna or Mania World Aquaculture 2000 31 4-17
Lumsden JH Normal or reference values Questions and Comments Veterinary Clinical Pathology 1998 27 102-106
Mallison JA 2000 A White Paper on the Status and Needs of Yellow Perch Aquaculture in the North Central Region North Central Regional Aquaculture Center Michigan State University E Lansing MI USA
Natt MP Herrick CA A New Blood Diluent for Counting Erythrocytes and Leukocytes of the Chicken Poultry Science 1952 31 735-738
40 International Journal of Recirculating Aquaculture Volume 5 June 2004
Hematology and Blood Chemistry of Yellow Perch (Percaflavescens)
NCCLS National Committee for Clinical Laboratory Standards 1992 How to Define Determine and Utilize Reference Intervals in the Clinical Laboratory Proposed Guidelines NCCLS Document C28-P Villanova PA USA
Nelson JA Mitchell GS Blood Chemistry Response to Acid in Yellow Perch (Perea flavescens) Comparison of Populations from Naturally Acidic and Neutral Environments Physiological Zoology 1992 65 493-514
Nelson JA Magnuson J J Chulkasem W Blood Oxygen Capacity Differences in Yellow Perch (Percaflavescens) from Northern Wisconsin Lakes Differing in pH Canadian Journal of Fisheries and Aquatic Sciences 1988 45 1699-1704
Ram-Bhaskar B Srinivasa-Rao K Influence of Environmental Variables on Hematology and Compendium of Normal Hematological Ranges of Milkfish Chanos chanos (Forskal) in Brackish Culture Aquaculture 1989 83 123-136
Reed AH Henry RJ Mason WB Influence of Statistical Method Used on the Resulting Estimate of Normal Range Clinical Chemistry 1971 17 275-284
Schmitz M 1999 Comparative Growth of All-Female Versus Mixed Sex Yellow Perch (Percaflavescens) in Recirculating Aquaculture Systems MS Thesis Virginia Tech Blacksburg VA USA
Toneys ML Coble DW Mortality Hematocrit Osmolality Electrolyte Regulation and Fat Depletion of Young-of-the-Year Freshwater Fishes under Simulated Winter Conditions Canadian Journal of Fisheries and Aquatic Science 1980 37 225-232
van den Heuvel MR Power M Richards J MacKinnon M Dixon DG Disease and Gill Lesions in Yellow Perch (Percaflavescens) Exposed to Oil Sands Mining-Associated Waters Ecotoxicology and Environmental Safety 2000 46 334-341
Wedemeyer GA Nelson NC Statistical Methods for Estimating Normal Blood Chemistry Ranges and Variance in Rainbow Trout (Salmo gairdneri) Shasta Strain Journal of the Fisheries Research Board of Canada 1975 32 551-554
International Journal of Recirculating Aquaculture Volume 5 June 2004 41
Hematology and Blood Chemistry of Yellow Perch (Percajlavescens)
Zinkl JG Avian Hematology In Schalms Veterinary Hematology (4th edition) Jain NC (Ed) 1986 Pages 256-260 Lippincott Williams amp Wilkins Philadelphia PA USA
42 International Journal of Recirculating Aquaculture Volume 5 June 2004
Hatchery and Grow-out Performance of Sunshine Bass and Backcross Hybrid Striped Bass in Recirculating Aquaculture Systems
SR Lindell1bull2 B Delbos1 R Perham1 J Goldman1 EM Hallerman3 TO Brenden3bull4
1 Fins Technology 15 Industrial Road Turners Falls MA 01376 USA
2Current address Marine Biological Laboratory Marine Resources Center 7 MBL Street Woods Hole MA 02543 USA
3Department of Fisheries and Wildlife Sciences (0321) Virginia Polytechnic Institute and State University Blacksburg VA 24061 USA
4Current address Institute of Fisheries Research University of Michigan 1109 N University Avenue Ann Arbor MI 41809 USA
Corresponding authors e-mail ehallermvtedu
Keywords striped bass performance aquaculture growth
International Journal of Recirculating Aquaculture 5 (2004) 43-54 All Rights Reserved copyCopyright 2004 by Virginia Tech and Virginia Sea Grant Blacksburg VA USA
International Journal of Recirculating Aquaculture Volume 5 June 2004 43
Performance of Sunshine Bass and Backcross Hybrid Striped Bass
ABSTRACT Previous research has suggested that backcross hybrid striped bass (BX sunshine bass female x striped bass male) perform as well as F 1 hybrid striped bass (sunshine bass white bass female x striped bass male) for many economically important traits We conducted trials to compare rearing and growth traits of selected backcross hybrid striped bass with hybrid striped bass (HSB) We spawned and reared larval BX fry in two hatchery cycles measured fry growth and performance and compared them to past performance of HSB fry We conducted a grow-out trial of commercially-available hybrid striped bass versus backcross hybrid striped bass in replicated tanks to phase II fingerling size (approximately lOOg) Compared to HSB in the hatchery phase backcross hybrid striped bass exhibited lower fertilization rate comparable swimbladder inflation rate shorter time-to-weaning lower survival comparable growth and comparable condition factor After 60 days HSB exhibited significantly better growth survival and feed conversion efficiency than BX However BX may have better potential market acceptance by virtue of having a lower condition factor appearing longer and less deep-bodied than HSB
INTRODUCTION Striped bass (Morone saxatilis) and its hybrids constitute a major sector of aquaculture in the United States with production of 105 million pounds in 2002 (Carlberg and Van Olst 2003) Commercially significant quantities of Morone stocks also are produced in Taiwan China and Israel Approximately 43 of Morone production occurs in tanks (Carlberg and Van Olst 2003) much of that in recirculating aquaculture systems (RAS) Private and government marketing experts estimate that US production could increase to 50 million pounds and $100 million in annual farm-gate revenue if market prices could be decreased only moderately (Halbrendt et al 1991) Production costs for HSB could be reduced by 12 if selective breeding can yield 20 faster growth rates (Losordo and Westerman 1994)
The majority of Marone production is not of striped bass but of its hybrids with white bass (M chrysops) because of their hardiness rapid growth rate and limited availability of female striped bass broodstock (reviewed by Harrell 1997) Further female WB are considered easier and more predictable to strip-spawn Hence most commercial production
44 International Journal of Recirculating Aquaculture Volume 5 June 2004
Performance of Sunshine Bass and Backcross Hybrid Striped Bass
is of sunshine bass the progeny of the white bass female x striped bass male interspecific cross Research has also been undertaken to evaluate the performance of second generation hybrids and backcrosses Several studies have suggested that the progeny of F 1 hybrid striped bass females backcrossed to striped bass males have merit for commercial production Jenkins et al (1998) compared the performance of backcross hybrids to F1 hybrid striped bass and striped bass to market size in a recirculating system At harvest no differences in growth rate or feed conversion were detected specific growth of BX was intermediate to those of the other stocks with survival lower Tomasso et al (1999) compared performance of F 1 and backcross hybrids between 20 and 90 grams for 56 days in tanks (Tomasso et al 1999) and observed similar survival growth and feed conversion rates among the hybrid types Detailed comparison of the hatchery performance of sunshine and BX hybrids is lacking We hypothesized that use of selected hybrid striped bass and striped bass for the backcross might yield a high-performance BX hybrid Should high performance be realized progressive fish farmers might utilize this approach by selecting the best F1 hybrid females from their own production stocks making the backcross by strip-spawning them and fertilizing the eggs with purchased milt from selectively bred striped bass males (Kerby 1983) thereby obtaining a high-performance production stock that because of selection on the maternal stock is suited to their particular farm conditions
In this study we evaluated the production potential of backcross (BX) hybrid striped bass (female sunshine bass x male striped bass) We compared the hatchery and grow-out performance of BX spawned from select broodstock and sunshine bass (HSB) of common genetic background Specifically we evaluated spawning success hatch rate growth survival and feed conversion efficiency through the first six months of life In order to benchmark our results we ran a trial in replicated tanks with HSB supplied by the most widely-used commercial source of fingerlings (Keo Fish Farms Keo AR USA) and compared their performance with our BX All fish were cultured within intensive controlled-environment recirculating aquaculture systems
International Journal of Recirculating Aquaculture Volume 5 June 2004 45
Performance of Sunshine Bass and Backcross Hybrid Striped Bass
MATERIALS AND METHODS In July 2001 we crossed 4 hybrid striped bass females to each of 4 striped bass males to produce 16 families of backcross hybrid striped bass Poor fertilization rates resulted in a low yield of fry from this spawn However there were enough fry to pool and conduct a pilot commercial-scale hatchery run Randomly-chosen samples from the resulting 4000 fingerlings were used for the grow-out trial
In October 2001 we spawned 3 female HSB with 2 male SB and eventually produced 7000 fingerlings While this was not enough to grow in commercial-scale systems we collected hatchery performance data to corroborate our JulyAugust experience with BX
Fertilized eggs were incubated in McDonald jars Upon hatch the larvae swam out of the hatching jar and into a 1900-L larval rearing tank Replicate larval rearing tanks were stocked with approximately 25 larvae per liter Tanks were maintained with recirculating water and surface oil-skimming pads for the first 5 to 7 days post-hatch until swim-bladder inflation was completed For the second week post-hatch larval rearing tanks were maintained static with gentle central aeration except for an exchange of about 30 of the tank water over the course of two hours each day During the second week post-hatch larvae were fed rotifers enriched with Algamac (Aquafauna BioMarine Inc Hawthorne CA USA) maintained at a density of 10ml By the end of the second week larvae were weaned from rotifers to Artemia nauplii By the end of the third week the larvae were typically weaned from enriched Artemia to artificial feed (Biokyowa Inc Girardeau MO USA) Weaned larvae were graded just once around 60 days post-hatch to remove the top 1 to 2 of larger fish responsible for cannibalism
In November 2001 we purchased lOg fingerlings that represent typical industry-standard HSB from Keo Fish Farms (Keo AR USA) These HSB closely matched the size and weight of our BX from the July spawn for the grow-out trial BX and HSB fingerlings were each stocked separately in triplicate 1900-L round tanks connected to the same recirculating system and reared at 23degC and a salinity of 1-3 ppt All six tanks were similarly stocked initially (approximately 1 kgm3) Fish were offered 80 of their expected ration via belt-feeders and hand-fed to satiation twice a day Approximately every 3 weeks length and weight samples were taken from a randomly-chosen 15 of each tanks
46 International Journal of Recirculating Aquaculture Volume 5 June 2004
Performance of Sunshine Bass and Backcross Hybrid Striped Bass
population At the conclusion of the project the tanks reached typical commercial densities of 5 to 9 kgm3bull
We quantified reproductive and hatchery performance of the three groups including fertilization rate swimbladder inflation rate days to weaning onto artificial feed (ie date of first ingestion to date that gt90 ingested artificial feed) survival estimates to approximately 60 days after hatch and to the end of the study feed conversion rate and monthly average weight and length The trial continued until mid-February 2002 when the HSB averaged approximately lOOg Results from previous years hatchery efforts with HSB using similar rearing protocols were used for comparative purposes
Both the hatchery and grow-out systems employed water recirculation technology including drum-filters fluidized-bed biofilters oxygenation ozonation and automated pH and temperature control that maintained high water-quality standards throughout the trials
Differences in fish weight between the hybrid types were analyzed as a repeated-measures general linear mixed model Residual (restricted) maximum likelihood was used to estimate the model parameters Initial fish biomass in each of the tanks and the amount of feed provided to each of the tanks were included in the model as covariates to assess the influence of these concomitant variables on differences in weight A first-order autoregressive covariance structure was assumed for the repeated-measurements of fish weight
Differences in fish survival at the end of the grow-out trial were analyzed as a general linear model with tanks serving as a blocking factor Because fish survivalmortality is a binary response and thus will violate an assumption of normality the significance of the test comparing survival between the hybrid types was obtained by randomization (number of randomizations= 1000) whereby the F-statistic of the original test was compared to F-statistics obtained by randomly allocating the survival mortality data to the different hybrid types The Type-I error rate for all statistical tests was set equal to 005
International Journal of Recirculating Aquaculture Volume 5 June 2004 47
Performance of Sunshine Bass and Backcross Hybrid Striped Bass
Table 1 Comparison of hatchery traits of backcross (BX) and Fl hybrid (HSB) striped bass for traits of economic interest
Traits of interest BX-HSB BX-HSB HSB HSB HSB
Female parent strain1 AR ARMD AR AR AR
Male parent strain1 MD FL MD FL MD MD FL MD Canada
Spawn date Oct-01 Jul-01 Mar-01 Oct-00 Jan-99
Fertilization 32 22 53 57
Swimbladder inflation 90 50 98 95
Weaning start (DAH)2bull3 24 21 17 22
Weaning end (DAH4 33 32 37 38
Mean wt (g) at 60 DAH 042 052 042 05
Survival to 60 DAH 7 740 104
Mean L (mm) at 30 DAH 133 11 1225
Mean L (mm) at 36 DAH 139 167
Mean L (mm) at 75 DAH 367 404 452
Mean Wt (g) at 75 DAH 074 081 12 0825 11
Condition factor at 1g 123E-05 118E-05 1Strain abbreviations AR=Arkansas R MD=Maryland FL=Florida 2DAH=Days after Hatch 3Weaning start marks the first introduction and ingestion of dry feed to replace live feeds 4Weaning end denotes the time when the transition to dry feeds is complete and live feeds are no longer utilized
RESULTS
Hatchery Trial Results A summary of performance for hatchery traits of production interest for BX and HSB is presented in Table 1
The fertilization rate for the BX eggs was lower than that which we typically found with HSB (22-32 vs 55) and considerably lower than our experience in 2000 when we conducted fertilization trials with BX (80)
Swimbladder inflation rate ranged from 50 in the first hatchery run to 90 in the second run We attribute the low rate in the first run to
48 International Journal of Recirculating Aquaculture Volume 5 June 2004
Performance of Sunshine Bass and Backcross Hybrid Striped Bass
surface-film and system management problems We showed in the second run that swimbladder inflation in BX was comparable to that typically attainable (gt90) for Morone fry
Time-to-weaning onto dry diets was shorter (10 days versus 18 days) and earlier (day 33 versus day 38) for BX than for HSB Survival of BX to 60 days after hatch (7) was lower than expected on the basis of previous experience with HSB (gt10) Mean weights for BX at 60 days after hatch in two hatchery runs (052 and 042g) was similar to those for HSB (042 and 05g) However HSB exhibited greater mean weight than BX at 75 days after hatch (l04 vs 077g)
Condition factor (K) of BX (123 + 009) was not significantly different from those of HSB (119 + 005) or striped bass (l13 + 003) at 1 gram mean weight
Frequencies of deformities for BX (lt2) were lower than those in earlier reports Bosworth et al (1997) reported deformities in 8 of BX and 4 ofHSB
Grow-out Trial Results Overall there was not a significant difference in weight between the hybrid types (F = 606 df = 13 P = 00907) however as evidenced in
100
80
60
40
20
--+- BX - Overall -0- HSB - Overall -ltgt- BX - Individual Tanks A middot middot middotbullmiddotmiddot middot HSB - Individual Tanks fi
fi ~o
12 Dec 2001 3 Jan 2002 24 Jan 2002 12 Feb 2002
Date Figure 1 Meanfish weight(plusmn 2 SE) at each time period for backcross hybrid striped bass (BX) and hybrid striped bass (HSB) Also shown is meanfish weight at each time periodor groups in individual tanks
International Journal of Recirculating Aquaculture Volume 5 June 2004 49
Performance of Sunshine Bass and Backcross Hybrid Striped Bass
Figure 1 there was a significant interaction on fish weight by hybrid type and time (F = 5157 df = 1587 P lt 00001) Using the slicing option available in SAS (SAS Institute 1999) we tested for differences in weight between the hybrid types for each time period and found that although weights of HSB and BX were not significantly different during the first two measurement periods (Time 1 F = 027 df = 1587 P = 06032 Time 2 F = 036 df = 1587 P = 05496) the hybrid types did differ in weight during the last measurement periods Specifically HSB were significantly heavier than BX on the 24th of January 2002 (F = 1061 df = 1 587 P = 00032) and the 12th of February 2002 (F = 3788 df = 1587 P lt 00001) Overall HSB had a specific growth rate of 268 per
Table 2 Mean weights of backcross hybrid striped bass (BX) and hybrid striped bass (HSB) over the course of a 3-month growth trial
Date BXTank5
Wt(g) SE
112101 1228
BXTank6 Wt(g) SE
1201
BX Tank 12 Wt(g) SE
1274
HSB Tank 13 HSB Tank14 HSB Tank 15 Wt(g) SE Wt(g) SE Wt(g) SE
1180 1016 1088
1211201 1744 102 1778 095 1658 096 1798 109 1752 118 1704 109
1 302 27 60 1 38 28 76 155 27 04 154 3306 157 3424 149 3414 211
1 2402 4196 252 4424 207 4882 299 6344 263 6192 326 6432 362
212102 6332 317 6763 334 6912 299 9474 473 9553 452 10500 388
Table 3 Comparison of survivalfeed conversion ratio (FCR) and condition factor at 60 grams for backcross hybrid striped bass (BX) and hybrid striped bass (HSB)
Cross Tank
Starting
Ending
Survival
BXS
160
136
85
BX 6 BX 12 HSB 13 HSB 14 HSB 15
160
138
86
161
137
85
178
177
99
179
173
97
180
179
99
Starting Biomass (g) 1964 1922 2051 2100 1819 1958
Ending Biomass (g) 8612 9334 9469 16770 16526 18795
Feed Fed(g) 12106 12135 11447 18041 17805 20463
FCR 182 164 154 123 121 122
Condition Factor 168E-05 166E-05 169E-05 194E-05 193E-05 208E-05
SE 353E-07 337E-07 424E-07 255E-07 327E-07 845E-07
50 International Journal of Recirculating Aquaculture Volume 5 June 2004
Performance of Sunshine Bass and Backcross Hybrid Striped Bass
day while BX had a specific growth rate of 205 per day Neither of the covariates included in the model were found to have a significant effect on weight differences (initial tank biomass F = 142 df = 1587 P = 02332 amount of feed F = 005 df = 1587 P = 08165)
Performance regarding key economic traits-survival feed conversion efficiency and condition factor-are summarized in Table 3 At the end of the grow-out trial survival of HSB was significantly greater than that of BX (F = 6216 df = 1 1014 P lt 00001) Feed conversion ratio was better for HSB (122) than for BX (166) Condition factors for BX were lower than those for HSB (l68 vs 198) meaning that BX appeared longer and less deep-bodied than HSB
DISCUSSION Our data showed that F1 HSB performed as well or better than BX for a range of hatchery- and grow-out-related traits
Hatchery traits Fertilization rates for backcross lots were approximately half that for HSB There was a wide variance for fertilization and hatch rates of eggs from HSB females Some of this variance may be due to differences in hatchery protocols (different hormone injections used strip vs tank spawning) at the commercial hatcheries where the data were collected (TIJ Smith personal communication) Poor hatch rates also may be attributable in part to hybrid breakdown that is to developmental incompatibilities among the genomes of the respective species when coadapted gene complexes are broken up at meiosis in the F1 (Hallerman 2003)
In the hatchery trial we hypothesize that the low swimbladder inflation rate for our J~ly fry resulted from offering first feed to the BX too early When rearing HSB and SB fry we typically wait until the yolk sac has been largely resorbed and the fry mostly have inflated their swimbladders before we introduce live feed This is because live feed can cause an oily film on the water surface that interferes with a frys successful ingestion of air bubbles necessary to inflate the swimbladder (Chapman et al 1988) The timing of swimbladder inflation varies with fry type and temperature with HSB typically inflating between 3 and 6 days after hatch and SB 6 to 9 days after hatch BX fry inflate their swimbladder at an intermediate time 5 to 8 days after hatch (DAH) Since for the July
International Journal of Recirculating Aquaculture Volume 5 June 2004 51
Performance of Sunshine Bass and Backcross Hybrid Striped Bass
spawn we introduced feed into their tanks at the time prescribed for HSB (at 5 DAH) BX fry may have had a reduced opportunity to inflate their swimbladders because of interference by a surface film with air contact In the October spawn we monitored swimbladder inflation more carefully and introduced live feed on day 7 after almost 90 of swimbladders were inflated The low swimbladder inflation rate in the July hatchery run of BX may have had a direct impact on survival Larvae without inflated swimbladders expend more energy swimming exhibit reduced growth rates are less tolerant of stress and often sink to the tank bottom and die (Van Heukelem et al 2000)
BX were weaned more quickly and earlier onto dry diets than HSB which may have helped contribute to their ability to match the size and weight of HSB at 60 DAH Earlier weaning has economic merit since dry diets are generally cheaper and easier to feed than brine shrimp
Grow-out traits After 60 days post-hatch the growth and other performance differences between BX and HSB became more evident HSB exhibited significantly better growth survival and feed conversion ratios
We hypothesized that backcross hybrid striped bass might grow as fast or faster than the standard commercially-available F 1 hybrid striped bass if high-performance HSB females were selected as broodstock Our data regarding performance in intensive tank systems did not support this hypothesis Rather our observations accord with the classical view that the high performance of some interspecific hybrids is largely due to heterosis and that because the heterosis shown by an F 2 or backcross hybrid is only half that shown in an F1 (Falconer and Mackay 1996 p 257) that advanced generation hybrids would not perform as well as F1
hybrids Indeed F 2 HSB previously showed low hatch rates low larval survival and high variability of growth rate (Smith and Jenkins 1984 Smith et al 1985) Our results suggest that the heterosis expressed in HSB for growth and performance was greater than the selective breeding advantage we employed by crossing high performance HSB females with male striped bass Apparently the additive genetic variance contributed by the HSB and striped bass selected for size-at-age could not make up for the loss of dominance variance
BX may have better potential market acceptance by virtue of having a lower condition factor appearing longer and less deep-bodied than HSB more
52 International Journal of Recirculating Aquaculture Volume 5 June 2004
Performance of Sunshine Bass and Backcross Hybrid Striped Bass
like striped bass that are more familiar in many markets Fins Technologys market experience has shown that the premium-priced live markets prefer longer leaner fish such as the backcross There is the possibility that because of later maturity backcross hybrid striped bass may grow to larger sizes than hybrid striped bass This is attractive because there is an unserviced demand for larger (1 kg+) fish that can provide portion-controlled 7-9 ounce fillets for the restaurant and retail markets
ACKNOWLEDGEMENTS This project was supported by US Department of Agriculture-Small Business Innovation Research Program Phase I Grant no 2001-00373 EMH is supported by the USDA-CSREES Hatch Program and the Commonwealth of Virginia Aquaculture Initiative
REFERENCES Bosworth BG Libey GS Notter DR Egg Larval and Fingerling
Traits of Crosses among Striped Bass White Bass and their Fl Hybrids Aquaculture 1997 154 201-217
Carlberg J Van Olst J US Production and Sales of Hybrid Striped Bass (1987-2002) 2003 httpaquanicorgsbgaHSBversion5ppt
Chapman DC Hubert WA Jackson UT Influence of Access to Air and of Salinity on Gas Bladder Inflation in Striped Bass Progressive Fish-Culturist 1988 50 23-27
Falconer DS Mackay TFC 1996 Introduction to Quantitative Genetics Fourth Edition Longman Group Ltd Harlow Essex UK
Halbrendt CK Wirth FF Vaughn GF Conjoint Analysis of the Mid-Atlantic Food-Fish Market for Farm-Raised HSB Southern Journal of Agricultural Economics 1991 23 155-163
Hallerman EM Coadaptation and Outbreeding Depression In Po_pulation Genetics Principles and Applications for Fisheries Scientists Hallerman E (Ed) 2004 American Fisheries Society Bethesda MD USA
Harrell RM Hybridization and Genetics Striped Bass and Other Morone Culture In Harrell RM (Ed) 1997 Pages 217-234 Elsevier Science Amsterdam
International Journal of Recirculating Aquaculture Volume 5 June 2004 53
Performance of Sunshine Bass and Backcross Hybrid Striped Bass
Jenkins WE Heyward LD Sr Smith TIJ Performance of Domesticated Striped Bass Marone saxatilis Palmetto Bass and Backcross Hybrid Striped Bass (Sunshine Bass Female x Striped Bass Male) Raised in a Tank Culture System Journal of the World Aquaculture Society 1998 29 505-509
Kerby JH Cryogenic Preservation of Sperm from Striped Bass Transactions of the American Fisheries Society 1983 112 86-91
Losordo TM Westerman P An Analysis of Biological Economic and Engineering Factors Affecting the Cost of Fish Production in Recirculating Aquaculture Systems Journal of the World Aquaculture Society 1994 25 193-203
SAS Institute 1999 The SAS System for Windows version 82 SAS Institute Cary NC USA
Smith TlJ Jenkins WE Controlled Spawning of Fl Hybrid Striped Bass (Marone saxatilis x M chrysops) and Rearing of F2 Progeny Journal of the World Mariculture Society 1984 15 147-161
Smith TlJ Jenkins WE Snevel JF Production Characteristics of Striped Bass (Marone saxatilis) and Fl - F2 hybrids (Marone saxatilis and M chrysops) Reared in Intensive Tank Systems Journal of the World Mariculture Society 1985 16 57-70
Tomasso JR Kempton CJ Gallman A Smith TlJ Comparative Production Characteristics of Sunshine Bass and Sunshine Bass x Striped Bass in Recirculating-Water Systems North American Journal of Aquaculture 1999 61 79-81
Van Heukelem WF Harrell RM Hughes SG Lindell SR Friedmann BR Optimal Conditions for Swimbladder Inflation in Striped Bass Larvae Reared in Intensive Systems Northeast Regional Aquaculture Center Publication No 00-006 (2000) 5 pages
54 International Journal of Recirculating Aquaculture Volume 5 June 2004
Book Review
Fjofish apd Shellfish Bacteriology Mapua) Techpjques apd Procedures KA Whitman with contributions by NG MacNair
Iowa State Press (Blackwell Publishing Professional) Ames IA USA (2004) 288 pages ISBN 0813819520 US $4999
Reviewed by Rocco C Cipriano United States Geological Survey National Fish Health Research Laboratory 11649 Leetown Road Kearneysville WV 25430 USA E-mail rocco_ciprianousgsgov
Despite the fact that several good texts have been published regarding the description and nature of bacterial pathogens in aquatic animals there remained a need for a comprehensive yet practical guide devoted to techniques and procedures used for bacterial identification Diagnosis and detection of fish and shellfish pathogens often requires reliance upon standard microbiological media tests and reagents for some bacteria but more specialized assays are required for many aquatic pathogens In the latter case the products necessary for such assays are not commercially available and must be produced in aquatic animal diagnostic facilities from their basic ingredients Often therefore the compositions of differential media and the conduct of certain tests for the primary isolation or detection of specific aquatic pathogens are only available by referencing the general body of published scientific literature Hence until now there has not been a single-source shelf-volume that combines standard microbiological procedures used for routine detection and identification of medically important bacteria with the specialized needs of the fisheries profession This manual however helps to fill that void
The manual stands as a reference suitable for professional aquatic biologists with backgrounds in microbiology veterinarians and students of aquatic animal health Its strength lies in its coverage of the subject matter regarding culture-based diagnosis and identification of bacteria associated with finfish bivalves and lobsters Sections on
International Journal of Recirculating Aquaculture 5 (2004) 55-56 All Rights Reserved copyCopyright 2004 by Virginia Tech and Virginia Sea Grant Blacksburg VA USA
International Journal of Recirculating Aquaculture Volume 5 June 2004 55
Book Review FiQish and ShelJfish Bacteriology Manualmiddot Techniques and Procedures
aseptic collection and shipment of samples qualitative and quantitative procedures for bacterial isolation staining techniques media and standard biological tests used for the cultivation and phentotypic characterization of pathogenic bacteria and antibiotic sensitivity testing provide sound background for the student or novice practitioner Particularly beneficial for anyone who is not experienced with aquatic microbial pathogens is the section listing principal organs media and appropriate incubation temperatures to be used as the most probable sources of isolation for the specific bacteria
More experienced professionals will find it helpful and convenient to have the descriptions and interpretations of differential media (eg Coomassie Brilliant Blue Agar for Aeromonas salmonicida Rimler-Shotts Agar for Aeromonas hydropila Cytophaga Agar Shieh and TYES for Flavobacterium spp and Edwardsiella ictaluri Agar and various other media for Renibacterium salmoninarum) listed in a single source The major identifying criteria that phenotypically characterize selected bacterial pathogens are also described in tabulated form Specialized tests such as the SIF test to detect covert infections nurse culture techniques for enhanced bacterial growth and assays for public health indicator organisms in bivalves are documented Sections covering serology immunoassay and non-cultured based molecular assays (eg polymerase chain reaction) are also presented but are not as completely summarized as those for bacterial isolation In summary the nature of this manual makes it appropriate for frequent use as a practical laboratory guide
56 International Journal of Recirculating Aquaculture Volume 5 June 2004
Subscription Information
International Journal of Recirculating Aquaculture
A publication ofVirginia Tech and the Virginia Sea Grant College Program
IJRA presents the latest developments in RAS-related research focusing on the areas of
Food Quality Pathology
Food Safety
Aquatic Medicine Breeding amp Genetics Waste Management
FishShellfish Growth amp Nutrition Recirculating Systems Mgmt Marketing amp Economics Water Conservation
Dont miss an issue of this informative peer-reviewed journal Subscribe now using your credit card by calling 540-231-2075 or by printing out a form at wwwcfastvteduijrahtml If you prefer you can also mail this form to the address below along with a check or money order
Name ----------------~ Address ----------------Line2 ------------------City ____________ State __ _ Country Postal Code ___________ _ Phone Fax -------- --------e-mail-----------------check _ 2 year ($25 US)
International Journal of Recirculating Aquaculture Food Science amp Technology Building (0418)
Virginia Polytechnic Institute and State University Blacksburg VA 24061
phone (540) 231-2075 fax (540) 231-9293 e-mail IJRAvtedu
International Journal of Recirculating Aquaculture Volume 5 June 2004 57
~ International Journal of ~ Recirculating Aquaculture A publication of Virginia Tech and the Virginia Sea Grant College Program
Instructions for Authors The International Journal of Recirculating Aquaculture (IJRA) encourages the submission of original high-quality papers on research in all aspects of recirculating aquaculture Papers will be peer-reviewed and evaluated for scientific merit relevance and for their usefulness in promoting the advancement of recirculating aquaculture Complete coherent projects are preferred Any related papers submitted together must be thoroughly cross-referenced All papers must be original meaning that the data and the information presented must be the work of the authors and can not have been published elsewhere Dual publication of a paper or data is possible only through the permission of the Editors of both journals THERE ARE NO PAGE CHARGES for IJRA submissions
INITIAL MANUSCRIPT SUBMISSION Manuscripts should be sent to Ms Angela Correa Managing Editor by mail using the address listed at the end of these instructions or by e-mail to (ijravtedu) Submit four (4) copies of each manuscript if regular mail is used All manuscripts must be in English Dot matrix type is not acceptable and all such submissions will be returned without review Each submission must include a cover letter stating that the paper contains original research and that the information has not been published elsewhere E-mailed submissions must be saved in doc format Be sure to include the names of colleagues who have already reviewed the work presented IJRA has two categories for submission 1 Articles which are complete in-depth scientific studies and 2 Notes which are short papers of limited scope Articles and notes will be critically reviewed by two or three experts as well as by the Managing Editor Submissions may be returned without peer review in cases where the Managing Editor determines that they are inappropriate for the journal of poor quality poorly written or fail to follow the journals style format
PREPARATION OF MANUSCRIPTS IJRA uses the latest editions of Websters New International Dictionary and Websters New Collegiate Dictionarv for standard spellings and word definitions All spelling will be in American English Foreign or science-related terminology that is unfamiliar and does not appear in these dictionaries will require an accompanying definition Acceptable scientific and common names of fishes are listed in A List of Common and Scientific Names of Fishes from the United States and Canada published by the American Fisheries Society Common names may be used throughout each paper but must be accompanied by a full scientific name when they first appear in a paper The author must use the full common name eg yellow perch not perch All foreign language words should be italicized in the manuscript
In the manuscript number each page sequentially and include the senior authors name next to the page number (eg Page 4 Jahncke) on each page Single-space all typed material including references Type size in the body of the text should be no larger than 12pts and no smaller than 10 pts Subsection headings should also be italicized in the manuscript Spell out one-digit numbers except when they are used with units of measure - eg six ponds 7 days
International Journal of Recirculating Aquaculture Volume 5 June 2004 59
Spell out any number that begins a sentence When two numbers occur sequentially in the text one of the numbers must be spelled out- eg In 1987 fifty fish were stocked Use commas in numbers of 1000 or more Use the 24-hour clock to describe time- eg 1300 not 100 pm
Keep footnotes to a minimum and number them sequentially throughout the paper All units of measurement must be reported via the metric system except in special circumstances (eg horsepower) Standard scientific abbreviations and symbols may be used without definition If the use of a symbol could cause confusion define the symbol the first time it is used On the final draft of a paper that has been accepted for publication Greek letters or other extraneous symbols that do not appear on a keyboard the name of the symbol should be noted where the symbol is used to help eliminate prepress errors Parts per million or milligrams per liter can be
-1 reported as either ppm or mgI but not as mgI
Commonly used aquaculture jargon can be used without defining the term - eg fry fingerling hapa Less commonly used jargon may also be used but terms should be defined the first time they are used Jargon from fields outside of aquaculture should also be defined the first time they are used Always place a zero to the left of a decimal point if the number is less than one this includes probability values - eg P = 005 not P = 05
COMPONENTS OF THE MANUSCRIPTS Articles and notes should include a title names of authors and their addresses abstract introduction materials and methods results discussion (or a combined results and discussion) conclusion (rarely) acknowledgements (if any) references figures and tables in that order Each section should start on a new page
Title - The title should accurately reflect the contents of the paper Brief concise titles are encouraged The title page must include the name(s) of the author(s) and all addresses
Abstract - The abstract should be a concise highlight of the results and conclusions Methodology should not be abstracted unless it is necessary to explain the results or unless the paper describes a new technique Abstracts should be less than 300 words
Introduction - The introduction should explain why the paper was written and why it should be read The introduction should condense the relevant information in the field that led the author to do the research The introduction is not a complete literature review and only the most relevant references should be cited The introduction should also contain a statement that describes the purpose or objective of the paper
Materials and Methods - The underlying goal of this section is to describe what was done so that others can repeat the experiment If previously published papers described a technique that was used they can be cited to prevent unnecessary repetition If the technique or process was modified the modification must be described so that others can repeat the process Experimental designs can be explained by use of figures if they will help clarify what was done If the experiment was a complicated one with many subparts subsections may be used to describe each subpart
Results - This section describes the data Proper use of tables and figures can simplify and help explain the results Statistical analysis of data is necessary unless differences are so obvious that statistical analysis is superfluous Although probability values of 005 and 001 are traditionally used each author is free to choose his or her own level of significance
60 International Journal of Recirculating Aquaculture Volume 5 June 2004
Discussion - This section should interpret the results and compare the results from this experiment to those found in similar research The section can also be used to speculate about the results to provide reasons for the trends and to suggest new ideas that can advance our understanding about aquaculture This section should not be a literature review section that merely compares results among several papers
Results and Discussion - Results and discussion sections can be combined In most cases this leads to a better paper because the integration of these sections leads to a more meaningful interpretation of data
Conclusion - This section should be used only when the results of an experiment lead to an unequivocal interpretation
Acknowledgements - This section should be used to thank organizations that supported the research monetarily and individuals who assisted in the research or preparation of the paper This section includes manuscript number designations for those institutions that assign such numbers
References - Select references with great care Unless the paper includes a literature review there is no need to reference every paper written about a subject Use only the most important ones
Figures and Tables - All figures andtables go after the references Figures always go before tables
Section headings (eg Materials and Methods) should be capitalized and in bold type Secondary headings should be balded and go flush left Tertiary headings are incorporated into the first paragraph of that subsection Tertiary headings are italicized and separated from the text by a double dash
In the text references are cited in one of two ways 1 Swingle (1959) evaluated two species of tilapia or 2 pond culture in Alabama began in the 1950s (Swingle 1959) When there are three or more authors list only the first in a citation and follow that with et al eg Smitherman et al (1983) reviewed catfish breeding work at Auburn University If the name of an institutional author is long it can be abbreviated in a citation eg Food and Agriculture Organization of the United Nations may be abbreviated as FAO When several citations are used in a single entry they are listed chronologically If you are citing two papers that were written by the same author(s) the name only has to appear once per citation followed by the years that designate the different papers Separate the years with a comma If you are citing two authors you must separate the citations with a semicolon (Smith 1975 1976 Jones 1976)
In the reference section the reference list is strictly alphabetical by last name of the senior author and then by initials if two authors have identical last names If an author has written more than one paper the following format should be followed All single authored papers go first followed by co-authored papers and then the papers that were written by three or more authors If an author has written more than one single-authored paper the papers are listed chronologically If an author has written more than one co-authored paper they are listed alphabetically by the second authors last name If a tandem has authored two or more papers the order is chronological Papers written by the same group of three or more authors should be listed chronologically
International Journal of Recirculating Aquaculture Volume 5 June 2004 61
The following format will be used when referencing various works
PAPERS Single-author papers
McGinty AS Effects of Size at Stocking on Competition and Growth of All-Male Tilapia Hybrids Journal of the World Aquaculture Society 1985 16 52-56
Multiple-author papers Tave D Smitherman RO Predicted Response to Selection for Early Growth in Tilapia nilotica Transactions of the American Fisheries Society 1980 109 439-445
If an author has published two or more papers in the same year follow the years with a letter to differentiate them eg Smith 1988a 1988b Use issue numbers only when each issue starts out with page 1 If pagination is consecutive throughout the volume omit the issue number Spell out journal names in their entirely without abbreviations
Papers in proceedings or in edited volumes Nicholson LC Woods LC Ill Woiwode JG Intensive Culture Techniques for the Striped Bass and its Hybrids In Culture and Propagation of Striped Bass and Its Hybrids Harrell RM Kerby JH Minton RV Eds 1990 American Fisheries Society Bethesda MD USA
Books and reportspublications from governmental or non-governmental bodies
Lovell T 1989 Nutrition and Feeding of Fish Van Nostrand Reinhold New York NY USA
Food and Agriculture Organization of the United Nations (FAO) Fisheries Department 1997 Review of the State of World Aquaculture No 886 FIRlC886 FAO Rome Italy
Theses and Dissertations
Easter CC 1992 Water Chemistry Characterization and Performance of a Recirculating Aquaculture System Producing Hybrid Striped Bass Masters thesis Virginia Polytechnic Institute and State University Blacksburg VA USA
Websites
Federation of European Aquaculture Producers (FEAP) European Eel Production (httpwwwfeaporgeelshtml) 2002
Page numbers for proceedings books theses and dissertations are unnecessary Government publications should be treated as if they were books but document numbers must be included THE ACCURACY OF REFERENCES IS THE SOLE RESPONSIBILITY OF THE AUTHORS MAKE SURE THAT CITATIONS AND REFERENCES MATCH
Tables - When creating a table decide what the purpose of the table is and what points are important then organize the table so that the main features can be easily understood The table heading should provide sufficient information for the table to be understood as an entity Keep footnotes to a minimum Each table goes on a separate page Tables must be camera ready TABLES WILL BE PRINTED AS IS AND WILL NOT BE TYPESET Figures - List all figure captions on separate pages Original artwork doesnt have to be submitted when a paper is first submitted for review but original artwork must accompany the final revised manuscript Good quality photocopies are acceptable when a manuscript
62 International Journal of Recirculating Aquaculture Volume 5 June 2004
is submitted for review Graphs and original artwork must be printed with a laser printer or done in pen and ink Dot-matrix figures are not acceptable Original artwork or high-contrast photographs are acceptable Label all figures on the back with a soft pencil name of senior author paper title and figure number
Photographs - Should be on glossy paper with good contrast Do not glue pictures to cardboard Color photographs can be printed but the additional cost of printing them will be charged to the author Label all photos on the back with a soft pencil name of senior author paper title and figure number
FINAL REVISED MANUSCRIPTS If using the mail submit two copies of the final revised manuscript including original artwork Submit either the original pen-and-ink drawings or laser-printed versions of the drawings In addition submit the manuscript on a disk (CD preferable) or by e-mail On the disk write the brand name of the computer or word processor the word processing program that was used (should be Microsoft Word) the title of your article and the file name NOTE Disk and hard copy must agree In case of discrepancies it is the policy of IJRA to follow hard copy An electronic version of the completed manuscript is needed in order to publish AUTHORS MAY NOT RECEIVE PAGE PROOFS Proofreading will be done by the Production Office of IJRA using the revised final version of the manuscript Therefore authors must be especially careful that no errors exist in the final revised version because in most cases no changes are possible after it is submitted
REPRINTS The senior author will receive two copies of the journal and a pdf file of the article for distribution and reprinting purposes The junior author(s) will also receive two copies of the journal issue These are sent several weeks after the journal is published and in circulation Requests for the pdf format of the article can only be made by the corresponding author
COPYRIGHT amp PERMISSIONS For permission to reprint articles that have appeared in IJRA please contact IJRA Copyright amp Permissions Food Science amp Technology Building (0418) Virginia Tech Blacksburg VA 24061 USA
COPYRIGHT TRANSFER If your manuscript is accepted for publication copyright ownership must be officially transferred to IJRA The Editors acceptance letter will include a form fully explaining this The form must be signed by all authors and the original returned to the Editor at this time Failure to return the copyright form in a timely fashion will result in delay in publication
Send your submissions to International Journal of Recirculating Aquaculture
AI Correa Managing Editor 27-B Food Science and Technology Building (0418) Virginia Polytechnic Institute and State University Blacksburg VA 24061 USA
If you have any questions please feel free to contact us Phone (540) 231-2075 Fax (540) 231-9293 e-mail ijravtedu
International Journal of Recirculating Aquaculture Volume 5 June 2004 63
Hematology and Blood Chemistry of Yellow Perch (Percaflavescens)
and veterinary medicine to diagnose and predict the outcome of disease and to monitor the effect of therapeutic nutritional and environmental management Blood analysis is not used extensively as a diagnostic tool in fish medicine partly due to the lack of reference intervals for various fish species and also because changes associated with specific diseases and metabolic disorders are not well characterized With sufficient background data clinical analysis of individual blood samples could detect infectious diseases metabolic disorders and sub-lethal disease states affecting production performance
Hematological and plasma biochemistry data from diseased individuals can be evaluated by direct comparison to a reference interval which is the appropriate range of variation in a blood parameter from a defined population of individuals under specific conditions The reference interval needs to be determined on a sufficient number of normal healthy individuals under similar production conditions using standardized analytical techniques (NCCLS 1992) When the deviation in a blood parameter is large enough to fall outside the reference interval it indicates the value may be aberrant and is most likely not due to individual variation for a given fish
Few previous studies have determined blood parameters for yellow perch (Toneys and Coble 1980 Nelson et al 1988 Nelson and Mitchell 1992 van den Heuvel et al 2000) These studies are of limited relevance as they were primarily toxicological studies and only a few blood parameters were determined and also because blood samples were collected and handled by differing methods prior to determination of the blood value Some of the capture (hook and line and gill netting) and blood collection methods (severing the caudal peduncle) used in these studies are also unsuitable for diagnostic blood samples as they result in significant alteration in the blood which will mask diseased states The study with the closest sampling procedure to that used in our experiment only presented selected blood chemistry values for yellow perch after 16 hours of moderate or exhaustive exercise (Nelson and Mitchell 1992) Therefore although the previous studies on yellow perch hematology are helpful in determining the effects of environmental factors and stress they have limited diagnostic utility and even prevent meaningful comparison with the data presented in this paper
The average mean weight of the yellow perch used for the hematological determinations was 125 +- 14g with a total length of 223 +- 08 cm For
34 International Journal of Recirculating Aquaculture Volume 5 June 2004
Hematology and Blood Chemistry of Yellow Perch (Percajlavescens)
the biochemical determinations the fish had a weight of 121 +- 15g and length of 226 +- 08 cm The results of the hematological determinations from 52 fish are listed in Table 2 Values for plasma chemistry reference intervals determined on 42 samples are listed in Table 3 Overall both the hematological and plasma chemistry values were similar to those reported previously for hybrid striped bass and tilapia reared in recirculation systems (Hrubec et al 1996 2000 Hrubec and Smith 2000) The striped bass and tilapia from production systems exhibited wider ranges in value for the different leukocyte types increased numbers of reticulocytes increased plasma and total protein values increased creatinine values and a decreased plasma chloride concentration as compared to fish in lower density recirculation tanks We did not compare blood values from the production yellow perch in this study to yellow perch maintained in low-density tank settings so were unable to determine if these same trends are apparent in yellow perch as well However based on our previous experience with fish hematological and plasma biochemical values there is an indication that these trends are occurring in yellow perch as well
Table 2 Hematological reference intervals for adult yellow perch (Perea flavescens) reared in a recirculation system
Analyte N Reference Interval Mean Stds1
PCV2 () 57 29-47 388 45
Plasma Protein (gdl) 57 60-82 67 06
Erythrocytes (x 106ml) 53 2160-3345 2737 0356
Leukocytes (ml) 53 52590-186490 113914 39086
Lymphocytes (ml)
Small 53 36800-153420 85630 31728
Large 53 3530-23 130 11602 5359
Neutrophils (ml) 53 1860-35950 12430 8837
Monocytes (ml) 53 670-12640 4252 2874
Thrombocytes (ml) 53 38270-118510 72972 21299 1Standard deviation 2Packed cell volume
International Journal of Recirculating Aquaculture Volume 5 June 2004 35
Hematology and Blood Chemistry of Yellow Perch (Perea flavescens)
Table 3 Plasma biochemical values for adult yellow perch (Percaftavescens) reared in a recirculation system
Analyte N Reference Interval Mean Stds1
Total Protein (gdl) 42 37-50 45 04
Albumin (gdl) 42 06-09 07 01
Globulin (gdl) 42 31-42 37 03
Creatinine (mgdi) 42 04-10 06 01
Total bilirubin (mgdi) 42 03-04 03 01
ALP2 (UI) 42 50-114 822 249
AST3 (UI) 42 2-29 85 64
Glucose (mgdi) 42 62-181 1000 350
Cholesterol (mgdi) 42 182-323 2440 330
Sodium (mEqI) 42 138-153 1470 40
Potassium (mEqI) 42 20-38 32 05
Chloride (mEqI) 42 119-133 1260 40
Calcium (mEqI) 42 86-120 103 13
Phosphorus (mEqI) 42 50-96 74 11
Magnesium (mEqI) 42 17-34 27 04 1 Standard deviation 2 Alkaline phosphatase 3 Aspartate aminotransferase (SGOT)
The blood cells present in the yellow perch were typical of teleost fish and included erythrocytes thrombocytes and leukocytes (Fig 1) Erythrocytes were oval to round with characteristic red cytoplasm and an elongate and centrally-located nucleus Immature erythrocytes or reticulocytes demonstrated a blue-purple tinge to the normal eosinophilic cytoplasm (Fig IA B C) The yellow perch had increased numbers of reticulocytes (included in the erythrocyte count) with approximately 7 to 10 per field at lOOx oil immersion compared to what we observe for most fish species The cause for the apparent reticulocytosis is not known but has been observed in other fish species exposed to elevated nitrite and nitrate (Grabda et al 1974 Hrubec et al 1996 2000 Hrubec and Smith 2000)
36 International Journal of Recirculating Aquaculture Volume 5 June 2004
Hematology and Blood Chemistry of Yellow Perch (Perea flavescens)
T bull middotmiddot ~~ - middot
N -
Figure I Characteristic blood cells from yellow perch reared in recirculation systems Blood smears were made with EDTA anticoagulated blood stained with Wrights Geimsa stain Cells are abbreviated as follows U - Large lymphocyte SL - small lymphocyte T - thrombocyte R - reticulocytes (immature erythrocyte) PC - plasma cell (activated lymphocyte) M- monocyte N-neutrophil The blue bar in frame A is Omm
International Journal of Recirculating Aquaculture Volume 5 June 2004 37
Hematology and Blood Chemistry of Yellow Perch (Percajlavescens)
The thrombocytes were slightly smaller than the erythrocytes (Fig IA) They had clear cytoplasm and were variable in shape being elongated pyriform oval or round Nuclear shape tended to follow cytoplasmic shape although oval and round thrombocyte nuclei occasionally were lobulated (Fig IB) as described for striped bass and tilapia (Hrubec et al 1996 2000)
Leukocytes made up the remainder of the cell types seen in the blood and included small and large lymphocytes neutrophils and monocytes No eosinophils or heterophils were observed Small lymphocytes were the smallest cell present with a rim of blue cytoplasm surrounding the round nucleus (Fig IA E F) Large lymphocytes had an abundant and darker blue cytoplasm and the nucleus was larger than observed in the small lymphocyte (Fig IA E) Plasma cells were occasionally observed with a classic open nucleus abundant dark blue cytoplasm and a clear cytoplasmic region adjacent to the nucleus presumably representing the Golgi as in mammalian plasma cells (Fig IC) Plasma cells were included in the large lymphocytes category for the differential counts
Neutrophils were the largest cell present in the blood (Fig ID E F) The cytoplasm of the neutrophil was a translucent grey containing no granules and infrequent vacuoles Cytoplasmic shape was round to angular as the cellular borders often appeared slightly adherent to adjacent erythrocytes distorting cellular shape Nuclear shape of the neutrophil varied from round to horseshoe shaped and frequently segmented into two prominent lobes connected by a thin nuclear bridge (Fig IF) Monocytes had abundant dark blue cytoplasm that was frequently vacuolated (Fig ID) The round to kidney-bean shaped monocyte nucleus was large with prominent chromatin clumping
Analysis of blood parameters can provide a wealth of information useful in analyzing the effects of disease and sub-optimal environmental conditions Providing reference intervals for healthy adult yellow perch reared in recirculation systems furnishes veterinarians and fish health professionals the foundation to develop diagnostic hematology for this species The number of studies that determine actual reference intervals for fish species is limited The majority of blood values determined for fishes are reported in the literature as a mean value with a standard deviation Historically reference intervals were determined as two standard deviations from the mean however this method is only valid when blood values follow a normal distribution It is incorrect to assume
38 International Journal of Recirculating Aquaculture Volume 5 June 2004
Hematology and Blood Chemistry of Yellow Perch (Percaflavescens)
that biological parameters are distributed normally therefore non-parametric methods should be used to accurately determine reference intervals (Reed et al 1971) Techniques to properly determine reference intervals have been established by the NCCLS (1992) and suggestions for their use and interpretation have been discussed (Lumsden 1998) As with mammalian species reference intervals need to be determined for different populations of fish within a single species as culture conditions and environmental variables affect blood values to the extent that they are outside the reference interval (Ram-Bhaskar and Srinivasa-Rao 1989 Hrubec et al 1996 1997ab 2000 2001) Although the reference range for some of the blood parameters appears large it is still possible to detect variation in hematologic values associated with pathological conditions (Hrubec et al 1997b and unpublished data)
Developing reference intervals is a necessary first step in determining which specific hematological changes can be associated with disease conditions As the field of fish hematology develops its usefulness to the aquaculture industry will increase Information derived by standardized non-lethal diagnostic assays will be needed to enhance the culture of yellow perch and other fish species Analysis of diagnostic blood samples can provide a means for early detection of infectious disease and assist in the identification of sub-lethal conditions affecting production performance This should allow for more specific timely and effective disease treatments in the future
ACKNOWLEDGEMENTS The authors wish to thank Mark Kidd of the Virginia Tech Aquaculture Center for his assistance with fish care and sampling
REFERENCES Grabda E Einszporn-Orecka T Felinska C Zbanyszek R
Experimental Methemoglobinemia in Rainbow Trout Acta Ichthyologica et Piscatoria 1974 4 43-71
Hrubec TC Smith SA Robertson JL Feldman B Veit HP Libey G Tinker MK Comparison of Hematologic Reference Intervals between Culture System and Type of Hybrid Striped Bass American Journal of Veterinary Research 1996 57 618-623
International Journal of Recirculating Aquaculture Volume 5 June 2004 3 9
Hematology and Blood Chemistry of Yellow Perch (Percajiavescens)
Hrubec TC Robertson JL Smith SA Effects of Temperature on Hematologic and Serum Biochemical Profiles of Hybrid Striped Bass (Morone chrysops x Morone saxatilis) American Journal of Veterinary Research 1997a 58 126-130
Hrubec TC Robertson JL Smith SA Effects of Ammonia and Nitrate Concentration on Hematologic and Serum Biochemical Profiles of Hybrid Striped Bass (Morone chrysops x Morone saxatilis) American Journal of Veterinary Research 1997b 58 131-135
Hrubec TC Smith SA Hematology and Plasma Chemistry Values for Production Tilapia ( Oreochromis hybrid) Raised in a Recirculation System International Journal of Recirculating Aquaculture 2000 J 5-14
Hrubec TC Cardinale JL Smith SA Hematology and Plasma Chemistry Reference Intervals for Cultured Tilapia ( Oreochromis hybrid) Veterinary Clinical Pathology 2000 29 7-12
Hrubec TC Smith SA Robertson JL Age Related Differences in Hematologic and Plasma Chemistry Analytes of Hybrid Striped Bass Morone chrysops x Morone saxatilis Veterinary Clinical Pathology 2001 30 8-15
Huffman PA Arkoosh MR Characteristics of Peripheral Blood Cells from Rainbow Trout Evaluated by Particle Counter Image Analysis and Hemocytometric Techniques Journal of Aquatic Animal Health 1997 9 239-248
Kelly AM Yellow Perch Culture in the United States Manna or Mania World Aquaculture 2000 31 4-17
Lumsden JH Normal or reference values Questions and Comments Veterinary Clinical Pathology 1998 27 102-106
Mallison JA 2000 A White Paper on the Status and Needs of Yellow Perch Aquaculture in the North Central Region North Central Regional Aquaculture Center Michigan State University E Lansing MI USA
Natt MP Herrick CA A New Blood Diluent for Counting Erythrocytes and Leukocytes of the Chicken Poultry Science 1952 31 735-738
40 International Journal of Recirculating Aquaculture Volume 5 June 2004
Hematology and Blood Chemistry of Yellow Perch (Percaflavescens)
NCCLS National Committee for Clinical Laboratory Standards 1992 How to Define Determine and Utilize Reference Intervals in the Clinical Laboratory Proposed Guidelines NCCLS Document C28-P Villanova PA USA
Nelson JA Mitchell GS Blood Chemistry Response to Acid in Yellow Perch (Perea flavescens) Comparison of Populations from Naturally Acidic and Neutral Environments Physiological Zoology 1992 65 493-514
Nelson JA Magnuson J J Chulkasem W Blood Oxygen Capacity Differences in Yellow Perch (Percaflavescens) from Northern Wisconsin Lakes Differing in pH Canadian Journal of Fisheries and Aquatic Sciences 1988 45 1699-1704
Ram-Bhaskar B Srinivasa-Rao K Influence of Environmental Variables on Hematology and Compendium of Normal Hematological Ranges of Milkfish Chanos chanos (Forskal) in Brackish Culture Aquaculture 1989 83 123-136
Reed AH Henry RJ Mason WB Influence of Statistical Method Used on the Resulting Estimate of Normal Range Clinical Chemistry 1971 17 275-284
Schmitz M 1999 Comparative Growth of All-Female Versus Mixed Sex Yellow Perch (Percaflavescens) in Recirculating Aquaculture Systems MS Thesis Virginia Tech Blacksburg VA USA
Toneys ML Coble DW Mortality Hematocrit Osmolality Electrolyte Regulation and Fat Depletion of Young-of-the-Year Freshwater Fishes under Simulated Winter Conditions Canadian Journal of Fisheries and Aquatic Science 1980 37 225-232
van den Heuvel MR Power M Richards J MacKinnon M Dixon DG Disease and Gill Lesions in Yellow Perch (Percaflavescens) Exposed to Oil Sands Mining-Associated Waters Ecotoxicology and Environmental Safety 2000 46 334-341
Wedemeyer GA Nelson NC Statistical Methods for Estimating Normal Blood Chemistry Ranges and Variance in Rainbow Trout (Salmo gairdneri) Shasta Strain Journal of the Fisheries Research Board of Canada 1975 32 551-554
International Journal of Recirculating Aquaculture Volume 5 June 2004 41
Hematology and Blood Chemistry of Yellow Perch (Percajlavescens)
Zinkl JG Avian Hematology In Schalms Veterinary Hematology (4th edition) Jain NC (Ed) 1986 Pages 256-260 Lippincott Williams amp Wilkins Philadelphia PA USA
42 International Journal of Recirculating Aquaculture Volume 5 June 2004
Hatchery and Grow-out Performance of Sunshine Bass and Backcross Hybrid Striped Bass in Recirculating Aquaculture Systems
SR Lindell1bull2 B Delbos1 R Perham1 J Goldman1 EM Hallerman3 TO Brenden3bull4
1 Fins Technology 15 Industrial Road Turners Falls MA 01376 USA
2Current address Marine Biological Laboratory Marine Resources Center 7 MBL Street Woods Hole MA 02543 USA
3Department of Fisheries and Wildlife Sciences (0321) Virginia Polytechnic Institute and State University Blacksburg VA 24061 USA
4Current address Institute of Fisheries Research University of Michigan 1109 N University Avenue Ann Arbor MI 41809 USA
Corresponding authors e-mail ehallermvtedu
Keywords striped bass performance aquaculture growth
International Journal of Recirculating Aquaculture 5 (2004) 43-54 All Rights Reserved copyCopyright 2004 by Virginia Tech and Virginia Sea Grant Blacksburg VA USA
International Journal of Recirculating Aquaculture Volume 5 June 2004 43
Performance of Sunshine Bass and Backcross Hybrid Striped Bass
ABSTRACT Previous research has suggested that backcross hybrid striped bass (BX sunshine bass female x striped bass male) perform as well as F 1 hybrid striped bass (sunshine bass white bass female x striped bass male) for many economically important traits We conducted trials to compare rearing and growth traits of selected backcross hybrid striped bass with hybrid striped bass (HSB) We spawned and reared larval BX fry in two hatchery cycles measured fry growth and performance and compared them to past performance of HSB fry We conducted a grow-out trial of commercially-available hybrid striped bass versus backcross hybrid striped bass in replicated tanks to phase II fingerling size (approximately lOOg) Compared to HSB in the hatchery phase backcross hybrid striped bass exhibited lower fertilization rate comparable swimbladder inflation rate shorter time-to-weaning lower survival comparable growth and comparable condition factor After 60 days HSB exhibited significantly better growth survival and feed conversion efficiency than BX However BX may have better potential market acceptance by virtue of having a lower condition factor appearing longer and less deep-bodied than HSB
INTRODUCTION Striped bass (Morone saxatilis) and its hybrids constitute a major sector of aquaculture in the United States with production of 105 million pounds in 2002 (Carlberg and Van Olst 2003) Commercially significant quantities of Morone stocks also are produced in Taiwan China and Israel Approximately 43 of Morone production occurs in tanks (Carlberg and Van Olst 2003) much of that in recirculating aquaculture systems (RAS) Private and government marketing experts estimate that US production could increase to 50 million pounds and $100 million in annual farm-gate revenue if market prices could be decreased only moderately (Halbrendt et al 1991) Production costs for HSB could be reduced by 12 if selective breeding can yield 20 faster growth rates (Losordo and Westerman 1994)
The majority of Marone production is not of striped bass but of its hybrids with white bass (M chrysops) because of their hardiness rapid growth rate and limited availability of female striped bass broodstock (reviewed by Harrell 1997) Further female WB are considered easier and more predictable to strip-spawn Hence most commercial production
44 International Journal of Recirculating Aquaculture Volume 5 June 2004
Performance of Sunshine Bass and Backcross Hybrid Striped Bass
is of sunshine bass the progeny of the white bass female x striped bass male interspecific cross Research has also been undertaken to evaluate the performance of second generation hybrids and backcrosses Several studies have suggested that the progeny of F 1 hybrid striped bass females backcrossed to striped bass males have merit for commercial production Jenkins et al (1998) compared the performance of backcross hybrids to F1 hybrid striped bass and striped bass to market size in a recirculating system At harvest no differences in growth rate or feed conversion were detected specific growth of BX was intermediate to those of the other stocks with survival lower Tomasso et al (1999) compared performance of F 1 and backcross hybrids between 20 and 90 grams for 56 days in tanks (Tomasso et al 1999) and observed similar survival growth and feed conversion rates among the hybrid types Detailed comparison of the hatchery performance of sunshine and BX hybrids is lacking We hypothesized that use of selected hybrid striped bass and striped bass for the backcross might yield a high-performance BX hybrid Should high performance be realized progressive fish farmers might utilize this approach by selecting the best F1 hybrid females from their own production stocks making the backcross by strip-spawning them and fertilizing the eggs with purchased milt from selectively bred striped bass males (Kerby 1983) thereby obtaining a high-performance production stock that because of selection on the maternal stock is suited to their particular farm conditions
In this study we evaluated the production potential of backcross (BX) hybrid striped bass (female sunshine bass x male striped bass) We compared the hatchery and grow-out performance of BX spawned from select broodstock and sunshine bass (HSB) of common genetic background Specifically we evaluated spawning success hatch rate growth survival and feed conversion efficiency through the first six months of life In order to benchmark our results we ran a trial in replicated tanks with HSB supplied by the most widely-used commercial source of fingerlings (Keo Fish Farms Keo AR USA) and compared their performance with our BX All fish were cultured within intensive controlled-environment recirculating aquaculture systems
International Journal of Recirculating Aquaculture Volume 5 June 2004 45
Performance of Sunshine Bass and Backcross Hybrid Striped Bass
MATERIALS AND METHODS In July 2001 we crossed 4 hybrid striped bass females to each of 4 striped bass males to produce 16 families of backcross hybrid striped bass Poor fertilization rates resulted in a low yield of fry from this spawn However there were enough fry to pool and conduct a pilot commercial-scale hatchery run Randomly-chosen samples from the resulting 4000 fingerlings were used for the grow-out trial
In October 2001 we spawned 3 female HSB with 2 male SB and eventually produced 7000 fingerlings While this was not enough to grow in commercial-scale systems we collected hatchery performance data to corroborate our JulyAugust experience with BX
Fertilized eggs were incubated in McDonald jars Upon hatch the larvae swam out of the hatching jar and into a 1900-L larval rearing tank Replicate larval rearing tanks were stocked with approximately 25 larvae per liter Tanks were maintained with recirculating water and surface oil-skimming pads for the first 5 to 7 days post-hatch until swim-bladder inflation was completed For the second week post-hatch larval rearing tanks were maintained static with gentle central aeration except for an exchange of about 30 of the tank water over the course of two hours each day During the second week post-hatch larvae were fed rotifers enriched with Algamac (Aquafauna BioMarine Inc Hawthorne CA USA) maintained at a density of 10ml By the end of the second week larvae were weaned from rotifers to Artemia nauplii By the end of the third week the larvae were typically weaned from enriched Artemia to artificial feed (Biokyowa Inc Girardeau MO USA) Weaned larvae were graded just once around 60 days post-hatch to remove the top 1 to 2 of larger fish responsible for cannibalism
In November 2001 we purchased lOg fingerlings that represent typical industry-standard HSB from Keo Fish Farms (Keo AR USA) These HSB closely matched the size and weight of our BX from the July spawn for the grow-out trial BX and HSB fingerlings were each stocked separately in triplicate 1900-L round tanks connected to the same recirculating system and reared at 23degC and a salinity of 1-3 ppt All six tanks were similarly stocked initially (approximately 1 kgm3) Fish were offered 80 of their expected ration via belt-feeders and hand-fed to satiation twice a day Approximately every 3 weeks length and weight samples were taken from a randomly-chosen 15 of each tanks
46 International Journal of Recirculating Aquaculture Volume 5 June 2004
Performance of Sunshine Bass and Backcross Hybrid Striped Bass
population At the conclusion of the project the tanks reached typical commercial densities of 5 to 9 kgm3bull
We quantified reproductive and hatchery performance of the three groups including fertilization rate swimbladder inflation rate days to weaning onto artificial feed (ie date of first ingestion to date that gt90 ingested artificial feed) survival estimates to approximately 60 days after hatch and to the end of the study feed conversion rate and monthly average weight and length The trial continued until mid-February 2002 when the HSB averaged approximately lOOg Results from previous years hatchery efforts with HSB using similar rearing protocols were used for comparative purposes
Both the hatchery and grow-out systems employed water recirculation technology including drum-filters fluidized-bed biofilters oxygenation ozonation and automated pH and temperature control that maintained high water-quality standards throughout the trials
Differences in fish weight between the hybrid types were analyzed as a repeated-measures general linear mixed model Residual (restricted) maximum likelihood was used to estimate the model parameters Initial fish biomass in each of the tanks and the amount of feed provided to each of the tanks were included in the model as covariates to assess the influence of these concomitant variables on differences in weight A first-order autoregressive covariance structure was assumed for the repeated-measurements of fish weight
Differences in fish survival at the end of the grow-out trial were analyzed as a general linear model with tanks serving as a blocking factor Because fish survivalmortality is a binary response and thus will violate an assumption of normality the significance of the test comparing survival between the hybrid types was obtained by randomization (number of randomizations= 1000) whereby the F-statistic of the original test was compared to F-statistics obtained by randomly allocating the survival mortality data to the different hybrid types The Type-I error rate for all statistical tests was set equal to 005
International Journal of Recirculating Aquaculture Volume 5 June 2004 47
Performance of Sunshine Bass and Backcross Hybrid Striped Bass
Table 1 Comparison of hatchery traits of backcross (BX) and Fl hybrid (HSB) striped bass for traits of economic interest
Traits of interest BX-HSB BX-HSB HSB HSB HSB
Female parent strain1 AR ARMD AR AR AR
Male parent strain1 MD FL MD FL MD MD FL MD Canada
Spawn date Oct-01 Jul-01 Mar-01 Oct-00 Jan-99
Fertilization 32 22 53 57
Swimbladder inflation 90 50 98 95
Weaning start (DAH)2bull3 24 21 17 22
Weaning end (DAH4 33 32 37 38
Mean wt (g) at 60 DAH 042 052 042 05
Survival to 60 DAH 7 740 104
Mean L (mm) at 30 DAH 133 11 1225
Mean L (mm) at 36 DAH 139 167
Mean L (mm) at 75 DAH 367 404 452
Mean Wt (g) at 75 DAH 074 081 12 0825 11
Condition factor at 1g 123E-05 118E-05 1Strain abbreviations AR=Arkansas R MD=Maryland FL=Florida 2DAH=Days after Hatch 3Weaning start marks the first introduction and ingestion of dry feed to replace live feeds 4Weaning end denotes the time when the transition to dry feeds is complete and live feeds are no longer utilized
RESULTS
Hatchery Trial Results A summary of performance for hatchery traits of production interest for BX and HSB is presented in Table 1
The fertilization rate for the BX eggs was lower than that which we typically found with HSB (22-32 vs 55) and considerably lower than our experience in 2000 when we conducted fertilization trials with BX (80)
Swimbladder inflation rate ranged from 50 in the first hatchery run to 90 in the second run We attribute the low rate in the first run to
48 International Journal of Recirculating Aquaculture Volume 5 June 2004
Performance of Sunshine Bass and Backcross Hybrid Striped Bass
surface-film and system management problems We showed in the second run that swimbladder inflation in BX was comparable to that typically attainable (gt90) for Morone fry
Time-to-weaning onto dry diets was shorter (10 days versus 18 days) and earlier (day 33 versus day 38) for BX than for HSB Survival of BX to 60 days after hatch (7) was lower than expected on the basis of previous experience with HSB (gt10) Mean weights for BX at 60 days after hatch in two hatchery runs (052 and 042g) was similar to those for HSB (042 and 05g) However HSB exhibited greater mean weight than BX at 75 days after hatch (l04 vs 077g)
Condition factor (K) of BX (123 + 009) was not significantly different from those of HSB (119 + 005) or striped bass (l13 + 003) at 1 gram mean weight
Frequencies of deformities for BX (lt2) were lower than those in earlier reports Bosworth et al (1997) reported deformities in 8 of BX and 4 ofHSB
Grow-out Trial Results Overall there was not a significant difference in weight between the hybrid types (F = 606 df = 13 P = 00907) however as evidenced in
100
80
60
40
20
--+- BX - Overall -0- HSB - Overall -ltgt- BX - Individual Tanks A middot middot middotbullmiddotmiddot middot HSB - Individual Tanks fi
fi ~o
12 Dec 2001 3 Jan 2002 24 Jan 2002 12 Feb 2002
Date Figure 1 Meanfish weight(plusmn 2 SE) at each time period for backcross hybrid striped bass (BX) and hybrid striped bass (HSB) Also shown is meanfish weight at each time periodor groups in individual tanks
International Journal of Recirculating Aquaculture Volume 5 June 2004 49
Performance of Sunshine Bass and Backcross Hybrid Striped Bass
Figure 1 there was a significant interaction on fish weight by hybrid type and time (F = 5157 df = 1587 P lt 00001) Using the slicing option available in SAS (SAS Institute 1999) we tested for differences in weight between the hybrid types for each time period and found that although weights of HSB and BX were not significantly different during the first two measurement periods (Time 1 F = 027 df = 1587 P = 06032 Time 2 F = 036 df = 1587 P = 05496) the hybrid types did differ in weight during the last measurement periods Specifically HSB were significantly heavier than BX on the 24th of January 2002 (F = 1061 df = 1 587 P = 00032) and the 12th of February 2002 (F = 3788 df = 1587 P lt 00001) Overall HSB had a specific growth rate of 268 per
Table 2 Mean weights of backcross hybrid striped bass (BX) and hybrid striped bass (HSB) over the course of a 3-month growth trial
Date BXTank5
Wt(g) SE
112101 1228
BXTank6 Wt(g) SE
1201
BX Tank 12 Wt(g) SE
1274
HSB Tank 13 HSB Tank14 HSB Tank 15 Wt(g) SE Wt(g) SE Wt(g) SE
1180 1016 1088
1211201 1744 102 1778 095 1658 096 1798 109 1752 118 1704 109
1 302 27 60 1 38 28 76 155 27 04 154 3306 157 3424 149 3414 211
1 2402 4196 252 4424 207 4882 299 6344 263 6192 326 6432 362
212102 6332 317 6763 334 6912 299 9474 473 9553 452 10500 388
Table 3 Comparison of survivalfeed conversion ratio (FCR) and condition factor at 60 grams for backcross hybrid striped bass (BX) and hybrid striped bass (HSB)
Cross Tank
Starting
Ending
Survival
BXS
160
136
85
BX 6 BX 12 HSB 13 HSB 14 HSB 15
160
138
86
161
137
85
178
177
99
179
173
97
180
179
99
Starting Biomass (g) 1964 1922 2051 2100 1819 1958
Ending Biomass (g) 8612 9334 9469 16770 16526 18795
Feed Fed(g) 12106 12135 11447 18041 17805 20463
FCR 182 164 154 123 121 122
Condition Factor 168E-05 166E-05 169E-05 194E-05 193E-05 208E-05
SE 353E-07 337E-07 424E-07 255E-07 327E-07 845E-07
50 International Journal of Recirculating Aquaculture Volume 5 June 2004
Performance of Sunshine Bass and Backcross Hybrid Striped Bass
day while BX had a specific growth rate of 205 per day Neither of the covariates included in the model were found to have a significant effect on weight differences (initial tank biomass F = 142 df = 1587 P = 02332 amount of feed F = 005 df = 1587 P = 08165)
Performance regarding key economic traits-survival feed conversion efficiency and condition factor-are summarized in Table 3 At the end of the grow-out trial survival of HSB was significantly greater than that of BX (F = 6216 df = 1 1014 P lt 00001) Feed conversion ratio was better for HSB (122) than for BX (166) Condition factors for BX were lower than those for HSB (l68 vs 198) meaning that BX appeared longer and less deep-bodied than HSB
DISCUSSION Our data showed that F1 HSB performed as well or better than BX for a range of hatchery- and grow-out-related traits
Hatchery traits Fertilization rates for backcross lots were approximately half that for HSB There was a wide variance for fertilization and hatch rates of eggs from HSB females Some of this variance may be due to differences in hatchery protocols (different hormone injections used strip vs tank spawning) at the commercial hatcheries where the data were collected (TIJ Smith personal communication) Poor hatch rates also may be attributable in part to hybrid breakdown that is to developmental incompatibilities among the genomes of the respective species when coadapted gene complexes are broken up at meiosis in the F1 (Hallerman 2003)
In the hatchery trial we hypothesize that the low swimbladder inflation rate for our J~ly fry resulted from offering first feed to the BX too early When rearing HSB and SB fry we typically wait until the yolk sac has been largely resorbed and the fry mostly have inflated their swimbladders before we introduce live feed This is because live feed can cause an oily film on the water surface that interferes with a frys successful ingestion of air bubbles necessary to inflate the swimbladder (Chapman et al 1988) The timing of swimbladder inflation varies with fry type and temperature with HSB typically inflating between 3 and 6 days after hatch and SB 6 to 9 days after hatch BX fry inflate their swimbladder at an intermediate time 5 to 8 days after hatch (DAH) Since for the July
International Journal of Recirculating Aquaculture Volume 5 June 2004 51
Performance of Sunshine Bass and Backcross Hybrid Striped Bass
spawn we introduced feed into their tanks at the time prescribed for HSB (at 5 DAH) BX fry may have had a reduced opportunity to inflate their swimbladders because of interference by a surface film with air contact In the October spawn we monitored swimbladder inflation more carefully and introduced live feed on day 7 after almost 90 of swimbladders were inflated The low swimbladder inflation rate in the July hatchery run of BX may have had a direct impact on survival Larvae without inflated swimbladders expend more energy swimming exhibit reduced growth rates are less tolerant of stress and often sink to the tank bottom and die (Van Heukelem et al 2000)
BX were weaned more quickly and earlier onto dry diets than HSB which may have helped contribute to their ability to match the size and weight of HSB at 60 DAH Earlier weaning has economic merit since dry diets are generally cheaper and easier to feed than brine shrimp
Grow-out traits After 60 days post-hatch the growth and other performance differences between BX and HSB became more evident HSB exhibited significantly better growth survival and feed conversion ratios
We hypothesized that backcross hybrid striped bass might grow as fast or faster than the standard commercially-available F 1 hybrid striped bass if high-performance HSB females were selected as broodstock Our data regarding performance in intensive tank systems did not support this hypothesis Rather our observations accord with the classical view that the high performance of some interspecific hybrids is largely due to heterosis and that because the heterosis shown by an F 2 or backcross hybrid is only half that shown in an F1 (Falconer and Mackay 1996 p 257) that advanced generation hybrids would not perform as well as F1
hybrids Indeed F 2 HSB previously showed low hatch rates low larval survival and high variability of growth rate (Smith and Jenkins 1984 Smith et al 1985) Our results suggest that the heterosis expressed in HSB for growth and performance was greater than the selective breeding advantage we employed by crossing high performance HSB females with male striped bass Apparently the additive genetic variance contributed by the HSB and striped bass selected for size-at-age could not make up for the loss of dominance variance
BX may have better potential market acceptance by virtue of having a lower condition factor appearing longer and less deep-bodied than HSB more
52 International Journal of Recirculating Aquaculture Volume 5 June 2004
Performance of Sunshine Bass and Backcross Hybrid Striped Bass
like striped bass that are more familiar in many markets Fins Technologys market experience has shown that the premium-priced live markets prefer longer leaner fish such as the backcross There is the possibility that because of later maturity backcross hybrid striped bass may grow to larger sizes than hybrid striped bass This is attractive because there is an unserviced demand for larger (1 kg+) fish that can provide portion-controlled 7-9 ounce fillets for the restaurant and retail markets
ACKNOWLEDGEMENTS This project was supported by US Department of Agriculture-Small Business Innovation Research Program Phase I Grant no 2001-00373 EMH is supported by the USDA-CSREES Hatch Program and the Commonwealth of Virginia Aquaculture Initiative
REFERENCES Bosworth BG Libey GS Notter DR Egg Larval and Fingerling
Traits of Crosses among Striped Bass White Bass and their Fl Hybrids Aquaculture 1997 154 201-217
Carlberg J Van Olst J US Production and Sales of Hybrid Striped Bass (1987-2002) 2003 httpaquanicorgsbgaHSBversion5ppt
Chapman DC Hubert WA Jackson UT Influence of Access to Air and of Salinity on Gas Bladder Inflation in Striped Bass Progressive Fish-Culturist 1988 50 23-27
Falconer DS Mackay TFC 1996 Introduction to Quantitative Genetics Fourth Edition Longman Group Ltd Harlow Essex UK
Halbrendt CK Wirth FF Vaughn GF Conjoint Analysis of the Mid-Atlantic Food-Fish Market for Farm-Raised HSB Southern Journal of Agricultural Economics 1991 23 155-163
Hallerman EM Coadaptation and Outbreeding Depression In Po_pulation Genetics Principles and Applications for Fisheries Scientists Hallerman E (Ed) 2004 American Fisheries Society Bethesda MD USA
Harrell RM Hybridization and Genetics Striped Bass and Other Morone Culture In Harrell RM (Ed) 1997 Pages 217-234 Elsevier Science Amsterdam
International Journal of Recirculating Aquaculture Volume 5 June 2004 53
Performance of Sunshine Bass and Backcross Hybrid Striped Bass
Jenkins WE Heyward LD Sr Smith TIJ Performance of Domesticated Striped Bass Marone saxatilis Palmetto Bass and Backcross Hybrid Striped Bass (Sunshine Bass Female x Striped Bass Male) Raised in a Tank Culture System Journal of the World Aquaculture Society 1998 29 505-509
Kerby JH Cryogenic Preservation of Sperm from Striped Bass Transactions of the American Fisheries Society 1983 112 86-91
Losordo TM Westerman P An Analysis of Biological Economic and Engineering Factors Affecting the Cost of Fish Production in Recirculating Aquaculture Systems Journal of the World Aquaculture Society 1994 25 193-203
SAS Institute 1999 The SAS System for Windows version 82 SAS Institute Cary NC USA
Smith TlJ Jenkins WE Controlled Spawning of Fl Hybrid Striped Bass (Marone saxatilis x M chrysops) and Rearing of F2 Progeny Journal of the World Mariculture Society 1984 15 147-161
Smith TlJ Jenkins WE Snevel JF Production Characteristics of Striped Bass (Marone saxatilis) and Fl - F2 hybrids (Marone saxatilis and M chrysops) Reared in Intensive Tank Systems Journal of the World Mariculture Society 1985 16 57-70
Tomasso JR Kempton CJ Gallman A Smith TlJ Comparative Production Characteristics of Sunshine Bass and Sunshine Bass x Striped Bass in Recirculating-Water Systems North American Journal of Aquaculture 1999 61 79-81
Van Heukelem WF Harrell RM Hughes SG Lindell SR Friedmann BR Optimal Conditions for Swimbladder Inflation in Striped Bass Larvae Reared in Intensive Systems Northeast Regional Aquaculture Center Publication No 00-006 (2000) 5 pages
54 International Journal of Recirculating Aquaculture Volume 5 June 2004
Book Review
Fjofish apd Shellfish Bacteriology Mapua) Techpjques apd Procedures KA Whitman with contributions by NG MacNair
Iowa State Press (Blackwell Publishing Professional) Ames IA USA (2004) 288 pages ISBN 0813819520 US $4999
Reviewed by Rocco C Cipriano United States Geological Survey National Fish Health Research Laboratory 11649 Leetown Road Kearneysville WV 25430 USA E-mail rocco_ciprianousgsgov
Despite the fact that several good texts have been published regarding the description and nature of bacterial pathogens in aquatic animals there remained a need for a comprehensive yet practical guide devoted to techniques and procedures used for bacterial identification Diagnosis and detection of fish and shellfish pathogens often requires reliance upon standard microbiological media tests and reagents for some bacteria but more specialized assays are required for many aquatic pathogens In the latter case the products necessary for such assays are not commercially available and must be produced in aquatic animal diagnostic facilities from their basic ingredients Often therefore the compositions of differential media and the conduct of certain tests for the primary isolation or detection of specific aquatic pathogens are only available by referencing the general body of published scientific literature Hence until now there has not been a single-source shelf-volume that combines standard microbiological procedures used for routine detection and identification of medically important bacteria with the specialized needs of the fisheries profession This manual however helps to fill that void
The manual stands as a reference suitable for professional aquatic biologists with backgrounds in microbiology veterinarians and students of aquatic animal health Its strength lies in its coverage of the subject matter regarding culture-based diagnosis and identification of bacteria associated with finfish bivalves and lobsters Sections on
International Journal of Recirculating Aquaculture 5 (2004) 55-56 All Rights Reserved copyCopyright 2004 by Virginia Tech and Virginia Sea Grant Blacksburg VA USA
International Journal of Recirculating Aquaculture Volume 5 June 2004 55
Book Review FiQish and ShelJfish Bacteriology Manualmiddot Techniques and Procedures
aseptic collection and shipment of samples qualitative and quantitative procedures for bacterial isolation staining techniques media and standard biological tests used for the cultivation and phentotypic characterization of pathogenic bacteria and antibiotic sensitivity testing provide sound background for the student or novice practitioner Particularly beneficial for anyone who is not experienced with aquatic microbial pathogens is the section listing principal organs media and appropriate incubation temperatures to be used as the most probable sources of isolation for the specific bacteria
More experienced professionals will find it helpful and convenient to have the descriptions and interpretations of differential media (eg Coomassie Brilliant Blue Agar for Aeromonas salmonicida Rimler-Shotts Agar for Aeromonas hydropila Cytophaga Agar Shieh and TYES for Flavobacterium spp and Edwardsiella ictaluri Agar and various other media for Renibacterium salmoninarum) listed in a single source The major identifying criteria that phenotypically characterize selected bacterial pathogens are also described in tabulated form Specialized tests such as the SIF test to detect covert infections nurse culture techniques for enhanced bacterial growth and assays for public health indicator organisms in bivalves are documented Sections covering serology immunoassay and non-cultured based molecular assays (eg polymerase chain reaction) are also presented but are not as completely summarized as those for bacterial isolation In summary the nature of this manual makes it appropriate for frequent use as a practical laboratory guide
56 International Journal of Recirculating Aquaculture Volume 5 June 2004
Subscription Information
International Journal of Recirculating Aquaculture
A publication ofVirginia Tech and the Virginia Sea Grant College Program
IJRA presents the latest developments in RAS-related research focusing on the areas of
Food Quality Pathology
Food Safety
Aquatic Medicine Breeding amp Genetics Waste Management
FishShellfish Growth amp Nutrition Recirculating Systems Mgmt Marketing amp Economics Water Conservation
Dont miss an issue of this informative peer-reviewed journal Subscribe now using your credit card by calling 540-231-2075 or by printing out a form at wwwcfastvteduijrahtml If you prefer you can also mail this form to the address below along with a check or money order
Name ----------------~ Address ----------------Line2 ------------------City ____________ State __ _ Country Postal Code ___________ _ Phone Fax -------- --------e-mail-----------------check _ 2 year ($25 US)
International Journal of Recirculating Aquaculture Food Science amp Technology Building (0418)
Virginia Polytechnic Institute and State University Blacksburg VA 24061
phone (540) 231-2075 fax (540) 231-9293 e-mail IJRAvtedu
International Journal of Recirculating Aquaculture Volume 5 June 2004 57
~ International Journal of ~ Recirculating Aquaculture A publication of Virginia Tech and the Virginia Sea Grant College Program
Instructions for Authors The International Journal of Recirculating Aquaculture (IJRA) encourages the submission of original high-quality papers on research in all aspects of recirculating aquaculture Papers will be peer-reviewed and evaluated for scientific merit relevance and for their usefulness in promoting the advancement of recirculating aquaculture Complete coherent projects are preferred Any related papers submitted together must be thoroughly cross-referenced All papers must be original meaning that the data and the information presented must be the work of the authors and can not have been published elsewhere Dual publication of a paper or data is possible only through the permission of the Editors of both journals THERE ARE NO PAGE CHARGES for IJRA submissions
INITIAL MANUSCRIPT SUBMISSION Manuscripts should be sent to Ms Angela Correa Managing Editor by mail using the address listed at the end of these instructions or by e-mail to (ijravtedu) Submit four (4) copies of each manuscript if regular mail is used All manuscripts must be in English Dot matrix type is not acceptable and all such submissions will be returned without review Each submission must include a cover letter stating that the paper contains original research and that the information has not been published elsewhere E-mailed submissions must be saved in doc format Be sure to include the names of colleagues who have already reviewed the work presented IJRA has two categories for submission 1 Articles which are complete in-depth scientific studies and 2 Notes which are short papers of limited scope Articles and notes will be critically reviewed by two or three experts as well as by the Managing Editor Submissions may be returned without peer review in cases where the Managing Editor determines that they are inappropriate for the journal of poor quality poorly written or fail to follow the journals style format
PREPARATION OF MANUSCRIPTS IJRA uses the latest editions of Websters New International Dictionary and Websters New Collegiate Dictionarv for standard spellings and word definitions All spelling will be in American English Foreign or science-related terminology that is unfamiliar and does not appear in these dictionaries will require an accompanying definition Acceptable scientific and common names of fishes are listed in A List of Common and Scientific Names of Fishes from the United States and Canada published by the American Fisheries Society Common names may be used throughout each paper but must be accompanied by a full scientific name when they first appear in a paper The author must use the full common name eg yellow perch not perch All foreign language words should be italicized in the manuscript
In the manuscript number each page sequentially and include the senior authors name next to the page number (eg Page 4 Jahncke) on each page Single-space all typed material including references Type size in the body of the text should be no larger than 12pts and no smaller than 10 pts Subsection headings should also be italicized in the manuscript Spell out one-digit numbers except when they are used with units of measure - eg six ponds 7 days
International Journal of Recirculating Aquaculture Volume 5 June 2004 59
Spell out any number that begins a sentence When two numbers occur sequentially in the text one of the numbers must be spelled out- eg In 1987 fifty fish were stocked Use commas in numbers of 1000 or more Use the 24-hour clock to describe time- eg 1300 not 100 pm
Keep footnotes to a minimum and number them sequentially throughout the paper All units of measurement must be reported via the metric system except in special circumstances (eg horsepower) Standard scientific abbreviations and symbols may be used without definition If the use of a symbol could cause confusion define the symbol the first time it is used On the final draft of a paper that has been accepted for publication Greek letters or other extraneous symbols that do not appear on a keyboard the name of the symbol should be noted where the symbol is used to help eliminate prepress errors Parts per million or milligrams per liter can be
-1 reported as either ppm or mgI but not as mgI
Commonly used aquaculture jargon can be used without defining the term - eg fry fingerling hapa Less commonly used jargon may also be used but terms should be defined the first time they are used Jargon from fields outside of aquaculture should also be defined the first time they are used Always place a zero to the left of a decimal point if the number is less than one this includes probability values - eg P = 005 not P = 05
COMPONENTS OF THE MANUSCRIPTS Articles and notes should include a title names of authors and their addresses abstract introduction materials and methods results discussion (or a combined results and discussion) conclusion (rarely) acknowledgements (if any) references figures and tables in that order Each section should start on a new page
Title - The title should accurately reflect the contents of the paper Brief concise titles are encouraged The title page must include the name(s) of the author(s) and all addresses
Abstract - The abstract should be a concise highlight of the results and conclusions Methodology should not be abstracted unless it is necessary to explain the results or unless the paper describes a new technique Abstracts should be less than 300 words
Introduction - The introduction should explain why the paper was written and why it should be read The introduction should condense the relevant information in the field that led the author to do the research The introduction is not a complete literature review and only the most relevant references should be cited The introduction should also contain a statement that describes the purpose or objective of the paper
Materials and Methods - The underlying goal of this section is to describe what was done so that others can repeat the experiment If previously published papers described a technique that was used they can be cited to prevent unnecessary repetition If the technique or process was modified the modification must be described so that others can repeat the process Experimental designs can be explained by use of figures if they will help clarify what was done If the experiment was a complicated one with many subparts subsections may be used to describe each subpart
Results - This section describes the data Proper use of tables and figures can simplify and help explain the results Statistical analysis of data is necessary unless differences are so obvious that statistical analysis is superfluous Although probability values of 005 and 001 are traditionally used each author is free to choose his or her own level of significance
60 International Journal of Recirculating Aquaculture Volume 5 June 2004
Discussion - This section should interpret the results and compare the results from this experiment to those found in similar research The section can also be used to speculate about the results to provide reasons for the trends and to suggest new ideas that can advance our understanding about aquaculture This section should not be a literature review section that merely compares results among several papers
Results and Discussion - Results and discussion sections can be combined In most cases this leads to a better paper because the integration of these sections leads to a more meaningful interpretation of data
Conclusion - This section should be used only when the results of an experiment lead to an unequivocal interpretation
Acknowledgements - This section should be used to thank organizations that supported the research monetarily and individuals who assisted in the research or preparation of the paper This section includes manuscript number designations for those institutions that assign such numbers
References - Select references with great care Unless the paper includes a literature review there is no need to reference every paper written about a subject Use only the most important ones
Figures and Tables - All figures andtables go after the references Figures always go before tables
Section headings (eg Materials and Methods) should be capitalized and in bold type Secondary headings should be balded and go flush left Tertiary headings are incorporated into the first paragraph of that subsection Tertiary headings are italicized and separated from the text by a double dash
In the text references are cited in one of two ways 1 Swingle (1959) evaluated two species of tilapia or 2 pond culture in Alabama began in the 1950s (Swingle 1959) When there are three or more authors list only the first in a citation and follow that with et al eg Smitherman et al (1983) reviewed catfish breeding work at Auburn University If the name of an institutional author is long it can be abbreviated in a citation eg Food and Agriculture Organization of the United Nations may be abbreviated as FAO When several citations are used in a single entry they are listed chronologically If you are citing two papers that were written by the same author(s) the name only has to appear once per citation followed by the years that designate the different papers Separate the years with a comma If you are citing two authors you must separate the citations with a semicolon (Smith 1975 1976 Jones 1976)
In the reference section the reference list is strictly alphabetical by last name of the senior author and then by initials if two authors have identical last names If an author has written more than one paper the following format should be followed All single authored papers go first followed by co-authored papers and then the papers that were written by three or more authors If an author has written more than one single-authored paper the papers are listed chronologically If an author has written more than one co-authored paper they are listed alphabetically by the second authors last name If a tandem has authored two or more papers the order is chronological Papers written by the same group of three or more authors should be listed chronologically
International Journal of Recirculating Aquaculture Volume 5 June 2004 61
The following format will be used when referencing various works
PAPERS Single-author papers
McGinty AS Effects of Size at Stocking on Competition and Growth of All-Male Tilapia Hybrids Journal of the World Aquaculture Society 1985 16 52-56
Multiple-author papers Tave D Smitherman RO Predicted Response to Selection for Early Growth in Tilapia nilotica Transactions of the American Fisheries Society 1980 109 439-445
If an author has published two or more papers in the same year follow the years with a letter to differentiate them eg Smith 1988a 1988b Use issue numbers only when each issue starts out with page 1 If pagination is consecutive throughout the volume omit the issue number Spell out journal names in their entirely without abbreviations
Papers in proceedings or in edited volumes Nicholson LC Woods LC Ill Woiwode JG Intensive Culture Techniques for the Striped Bass and its Hybrids In Culture and Propagation of Striped Bass and Its Hybrids Harrell RM Kerby JH Minton RV Eds 1990 American Fisheries Society Bethesda MD USA
Books and reportspublications from governmental or non-governmental bodies
Lovell T 1989 Nutrition and Feeding of Fish Van Nostrand Reinhold New York NY USA
Food and Agriculture Organization of the United Nations (FAO) Fisheries Department 1997 Review of the State of World Aquaculture No 886 FIRlC886 FAO Rome Italy
Theses and Dissertations
Easter CC 1992 Water Chemistry Characterization and Performance of a Recirculating Aquaculture System Producing Hybrid Striped Bass Masters thesis Virginia Polytechnic Institute and State University Blacksburg VA USA
Websites
Federation of European Aquaculture Producers (FEAP) European Eel Production (httpwwwfeaporgeelshtml) 2002
Page numbers for proceedings books theses and dissertations are unnecessary Government publications should be treated as if they were books but document numbers must be included THE ACCURACY OF REFERENCES IS THE SOLE RESPONSIBILITY OF THE AUTHORS MAKE SURE THAT CITATIONS AND REFERENCES MATCH
Tables - When creating a table decide what the purpose of the table is and what points are important then organize the table so that the main features can be easily understood The table heading should provide sufficient information for the table to be understood as an entity Keep footnotes to a minimum Each table goes on a separate page Tables must be camera ready TABLES WILL BE PRINTED AS IS AND WILL NOT BE TYPESET Figures - List all figure captions on separate pages Original artwork doesnt have to be submitted when a paper is first submitted for review but original artwork must accompany the final revised manuscript Good quality photocopies are acceptable when a manuscript
62 International Journal of Recirculating Aquaculture Volume 5 June 2004
is submitted for review Graphs and original artwork must be printed with a laser printer or done in pen and ink Dot-matrix figures are not acceptable Original artwork or high-contrast photographs are acceptable Label all figures on the back with a soft pencil name of senior author paper title and figure number
Photographs - Should be on glossy paper with good contrast Do not glue pictures to cardboard Color photographs can be printed but the additional cost of printing them will be charged to the author Label all photos on the back with a soft pencil name of senior author paper title and figure number
FINAL REVISED MANUSCRIPTS If using the mail submit two copies of the final revised manuscript including original artwork Submit either the original pen-and-ink drawings or laser-printed versions of the drawings In addition submit the manuscript on a disk (CD preferable) or by e-mail On the disk write the brand name of the computer or word processor the word processing program that was used (should be Microsoft Word) the title of your article and the file name NOTE Disk and hard copy must agree In case of discrepancies it is the policy of IJRA to follow hard copy An electronic version of the completed manuscript is needed in order to publish AUTHORS MAY NOT RECEIVE PAGE PROOFS Proofreading will be done by the Production Office of IJRA using the revised final version of the manuscript Therefore authors must be especially careful that no errors exist in the final revised version because in most cases no changes are possible after it is submitted
REPRINTS The senior author will receive two copies of the journal and a pdf file of the article for distribution and reprinting purposes The junior author(s) will also receive two copies of the journal issue These are sent several weeks after the journal is published and in circulation Requests for the pdf format of the article can only be made by the corresponding author
COPYRIGHT amp PERMISSIONS For permission to reprint articles that have appeared in IJRA please contact IJRA Copyright amp Permissions Food Science amp Technology Building (0418) Virginia Tech Blacksburg VA 24061 USA
COPYRIGHT TRANSFER If your manuscript is accepted for publication copyright ownership must be officially transferred to IJRA The Editors acceptance letter will include a form fully explaining this The form must be signed by all authors and the original returned to the Editor at this time Failure to return the copyright form in a timely fashion will result in delay in publication
Send your submissions to International Journal of Recirculating Aquaculture
AI Correa Managing Editor 27-B Food Science and Technology Building (0418) Virginia Polytechnic Institute and State University Blacksburg VA 24061 USA
If you have any questions please feel free to contact us Phone (540) 231-2075 Fax (540) 231-9293 e-mail ijravtedu
International Journal of Recirculating Aquaculture Volume 5 June 2004 63

Hematology and Blood Chemistry of Yellow Perch (Percajlavescens)
the biochemical determinations the fish had a weight of 121 +- 15g and length of 226 +- 08 cm The results of the hematological determinations from 52 fish are listed in Table 2 Values for plasma chemistry reference intervals determined on 42 samples are listed in Table 3 Overall both the hematological and plasma chemistry values were similar to those reported previously for hybrid striped bass and tilapia reared in recirculation systems (Hrubec et al 1996 2000 Hrubec and Smith 2000) The striped bass and tilapia from production systems exhibited wider ranges in value for the different leukocyte types increased numbers of reticulocytes increased plasma and total protein values increased creatinine values and a decreased plasma chloride concentration as compared to fish in lower density recirculation tanks We did not compare blood values from the production yellow perch in this study to yellow perch maintained in low-density tank settings so were unable to determine if these same trends are apparent in yellow perch as well However based on our previous experience with fish hematological and plasma biochemical values there is an indication that these trends are occurring in yellow perch as well
Table 2 Hematological reference intervals for adult yellow perch (Perea flavescens) reared in a recirculation system
Analyte N Reference Interval Mean Stds1
PCV2 () 57 29-47 388 45
Plasma Protein (gdl) 57 60-82 67 06
Erythrocytes (x 106ml) 53 2160-3345 2737 0356
Leukocytes (ml) 53 52590-186490 113914 39086
Lymphocytes (ml)
Small 53 36800-153420 85630 31728
Large 53 3530-23 130 11602 5359
Neutrophils (ml) 53 1860-35950 12430 8837
Monocytes (ml) 53 670-12640 4252 2874
Thrombocytes (ml) 53 38270-118510 72972 21299 1Standard deviation 2Packed cell volume
International Journal of Recirculating Aquaculture Volume 5 June 2004 35
Hematology and Blood Chemistry of Yellow Perch (Perea flavescens)
Table 3 Plasma biochemical values for adult yellow perch (Percaftavescens) reared in a recirculation system
Analyte N Reference Interval Mean Stds1
Total Protein (gdl) 42 37-50 45 04
Albumin (gdl) 42 06-09 07 01
Globulin (gdl) 42 31-42 37 03
Creatinine (mgdi) 42 04-10 06 01
Total bilirubin (mgdi) 42 03-04 03 01
ALP2 (UI) 42 50-114 822 249
AST3 (UI) 42 2-29 85 64
Glucose (mgdi) 42 62-181 1000 350
Cholesterol (mgdi) 42 182-323 2440 330
Sodium (mEqI) 42 138-153 1470 40
Potassium (mEqI) 42 20-38 32 05
Chloride (mEqI) 42 119-133 1260 40
Calcium (mEqI) 42 86-120 103 13
Phosphorus (mEqI) 42 50-96 74 11
Magnesium (mEqI) 42 17-34 27 04 1 Standard deviation 2 Alkaline phosphatase 3 Aspartate aminotransferase (SGOT)
The blood cells present in the yellow perch were typical of teleost fish and included erythrocytes thrombocytes and leukocytes (Fig 1) Erythrocytes were oval to round with characteristic red cytoplasm and an elongate and centrally-located nucleus Immature erythrocytes or reticulocytes demonstrated a blue-purple tinge to the normal eosinophilic cytoplasm (Fig IA B C) The yellow perch had increased numbers of reticulocytes (included in the erythrocyte count) with approximately 7 to 10 per field at lOOx oil immersion compared to what we observe for most fish species The cause for the apparent reticulocytosis is not known but has been observed in other fish species exposed to elevated nitrite and nitrate (Grabda et al 1974 Hrubec et al 1996 2000 Hrubec and Smith 2000)
36 International Journal of Recirculating Aquaculture Volume 5 June 2004
Hematology and Blood Chemistry of Yellow Perch (Perea flavescens)
T bull middotmiddot ~~ - middot
N -
Figure I Characteristic blood cells from yellow perch reared in recirculation systems Blood smears were made with EDTA anticoagulated blood stained with Wrights Geimsa stain Cells are abbreviated as follows U - Large lymphocyte SL - small lymphocyte T - thrombocyte R - reticulocytes (immature erythrocyte) PC - plasma cell (activated lymphocyte) M- monocyte N-neutrophil The blue bar in frame A is Omm
International Journal of Recirculating Aquaculture Volume 5 June 2004 37
Hematology and Blood Chemistry of Yellow Perch (Percajlavescens)
The thrombocytes were slightly smaller than the erythrocytes (Fig IA) They had clear cytoplasm and were variable in shape being elongated pyriform oval or round Nuclear shape tended to follow cytoplasmic shape although oval and round thrombocyte nuclei occasionally were lobulated (Fig IB) as described for striped bass and tilapia (Hrubec et al 1996 2000)
Leukocytes made up the remainder of the cell types seen in the blood and included small and large lymphocytes neutrophils and monocytes No eosinophils or heterophils were observed Small lymphocytes were the smallest cell present with a rim of blue cytoplasm surrounding the round nucleus (Fig IA E F) Large lymphocytes had an abundant and darker blue cytoplasm and the nucleus was larger than observed in the small lymphocyte (Fig IA E) Plasma cells were occasionally observed with a classic open nucleus abundant dark blue cytoplasm and a clear cytoplasmic region adjacent to the nucleus presumably representing the Golgi as in mammalian plasma cells (Fig IC) Plasma cells were included in the large lymphocytes category for the differential counts
Neutrophils were the largest cell present in the blood (Fig ID E F) The cytoplasm of the neutrophil was a translucent grey containing no granules and infrequent vacuoles Cytoplasmic shape was round to angular as the cellular borders often appeared slightly adherent to adjacent erythrocytes distorting cellular shape Nuclear shape of the neutrophil varied from round to horseshoe shaped and frequently segmented into two prominent lobes connected by a thin nuclear bridge (Fig IF) Monocytes had abundant dark blue cytoplasm that was frequently vacuolated (Fig ID) The round to kidney-bean shaped monocyte nucleus was large with prominent chromatin clumping
Analysis of blood parameters can provide a wealth of information useful in analyzing the effects of disease and sub-optimal environmental conditions Providing reference intervals for healthy adult yellow perch reared in recirculation systems furnishes veterinarians and fish health professionals the foundation to develop diagnostic hematology for this species The number of studies that determine actual reference intervals for fish species is limited The majority of blood values determined for fishes are reported in the literature as a mean value with a standard deviation Historically reference intervals were determined as two standard deviations from the mean however this method is only valid when blood values follow a normal distribution It is incorrect to assume
38 International Journal of Recirculating Aquaculture Volume 5 June 2004
Hematology and Blood Chemistry of Yellow Perch (Percaflavescens)
that biological parameters are distributed normally therefore non-parametric methods should be used to accurately determine reference intervals (Reed et al 1971) Techniques to properly determine reference intervals have been established by the NCCLS (1992) and suggestions for their use and interpretation have been discussed (Lumsden 1998) As with mammalian species reference intervals need to be determined for different populations of fish within a single species as culture conditions and environmental variables affect blood values to the extent that they are outside the reference interval (Ram-Bhaskar and Srinivasa-Rao 1989 Hrubec et al 1996 1997ab 2000 2001) Although the reference range for some of the blood parameters appears large it is still possible to detect variation in hematologic values associated with pathological conditions (Hrubec et al 1997b and unpublished data)
Developing reference intervals is a necessary first step in determining which specific hematological changes can be associated with disease conditions As the field of fish hematology develops its usefulness to the aquaculture industry will increase Information derived by standardized non-lethal diagnostic assays will be needed to enhance the culture of yellow perch and other fish species Analysis of diagnostic blood samples can provide a means for early detection of infectious disease and assist in the identification of sub-lethal conditions affecting production performance This should allow for more specific timely and effective disease treatments in the future
ACKNOWLEDGEMENTS The authors wish to thank Mark Kidd of the Virginia Tech Aquaculture Center for his assistance with fish care and sampling
REFERENCES Grabda E Einszporn-Orecka T Felinska C Zbanyszek R
Experimental Methemoglobinemia in Rainbow Trout Acta Ichthyologica et Piscatoria 1974 4 43-71
Hrubec TC Smith SA Robertson JL Feldman B Veit HP Libey G Tinker MK Comparison of Hematologic Reference Intervals between Culture System and Type of Hybrid Striped Bass American Journal of Veterinary Research 1996 57 618-623
International Journal of Recirculating Aquaculture Volume 5 June 2004 3 9
Hematology and Blood Chemistry of Yellow Perch (Percajiavescens)
Hrubec TC Robertson JL Smith SA Effects of Temperature on Hematologic and Serum Biochemical Profiles of Hybrid Striped Bass (Morone chrysops x Morone saxatilis) American Journal of Veterinary Research 1997a 58 126-130
Hrubec TC Robertson JL Smith SA Effects of Ammonia and Nitrate Concentration on Hematologic and Serum Biochemical Profiles of Hybrid Striped Bass (Morone chrysops x Morone saxatilis) American Journal of Veterinary Research 1997b 58 131-135
Hrubec TC Smith SA Hematology and Plasma Chemistry Values for Production Tilapia ( Oreochromis hybrid) Raised in a Recirculation System International Journal of Recirculating Aquaculture 2000 J 5-14
Hrubec TC Cardinale JL Smith SA Hematology and Plasma Chemistry Reference Intervals for Cultured Tilapia ( Oreochromis hybrid) Veterinary Clinical Pathology 2000 29 7-12
Hrubec TC Smith SA Robertson JL Age Related Differences in Hematologic and Plasma Chemistry Analytes of Hybrid Striped Bass Morone chrysops x Morone saxatilis Veterinary Clinical Pathology 2001 30 8-15
Huffman PA Arkoosh MR Characteristics of Peripheral Blood Cells from Rainbow Trout Evaluated by Particle Counter Image Analysis and Hemocytometric Techniques Journal of Aquatic Animal Health 1997 9 239-248
Kelly AM Yellow Perch Culture in the United States Manna or Mania World Aquaculture 2000 31 4-17
Lumsden JH Normal or reference values Questions and Comments Veterinary Clinical Pathology 1998 27 102-106
Mallison JA 2000 A White Paper on the Status and Needs of Yellow Perch Aquaculture in the North Central Region North Central Regional Aquaculture Center Michigan State University E Lansing MI USA
Natt MP Herrick CA A New Blood Diluent for Counting Erythrocytes and Leukocytes of the Chicken Poultry Science 1952 31 735-738
40 International Journal of Recirculating Aquaculture Volume 5 June 2004
Hematology and Blood Chemistry of Yellow Perch (Percaflavescens)
NCCLS National Committee for Clinical Laboratory Standards 1992 How to Define Determine and Utilize Reference Intervals in the Clinical Laboratory Proposed Guidelines NCCLS Document C28-P Villanova PA USA
Nelson JA Mitchell GS Blood Chemistry Response to Acid in Yellow Perch (Perea flavescens) Comparison of Populations from Naturally Acidic and Neutral Environments Physiological Zoology 1992 65 493-514
Nelson JA Magnuson J J Chulkasem W Blood Oxygen Capacity Differences in Yellow Perch (Percaflavescens) from Northern Wisconsin Lakes Differing in pH Canadian Journal of Fisheries and Aquatic Sciences 1988 45 1699-1704
Ram-Bhaskar B Srinivasa-Rao K Influence of Environmental Variables on Hematology and Compendium of Normal Hematological Ranges of Milkfish Chanos chanos (Forskal) in Brackish Culture Aquaculture 1989 83 123-136
Reed AH Henry RJ Mason WB Influence of Statistical Method Used on the Resulting Estimate of Normal Range Clinical Chemistry 1971 17 275-284
Schmitz M 1999 Comparative Growth of All-Female Versus Mixed Sex Yellow Perch (Percaflavescens) in Recirculating Aquaculture Systems MS Thesis Virginia Tech Blacksburg VA USA
Toneys ML Coble DW Mortality Hematocrit Osmolality Electrolyte Regulation and Fat Depletion of Young-of-the-Year Freshwater Fishes under Simulated Winter Conditions Canadian Journal of Fisheries and Aquatic Science 1980 37 225-232
van den Heuvel MR Power M Richards J MacKinnon M Dixon DG Disease and Gill Lesions in Yellow Perch (Percaflavescens) Exposed to Oil Sands Mining-Associated Waters Ecotoxicology and Environmental Safety 2000 46 334-341
Wedemeyer GA Nelson NC Statistical Methods for Estimating Normal Blood Chemistry Ranges and Variance in Rainbow Trout (Salmo gairdneri) Shasta Strain Journal of the Fisheries Research Board of Canada 1975 32 551-554
International Journal of Recirculating Aquaculture Volume 5 June 2004 41
Hematology and Blood Chemistry of Yellow Perch (Percajlavescens)
Zinkl JG Avian Hematology In Schalms Veterinary Hematology (4th edition) Jain NC (Ed) 1986 Pages 256-260 Lippincott Williams amp Wilkins Philadelphia PA USA
42 International Journal of Recirculating Aquaculture Volume 5 June 2004
Hatchery and Grow-out Performance of Sunshine Bass and Backcross Hybrid Striped Bass in Recirculating Aquaculture Systems
SR Lindell1bull2 B Delbos1 R Perham1 J Goldman1 EM Hallerman3 TO Brenden3bull4
1 Fins Technology 15 Industrial Road Turners Falls MA 01376 USA
2Current address Marine Biological Laboratory Marine Resources Center 7 MBL Street Woods Hole MA 02543 USA
3Department of Fisheries and Wildlife Sciences (0321) Virginia Polytechnic Institute and State University Blacksburg VA 24061 USA
4Current address Institute of Fisheries Research University of Michigan 1109 N University Avenue Ann Arbor MI 41809 USA
Corresponding authors e-mail ehallermvtedu
Keywords striped bass performance aquaculture growth
International Journal of Recirculating Aquaculture 5 (2004) 43-54 All Rights Reserved copyCopyright 2004 by Virginia Tech and Virginia Sea Grant Blacksburg VA USA
International Journal of Recirculating Aquaculture Volume 5 June 2004 43
Performance of Sunshine Bass and Backcross Hybrid Striped Bass
ABSTRACT Previous research has suggested that backcross hybrid striped bass (BX sunshine bass female x striped bass male) perform as well as F 1 hybrid striped bass (sunshine bass white bass female x striped bass male) for many economically important traits We conducted trials to compare rearing and growth traits of selected backcross hybrid striped bass with hybrid striped bass (HSB) We spawned and reared larval BX fry in two hatchery cycles measured fry growth and performance and compared them to past performance of HSB fry We conducted a grow-out trial of commercially-available hybrid striped bass versus backcross hybrid striped bass in replicated tanks to phase II fingerling size (approximately lOOg) Compared to HSB in the hatchery phase backcross hybrid striped bass exhibited lower fertilization rate comparable swimbladder inflation rate shorter time-to-weaning lower survival comparable growth and comparable condition factor After 60 days HSB exhibited significantly better growth survival and feed conversion efficiency than BX However BX may have better potential market acceptance by virtue of having a lower condition factor appearing longer and less deep-bodied than HSB
INTRODUCTION Striped bass (Morone saxatilis) and its hybrids constitute a major sector of aquaculture in the United States with production of 105 million pounds in 2002 (Carlberg and Van Olst 2003) Commercially significant quantities of Morone stocks also are produced in Taiwan China and Israel Approximately 43 of Morone production occurs in tanks (Carlberg and Van Olst 2003) much of that in recirculating aquaculture systems (RAS) Private and government marketing experts estimate that US production could increase to 50 million pounds and $100 million in annual farm-gate revenue if market prices could be decreased only moderately (Halbrendt et al 1991) Production costs for HSB could be reduced by 12 if selective breeding can yield 20 faster growth rates (Losordo and Westerman 1994)
The majority of Marone production is not of striped bass but of its hybrids with white bass (M chrysops) because of their hardiness rapid growth rate and limited availability of female striped bass broodstock (reviewed by Harrell 1997) Further female WB are considered easier and more predictable to strip-spawn Hence most commercial production
44 International Journal of Recirculating Aquaculture Volume 5 June 2004
Performance of Sunshine Bass and Backcross Hybrid Striped Bass
is of sunshine bass the progeny of the white bass female x striped bass male interspecific cross Research has also been undertaken to evaluate the performance of second generation hybrids and backcrosses Several studies have suggested that the progeny of F 1 hybrid striped bass females backcrossed to striped bass males have merit for commercial production Jenkins et al (1998) compared the performance of backcross hybrids to F1 hybrid striped bass and striped bass to market size in a recirculating system At harvest no differences in growth rate or feed conversion were detected specific growth of BX was intermediate to those of the other stocks with survival lower Tomasso et al (1999) compared performance of F 1 and backcross hybrids between 20 and 90 grams for 56 days in tanks (Tomasso et al 1999) and observed similar survival growth and feed conversion rates among the hybrid types Detailed comparison of the hatchery performance of sunshine and BX hybrids is lacking We hypothesized that use of selected hybrid striped bass and striped bass for the backcross might yield a high-performance BX hybrid Should high performance be realized progressive fish farmers might utilize this approach by selecting the best F1 hybrid females from their own production stocks making the backcross by strip-spawning them and fertilizing the eggs with purchased milt from selectively bred striped bass males (Kerby 1983) thereby obtaining a high-performance production stock that because of selection on the maternal stock is suited to their particular farm conditions
In this study we evaluated the production potential of backcross (BX) hybrid striped bass (female sunshine bass x male striped bass) We compared the hatchery and grow-out performance of BX spawned from select broodstock and sunshine bass (HSB) of common genetic background Specifically we evaluated spawning success hatch rate growth survival and feed conversion efficiency through the first six months of life In order to benchmark our results we ran a trial in replicated tanks with HSB supplied by the most widely-used commercial source of fingerlings (Keo Fish Farms Keo AR USA) and compared their performance with our BX All fish were cultured within intensive controlled-environment recirculating aquaculture systems
International Journal of Recirculating Aquaculture Volume 5 June 2004 45
Performance of Sunshine Bass and Backcross Hybrid Striped Bass
MATERIALS AND METHODS In July 2001 we crossed 4 hybrid striped bass females to each of 4 striped bass males to produce 16 families of backcross hybrid striped bass Poor fertilization rates resulted in a low yield of fry from this spawn However there were enough fry to pool and conduct a pilot commercial-scale hatchery run Randomly-chosen samples from the resulting 4000 fingerlings were used for the grow-out trial
In October 2001 we spawned 3 female HSB with 2 male SB and eventually produced 7000 fingerlings While this was not enough to grow in commercial-scale systems we collected hatchery performance data to corroborate our JulyAugust experience with BX
Fertilized eggs were incubated in McDonald jars Upon hatch the larvae swam out of the hatching jar and into a 1900-L larval rearing tank Replicate larval rearing tanks were stocked with approximately 25 larvae per liter Tanks were maintained with recirculating water and surface oil-skimming pads for the first 5 to 7 days post-hatch until swim-bladder inflation was completed For the second week post-hatch larval rearing tanks were maintained static with gentle central aeration except for an exchange of about 30 of the tank water over the course of two hours each day During the second week post-hatch larvae were fed rotifers enriched with Algamac (Aquafauna BioMarine Inc Hawthorne CA USA) maintained at a density of 10ml By the end of the second week larvae were weaned from rotifers to Artemia nauplii By the end of the third week the larvae were typically weaned from enriched Artemia to artificial feed (Biokyowa Inc Girardeau MO USA) Weaned larvae were graded just once around 60 days post-hatch to remove the top 1 to 2 of larger fish responsible for cannibalism
In November 2001 we purchased lOg fingerlings that represent typical industry-standard HSB from Keo Fish Farms (Keo AR USA) These HSB closely matched the size and weight of our BX from the July spawn for the grow-out trial BX and HSB fingerlings were each stocked separately in triplicate 1900-L round tanks connected to the same recirculating system and reared at 23degC and a salinity of 1-3 ppt All six tanks were similarly stocked initially (approximately 1 kgm3) Fish were offered 80 of their expected ration via belt-feeders and hand-fed to satiation twice a day Approximately every 3 weeks length and weight samples were taken from a randomly-chosen 15 of each tanks
46 International Journal of Recirculating Aquaculture Volume 5 June 2004
Performance of Sunshine Bass and Backcross Hybrid Striped Bass
population At the conclusion of the project the tanks reached typical commercial densities of 5 to 9 kgm3bull
We quantified reproductive and hatchery performance of the three groups including fertilization rate swimbladder inflation rate days to weaning onto artificial feed (ie date of first ingestion to date that gt90 ingested artificial feed) survival estimates to approximately 60 days after hatch and to the end of the study feed conversion rate and monthly average weight and length The trial continued until mid-February 2002 when the HSB averaged approximately lOOg Results from previous years hatchery efforts with HSB using similar rearing protocols were used for comparative purposes
Both the hatchery and grow-out systems employed water recirculation technology including drum-filters fluidized-bed biofilters oxygenation ozonation and automated pH and temperature control that maintained high water-quality standards throughout the trials
Differences in fish weight between the hybrid types were analyzed as a repeated-measures general linear mixed model Residual (restricted) maximum likelihood was used to estimate the model parameters Initial fish biomass in each of the tanks and the amount of feed provided to each of the tanks were included in the model as covariates to assess the influence of these concomitant variables on differences in weight A first-order autoregressive covariance structure was assumed for the repeated-measurements of fish weight
Differences in fish survival at the end of the grow-out trial were analyzed as a general linear model with tanks serving as a blocking factor Because fish survivalmortality is a binary response and thus will violate an assumption of normality the significance of the test comparing survival between the hybrid types was obtained by randomization (number of randomizations= 1000) whereby the F-statistic of the original test was compared to F-statistics obtained by randomly allocating the survival mortality data to the different hybrid types The Type-I error rate for all statistical tests was set equal to 005
International Journal of Recirculating Aquaculture Volume 5 June 2004 47
Performance of Sunshine Bass and Backcross Hybrid Striped Bass
Table 1 Comparison of hatchery traits of backcross (BX) and Fl hybrid (HSB) striped bass for traits of economic interest
Traits of interest BX-HSB BX-HSB HSB HSB HSB
Female parent strain1 AR ARMD AR AR AR
Male parent strain1 MD FL MD FL MD MD FL MD Canada
Spawn date Oct-01 Jul-01 Mar-01 Oct-00 Jan-99
Fertilization 32 22 53 57
Swimbladder inflation 90 50 98 95
Weaning start (DAH)2bull3 24 21 17 22
Weaning end (DAH4 33 32 37 38
Mean wt (g) at 60 DAH 042 052 042 05
Survival to 60 DAH 7 740 104
Mean L (mm) at 30 DAH 133 11 1225
Mean L (mm) at 36 DAH 139 167
Mean L (mm) at 75 DAH 367 404 452
Mean Wt (g) at 75 DAH 074 081 12 0825 11
Condition factor at 1g 123E-05 118E-05 1Strain abbreviations AR=Arkansas R MD=Maryland FL=Florida 2DAH=Days after Hatch 3Weaning start marks the first introduction and ingestion of dry feed to replace live feeds 4Weaning end denotes the time when the transition to dry feeds is complete and live feeds are no longer utilized
RESULTS
Hatchery Trial Results A summary of performance for hatchery traits of production interest for BX and HSB is presented in Table 1
The fertilization rate for the BX eggs was lower than that which we typically found with HSB (22-32 vs 55) and considerably lower than our experience in 2000 when we conducted fertilization trials with BX (80)
Swimbladder inflation rate ranged from 50 in the first hatchery run to 90 in the second run We attribute the low rate in the first run to
48 International Journal of Recirculating Aquaculture Volume 5 June 2004
Performance of Sunshine Bass and Backcross Hybrid Striped Bass
surface-film and system management problems We showed in the second run that swimbladder inflation in BX was comparable to that typically attainable (gt90) for Morone fry
Time-to-weaning onto dry diets was shorter (10 days versus 18 days) and earlier (day 33 versus day 38) for BX than for HSB Survival of BX to 60 days after hatch (7) was lower than expected on the basis of previous experience with HSB (gt10) Mean weights for BX at 60 days after hatch in two hatchery runs (052 and 042g) was similar to those for HSB (042 and 05g) However HSB exhibited greater mean weight than BX at 75 days after hatch (l04 vs 077g)
Condition factor (K) of BX (123 + 009) was not significantly different from those of HSB (119 + 005) or striped bass (l13 + 003) at 1 gram mean weight
Frequencies of deformities for BX (lt2) were lower than those in earlier reports Bosworth et al (1997) reported deformities in 8 of BX and 4 ofHSB
Grow-out Trial Results Overall there was not a significant difference in weight between the hybrid types (F = 606 df = 13 P = 00907) however as evidenced in
100
80
60
40
20
--+- BX - Overall -0- HSB - Overall -ltgt- BX - Individual Tanks A middot middot middotbullmiddotmiddot middot HSB - Individual Tanks fi
fi ~o
12 Dec 2001 3 Jan 2002 24 Jan 2002 12 Feb 2002
Date Figure 1 Meanfish weight(plusmn 2 SE) at each time period for backcross hybrid striped bass (BX) and hybrid striped bass (HSB) Also shown is meanfish weight at each time periodor groups in individual tanks
International Journal of Recirculating Aquaculture Volume 5 June 2004 49
Performance of Sunshine Bass and Backcross Hybrid Striped Bass
Figure 1 there was a significant interaction on fish weight by hybrid type and time (F = 5157 df = 1587 P lt 00001) Using the slicing option available in SAS (SAS Institute 1999) we tested for differences in weight between the hybrid types for each time period and found that although weights of HSB and BX were not significantly different during the first two measurement periods (Time 1 F = 027 df = 1587 P = 06032 Time 2 F = 036 df = 1587 P = 05496) the hybrid types did differ in weight during the last measurement periods Specifically HSB were significantly heavier than BX on the 24th of January 2002 (F = 1061 df = 1 587 P = 00032) and the 12th of February 2002 (F = 3788 df = 1587 P lt 00001) Overall HSB had a specific growth rate of 268 per
Table 2 Mean weights of backcross hybrid striped bass (BX) and hybrid striped bass (HSB) over the course of a 3-month growth trial
Date BXTank5
Wt(g) SE
112101 1228
BXTank6 Wt(g) SE
1201
BX Tank 12 Wt(g) SE
1274
HSB Tank 13 HSB Tank14 HSB Tank 15 Wt(g) SE Wt(g) SE Wt(g) SE
1180 1016 1088
1211201 1744 102 1778 095 1658 096 1798 109 1752 118 1704 109
1 302 27 60 1 38 28 76 155 27 04 154 3306 157 3424 149 3414 211
1 2402 4196 252 4424 207 4882 299 6344 263 6192 326 6432 362
212102 6332 317 6763 334 6912 299 9474 473 9553 452 10500 388
Table 3 Comparison of survivalfeed conversion ratio (FCR) and condition factor at 60 grams for backcross hybrid striped bass (BX) and hybrid striped bass (HSB)
Cross Tank
Starting
Ending
Survival
BXS
160
136
85
BX 6 BX 12 HSB 13 HSB 14 HSB 15
160
138
86
161
137
85
178
177
99
179
173
97
180
179
99
Starting Biomass (g) 1964 1922 2051 2100 1819 1958
Ending Biomass (g) 8612 9334 9469 16770 16526 18795
Feed Fed(g) 12106 12135 11447 18041 17805 20463
FCR 182 164 154 123 121 122
Condition Factor 168E-05 166E-05 169E-05 194E-05 193E-05 208E-05
SE 353E-07 337E-07 424E-07 255E-07 327E-07 845E-07
50 International Journal of Recirculating Aquaculture Volume 5 June 2004
Performance of Sunshine Bass and Backcross Hybrid Striped Bass
day while BX had a specific growth rate of 205 per day Neither of the covariates included in the model were found to have a significant effect on weight differences (initial tank biomass F = 142 df = 1587 P = 02332 amount of feed F = 005 df = 1587 P = 08165)
Performance regarding key economic traits-survival feed conversion efficiency and condition factor-are summarized in Table 3 At the end of the grow-out trial survival of HSB was significantly greater than that of BX (F = 6216 df = 1 1014 P lt 00001) Feed conversion ratio was better for HSB (122) than for BX (166) Condition factors for BX were lower than those for HSB (l68 vs 198) meaning that BX appeared longer and less deep-bodied than HSB
DISCUSSION Our data showed that F1 HSB performed as well or better than BX for a range of hatchery- and grow-out-related traits
Hatchery traits Fertilization rates for backcross lots were approximately half that for HSB There was a wide variance for fertilization and hatch rates of eggs from HSB females Some of this variance may be due to differences in hatchery protocols (different hormone injections used strip vs tank spawning) at the commercial hatcheries where the data were collected (TIJ Smith personal communication) Poor hatch rates also may be attributable in part to hybrid breakdown that is to developmental incompatibilities among the genomes of the respective species when coadapted gene complexes are broken up at meiosis in the F1 (Hallerman 2003)
In the hatchery trial we hypothesize that the low swimbladder inflation rate for our J~ly fry resulted from offering first feed to the BX too early When rearing HSB and SB fry we typically wait until the yolk sac has been largely resorbed and the fry mostly have inflated their swimbladders before we introduce live feed This is because live feed can cause an oily film on the water surface that interferes with a frys successful ingestion of air bubbles necessary to inflate the swimbladder (Chapman et al 1988) The timing of swimbladder inflation varies with fry type and temperature with HSB typically inflating between 3 and 6 days after hatch and SB 6 to 9 days after hatch BX fry inflate their swimbladder at an intermediate time 5 to 8 days after hatch (DAH) Since for the July
International Journal of Recirculating Aquaculture Volume 5 June 2004 51
Performance of Sunshine Bass and Backcross Hybrid Striped Bass
spawn we introduced feed into their tanks at the time prescribed for HSB (at 5 DAH) BX fry may have had a reduced opportunity to inflate their swimbladders because of interference by a surface film with air contact In the October spawn we monitored swimbladder inflation more carefully and introduced live feed on day 7 after almost 90 of swimbladders were inflated The low swimbladder inflation rate in the July hatchery run of BX may have had a direct impact on survival Larvae without inflated swimbladders expend more energy swimming exhibit reduced growth rates are less tolerant of stress and often sink to the tank bottom and die (Van Heukelem et al 2000)
BX were weaned more quickly and earlier onto dry diets than HSB which may have helped contribute to their ability to match the size and weight of HSB at 60 DAH Earlier weaning has economic merit since dry diets are generally cheaper and easier to feed than brine shrimp
Grow-out traits After 60 days post-hatch the growth and other performance differences between BX and HSB became more evident HSB exhibited significantly better growth survival and feed conversion ratios
We hypothesized that backcross hybrid striped bass might grow as fast or faster than the standard commercially-available F 1 hybrid striped bass if high-performance HSB females were selected as broodstock Our data regarding performance in intensive tank systems did not support this hypothesis Rather our observations accord with the classical view that the high performance of some interspecific hybrids is largely due to heterosis and that because the heterosis shown by an F 2 or backcross hybrid is only half that shown in an F1 (Falconer and Mackay 1996 p 257) that advanced generation hybrids would not perform as well as F1
hybrids Indeed F 2 HSB previously showed low hatch rates low larval survival and high variability of growth rate (Smith and Jenkins 1984 Smith et al 1985) Our results suggest that the heterosis expressed in HSB for growth and performance was greater than the selective breeding advantage we employed by crossing high performance HSB females with male striped bass Apparently the additive genetic variance contributed by the HSB and striped bass selected for size-at-age could not make up for the loss of dominance variance
BX may have better potential market acceptance by virtue of having a lower condition factor appearing longer and less deep-bodied than HSB more
52 International Journal of Recirculating Aquaculture Volume 5 June 2004
Performance of Sunshine Bass and Backcross Hybrid Striped Bass
like striped bass that are more familiar in many markets Fins Technologys market experience has shown that the premium-priced live markets prefer longer leaner fish such as the backcross There is the possibility that because of later maturity backcross hybrid striped bass may grow to larger sizes than hybrid striped bass This is attractive because there is an unserviced demand for larger (1 kg+) fish that can provide portion-controlled 7-9 ounce fillets for the restaurant and retail markets
ACKNOWLEDGEMENTS This project was supported by US Department of Agriculture-Small Business Innovation Research Program Phase I Grant no 2001-00373 EMH is supported by the USDA-CSREES Hatch Program and the Commonwealth of Virginia Aquaculture Initiative
REFERENCES Bosworth BG Libey GS Notter DR Egg Larval and Fingerling
Traits of Crosses among Striped Bass White Bass and their Fl Hybrids Aquaculture 1997 154 201-217
Carlberg J Van Olst J US Production and Sales of Hybrid Striped Bass (1987-2002) 2003 httpaquanicorgsbgaHSBversion5ppt
Chapman DC Hubert WA Jackson UT Influence of Access to Air and of Salinity on Gas Bladder Inflation in Striped Bass Progressive Fish-Culturist 1988 50 23-27
Falconer DS Mackay TFC 1996 Introduction to Quantitative Genetics Fourth Edition Longman Group Ltd Harlow Essex UK
Halbrendt CK Wirth FF Vaughn GF Conjoint Analysis of the Mid-Atlantic Food-Fish Market for Farm-Raised HSB Southern Journal of Agricultural Economics 1991 23 155-163
Hallerman EM Coadaptation and Outbreeding Depression In Po_pulation Genetics Principles and Applications for Fisheries Scientists Hallerman E (Ed) 2004 American Fisheries Society Bethesda MD USA
Harrell RM Hybridization and Genetics Striped Bass and Other Morone Culture In Harrell RM (Ed) 1997 Pages 217-234 Elsevier Science Amsterdam
International Journal of Recirculating Aquaculture Volume 5 June 2004 53
Performance of Sunshine Bass and Backcross Hybrid Striped Bass
Jenkins WE Heyward LD Sr Smith TIJ Performance of Domesticated Striped Bass Marone saxatilis Palmetto Bass and Backcross Hybrid Striped Bass (Sunshine Bass Female x Striped Bass Male) Raised in a Tank Culture System Journal of the World Aquaculture Society 1998 29 505-509
Kerby JH Cryogenic Preservation of Sperm from Striped Bass Transactions of the American Fisheries Society 1983 112 86-91
Losordo TM Westerman P An Analysis of Biological Economic and Engineering Factors Affecting the Cost of Fish Production in Recirculating Aquaculture Systems Journal of the World Aquaculture Society 1994 25 193-203
SAS Institute 1999 The SAS System for Windows version 82 SAS Institute Cary NC USA
Smith TlJ Jenkins WE Controlled Spawning of Fl Hybrid Striped Bass (Marone saxatilis x M chrysops) and Rearing of F2 Progeny Journal of the World Mariculture Society 1984 15 147-161
Smith TlJ Jenkins WE Snevel JF Production Characteristics of Striped Bass (Marone saxatilis) and Fl - F2 hybrids (Marone saxatilis and M chrysops) Reared in Intensive Tank Systems Journal of the World Mariculture Society 1985 16 57-70
Tomasso JR Kempton CJ Gallman A Smith TlJ Comparative Production Characteristics of Sunshine Bass and Sunshine Bass x Striped Bass in Recirculating-Water Systems North American Journal of Aquaculture 1999 61 79-81
Van Heukelem WF Harrell RM Hughes SG Lindell SR Friedmann BR Optimal Conditions for Swimbladder Inflation in Striped Bass Larvae Reared in Intensive Systems Northeast Regional Aquaculture Center Publication No 00-006 (2000) 5 pages
54 International Journal of Recirculating Aquaculture Volume 5 June 2004
Book Review
Fjofish apd Shellfish Bacteriology Mapua) Techpjques apd Procedures KA Whitman with contributions by NG MacNair
Iowa State Press (Blackwell Publishing Professional) Ames IA USA (2004) 288 pages ISBN 0813819520 US $4999
Reviewed by Rocco C Cipriano United States Geological Survey National Fish Health Research Laboratory 11649 Leetown Road Kearneysville WV 25430 USA E-mail rocco_ciprianousgsgov
Despite the fact that several good texts have been published regarding the description and nature of bacterial pathogens in aquatic animals there remained a need for a comprehensive yet practical guide devoted to techniques and procedures used for bacterial identification Diagnosis and detection of fish and shellfish pathogens often requires reliance upon standard microbiological media tests and reagents for some bacteria but more specialized assays are required for many aquatic pathogens In the latter case the products necessary for such assays are not commercially available and must be produced in aquatic animal diagnostic facilities from their basic ingredients Often therefore the compositions of differential media and the conduct of certain tests for the primary isolation or detection of specific aquatic pathogens are only available by referencing the general body of published scientific literature Hence until now there has not been a single-source shelf-volume that combines standard microbiological procedures used for routine detection and identification of medically important bacteria with the specialized needs of the fisheries profession This manual however helps to fill that void
The manual stands as a reference suitable for professional aquatic biologists with backgrounds in microbiology veterinarians and students of aquatic animal health Its strength lies in its coverage of the subject matter regarding culture-based diagnosis and identification of bacteria associated with finfish bivalves and lobsters Sections on
International Journal of Recirculating Aquaculture 5 (2004) 55-56 All Rights Reserved copyCopyright 2004 by Virginia Tech and Virginia Sea Grant Blacksburg VA USA
International Journal of Recirculating Aquaculture Volume 5 June 2004 55
Book Review FiQish and ShelJfish Bacteriology Manualmiddot Techniques and Procedures
aseptic collection and shipment of samples qualitative and quantitative procedures for bacterial isolation staining techniques media and standard biological tests used for the cultivation and phentotypic characterization of pathogenic bacteria and antibiotic sensitivity testing provide sound background for the student or novice practitioner Particularly beneficial for anyone who is not experienced with aquatic microbial pathogens is the section listing principal organs media and appropriate incubation temperatures to be used as the most probable sources of isolation for the specific bacteria
More experienced professionals will find it helpful and convenient to have the descriptions and interpretations of differential media (eg Coomassie Brilliant Blue Agar for Aeromonas salmonicida Rimler-Shotts Agar for Aeromonas hydropila Cytophaga Agar Shieh and TYES for Flavobacterium spp and Edwardsiella ictaluri Agar and various other media for Renibacterium salmoninarum) listed in a single source The major identifying criteria that phenotypically characterize selected bacterial pathogens are also described in tabulated form Specialized tests such as the SIF test to detect covert infections nurse culture techniques for enhanced bacterial growth and assays for public health indicator organisms in bivalves are documented Sections covering serology immunoassay and non-cultured based molecular assays (eg polymerase chain reaction) are also presented but are not as completely summarized as those for bacterial isolation In summary the nature of this manual makes it appropriate for frequent use as a practical laboratory guide
56 International Journal of Recirculating Aquaculture Volume 5 June 2004
Subscription Information
International Journal of Recirculating Aquaculture
A publication ofVirginia Tech and the Virginia Sea Grant College Program
IJRA presents the latest developments in RAS-related research focusing on the areas of
Food Quality Pathology
Food Safety
Aquatic Medicine Breeding amp Genetics Waste Management
FishShellfish Growth amp Nutrition Recirculating Systems Mgmt Marketing amp Economics Water Conservation
Dont miss an issue of this informative peer-reviewed journal Subscribe now using your credit card by calling 540-231-2075 or by printing out a form at wwwcfastvteduijrahtml If you prefer you can also mail this form to the address below along with a check or money order
Name ----------------~ Address ----------------Line2 ------------------City ____________ State __ _ Country Postal Code ___________ _ Phone Fax -------- --------e-mail-----------------check _ 2 year ($25 US)
International Journal of Recirculating Aquaculture Food Science amp Technology Building (0418)
Virginia Polytechnic Institute and State University Blacksburg VA 24061
phone (540) 231-2075 fax (540) 231-9293 e-mail IJRAvtedu
International Journal of Recirculating Aquaculture Volume 5 June 2004 57
~ International Journal of ~ Recirculating Aquaculture A publication of Virginia Tech and the Virginia Sea Grant College Program
Instructions for Authors The International Journal of Recirculating Aquaculture (IJRA) encourages the submission of original high-quality papers on research in all aspects of recirculating aquaculture Papers will be peer-reviewed and evaluated for scientific merit relevance and for their usefulness in promoting the advancement of recirculating aquaculture Complete coherent projects are preferred Any related papers submitted together must be thoroughly cross-referenced All papers must be original meaning that the data and the information presented must be the work of the authors and can not have been published elsewhere Dual publication of a paper or data is possible only through the permission of the Editors of both journals THERE ARE NO PAGE CHARGES for IJRA submissions
INITIAL MANUSCRIPT SUBMISSION Manuscripts should be sent to Ms Angela Correa Managing Editor by mail using the address listed at the end of these instructions or by e-mail to (ijravtedu) Submit four (4) copies of each manuscript if regular mail is used All manuscripts must be in English Dot matrix type is not acceptable and all such submissions will be returned without review Each submission must include a cover letter stating that the paper contains original research and that the information has not been published elsewhere E-mailed submissions must be saved in doc format Be sure to include the names of colleagues who have already reviewed the work presented IJRA has two categories for submission 1 Articles which are complete in-depth scientific studies and 2 Notes which are short papers of limited scope Articles and notes will be critically reviewed by two or three experts as well as by the Managing Editor Submissions may be returned without peer review in cases where the Managing Editor determines that they are inappropriate for the journal of poor quality poorly written or fail to follow the journals style format
PREPARATION OF MANUSCRIPTS IJRA uses the latest editions of Websters New International Dictionary and Websters New Collegiate Dictionarv for standard spellings and word definitions All spelling will be in American English Foreign or science-related terminology that is unfamiliar and does not appear in these dictionaries will require an accompanying definition Acceptable scientific and common names of fishes are listed in A List of Common and Scientific Names of Fishes from the United States and Canada published by the American Fisheries Society Common names may be used throughout each paper but must be accompanied by a full scientific name when they first appear in a paper The author must use the full common name eg yellow perch not perch All foreign language words should be italicized in the manuscript
In the manuscript number each page sequentially and include the senior authors name next to the page number (eg Page 4 Jahncke) on each page Single-space all typed material including references Type size in the body of the text should be no larger than 12pts and no smaller than 10 pts Subsection headings should also be italicized in the manuscript Spell out one-digit numbers except when they are used with units of measure - eg six ponds 7 days
International Journal of Recirculating Aquaculture Volume 5 June 2004 59
Spell out any number that begins a sentence When two numbers occur sequentially in the text one of the numbers must be spelled out- eg In 1987 fifty fish were stocked Use commas in numbers of 1000 or more Use the 24-hour clock to describe time- eg 1300 not 100 pm
Keep footnotes to a minimum and number them sequentially throughout the paper All units of measurement must be reported via the metric system except in special circumstances (eg horsepower) Standard scientific abbreviations and symbols may be used without definition If the use of a symbol could cause confusion define the symbol the first time it is used On the final draft of a paper that has been accepted for publication Greek letters or other extraneous symbols that do not appear on a keyboard the name of the symbol should be noted where the symbol is used to help eliminate prepress errors Parts per million or milligrams per liter can be
-1 reported as either ppm or mgI but not as mgI
Commonly used aquaculture jargon can be used without defining the term - eg fry fingerling hapa Less commonly used jargon may also be used but terms should be defined the first time they are used Jargon from fields outside of aquaculture should also be defined the first time they are used Always place a zero to the left of a decimal point if the number is less than one this includes probability values - eg P = 005 not P = 05
COMPONENTS OF THE MANUSCRIPTS Articles and notes should include a title names of authors and their addresses abstract introduction materials and methods results discussion (or a combined results and discussion) conclusion (rarely) acknowledgements (if any) references figures and tables in that order Each section should start on a new page
Title - The title should accurately reflect the contents of the paper Brief concise titles are encouraged The title page must include the name(s) of the author(s) and all addresses
Abstract - The abstract should be a concise highlight of the results and conclusions Methodology should not be abstracted unless it is necessary to explain the results or unless the paper describes a new technique Abstracts should be less than 300 words
Introduction - The introduction should explain why the paper was written and why it should be read The introduction should condense the relevant information in the field that led the author to do the research The introduction is not a complete literature review and only the most relevant references should be cited The introduction should also contain a statement that describes the purpose or objective of the paper
Materials and Methods - The underlying goal of this section is to describe what was done so that others can repeat the experiment If previously published papers described a technique that was used they can be cited to prevent unnecessary repetition If the technique or process was modified the modification must be described so that others can repeat the process Experimental designs can be explained by use of figures if they will help clarify what was done If the experiment was a complicated one with many subparts subsections may be used to describe each subpart
Results - This section describes the data Proper use of tables and figures can simplify and help explain the results Statistical analysis of data is necessary unless differences are so obvious that statistical analysis is superfluous Although probability values of 005 and 001 are traditionally used each author is free to choose his or her own level of significance
60 International Journal of Recirculating Aquaculture Volume 5 June 2004
Discussion - This section should interpret the results and compare the results from this experiment to those found in similar research The section can also be used to speculate about the results to provide reasons for the trends and to suggest new ideas that can advance our understanding about aquaculture This section should not be a literature review section that merely compares results among several papers
Results and Discussion - Results and discussion sections can be combined In most cases this leads to a better paper because the integration of these sections leads to a more meaningful interpretation of data
Conclusion - This section should be used only when the results of an experiment lead to an unequivocal interpretation
Acknowledgements - This section should be used to thank organizations that supported the research monetarily and individuals who assisted in the research or preparation of the paper This section includes manuscript number designations for those institutions that assign such numbers
References - Select references with great care Unless the paper includes a literature review there is no need to reference every paper written about a subject Use only the most important ones
Figures and Tables - All figures andtables go after the references Figures always go before tables
Section headings (eg Materials and Methods) should be capitalized and in bold type Secondary headings should be balded and go flush left Tertiary headings are incorporated into the first paragraph of that subsection Tertiary headings are italicized and separated from the text by a double dash
In the text references are cited in one of two ways 1 Swingle (1959) evaluated two species of tilapia or 2 pond culture in Alabama began in the 1950s (Swingle 1959) When there are three or more authors list only the first in a citation and follow that with et al eg Smitherman et al (1983) reviewed catfish breeding work at Auburn University If the name of an institutional author is long it can be abbreviated in a citation eg Food and Agriculture Organization of the United Nations may be abbreviated as FAO When several citations are used in a single entry they are listed chronologically If you are citing two papers that were written by the same author(s) the name only has to appear once per citation followed by the years that designate the different papers Separate the years with a comma If you are citing two authors you must separate the citations with a semicolon (Smith 1975 1976 Jones 1976)
In the reference section the reference list is strictly alphabetical by last name of the senior author and then by initials if two authors have identical last names If an author has written more than one paper the following format should be followed All single authored papers go first followed by co-authored papers and then the papers that were written by three or more authors If an author has written more than one single-authored paper the papers are listed chronologically If an author has written more than one co-authored paper they are listed alphabetically by the second authors last name If a tandem has authored two or more papers the order is chronological Papers written by the same group of three or more authors should be listed chronologically
International Journal of Recirculating Aquaculture Volume 5 June 2004 61
The following format will be used when referencing various works
PAPERS Single-author papers
McGinty AS Effects of Size at Stocking on Competition and Growth of All-Male Tilapia Hybrids Journal of the World Aquaculture Society 1985 16 52-56
Multiple-author papers Tave D Smitherman RO Predicted Response to Selection for Early Growth in Tilapia nilotica Transactions of the American Fisheries Society 1980 109 439-445
If an author has published two or more papers in the same year follow the years with a letter to differentiate them eg Smith 1988a 1988b Use issue numbers only when each issue starts out with page 1 If pagination is consecutive throughout the volume omit the issue number Spell out journal names in their entirely without abbreviations
Papers in proceedings or in edited volumes Nicholson LC Woods LC Ill Woiwode JG Intensive Culture Techniques for the Striped Bass and its Hybrids In Culture and Propagation of Striped Bass and Its Hybrids Harrell RM Kerby JH Minton RV Eds 1990 American Fisheries Society Bethesda MD USA
Books and reportspublications from governmental or non-governmental bodies
Lovell T 1989 Nutrition and Feeding of Fish Van Nostrand Reinhold New York NY USA
Food and Agriculture Organization of the United Nations (FAO) Fisheries Department 1997 Review of the State of World Aquaculture No 886 FIRlC886 FAO Rome Italy
Theses and Dissertations
Easter CC 1992 Water Chemistry Characterization and Performance of a Recirculating Aquaculture System Producing Hybrid Striped Bass Masters thesis Virginia Polytechnic Institute and State University Blacksburg VA USA
Websites
Federation of European Aquaculture Producers (FEAP) European Eel Production (httpwwwfeaporgeelshtml) 2002
Page numbers for proceedings books theses and dissertations are unnecessary Government publications should be treated as if they were books but document numbers must be included THE ACCURACY OF REFERENCES IS THE SOLE RESPONSIBILITY OF THE AUTHORS MAKE SURE THAT CITATIONS AND REFERENCES MATCH
Tables - When creating a table decide what the purpose of the table is and what points are important then organize the table so that the main features can be easily understood The table heading should provide sufficient information for the table to be understood as an entity Keep footnotes to a minimum Each table goes on a separate page Tables must be camera ready TABLES WILL BE PRINTED AS IS AND WILL NOT BE TYPESET Figures - List all figure captions on separate pages Original artwork doesnt have to be submitted when a paper is first submitted for review but original artwork must accompany the final revised manuscript Good quality photocopies are acceptable when a manuscript
62 International Journal of Recirculating Aquaculture Volume 5 June 2004
is submitted for review Graphs and original artwork must be printed with a laser printer or done in pen and ink Dot-matrix figures are not acceptable Original artwork or high-contrast photographs are acceptable Label all figures on the back with a soft pencil name of senior author paper title and figure number
Photographs - Should be on glossy paper with good contrast Do not glue pictures to cardboard Color photographs can be printed but the additional cost of printing them will be charged to the author Label all photos on the back with a soft pencil name of senior author paper title and figure number
FINAL REVISED MANUSCRIPTS If using the mail submit two copies of the final revised manuscript including original artwork Submit either the original pen-and-ink drawings or laser-printed versions of the drawings In addition submit the manuscript on a disk (CD preferable) or by e-mail On the disk write the brand name of the computer or word processor the word processing program that was used (should be Microsoft Word) the title of your article and the file name NOTE Disk and hard copy must agree In case of discrepancies it is the policy of IJRA to follow hard copy An electronic version of the completed manuscript is needed in order to publish AUTHORS MAY NOT RECEIVE PAGE PROOFS Proofreading will be done by the Production Office of IJRA using the revised final version of the manuscript Therefore authors must be especially careful that no errors exist in the final revised version because in most cases no changes are possible after it is submitted
REPRINTS The senior author will receive two copies of the journal and a pdf file of the article for distribution and reprinting purposes The junior author(s) will also receive two copies of the journal issue These are sent several weeks after the journal is published and in circulation Requests for the pdf format of the article can only be made by the corresponding author
COPYRIGHT amp PERMISSIONS For permission to reprint articles that have appeared in IJRA please contact IJRA Copyright amp Permissions Food Science amp Technology Building (0418) Virginia Tech Blacksburg VA 24061 USA
COPYRIGHT TRANSFER If your manuscript is accepted for publication copyright ownership must be officially transferred to IJRA The Editors acceptance letter will include a form fully explaining this The form must be signed by all authors and the original returned to the Editor at this time Failure to return the copyright form in a timely fashion will result in delay in publication
Send your submissions to International Journal of Recirculating Aquaculture
AI Correa Managing Editor 27-B Food Science and Technology Building (0418) Virginia Polytechnic Institute and State University Blacksburg VA 24061 USA
If you have any questions please feel free to contact us Phone (540) 231-2075 Fax (540) 231-9293 e-mail ijravtedu
International Journal of Recirculating Aquaculture Volume 5 June 2004 63

Hematology and Blood Chemistry of Yellow Perch (Perea flavescens)
T bull middotmiddot ~~ - middot
N -
Figure I Characteristic blood cells from yellow perch reared in recirculation systems Blood smears were made with EDTA anticoagulated blood stained with Wrights Geimsa stain Cells are abbreviated as follows U - Large lymphocyte SL - small lymphocyte T - thrombocyte R - reticulocytes (immature erythrocyte) PC - plasma cell (activated lymphocyte) M- monocyte N-neutrophil The blue bar in frame A is Omm
International Journal of Recirculating Aquaculture Volume 5 June 2004 37
Hematology and Blood Chemistry of Yellow Perch (Percajlavescens)
The thrombocytes were slightly smaller than the erythrocytes (Fig IA) They had clear cytoplasm and were variable in shape being elongated pyriform oval or round Nuclear shape tended to follow cytoplasmic shape although oval and round thrombocyte nuclei occasionally were lobulated (Fig IB) as described for striped bass and tilapia (Hrubec et al 1996 2000)
Leukocytes made up the remainder of the cell types seen in the blood and included small and large lymphocytes neutrophils and monocytes No eosinophils or heterophils were observed Small lymphocytes were the smallest cell present with a rim of blue cytoplasm surrounding the round nucleus (Fig IA E F) Large lymphocytes had an abundant and darker blue cytoplasm and the nucleus was larger than observed in the small lymphocyte (Fig IA E) Plasma cells were occasionally observed with a classic open nucleus abundant dark blue cytoplasm and a clear cytoplasmic region adjacent to the nucleus presumably representing the Golgi as in mammalian plasma cells (Fig IC) Plasma cells were included in the large lymphocytes category for the differential counts
Neutrophils were the largest cell present in the blood (Fig ID E F) The cytoplasm of the neutrophil was a translucent grey containing no granules and infrequent vacuoles Cytoplasmic shape was round to angular as the cellular borders often appeared slightly adherent to adjacent erythrocytes distorting cellular shape Nuclear shape of the neutrophil varied from round to horseshoe shaped and frequently segmented into two prominent lobes connected by a thin nuclear bridge (Fig IF) Monocytes had abundant dark blue cytoplasm that was frequently vacuolated (Fig ID) The round to kidney-bean shaped monocyte nucleus was large with prominent chromatin clumping
Analysis of blood parameters can provide a wealth of information useful in analyzing the effects of disease and sub-optimal environmental conditions Providing reference intervals for healthy adult yellow perch reared in recirculation systems furnishes veterinarians and fish health professionals the foundation to develop diagnostic hematology for this species The number of studies that determine actual reference intervals for fish species is limited The majority of blood values determined for fishes are reported in the literature as a mean value with a standard deviation Historically reference intervals were determined as two standard deviations from the mean however this method is only valid when blood values follow a normal distribution It is incorrect to assume
38 International Journal of Recirculating Aquaculture Volume 5 June 2004
Hematology and Blood Chemistry of Yellow Perch (Percaflavescens)
that biological parameters are distributed normally therefore non-parametric methods should be used to accurately determine reference intervals (Reed et al 1971) Techniques to properly determine reference intervals have been established by the NCCLS (1992) and suggestions for their use and interpretation have been discussed (Lumsden 1998) As with mammalian species reference intervals need to be determined for different populations of fish within a single species as culture conditions and environmental variables affect blood values to the extent that they are outside the reference interval (Ram-Bhaskar and Srinivasa-Rao 1989 Hrubec et al 1996 1997ab 2000 2001) Although the reference range for some of the blood parameters appears large it is still possible to detect variation in hematologic values associated with pathological conditions (Hrubec et al 1997b and unpublished data)
Developing reference intervals is a necessary first step in determining which specific hematological changes can be associated with disease conditions As the field of fish hematology develops its usefulness to the aquaculture industry will increase Information derived by standardized non-lethal diagnostic assays will be needed to enhance the culture of yellow perch and other fish species Analysis of diagnostic blood samples can provide a means for early detection of infectious disease and assist in the identification of sub-lethal conditions affecting production performance This should allow for more specific timely and effective disease treatments in the future
ACKNOWLEDGEMENTS The authors wish to thank Mark Kidd of the Virginia Tech Aquaculture Center for his assistance with fish care and sampling
REFERENCES Grabda E Einszporn-Orecka T Felinska C Zbanyszek R
Experimental Methemoglobinemia in Rainbow Trout Acta Ichthyologica et Piscatoria 1974 4 43-71
Hrubec TC Smith SA Robertson JL Feldman B Veit HP Libey G Tinker MK Comparison of Hematologic Reference Intervals between Culture System and Type of Hybrid Striped Bass American Journal of Veterinary Research 1996 57 618-623
International Journal of Recirculating Aquaculture Volume 5 June 2004 3 9
Hematology and Blood Chemistry of Yellow Perch (Percajiavescens)
Hrubec TC Robertson JL Smith SA Effects of Temperature on Hematologic and Serum Biochemical Profiles of Hybrid Striped Bass (Morone chrysops x Morone saxatilis) American Journal of Veterinary Research 1997a 58 126-130
Hrubec TC Robertson JL Smith SA Effects of Ammonia and Nitrate Concentration on Hematologic and Serum Biochemical Profiles of Hybrid Striped Bass (Morone chrysops x Morone saxatilis) American Journal of Veterinary Research 1997b 58 131-135
Hrubec TC Smith SA Hematology and Plasma Chemistry Values for Production Tilapia ( Oreochromis hybrid) Raised in a Recirculation System International Journal of Recirculating Aquaculture 2000 J 5-14
Hrubec TC Cardinale JL Smith SA Hematology and Plasma Chemistry Reference Intervals for Cultured Tilapia ( Oreochromis hybrid) Veterinary Clinical Pathology 2000 29 7-12
Hrubec TC Smith SA Robertson JL Age Related Differences in Hematologic and Plasma Chemistry Analytes of Hybrid Striped Bass Morone chrysops x Morone saxatilis Veterinary Clinical Pathology 2001 30 8-15
Huffman PA Arkoosh MR Characteristics of Peripheral Blood Cells from Rainbow Trout Evaluated by Particle Counter Image Analysis and Hemocytometric Techniques Journal of Aquatic Animal Health 1997 9 239-248
Kelly AM Yellow Perch Culture in the United States Manna or Mania World Aquaculture 2000 31 4-17
Lumsden JH Normal or reference values Questions and Comments Veterinary Clinical Pathology 1998 27 102-106
Mallison JA 2000 A White Paper on the Status and Needs of Yellow Perch Aquaculture in the North Central Region North Central Regional Aquaculture Center Michigan State University E Lansing MI USA
Natt MP Herrick CA A New Blood Diluent for Counting Erythrocytes and Leukocytes of the Chicken Poultry Science 1952 31 735-738
40 International Journal of Recirculating Aquaculture Volume 5 June 2004
Hematology and Blood Chemistry of Yellow Perch (Percaflavescens)
NCCLS National Committee for Clinical Laboratory Standards 1992 How to Define Determine and Utilize Reference Intervals in the Clinical Laboratory Proposed Guidelines NCCLS Document C28-P Villanova PA USA
Nelson JA Mitchell GS Blood Chemistry Response to Acid in Yellow Perch (Perea flavescens) Comparison of Populations from Naturally Acidic and Neutral Environments Physiological Zoology 1992 65 493-514
Nelson JA Magnuson J J Chulkasem W Blood Oxygen Capacity Differences in Yellow Perch (Percaflavescens) from Northern Wisconsin Lakes Differing in pH Canadian Journal of Fisheries and Aquatic Sciences 1988 45 1699-1704
Ram-Bhaskar B Srinivasa-Rao K Influence of Environmental Variables on Hematology and Compendium of Normal Hematological Ranges of Milkfish Chanos chanos (Forskal) in Brackish Culture Aquaculture 1989 83 123-136
Reed AH Henry RJ Mason WB Influence of Statistical Method Used on the Resulting Estimate of Normal Range Clinical Chemistry 1971 17 275-284
Schmitz M 1999 Comparative Growth of All-Female Versus Mixed Sex Yellow Perch (Percaflavescens) in Recirculating Aquaculture Systems MS Thesis Virginia Tech Blacksburg VA USA
Toneys ML Coble DW Mortality Hematocrit Osmolality Electrolyte Regulation and Fat Depletion of Young-of-the-Year Freshwater Fishes under Simulated Winter Conditions Canadian Journal of Fisheries and Aquatic Science 1980 37 225-232
van den Heuvel MR Power M Richards J MacKinnon M Dixon DG Disease and Gill Lesions in Yellow Perch (Percaflavescens) Exposed to Oil Sands Mining-Associated Waters Ecotoxicology and Environmental Safety 2000 46 334-341
Wedemeyer GA Nelson NC Statistical Methods for Estimating Normal Blood Chemistry Ranges and Variance in Rainbow Trout (Salmo gairdneri) Shasta Strain Journal of the Fisheries Research Board of Canada 1975 32 551-554
International Journal of Recirculating Aquaculture Volume 5 June 2004 41
Hematology and Blood Chemistry of Yellow Perch (Percajlavescens)
Zinkl JG Avian Hematology In Schalms Veterinary Hematology (4th edition) Jain NC (Ed) 1986 Pages 256-260 Lippincott Williams amp Wilkins Philadelphia PA USA
42 International Journal of Recirculating Aquaculture Volume 5 June 2004
Hatchery and Grow-out Performance of Sunshine Bass and Backcross Hybrid Striped Bass in Recirculating Aquaculture Systems
SR Lindell1bull2 B Delbos1 R Perham1 J Goldman1 EM Hallerman3 TO Brenden3bull4
1 Fins Technology 15 Industrial Road Turners Falls MA 01376 USA
2Current address Marine Biological Laboratory Marine Resources Center 7 MBL Street Woods Hole MA 02543 USA
3Department of Fisheries and Wildlife Sciences (0321) Virginia Polytechnic Institute and State University Blacksburg VA 24061 USA
4Current address Institute of Fisheries Research University of Michigan 1109 N University Avenue Ann Arbor MI 41809 USA
Corresponding authors e-mail ehallermvtedu
Keywords striped bass performance aquaculture growth
International Journal of Recirculating Aquaculture 5 (2004) 43-54 All Rights Reserved copyCopyright 2004 by Virginia Tech and Virginia Sea Grant Blacksburg VA USA
International Journal of Recirculating Aquaculture Volume 5 June 2004 43
Performance of Sunshine Bass and Backcross Hybrid Striped Bass
ABSTRACT Previous research has suggested that backcross hybrid striped bass (BX sunshine bass female x striped bass male) perform as well as F 1 hybrid striped bass (sunshine bass white bass female x striped bass male) for many economically important traits We conducted trials to compare rearing and growth traits of selected backcross hybrid striped bass with hybrid striped bass (HSB) We spawned and reared larval BX fry in two hatchery cycles measured fry growth and performance and compared them to past performance of HSB fry We conducted a grow-out trial of commercially-available hybrid striped bass versus backcross hybrid striped bass in replicated tanks to phase II fingerling size (approximately lOOg) Compared to HSB in the hatchery phase backcross hybrid striped bass exhibited lower fertilization rate comparable swimbladder inflation rate shorter time-to-weaning lower survival comparable growth and comparable condition factor After 60 days HSB exhibited significantly better growth survival and feed conversion efficiency than BX However BX may have better potential market acceptance by virtue of having a lower condition factor appearing longer and less deep-bodied than HSB
INTRODUCTION Striped bass (Morone saxatilis) and its hybrids constitute a major sector of aquaculture in the United States with production of 105 million pounds in 2002 (Carlberg and Van Olst 2003) Commercially significant quantities of Morone stocks also are produced in Taiwan China and Israel Approximately 43 of Morone production occurs in tanks (Carlberg and Van Olst 2003) much of that in recirculating aquaculture systems (RAS) Private and government marketing experts estimate that US production could increase to 50 million pounds and $100 million in annual farm-gate revenue if market prices could be decreased only moderately (Halbrendt et al 1991) Production costs for HSB could be reduced by 12 if selective breeding can yield 20 faster growth rates (Losordo and Westerman 1994)
The majority of Marone production is not of striped bass but of its hybrids with white bass (M chrysops) because of their hardiness rapid growth rate and limited availability of female striped bass broodstock (reviewed by Harrell 1997) Further female WB are considered easier and more predictable to strip-spawn Hence most commercial production
44 International Journal of Recirculating Aquaculture Volume 5 June 2004
Performance of Sunshine Bass and Backcross Hybrid Striped Bass
is of sunshine bass the progeny of the white bass female x striped bass male interspecific cross Research has also been undertaken to evaluate the performance of second generation hybrids and backcrosses Several studies have suggested that the progeny of F 1 hybrid striped bass females backcrossed to striped bass males have merit for commercial production Jenkins et al (1998) compared the performance of backcross hybrids to F1 hybrid striped bass and striped bass to market size in a recirculating system At harvest no differences in growth rate or feed conversion were detected specific growth of BX was intermediate to those of the other stocks with survival lower Tomasso et al (1999) compared performance of F 1 and backcross hybrids between 20 and 90 grams for 56 days in tanks (Tomasso et al 1999) and observed similar survival growth and feed conversion rates among the hybrid types Detailed comparison of the hatchery performance of sunshine and BX hybrids is lacking We hypothesized that use of selected hybrid striped bass and striped bass for the backcross might yield a high-performance BX hybrid Should high performance be realized progressive fish farmers might utilize this approach by selecting the best F1 hybrid females from their own production stocks making the backcross by strip-spawning them and fertilizing the eggs with purchased milt from selectively bred striped bass males (Kerby 1983) thereby obtaining a high-performance production stock that because of selection on the maternal stock is suited to their particular farm conditions
In this study we evaluated the production potential of backcross (BX) hybrid striped bass (female sunshine bass x male striped bass) We compared the hatchery and grow-out performance of BX spawned from select broodstock and sunshine bass (HSB) of common genetic background Specifically we evaluated spawning success hatch rate growth survival and feed conversion efficiency through the first six months of life In order to benchmark our results we ran a trial in replicated tanks with HSB supplied by the most widely-used commercial source of fingerlings (Keo Fish Farms Keo AR USA) and compared their performance with our BX All fish were cultured within intensive controlled-environment recirculating aquaculture systems
International Journal of Recirculating Aquaculture Volume 5 June 2004 45
Performance of Sunshine Bass and Backcross Hybrid Striped Bass
MATERIALS AND METHODS In July 2001 we crossed 4 hybrid striped bass females to each of 4 striped bass males to produce 16 families of backcross hybrid striped bass Poor fertilization rates resulted in a low yield of fry from this spawn However there were enough fry to pool and conduct a pilot commercial-scale hatchery run Randomly-chosen samples from the resulting 4000 fingerlings were used for the grow-out trial
In October 2001 we spawned 3 female HSB with 2 male SB and eventually produced 7000 fingerlings While this was not enough to grow in commercial-scale systems we collected hatchery performance data to corroborate our JulyAugust experience with BX
Fertilized eggs were incubated in McDonald jars Upon hatch the larvae swam out of the hatching jar and into a 1900-L larval rearing tank Replicate larval rearing tanks were stocked with approximately 25 larvae per liter Tanks were maintained with recirculating water and surface oil-skimming pads for the first 5 to 7 days post-hatch until swim-bladder inflation was completed For the second week post-hatch larval rearing tanks were maintained static with gentle central aeration except for an exchange of about 30 of the tank water over the course of two hours each day During the second week post-hatch larvae were fed rotifers enriched with Algamac (Aquafauna BioMarine Inc Hawthorne CA USA) maintained at a density of 10ml By the end of the second week larvae were weaned from rotifers to Artemia nauplii By the end of the third week the larvae were typically weaned from enriched Artemia to artificial feed (Biokyowa Inc Girardeau MO USA) Weaned larvae were graded just once around 60 days post-hatch to remove the top 1 to 2 of larger fish responsible for cannibalism
In November 2001 we purchased lOg fingerlings that represent typical industry-standard HSB from Keo Fish Farms (Keo AR USA) These HSB closely matched the size and weight of our BX from the July spawn for the grow-out trial BX and HSB fingerlings were each stocked separately in triplicate 1900-L round tanks connected to the same recirculating system and reared at 23degC and a salinity of 1-3 ppt All six tanks were similarly stocked initially (approximately 1 kgm3) Fish were offered 80 of their expected ration via belt-feeders and hand-fed to satiation twice a day Approximately every 3 weeks length and weight samples were taken from a randomly-chosen 15 of each tanks
46 International Journal of Recirculating Aquaculture Volume 5 June 2004
Performance of Sunshine Bass and Backcross Hybrid Striped Bass
population At the conclusion of the project the tanks reached typical commercial densities of 5 to 9 kgm3bull
We quantified reproductive and hatchery performance of the three groups including fertilization rate swimbladder inflation rate days to weaning onto artificial feed (ie date of first ingestion to date that gt90 ingested artificial feed) survival estimates to approximately 60 days after hatch and to the end of the study feed conversion rate and monthly average weight and length The trial continued until mid-February 2002 when the HSB averaged approximately lOOg Results from previous years hatchery efforts with HSB using similar rearing protocols were used for comparative purposes
Both the hatchery and grow-out systems employed water recirculation technology including drum-filters fluidized-bed biofilters oxygenation ozonation and automated pH and temperature control that maintained high water-quality standards throughout the trials
Differences in fish weight between the hybrid types were analyzed as a repeated-measures general linear mixed model Residual (restricted) maximum likelihood was used to estimate the model parameters Initial fish biomass in each of the tanks and the amount of feed provided to each of the tanks were included in the model as covariates to assess the influence of these concomitant variables on differences in weight A first-order autoregressive covariance structure was assumed for the repeated-measurements of fish weight
Differences in fish survival at the end of the grow-out trial were analyzed as a general linear model with tanks serving as a blocking factor Because fish survivalmortality is a binary response and thus will violate an assumption of normality the significance of the test comparing survival between the hybrid types was obtained by randomization (number of randomizations= 1000) whereby the F-statistic of the original test was compared to F-statistics obtained by randomly allocating the survival mortality data to the different hybrid types The Type-I error rate for all statistical tests was set equal to 005
International Journal of Recirculating Aquaculture Volume 5 June 2004 47
Performance of Sunshine Bass and Backcross Hybrid Striped Bass
Table 1 Comparison of hatchery traits of backcross (BX) and Fl hybrid (HSB) striped bass for traits of economic interest
Traits of interest BX-HSB BX-HSB HSB HSB HSB
Female parent strain1 AR ARMD AR AR AR
Male parent strain1 MD FL MD FL MD MD FL MD Canada
Spawn date Oct-01 Jul-01 Mar-01 Oct-00 Jan-99
Fertilization 32 22 53 57
Swimbladder inflation 90 50 98 95
Weaning start (DAH)2bull3 24 21 17 22
Weaning end (DAH4 33 32 37 38
Mean wt (g) at 60 DAH 042 052 042 05
Survival to 60 DAH 7 740 104
Mean L (mm) at 30 DAH 133 11 1225
Mean L (mm) at 36 DAH 139 167
Mean L (mm) at 75 DAH 367 404 452
Mean Wt (g) at 75 DAH 074 081 12 0825 11
Condition factor at 1g 123E-05 118E-05 1Strain abbreviations AR=Arkansas R MD=Maryland FL=Florida 2DAH=Days after Hatch 3Weaning start marks the first introduction and ingestion of dry feed to replace live feeds 4Weaning end denotes the time when the transition to dry feeds is complete and live feeds are no longer utilized
RESULTS
Hatchery Trial Results A summary of performance for hatchery traits of production interest for BX and HSB is presented in Table 1
The fertilization rate for the BX eggs was lower than that which we typically found with HSB (22-32 vs 55) and considerably lower than our experience in 2000 when we conducted fertilization trials with BX (80)
Swimbladder inflation rate ranged from 50 in the first hatchery run to 90 in the second run We attribute the low rate in the first run to
48 International Journal of Recirculating Aquaculture Volume 5 June 2004
Performance of Sunshine Bass and Backcross Hybrid Striped Bass
surface-film and system management problems We showed in the second run that swimbladder inflation in BX was comparable to that typically attainable (gt90) for Morone fry
Time-to-weaning onto dry diets was shorter (10 days versus 18 days) and earlier (day 33 versus day 38) for BX than for HSB Survival of BX to 60 days after hatch (7) was lower than expected on the basis of previous experience with HSB (gt10) Mean weights for BX at 60 days after hatch in two hatchery runs (052 and 042g) was similar to those for HSB (042 and 05g) However HSB exhibited greater mean weight than BX at 75 days after hatch (l04 vs 077g)
Condition factor (K) of BX (123 + 009) was not significantly different from those of HSB (119 + 005) or striped bass (l13 + 003) at 1 gram mean weight
Frequencies of deformities for BX (lt2) were lower than those in earlier reports Bosworth et al (1997) reported deformities in 8 of BX and 4 ofHSB
Grow-out Trial Results Overall there was not a significant difference in weight between the hybrid types (F = 606 df = 13 P = 00907) however as evidenced in
100
80
60
40
20
--+- BX - Overall -0- HSB - Overall -ltgt- BX - Individual Tanks A middot middot middotbullmiddotmiddot middot HSB - Individual Tanks fi
fi ~o
12 Dec 2001 3 Jan 2002 24 Jan 2002 12 Feb 2002
Date Figure 1 Meanfish weight(plusmn 2 SE) at each time period for backcross hybrid striped bass (BX) and hybrid striped bass (HSB) Also shown is meanfish weight at each time periodor groups in individual tanks
International Journal of Recirculating Aquaculture Volume 5 June 2004 49
Performance of Sunshine Bass and Backcross Hybrid Striped Bass
Figure 1 there was a significant interaction on fish weight by hybrid type and time (F = 5157 df = 1587 P lt 00001) Using the slicing option available in SAS (SAS Institute 1999) we tested for differences in weight between the hybrid types for each time period and found that although weights of HSB and BX were not significantly different during the first two measurement periods (Time 1 F = 027 df = 1587 P = 06032 Time 2 F = 036 df = 1587 P = 05496) the hybrid types did differ in weight during the last measurement periods Specifically HSB were significantly heavier than BX on the 24th of January 2002 (F = 1061 df = 1 587 P = 00032) and the 12th of February 2002 (F = 3788 df = 1587 P lt 00001) Overall HSB had a specific growth rate of 268 per
Table 2 Mean weights of backcross hybrid striped bass (BX) and hybrid striped bass (HSB) over the course of a 3-month growth trial
Date BXTank5
Wt(g) SE
112101 1228
BXTank6 Wt(g) SE
1201
BX Tank 12 Wt(g) SE
1274
HSB Tank 13 HSB Tank14 HSB Tank 15 Wt(g) SE Wt(g) SE Wt(g) SE
1180 1016 1088
1211201 1744 102 1778 095 1658 096 1798 109 1752 118 1704 109
1 302 27 60 1 38 28 76 155 27 04 154 3306 157 3424 149 3414 211
1 2402 4196 252 4424 207 4882 299 6344 263 6192 326 6432 362
212102 6332 317 6763 334 6912 299 9474 473 9553 452 10500 388
Table 3 Comparison of survivalfeed conversion ratio (FCR) and condition factor at 60 grams for backcross hybrid striped bass (BX) and hybrid striped bass (HSB)
Cross Tank
Starting
Ending
Survival
BXS
160
136
85
BX 6 BX 12 HSB 13 HSB 14 HSB 15
160
138
86
161
137
85
178
177
99
179
173
97
180
179
99
Starting Biomass (g) 1964 1922 2051 2100 1819 1958
Ending Biomass (g) 8612 9334 9469 16770 16526 18795
Feed Fed(g) 12106 12135 11447 18041 17805 20463
FCR 182 164 154 123 121 122
Condition Factor 168E-05 166E-05 169E-05 194E-05 193E-05 208E-05
SE 353E-07 337E-07 424E-07 255E-07 327E-07 845E-07
50 International Journal of Recirculating Aquaculture Volume 5 June 2004
Performance of Sunshine Bass and Backcross Hybrid Striped Bass
day while BX had a specific growth rate of 205 per day Neither of the covariates included in the model were found to have a significant effect on weight differences (initial tank biomass F = 142 df = 1587 P = 02332 amount of feed F = 005 df = 1587 P = 08165)
Performance regarding key economic traits-survival feed conversion efficiency and condition factor-are summarized in Table 3 At the end of the grow-out trial survival of HSB was significantly greater than that of BX (F = 6216 df = 1 1014 P lt 00001) Feed conversion ratio was better for HSB (122) than for BX (166) Condition factors for BX were lower than those for HSB (l68 vs 198) meaning that BX appeared longer and less deep-bodied than HSB
DISCUSSION Our data showed that F1 HSB performed as well or better than BX for a range of hatchery- and grow-out-related traits
Hatchery traits Fertilization rates for backcross lots were approximately half that for HSB There was a wide variance for fertilization and hatch rates of eggs from HSB females Some of this variance may be due to differences in hatchery protocols (different hormone injections used strip vs tank spawning) at the commercial hatcheries where the data were collected (TIJ Smith personal communication) Poor hatch rates also may be attributable in part to hybrid breakdown that is to developmental incompatibilities among the genomes of the respective species when coadapted gene complexes are broken up at meiosis in the F1 (Hallerman 2003)
In the hatchery trial we hypothesize that the low swimbladder inflation rate for our J~ly fry resulted from offering first feed to the BX too early When rearing HSB and SB fry we typically wait until the yolk sac has been largely resorbed and the fry mostly have inflated their swimbladders before we introduce live feed This is because live feed can cause an oily film on the water surface that interferes with a frys successful ingestion of air bubbles necessary to inflate the swimbladder (Chapman et al 1988) The timing of swimbladder inflation varies with fry type and temperature with HSB typically inflating between 3 and 6 days after hatch and SB 6 to 9 days after hatch BX fry inflate their swimbladder at an intermediate time 5 to 8 days after hatch (DAH) Since for the July
International Journal of Recirculating Aquaculture Volume 5 June 2004 51
Performance of Sunshine Bass and Backcross Hybrid Striped Bass
spawn we introduced feed into their tanks at the time prescribed for HSB (at 5 DAH) BX fry may have had a reduced opportunity to inflate their swimbladders because of interference by a surface film with air contact In the October spawn we monitored swimbladder inflation more carefully and introduced live feed on day 7 after almost 90 of swimbladders were inflated The low swimbladder inflation rate in the July hatchery run of BX may have had a direct impact on survival Larvae without inflated swimbladders expend more energy swimming exhibit reduced growth rates are less tolerant of stress and often sink to the tank bottom and die (Van Heukelem et al 2000)
BX were weaned more quickly and earlier onto dry diets than HSB which may have helped contribute to their ability to match the size and weight of HSB at 60 DAH Earlier weaning has economic merit since dry diets are generally cheaper and easier to feed than brine shrimp
Grow-out traits After 60 days post-hatch the growth and other performance differences between BX and HSB became more evident HSB exhibited significantly better growth survival and feed conversion ratios
We hypothesized that backcross hybrid striped bass might grow as fast or faster than the standard commercially-available F 1 hybrid striped bass if high-performance HSB females were selected as broodstock Our data regarding performance in intensive tank systems did not support this hypothesis Rather our observations accord with the classical view that the high performance of some interspecific hybrids is largely due to heterosis and that because the heterosis shown by an F 2 or backcross hybrid is only half that shown in an F1 (Falconer and Mackay 1996 p 257) that advanced generation hybrids would not perform as well as F1
hybrids Indeed F 2 HSB previously showed low hatch rates low larval survival and high variability of growth rate (Smith and Jenkins 1984 Smith et al 1985) Our results suggest that the heterosis expressed in HSB for growth and performance was greater than the selective breeding advantage we employed by crossing high performance HSB females with male striped bass Apparently the additive genetic variance contributed by the HSB and striped bass selected for size-at-age could not make up for the loss of dominance variance
BX may have better potential market acceptance by virtue of having a lower condition factor appearing longer and less deep-bodied than HSB more
52 International Journal of Recirculating Aquaculture Volume 5 June 2004
Performance of Sunshine Bass and Backcross Hybrid Striped Bass
like striped bass that are more familiar in many markets Fins Technologys market experience has shown that the premium-priced live markets prefer longer leaner fish such as the backcross There is the possibility that because of later maturity backcross hybrid striped bass may grow to larger sizes than hybrid striped bass This is attractive because there is an unserviced demand for larger (1 kg+) fish that can provide portion-controlled 7-9 ounce fillets for the restaurant and retail markets
ACKNOWLEDGEMENTS This project was supported by US Department of Agriculture-Small Business Innovation Research Program Phase I Grant no 2001-00373 EMH is supported by the USDA-CSREES Hatch Program and the Commonwealth of Virginia Aquaculture Initiative
REFERENCES Bosworth BG Libey GS Notter DR Egg Larval and Fingerling
Traits of Crosses among Striped Bass White Bass and their Fl Hybrids Aquaculture 1997 154 201-217
Carlberg J Van Olst J US Production and Sales of Hybrid Striped Bass (1987-2002) 2003 httpaquanicorgsbgaHSBversion5ppt
Chapman DC Hubert WA Jackson UT Influence of Access to Air and of Salinity on Gas Bladder Inflation in Striped Bass Progressive Fish-Culturist 1988 50 23-27
Falconer DS Mackay TFC 1996 Introduction to Quantitative Genetics Fourth Edition Longman Group Ltd Harlow Essex UK
Halbrendt CK Wirth FF Vaughn GF Conjoint Analysis of the Mid-Atlantic Food-Fish Market for Farm-Raised HSB Southern Journal of Agricultural Economics 1991 23 155-163
Hallerman EM Coadaptation and Outbreeding Depression In Po_pulation Genetics Principles and Applications for Fisheries Scientists Hallerman E (Ed) 2004 American Fisheries Society Bethesda MD USA
Harrell RM Hybridization and Genetics Striped Bass and Other Morone Culture In Harrell RM (Ed) 1997 Pages 217-234 Elsevier Science Amsterdam
International Journal of Recirculating Aquaculture Volume 5 June 2004 53
Performance of Sunshine Bass and Backcross Hybrid Striped Bass
Jenkins WE Heyward LD Sr Smith TIJ Performance of Domesticated Striped Bass Marone saxatilis Palmetto Bass and Backcross Hybrid Striped Bass (Sunshine Bass Female x Striped Bass Male) Raised in a Tank Culture System Journal of the World Aquaculture Society 1998 29 505-509
Kerby JH Cryogenic Preservation of Sperm from Striped Bass Transactions of the American Fisheries Society 1983 112 86-91
Losordo TM Westerman P An Analysis of Biological Economic and Engineering Factors Affecting the Cost of Fish Production in Recirculating Aquaculture Systems Journal of the World Aquaculture Society 1994 25 193-203
SAS Institute 1999 The SAS System for Windows version 82 SAS Institute Cary NC USA
Smith TlJ Jenkins WE Controlled Spawning of Fl Hybrid Striped Bass (Marone saxatilis x M chrysops) and Rearing of F2 Progeny Journal of the World Mariculture Society 1984 15 147-161
Smith TlJ Jenkins WE Snevel JF Production Characteristics of Striped Bass (Marone saxatilis) and Fl - F2 hybrids (Marone saxatilis and M chrysops) Reared in Intensive Tank Systems Journal of the World Mariculture Society 1985 16 57-70
Tomasso JR Kempton CJ Gallman A Smith TlJ Comparative Production Characteristics of Sunshine Bass and Sunshine Bass x Striped Bass in Recirculating-Water Systems North American Journal of Aquaculture 1999 61 79-81
Van Heukelem WF Harrell RM Hughes SG Lindell SR Friedmann BR Optimal Conditions for Swimbladder Inflation in Striped Bass Larvae Reared in Intensive Systems Northeast Regional Aquaculture Center Publication No 00-006 (2000) 5 pages
54 International Journal of Recirculating Aquaculture Volume 5 June 2004
Book Review
Fjofish apd Shellfish Bacteriology Mapua) Techpjques apd Procedures KA Whitman with contributions by NG MacNair
Iowa State Press (Blackwell Publishing Professional) Ames IA USA (2004) 288 pages ISBN 0813819520 US $4999
Reviewed by Rocco C Cipriano United States Geological Survey National Fish Health Research Laboratory 11649 Leetown Road Kearneysville WV 25430 USA E-mail rocco_ciprianousgsgov
Despite the fact that several good texts have been published regarding the description and nature of bacterial pathogens in aquatic animals there remained a need for a comprehensive yet practical guide devoted to techniques and procedures used for bacterial identification Diagnosis and detection of fish and shellfish pathogens often requires reliance upon standard microbiological media tests and reagents for some bacteria but more specialized assays are required for many aquatic pathogens In the latter case the products necessary for such assays are not commercially available and must be produced in aquatic animal diagnostic facilities from their basic ingredients Often therefore the compositions of differential media and the conduct of certain tests for the primary isolation or detection of specific aquatic pathogens are only available by referencing the general body of published scientific literature Hence until now there has not been a single-source shelf-volume that combines standard microbiological procedures used for routine detection and identification of medically important bacteria with the specialized needs of the fisheries profession This manual however helps to fill that void
The manual stands as a reference suitable for professional aquatic biologists with backgrounds in microbiology veterinarians and students of aquatic animal health Its strength lies in its coverage of the subject matter regarding culture-based diagnosis and identification of bacteria associated with finfish bivalves and lobsters Sections on
International Journal of Recirculating Aquaculture 5 (2004) 55-56 All Rights Reserved copyCopyright 2004 by Virginia Tech and Virginia Sea Grant Blacksburg VA USA
International Journal of Recirculating Aquaculture Volume 5 June 2004 55
Book Review FiQish and ShelJfish Bacteriology Manualmiddot Techniques and Procedures
aseptic collection and shipment of samples qualitative and quantitative procedures for bacterial isolation staining techniques media and standard biological tests used for the cultivation and phentotypic characterization of pathogenic bacteria and antibiotic sensitivity testing provide sound background for the student or novice practitioner Particularly beneficial for anyone who is not experienced with aquatic microbial pathogens is the section listing principal organs media and appropriate incubation temperatures to be used as the most probable sources of isolation for the specific bacteria
More experienced professionals will find it helpful and convenient to have the descriptions and interpretations of differential media (eg Coomassie Brilliant Blue Agar for Aeromonas salmonicida Rimler-Shotts Agar for Aeromonas hydropila Cytophaga Agar Shieh and TYES for Flavobacterium spp and Edwardsiella ictaluri Agar and various other media for Renibacterium salmoninarum) listed in a single source The major identifying criteria that phenotypically characterize selected bacterial pathogens are also described in tabulated form Specialized tests such as the SIF test to detect covert infections nurse culture techniques for enhanced bacterial growth and assays for public health indicator organisms in bivalves are documented Sections covering serology immunoassay and non-cultured based molecular assays (eg polymerase chain reaction) are also presented but are not as completely summarized as those for bacterial isolation In summary the nature of this manual makes it appropriate for frequent use as a practical laboratory guide
56 International Journal of Recirculating Aquaculture Volume 5 June 2004
Subscription Information
International Journal of Recirculating Aquaculture
A publication ofVirginia Tech and the Virginia Sea Grant College Program
IJRA presents the latest developments in RAS-related research focusing on the areas of
Food Quality Pathology
Food Safety
Aquatic Medicine Breeding amp Genetics Waste Management
FishShellfish Growth amp Nutrition Recirculating Systems Mgmt Marketing amp Economics Water Conservation
Dont miss an issue of this informative peer-reviewed journal Subscribe now using your credit card by calling 540-231-2075 or by printing out a form at wwwcfastvteduijrahtml If you prefer you can also mail this form to the address below along with a check or money order
Name ----------------~ Address ----------------Line2 ------------------City ____________ State __ _ Country Postal Code ___________ _ Phone Fax -------- --------e-mail-----------------check _ 2 year ($25 US)
International Journal of Recirculating Aquaculture Food Science amp Technology Building (0418)
Virginia Polytechnic Institute and State University Blacksburg VA 24061
phone (540) 231-2075 fax (540) 231-9293 e-mail IJRAvtedu
International Journal of Recirculating Aquaculture Volume 5 June 2004 57
~ International Journal of ~ Recirculating Aquaculture A publication of Virginia Tech and the Virginia Sea Grant College Program
Instructions for Authors The International Journal of Recirculating Aquaculture (IJRA) encourages the submission of original high-quality papers on research in all aspects of recirculating aquaculture Papers will be peer-reviewed and evaluated for scientific merit relevance and for their usefulness in promoting the advancement of recirculating aquaculture Complete coherent projects are preferred Any related papers submitted together must be thoroughly cross-referenced All papers must be original meaning that the data and the information presented must be the work of the authors and can not have been published elsewhere Dual publication of a paper or data is possible only through the permission of the Editors of both journals THERE ARE NO PAGE CHARGES for IJRA submissions
INITIAL MANUSCRIPT SUBMISSION Manuscripts should be sent to Ms Angela Correa Managing Editor by mail using the address listed at the end of these instructions or by e-mail to (ijravtedu) Submit four (4) copies of each manuscript if regular mail is used All manuscripts must be in English Dot matrix type is not acceptable and all such submissions will be returned without review Each submission must include a cover letter stating that the paper contains original research and that the information has not been published elsewhere E-mailed submissions must be saved in doc format Be sure to include the names of colleagues who have already reviewed the work presented IJRA has two categories for submission 1 Articles which are complete in-depth scientific studies and 2 Notes which are short papers of limited scope Articles and notes will be critically reviewed by two or three experts as well as by the Managing Editor Submissions may be returned without peer review in cases where the Managing Editor determines that they are inappropriate for the journal of poor quality poorly written or fail to follow the journals style format
PREPARATION OF MANUSCRIPTS IJRA uses the latest editions of Websters New International Dictionary and Websters New Collegiate Dictionarv for standard spellings and word definitions All spelling will be in American English Foreign or science-related terminology that is unfamiliar and does not appear in these dictionaries will require an accompanying definition Acceptable scientific and common names of fishes are listed in A List of Common and Scientific Names of Fishes from the United States and Canada published by the American Fisheries Society Common names may be used throughout each paper but must be accompanied by a full scientific name when they first appear in a paper The author must use the full common name eg yellow perch not perch All foreign language words should be italicized in the manuscript
In the manuscript number each page sequentially and include the senior authors name next to the page number (eg Page 4 Jahncke) on each page Single-space all typed material including references Type size in the body of the text should be no larger than 12pts and no smaller than 10 pts Subsection headings should also be italicized in the manuscript Spell out one-digit numbers except when they are used with units of measure - eg six ponds 7 days
International Journal of Recirculating Aquaculture Volume 5 June 2004 59
Spell out any number that begins a sentence When two numbers occur sequentially in the text one of the numbers must be spelled out- eg In 1987 fifty fish were stocked Use commas in numbers of 1000 or more Use the 24-hour clock to describe time- eg 1300 not 100 pm
Keep footnotes to a minimum and number them sequentially throughout the paper All units of measurement must be reported via the metric system except in special circumstances (eg horsepower) Standard scientific abbreviations and symbols may be used without definition If the use of a symbol could cause confusion define the symbol the first time it is used On the final draft of a paper that has been accepted for publication Greek letters or other extraneous symbols that do not appear on a keyboard the name of the symbol should be noted where the symbol is used to help eliminate prepress errors Parts per million or milligrams per liter can be
-1 reported as either ppm or mgI but not as mgI
Commonly used aquaculture jargon can be used without defining the term - eg fry fingerling hapa Less commonly used jargon may also be used but terms should be defined the first time they are used Jargon from fields outside of aquaculture should also be defined the first time they are used Always place a zero to the left of a decimal point if the number is less than one this includes probability values - eg P = 005 not P = 05
COMPONENTS OF THE MANUSCRIPTS Articles and notes should include a title names of authors and their addresses abstract introduction materials and methods results discussion (or a combined results and discussion) conclusion (rarely) acknowledgements (if any) references figures and tables in that order Each section should start on a new page
Title - The title should accurately reflect the contents of the paper Brief concise titles are encouraged The title page must include the name(s) of the author(s) and all addresses
Abstract - The abstract should be a concise highlight of the results and conclusions Methodology should not be abstracted unless it is necessary to explain the results or unless the paper describes a new technique Abstracts should be less than 300 words
Introduction - The introduction should explain why the paper was written and why it should be read The introduction should condense the relevant information in the field that led the author to do the research The introduction is not a complete literature review and only the most relevant references should be cited The introduction should also contain a statement that describes the purpose or objective of the paper
Materials and Methods - The underlying goal of this section is to describe what was done so that others can repeat the experiment If previously published papers described a technique that was used they can be cited to prevent unnecessary repetition If the technique or process was modified the modification must be described so that others can repeat the process Experimental designs can be explained by use of figures if they will help clarify what was done If the experiment was a complicated one with many subparts subsections may be used to describe each subpart
Results - This section describes the data Proper use of tables and figures can simplify and help explain the results Statistical analysis of data is necessary unless differences are so obvious that statistical analysis is superfluous Although probability values of 005 and 001 are traditionally used each author is free to choose his or her own level of significance
60 International Journal of Recirculating Aquaculture Volume 5 June 2004
Discussion - This section should interpret the results and compare the results from this experiment to those found in similar research The section can also be used to speculate about the results to provide reasons for the trends and to suggest new ideas that can advance our understanding about aquaculture This section should not be a literature review section that merely compares results among several papers
Results and Discussion - Results and discussion sections can be combined In most cases this leads to a better paper because the integration of these sections leads to a more meaningful interpretation of data
Conclusion - This section should be used only when the results of an experiment lead to an unequivocal interpretation
Acknowledgements - This section should be used to thank organizations that supported the research monetarily and individuals who assisted in the research or preparation of the paper This section includes manuscript number designations for those institutions that assign such numbers
References - Select references with great care Unless the paper includes a literature review there is no need to reference every paper written about a subject Use only the most important ones
Figures and Tables - All figures andtables go after the references Figures always go before tables
Section headings (eg Materials and Methods) should be capitalized and in bold type Secondary headings should be balded and go flush left Tertiary headings are incorporated into the first paragraph of that subsection Tertiary headings are italicized and separated from the text by a double dash
In the text references are cited in one of two ways 1 Swingle (1959) evaluated two species of tilapia or 2 pond culture in Alabama began in the 1950s (Swingle 1959) When there are three or more authors list only the first in a citation and follow that with et al eg Smitherman et al (1983) reviewed catfish breeding work at Auburn University If the name of an institutional author is long it can be abbreviated in a citation eg Food and Agriculture Organization of the United Nations may be abbreviated as FAO When several citations are used in a single entry they are listed chronologically If you are citing two papers that were written by the same author(s) the name only has to appear once per citation followed by the years that designate the different papers Separate the years with a comma If you are citing two authors you must separate the citations with a semicolon (Smith 1975 1976 Jones 1976)
In the reference section the reference list is strictly alphabetical by last name of the senior author and then by initials if two authors have identical last names If an author has written more than one paper the following format should be followed All single authored papers go first followed by co-authored papers and then the papers that were written by three or more authors If an author has written more than one single-authored paper the papers are listed chronologically If an author has written more than one co-authored paper they are listed alphabetically by the second authors last name If a tandem has authored two or more papers the order is chronological Papers written by the same group of three or more authors should be listed chronologically
International Journal of Recirculating Aquaculture Volume 5 June 2004 61
The following format will be used when referencing various works
PAPERS Single-author papers
McGinty AS Effects of Size at Stocking on Competition and Growth of All-Male Tilapia Hybrids Journal of the World Aquaculture Society 1985 16 52-56
Multiple-author papers Tave D Smitherman RO Predicted Response to Selection for Early Growth in Tilapia nilotica Transactions of the American Fisheries Society 1980 109 439-445
If an author has published two or more papers in the same year follow the years with a letter to differentiate them eg Smith 1988a 1988b Use issue numbers only when each issue starts out with page 1 If pagination is consecutive throughout the volume omit the issue number Spell out journal names in their entirely without abbreviations
Papers in proceedings or in edited volumes Nicholson LC Woods LC Ill Woiwode JG Intensive Culture Techniques for the Striped Bass and its Hybrids In Culture and Propagation of Striped Bass and Its Hybrids Harrell RM Kerby JH Minton RV Eds 1990 American Fisheries Society Bethesda MD USA
Books and reportspublications from governmental or non-governmental bodies
Lovell T 1989 Nutrition and Feeding of Fish Van Nostrand Reinhold New York NY USA
Food and Agriculture Organization of the United Nations (FAO) Fisheries Department 1997 Review of the State of World Aquaculture No 886 FIRlC886 FAO Rome Italy
Theses and Dissertations
Easter CC 1992 Water Chemistry Characterization and Performance of a Recirculating Aquaculture System Producing Hybrid Striped Bass Masters thesis Virginia Polytechnic Institute and State University Blacksburg VA USA
Websites
Federation of European Aquaculture Producers (FEAP) European Eel Production (httpwwwfeaporgeelshtml) 2002
Page numbers for proceedings books theses and dissertations are unnecessary Government publications should be treated as if they were books but document numbers must be included THE ACCURACY OF REFERENCES IS THE SOLE RESPONSIBILITY OF THE AUTHORS MAKE SURE THAT CITATIONS AND REFERENCES MATCH
Tables - When creating a table decide what the purpose of the table is and what points are important then organize the table so that the main features can be easily understood The table heading should provide sufficient information for the table to be understood as an entity Keep footnotes to a minimum Each table goes on a separate page Tables must be camera ready TABLES WILL BE PRINTED AS IS AND WILL NOT BE TYPESET Figures - List all figure captions on separate pages Original artwork doesnt have to be submitted when a paper is first submitted for review but original artwork must accompany the final revised manuscript Good quality photocopies are acceptable when a manuscript
62 International Journal of Recirculating Aquaculture Volume 5 June 2004
is submitted for review Graphs and original artwork must be printed with a laser printer or done in pen and ink Dot-matrix figures are not acceptable Original artwork or high-contrast photographs are acceptable Label all figures on the back with a soft pencil name of senior author paper title and figure number
Photographs - Should be on glossy paper with good contrast Do not glue pictures to cardboard Color photographs can be printed but the additional cost of printing them will be charged to the author Label all photos on the back with a soft pencil name of senior author paper title and figure number
FINAL REVISED MANUSCRIPTS If using the mail submit two copies of the final revised manuscript including original artwork Submit either the original pen-and-ink drawings or laser-printed versions of the drawings In addition submit the manuscript on a disk (CD preferable) or by e-mail On the disk write the brand name of the computer or word processor the word processing program that was used (should be Microsoft Word) the title of your article and the file name NOTE Disk and hard copy must agree In case of discrepancies it is the policy of IJRA to follow hard copy An electronic version of the completed manuscript is needed in order to publish AUTHORS MAY NOT RECEIVE PAGE PROOFS Proofreading will be done by the Production Office of IJRA using the revised final version of the manuscript Therefore authors must be especially careful that no errors exist in the final revised version because in most cases no changes are possible after it is submitted
REPRINTS The senior author will receive two copies of the journal and a pdf file of the article for distribution and reprinting purposes The junior author(s) will also receive two copies of the journal issue These are sent several weeks after the journal is published and in circulation Requests for the pdf format of the article can only be made by the corresponding author
COPYRIGHT amp PERMISSIONS For permission to reprint articles that have appeared in IJRA please contact IJRA Copyright amp Permissions Food Science amp Technology Building (0418) Virginia Tech Blacksburg VA 24061 USA
COPYRIGHT TRANSFER If your manuscript is accepted for publication copyright ownership must be officially transferred to IJRA The Editors acceptance letter will include a form fully explaining this The form must be signed by all authors and the original returned to the Editor at this time Failure to return the copyright form in a timely fashion will result in delay in publication
Send your submissions to International Journal of Recirculating Aquaculture
AI Correa Managing Editor 27-B Food Science and Technology Building (0418) Virginia Polytechnic Institute and State University Blacksburg VA 24061 USA
If you have any questions please feel free to contact us Phone (540) 231-2075 Fax (540) 231-9293 e-mail ijravtedu
International Journal of Recirculating Aquaculture Volume 5 June 2004 63

Hematology and Blood Chemistry of Yellow Perch (Percajlavescens)
The thrombocytes were slightly smaller than the erythrocytes (Fig IA) They had clear cytoplasm and were variable in shape being elongated pyriform oval or round Nuclear shape tended to follow cytoplasmic shape although oval and round thrombocyte nuclei occasionally were lobulated (Fig IB) as described for striped bass and tilapia (Hrubec et al 1996 2000)
Leukocytes made up the remainder of the cell types seen in the blood and included small and large lymphocytes neutrophils and monocytes No eosinophils or heterophils were observed Small lymphocytes were the smallest cell present with a rim of blue cytoplasm surrounding the round nucleus (Fig IA E F) Large lymphocytes had an abundant and darker blue cytoplasm and the nucleus was larger than observed in the small lymphocyte (Fig IA E) Plasma cells were occasionally observed with a classic open nucleus abundant dark blue cytoplasm and a clear cytoplasmic region adjacent to the nucleus presumably representing the Golgi as in mammalian plasma cells (Fig IC) Plasma cells were included in the large lymphocytes category for the differential counts
Neutrophils were the largest cell present in the blood (Fig ID E F) The cytoplasm of the neutrophil was a translucent grey containing no granules and infrequent vacuoles Cytoplasmic shape was round to angular as the cellular borders often appeared slightly adherent to adjacent erythrocytes distorting cellular shape Nuclear shape of the neutrophil varied from round to horseshoe shaped and frequently segmented into two prominent lobes connected by a thin nuclear bridge (Fig IF) Monocytes had abundant dark blue cytoplasm that was frequently vacuolated (Fig ID) The round to kidney-bean shaped monocyte nucleus was large with prominent chromatin clumping
Analysis of blood parameters can provide a wealth of information useful in analyzing the effects of disease and sub-optimal environmental conditions Providing reference intervals for healthy adult yellow perch reared in recirculation systems furnishes veterinarians and fish health professionals the foundation to develop diagnostic hematology for this species The number of studies that determine actual reference intervals for fish species is limited The majority of blood values determined for fishes are reported in the literature as a mean value with a standard deviation Historically reference intervals were determined as two standard deviations from the mean however this method is only valid when blood values follow a normal distribution It is incorrect to assume
38 International Journal of Recirculating Aquaculture Volume 5 June 2004
Hematology and Blood Chemistry of Yellow Perch (Percaflavescens)
that biological parameters are distributed normally therefore non-parametric methods should be used to accurately determine reference intervals (Reed et al 1971) Techniques to properly determine reference intervals have been established by the NCCLS (1992) and suggestions for their use and interpretation have been discussed (Lumsden 1998) As with mammalian species reference intervals need to be determined for different populations of fish within a single species as culture conditions and environmental variables affect blood values to the extent that they are outside the reference interval (Ram-Bhaskar and Srinivasa-Rao 1989 Hrubec et al 1996 1997ab 2000 2001) Although the reference range for some of the blood parameters appears large it is still possible to detect variation in hematologic values associated with pathological conditions (Hrubec et al 1997b and unpublished data)
Developing reference intervals is a necessary first step in determining which specific hematological changes can be associated with disease conditions As the field of fish hematology develops its usefulness to the aquaculture industry will increase Information derived by standardized non-lethal diagnostic assays will be needed to enhance the culture of yellow perch and other fish species Analysis of diagnostic blood samples can provide a means for early detection of infectious disease and assist in the identification of sub-lethal conditions affecting production performance This should allow for more specific timely and effective disease treatments in the future
ACKNOWLEDGEMENTS The authors wish to thank Mark Kidd of the Virginia Tech Aquaculture Center for his assistance with fish care and sampling
REFERENCES Grabda E Einszporn-Orecka T Felinska C Zbanyszek R
Experimental Methemoglobinemia in Rainbow Trout Acta Ichthyologica et Piscatoria 1974 4 43-71
Hrubec TC Smith SA Robertson JL Feldman B Veit HP Libey G Tinker MK Comparison of Hematologic Reference Intervals between Culture System and Type of Hybrid Striped Bass American Journal of Veterinary Research 1996 57 618-623
International Journal of Recirculating Aquaculture Volume 5 June 2004 3 9
Hematology and Blood Chemistry of Yellow Perch (Percajiavescens)
Hrubec TC Robertson JL Smith SA Effects of Temperature on Hematologic and Serum Biochemical Profiles of Hybrid Striped Bass (Morone chrysops x Morone saxatilis) American Journal of Veterinary Research 1997a 58 126-130
Hrubec TC Robertson JL Smith SA Effects of Ammonia and Nitrate Concentration on Hematologic and Serum Biochemical Profiles of Hybrid Striped Bass (Morone chrysops x Morone saxatilis) American Journal of Veterinary Research 1997b 58 131-135
Hrubec TC Smith SA Hematology and Plasma Chemistry Values for Production Tilapia ( Oreochromis hybrid) Raised in a Recirculation System International Journal of Recirculating Aquaculture 2000 J 5-14
Hrubec TC Cardinale JL Smith SA Hematology and Plasma Chemistry Reference Intervals for Cultured Tilapia ( Oreochromis hybrid) Veterinary Clinical Pathology 2000 29 7-12
Hrubec TC Smith SA Robertson JL Age Related Differences in Hematologic and Plasma Chemistry Analytes of Hybrid Striped Bass Morone chrysops x Morone saxatilis Veterinary Clinical Pathology 2001 30 8-15
Huffman PA Arkoosh MR Characteristics of Peripheral Blood Cells from Rainbow Trout Evaluated by Particle Counter Image Analysis and Hemocytometric Techniques Journal of Aquatic Animal Health 1997 9 239-248
Kelly AM Yellow Perch Culture in the United States Manna or Mania World Aquaculture 2000 31 4-17
Lumsden JH Normal or reference values Questions and Comments Veterinary Clinical Pathology 1998 27 102-106
Mallison JA 2000 A White Paper on the Status and Needs of Yellow Perch Aquaculture in the North Central Region North Central Regional Aquaculture Center Michigan State University E Lansing MI USA
Natt MP Herrick CA A New Blood Diluent for Counting Erythrocytes and Leukocytes of the Chicken Poultry Science 1952 31 735-738
40 International Journal of Recirculating Aquaculture Volume 5 June 2004
Hematology and Blood Chemistry of Yellow Perch (Percaflavescens)
NCCLS National Committee for Clinical Laboratory Standards 1992 How to Define Determine and Utilize Reference Intervals in the Clinical Laboratory Proposed Guidelines NCCLS Document C28-P Villanova PA USA
Nelson JA Mitchell GS Blood Chemistry Response to Acid in Yellow Perch (Perea flavescens) Comparison of Populations from Naturally Acidic and Neutral Environments Physiological Zoology 1992 65 493-514
Nelson JA Magnuson J J Chulkasem W Blood Oxygen Capacity Differences in Yellow Perch (Percaflavescens) from Northern Wisconsin Lakes Differing in pH Canadian Journal of Fisheries and Aquatic Sciences 1988 45 1699-1704
Ram-Bhaskar B Srinivasa-Rao K Influence of Environmental Variables on Hematology and Compendium of Normal Hematological Ranges of Milkfish Chanos chanos (Forskal) in Brackish Culture Aquaculture 1989 83 123-136
Reed AH Henry RJ Mason WB Influence of Statistical Method Used on the Resulting Estimate of Normal Range Clinical Chemistry 1971 17 275-284
Schmitz M 1999 Comparative Growth of All-Female Versus Mixed Sex Yellow Perch (Percaflavescens) in Recirculating Aquaculture Systems MS Thesis Virginia Tech Blacksburg VA USA
Toneys ML Coble DW Mortality Hematocrit Osmolality Electrolyte Regulation and Fat Depletion of Young-of-the-Year Freshwater Fishes under Simulated Winter Conditions Canadian Journal of Fisheries and Aquatic Science 1980 37 225-232
van den Heuvel MR Power M Richards J MacKinnon M Dixon DG Disease and Gill Lesions in Yellow Perch (Percaflavescens) Exposed to Oil Sands Mining-Associated Waters Ecotoxicology and Environmental Safety 2000 46 334-341
Wedemeyer GA Nelson NC Statistical Methods for Estimating Normal Blood Chemistry Ranges and Variance in Rainbow Trout (Salmo gairdneri) Shasta Strain Journal of the Fisheries Research Board of Canada 1975 32 551-554
International Journal of Recirculating Aquaculture Volume 5 June 2004 41
Hematology and Blood Chemistry of Yellow Perch (Percajlavescens)
Zinkl JG Avian Hematology In Schalms Veterinary Hematology (4th edition) Jain NC (Ed) 1986 Pages 256-260 Lippincott Williams amp Wilkins Philadelphia PA USA
42 International Journal of Recirculating Aquaculture Volume 5 June 2004
Hatchery and Grow-out Performance of Sunshine Bass and Backcross Hybrid Striped Bass in Recirculating Aquaculture Systems
SR Lindell1bull2 B Delbos1 R Perham1 J Goldman1 EM Hallerman3 TO Brenden3bull4
1 Fins Technology 15 Industrial Road Turners Falls MA 01376 USA
2Current address Marine Biological Laboratory Marine Resources Center 7 MBL Street Woods Hole MA 02543 USA
3Department of Fisheries and Wildlife Sciences (0321) Virginia Polytechnic Institute and State University Blacksburg VA 24061 USA
4Current address Institute of Fisheries Research University of Michigan 1109 N University Avenue Ann Arbor MI 41809 USA
Corresponding authors e-mail ehallermvtedu
Keywords striped bass performance aquaculture growth
International Journal of Recirculating Aquaculture 5 (2004) 43-54 All Rights Reserved copyCopyright 2004 by Virginia Tech and Virginia Sea Grant Blacksburg VA USA
International Journal of Recirculating Aquaculture Volume 5 June 2004 43
Performance of Sunshine Bass and Backcross Hybrid Striped Bass
ABSTRACT Previous research has suggested that backcross hybrid striped bass (BX sunshine bass female x striped bass male) perform as well as F 1 hybrid striped bass (sunshine bass white bass female x striped bass male) for many economically important traits We conducted trials to compare rearing and growth traits of selected backcross hybrid striped bass with hybrid striped bass (HSB) We spawned and reared larval BX fry in two hatchery cycles measured fry growth and performance and compared them to past performance of HSB fry We conducted a grow-out trial of commercially-available hybrid striped bass versus backcross hybrid striped bass in replicated tanks to phase II fingerling size (approximately lOOg) Compared to HSB in the hatchery phase backcross hybrid striped bass exhibited lower fertilization rate comparable swimbladder inflation rate shorter time-to-weaning lower survival comparable growth and comparable condition factor After 60 days HSB exhibited significantly better growth survival and feed conversion efficiency than BX However BX may have better potential market acceptance by virtue of having a lower condition factor appearing longer and less deep-bodied than HSB
INTRODUCTION Striped bass (Morone saxatilis) and its hybrids constitute a major sector of aquaculture in the United States with production of 105 million pounds in 2002 (Carlberg and Van Olst 2003) Commercially significant quantities of Morone stocks also are produced in Taiwan China and Israel Approximately 43 of Morone production occurs in tanks (Carlberg and Van Olst 2003) much of that in recirculating aquaculture systems (RAS) Private and government marketing experts estimate that US production could increase to 50 million pounds and $100 million in annual farm-gate revenue if market prices could be decreased only moderately (Halbrendt et al 1991) Production costs for HSB could be reduced by 12 if selective breeding can yield 20 faster growth rates (Losordo and Westerman 1994)
The majority of Marone production is not of striped bass but of its hybrids with white bass (M chrysops) because of their hardiness rapid growth rate and limited availability of female striped bass broodstock (reviewed by Harrell 1997) Further female WB are considered easier and more predictable to strip-spawn Hence most commercial production
44 International Journal of Recirculating Aquaculture Volume 5 June 2004
Performance of Sunshine Bass and Backcross Hybrid Striped Bass
is of sunshine bass the progeny of the white bass female x striped bass male interspecific cross Research has also been undertaken to evaluate the performance of second generation hybrids and backcrosses Several studies have suggested that the progeny of F 1 hybrid striped bass females backcrossed to striped bass males have merit for commercial production Jenkins et al (1998) compared the performance of backcross hybrids to F1 hybrid striped bass and striped bass to market size in a recirculating system At harvest no differences in growth rate or feed conversion were detected specific growth of BX was intermediate to those of the other stocks with survival lower Tomasso et al (1999) compared performance of F 1 and backcross hybrids between 20 and 90 grams for 56 days in tanks (Tomasso et al 1999) and observed similar survival growth and feed conversion rates among the hybrid types Detailed comparison of the hatchery performance of sunshine and BX hybrids is lacking We hypothesized that use of selected hybrid striped bass and striped bass for the backcross might yield a high-performance BX hybrid Should high performance be realized progressive fish farmers might utilize this approach by selecting the best F1 hybrid females from their own production stocks making the backcross by strip-spawning them and fertilizing the eggs with purchased milt from selectively bred striped bass males (Kerby 1983) thereby obtaining a high-performance production stock that because of selection on the maternal stock is suited to their particular farm conditions
In this study we evaluated the production potential of backcross (BX) hybrid striped bass (female sunshine bass x male striped bass) We compared the hatchery and grow-out performance of BX spawned from select broodstock and sunshine bass (HSB) of common genetic background Specifically we evaluated spawning success hatch rate growth survival and feed conversion efficiency through the first six months of life In order to benchmark our results we ran a trial in replicated tanks with HSB supplied by the most widely-used commercial source of fingerlings (Keo Fish Farms Keo AR USA) and compared their performance with our BX All fish were cultured within intensive controlled-environment recirculating aquaculture systems
International Journal of Recirculating Aquaculture Volume 5 June 2004 45
Performance of Sunshine Bass and Backcross Hybrid Striped Bass
MATERIALS AND METHODS In July 2001 we crossed 4 hybrid striped bass females to each of 4 striped bass males to produce 16 families of backcross hybrid striped bass Poor fertilization rates resulted in a low yield of fry from this spawn However there were enough fry to pool and conduct a pilot commercial-scale hatchery run Randomly-chosen samples from the resulting 4000 fingerlings were used for the grow-out trial
In October 2001 we spawned 3 female HSB with 2 male SB and eventually produced 7000 fingerlings While this was not enough to grow in commercial-scale systems we collected hatchery performance data to corroborate our JulyAugust experience with BX
Fertilized eggs were incubated in McDonald jars Upon hatch the larvae swam out of the hatching jar and into a 1900-L larval rearing tank Replicate larval rearing tanks were stocked with approximately 25 larvae per liter Tanks were maintained with recirculating water and surface oil-skimming pads for the first 5 to 7 days post-hatch until swim-bladder inflation was completed For the second week post-hatch larval rearing tanks were maintained static with gentle central aeration except for an exchange of about 30 of the tank water over the course of two hours each day During the second week post-hatch larvae were fed rotifers enriched with Algamac (Aquafauna BioMarine Inc Hawthorne CA USA) maintained at a density of 10ml By the end of the second week larvae were weaned from rotifers to Artemia nauplii By the end of the third week the larvae were typically weaned from enriched Artemia to artificial feed (Biokyowa Inc Girardeau MO USA) Weaned larvae were graded just once around 60 days post-hatch to remove the top 1 to 2 of larger fish responsible for cannibalism
In November 2001 we purchased lOg fingerlings that represent typical industry-standard HSB from Keo Fish Farms (Keo AR USA) These HSB closely matched the size and weight of our BX from the July spawn for the grow-out trial BX and HSB fingerlings were each stocked separately in triplicate 1900-L round tanks connected to the same recirculating system and reared at 23degC and a salinity of 1-3 ppt All six tanks were similarly stocked initially (approximately 1 kgm3) Fish were offered 80 of their expected ration via belt-feeders and hand-fed to satiation twice a day Approximately every 3 weeks length and weight samples were taken from a randomly-chosen 15 of each tanks
46 International Journal of Recirculating Aquaculture Volume 5 June 2004
Performance of Sunshine Bass and Backcross Hybrid Striped Bass
population At the conclusion of the project the tanks reached typical commercial densities of 5 to 9 kgm3bull
We quantified reproductive and hatchery performance of the three groups including fertilization rate swimbladder inflation rate days to weaning onto artificial feed (ie date of first ingestion to date that gt90 ingested artificial feed) survival estimates to approximately 60 days after hatch and to the end of the study feed conversion rate and monthly average weight and length The trial continued until mid-February 2002 when the HSB averaged approximately lOOg Results from previous years hatchery efforts with HSB using similar rearing protocols were used for comparative purposes
Both the hatchery and grow-out systems employed water recirculation technology including drum-filters fluidized-bed biofilters oxygenation ozonation and automated pH and temperature control that maintained high water-quality standards throughout the trials
Differences in fish weight between the hybrid types were analyzed as a repeated-measures general linear mixed model Residual (restricted) maximum likelihood was used to estimate the model parameters Initial fish biomass in each of the tanks and the amount of feed provided to each of the tanks were included in the model as covariates to assess the influence of these concomitant variables on differences in weight A first-order autoregressive covariance structure was assumed for the repeated-measurements of fish weight
Differences in fish survival at the end of the grow-out trial were analyzed as a general linear model with tanks serving as a blocking factor Because fish survivalmortality is a binary response and thus will violate an assumption of normality the significance of the test comparing survival between the hybrid types was obtained by randomization (number of randomizations= 1000) whereby the F-statistic of the original test was compared to F-statistics obtained by randomly allocating the survival mortality data to the different hybrid types The Type-I error rate for all statistical tests was set equal to 005
International Journal of Recirculating Aquaculture Volume 5 June 2004 47
Performance of Sunshine Bass and Backcross Hybrid Striped Bass
Table 1 Comparison of hatchery traits of backcross (BX) and Fl hybrid (HSB) striped bass for traits of economic interest
Traits of interest BX-HSB BX-HSB HSB HSB HSB
Female parent strain1 AR ARMD AR AR AR
Male parent strain1 MD FL MD FL MD MD FL MD Canada
Spawn date Oct-01 Jul-01 Mar-01 Oct-00 Jan-99
Fertilization 32 22 53 57
Swimbladder inflation 90 50 98 95
Weaning start (DAH)2bull3 24 21 17 22
Weaning end (DAH4 33 32 37 38
Mean wt (g) at 60 DAH 042 052 042 05
Survival to 60 DAH 7 740 104
Mean L (mm) at 30 DAH 133 11 1225
Mean L (mm) at 36 DAH 139 167
Mean L (mm) at 75 DAH 367 404 452
Mean Wt (g) at 75 DAH 074 081 12 0825 11
Condition factor at 1g 123E-05 118E-05 1Strain abbreviations AR=Arkansas R MD=Maryland FL=Florida 2DAH=Days after Hatch 3Weaning start marks the first introduction and ingestion of dry feed to replace live feeds 4Weaning end denotes the time when the transition to dry feeds is complete and live feeds are no longer utilized
RESULTS
Hatchery Trial Results A summary of performance for hatchery traits of production interest for BX and HSB is presented in Table 1
The fertilization rate for the BX eggs was lower than that which we typically found with HSB (22-32 vs 55) and considerably lower than our experience in 2000 when we conducted fertilization trials with BX (80)
Swimbladder inflation rate ranged from 50 in the first hatchery run to 90 in the second run We attribute the low rate in the first run to
48 International Journal of Recirculating Aquaculture Volume 5 June 2004
Performance of Sunshine Bass and Backcross Hybrid Striped Bass
surface-film and system management problems We showed in the second run that swimbladder inflation in BX was comparable to that typically attainable (gt90) for Morone fry
Time-to-weaning onto dry diets was shorter (10 days versus 18 days) and earlier (day 33 versus day 38) for BX than for HSB Survival of BX to 60 days after hatch (7) was lower than expected on the basis of previous experience with HSB (gt10) Mean weights for BX at 60 days after hatch in two hatchery runs (052 and 042g) was similar to those for HSB (042 and 05g) However HSB exhibited greater mean weight than BX at 75 days after hatch (l04 vs 077g)
Condition factor (K) of BX (123 + 009) was not significantly different from those of HSB (119 + 005) or striped bass (l13 + 003) at 1 gram mean weight
Frequencies of deformities for BX (lt2) were lower than those in earlier reports Bosworth et al (1997) reported deformities in 8 of BX and 4 ofHSB
Grow-out Trial Results Overall there was not a significant difference in weight between the hybrid types (F = 606 df = 13 P = 00907) however as evidenced in
100
80
60
40
20
--+- BX - Overall -0- HSB - Overall -ltgt- BX - Individual Tanks A middot middot middotbullmiddotmiddot middot HSB - Individual Tanks fi
fi ~o
12 Dec 2001 3 Jan 2002 24 Jan 2002 12 Feb 2002
Date Figure 1 Meanfish weight(plusmn 2 SE) at each time period for backcross hybrid striped bass (BX) and hybrid striped bass (HSB) Also shown is meanfish weight at each time periodor groups in individual tanks
International Journal of Recirculating Aquaculture Volume 5 June 2004 49
Performance of Sunshine Bass and Backcross Hybrid Striped Bass
Figure 1 there was a significant interaction on fish weight by hybrid type and time (F = 5157 df = 1587 P lt 00001) Using the slicing option available in SAS (SAS Institute 1999) we tested for differences in weight between the hybrid types for each time period and found that although weights of HSB and BX were not significantly different during the first two measurement periods (Time 1 F = 027 df = 1587 P = 06032 Time 2 F = 036 df = 1587 P = 05496) the hybrid types did differ in weight during the last measurement periods Specifically HSB were significantly heavier than BX on the 24th of January 2002 (F = 1061 df = 1 587 P = 00032) and the 12th of February 2002 (F = 3788 df = 1587 P lt 00001) Overall HSB had a specific growth rate of 268 per
Table 2 Mean weights of backcross hybrid striped bass (BX) and hybrid striped bass (HSB) over the course of a 3-month growth trial
Date BXTank5
Wt(g) SE
112101 1228
BXTank6 Wt(g) SE
1201
BX Tank 12 Wt(g) SE
1274
HSB Tank 13 HSB Tank14 HSB Tank 15 Wt(g) SE Wt(g) SE Wt(g) SE
1180 1016 1088
1211201 1744 102 1778 095 1658 096 1798 109 1752 118 1704 109
1 302 27 60 1 38 28 76 155 27 04 154 3306 157 3424 149 3414 211
1 2402 4196 252 4424 207 4882 299 6344 263 6192 326 6432 362
212102 6332 317 6763 334 6912 299 9474 473 9553 452 10500 388
Table 3 Comparison of survivalfeed conversion ratio (FCR) and condition factor at 60 grams for backcross hybrid striped bass (BX) and hybrid striped bass (HSB)
Cross Tank
Starting
Ending
Survival
BXS
160
136
85
BX 6 BX 12 HSB 13 HSB 14 HSB 15
160
138
86
161
137
85
178
177
99
179
173
97
180
179
99
Starting Biomass (g) 1964 1922 2051 2100 1819 1958
Ending Biomass (g) 8612 9334 9469 16770 16526 18795
Feed Fed(g) 12106 12135 11447 18041 17805 20463
FCR 182 164 154 123 121 122
Condition Factor 168E-05 166E-05 169E-05 194E-05 193E-05 208E-05
SE 353E-07 337E-07 424E-07 255E-07 327E-07 845E-07
50 International Journal of Recirculating Aquaculture Volume 5 June 2004
Performance of Sunshine Bass and Backcross Hybrid Striped Bass
day while BX had a specific growth rate of 205 per day Neither of the covariates included in the model were found to have a significant effect on weight differences (initial tank biomass F = 142 df = 1587 P = 02332 amount of feed F = 005 df = 1587 P = 08165)
Performance regarding key economic traits-survival feed conversion efficiency and condition factor-are summarized in Table 3 At the end of the grow-out trial survival of HSB was significantly greater than that of BX (F = 6216 df = 1 1014 P lt 00001) Feed conversion ratio was better for HSB (122) than for BX (166) Condition factors for BX were lower than those for HSB (l68 vs 198) meaning that BX appeared longer and less deep-bodied than HSB
DISCUSSION Our data showed that F1 HSB performed as well or better than BX for a range of hatchery- and grow-out-related traits
Hatchery traits Fertilization rates for backcross lots were approximately half that for HSB There was a wide variance for fertilization and hatch rates of eggs from HSB females Some of this variance may be due to differences in hatchery protocols (different hormone injections used strip vs tank spawning) at the commercial hatcheries where the data were collected (TIJ Smith personal communication) Poor hatch rates also may be attributable in part to hybrid breakdown that is to developmental incompatibilities among the genomes of the respective species when coadapted gene complexes are broken up at meiosis in the F1 (Hallerman 2003)
In the hatchery trial we hypothesize that the low swimbladder inflation rate for our J~ly fry resulted from offering first feed to the BX too early When rearing HSB and SB fry we typically wait until the yolk sac has been largely resorbed and the fry mostly have inflated their swimbladders before we introduce live feed This is because live feed can cause an oily film on the water surface that interferes with a frys successful ingestion of air bubbles necessary to inflate the swimbladder (Chapman et al 1988) The timing of swimbladder inflation varies with fry type and temperature with HSB typically inflating between 3 and 6 days after hatch and SB 6 to 9 days after hatch BX fry inflate their swimbladder at an intermediate time 5 to 8 days after hatch (DAH) Since for the July
International Journal of Recirculating Aquaculture Volume 5 June 2004 51
Performance of Sunshine Bass and Backcross Hybrid Striped Bass
spawn we introduced feed into their tanks at the time prescribed for HSB (at 5 DAH) BX fry may have had a reduced opportunity to inflate their swimbladders because of interference by a surface film with air contact In the October spawn we monitored swimbladder inflation more carefully and introduced live feed on day 7 after almost 90 of swimbladders were inflated The low swimbladder inflation rate in the July hatchery run of BX may have had a direct impact on survival Larvae without inflated swimbladders expend more energy swimming exhibit reduced growth rates are less tolerant of stress and often sink to the tank bottom and die (Van Heukelem et al 2000)
BX were weaned more quickly and earlier onto dry diets than HSB which may have helped contribute to their ability to match the size and weight of HSB at 60 DAH Earlier weaning has economic merit since dry diets are generally cheaper and easier to feed than brine shrimp
Grow-out traits After 60 days post-hatch the growth and other performance differences between BX and HSB became more evident HSB exhibited significantly better growth survival and feed conversion ratios
We hypothesized that backcross hybrid striped bass might grow as fast or faster than the standard commercially-available F 1 hybrid striped bass if high-performance HSB females were selected as broodstock Our data regarding performance in intensive tank systems did not support this hypothesis Rather our observations accord with the classical view that the high performance of some interspecific hybrids is largely due to heterosis and that because the heterosis shown by an F 2 or backcross hybrid is only half that shown in an F1 (Falconer and Mackay 1996 p 257) that advanced generation hybrids would not perform as well as F1
hybrids Indeed F 2 HSB previously showed low hatch rates low larval survival and high variability of growth rate (Smith and Jenkins 1984 Smith et al 1985) Our results suggest that the heterosis expressed in HSB for growth and performance was greater than the selective breeding advantage we employed by crossing high performance HSB females with male striped bass Apparently the additive genetic variance contributed by the HSB and striped bass selected for size-at-age could not make up for the loss of dominance variance
BX may have better potential market acceptance by virtue of having a lower condition factor appearing longer and less deep-bodied than HSB more
52 International Journal of Recirculating Aquaculture Volume 5 June 2004
Performance of Sunshine Bass and Backcross Hybrid Striped Bass
like striped bass that are more familiar in many markets Fins Technologys market experience has shown that the premium-priced live markets prefer longer leaner fish such as the backcross There is the possibility that because of later maturity backcross hybrid striped bass may grow to larger sizes than hybrid striped bass This is attractive because there is an unserviced demand for larger (1 kg+) fish that can provide portion-controlled 7-9 ounce fillets for the restaurant and retail markets
ACKNOWLEDGEMENTS This project was supported by US Department of Agriculture-Small Business Innovation Research Program Phase I Grant no 2001-00373 EMH is supported by the USDA-CSREES Hatch Program and the Commonwealth of Virginia Aquaculture Initiative
REFERENCES Bosworth BG Libey GS Notter DR Egg Larval and Fingerling
Traits of Crosses among Striped Bass White Bass and their Fl Hybrids Aquaculture 1997 154 201-217
Carlberg J Van Olst J US Production and Sales of Hybrid Striped Bass (1987-2002) 2003 httpaquanicorgsbgaHSBversion5ppt
Chapman DC Hubert WA Jackson UT Influence of Access to Air and of Salinity on Gas Bladder Inflation in Striped Bass Progressive Fish-Culturist 1988 50 23-27
Falconer DS Mackay TFC 1996 Introduction to Quantitative Genetics Fourth Edition Longman Group Ltd Harlow Essex UK
Halbrendt CK Wirth FF Vaughn GF Conjoint Analysis of the Mid-Atlantic Food-Fish Market for Farm-Raised HSB Southern Journal of Agricultural Economics 1991 23 155-163
Hallerman EM Coadaptation and Outbreeding Depression In Po_pulation Genetics Principles and Applications for Fisheries Scientists Hallerman E (Ed) 2004 American Fisheries Society Bethesda MD USA
Harrell RM Hybridization and Genetics Striped Bass and Other Morone Culture In Harrell RM (Ed) 1997 Pages 217-234 Elsevier Science Amsterdam
International Journal of Recirculating Aquaculture Volume 5 June 2004 53
Performance of Sunshine Bass and Backcross Hybrid Striped Bass
Jenkins WE Heyward LD Sr Smith TIJ Performance of Domesticated Striped Bass Marone saxatilis Palmetto Bass and Backcross Hybrid Striped Bass (Sunshine Bass Female x Striped Bass Male) Raised in a Tank Culture System Journal of the World Aquaculture Society 1998 29 505-509
Kerby JH Cryogenic Preservation of Sperm from Striped Bass Transactions of the American Fisheries Society 1983 112 86-91
Losordo TM Westerman P An Analysis of Biological Economic and Engineering Factors Affecting the Cost of Fish Production in Recirculating Aquaculture Systems Journal of the World Aquaculture Society 1994 25 193-203
SAS Institute 1999 The SAS System for Windows version 82 SAS Institute Cary NC USA
Smith TlJ Jenkins WE Controlled Spawning of Fl Hybrid Striped Bass (Marone saxatilis x M chrysops) and Rearing of F2 Progeny Journal of the World Mariculture Society 1984 15 147-161
Smith TlJ Jenkins WE Snevel JF Production Characteristics of Striped Bass (Marone saxatilis) and Fl - F2 hybrids (Marone saxatilis and M chrysops) Reared in Intensive Tank Systems Journal of the World Mariculture Society 1985 16 57-70
Tomasso JR Kempton CJ Gallman A Smith TlJ Comparative Production Characteristics of Sunshine Bass and Sunshine Bass x Striped Bass in Recirculating-Water Systems North American Journal of Aquaculture 1999 61 79-81
Van Heukelem WF Harrell RM Hughes SG Lindell SR Friedmann BR Optimal Conditions for Swimbladder Inflation in Striped Bass Larvae Reared in Intensive Systems Northeast Regional Aquaculture Center Publication No 00-006 (2000) 5 pages
54 International Journal of Recirculating Aquaculture Volume 5 June 2004
Book Review
Fjofish apd Shellfish Bacteriology Mapua) Techpjques apd Procedures KA Whitman with contributions by NG MacNair
Iowa State Press (Blackwell Publishing Professional) Ames IA USA (2004) 288 pages ISBN 0813819520 US $4999
Reviewed by Rocco C Cipriano United States Geological Survey National Fish Health Research Laboratory 11649 Leetown Road Kearneysville WV 25430 USA E-mail rocco_ciprianousgsgov
Despite the fact that several good texts have been published regarding the description and nature of bacterial pathogens in aquatic animals there remained a need for a comprehensive yet practical guide devoted to techniques and procedures used for bacterial identification Diagnosis and detection of fish and shellfish pathogens often requires reliance upon standard microbiological media tests and reagents for some bacteria but more specialized assays are required for many aquatic pathogens In the latter case the products necessary for such assays are not commercially available and must be produced in aquatic animal diagnostic facilities from their basic ingredients Often therefore the compositions of differential media and the conduct of certain tests for the primary isolation or detection of specific aquatic pathogens are only available by referencing the general body of published scientific literature Hence until now there has not been a single-source shelf-volume that combines standard microbiological procedures used for routine detection and identification of medically important bacteria with the specialized needs of the fisheries profession This manual however helps to fill that void
The manual stands as a reference suitable for professional aquatic biologists with backgrounds in microbiology veterinarians and students of aquatic animal health Its strength lies in its coverage of the subject matter regarding culture-based diagnosis and identification of bacteria associated with finfish bivalves and lobsters Sections on
International Journal of Recirculating Aquaculture 5 (2004) 55-56 All Rights Reserved copyCopyright 2004 by Virginia Tech and Virginia Sea Grant Blacksburg VA USA
International Journal of Recirculating Aquaculture Volume 5 June 2004 55
Book Review FiQish and ShelJfish Bacteriology Manualmiddot Techniques and Procedures
aseptic collection and shipment of samples qualitative and quantitative procedures for bacterial isolation staining techniques media and standard biological tests used for the cultivation and phentotypic characterization of pathogenic bacteria and antibiotic sensitivity testing provide sound background for the student or novice practitioner Particularly beneficial for anyone who is not experienced with aquatic microbial pathogens is the section listing principal organs media and appropriate incubation temperatures to be used as the most probable sources of isolation for the specific bacteria
More experienced professionals will find it helpful and convenient to have the descriptions and interpretations of differential media (eg Coomassie Brilliant Blue Agar for Aeromonas salmonicida Rimler-Shotts Agar for Aeromonas hydropila Cytophaga Agar Shieh and TYES for Flavobacterium spp and Edwardsiella ictaluri Agar and various other media for Renibacterium salmoninarum) listed in a single source The major identifying criteria that phenotypically characterize selected bacterial pathogens are also described in tabulated form Specialized tests such as the SIF test to detect covert infections nurse culture techniques for enhanced bacterial growth and assays for public health indicator organisms in bivalves are documented Sections covering serology immunoassay and non-cultured based molecular assays (eg polymerase chain reaction) are also presented but are not as completely summarized as those for bacterial isolation In summary the nature of this manual makes it appropriate for frequent use as a practical laboratory guide
56 International Journal of Recirculating Aquaculture Volume 5 June 2004
Subscription Information
International Journal of Recirculating Aquaculture
A publication ofVirginia Tech and the Virginia Sea Grant College Program
IJRA presents the latest developments in RAS-related research focusing on the areas of
Food Quality Pathology
Food Safety
Aquatic Medicine Breeding amp Genetics Waste Management
FishShellfish Growth amp Nutrition Recirculating Systems Mgmt Marketing amp Economics Water Conservation
Dont miss an issue of this informative peer-reviewed journal Subscribe now using your credit card by calling 540-231-2075 or by printing out a form at wwwcfastvteduijrahtml If you prefer you can also mail this form to the address below along with a check or money order
Name ----------------~ Address ----------------Line2 ------------------City ____________ State __ _ Country Postal Code ___________ _ Phone Fax -------- --------e-mail-----------------check _ 2 year ($25 US)
International Journal of Recirculating Aquaculture Food Science amp Technology Building (0418)
Virginia Polytechnic Institute and State University Blacksburg VA 24061
phone (540) 231-2075 fax (540) 231-9293 e-mail IJRAvtedu
International Journal of Recirculating Aquaculture Volume 5 June 2004 57
~ International Journal of ~ Recirculating Aquaculture A publication of Virginia Tech and the Virginia Sea Grant College Program
Instructions for Authors The International Journal of Recirculating Aquaculture (IJRA) encourages the submission of original high-quality papers on research in all aspects of recirculating aquaculture Papers will be peer-reviewed and evaluated for scientific merit relevance and for their usefulness in promoting the advancement of recirculating aquaculture Complete coherent projects are preferred Any related papers submitted together must be thoroughly cross-referenced All papers must be original meaning that the data and the information presented must be the work of the authors and can not have been published elsewhere Dual publication of a paper or data is possible only through the permission of the Editors of both journals THERE ARE NO PAGE CHARGES for IJRA submissions
INITIAL MANUSCRIPT SUBMISSION Manuscripts should be sent to Ms Angela Correa Managing Editor by mail using the address listed at the end of these instructions or by e-mail to (ijravtedu) Submit four (4) copies of each manuscript if regular mail is used All manuscripts must be in English Dot matrix type is not acceptable and all such submissions will be returned without review Each submission must include a cover letter stating that the paper contains original research and that the information has not been published elsewhere E-mailed submissions must be saved in doc format Be sure to include the names of colleagues who have already reviewed the work presented IJRA has two categories for submission 1 Articles which are complete in-depth scientific studies and 2 Notes which are short papers of limited scope Articles and notes will be critically reviewed by two or three experts as well as by the Managing Editor Submissions may be returned without peer review in cases where the Managing Editor determines that they are inappropriate for the journal of poor quality poorly written or fail to follow the journals style format
PREPARATION OF MANUSCRIPTS IJRA uses the latest editions of Websters New International Dictionary and Websters New Collegiate Dictionarv for standard spellings and word definitions All spelling will be in American English Foreign or science-related terminology that is unfamiliar and does not appear in these dictionaries will require an accompanying definition Acceptable scientific and common names of fishes are listed in A List of Common and Scientific Names of Fishes from the United States and Canada published by the American Fisheries Society Common names may be used throughout each paper but must be accompanied by a full scientific name when they first appear in a paper The author must use the full common name eg yellow perch not perch All foreign language words should be italicized in the manuscript
In the manuscript number each page sequentially and include the senior authors name next to the page number (eg Page 4 Jahncke) on each page Single-space all typed material including references Type size in the body of the text should be no larger than 12pts and no smaller than 10 pts Subsection headings should also be italicized in the manuscript Spell out one-digit numbers except when they are used with units of measure - eg six ponds 7 days
International Journal of Recirculating Aquaculture Volume 5 June 2004 59
Spell out any number that begins a sentence When two numbers occur sequentially in the text one of the numbers must be spelled out- eg In 1987 fifty fish were stocked Use commas in numbers of 1000 or more Use the 24-hour clock to describe time- eg 1300 not 100 pm
Keep footnotes to a minimum and number them sequentially throughout the paper All units of measurement must be reported via the metric system except in special circumstances (eg horsepower) Standard scientific abbreviations and symbols may be used without definition If the use of a symbol could cause confusion define the symbol the first time it is used On the final draft of a paper that has been accepted for publication Greek letters or other extraneous symbols that do not appear on a keyboard the name of the symbol should be noted where the symbol is used to help eliminate prepress errors Parts per million or milligrams per liter can be
-1 reported as either ppm or mgI but not as mgI
Commonly used aquaculture jargon can be used without defining the term - eg fry fingerling hapa Less commonly used jargon may also be used but terms should be defined the first time they are used Jargon from fields outside of aquaculture should also be defined the first time they are used Always place a zero to the left of a decimal point if the number is less than one this includes probability values - eg P = 005 not P = 05
COMPONENTS OF THE MANUSCRIPTS Articles and notes should include a title names of authors and their addresses abstract introduction materials and methods results discussion (or a combined results and discussion) conclusion (rarely) acknowledgements (if any) references figures and tables in that order Each section should start on a new page
Title - The title should accurately reflect the contents of the paper Brief concise titles are encouraged The title page must include the name(s) of the author(s) and all addresses
Abstract - The abstract should be a concise highlight of the results and conclusions Methodology should not be abstracted unless it is necessary to explain the results or unless the paper describes a new technique Abstracts should be less than 300 words
Introduction - The introduction should explain why the paper was written and why it should be read The introduction should condense the relevant information in the field that led the author to do the research The introduction is not a complete literature review and only the most relevant references should be cited The introduction should also contain a statement that describes the purpose or objective of the paper
Materials and Methods - The underlying goal of this section is to describe what was done so that others can repeat the experiment If previously published papers described a technique that was used they can be cited to prevent unnecessary repetition If the technique or process was modified the modification must be described so that others can repeat the process Experimental designs can be explained by use of figures if they will help clarify what was done If the experiment was a complicated one with many subparts subsections may be used to describe each subpart
Results - This section describes the data Proper use of tables and figures can simplify and help explain the results Statistical analysis of data is necessary unless differences are so obvious that statistical analysis is superfluous Although probability values of 005 and 001 are traditionally used each author is free to choose his or her own level of significance
60 International Journal of Recirculating Aquaculture Volume 5 June 2004
Discussion - This section should interpret the results and compare the results from this experiment to those found in similar research The section can also be used to speculate about the results to provide reasons for the trends and to suggest new ideas that can advance our understanding about aquaculture This section should not be a literature review section that merely compares results among several papers
Results and Discussion - Results and discussion sections can be combined In most cases this leads to a better paper because the integration of these sections leads to a more meaningful interpretation of data
Conclusion - This section should be used only when the results of an experiment lead to an unequivocal interpretation
Acknowledgements - This section should be used to thank organizations that supported the research monetarily and individuals who assisted in the research or preparation of the paper This section includes manuscript number designations for those institutions that assign such numbers
References - Select references with great care Unless the paper includes a literature review there is no need to reference every paper written about a subject Use only the most important ones
Figures and Tables - All figures andtables go after the references Figures always go before tables
Section headings (eg Materials and Methods) should be capitalized and in bold type Secondary headings should be balded and go flush left Tertiary headings are incorporated into the first paragraph of that subsection Tertiary headings are italicized and separated from the text by a double dash
In the text references are cited in one of two ways 1 Swingle (1959) evaluated two species of tilapia or 2 pond culture in Alabama began in the 1950s (Swingle 1959) When there are three or more authors list only the first in a citation and follow that with et al eg Smitherman et al (1983) reviewed catfish breeding work at Auburn University If the name of an institutional author is long it can be abbreviated in a citation eg Food and Agriculture Organization of the United Nations may be abbreviated as FAO When several citations are used in a single entry they are listed chronologically If you are citing two papers that were written by the same author(s) the name only has to appear once per citation followed by the years that designate the different papers Separate the years with a comma If you are citing two authors you must separate the citations with a semicolon (Smith 1975 1976 Jones 1976)
In the reference section the reference list is strictly alphabetical by last name of the senior author and then by initials if two authors have identical last names If an author has written more than one paper the following format should be followed All single authored papers go first followed by co-authored papers and then the papers that were written by three or more authors If an author has written more than one single-authored paper the papers are listed chronologically If an author has written more than one co-authored paper they are listed alphabetically by the second authors last name If a tandem has authored two or more papers the order is chronological Papers written by the same group of three or more authors should be listed chronologically
International Journal of Recirculating Aquaculture Volume 5 June 2004 61
The following format will be used when referencing various works
PAPERS Single-author papers
McGinty AS Effects of Size at Stocking on Competition and Growth of All-Male Tilapia Hybrids Journal of the World Aquaculture Society 1985 16 52-56
Multiple-author papers Tave D Smitherman RO Predicted Response to Selection for Early Growth in Tilapia nilotica Transactions of the American Fisheries Society 1980 109 439-445
If an author has published two or more papers in the same year follow the years with a letter to differentiate them eg Smith 1988a 1988b Use issue numbers only when each issue starts out with page 1 If pagination is consecutive throughout the volume omit the issue number Spell out journal names in their entirely without abbreviations
Papers in proceedings or in edited volumes Nicholson LC Woods LC Ill Woiwode JG Intensive Culture Techniques for the Striped Bass and its Hybrids In Culture and Propagation of Striped Bass and Its Hybrids Harrell RM Kerby JH Minton RV Eds 1990 American Fisheries Society Bethesda MD USA
Books and reportspublications from governmental or non-governmental bodies
Lovell T 1989 Nutrition and Feeding of Fish Van Nostrand Reinhold New York NY USA
Food and Agriculture Organization of the United Nations (FAO) Fisheries Department 1997 Review of the State of World Aquaculture No 886 FIRlC886 FAO Rome Italy
Theses and Dissertations
Easter CC 1992 Water Chemistry Characterization and Performance of a Recirculating Aquaculture System Producing Hybrid Striped Bass Masters thesis Virginia Polytechnic Institute and State University Blacksburg VA USA
Websites
Federation of European Aquaculture Producers (FEAP) European Eel Production (httpwwwfeaporgeelshtml) 2002
Page numbers for proceedings books theses and dissertations are unnecessary Government publications should be treated as if they were books but document numbers must be included THE ACCURACY OF REFERENCES IS THE SOLE RESPONSIBILITY OF THE AUTHORS MAKE SURE THAT CITATIONS AND REFERENCES MATCH
Tables - When creating a table decide what the purpose of the table is and what points are important then organize the table so that the main features can be easily understood The table heading should provide sufficient information for the table to be understood as an entity Keep footnotes to a minimum Each table goes on a separate page Tables must be camera ready TABLES WILL BE PRINTED AS IS AND WILL NOT BE TYPESET Figures - List all figure captions on separate pages Original artwork doesnt have to be submitted when a paper is first submitted for review but original artwork must accompany the final revised manuscript Good quality photocopies are acceptable when a manuscript
62 International Journal of Recirculating Aquaculture Volume 5 June 2004
is submitted for review Graphs and original artwork must be printed with a laser printer or done in pen and ink Dot-matrix figures are not acceptable Original artwork or high-contrast photographs are acceptable Label all figures on the back with a soft pencil name of senior author paper title and figure number
Photographs - Should be on glossy paper with good contrast Do not glue pictures to cardboard Color photographs can be printed but the additional cost of printing them will be charged to the author Label all photos on the back with a soft pencil name of senior author paper title and figure number
FINAL REVISED MANUSCRIPTS If using the mail submit two copies of the final revised manuscript including original artwork Submit either the original pen-and-ink drawings or laser-printed versions of the drawings In addition submit the manuscript on a disk (CD preferable) or by e-mail On the disk write the brand name of the computer or word processor the word processing program that was used (should be Microsoft Word) the title of your article and the file name NOTE Disk and hard copy must agree In case of discrepancies it is the policy of IJRA to follow hard copy An electronic version of the completed manuscript is needed in order to publish AUTHORS MAY NOT RECEIVE PAGE PROOFS Proofreading will be done by the Production Office of IJRA using the revised final version of the manuscript Therefore authors must be especially careful that no errors exist in the final revised version because in most cases no changes are possible after it is submitted
REPRINTS The senior author will receive two copies of the journal and a pdf file of the article for distribution and reprinting purposes The junior author(s) will also receive two copies of the journal issue These are sent several weeks after the journal is published and in circulation Requests for the pdf format of the article can only be made by the corresponding author
COPYRIGHT amp PERMISSIONS For permission to reprint articles that have appeared in IJRA please contact IJRA Copyright amp Permissions Food Science amp Technology Building (0418) Virginia Tech Blacksburg VA 24061 USA
COPYRIGHT TRANSFER If your manuscript is accepted for publication copyright ownership must be officially transferred to IJRA The Editors acceptance letter will include a form fully explaining this The form must be signed by all authors and the original returned to the Editor at this time Failure to return the copyright form in a timely fashion will result in delay in publication
Send your submissions to International Journal of Recirculating Aquaculture
AI Correa Managing Editor 27-B Food Science and Technology Building (0418) Virginia Polytechnic Institute and State University Blacksburg VA 24061 USA
If you have any questions please feel free to contact us Phone (540) 231-2075 Fax (540) 231-9293 e-mail ijravtedu
International Journal of Recirculating Aquaculture Volume 5 June 2004 63

Hematology and Blood Chemistry of Yellow Perch (Percaflavescens)
that biological parameters are distributed normally therefore non-parametric methods should be used to accurately determine reference intervals (Reed et al 1971) Techniques to properly determine reference intervals have been established by the NCCLS (1992) and suggestions for their use and interpretation have been discussed (Lumsden 1998) As with mammalian species reference intervals need to be determined for different populations of fish within a single species as culture conditions and environmental variables affect blood values to the extent that they are outside the reference interval (Ram-Bhaskar and Srinivasa-Rao 1989 Hrubec et al 1996 1997ab 2000 2001) Although the reference range for some of the blood parameters appears large it is still possible to detect variation in hematologic values associated with pathological conditions (Hrubec et al 1997b and unpublished data)
Developing reference intervals is a necessary first step in determining which specific hematological changes can be associated with disease conditions As the field of fish hematology develops its usefulness to the aquaculture industry will increase Information derived by standardized non-lethal diagnostic assays will be needed to enhance the culture of yellow perch and other fish species Analysis of diagnostic blood samples can provide a means for early detection of infectious disease and assist in the identification of sub-lethal conditions affecting production performance This should allow for more specific timely and effective disease treatments in the future
ACKNOWLEDGEMENTS The authors wish to thank Mark Kidd of the Virginia Tech Aquaculture Center for his assistance with fish care and sampling
REFERENCES Grabda E Einszporn-Orecka T Felinska C Zbanyszek R
Experimental Methemoglobinemia in Rainbow Trout Acta Ichthyologica et Piscatoria 1974 4 43-71
Hrubec TC Smith SA Robertson JL Feldman B Veit HP Libey G Tinker MK Comparison of Hematologic Reference Intervals between Culture System and Type of Hybrid Striped Bass American Journal of Veterinary Research 1996 57 618-623
International Journal of Recirculating Aquaculture Volume 5 June 2004 3 9
Hematology and Blood Chemistry of Yellow Perch (Percajiavescens)
Hrubec TC Robertson JL Smith SA Effects of Temperature on Hematologic and Serum Biochemical Profiles of Hybrid Striped Bass (Morone chrysops x Morone saxatilis) American Journal of Veterinary Research 1997a 58 126-130
Hrubec TC Robertson JL Smith SA Effects of Ammonia and Nitrate Concentration on Hematologic and Serum Biochemical Profiles of Hybrid Striped Bass (Morone chrysops x Morone saxatilis) American Journal of Veterinary Research 1997b 58 131-135
Hrubec TC Smith SA Hematology and Plasma Chemistry Values for Production Tilapia ( Oreochromis hybrid) Raised in a Recirculation System International Journal of Recirculating Aquaculture 2000 J 5-14
Hrubec TC Cardinale JL Smith SA Hematology and Plasma Chemistry Reference Intervals for Cultured Tilapia ( Oreochromis hybrid) Veterinary Clinical Pathology 2000 29 7-12
Hrubec TC Smith SA Robertson JL Age Related Differences in Hematologic and Plasma Chemistry Analytes of Hybrid Striped Bass Morone chrysops x Morone saxatilis Veterinary Clinical Pathology 2001 30 8-15
Huffman PA Arkoosh MR Characteristics of Peripheral Blood Cells from Rainbow Trout Evaluated by Particle Counter Image Analysis and Hemocytometric Techniques Journal of Aquatic Animal Health 1997 9 239-248
Kelly AM Yellow Perch Culture in the United States Manna or Mania World Aquaculture 2000 31 4-17
Lumsden JH Normal or reference values Questions and Comments Veterinary Clinical Pathology 1998 27 102-106
Mallison JA 2000 A White Paper on the Status and Needs of Yellow Perch Aquaculture in the North Central Region North Central Regional Aquaculture Center Michigan State University E Lansing MI USA
Natt MP Herrick CA A New Blood Diluent for Counting Erythrocytes and Leukocytes of the Chicken Poultry Science 1952 31 735-738
40 International Journal of Recirculating Aquaculture Volume 5 June 2004
Hematology and Blood Chemistry of Yellow Perch (Percaflavescens)
NCCLS National Committee for Clinical Laboratory Standards 1992 How to Define Determine and Utilize Reference Intervals in the Clinical Laboratory Proposed Guidelines NCCLS Document C28-P Villanova PA USA
Nelson JA Mitchell GS Blood Chemistry Response to Acid in Yellow Perch (Perea flavescens) Comparison of Populations from Naturally Acidic and Neutral Environments Physiological Zoology 1992 65 493-514
Nelson JA Magnuson J J Chulkasem W Blood Oxygen Capacity Differences in Yellow Perch (Percaflavescens) from Northern Wisconsin Lakes Differing in pH Canadian Journal of Fisheries and Aquatic Sciences 1988 45 1699-1704
Ram-Bhaskar B Srinivasa-Rao K Influence of Environmental Variables on Hematology and Compendium of Normal Hematological Ranges of Milkfish Chanos chanos (Forskal) in Brackish Culture Aquaculture 1989 83 123-136
Reed AH Henry RJ Mason WB Influence of Statistical Method Used on the Resulting Estimate of Normal Range Clinical Chemistry 1971 17 275-284
Schmitz M 1999 Comparative Growth of All-Female Versus Mixed Sex Yellow Perch (Percaflavescens) in Recirculating Aquaculture Systems MS Thesis Virginia Tech Blacksburg VA USA
Toneys ML Coble DW Mortality Hematocrit Osmolality Electrolyte Regulation and Fat Depletion of Young-of-the-Year Freshwater Fishes under Simulated Winter Conditions Canadian Journal of Fisheries and Aquatic Science 1980 37 225-232
van den Heuvel MR Power M Richards J MacKinnon M Dixon DG Disease and Gill Lesions in Yellow Perch (Percaflavescens) Exposed to Oil Sands Mining-Associated Waters Ecotoxicology and Environmental Safety 2000 46 334-341
Wedemeyer GA Nelson NC Statistical Methods for Estimating Normal Blood Chemistry Ranges and Variance in Rainbow Trout (Salmo gairdneri) Shasta Strain Journal of the Fisheries Research Board of Canada 1975 32 551-554
International Journal of Recirculating Aquaculture Volume 5 June 2004 41
Hematology and Blood Chemistry of Yellow Perch (Percajlavescens)
Zinkl JG Avian Hematology In Schalms Veterinary Hematology (4th edition) Jain NC (Ed) 1986 Pages 256-260 Lippincott Williams amp Wilkins Philadelphia PA USA
42 International Journal of Recirculating Aquaculture Volume 5 June 2004
Hatchery and Grow-out Performance of Sunshine Bass and Backcross Hybrid Striped Bass in Recirculating Aquaculture Systems
SR Lindell1bull2 B Delbos1 R Perham1 J Goldman1 EM Hallerman3 TO Brenden3bull4
1 Fins Technology 15 Industrial Road Turners Falls MA 01376 USA
2Current address Marine Biological Laboratory Marine Resources Center 7 MBL Street Woods Hole MA 02543 USA
3Department of Fisheries and Wildlife Sciences (0321) Virginia Polytechnic Institute and State University Blacksburg VA 24061 USA
4Current address Institute of Fisheries Research University of Michigan 1109 N University Avenue Ann Arbor MI 41809 USA
Corresponding authors e-mail ehallermvtedu
Keywords striped bass performance aquaculture growth
International Journal of Recirculating Aquaculture 5 (2004) 43-54 All Rights Reserved copyCopyright 2004 by Virginia Tech and Virginia Sea Grant Blacksburg VA USA
International Journal of Recirculating Aquaculture Volume 5 June 2004 43
Performance of Sunshine Bass and Backcross Hybrid Striped Bass
ABSTRACT Previous research has suggested that backcross hybrid striped bass (BX sunshine bass female x striped bass male) perform as well as F 1 hybrid striped bass (sunshine bass white bass female x striped bass male) for many economically important traits We conducted trials to compare rearing and growth traits of selected backcross hybrid striped bass with hybrid striped bass (HSB) We spawned and reared larval BX fry in two hatchery cycles measured fry growth and performance and compared them to past performance of HSB fry We conducted a grow-out trial of commercially-available hybrid striped bass versus backcross hybrid striped bass in replicated tanks to phase II fingerling size (approximately lOOg) Compared to HSB in the hatchery phase backcross hybrid striped bass exhibited lower fertilization rate comparable swimbladder inflation rate shorter time-to-weaning lower survival comparable growth and comparable condition factor After 60 days HSB exhibited significantly better growth survival and feed conversion efficiency than BX However BX may have better potential market acceptance by virtue of having a lower condition factor appearing longer and less deep-bodied than HSB
INTRODUCTION Striped bass (Morone saxatilis) and its hybrids constitute a major sector of aquaculture in the United States with production of 105 million pounds in 2002 (Carlberg and Van Olst 2003) Commercially significant quantities of Morone stocks also are produced in Taiwan China and Israel Approximately 43 of Morone production occurs in tanks (Carlberg and Van Olst 2003) much of that in recirculating aquaculture systems (RAS) Private and government marketing experts estimate that US production could increase to 50 million pounds and $100 million in annual farm-gate revenue if market prices could be decreased only moderately (Halbrendt et al 1991) Production costs for HSB could be reduced by 12 if selective breeding can yield 20 faster growth rates (Losordo and Westerman 1994)
The majority of Marone production is not of striped bass but of its hybrids with white bass (M chrysops) because of their hardiness rapid growth rate and limited availability of female striped bass broodstock (reviewed by Harrell 1997) Further female WB are considered easier and more predictable to strip-spawn Hence most commercial production
44 International Journal of Recirculating Aquaculture Volume 5 June 2004
Performance of Sunshine Bass and Backcross Hybrid Striped Bass
is of sunshine bass the progeny of the white bass female x striped bass male interspecific cross Research has also been undertaken to evaluate the performance of second generation hybrids and backcrosses Several studies have suggested that the progeny of F 1 hybrid striped bass females backcrossed to striped bass males have merit for commercial production Jenkins et al (1998) compared the performance of backcross hybrids to F1 hybrid striped bass and striped bass to market size in a recirculating system At harvest no differences in growth rate or feed conversion were detected specific growth of BX was intermediate to those of the other stocks with survival lower Tomasso et al (1999) compared performance of F 1 and backcross hybrids between 20 and 90 grams for 56 days in tanks (Tomasso et al 1999) and observed similar survival growth and feed conversion rates among the hybrid types Detailed comparison of the hatchery performance of sunshine and BX hybrids is lacking We hypothesized that use of selected hybrid striped bass and striped bass for the backcross might yield a high-performance BX hybrid Should high performance be realized progressive fish farmers might utilize this approach by selecting the best F1 hybrid females from their own production stocks making the backcross by strip-spawning them and fertilizing the eggs with purchased milt from selectively bred striped bass males (Kerby 1983) thereby obtaining a high-performance production stock that because of selection on the maternal stock is suited to their particular farm conditions
In this study we evaluated the production potential of backcross (BX) hybrid striped bass (female sunshine bass x male striped bass) We compared the hatchery and grow-out performance of BX spawned from select broodstock and sunshine bass (HSB) of common genetic background Specifically we evaluated spawning success hatch rate growth survival and feed conversion efficiency through the first six months of life In order to benchmark our results we ran a trial in replicated tanks with HSB supplied by the most widely-used commercial source of fingerlings (Keo Fish Farms Keo AR USA) and compared their performance with our BX All fish were cultured within intensive controlled-environment recirculating aquaculture systems
International Journal of Recirculating Aquaculture Volume 5 June 2004 45
Performance of Sunshine Bass and Backcross Hybrid Striped Bass
MATERIALS AND METHODS In July 2001 we crossed 4 hybrid striped bass females to each of 4 striped bass males to produce 16 families of backcross hybrid striped bass Poor fertilization rates resulted in a low yield of fry from this spawn However there were enough fry to pool and conduct a pilot commercial-scale hatchery run Randomly-chosen samples from the resulting 4000 fingerlings were used for the grow-out trial
In October 2001 we spawned 3 female HSB with 2 male SB and eventually produced 7000 fingerlings While this was not enough to grow in commercial-scale systems we collected hatchery performance data to corroborate our JulyAugust experience with BX
Fertilized eggs were incubated in McDonald jars Upon hatch the larvae swam out of the hatching jar and into a 1900-L larval rearing tank Replicate larval rearing tanks were stocked with approximately 25 larvae per liter Tanks were maintained with recirculating water and surface oil-skimming pads for the first 5 to 7 days post-hatch until swim-bladder inflation was completed For the second week post-hatch larval rearing tanks were maintained static with gentle central aeration except for an exchange of about 30 of the tank water over the course of two hours each day During the second week post-hatch larvae were fed rotifers enriched with Algamac (Aquafauna BioMarine Inc Hawthorne CA USA) maintained at a density of 10ml By the end of the second week larvae were weaned from rotifers to Artemia nauplii By the end of the third week the larvae were typically weaned from enriched Artemia to artificial feed (Biokyowa Inc Girardeau MO USA) Weaned larvae were graded just once around 60 days post-hatch to remove the top 1 to 2 of larger fish responsible for cannibalism
In November 2001 we purchased lOg fingerlings that represent typical industry-standard HSB from Keo Fish Farms (Keo AR USA) These HSB closely matched the size and weight of our BX from the July spawn for the grow-out trial BX and HSB fingerlings were each stocked separately in triplicate 1900-L round tanks connected to the same recirculating system and reared at 23degC and a salinity of 1-3 ppt All six tanks were similarly stocked initially (approximately 1 kgm3) Fish were offered 80 of their expected ration via belt-feeders and hand-fed to satiation twice a day Approximately every 3 weeks length and weight samples were taken from a randomly-chosen 15 of each tanks
46 International Journal of Recirculating Aquaculture Volume 5 June 2004
Performance of Sunshine Bass and Backcross Hybrid Striped Bass
population At the conclusion of the project the tanks reached typical commercial densities of 5 to 9 kgm3bull
We quantified reproductive and hatchery performance of the three groups including fertilization rate swimbladder inflation rate days to weaning onto artificial feed (ie date of first ingestion to date that gt90 ingested artificial feed) survival estimates to approximately 60 days after hatch and to the end of the study feed conversion rate and monthly average weight and length The trial continued until mid-February 2002 when the HSB averaged approximately lOOg Results from previous years hatchery efforts with HSB using similar rearing protocols were used for comparative purposes
Both the hatchery and grow-out systems employed water recirculation technology including drum-filters fluidized-bed biofilters oxygenation ozonation and automated pH and temperature control that maintained high water-quality standards throughout the trials
Differences in fish weight between the hybrid types were analyzed as a repeated-measures general linear mixed model Residual (restricted) maximum likelihood was used to estimate the model parameters Initial fish biomass in each of the tanks and the amount of feed provided to each of the tanks were included in the model as covariates to assess the influence of these concomitant variables on differences in weight A first-order autoregressive covariance structure was assumed for the repeated-measurements of fish weight
Differences in fish survival at the end of the grow-out trial were analyzed as a general linear model with tanks serving as a blocking factor Because fish survivalmortality is a binary response and thus will violate an assumption of normality the significance of the test comparing survival between the hybrid types was obtained by randomization (number of randomizations= 1000) whereby the F-statistic of the original test was compared to F-statistics obtained by randomly allocating the survival mortality data to the different hybrid types The Type-I error rate for all statistical tests was set equal to 005
International Journal of Recirculating Aquaculture Volume 5 June 2004 47
Performance of Sunshine Bass and Backcross Hybrid Striped Bass
Table 1 Comparison of hatchery traits of backcross (BX) and Fl hybrid (HSB) striped bass for traits of economic interest
Traits of interest BX-HSB BX-HSB HSB HSB HSB
Female parent strain1 AR ARMD AR AR AR
Male parent strain1 MD FL MD FL MD MD FL MD Canada
Spawn date Oct-01 Jul-01 Mar-01 Oct-00 Jan-99
Fertilization 32 22 53 57
Swimbladder inflation 90 50 98 95
Weaning start (DAH)2bull3 24 21 17 22
Weaning end (DAH4 33 32 37 38
Mean wt (g) at 60 DAH 042 052 042 05
Survival to 60 DAH 7 740 104
Mean L (mm) at 30 DAH 133 11 1225
Mean L (mm) at 36 DAH 139 167
Mean L (mm) at 75 DAH 367 404 452
Mean Wt (g) at 75 DAH 074 081 12 0825 11
Condition factor at 1g 123E-05 118E-05 1Strain abbreviations AR=Arkansas R MD=Maryland FL=Florida 2DAH=Days after Hatch 3Weaning start marks the first introduction and ingestion of dry feed to replace live feeds 4Weaning end denotes the time when the transition to dry feeds is complete and live feeds are no longer utilized
RESULTS
Hatchery Trial Results A summary of performance for hatchery traits of production interest for BX and HSB is presented in Table 1
The fertilization rate for the BX eggs was lower than that which we typically found with HSB (22-32 vs 55) and considerably lower than our experience in 2000 when we conducted fertilization trials with BX (80)
Swimbladder inflation rate ranged from 50 in the first hatchery run to 90 in the second run We attribute the low rate in the first run to
48 International Journal of Recirculating Aquaculture Volume 5 June 2004
Performance of Sunshine Bass and Backcross Hybrid Striped Bass
surface-film and system management problems We showed in the second run that swimbladder inflation in BX was comparable to that typically attainable (gt90) for Morone fry
Time-to-weaning onto dry diets was shorter (10 days versus 18 days) and earlier (day 33 versus day 38) for BX than for HSB Survival of BX to 60 days after hatch (7) was lower than expected on the basis of previous experience with HSB (gt10) Mean weights for BX at 60 days after hatch in two hatchery runs (052 and 042g) was similar to those for HSB (042 and 05g) However HSB exhibited greater mean weight than BX at 75 days after hatch (l04 vs 077g)
Condition factor (K) of BX (123 + 009) was not significantly different from those of HSB (119 + 005) or striped bass (l13 + 003) at 1 gram mean weight
Frequencies of deformities for BX (lt2) were lower than those in earlier reports Bosworth et al (1997) reported deformities in 8 of BX and 4 ofHSB
Grow-out Trial Results Overall there was not a significant difference in weight between the hybrid types (F = 606 df = 13 P = 00907) however as evidenced in
100
80
60
40
20
--+- BX - Overall -0- HSB - Overall -ltgt- BX - Individual Tanks A middot middot middotbullmiddotmiddot middot HSB - Individual Tanks fi
fi ~o
12 Dec 2001 3 Jan 2002 24 Jan 2002 12 Feb 2002
Date Figure 1 Meanfish weight(plusmn 2 SE) at each time period for backcross hybrid striped bass (BX) and hybrid striped bass (HSB) Also shown is meanfish weight at each time periodor groups in individual tanks
International Journal of Recirculating Aquaculture Volume 5 June 2004 49
Performance of Sunshine Bass and Backcross Hybrid Striped Bass
Figure 1 there was a significant interaction on fish weight by hybrid type and time (F = 5157 df = 1587 P lt 00001) Using the slicing option available in SAS (SAS Institute 1999) we tested for differences in weight between the hybrid types for each time period and found that although weights of HSB and BX were not significantly different during the first two measurement periods (Time 1 F = 027 df = 1587 P = 06032 Time 2 F = 036 df = 1587 P = 05496) the hybrid types did differ in weight during the last measurement periods Specifically HSB were significantly heavier than BX on the 24th of January 2002 (F = 1061 df = 1 587 P = 00032) and the 12th of February 2002 (F = 3788 df = 1587 P lt 00001) Overall HSB had a specific growth rate of 268 per
Table 2 Mean weights of backcross hybrid striped bass (BX) and hybrid striped bass (HSB) over the course of a 3-month growth trial
Date BXTank5
Wt(g) SE
112101 1228
BXTank6 Wt(g) SE
1201
BX Tank 12 Wt(g) SE
1274
HSB Tank 13 HSB Tank14 HSB Tank 15 Wt(g) SE Wt(g) SE Wt(g) SE
1180 1016 1088
1211201 1744 102 1778 095 1658 096 1798 109 1752 118 1704 109
1 302 27 60 1 38 28 76 155 27 04 154 3306 157 3424 149 3414 211
1 2402 4196 252 4424 207 4882 299 6344 263 6192 326 6432 362
212102 6332 317 6763 334 6912 299 9474 473 9553 452 10500 388
Table 3 Comparison of survivalfeed conversion ratio (FCR) and condition factor at 60 grams for backcross hybrid striped bass (BX) and hybrid striped bass (HSB)
Cross Tank
Starting
Ending
Survival
BXS
160
136
85
BX 6 BX 12 HSB 13 HSB 14 HSB 15
160
138
86
161
137
85
178
177
99
179
173
97
180
179
99
Starting Biomass (g) 1964 1922 2051 2100 1819 1958
Ending Biomass (g) 8612 9334 9469 16770 16526 18795
Feed Fed(g) 12106 12135 11447 18041 17805 20463
FCR 182 164 154 123 121 122
Condition Factor 168E-05 166E-05 169E-05 194E-05 193E-05 208E-05
SE 353E-07 337E-07 424E-07 255E-07 327E-07 845E-07
50 International Journal of Recirculating Aquaculture Volume 5 June 2004
Performance of Sunshine Bass and Backcross Hybrid Striped Bass
day while BX had a specific growth rate of 205 per day Neither of the covariates included in the model were found to have a significant effect on weight differences (initial tank biomass F = 142 df = 1587 P = 02332 amount of feed F = 005 df = 1587 P = 08165)
Performance regarding key economic traits-survival feed conversion efficiency and condition factor-are summarized in Table 3 At the end of the grow-out trial survival of HSB was significantly greater than that of BX (F = 6216 df = 1 1014 P lt 00001) Feed conversion ratio was better for HSB (122) than for BX (166) Condition factors for BX were lower than those for HSB (l68 vs 198) meaning that BX appeared longer and less deep-bodied than HSB
DISCUSSION Our data showed that F1 HSB performed as well or better than BX for a range of hatchery- and grow-out-related traits
Hatchery traits Fertilization rates for backcross lots were approximately half that for HSB There was a wide variance for fertilization and hatch rates of eggs from HSB females Some of this variance may be due to differences in hatchery protocols (different hormone injections used strip vs tank spawning) at the commercial hatcheries where the data were collected (TIJ Smith personal communication) Poor hatch rates also may be attributable in part to hybrid breakdown that is to developmental incompatibilities among the genomes of the respective species when coadapted gene complexes are broken up at meiosis in the F1 (Hallerman 2003)
In the hatchery trial we hypothesize that the low swimbladder inflation rate for our J~ly fry resulted from offering first feed to the BX too early When rearing HSB and SB fry we typically wait until the yolk sac has been largely resorbed and the fry mostly have inflated their swimbladders before we introduce live feed This is because live feed can cause an oily film on the water surface that interferes with a frys successful ingestion of air bubbles necessary to inflate the swimbladder (Chapman et al 1988) The timing of swimbladder inflation varies with fry type and temperature with HSB typically inflating between 3 and 6 days after hatch and SB 6 to 9 days after hatch BX fry inflate their swimbladder at an intermediate time 5 to 8 days after hatch (DAH) Since for the July
International Journal of Recirculating Aquaculture Volume 5 June 2004 51
Performance of Sunshine Bass and Backcross Hybrid Striped Bass
spawn we introduced feed into their tanks at the time prescribed for HSB (at 5 DAH) BX fry may have had a reduced opportunity to inflate their swimbladders because of interference by a surface film with air contact In the October spawn we monitored swimbladder inflation more carefully and introduced live feed on day 7 after almost 90 of swimbladders were inflated The low swimbladder inflation rate in the July hatchery run of BX may have had a direct impact on survival Larvae without inflated swimbladders expend more energy swimming exhibit reduced growth rates are less tolerant of stress and often sink to the tank bottom and die (Van Heukelem et al 2000)
BX were weaned more quickly and earlier onto dry diets than HSB which may have helped contribute to their ability to match the size and weight of HSB at 60 DAH Earlier weaning has economic merit since dry diets are generally cheaper and easier to feed than brine shrimp
Grow-out traits After 60 days post-hatch the growth and other performance differences between BX and HSB became more evident HSB exhibited significantly better growth survival and feed conversion ratios
We hypothesized that backcross hybrid striped bass might grow as fast or faster than the standard commercially-available F 1 hybrid striped bass if high-performance HSB females were selected as broodstock Our data regarding performance in intensive tank systems did not support this hypothesis Rather our observations accord with the classical view that the high performance of some interspecific hybrids is largely due to heterosis and that because the heterosis shown by an F 2 or backcross hybrid is only half that shown in an F1 (Falconer and Mackay 1996 p 257) that advanced generation hybrids would not perform as well as F1
hybrids Indeed F 2 HSB previously showed low hatch rates low larval survival and high variability of growth rate (Smith and Jenkins 1984 Smith et al 1985) Our results suggest that the heterosis expressed in HSB for growth and performance was greater than the selective breeding advantage we employed by crossing high performance HSB females with male striped bass Apparently the additive genetic variance contributed by the HSB and striped bass selected for size-at-age could not make up for the loss of dominance variance
BX may have better potential market acceptance by virtue of having a lower condition factor appearing longer and less deep-bodied than HSB more
52 International Journal of Recirculating Aquaculture Volume 5 June 2004
Performance of Sunshine Bass and Backcross Hybrid Striped Bass
like striped bass that are more familiar in many markets Fins Technologys market experience has shown that the premium-priced live markets prefer longer leaner fish such as the backcross There is the possibility that because of later maturity backcross hybrid striped bass may grow to larger sizes than hybrid striped bass This is attractive because there is an unserviced demand for larger (1 kg+) fish that can provide portion-controlled 7-9 ounce fillets for the restaurant and retail markets
ACKNOWLEDGEMENTS This project was supported by US Department of Agriculture-Small Business Innovation Research Program Phase I Grant no 2001-00373 EMH is supported by the USDA-CSREES Hatch Program and the Commonwealth of Virginia Aquaculture Initiative
REFERENCES Bosworth BG Libey GS Notter DR Egg Larval and Fingerling
Traits of Crosses among Striped Bass White Bass and their Fl Hybrids Aquaculture 1997 154 201-217
Carlberg J Van Olst J US Production and Sales of Hybrid Striped Bass (1987-2002) 2003 httpaquanicorgsbgaHSBversion5ppt
Chapman DC Hubert WA Jackson UT Influence of Access to Air and of Salinity on Gas Bladder Inflation in Striped Bass Progressive Fish-Culturist 1988 50 23-27
Falconer DS Mackay TFC 1996 Introduction to Quantitative Genetics Fourth Edition Longman Group Ltd Harlow Essex UK
Halbrendt CK Wirth FF Vaughn GF Conjoint Analysis of the Mid-Atlantic Food-Fish Market for Farm-Raised HSB Southern Journal of Agricultural Economics 1991 23 155-163
Hallerman EM Coadaptation and Outbreeding Depression In Po_pulation Genetics Principles and Applications for Fisheries Scientists Hallerman E (Ed) 2004 American Fisheries Society Bethesda MD USA
Harrell RM Hybridization and Genetics Striped Bass and Other Morone Culture In Harrell RM (Ed) 1997 Pages 217-234 Elsevier Science Amsterdam
International Journal of Recirculating Aquaculture Volume 5 June 2004 53
Performance of Sunshine Bass and Backcross Hybrid Striped Bass
Jenkins WE Heyward LD Sr Smith TIJ Performance of Domesticated Striped Bass Marone saxatilis Palmetto Bass and Backcross Hybrid Striped Bass (Sunshine Bass Female x Striped Bass Male) Raised in a Tank Culture System Journal of the World Aquaculture Society 1998 29 505-509
Kerby JH Cryogenic Preservation of Sperm from Striped Bass Transactions of the American Fisheries Society 1983 112 86-91
Losordo TM Westerman P An Analysis of Biological Economic and Engineering Factors Affecting the Cost of Fish Production in Recirculating Aquaculture Systems Journal of the World Aquaculture Society 1994 25 193-203
SAS Institute 1999 The SAS System for Windows version 82 SAS Institute Cary NC USA
Smith TlJ Jenkins WE Controlled Spawning of Fl Hybrid Striped Bass (Marone saxatilis x M chrysops) and Rearing of F2 Progeny Journal of the World Mariculture Society 1984 15 147-161
Smith TlJ Jenkins WE Snevel JF Production Characteristics of Striped Bass (Marone saxatilis) and Fl - F2 hybrids (Marone saxatilis and M chrysops) Reared in Intensive Tank Systems Journal of the World Mariculture Society 1985 16 57-70
Tomasso JR Kempton CJ Gallman A Smith TlJ Comparative Production Characteristics of Sunshine Bass and Sunshine Bass x Striped Bass in Recirculating-Water Systems North American Journal of Aquaculture 1999 61 79-81
Van Heukelem WF Harrell RM Hughes SG Lindell SR Friedmann BR Optimal Conditions for Swimbladder Inflation in Striped Bass Larvae Reared in Intensive Systems Northeast Regional Aquaculture Center Publication No 00-006 (2000) 5 pages
54 International Journal of Recirculating Aquaculture Volume 5 June 2004
Book Review
Fjofish apd Shellfish Bacteriology Mapua) Techpjques apd Procedures KA Whitman with contributions by NG MacNair
Iowa State Press (Blackwell Publishing Professional) Ames IA USA (2004) 288 pages ISBN 0813819520 US $4999
Reviewed by Rocco C Cipriano United States Geological Survey National Fish Health Research Laboratory 11649 Leetown Road Kearneysville WV 25430 USA E-mail rocco_ciprianousgsgov
Despite the fact that several good texts have been published regarding the description and nature of bacterial pathogens in aquatic animals there remained a need for a comprehensive yet practical guide devoted to techniques and procedures used for bacterial identification Diagnosis and detection of fish and shellfish pathogens often requires reliance upon standard microbiological media tests and reagents for some bacteria but more specialized assays are required for many aquatic pathogens In the latter case the products necessary for such assays are not commercially available and must be produced in aquatic animal diagnostic facilities from their basic ingredients Often therefore the compositions of differential media and the conduct of certain tests for the primary isolation or detection of specific aquatic pathogens are only available by referencing the general body of published scientific literature Hence until now there has not been a single-source shelf-volume that combines standard microbiological procedures used for routine detection and identification of medically important bacteria with the specialized needs of the fisheries profession This manual however helps to fill that void
The manual stands as a reference suitable for professional aquatic biologists with backgrounds in microbiology veterinarians and students of aquatic animal health Its strength lies in its coverage of the subject matter regarding culture-based diagnosis and identification of bacteria associated with finfish bivalves and lobsters Sections on
International Journal of Recirculating Aquaculture 5 (2004) 55-56 All Rights Reserved copyCopyright 2004 by Virginia Tech and Virginia Sea Grant Blacksburg VA USA
International Journal of Recirculating Aquaculture Volume 5 June 2004 55
Book Review FiQish and ShelJfish Bacteriology Manualmiddot Techniques and Procedures
aseptic collection and shipment of samples qualitative and quantitative procedures for bacterial isolation staining techniques media and standard biological tests used for the cultivation and phentotypic characterization of pathogenic bacteria and antibiotic sensitivity testing provide sound background for the student or novice practitioner Particularly beneficial for anyone who is not experienced with aquatic microbial pathogens is the section listing principal organs media and appropriate incubation temperatures to be used as the most probable sources of isolation for the specific bacteria
More experienced professionals will find it helpful and convenient to have the descriptions and interpretations of differential media (eg Coomassie Brilliant Blue Agar for Aeromonas salmonicida Rimler-Shotts Agar for Aeromonas hydropila Cytophaga Agar Shieh and TYES for Flavobacterium spp and Edwardsiella ictaluri Agar and various other media for Renibacterium salmoninarum) listed in a single source The major identifying criteria that phenotypically characterize selected bacterial pathogens are also described in tabulated form Specialized tests such as the SIF test to detect covert infections nurse culture techniques for enhanced bacterial growth and assays for public health indicator organisms in bivalves are documented Sections covering serology immunoassay and non-cultured based molecular assays (eg polymerase chain reaction) are also presented but are not as completely summarized as those for bacterial isolation In summary the nature of this manual makes it appropriate for frequent use as a practical laboratory guide
56 International Journal of Recirculating Aquaculture Volume 5 June 2004
Subscription Information
International Journal of Recirculating Aquaculture
A publication ofVirginia Tech and the Virginia Sea Grant College Program
IJRA presents the latest developments in RAS-related research focusing on the areas of
Food Quality Pathology
Food Safety
Aquatic Medicine Breeding amp Genetics Waste Management
FishShellfish Growth amp Nutrition Recirculating Systems Mgmt Marketing amp Economics Water Conservation
Dont miss an issue of this informative peer-reviewed journal Subscribe now using your credit card by calling 540-231-2075 or by printing out a form at wwwcfastvteduijrahtml If you prefer you can also mail this form to the address below along with a check or money order
Name ----------------~ Address ----------------Line2 ------------------City ____________ State __ _ Country Postal Code ___________ _ Phone Fax -------- --------e-mail-----------------check _ 2 year ($25 US)
International Journal of Recirculating Aquaculture Food Science amp Technology Building (0418)
Virginia Polytechnic Institute and State University Blacksburg VA 24061
phone (540) 231-2075 fax (540) 231-9293 e-mail IJRAvtedu
International Journal of Recirculating Aquaculture Volume 5 June 2004 57
~ International Journal of ~ Recirculating Aquaculture A publication of Virginia Tech and the Virginia Sea Grant College Program
Instructions for Authors The International Journal of Recirculating Aquaculture (IJRA) encourages the submission of original high-quality papers on research in all aspects of recirculating aquaculture Papers will be peer-reviewed and evaluated for scientific merit relevance and for their usefulness in promoting the advancement of recirculating aquaculture Complete coherent projects are preferred Any related papers submitted together must be thoroughly cross-referenced All papers must be original meaning that the data and the information presented must be the work of the authors and can not have been published elsewhere Dual publication of a paper or data is possible only through the permission of the Editors of both journals THERE ARE NO PAGE CHARGES for IJRA submissions
INITIAL MANUSCRIPT SUBMISSION Manuscripts should be sent to Ms Angela Correa Managing Editor by mail using the address listed at the end of these instructions or by e-mail to (ijravtedu) Submit four (4) copies of each manuscript if regular mail is used All manuscripts must be in English Dot matrix type is not acceptable and all such submissions will be returned without review Each submission must include a cover letter stating that the paper contains original research and that the information has not been published elsewhere E-mailed submissions must be saved in doc format Be sure to include the names of colleagues who have already reviewed the work presented IJRA has two categories for submission 1 Articles which are complete in-depth scientific studies and 2 Notes which are short papers of limited scope Articles and notes will be critically reviewed by two or three experts as well as by the Managing Editor Submissions may be returned without peer review in cases where the Managing Editor determines that they are inappropriate for the journal of poor quality poorly written or fail to follow the journals style format
PREPARATION OF MANUSCRIPTS IJRA uses the latest editions of Websters New International Dictionary and Websters New Collegiate Dictionarv for standard spellings and word definitions All spelling will be in American English Foreign or science-related terminology that is unfamiliar and does not appear in these dictionaries will require an accompanying definition Acceptable scientific and common names of fishes are listed in A List of Common and Scientific Names of Fishes from the United States and Canada published by the American Fisheries Society Common names may be used throughout each paper but must be accompanied by a full scientific name when they first appear in a paper The author must use the full common name eg yellow perch not perch All foreign language words should be italicized in the manuscript
In the manuscript number each page sequentially and include the senior authors name next to the page number (eg Page 4 Jahncke) on each page Single-space all typed material including references Type size in the body of the text should be no larger than 12pts and no smaller than 10 pts Subsection headings should also be italicized in the manuscript Spell out one-digit numbers except when they are used with units of measure - eg six ponds 7 days
International Journal of Recirculating Aquaculture Volume 5 June 2004 59
Spell out any number that begins a sentence When two numbers occur sequentially in the text one of the numbers must be spelled out- eg In 1987 fifty fish were stocked Use commas in numbers of 1000 or more Use the 24-hour clock to describe time- eg 1300 not 100 pm
Keep footnotes to a minimum and number them sequentially throughout the paper All units of measurement must be reported via the metric system except in special circumstances (eg horsepower) Standard scientific abbreviations and symbols may be used without definition If the use of a symbol could cause confusion define the symbol the first time it is used On the final draft of a paper that has been accepted for publication Greek letters or other extraneous symbols that do not appear on a keyboard the name of the symbol should be noted where the symbol is used to help eliminate prepress errors Parts per million or milligrams per liter can be
-1 reported as either ppm or mgI but not as mgI
Commonly used aquaculture jargon can be used without defining the term - eg fry fingerling hapa Less commonly used jargon may also be used but terms should be defined the first time they are used Jargon from fields outside of aquaculture should also be defined the first time they are used Always place a zero to the left of a decimal point if the number is less than one this includes probability values - eg P = 005 not P = 05
COMPONENTS OF THE MANUSCRIPTS Articles and notes should include a title names of authors and their addresses abstract introduction materials and methods results discussion (or a combined results and discussion) conclusion (rarely) acknowledgements (if any) references figures and tables in that order Each section should start on a new page
Title - The title should accurately reflect the contents of the paper Brief concise titles are encouraged The title page must include the name(s) of the author(s) and all addresses
Abstract - The abstract should be a concise highlight of the results and conclusions Methodology should not be abstracted unless it is necessary to explain the results or unless the paper describes a new technique Abstracts should be less than 300 words
Introduction - The introduction should explain why the paper was written and why it should be read The introduction should condense the relevant information in the field that led the author to do the research The introduction is not a complete literature review and only the most relevant references should be cited The introduction should also contain a statement that describes the purpose or objective of the paper
Materials and Methods - The underlying goal of this section is to describe what was done so that others can repeat the experiment If previously published papers described a technique that was used they can be cited to prevent unnecessary repetition If the technique or process was modified the modification must be described so that others can repeat the process Experimental designs can be explained by use of figures if they will help clarify what was done If the experiment was a complicated one with many subparts subsections may be used to describe each subpart
Results - This section describes the data Proper use of tables and figures can simplify and help explain the results Statistical analysis of data is necessary unless differences are so obvious that statistical analysis is superfluous Although probability values of 005 and 001 are traditionally used each author is free to choose his or her own level of significance
60 International Journal of Recirculating Aquaculture Volume 5 June 2004
Discussion - This section should interpret the results and compare the results from this experiment to those found in similar research The section can also be used to speculate about the results to provide reasons for the trends and to suggest new ideas that can advance our understanding about aquaculture This section should not be a literature review section that merely compares results among several papers
Results and Discussion - Results and discussion sections can be combined In most cases this leads to a better paper because the integration of these sections leads to a more meaningful interpretation of data
Conclusion - This section should be used only when the results of an experiment lead to an unequivocal interpretation
Acknowledgements - This section should be used to thank organizations that supported the research monetarily and individuals who assisted in the research or preparation of the paper This section includes manuscript number designations for those institutions that assign such numbers
References - Select references with great care Unless the paper includes a literature review there is no need to reference every paper written about a subject Use only the most important ones
Figures and Tables - All figures andtables go after the references Figures always go before tables
Section headings (eg Materials and Methods) should be capitalized and in bold type Secondary headings should be balded and go flush left Tertiary headings are incorporated into the first paragraph of that subsection Tertiary headings are italicized and separated from the text by a double dash
In the text references are cited in one of two ways 1 Swingle (1959) evaluated two species of tilapia or 2 pond culture in Alabama began in the 1950s (Swingle 1959) When there are three or more authors list only the first in a citation and follow that with et al eg Smitherman et al (1983) reviewed catfish breeding work at Auburn University If the name of an institutional author is long it can be abbreviated in a citation eg Food and Agriculture Organization of the United Nations may be abbreviated as FAO When several citations are used in a single entry they are listed chronologically If you are citing two papers that were written by the same author(s) the name only has to appear once per citation followed by the years that designate the different papers Separate the years with a comma If you are citing two authors you must separate the citations with a semicolon (Smith 1975 1976 Jones 1976)
In the reference section the reference list is strictly alphabetical by last name of the senior author and then by initials if two authors have identical last names If an author has written more than one paper the following format should be followed All single authored papers go first followed by co-authored papers and then the papers that were written by three or more authors If an author has written more than one single-authored paper the papers are listed chronologically If an author has written more than one co-authored paper they are listed alphabetically by the second authors last name If a tandem has authored two or more papers the order is chronological Papers written by the same group of three or more authors should be listed chronologically
International Journal of Recirculating Aquaculture Volume 5 June 2004 61
The following format will be used when referencing various works
PAPERS Single-author papers
McGinty AS Effects of Size at Stocking on Competition and Growth of All-Male Tilapia Hybrids Journal of the World Aquaculture Society 1985 16 52-56
Multiple-author papers Tave D Smitherman RO Predicted Response to Selection for Early Growth in Tilapia nilotica Transactions of the American Fisheries Society 1980 109 439-445
If an author has published two or more papers in the same year follow the years with a letter to differentiate them eg Smith 1988a 1988b Use issue numbers only when each issue starts out with page 1 If pagination is consecutive throughout the volume omit the issue number Spell out journal names in their entirely without abbreviations
Papers in proceedings or in edited volumes Nicholson LC Woods LC Ill Woiwode JG Intensive Culture Techniques for the Striped Bass and its Hybrids In Culture and Propagation of Striped Bass and Its Hybrids Harrell RM Kerby JH Minton RV Eds 1990 American Fisheries Society Bethesda MD USA
Books and reportspublications from governmental or non-governmental bodies
Lovell T 1989 Nutrition and Feeding of Fish Van Nostrand Reinhold New York NY USA
Food and Agriculture Organization of the United Nations (FAO) Fisheries Department 1997 Review of the State of World Aquaculture No 886 FIRlC886 FAO Rome Italy
Theses and Dissertations
Easter CC 1992 Water Chemistry Characterization and Performance of a Recirculating Aquaculture System Producing Hybrid Striped Bass Masters thesis Virginia Polytechnic Institute and State University Blacksburg VA USA
Websites
Federation of European Aquaculture Producers (FEAP) European Eel Production (httpwwwfeaporgeelshtml) 2002
Page numbers for proceedings books theses and dissertations are unnecessary Government publications should be treated as if they were books but document numbers must be included THE ACCURACY OF REFERENCES IS THE SOLE RESPONSIBILITY OF THE AUTHORS MAKE SURE THAT CITATIONS AND REFERENCES MATCH
Tables - When creating a table decide what the purpose of the table is and what points are important then organize the table so that the main features can be easily understood The table heading should provide sufficient information for the table to be understood as an entity Keep footnotes to a minimum Each table goes on a separate page Tables must be camera ready TABLES WILL BE PRINTED AS IS AND WILL NOT BE TYPESET Figures - List all figure captions on separate pages Original artwork doesnt have to be submitted when a paper is first submitted for review but original artwork must accompany the final revised manuscript Good quality photocopies are acceptable when a manuscript
62 International Journal of Recirculating Aquaculture Volume 5 June 2004
is submitted for review Graphs and original artwork must be printed with a laser printer or done in pen and ink Dot-matrix figures are not acceptable Original artwork or high-contrast photographs are acceptable Label all figures on the back with a soft pencil name of senior author paper title and figure number
Photographs - Should be on glossy paper with good contrast Do not glue pictures to cardboard Color photographs can be printed but the additional cost of printing them will be charged to the author Label all photos on the back with a soft pencil name of senior author paper title and figure number
FINAL REVISED MANUSCRIPTS If using the mail submit two copies of the final revised manuscript including original artwork Submit either the original pen-and-ink drawings or laser-printed versions of the drawings In addition submit the manuscript on a disk (CD preferable) or by e-mail On the disk write the brand name of the computer or word processor the word processing program that was used (should be Microsoft Word) the title of your article and the file name NOTE Disk and hard copy must agree In case of discrepancies it is the policy of IJRA to follow hard copy An electronic version of the completed manuscript is needed in order to publish AUTHORS MAY NOT RECEIVE PAGE PROOFS Proofreading will be done by the Production Office of IJRA using the revised final version of the manuscript Therefore authors must be especially careful that no errors exist in the final revised version because in most cases no changes are possible after it is submitted
REPRINTS The senior author will receive two copies of the journal and a pdf file of the article for distribution and reprinting purposes The junior author(s) will also receive two copies of the journal issue These are sent several weeks after the journal is published and in circulation Requests for the pdf format of the article can only be made by the corresponding author
COPYRIGHT amp PERMISSIONS For permission to reprint articles that have appeared in IJRA please contact IJRA Copyright amp Permissions Food Science amp Technology Building (0418) Virginia Tech Blacksburg VA 24061 USA
COPYRIGHT TRANSFER If your manuscript is accepted for publication copyright ownership must be officially transferred to IJRA The Editors acceptance letter will include a form fully explaining this The form must be signed by all authors and the original returned to the Editor at this time Failure to return the copyright form in a timely fashion will result in delay in publication
Send your submissions to International Journal of Recirculating Aquaculture
AI Correa Managing Editor 27-B Food Science and Technology Building (0418) Virginia Polytechnic Institute and State University Blacksburg VA 24061 USA
If you have any questions please feel free to contact us Phone (540) 231-2075 Fax (540) 231-9293 e-mail ijravtedu
International Journal of Recirculating Aquaculture Volume 5 June 2004 63

Performance of Sunshine Bass and Backcross Hybrid Striped Bass
population At the conclusion of the project the tanks reached typical commercial densities of 5 to 9 kgm3bull
We quantified reproductive and hatchery performance of the three groups including fertilization rate swimbladder inflation rate days to weaning onto artificial feed (ie date of first ingestion to date that gt90 ingested artificial feed) survival estimates to approximately 60 days after hatch and to the end of the study feed conversion rate and monthly average weight and length The trial continued until mid-February 2002 when the HSB averaged approximately lOOg Results from previous years hatchery efforts with HSB using similar rearing protocols were used for comparative purposes
Both the hatchery and grow-out systems employed water recirculation technology including drum-filters fluidized-bed biofilters oxygenation ozonation and automated pH and temperature control that maintained high water-quality standards throughout the trials
Differences in fish weight between the hybrid types were analyzed as a repeated-measures general linear mixed model Residual (restricted) maximum likelihood was used to estimate the model parameters Initial fish biomass in each of the tanks and the amount of feed provided to each of the tanks were included in the model as covariates to assess the influence of these concomitant variables on differences in weight A first-order autoregressive covariance structure was assumed for the repeated-measurements of fish weight
Differences in fish survival at the end of the grow-out trial were analyzed as a general linear model with tanks serving as a blocking factor Because fish survivalmortality is a binary response and thus will violate an assumption of normality the significance of the test comparing survival between the hybrid types was obtained by randomization (number of randomizations= 1000) whereby the F-statistic of the original test was compared to F-statistics obtained by randomly allocating the survival mortality data to the different hybrid types The Type-I error rate for all statistical tests was set equal to 005
International Journal of Recirculating Aquaculture Volume 5 June 2004 47
Performance of Sunshine Bass and Backcross Hybrid Striped Bass
Table 1 Comparison of hatchery traits of backcross (BX) and Fl hybrid (HSB) striped bass for traits of economic interest
Traits of interest BX-HSB BX-HSB HSB HSB HSB
Female parent strain1 AR ARMD AR AR AR
Male parent strain1 MD FL MD FL MD MD FL MD Canada
Spawn date Oct-01 Jul-01 Mar-01 Oct-00 Jan-99
Fertilization 32 22 53 57
Swimbladder inflation 90 50 98 95
Weaning start (DAH)2bull3 24 21 17 22
Weaning end (DAH4 33 32 37 38
Mean wt (g) at 60 DAH 042 052 042 05
Survival to 60 DAH 7 740 104
Mean L (mm) at 30 DAH 133 11 1225
Mean L (mm) at 36 DAH 139 167
Mean L (mm) at 75 DAH 367 404 452
Mean Wt (g) at 75 DAH 074 081 12 0825 11
Condition factor at 1g 123E-05 118E-05 1Strain abbreviations AR=Arkansas R MD=Maryland FL=Florida 2DAH=Days after Hatch 3Weaning start marks the first introduction and ingestion of dry feed to replace live feeds 4Weaning end denotes the time when the transition to dry feeds is complete and live feeds are no longer utilized
RESULTS
Hatchery Trial Results A summary of performance for hatchery traits of production interest for BX and HSB is presented in Table 1
The fertilization rate for the BX eggs was lower than that which we typically found with HSB (22-32 vs 55) and considerably lower than our experience in 2000 when we conducted fertilization trials with BX (80)
Swimbladder inflation rate ranged from 50 in the first hatchery run to 90 in the second run We attribute the low rate in the first run to
48 International Journal of Recirculating Aquaculture Volume 5 June 2004
Performance of Sunshine Bass and Backcross Hybrid Striped Bass
surface-film and system management problems We showed in the second run that swimbladder inflation in BX was comparable to that typically attainable (gt90) for Morone fry
Time-to-weaning onto dry diets was shorter (10 days versus 18 days) and earlier (day 33 versus day 38) for BX than for HSB Survival of BX to 60 days after hatch (7) was lower than expected on the basis of previous experience with HSB (gt10) Mean weights for BX at 60 days after hatch in two hatchery runs (052 and 042g) was similar to those for HSB (042 and 05g) However HSB exhibited greater mean weight than BX at 75 days after hatch (l04 vs 077g)
Condition factor (K) of BX (123 + 009) was not significantly different from those of HSB (119 + 005) or striped bass (l13 + 003) at 1 gram mean weight
Frequencies of deformities for BX (lt2) were lower than those in earlier reports Bosworth et al (1997) reported deformities in 8 of BX and 4 ofHSB
Grow-out Trial Results Overall there was not a significant difference in weight between the hybrid types (F = 606 df = 13 P = 00907) however as evidenced in
100
80
60
40
20
--+- BX - Overall -0- HSB - Overall -ltgt- BX - Individual Tanks A middot middot middotbullmiddotmiddot middot HSB - Individual Tanks fi
fi ~o
12 Dec 2001 3 Jan 2002 24 Jan 2002 12 Feb 2002
Date Figure 1 Meanfish weight(plusmn 2 SE) at each time period for backcross hybrid striped bass (BX) and hybrid striped bass (HSB) Also shown is meanfish weight at each time periodor groups in individual tanks
International Journal of Recirculating Aquaculture Volume 5 June 2004 49
Performance of Sunshine Bass and Backcross Hybrid Striped Bass
Figure 1 there was a significant interaction on fish weight by hybrid type and time (F = 5157 df = 1587 P lt 00001) Using the slicing option available in SAS (SAS Institute 1999) we tested for differences in weight between the hybrid types for each time period and found that although weights of HSB and BX were not significantly different during the first two measurement periods (Time 1 F = 027 df = 1587 P = 06032 Time 2 F = 036 df = 1587 P = 05496) the hybrid types did differ in weight during the last measurement periods Specifically HSB were significantly heavier than BX on the 24th of January 2002 (F = 1061 df = 1 587 P = 00032) and the 12th of February 2002 (F = 3788 df = 1587 P lt 00001) Overall HSB had a specific growth rate of 268 per
Table 2 Mean weights of backcross hybrid striped bass (BX) and hybrid striped bass (HSB) over the course of a 3-month growth trial
Date BXTank5
Wt(g) SE
112101 1228
BXTank6 Wt(g) SE
1201
BX Tank 12 Wt(g) SE
1274
HSB Tank 13 HSB Tank14 HSB Tank 15 Wt(g) SE Wt(g) SE Wt(g) SE
1180 1016 1088
1211201 1744 102 1778 095 1658 096 1798 109 1752 118 1704 109
1 302 27 60 1 38 28 76 155 27 04 154 3306 157 3424 149 3414 211
1 2402 4196 252 4424 207 4882 299 6344 263 6192 326 6432 362
212102 6332 317 6763 334 6912 299 9474 473 9553 452 10500 388
Table 3 Comparison of survivalfeed conversion ratio (FCR) and condition factor at 60 grams for backcross hybrid striped bass (BX) and hybrid striped bass (HSB)
Cross Tank
Starting
Ending
Survival
BXS
160
136
85
BX 6 BX 12 HSB 13 HSB 14 HSB 15
160
138
86
161
137
85
178
177
99
179
173
97
180
179
99
Starting Biomass (g) 1964 1922 2051 2100 1819 1958
Ending Biomass (g) 8612 9334 9469 16770 16526 18795
Feed Fed(g) 12106 12135 11447 18041 17805 20463
FCR 182 164 154 123 121 122
Condition Factor 168E-05 166E-05 169E-05 194E-05 193E-05 208E-05
SE 353E-07 337E-07 424E-07 255E-07 327E-07 845E-07
50 International Journal of Recirculating Aquaculture Volume 5 June 2004
Performance of Sunshine Bass and Backcross Hybrid Striped Bass
day while BX had a specific growth rate of 205 per day Neither of the covariates included in the model were found to have a significant effect on weight differences (initial tank biomass F = 142 df = 1587 P = 02332 amount of feed F = 005 df = 1587 P = 08165)
Performance regarding key economic traits-survival feed conversion efficiency and condition factor-are summarized in Table 3 At the end of the grow-out trial survival of HSB was significantly greater than that of BX (F = 6216 df = 1 1014 P lt 00001) Feed conversion ratio was better for HSB (122) than for BX (166) Condition factors for BX were lower than those for HSB (l68 vs 198) meaning that BX appeared longer and less deep-bodied than HSB
DISCUSSION Our data showed that F1 HSB performed as well or better than BX for a range of hatchery- and grow-out-related traits
Hatchery traits Fertilization rates for backcross lots were approximately half that for HSB There was a wide variance for fertilization and hatch rates of eggs from HSB females Some of this variance may be due to differences in hatchery protocols (different hormone injections used strip vs tank spawning) at the commercial hatcheries where the data were collected (TIJ Smith personal communication) Poor hatch rates also may be attributable in part to hybrid breakdown that is to developmental incompatibilities among the genomes of the respective species when coadapted gene complexes are broken up at meiosis in the F1 (Hallerman 2003)
In the hatchery trial we hypothesize that the low swimbladder inflation rate for our J~ly fry resulted from offering first feed to the BX too early When rearing HSB and SB fry we typically wait until the yolk sac has been largely resorbed and the fry mostly have inflated their swimbladders before we introduce live feed This is because live feed can cause an oily film on the water surface that interferes with a frys successful ingestion of air bubbles necessary to inflate the swimbladder (Chapman et al 1988) The timing of swimbladder inflation varies with fry type and temperature with HSB typically inflating between 3 and 6 days after hatch and SB 6 to 9 days after hatch BX fry inflate their swimbladder at an intermediate time 5 to 8 days after hatch (DAH) Since for the July
International Journal of Recirculating Aquaculture Volume 5 June 2004 51
Performance of Sunshine Bass and Backcross Hybrid Striped Bass
spawn we introduced feed into their tanks at the time prescribed for HSB (at 5 DAH) BX fry may have had a reduced opportunity to inflate their swimbladders because of interference by a surface film with air contact In the October spawn we monitored swimbladder inflation more carefully and introduced live feed on day 7 after almost 90 of swimbladders were inflated The low swimbladder inflation rate in the July hatchery run of BX may have had a direct impact on survival Larvae without inflated swimbladders expend more energy swimming exhibit reduced growth rates are less tolerant of stress and often sink to the tank bottom and die (Van Heukelem et al 2000)
BX were weaned more quickly and earlier onto dry diets than HSB which may have helped contribute to their ability to match the size and weight of HSB at 60 DAH Earlier weaning has economic merit since dry diets are generally cheaper and easier to feed than brine shrimp
Grow-out traits After 60 days post-hatch the growth and other performance differences between BX and HSB became more evident HSB exhibited significantly better growth survival and feed conversion ratios
We hypothesized that backcross hybrid striped bass might grow as fast or faster than the standard commercially-available F 1 hybrid striped bass if high-performance HSB females were selected as broodstock Our data regarding performance in intensive tank systems did not support this hypothesis Rather our observations accord with the classical view that the high performance of some interspecific hybrids is largely due to heterosis and that because the heterosis shown by an F 2 or backcross hybrid is only half that shown in an F1 (Falconer and Mackay 1996 p 257) that advanced generation hybrids would not perform as well as F1
hybrids Indeed F 2 HSB previously showed low hatch rates low larval survival and high variability of growth rate (Smith and Jenkins 1984 Smith et al 1985) Our results suggest that the heterosis expressed in HSB for growth and performance was greater than the selective breeding advantage we employed by crossing high performance HSB females with male striped bass Apparently the additive genetic variance contributed by the HSB and striped bass selected for size-at-age could not make up for the loss of dominance variance
BX may have better potential market acceptance by virtue of having a lower condition factor appearing longer and less deep-bodied than HSB more
52 International Journal of Recirculating Aquaculture Volume 5 June 2004
Performance of Sunshine Bass and Backcross Hybrid Striped Bass
like striped bass that are more familiar in many markets Fins Technologys market experience has shown that the premium-priced live markets prefer longer leaner fish such as the backcross There is the possibility that because of later maturity backcross hybrid striped bass may grow to larger sizes than hybrid striped bass This is attractive because there is an unserviced demand for larger (1 kg+) fish that can provide portion-controlled 7-9 ounce fillets for the restaurant and retail markets
ACKNOWLEDGEMENTS This project was supported by US Department of Agriculture-Small Business Innovation Research Program Phase I Grant no 2001-00373 EMH is supported by the USDA-CSREES Hatch Program and the Commonwealth of Virginia Aquaculture Initiative
REFERENCES Bosworth BG Libey GS Notter DR Egg Larval and Fingerling
Traits of Crosses among Striped Bass White Bass and their Fl Hybrids Aquaculture 1997 154 201-217
Carlberg J Van Olst J US Production and Sales of Hybrid Striped Bass (1987-2002) 2003 httpaquanicorgsbgaHSBversion5ppt
Chapman DC Hubert WA Jackson UT Influence of Access to Air and of Salinity on Gas Bladder Inflation in Striped Bass Progressive Fish-Culturist 1988 50 23-27
Falconer DS Mackay TFC 1996 Introduction to Quantitative Genetics Fourth Edition Longman Group Ltd Harlow Essex UK
Halbrendt CK Wirth FF Vaughn GF Conjoint Analysis of the Mid-Atlantic Food-Fish Market for Farm-Raised HSB Southern Journal of Agricultural Economics 1991 23 155-163
Hallerman EM Coadaptation and Outbreeding Depression In Po_pulation Genetics Principles and Applications for Fisheries Scientists Hallerman E (Ed) 2004 American Fisheries Society Bethesda MD USA
Harrell RM Hybridization and Genetics Striped Bass and Other Morone Culture In Harrell RM (Ed) 1997 Pages 217-234 Elsevier Science Amsterdam
International Journal of Recirculating Aquaculture Volume 5 June 2004 53
Performance of Sunshine Bass and Backcross Hybrid Striped Bass
Jenkins WE Heyward LD Sr Smith TIJ Performance of Domesticated Striped Bass Marone saxatilis Palmetto Bass and Backcross Hybrid Striped Bass (Sunshine Bass Female x Striped Bass Male) Raised in a Tank Culture System Journal of the World Aquaculture Society 1998 29 505-509
Kerby JH Cryogenic Preservation of Sperm from Striped Bass Transactions of the American Fisheries Society 1983 112 86-91
Losordo TM Westerman P An Analysis of Biological Economic and Engineering Factors Affecting the Cost of Fish Production in Recirculating Aquaculture Systems Journal of the World Aquaculture Society 1994 25 193-203
SAS Institute 1999 The SAS System for Windows version 82 SAS Institute Cary NC USA
Smith TlJ Jenkins WE Controlled Spawning of Fl Hybrid Striped Bass (Marone saxatilis x M chrysops) and Rearing of F2 Progeny Journal of the World Mariculture Society 1984 15 147-161
Smith TlJ Jenkins WE Snevel JF Production Characteristics of Striped Bass (Marone saxatilis) and Fl - F2 hybrids (Marone saxatilis and M chrysops) Reared in Intensive Tank Systems Journal of the World Mariculture Society 1985 16 57-70
Tomasso JR Kempton CJ Gallman A Smith TlJ Comparative Production Characteristics of Sunshine Bass and Sunshine Bass x Striped Bass in Recirculating-Water Systems North American Journal of Aquaculture 1999 61 79-81
Van Heukelem WF Harrell RM Hughes SG Lindell SR Friedmann BR Optimal Conditions for Swimbladder Inflation in Striped Bass Larvae Reared in Intensive Systems Northeast Regional Aquaculture Center Publication No 00-006 (2000) 5 pages
54 International Journal of Recirculating Aquaculture Volume 5 June 2004
Book Review
Fjofish apd Shellfish Bacteriology Mapua) Techpjques apd Procedures KA Whitman with contributions by NG MacNair
Iowa State Press (Blackwell Publishing Professional) Ames IA USA (2004) 288 pages ISBN 0813819520 US $4999
Reviewed by Rocco C Cipriano United States Geological Survey National Fish Health Research Laboratory 11649 Leetown Road Kearneysville WV 25430 USA E-mail rocco_ciprianousgsgov
Despite the fact that several good texts have been published regarding the description and nature of bacterial pathogens in aquatic animals there remained a need for a comprehensive yet practical guide devoted to techniques and procedures used for bacterial identification Diagnosis and detection of fish and shellfish pathogens often requires reliance upon standard microbiological media tests and reagents for some bacteria but more specialized assays are required for many aquatic pathogens In the latter case the products necessary for such assays are not commercially available and must be produced in aquatic animal diagnostic facilities from their basic ingredients Often therefore the compositions of differential media and the conduct of certain tests for the primary isolation or detection of specific aquatic pathogens are only available by referencing the general body of published scientific literature Hence until now there has not been a single-source shelf-volume that combines standard microbiological procedures used for routine detection and identification of medically important bacteria with the specialized needs of the fisheries profession This manual however helps to fill that void
The manual stands as a reference suitable for professional aquatic biologists with backgrounds in microbiology veterinarians and students of aquatic animal health Its strength lies in its coverage of the subject matter regarding culture-based diagnosis and identification of bacteria associated with finfish bivalves and lobsters Sections on
International Journal of Recirculating Aquaculture 5 (2004) 55-56 All Rights Reserved copyCopyright 2004 by Virginia Tech and Virginia Sea Grant Blacksburg VA USA
International Journal of Recirculating Aquaculture Volume 5 June 2004 55
Book Review FiQish and ShelJfish Bacteriology Manualmiddot Techniques and Procedures
aseptic collection and shipment of samples qualitative and quantitative procedures for bacterial isolation staining techniques media and standard biological tests used for the cultivation and phentotypic characterization of pathogenic bacteria and antibiotic sensitivity testing provide sound background for the student or novice practitioner Particularly beneficial for anyone who is not experienced with aquatic microbial pathogens is the section listing principal organs media and appropriate incubation temperatures to be used as the most probable sources of isolation for the specific bacteria
More experienced professionals will find it helpful and convenient to have the descriptions and interpretations of differential media (eg Coomassie Brilliant Blue Agar for Aeromonas salmonicida Rimler-Shotts Agar for Aeromonas hydropila Cytophaga Agar Shieh and TYES for Flavobacterium spp and Edwardsiella ictaluri Agar and various other media for Renibacterium salmoninarum) listed in a single source The major identifying criteria that phenotypically characterize selected bacterial pathogens are also described in tabulated form Specialized tests such as the SIF test to detect covert infections nurse culture techniques for enhanced bacterial growth and assays for public health indicator organisms in bivalves are documented Sections covering serology immunoassay and non-cultured based molecular assays (eg polymerase chain reaction) are also presented but are not as completely summarized as those for bacterial isolation In summary the nature of this manual makes it appropriate for frequent use as a practical laboratory guide
56 International Journal of Recirculating Aquaculture Volume 5 June 2004
Subscription Information
International Journal of Recirculating Aquaculture
A publication ofVirginia Tech and the Virginia Sea Grant College Program
IJRA presents the latest developments in RAS-related research focusing on the areas of
Food Quality Pathology
Food Safety
Aquatic Medicine Breeding amp Genetics Waste Management
FishShellfish Growth amp Nutrition Recirculating Systems Mgmt Marketing amp Economics Water Conservation
Dont miss an issue of this informative peer-reviewed journal Subscribe now using your credit card by calling 540-231-2075 or by printing out a form at wwwcfastvteduijrahtml If you prefer you can also mail this form to the address below along with a check or money order
Name ----------------~ Address ----------------Line2 ------------------City ____________ State __ _ Country Postal Code ___________ _ Phone Fax -------- --------e-mail-----------------check _ 2 year ($25 US)
International Journal of Recirculating Aquaculture Food Science amp Technology Building (0418)
Virginia Polytechnic Institute and State University Blacksburg VA 24061
phone (540) 231-2075 fax (540) 231-9293 e-mail IJRAvtedu
International Journal of Recirculating Aquaculture Volume 5 June 2004 57
~ International Journal of ~ Recirculating Aquaculture A publication of Virginia Tech and the Virginia Sea Grant College Program
Instructions for Authors The International Journal of Recirculating Aquaculture (IJRA) encourages the submission of original high-quality papers on research in all aspects of recirculating aquaculture Papers will be peer-reviewed and evaluated for scientific merit relevance and for their usefulness in promoting the advancement of recirculating aquaculture Complete coherent projects are preferred Any related papers submitted together must be thoroughly cross-referenced All papers must be original meaning that the data and the information presented must be the work of the authors and can not have been published elsewhere Dual publication of a paper or data is possible only through the permission of the Editors of both journals THERE ARE NO PAGE CHARGES for IJRA submissions
INITIAL MANUSCRIPT SUBMISSION Manuscripts should be sent to Ms Angela Correa Managing Editor by mail using the address listed at the end of these instructions or by e-mail to (ijravtedu) Submit four (4) copies of each manuscript if regular mail is used All manuscripts must be in English Dot matrix type is not acceptable and all such submissions will be returned without review Each submission must include a cover letter stating that the paper contains original research and that the information has not been published elsewhere E-mailed submissions must be saved in doc format Be sure to include the names of colleagues who have already reviewed the work presented IJRA has two categories for submission 1 Articles which are complete in-depth scientific studies and 2 Notes which are short papers of limited scope Articles and notes will be critically reviewed by two or three experts as well as by the Managing Editor Submissions may be returned without peer review in cases where the Managing Editor determines that they are inappropriate for the journal of poor quality poorly written or fail to follow the journals style format
PREPARATION OF MANUSCRIPTS IJRA uses the latest editions of Websters New International Dictionary and Websters New Collegiate Dictionarv for standard spellings and word definitions All spelling will be in American English Foreign or science-related terminology that is unfamiliar and does not appear in these dictionaries will require an accompanying definition Acceptable scientific and common names of fishes are listed in A List of Common and Scientific Names of Fishes from the United States and Canada published by the American Fisheries Society Common names may be used throughout each paper but must be accompanied by a full scientific name when they first appear in a paper The author must use the full common name eg yellow perch not perch All foreign language words should be italicized in the manuscript
In the manuscript number each page sequentially and include the senior authors name next to the page number (eg Page 4 Jahncke) on each page Single-space all typed material including references Type size in the body of the text should be no larger than 12pts and no smaller than 10 pts Subsection headings should also be italicized in the manuscript Spell out one-digit numbers except when they are used with units of measure - eg six ponds 7 days
International Journal of Recirculating Aquaculture Volume 5 June 2004 59
Spell out any number that begins a sentence When two numbers occur sequentially in the text one of the numbers must be spelled out- eg In 1987 fifty fish were stocked Use commas in numbers of 1000 or more Use the 24-hour clock to describe time- eg 1300 not 100 pm
Keep footnotes to a minimum and number them sequentially throughout the paper All units of measurement must be reported via the metric system except in special circumstances (eg horsepower) Standard scientific abbreviations and symbols may be used without definition If the use of a symbol could cause confusion define the symbol the first time it is used On the final draft of a paper that has been accepted for publication Greek letters or other extraneous symbols that do not appear on a keyboard the name of the symbol should be noted where the symbol is used to help eliminate prepress errors Parts per million or milligrams per liter can be
-1 reported as either ppm or mgI but not as mgI
Commonly used aquaculture jargon can be used without defining the term - eg fry fingerling hapa Less commonly used jargon may also be used but terms should be defined the first time they are used Jargon from fields outside of aquaculture should also be defined the first time they are used Always place a zero to the left of a decimal point if the number is less than one this includes probability values - eg P = 005 not P = 05
COMPONENTS OF THE MANUSCRIPTS Articles and notes should include a title names of authors and their addresses abstract introduction materials and methods results discussion (or a combined results and discussion) conclusion (rarely) acknowledgements (if any) references figures and tables in that order Each section should start on a new page
Title - The title should accurately reflect the contents of the paper Brief concise titles are encouraged The title page must include the name(s) of the author(s) and all addresses
Abstract - The abstract should be a concise highlight of the results and conclusions Methodology should not be abstracted unless it is necessary to explain the results or unless the paper describes a new technique Abstracts should be less than 300 words
Introduction - The introduction should explain why the paper was written and why it should be read The introduction should condense the relevant information in the field that led the author to do the research The introduction is not a complete literature review and only the most relevant references should be cited The introduction should also contain a statement that describes the purpose or objective of the paper
Materials and Methods - The underlying goal of this section is to describe what was done so that others can repeat the experiment If previously published papers described a technique that was used they can be cited to prevent unnecessary repetition If the technique or process was modified the modification must be described so that others can repeat the process Experimental designs can be explained by use of figures if they will help clarify what was done If the experiment was a complicated one with many subparts subsections may be used to describe each subpart
Results - This section describes the data Proper use of tables and figures can simplify and help explain the results Statistical analysis of data is necessary unless differences are so obvious that statistical analysis is superfluous Although probability values of 005 and 001 are traditionally used each author is free to choose his or her own level of significance
60 International Journal of Recirculating Aquaculture Volume 5 June 2004
Discussion - This section should interpret the results and compare the results from this experiment to those found in similar research The section can also be used to speculate about the results to provide reasons for the trends and to suggest new ideas that can advance our understanding about aquaculture This section should not be a literature review section that merely compares results among several papers
Results and Discussion - Results and discussion sections can be combined In most cases this leads to a better paper because the integration of these sections leads to a more meaningful interpretation of data
Conclusion - This section should be used only when the results of an experiment lead to an unequivocal interpretation
Acknowledgements - This section should be used to thank organizations that supported the research monetarily and individuals who assisted in the research or preparation of the paper This section includes manuscript number designations for those institutions that assign such numbers
References - Select references with great care Unless the paper includes a literature review there is no need to reference every paper written about a subject Use only the most important ones
Figures and Tables - All figures andtables go after the references Figures always go before tables
Section headings (eg Materials and Methods) should be capitalized and in bold type Secondary headings should be balded and go flush left Tertiary headings are incorporated into the first paragraph of that subsection Tertiary headings are italicized and separated from the text by a double dash
In the text references are cited in one of two ways 1 Swingle (1959) evaluated two species of tilapia or 2 pond culture in Alabama began in the 1950s (Swingle 1959) When there are three or more authors list only the first in a citation and follow that with et al eg Smitherman et al (1983) reviewed catfish breeding work at Auburn University If the name of an institutional author is long it can be abbreviated in a citation eg Food and Agriculture Organization of the United Nations may be abbreviated as FAO When several citations are used in a single entry they are listed chronologically If you are citing two papers that were written by the same author(s) the name only has to appear once per citation followed by the years that designate the different papers Separate the years with a comma If you are citing two authors you must separate the citations with a semicolon (Smith 1975 1976 Jones 1976)
In the reference section the reference list is strictly alphabetical by last name of the senior author and then by initials if two authors have identical last names If an author has written more than one paper the following format should be followed All single authored papers go first followed by co-authored papers and then the papers that were written by three or more authors If an author has written more than one single-authored paper the papers are listed chronologically If an author has written more than one co-authored paper they are listed alphabetically by the second authors last name If a tandem has authored two or more papers the order is chronological Papers written by the same group of three or more authors should be listed chronologically
International Journal of Recirculating Aquaculture Volume 5 June 2004 61
The following format will be used when referencing various works
PAPERS Single-author papers
McGinty AS Effects of Size at Stocking on Competition and Growth of All-Male Tilapia Hybrids Journal of the World Aquaculture Society 1985 16 52-56
Multiple-author papers Tave D Smitherman RO Predicted Response to Selection for Early Growth in Tilapia nilotica Transactions of the American Fisheries Society 1980 109 439-445
If an author has published two or more papers in the same year follow the years with a letter to differentiate them eg Smith 1988a 1988b Use issue numbers only when each issue starts out with page 1 If pagination is consecutive throughout the volume omit the issue number Spell out journal names in their entirely without abbreviations
Papers in proceedings or in edited volumes Nicholson LC Woods LC Ill Woiwode JG Intensive Culture Techniques for the Striped Bass and its Hybrids In Culture and Propagation of Striped Bass and Its Hybrids Harrell RM Kerby JH Minton RV Eds 1990 American Fisheries Society Bethesda MD USA
Books and reportspublications from governmental or non-governmental bodies
Lovell T 1989 Nutrition and Feeding of Fish Van Nostrand Reinhold New York NY USA
Food and Agriculture Organization of the United Nations (FAO) Fisheries Department 1997 Review of the State of World Aquaculture No 886 FIRlC886 FAO Rome Italy
Theses and Dissertations
Easter CC 1992 Water Chemistry Characterization and Performance of a Recirculating Aquaculture System Producing Hybrid Striped Bass Masters thesis Virginia Polytechnic Institute and State University Blacksburg VA USA
Websites
Federation of European Aquaculture Producers (FEAP) European Eel Production (httpwwwfeaporgeelshtml) 2002
Page numbers for proceedings books theses and dissertations are unnecessary Government publications should be treated as if they were books but document numbers must be included THE ACCURACY OF REFERENCES IS THE SOLE RESPONSIBILITY OF THE AUTHORS MAKE SURE THAT CITATIONS AND REFERENCES MATCH
Tables - When creating a table decide what the purpose of the table is and what points are important then organize the table so that the main features can be easily understood The table heading should provide sufficient information for the table to be understood as an entity Keep footnotes to a minimum Each table goes on a separate page Tables must be camera ready TABLES WILL BE PRINTED AS IS AND WILL NOT BE TYPESET Figures - List all figure captions on separate pages Original artwork doesnt have to be submitted when a paper is first submitted for review but original artwork must accompany the final revised manuscript Good quality photocopies are acceptable when a manuscript
62 International Journal of Recirculating Aquaculture Volume 5 June 2004
is submitted for review Graphs and original artwork must be printed with a laser printer or done in pen and ink Dot-matrix figures are not acceptable Original artwork or high-contrast photographs are acceptable Label all figures on the back with a soft pencil name of senior author paper title and figure number
Photographs - Should be on glossy paper with good contrast Do not glue pictures to cardboard Color photographs can be printed but the additional cost of printing them will be charged to the author Label all photos on the back with a soft pencil name of senior author paper title and figure number
FINAL REVISED MANUSCRIPTS If using the mail submit two copies of the final revised manuscript including original artwork Submit either the original pen-and-ink drawings or laser-printed versions of the drawings In addition submit the manuscript on a disk (CD preferable) or by e-mail On the disk write the brand name of the computer or word processor the word processing program that was used (should be Microsoft Word) the title of your article and the file name NOTE Disk and hard copy must agree In case of discrepancies it is the policy of IJRA to follow hard copy An electronic version of the completed manuscript is needed in order to publish AUTHORS MAY NOT RECEIVE PAGE PROOFS Proofreading will be done by the Production Office of IJRA using the revised final version of the manuscript Therefore authors must be especially careful that no errors exist in the final revised version because in most cases no changes are possible after it is submitted
REPRINTS The senior author will receive two copies of the journal and a pdf file of the article for distribution and reprinting purposes The junior author(s) will also receive two copies of the journal issue These are sent several weeks after the journal is published and in circulation Requests for the pdf format of the article can only be made by the corresponding author
COPYRIGHT amp PERMISSIONS For permission to reprint articles that have appeared in IJRA please contact IJRA Copyright amp Permissions Food Science amp Technology Building (0418) Virginia Tech Blacksburg VA 24061 USA
COPYRIGHT TRANSFER If your manuscript is accepted for publication copyright ownership must be officially transferred to IJRA The Editors acceptance letter will include a form fully explaining this The form must be signed by all authors and the original returned to the Editor at this time Failure to return the copyright form in a timely fashion will result in delay in publication
Send your submissions to International Journal of Recirculating Aquaculture
AI Correa Managing Editor 27-B Food Science and Technology Building (0418) Virginia Polytechnic Institute and State University Blacksburg VA 24061 USA
If you have any questions please feel free to contact us Phone (540) 231-2075 Fax (540) 231-9293 e-mail ijravtedu
International Journal of Recirculating Aquaculture Volume 5 June 2004 63
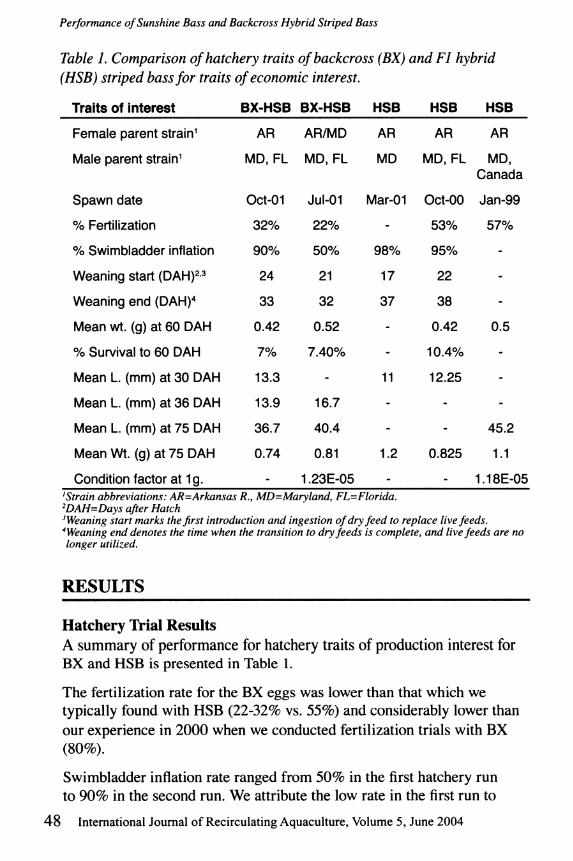
Performance of Sunshine Bass and Backcross Hybrid Striped Bass
Jenkins WE Heyward LD Sr Smith TIJ Performance of Domesticated Striped Bass Marone saxatilis Palmetto Bass and Backcross Hybrid Striped Bass (Sunshine Bass Female x Striped Bass Male) Raised in a Tank Culture System Journal of the World Aquaculture Society 1998 29 505-509
Kerby JH Cryogenic Preservation of Sperm from Striped Bass Transactions of the American Fisheries Society 1983 112 86-91
Losordo TM Westerman P An Analysis of Biological Economic and Engineering Factors Affecting the Cost of Fish Production in Recirculating Aquaculture Systems Journal of the World Aquaculture Society 1994 25 193-203
SAS Institute 1999 The SAS System for Windows version 82 SAS Institute Cary NC USA
Smith TlJ Jenkins WE Controlled Spawning of Fl Hybrid Striped Bass (Marone saxatilis x M chrysops) and Rearing of F2 Progeny Journal of the World Mariculture Society 1984 15 147-161
Smith TlJ Jenkins WE Snevel JF Production Characteristics of Striped Bass (Marone saxatilis) and Fl - F2 hybrids (Marone saxatilis and M chrysops) Reared in Intensive Tank Systems Journal of the World Mariculture Society 1985 16 57-70
Tomasso JR Kempton CJ Gallman A Smith TlJ Comparative Production Characteristics of Sunshine Bass and Sunshine Bass x Striped Bass in Recirculating-Water Systems North American Journal of Aquaculture 1999 61 79-81
Van Heukelem WF Harrell RM Hughes SG Lindell SR Friedmann BR Optimal Conditions for Swimbladder Inflation in Striped Bass Larvae Reared in Intensive Systems Northeast Regional Aquaculture Center Publication No 00-006 (2000) 5 pages
54 International Journal of Recirculating Aquaculture Volume 5 June 2004
Book Review
Fjofish apd Shellfish Bacteriology Mapua) Techpjques apd Procedures KA Whitman with contributions by NG MacNair
Iowa State Press (Blackwell Publishing Professional) Ames IA USA (2004) 288 pages ISBN 0813819520 US $4999
Reviewed by Rocco C Cipriano United States Geological Survey National Fish Health Research Laboratory 11649 Leetown Road Kearneysville WV 25430 USA E-mail rocco_ciprianousgsgov
Despite the fact that several good texts have been published regarding the description and nature of bacterial pathogens in aquatic animals there remained a need for a comprehensive yet practical guide devoted to techniques and procedures used for bacterial identification Diagnosis and detection of fish and shellfish pathogens often requires reliance upon standard microbiological media tests and reagents for some bacteria but more specialized assays are required for many aquatic pathogens In the latter case the products necessary for such assays are not commercially available and must be produced in aquatic animal diagnostic facilities from their basic ingredients Often therefore the compositions of differential media and the conduct of certain tests for the primary isolation or detection of specific aquatic pathogens are only available by referencing the general body of published scientific literature Hence until now there has not been a single-source shelf-volume that combines standard microbiological procedures used for routine detection and identification of medically important bacteria with the specialized needs of the fisheries profession This manual however helps to fill that void
The manual stands as a reference suitable for professional aquatic biologists with backgrounds in microbiology veterinarians and students of aquatic animal health Its strength lies in its coverage of the subject matter regarding culture-based diagnosis and identification of bacteria associated with finfish bivalves and lobsters Sections on
International Journal of Recirculating Aquaculture 5 (2004) 55-56 All Rights Reserved copyCopyright 2004 by Virginia Tech and Virginia Sea Grant Blacksburg VA USA
International Journal of Recirculating Aquaculture Volume 5 June 2004 55
Book Review FiQish and ShelJfish Bacteriology Manualmiddot Techniques and Procedures
aseptic collection and shipment of samples qualitative and quantitative procedures for bacterial isolation staining techniques media and standard biological tests used for the cultivation and phentotypic characterization of pathogenic bacteria and antibiotic sensitivity testing provide sound background for the student or novice practitioner Particularly beneficial for anyone who is not experienced with aquatic microbial pathogens is the section listing principal organs media and appropriate incubation temperatures to be used as the most probable sources of isolation for the specific bacteria
More experienced professionals will find it helpful and convenient to have the descriptions and interpretations of differential media (eg Coomassie Brilliant Blue Agar for Aeromonas salmonicida Rimler-Shotts Agar for Aeromonas hydropila Cytophaga Agar Shieh and TYES for Flavobacterium spp and Edwardsiella ictaluri Agar and various other media for Renibacterium salmoninarum) listed in a single source The major identifying criteria that phenotypically characterize selected bacterial pathogens are also described in tabulated form Specialized tests such as the SIF test to detect covert infections nurse culture techniques for enhanced bacterial growth and assays for public health indicator organisms in bivalves are documented Sections covering serology immunoassay and non-cultured based molecular assays (eg polymerase chain reaction) are also presented but are not as completely summarized as those for bacterial isolation In summary the nature of this manual makes it appropriate for frequent use as a practical laboratory guide
56 International Journal of Recirculating Aquaculture Volume 5 June 2004
Subscription Information
International Journal of Recirculating Aquaculture
A publication ofVirginia Tech and the Virginia Sea Grant College Program
IJRA presents the latest developments in RAS-related research focusing on the areas of
Food Quality Pathology
Food Safety
Aquatic Medicine Breeding amp Genetics Waste Management
FishShellfish Growth amp Nutrition Recirculating Systems Mgmt Marketing amp Economics Water Conservation
Dont miss an issue of this informative peer-reviewed journal Subscribe now using your credit card by calling 540-231-2075 or by printing out a form at wwwcfastvteduijrahtml If you prefer you can also mail this form to the address below along with a check or money order
Name ----------------~ Address ----------------Line2 ------------------City ____________ State __ _ Country Postal Code ___________ _ Phone Fax -------- --------e-mail-----------------check _ 2 year ($25 US)
International Journal of Recirculating Aquaculture Food Science amp Technology Building (0418)
Virginia Polytechnic Institute and State University Blacksburg VA 24061
phone (540) 231-2075 fax (540) 231-9293 e-mail IJRAvtedu
International Journal of Recirculating Aquaculture Volume 5 June 2004 57
~ International Journal of ~ Recirculating Aquaculture A publication of Virginia Tech and the Virginia Sea Grant College Program
Instructions for Authors The International Journal of Recirculating Aquaculture (IJRA) encourages the submission of original high-quality papers on research in all aspects of recirculating aquaculture Papers will be peer-reviewed and evaluated for scientific merit relevance and for their usefulness in promoting the advancement of recirculating aquaculture Complete coherent projects are preferred Any related papers submitted together must be thoroughly cross-referenced All papers must be original meaning that the data and the information presented must be the work of the authors and can not have been published elsewhere Dual publication of a paper or data is possible only through the permission of the Editors of both journals THERE ARE NO PAGE CHARGES for IJRA submissions
INITIAL MANUSCRIPT SUBMISSION Manuscripts should be sent to Ms Angela Correa Managing Editor by mail using the address listed at the end of these instructions or by e-mail to (ijravtedu) Submit four (4) copies of each manuscript if regular mail is used All manuscripts must be in English Dot matrix type is not acceptable and all such submissions will be returned without review Each submission must include a cover letter stating that the paper contains original research and that the information has not been published elsewhere E-mailed submissions must be saved in doc format Be sure to include the names of colleagues who have already reviewed the work presented IJRA has two categories for submission 1 Articles which are complete in-depth scientific studies and 2 Notes which are short papers of limited scope Articles and notes will be critically reviewed by two or three experts as well as by the Managing Editor Submissions may be returned without peer review in cases where the Managing Editor determines that they are inappropriate for the journal of poor quality poorly written or fail to follow the journals style format
PREPARATION OF MANUSCRIPTS IJRA uses the latest editions of Websters New International Dictionary and Websters New Collegiate Dictionarv for standard spellings and word definitions All spelling will be in American English Foreign or science-related terminology that is unfamiliar and does not appear in these dictionaries will require an accompanying definition Acceptable scientific and common names of fishes are listed in A List of Common and Scientific Names of Fishes from the United States and Canada published by the American Fisheries Society Common names may be used throughout each paper but must be accompanied by a full scientific name when they first appear in a paper The author must use the full common name eg yellow perch not perch All foreign language words should be italicized in the manuscript
In the manuscript number each page sequentially and include the senior authors name next to the page number (eg Page 4 Jahncke) on each page Single-space all typed material including references Type size in the body of the text should be no larger than 12pts and no smaller than 10 pts Subsection headings should also be italicized in the manuscript Spell out one-digit numbers except when they are used with units of measure - eg six ponds 7 days
International Journal of Recirculating Aquaculture Volume 5 June 2004 59
Spell out any number that begins a sentence When two numbers occur sequentially in the text one of the numbers must be spelled out- eg In 1987 fifty fish were stocked Use commas in numbers of 1000 or more Use the 24-hour clock to describe time- eg 1300 not 100 pm
Keep footnotes to a minimum and number them sequentially throughout the paper All units of measurement must be reported via the metric system except in special circumstances (eg horsepower) Standard scientific abbreviations and symbols may be used without definition If the use of a symbol could cause confusion define the symbol the first time it is used On the final draft of a paper that has been accepted for publication Greek letters or other extraneous symbols that do not appear on a keyboard the name of the symbol should be noted where the symbol is used to help eliminate prepress errors Parts per million or milligrams per liter can be
-1 reported as either ppm or mgI but not as mgI
Commonly used aquaculture jargon can be used without defining the term - eg fry fingerling hapa Less commonly used jargon may also be used but terms should be defined the first time they are used Jargon from fields outside of aquaculture should also be defined the first time they are used Always place a zero to the left of a decimal point if the number is less than one this includes probability values - eg P = 005 not P = 05
COMPONENTS OF THE MANUSCRIPTS Articles and notes should include a title names of authors and their addresses abstract introduction materials and methods results discussion (or a combined results and discussion) conclusion (rarely) acknowledgements (if any) references figures and tables in that order Each section should start on a new page
Title - The title should accurately reflect the contents of the paper Brief concise titles are encouraged The title page must include the name(s) of the author(s) and all addresses
Abstract - The abstract should be a concise highlight of the results and conclusions Methodology should not be abstracted unless it is necessary to explain the results or unless the paper describes a new technique Abstracts should be less than 300 words
Introduction - The introduction should explain why the paper was written and why it should be read The introduction should condense the relevant information in the field that led the author to do the research The introduction is not a complete literature review and only the most relevant references should be cited The introduction should also contain a statement that describes the purpose or objective of the paper
Materials and Methods - The underlying goal of this section is to describe what was done so that others can repeat the experiment If previously published papers described a technique that was used they can be cited to prevent unnecessary repetition If the technique or process was modified the modification must be described so that others can repeat the process Experimental designs can be explained by use of figures if they will help clarify what was done If the experiment was a complicated one with many subparts subsections may be used to describe each subpart
Results - This section describes the data Proper use of tables and figures can simplify and help explain the results Statistical analysis of data is necessary unless differences are so obvious that statistical analysis is superfluous Although probability values of 005 and 001 are traditionally used each author is free to choose his or her own level of significance
60 International Journal of Recirculating Aquaculture Volume 5 June 2004
Discussion - This section should interpret the results and compare the results from this experiment to those found in similar research The section can also be used to speculate about the results to provide reasons for the trends and to suggest new ideas that can advance our understanding about aquaculture This section should not be a literature review section that merely compares results among several papers
Results and Discussion - Results and discussion sections can be combined In most cases this leads to a better paper because the integration of these sections leads to a more meaningful interpretation of data
Conclusion - This section should be used only when the results of an experiment lead to an unequivocal interpretation
Acknowledgements - This section should be used to thank organizations that supported the research monetarily and individuals who assisted in the research or preparation of the paper This section includes manuscript number designations for those institutions that assign such numbers
References - Select references with great care Unless the paper includes a literature review there is no need to reference every paper written about a subject Use only the most important ones
Figures and Tables - All figures andtables go after the references Figures always go before tables
Section headings (eg Materials and Methods) should be capitalized and in bold type Secondary headings should be balded and go flush left Tertiary headings are incorporated into the first paragraph of that subsection Tertiary headings are italicized and separated from the text by a double dash
In the text references are cited in one of two ways 1 Swingle (1959) evaluated two species of tilapia or 2 pond culture in Alabama began in the 1950s (Swingle 1959) When there are three or more authors list only the first in a citation and follow that with et al eg Smitherman et al (1983) reviewed catfish breeding work at Auburn University If the name of an institutional author is long it can be abbreviated in a citation eg Food and Agriculture Organization of the United Nations may be abbreviated as FAO When several citations are used in a single entry they are listed chronologically If you are citing two papers that were written by the same author(s) the name only has to appear once per citation followed by the years that designate the different papers Separate the years with a comma If you are citing two authors you must separate the citations with a semicolon (Smith 1975 1976 Jones 1976)
In the reference section the reference list is strictly alphabetical by last name of the senior author and then by initials if two authors have identical last names If an author has written more than one paper the following format should be followed All single authored papers go first followed by co-authored papers and then the papers that were written by three or more authors If an author has written more than one single-authored paper the papers are listed chronologically If an author has written more than one co-authored paper they are listed alphabetically by the second authors last name If a tandem has authored two or more papers the order is chronological Papers written by the same group of three or more authors should be listed chronologically
International Journal of Recirculating Aquaculture Volume 5 June 2004 61
The following format will be used when referencing various works
PAPERS Single-author papers
McGinty AS Effects of Size at Stocking on Competition and Growth of All-Male Tilapia Hybrids Journal of the World Aquaculture Society 1985 16 52-56
Multiple-author papers Tave D Smitherman RO Predicted Response to Selection for Early Growth in Tilapia nilotica Transactions of the American Fisheries Society 1980 109 439-445
If an author has published two or more papers in the same year follow the years with a letter to differentiate them eg Smith 1988a 1988b Use issue numbers only when each issue starts out with page 1 If pagination is consecutive throughout the volume omit the issue number Spell out journal names in their entirely without abbreviations
Papers in proceedings or in edited volumes Nicholson LC Woods LC Ill Woiwode JG Intensive Culture Techniques for the Striped Bass and its Hybrids In Culture and Propagation of Striped Bass and Its Hybrids Harrell RM Kerby JH Minton RV Eds 1990 American Fisheries Society Bethesda MD USA
Books and reportspublications from governmental or non-governmental bodies
Lovell T 1989 Nutrition and Feeding of Fish Van Nostrand Reinhold New York NY USA
Food and Agriculture Organization of the United Nations (FAO) Fisheries Department 1997 Review of the State of World Aquaculture No 886 FIRlC886 FAO Rome Italy
Theses and Dissertations
Easter CC 1992 Water Chemistry Characterization and Performance of a Recirculating Aquaculture System Producing Hybrid Striped Bass Masters thesis Virginia Polytechnic Institute and State University Blacksburg VA USA
Websites
Federation of European Aquaculture Producers (FEAP) European Eel Production (httpwwwfeaporgeelshtml) 2002
Page numbers for proceedings books theses and dissertations are unnecessary Government publications should be treated as if they were books but document numbers must be included THE ACCURACY OF REFERENCES IS THE SOLE RESPONSIBILITY OF THE AUTHORS MAKE SURE THAT CITATIONS AND REFERENCES MATCH
Tables - When creating a table decide what the purpose of the table is and what points are important then organize the table so that the main features can be easily understood The table heading should provide sufficient information for the table to be understood as an entity Keep footnotes to a minimum Each table goes on a separate page Tables must be camera ready TABLES WILL BE PRINTED AS IS AND WILL NOT BE TYPESET Figures - List all figure captions on separate pages Original artwork doesnt have to be submitted when a paper is first submitted for review but original artwork must accompany the final revised manuscript Good quality photocopies are acceptable when a manuscript
62 International Journal of Recirculating Aquaculture Volume 5 June 2004
is submitted for review Graphs and original artwork must be printed with a laser printer or done in pen and ink Dot-matrix figures are not acceptable Original artwork or high-contrast photographs are acceptable Label all figures on the back with a soft pencil name of senior author paper title and figure number
Photographs - Should be on glossy paper with good contrast Do not glue pictures to cardboard Color photographs can be printed but the additional cost of printing them will be charged to the author Label all photos on the back with a soft pencil name of senior author paper title and figure number
FINAL REVISED MANUSCRIPTS If using the mail submit two copies of the final revised manuscript including original artwork Submit either the original pen-and-ink drawings or laser-printed versions of the drawings In addition submit the manuscript on a disk (CD preferable) or by e-mail On the disk write the brand name of the computer or word processor the word processing program that was used (should be Microsoft Word) the title of your article and the file name NOTE Disk and hard copy must agree In case of discrepancies it is the policy of IJRA to follow hard copy An electronic version of the completed manuscript is needed in order to publish AUTHORS MAY NOT RECEIVE PAGE PROOFS Proofreading will be done by the Production Office of IJRA using the revised final version of the manuscript Therefore authors must be especially careful that no errors exist in the final revised version because in most cases no changes are possible after it is submitted
REPRINTS The senior author will receive two copies of the journal and a pdf file of the article for distribution and reprinting purposes The junior author(s) will also receive two copies of the journal issue These are sent several weeks after the journal is published and in circulation Requests for the pdf format of the article can only be made by the corresponding author
COPYRIGHT amp PERMISSIONS For permission to reprint articles that have appeared in IJRA please contact IJRA Copyright amp Permissions Food Science amp Technology Building (0418) Virginia Tech Blacksburg VA 24061 USA
COPYRIGHT TRANSFER If your manuscript is accepted for publication copyright ownership must be officially transferred to IJRA The Editors acceptance letter will include a form fully explaining this The form must be signed by all authors and the original returned to the Editor at this time Failure to return the copyright form in a timely fashion will result in delay in publication
Send your submissions to International Journal of Recirculating Aquaculture
AI Correa Managing Editor 27-B Food Science and Technology Building (0418) Virginia Polytechnic Institute and State University Blacksburg VA 24061 USA
If you have any questions please feel free to contact us Phone (540) 231-2075 Fax (540) 231-9293 e-mail ijravtedu
International Journal of Recirculating Aquaculture Volume 5 June 2004 63