Embed Size (px)
Citation preview
June 1985
... -J
Staff Paper No. 239
EFFECT OF IMITATION OR
FILLED DAIRY PRODUCTS
by
Truman F. Graf
University of Wisconsin Madison, Wisconsin
EFFECT OF IMITATION OR FILLED DAIRY PRODUCTS
by
Truman F. Graf Department of Agricultural Economics
University of Wisconsin-Madison
Presented at Eightieth Annual Meeting
American Dairy Science Association University of Illinois
Urbana-Champaign, Illinois June 12, 1985
Introduction
The dairy industry is confronted with a myriad of problems including
stagnant prices, increasing costs, surpluses, lagging per capita consumption,
subsidized imports, an unfavorable international market, and imitation dairy
products. Many of the other problems derive in part from the imitation problem,
which in turn derives from profit maximization decisions independent of
dairying, and thus is less subject to correction by the dairy industry than are
many of its other problems. Many therefore feel the imitation problem is the
greatest single challenge facing the dairy industry. This paper analyzes the
economic effects of imitation dairy products.
Imitation Impact
Harket Impact
Research findings of the United Dairy Industry Association (UDIA), reported
by the Chief Executive Officer, at the group's 1982 Annual Heeting, quantified
the U.S. dairy imitation volume as follows:
(a) 30% of the overall market for dairy products;
(b) 72% of the butter market;
(c) 50% of the cream market;
(d) 15% of the fluid milk market;
(e) 5% of the cheese market; and
(f) 1.7% of the ice cream market.
- 2 -
The large proportion of the dairy market claimed by imitations, naturally
has a tremendously negative impact on the dairy market.
Product Impact
UDIA research indicated the following imitation vulnerability ranking of
dairy products:
(1) cheese;
(2) cream;
(3) fluid milk;
(4) ice cream;
(5) butter;
(6) cottage cheese; and
(7) yogurt.
Unfortunately cheese which is the second heaviest utilizer of milk (29% in
1984), is the most vulnerable to increased competition from imitations.
Imitation cheese consumption continues to increase, and poses an increasing
challenge to the dairy industry.
Dairy Industry Impact
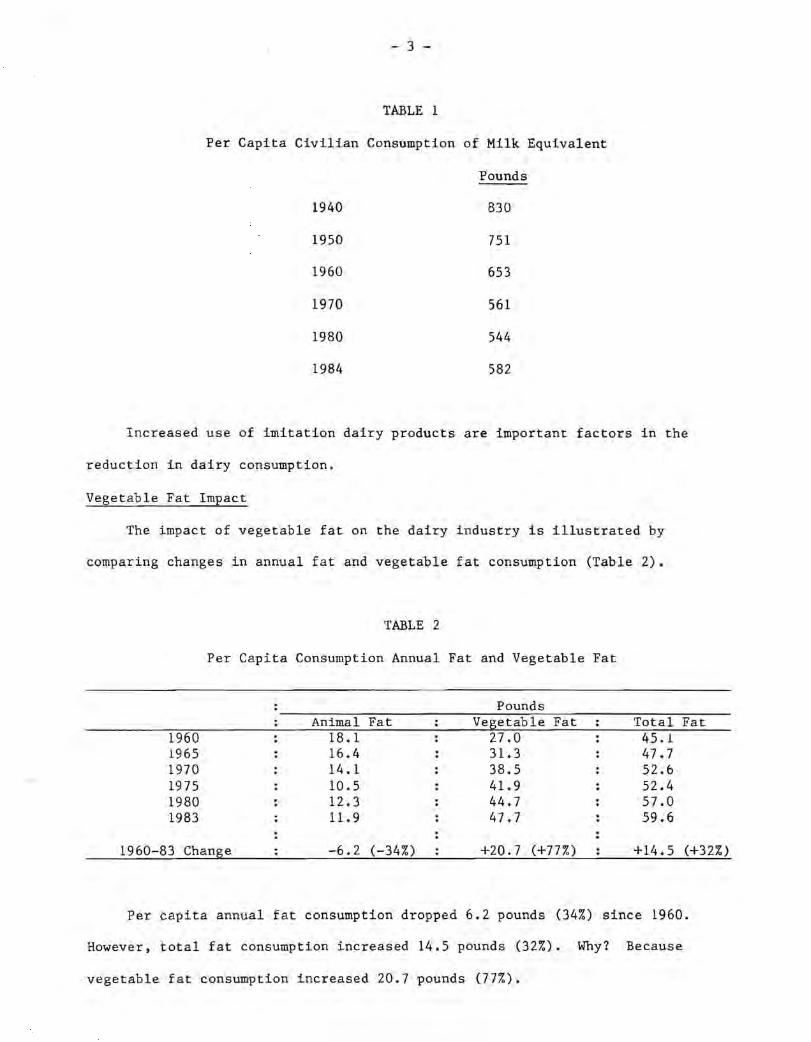
Lagging per capita consumption -- down 169 pounds of milk equivalent (23%)
since 1950, and down 248 pounds (30%) since 1940, pinpoint the impact of
imitations (Table 1).
- 3 -
TABLE 1
Per Capita Civilian Consumption of Milk Equivalent
Pounds
1940 830
1950 751
1960 653
1970 561
1980 544
1984 582
Increased use of imitation dairy products are important factors in the
reduction in dairy consumption.
Vegetable Fat Impact
The impact of vegetable fat on the dairy industry is illustrated by
comparing changes in annual fat and vegetable fat consumption (Table 2).
TABLE 2
Per Capita Consumption Annual Fat and Vegetable Fat
Pounds Animal Fat Vegetable Fat Total Fat
1960 18.1 27.0 45.1 1965 16.4 31.3 47.7 1970 14.1 38.5 52.6 1975 10.5 41.9 52.4 1980 12.3 44.7 57.0 1983 11.9 47.7 59.6
1960-83 Change -6.2 (-34%) +20.7 (+77%) +14.5 (+32%)
Per capita annual fat consumption dropped 6.2 pounds (34%) since 1960.
However, total fat consumption increased 14.5 pounds (32%). Why? Because
vegetable fat consumption increased 20.7 pounds (77%).
- 4 -
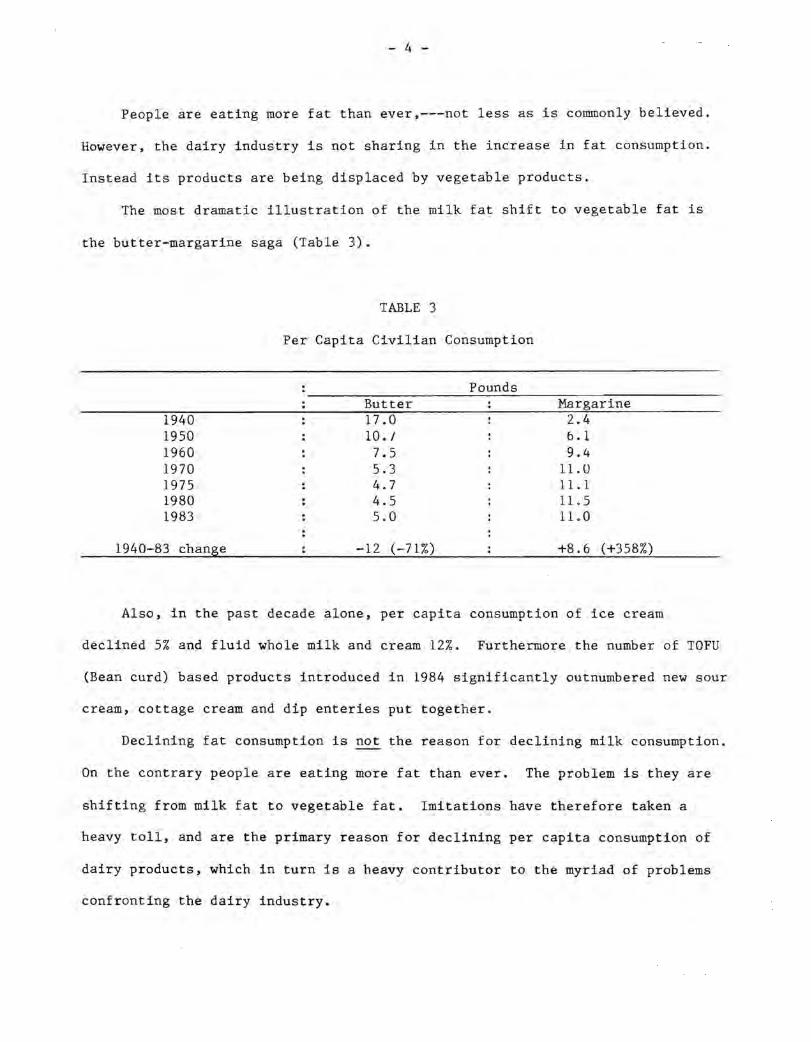
People are eating more fat than ever,---not less as is commonly believed.
However, the dairy indu~try is not sharing in the increase in fat consumption.
Instead its products are being displaced by vegetable products.
The most dramatic illustration of the milk fat shift to vegetable fat is
the butter-margarine saga (Table 3).
1940 1950 1960 1970 1975 1980 1983
1940-83 change
TABLE 3
Per Capita Civilian Consumption
Butter 17.0 10. / 7.5 5.3 4.7 4.5 5.0
-12 (-71%)
Pounds Margarine
2.4 b.l 9.4
11.0 11.1 11.5 11.0
+8.6 (+358%)
Also, in the past decade alone, per capita consumption of ice cream
declined 5% and fluid whole milk and cream 12%. Furthermore the number of TOFU
(Bean curd) based products introduced in 1984 significantly outnumbered new sour
cream, cottage cream and dip enteries put together.
Declining fat consumption is not the reason for declining milk consumption.
On the contrary people are eating more fat than ever. The problem is they are
shifting from milk fat to vegetable fat. Imitations have therefore taken a
heavy toll, and are the primary reason for declining per capita consumption of
dairy products, which in turn is a heavy contributor to the myriad of problems
confronting the dairy industry.
- 5 -
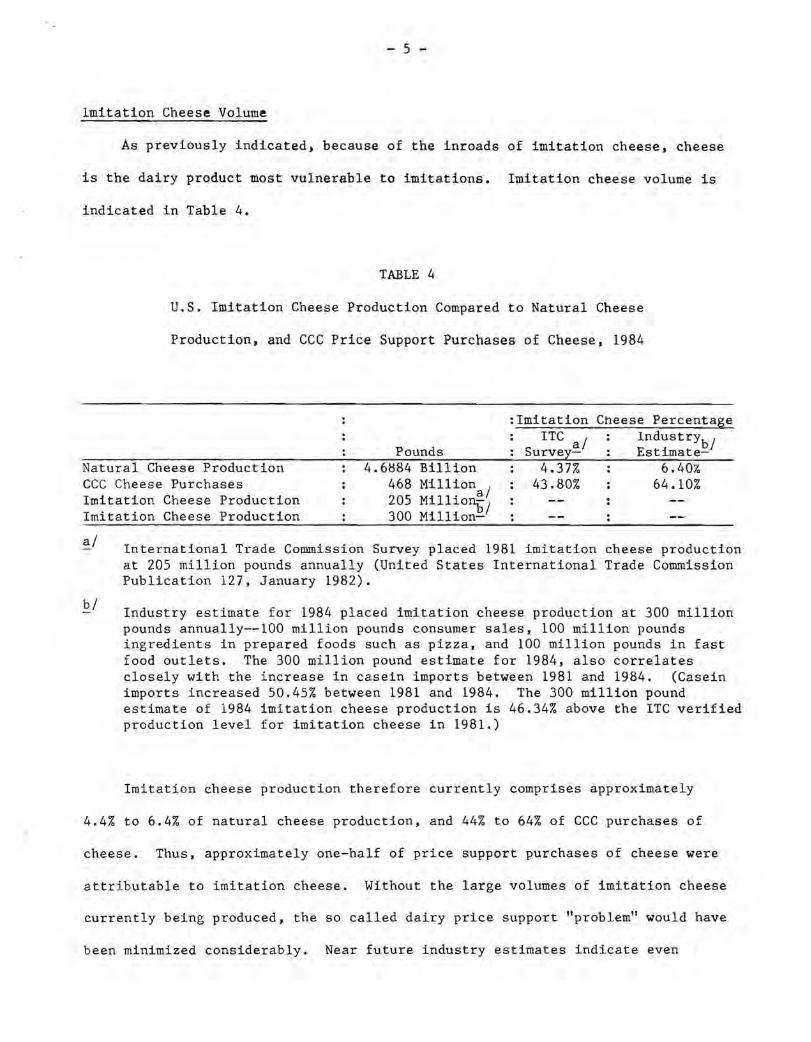
Imitation Cheese Volume
As previously indicated, because of the inroads of imitation cheese, cheese
is the dairy product most vulnerable to imitations. Imitation cheese volume is
indicated in Table 4.
TABLE 4
U.S. Imitation Cheese Production Compared to Natural Cheese
Production, and CCC Price Support Purchases of Cheese, 1984
Pounds
: Imitation ITC al
Survey-
Cheese Percentage IndustrYbl
. Estimate-
Natural Cheese Production CCC Cheese Purchases Imitation Cheese Production Imitation Cheese Production
4.6~84 Billion 468 Million I 205 Millio~1 300 Million-
4.37% 43.80%
6.407-64.10%
al
bl
International Trade Commission Survey placed 1981 imitation cheese production at 205 million pounds annually (United States International Trade Commission Publication 127, January 1982).
Industry estimate for 1984 placed imitation cheese production at 300 million pounds annually--100 million pounds consumer sales, 100 million pounds ingredients in prepared foods such as pizza, and 100 million pounds in fast food outlets. The 300 million pound estimate for 1984, also correlates closely with the increase in casein imports between 1981 and 1984. (Casein imports increased 50.45% between 1981 and 1984. The 300 million pound estimate of 1984 imitation cheese production is 46.34% above the ITC verified production level for imitation cheese in 1981.)
Imitation cheese production therefore currently comprises approximately
4.4% to 6.4% of natural cheese production, and 44% to 64% of CCC purchases of
cheese. Thus, approximately one-half of price support purchases of cheese were
attributable to imitation cheese. Without the large volumes of imitation cheese
currently being produced, the so called dairy price support "problem" would have
been minimized considerably. Near future industry estimates indicate even
- 6 -
larger imitation cheese production,---ranging from 8% to 15% of natural cheese
production. SAMI a private research group concludes 1984 imitation cheese sales
increased 6% over 1983 sales.
Imitation cheese therefore poses a considerable competitive threat to
natural cheese--and its competitive challenge is increasing. Industry estimates
suggest approximately 90% of imitation cheese is used by food processors,
restaurants and institutional feeding operations. Fast food operations appear
to be the fastest growing outlet for imitation cheese, with increasing use of
imitation cheese in pizza, fondue and blended dips, and cheeseburgers.
Imitation Cheese Competitive Position
Retail prices for imitation and natural cheese, and products they are used
in were collected by the author in twelve states (and Washington, D.C.) where
considerable quantities of imitation cheese is sold. This data was collected in
a personal survey of a random sample of 26 supermarkets in late 1981 and early
1982. States surveyed were: Iowa, Minnesota, Ohio, Illinois, Arizona,
California, Kentucky, Tennessee, New York-New Jersey, Wisconsin, Florida (and
Washington, D.C.).
Imitation cheese, and pizza with imitation cheese, is generally priced
lower at retail, than natural cheese--60% of the time for processed cheese, 80%
of the time for unshredded cheese, 74% of the time for pizza, and 99% of the
time for shredded cheese. However, a substantial variation existed between
states in the proportion of the time that im1tation theese retail prices are
lower than natural cheese prices--56% to 100% of the time for ghredded cheese,
43% to 100% of the time for processed cheese, and 54% to 89% of the time for
pizza.
Retail price variations between states are generally less for natural
cheese than for imitation cheese. As a result, wider variations exist in profit
- 7 -
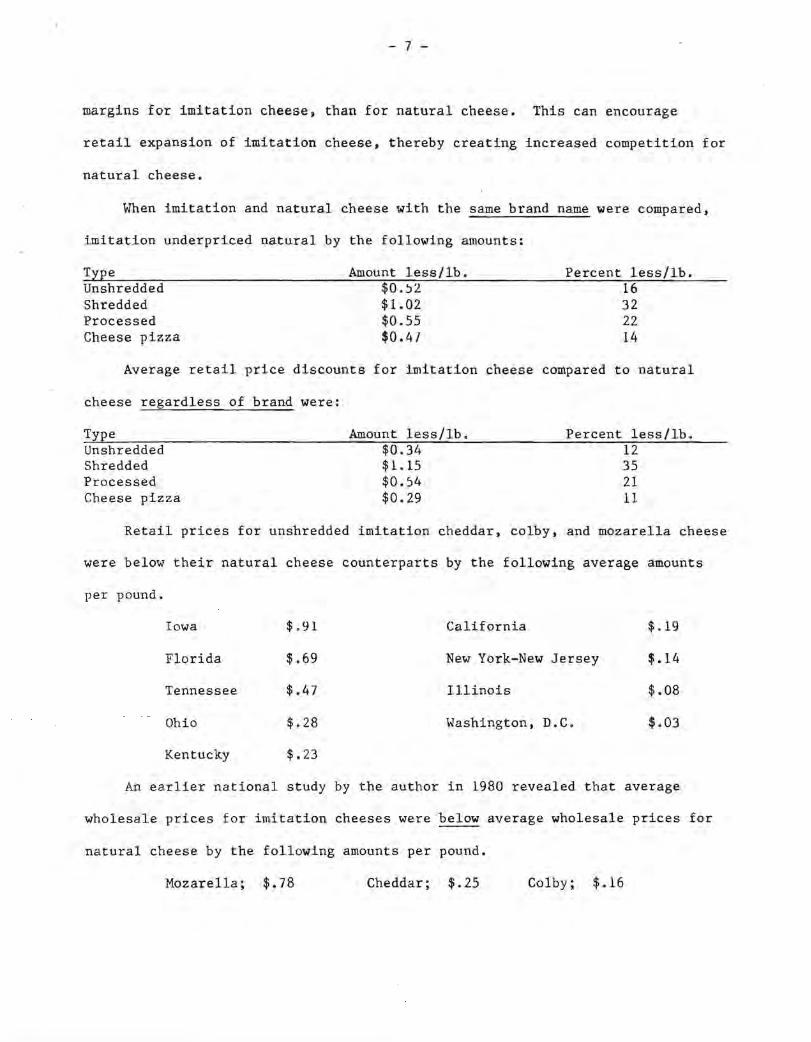
margins for imitation cheese t than for natural cheese. This can encourage
retail expansion of imitation cheese. thereby creating increased competition for
natural cheese.
When imitation and natural cheese with the same brand name were compared,
imitation underpriced natural by the following amounts:
Type Unshredded Shredded Processed Cheese pizza
Amount less/lb. $0.)2 $1.02 $0.55 $0.47
Percent less/lb. 16 32 22 14
Average retail price discounts for imitation cheese compared to natural
cheese regardless of brand were:
Type Unshredded Shredded Processed Cheese pizza
Amount less/lb. $0.34 $1.15 $0.)4 $0.29
Percent less/lb. 12 35 21 11
Retail prices for unshredded imitation cheddar, colby, and mozarella cheese
were below their natural cheese counterparts by the following average amounts
per pound.
Iowa $.91 California $.19
Florida $.69 New York-New Jersey $.14
Tennessee $.47 Illinois $.08
Ohio $.28 Washington, D.C. $.03
Kentucky $.23
An earlier national study by the author in 1980 revealed that average
wholesale prices for imitation cheeses were below average wholesale prices for
natural cheese by the following amounts per pound.
Mozarella; $.78 Cheddar; $.25 C-olby; $.16
- 8 -
Agai n , there was a substantial difference between states. Overall,
however, imitat ion cheese underprices its natural counterpart by a wide margin.
Consumers can buy imitation cheese only if it's on the supermarket shelf.
The aut hor f ound that an average of 16 percent of shredded cheese retail shelf
spa ce was used for imitation cheese. But relatively little shelf space was used
f or packaged imita t ion cheese--1 .6 percent for unshredded and 1.7 percent for
process ed.
The story is completely different for pizza. More than one-half (57
percent ) o f piz za r e t a il shelf space was used for pizza with imitation cheese.
The use of imitation cheese in pizza is substantial .•• and growing.
In the 26 supermarkets surveyed, natural cheese brands outnumbered
imitation cheese brands by an average of 26 to 1 for unshredded cheese, 12 to 1
for processed cheese and 7 t o 1 for shredded cheese. But the situation was
reversed for pizza where brands with imitation cheese outnumbered those with
only natural cheese 18 to 14.
Imi t ation cheese in the 26 supermarkets was manufactured by 17 different
firms. and the imitation cheese pizzas were made by 20 different firms. This
further emphasizes the competitive problem natural cheese faces.
Strategies For Dealing With Imitations
Restrict Casein Imports
Imported casein (milk protein) is a major ingredient of imitation cheese.
Although the U.S. dairy industry has petitioned for import quotas on casein.
none have been imposed. Therefor e , casein can be imported in unlimited
quantities for manufacture into imitation cheese. which in turn competes with
cheese manufactured from domestic milk supplies.
· ,
- 9 -
u.s. import prices for casein used in imitation cheese of approximately
$.945 per pound (April 1985) are only three-eights of the $2.54 per pound price
for domestic nonfat dry milk solids of comparable protein content, used in
natural cheese. (One pound of casein has about three times as much protein as
one pound of nonfat dry milk solids. Therefore, to get a similar protein
quantity, three pounds of nonfat is needed, which at the current support price
of 84 3/4~ per pound equals $2.54.) The 192 million pounds of casein imports in
1984 are equivalent in protein to 577 million pounds of nonfat dry milk--85% of
nonfat dry milk price support purchases by CCC in 1984.
EEC export subsides on casein have been averaging approximately $.95 per
pound. These export subsidies have in turn driven down the world and therefore
u.s. price for casein, contributing to the low price for imitation cheese.
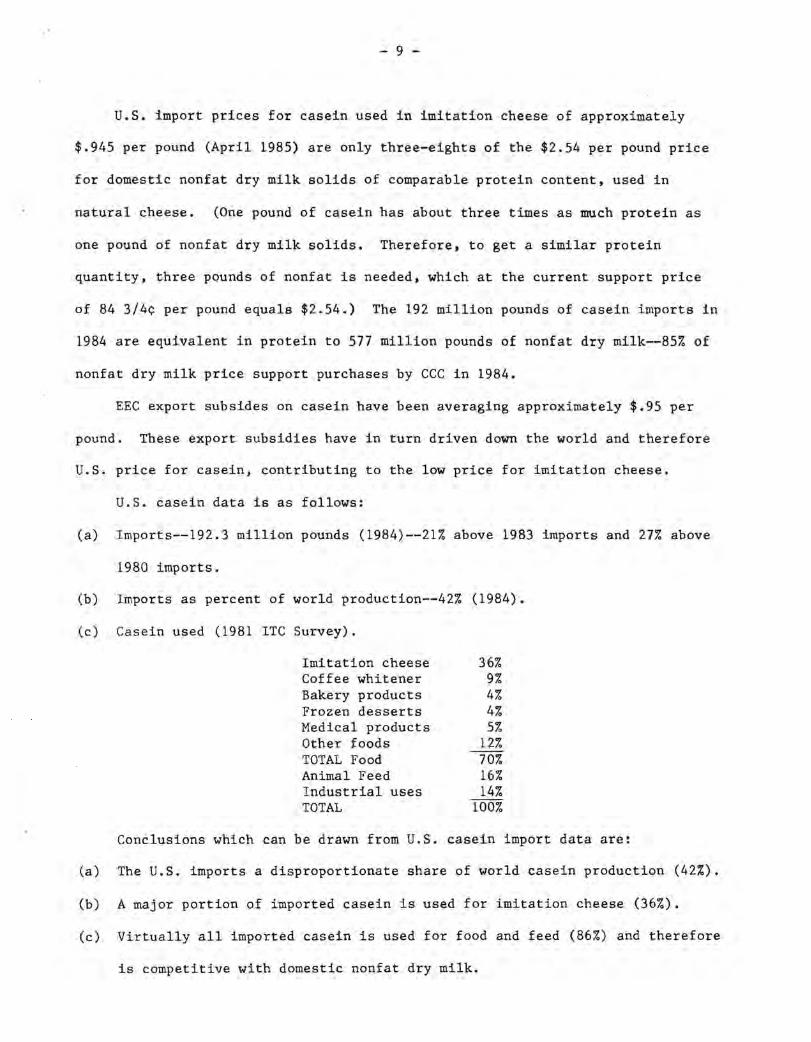
u.s. casein data is as follows:
(a) Imports--192.3 million pounds (1984)--21% above 1983 imports and 27% above
1980 imports.
(b) Imports as percent of world production--42% (1984).
(c) Casein used (1981 ITC Survey).
36% 9% 4% 4% 5%
12% 70% 16% 14%
Imitation cheese Coffee whitener Bakery products Frozen desserts Medical products Other foods TOTAL Food Animal Feed Industrial uses TOTAL 100%
Conclusions which can be drawn from u.S. casein import data are:
(a) The U.S. imports a disproportionate share of world casein production (42%).
(b) A major portion of imported casein is used for imitation cheese (36%).
(c) Virtually all imported casein is used for food and feed (86%) and therefore
is competitive with domestic nonfat dry milk.
- 10 -
(d ) U.S. casein imports are heavily subsidized by foreign exporters thereby
driving the U.S. landed price to only three-eights of the U.s. domestic
price for comparable qualities of milk protein.
Proponents of casein import quotas contend unlimited subsidized casein
imports result in increased production of imitation cheese, thereby increasing
USDA dairy price support purchases. Opponents contend consumer prices for
cheese and dairy products would increase if import quotas were imposed, and
therefore argue for free trade • . Thus far opponents of .casein import quotas have
prevailed through three ITC Hearings, one Congressional Hearing, three ITC and
USDA study reports, and three different Presidential rejections of casein import
quotas (Ford, Carter and Reagan).
Two separate bills have been introduced in the current Congressional
session to limit casein imports to 50% of the average levels ot the past 5
years. For 1985 this would restrict imports to 81 million pounds,---42% of 1984
imports. The 81 million pound limit on casein imports would still be
approximately 50 million pounds more than the quantity of casein used for
industrial products, and 22 million pounds more than the total used for
industrial products plus animal feed. Thus it would primarily limit use of
imported casein in imitation cheese and other food products, where casein is
competitive with dairy products.
The House subcommittee on dairy, livestock, and poultry held a hearing on
these bills on June 5. Realistically however, it is extremely doubtful that
legislation imposing import quotas on casein thereby restricting imports will be
enacted. Based on the three previous Presidential actions it is also doubtful
President Reagan will impose import quotas on casein. However, the
Administration and Congress have both taken a strong stand against EEC export
subsidies on dairy products including casein. If this challenge results in
- 11 -
elimination or even reduction in EEC export subsidies on casein, the price
advantage of imported casein and therefore imitation cheese would be reduced.
Also a further reduction in the U.S. dairy price support level is likely, which
would also reduce the price advantage of imitation cheese compared to natural
cheese.
However, if casein imports are restricted either through import quotas, or
pricing revision, nondairy ingredients such as soy isolates show promise as
substitutes for casein and nonfat dry milk in imitation cheese. Therefore
imitation cheese is likely to continue to be an important factor in the dairy
industry, and the industry must therefore plan its future accordingly.
Labeling and Content Revision
Proponents justify labeling and content revision on the basis (a) consumers
should know what they are buying and (b) food products using imitation dairy
products should also contain some natural dairy products.
With respect to imitation cheese, USDA has formally proposed that frozen
pizzas containing meat and imitation cheese, prominently label the inclusion of
imitation cheese in a type of least one-half the size of the largest type on the
package. USDA also proposed frozen meat pizzas contain at least 12% cheese, of
which at least 6% would have to be natural cheese.
However, USDA received more than ~,OOO comments on the proposal, and it is
uncertain when, or if it will be promulgated. More prominent labeling of
imitation component~like1y stands a better chance of surviving legal
challenges, than does mandatory minimum natural dairy product content
requirements, unless the minimums can be justified on a nutrition and health
basis.
Butterb1end Products
As previously indicated per capita consumption of butter declined 5.7
pounds since 1950, compared to an increase of 4.9 pounds for margarine.
- 12 -
Butterblend products which are part margarine and part butter offer an
opportunity for reversing this trend. Based on research by the author,
but terblend has resulted in an overall increase in butterfat sales. This is
because the product is more competitive with margarine, than with all but the
lower grades of butter.
The chief selling point to the consumer seems to be price. Retail prices
in the Midwest have been averaging approximately $1.45 per pound of butterblend,
compared with $1 for corn-oil margarine, and $1.90 for butter. At these prices,
the butter used in butterblend becomes more competitive with margarine than when
it is sold as butter.
Butterblend offers the dairy industry a chance to recapture some butterfat
sales, whether price or cholesterol lost them to begin with. For example, one
major dairy projects annual sales of 50 million pounds of butterblend, of which
20 million pounds will be butter.
Since there appears to be little likelihood of ever recapturing anything
close to butter sales of the 1940s or even the 1950s, the industry should give
serious consideration to a vigorous campaign to sell butterblend.
Research indicates approximately one-twelfth of consumers now use butter/
margarine blends away from home, and one-fifth of consumers use butter/margarine
blends at home. Heaviest use is at dinner, with breakfast and lunch use almost
identical,--and only slightly less than at dinner.
Butterblends therefore offer a distinct possibility for dealing with the
imitation problem.
Increased Promotion
The current national program of promotion, research and nutrition education
is financed by a mandatory assessment of 15 cents per hundredweight on all milk
marketed commercially in the 48 contiguous States until October 1, 1985.
- 13 -
Current estimates project a total annual income of about $197 million from this
15-cent assessment. The National Dairy Promotoion and Research Board (NDPRB)
is projected to receive approximately $87 million of this, while state and
regional programs will retain the remaining funds--approximately $110 million
for dairy promotional activities ($197 million - $87 million = $110 million).
Generic promotion programs in place when the legislation was passed spent
approximately $96 million annually. The impact of this legislation is to add
approximately $101 million annually to dairy promotion efforts ($197 million -
$96 million = $101 million).
Combatting imitations should have high priority in allocating these
promotional expenditures. Promotional considerations to combat dairy imitations
include:
1. Increased cheese promotion could be stressed in light of its relatively low
promotion expenditures compared to fluid milk, more favorably demand for
cheese than for most other dairy products, and tremendous growth and
competition of imitation cheese. Increased cheese promotion funding would
also permit targeting cheese ads to "local" cheese preferences, and also
permit greater emphasis on advertising specialty cheeses. Now most
emphasis is on hard cheese.
Research indicates that a given investment in cheese promotion
consistenly will generate a sales response about three times larger than a
similar investment in fluid milk promotion.ll
2. Future butter promotion funding allocations should be correlated with
1/
margarine's response to the increased butter promotion resulting from the
"Increasing Returns to Dairy Farmers by Generic Promotion of Milk and Dairy Products; The Issue of Which Products to Promote," Department of Agricultural Economics, The Ohio State University, ESO 1162, April, 1985.
- 14 -
national checkoff. If margarine promotion is stepped up substantially,
further increases in butter promotion should be given serious
consideration.
3. Consideration should be given to major promotion programs for ice cream and
fluid cream. This recommendation is made because ot substantial increases
in per capita consumption of both products, and the vigorous competition
from imitations. Increases usage of heavy cream, sour cream, whipping
cream, and salad dressing has resulted from the increasing popularity of
gourmet dining, away from horne dining, and use of creams in cooking.
Popularity, of high fat "premium" ice cream in turn has resulted in
increased usage of both ice cream and butterfat. Capitalizing on these
trends can help in dealing with competitive imitation products.
4. The dairy industry will likely find it to its advantage to have national
budget promotion funding decisions coordinated with local and regional
groups decisions, rather than each group going its own separate way. This
approach would give the dairy industry greater leverage in attempting to
maintain a fair allocation of advertising funds for cheese and other
manufactured dairy products particularly susceptible to competition from
imitation products. Also, this procedure could permit the national budget
to "fill in the gaps," from local funding, thereby more effectively
combatting imitations, rather than attempting to have widely diverse local
groups get together to fill in promotion gaps of national funding.
One total promotion strategy will be needed for the long term, if promotion
effectiveness in dealing with imitations is to be maximized. Divorcing NDPRB
promotion funding from local and regional funding sacrifices coordinated
promotional activities of approximately $85 million annually by NDPRB, and $112
million annually by State and Regional organizations; This would be very
counterproductive in competing with imitations.
· ~
- 15 -
Continued coordination of dairy promotional activities of NDPRB, and State
and Regional organizations, is essential to derive maximum return on the $197
million annually currently being deducted from farmers milk checks, for dairy
promotion in combatting imitation dairy products.
Summary
People are eating more fat than ever--an increase of 14.5 pounds (32%) per
person since 1960. However, per capita consumption of annual fat dropped 6.2
pounds (34%) while vegetable fat consumption increased 20.7 pounds (77%). This
shift in consumption from milk fat to vegetable fat contributed to milk fat
surpluses, downward price pressures, and is a continuing problem for the dairy
industry.
The most important imitation problem for the dairy industry is imitation
cheese. The 205 plus million pounds of imitation cheese production is 44% of
1984 USDA price support purchases of cheese. Import prices for casein used in
imitation cheese are only three-eights the price of domestic nonfat milk solids
of comparable protein content, used in natural cheese.
The $.52 to $1.02 (16%-32%) lower average retail price per pound for
imitation cheese than natural cheese of the same brand, and $.47 per pound (14%)
lower price for pizza with imitation cheese than pizza with natural cheese of
the same brand, indicates vigorous across-the-board competition by imitation
cheese. Pizza with imitation cheese has already claimed over one-half (57%) of
the shelf space in the supermarkets in the twelve major states (and Washington,
D.C.) surveyed. It also has 16% of the shredded cheese shelf space, and about
2% of the unshredded and process cheese shelf space.
Pizza brands with imitation cheese outnumbered pizza brands, with only
natural cheese 18 to 14. Natural brands of unshredded, process, and shredded
cheese outnumbered imitation brands.
- 16 -
Imitation cheese in the 26 supermarkets surveyed was manufactured by 17
different firms, and pizza with imitation cheese was manufactured by twenty
different firms. Thus, a wide variety of companies are manufacturing imitation
cheese. and pizza with imitation cheese.
Imitation cheese therefore impacts substantially on the dairy industry.
Imitation cheese is likely to continue to be an important factor in the dairy
industry. and the industry must plan its future accordingly.
Alternative strategies for dealing with imitation dairy products include:
(a) Reducing casein imports. However if casein imports are restricted,
nondairy ingredients such as soy isolates show promise as substitutes for
casein and nonfat dry milk in imitation cheese. Therefore, working to
reduce or terminate EEC export subsidies which are driving import prices
down to three-eights of domestic nonfat dry milk prices will likely be more
helpful in reducing or eliminating the competitive price advantage
imitation cheese has over natural cheese.
(b) Clearer and more prominent labeling of imitation dairy products, so
consumers know what they are buying.
(c) Greater emphasis on butterblend products which compete better price wise
with imitation products, than do natural dairy products.
(d) Increased allocation of promotion funds from the $197 million annually now
available from farmer checkoffs, .to products such as cheese. cream, and ice
cream, which are particularly vulnerable to imitations. Increased
promotion of cheese in particular is very important because of the intense
competition from imitation cheese, coupled with the fact that the sales
response from cheese promotion is about three times larger than the sales
response from a similar investment in fluid milk promotion.