Embed Size (px)
Citation preview
44 • January 2013 • Technical Analysis of StockS & commoditieS
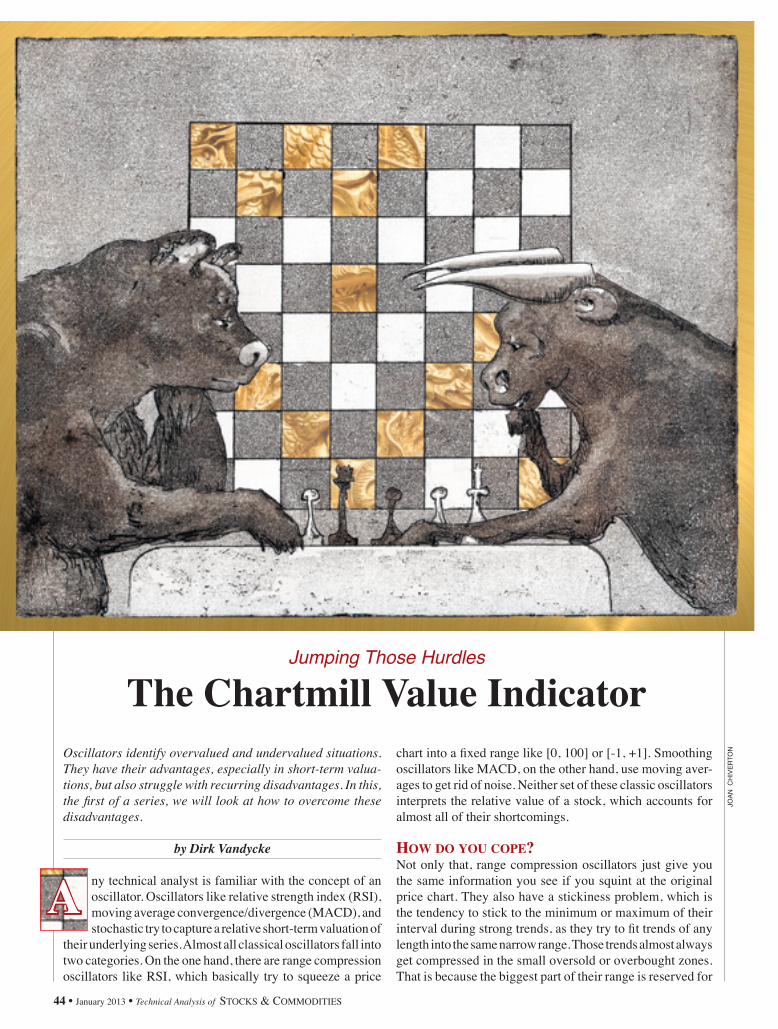
Oscillators identify overvalued and undervalued situations. They have their advantages, especially in short-term valua-tions, but also struggle with recurring disadvantages. In this, the first of a series, we will look at how to overcome these disadvantages.
by Dirk Vandycke
ny technical analyst is familiar with the concept of an oscillator. Oscillators like relative strength index (RSI), moving average convergence/divergence (MACD), and stochastic try to capture a relative short-term valuation of
their underlying series. Almost all classical oscillators fall into two categories. On the one hand, there are range compression oscillators like RSI, which basically try to squeeze a price
Jumping Those Hurdles
The Chartmill Value Indicator chart into a fixed range like [0, 100] or [‑1, +1]. Smoothing oscillators like MACD, on the other hand, use moving aver-ages to get rid of noise. Neither set of these classic oscillators interprets the relative value of a stock, which accounts for almost all of their shortcomings.
How do you cope?Not only that, range compression oscillators just give you the same information you see if you squint at the original price chart. They also have a stickiness problem, which is the tendency to stick to the minimum or maximum of their interval during strong trends, as they try to fit trends of any length into the same narrow range. Those trends almost always get compressed in the small oversold or overbought zones. That is because the biggest part of their range is reserved for
A
JOAN
CH
IVER
TON
January 2013 • Technical Analysis of StockS & commoditieS • 45
short-term reactions to price. This gives extended overbought or oversold signals with the trend just marching on, making those signals useless. Smoothing oscillators on their part have the same lagging problems as moving averages, the primary components on which they are built.
To make things even worse, they all need parameters, which leaves them open to a lot of subjectivity in their usage and interpretation. This puts traders who are backtesting these oscillators in harm’s way, as they might fall victim to curve-fitting. This lack of transparency can be seen in the numerous ways they are used, while in fact they are often nothing more than a small, distorted version of the original price chart.
This leaves us with the question: Can we cope with the lag, stickiness, and subjectivity to come up with a better oscillator? Yes. The solution to this problem of building such an oscillator lies in the statistics of what short-term value is.
Universal valUeValue and its relation to price is a matter of future price gain. Prices will result from what other people do after our order gets filled. A transaction is an agreement over current prices as well as a disagreement over future ones. Or as investor Warren Buffett
said, price is what you pay, value is what you get. So value will be determined by future transactions. As such, it can’t be known the moment we put in our order. As the position starts showing us a profit or a loss, value or the lack of it will become clear.
Long-term value may be estimated by fundamental analysis, but short-term value depends mostly on the perception of those watching the most recent price action. This mainly concerns those who just had their orders filled or are on the verge of placing them. The perception of value and resulting consensus comes from making a comparison. On a chart, previous prices are the closest thing with which to do so.
So any good oscillator without these drawbacks should be built on the premise that market participants will change their minds about a given tradable as prices change. If the price keeps going up, that will make people believe that a drop in the price will be inevitable.
Suppose a stock price increased, and after that, prices stayed the same for a while, keeping the same range. Should the oscillator maintain its level?
Many existing oscillators do this, which may explain their stickiness. The longer that prices stay at the higher level, the more likely that perception of value shifts because people get used to the higher price. Say a stock goes from $9 to $10 from one period to the next. As its price rises, a good oscillator should peak. But if price stays at $10, the oscillator should start to drop because $10 becomes the consensus, rather than a higher price.
Don’t forget, we’re talking short term here: a few days, tops. But as it will become clear, it is on such shorter time frames that you will be able to find good entries to hop on board a trend of a longer time frame.
Meet the indicatorThe idea behind this oscillator is to measure short-term con-sensus about price in order to put price changes in perspective. This idea can be implemented with the help of a statistical procedure called a normalization process used to obtain a standardized distribution.
There are several reasons why such a procedure would fit this purpose. First of all, absolute prices don’t mean a thing. We have to look at their relation to recent prices. Second, dif-ferent markets have different volatility. A price change of $1 implies more volatility in the case of a $5 stock than it does with a $50 stock. Further, price series on financial markets don’t show a normal distribution. So you need to look for a normally distributed characteristic if you want to use statistical analysis. Last but not least, your valuation model must behave as an oscillator but without the lag, stickiness, and subjectivity in its definition and interpretation.
Here’s how a statistical normalization process works. First, you establish an x-day consensus as the x-period mov-ing average of the median of each period — that is, (high + low)/2. You don’t want to stretch x more than a few periods. Next, the OHLC data is set off against the x-day consensus line. This is done by subtracting the consensus value from the open, high, low, and close, giving you a new open, high, low, and close with the same relative position but around a straight zero consensus line.
A transaction is an agreement over current prices. Or as investor Warren Buffett said, price is what you pay, value is what you get.
INDICATORS
If you are knowledgeable about technical indicators, charting, trading systems, money management, intraday trading, trading psychology, options, cycles...and more... we’d like to hear from you!
See http://www.traders.com/index.php/contact-us/editorial-departmentfor more information.
You read our publications. Now
write for them, too!
46 • January 2013 • Technical Analysis of StockS & commoditieS
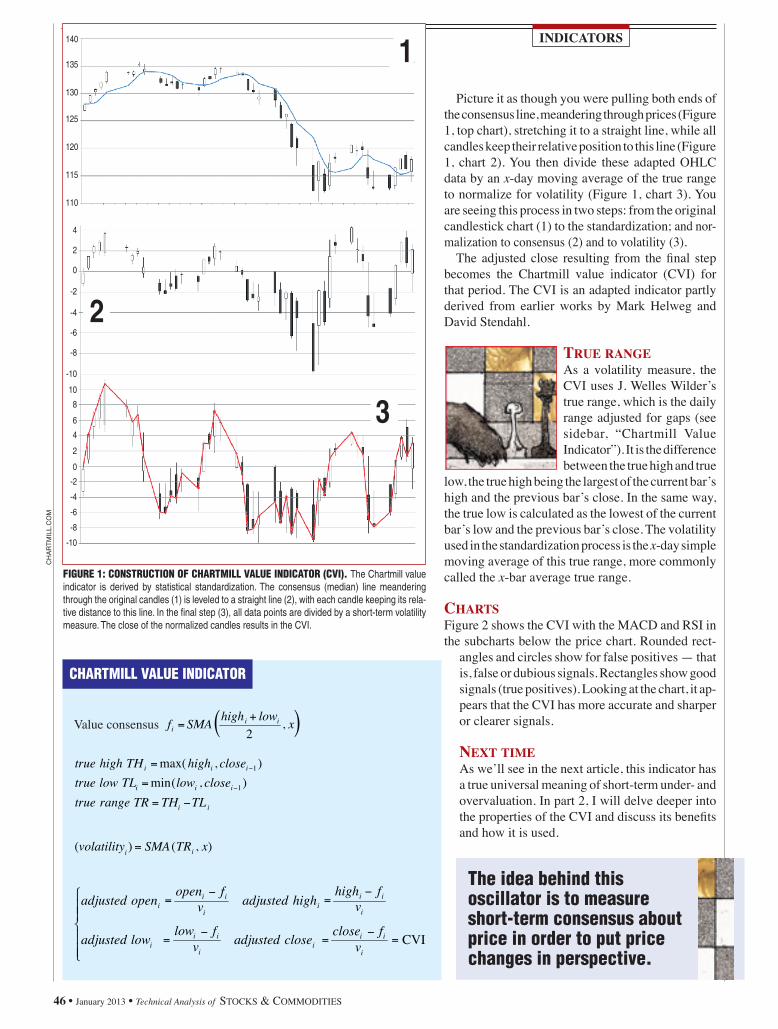
Picture it as though you were pulling both ends of the consensus line, meandering through prices (Figure 1, top chart), stretching it to a straight line, while all candles keep their relative position to this line (Figure 1, chart 2). You then divide these adapted OHLC data by an x-day moving average of the true range to normalize for volatility (Figure 1, chart 3). You are seeing this process in two steps: from the original candlestick chart (1) to the standardization; and nor-malization to consensus (2) and to volatility (3).
The adjusted close resulting from the final step becomes the Chartmill value indicator (CVI) for that period. The CVI is an adapted indicator partly derived from earlier works by Mark Helweg and David Stendahl.
True rangeAs a volatility measure, the CVI uses J. Welles Wilder’s true range, which is the daily range adjusted for gaps (see sidebar, “Chartmill Value Indicator”). It is the difference between the true high and true
low, the true high being the largest of the current bar’s high and the previous bar’s close. In the same way, the true low is calculated as the lowest of the current bar’s low and the previous bar’s close. The volatility used in the standardization process is the x-day simple moving average of this true range, more commonly called the x-bar average true range.
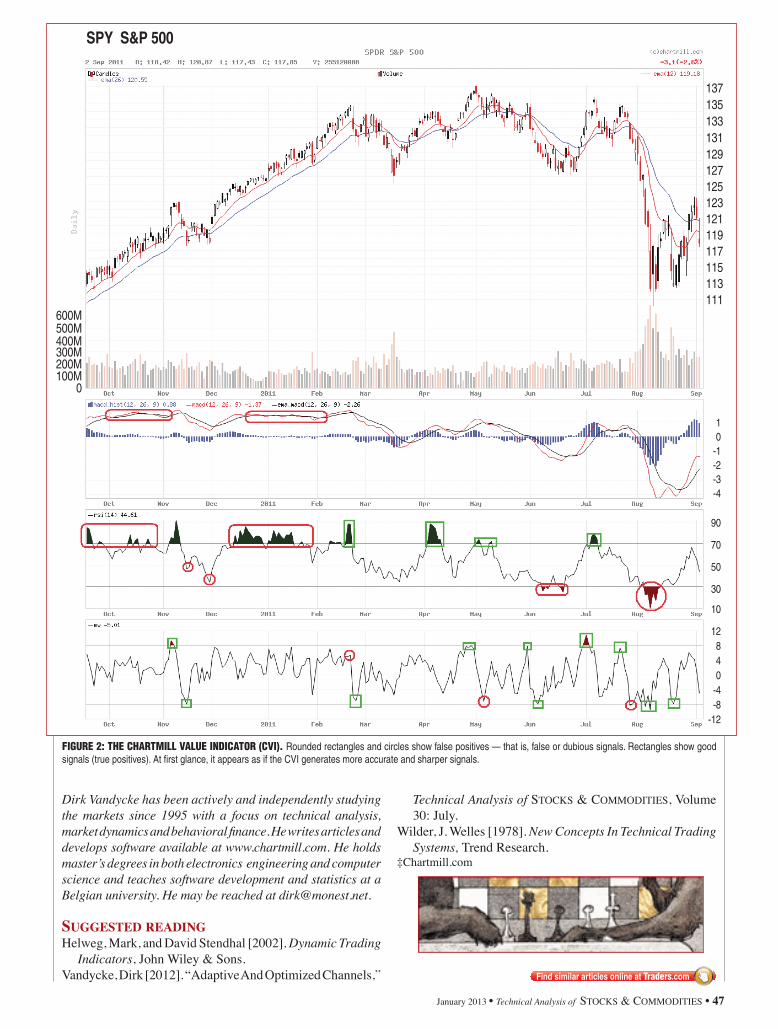
CharTsFigure 2 shows the CVI with the MACD and RSI in the subcharts below the price chart. Rounded rect-
angles and circles show for false positives — that is, false or dubious signals. Rectangles show good signals (true positives). Looking at the chart, it ap-pears that the CVI has more accurate and sharper or clearer signals.
nexT TimeAs we’ll see in the next article, this indicator has a true universal meaning of short-term under- and overvaluation. In part 2, I will delve deeper into the properties of the CVI and discuss its benefits and how it is used.
140
135
130
125
120
115
110
4
2
0
-2
-4
-6
-8
-10
10
8
6
4
2
0
-2
-4
-6
-8
-10
2
3
1
Figure 1: CONSTruCTiON OF CHArTMiLL VALue iNDiCATOr (CVi). The Chartmill value indicator is derived by statistical standardization. The consensus (median) line meandering through the original candles (1) is leveled to a straight line (2), with each candle keeping its rela-tive distance to this line. In the final step (3), all data points are divided by a short-term volatility measure. The close of the normalized candles results in the CVI.
CH
ARTM
ILL.
CO
MINDICATORS
CHArTMiLL VALue iNDiCATOr
,2 )( xlowhighSMAf ii
i+
=
ii
iii
iii
TLTHTRrangetruecloselowTLlowtrue
closehighTHhightrue
−=
=
=
−
−
),min(),max(
1
1
),( xTRSMA(volatilityi ) i
⎪⎪⎩
⎪⎪⎨
⎧
CVIvfclosecloseadjustedv
flowlowadjusted
vfhigh
highadjustedvfopen
openadjusted
i
iii
i
iii
i
iii
i
iii
=
=
=
=
= =−
− −
−
Value consensus
The idea behind this oscillator is to measure short-term consensus about price in order to put price changes in perspective.
January 2013 • Technical Analysis of StockS & commoditieS • 47
Dirk Vandycke has been actively and independently studying the markets since 1995 with a focus on technical analysis, market dynamics and behavioral finance. He writes articles and develops software available at www.chartmill.com. He holds master’s degrees in both electronics engineering and computer science and teaches software development and statistics at a Belgian university. He may be reached at [email protected].
SuggeSted readingHelweg, Mark, and David Stendhal [2002]. Dynamic Trading
Indicators, John Wiley & Sons.Vandycke, Dirk [2012]. “Adaptive And Optimized Channels,”
137135133131129127125123121119117115113111
10
-1-2-3-4
90
70
50
30
10
12840
-4-8
-12
SPY S&P 500
600M500M400M300M200M100M
0
Figure 2: the chartmill value indicator (cvi). Rounded rectangles and circles show false positives — that is, false or dubious signals. Rectangles show good signals (true positives). At first glance, it appears as if the CVI generates more accurate and sharper signals.
Technical Analysis of StockS & commoditieS, Volume 30: July.
Wilder, J. Welles [1978]. New Concepts In Technical Trading Systems, Trend Research.
‡Chartmill.com
36 • February 2013 • Technical Analysis of StockS & commoditieS
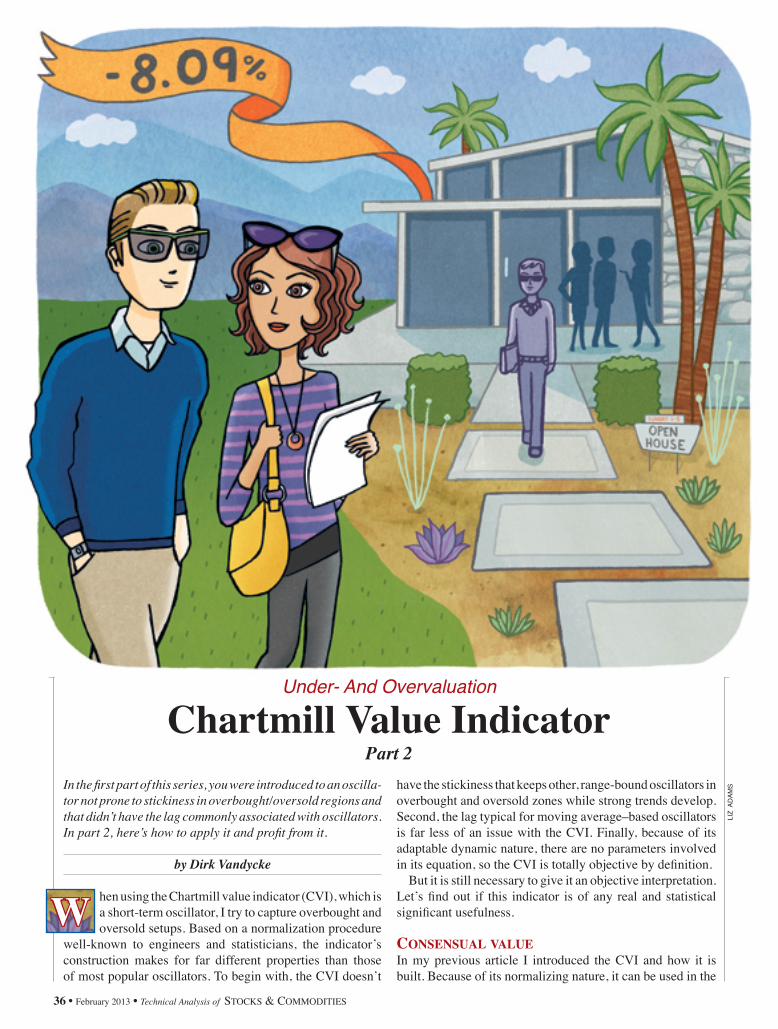
In the first part of this series, you were introduced to an oscilla-tor not prone to stickiness in overbought/oversold regions and that didn’t have the lag commonly associated with oscillators. In part 2, here’s how to apply it and profit from it.
by Dirk Vandycke
hen using the Chartmill value indicator (CVI), which is a short-term oscillator, I try to capture overbought and oversold setups. Based on a normalization procedure
well-known to engineers and statisticians, the indicator’s construction makes for far different properties than those of most popular oscillators. To begin with, the CVI doesn’t
Under- And Overvaluation
Chartmill Value IndicatorPart 2
have the stickiness that keeps other, range-bound oscillators in overbought and oversold zones while strong trends develop. Second, the lag typical for moving average–based oscillators is far less of an issue with the CVI. Finally, because of its adaptable dynamic nature, there are no parameters involved in its equation, so the CVI is totally objective by definition.
But it is still necessary to give it an objective interpretation. Let’s find out if this indicator is of any real and statistical significant usefulness.
Consensual valueIn my previous article I introduced the CVI and how it is built. Because of its normalizing nature, it can be used in the
W
LIZ
AD
AMS
February 2013 • Technical Analysis of StockS & commoditieS • 37
costs that will put you in the red at the beginning. If you can visualize that, it shouldn’t be too difficult to imagine such a trade getting stopped out before it materializes.
Now, wouldn’t it be cool if you could tip this in your favor? You can do this by focusing on short-term value consensus, looking for entries at a short-term price extreme.
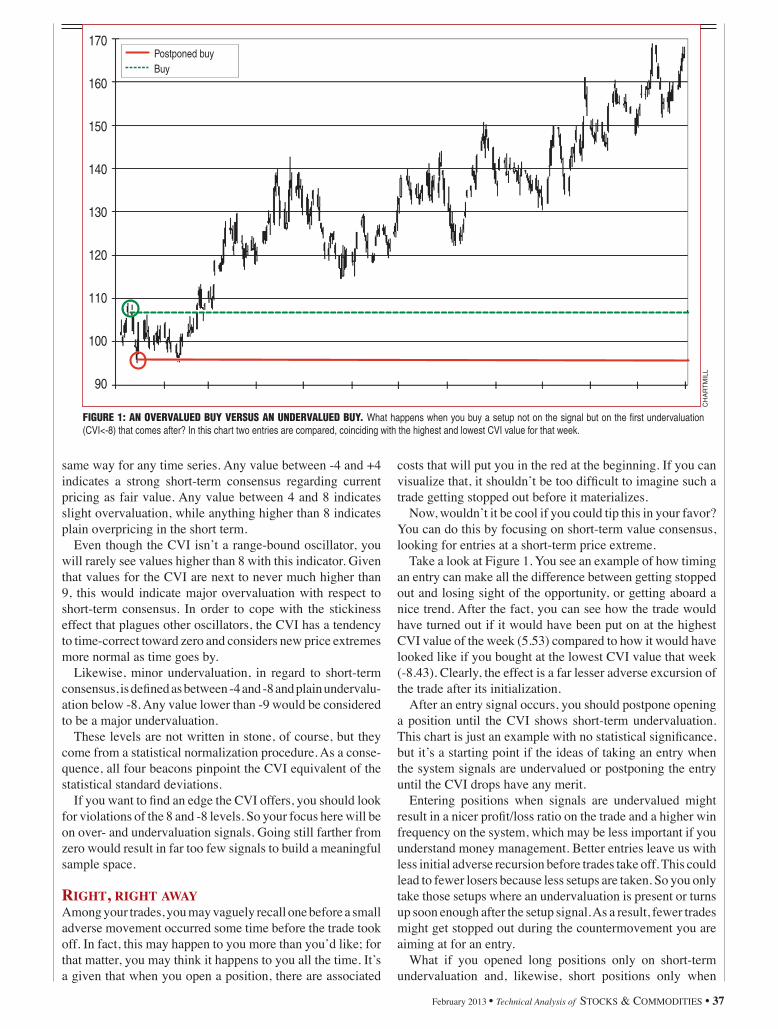
Take a look at Figure 1. You see an example of how timing an entry can make all the difference between getting stopped out and losing sight of the opportunity, or getting aboard a nice trend. After the fact, you can see how the trade would have turned out if it would have been put on at the highest CVI value of the week (5.53) compared to how it would have looked like if you bought at the lowest CVI value that week (-8.43). Clearly, the effect is a far lesser adverse excursion of the trade after its initialization.
After an entry signal occurs, you should postpone opening a position until the CVI shows short-term undervaluation. This chart is just an example with no statistical significance, but it’s a starting point if the ideas of taking an entry when the system signals are undervalued or postponing the entry until the CVI drops have any merit.
Entering positions when signals are undervalued might result in a nicer profit/loss ratio on the trade and a higher win frequency on the system, which may be less important if you understand money management. Better entries leave us with less initial adverse recursion before trades take off. This could lead to fewer losers because less setups are taken. So you only take those setups where an undervaluation is present or turns up soon enough after the setup signal. As a result, fewer trades might get stopped out during the countermovement you are aiming at for an entry.
What if you opened long positions only on short-term undervaluation and, likewise, short positions only when
same way for any time series. Any value between -4 and +4 indicates a strong short-term consensus regarding current pricing as fair value. Any value between 4 and 8 indicates slight overvaluation, while anything higher than 8 indicates plain overpricing in the short term.
Even though the CVI isn’t a range-bound oscillator, you will rarely see values higher than 8 with this indicator. Given that values for the CVI are next to never much higher than 9, this would indicate major overvaluation with respect to short-term consensus. In order to cope with the stickiness effect that plagues other oscillators, the CVI has a tendency to time-correct toward zero and considers new price extremes more normal as time goes by.
Likewise, minor undervaluation, in regard to short-term consensus, is defined as between -4 and -8 and plain undervalu-ation below -8. Any value lower than -9 would be considered to be a major undervaluation.
These levels are not written in stone, of course, but they come from a statistical normalization procedure. As a conse-quence, all four beacons pinpoint the CVI equivalent of the statistical standard deviations.
If you want to find an edge the CVI offers, you should look for violations of the 8 and -8 levels. So your focus here will be on over- and undervaluation signals. Going still farther from zero would result in far too few signals to build a meaningful sample space.
Right, Right awayAmong your trades, you may vaguely recall one before a small adverse movement occurred some time before the trade took off. In fact, this may happen to you more than you’d like; for that matter, you may think it happens to you all the time. It’s a given that when you open a position, there are associated
CH
ARTM
ILL
Figure 1: An overvAlued buy versus An undervAlued buy. What happens when you buy a setup not on the signal but on the first undervaluation (CVI<-8) that comes after? In this chart two entries are compared, coinciding with the highest and lowest CVI value for that week.
170
160
150
140
130
120
110
100
90
Postponed buyBuy
38 • February 2013 • Technical Analysis of StockS & commoditieS
short-term consensus of value is over-rated? Here’s where the CVI can come to the rescue.
To test for possible added value of the CVI, I pulled out my simulator and looked at random entries where the CVI went below -8 within the next week (the CVI is a short-term value in-dicator, remember). Note those setups where the CVI doesn’t reach -8 in the five days after the random date pick are not considered for a possible entry. That is looking forward! At this point, you don’t want to prove you have a better system with the CVI constraint added: at least, not yet.
For the moment, you only want to see what happens to the average initial adverse recursion of trades when you wait for undervaluation or, if that doesn’t happen, not take the trades at all.
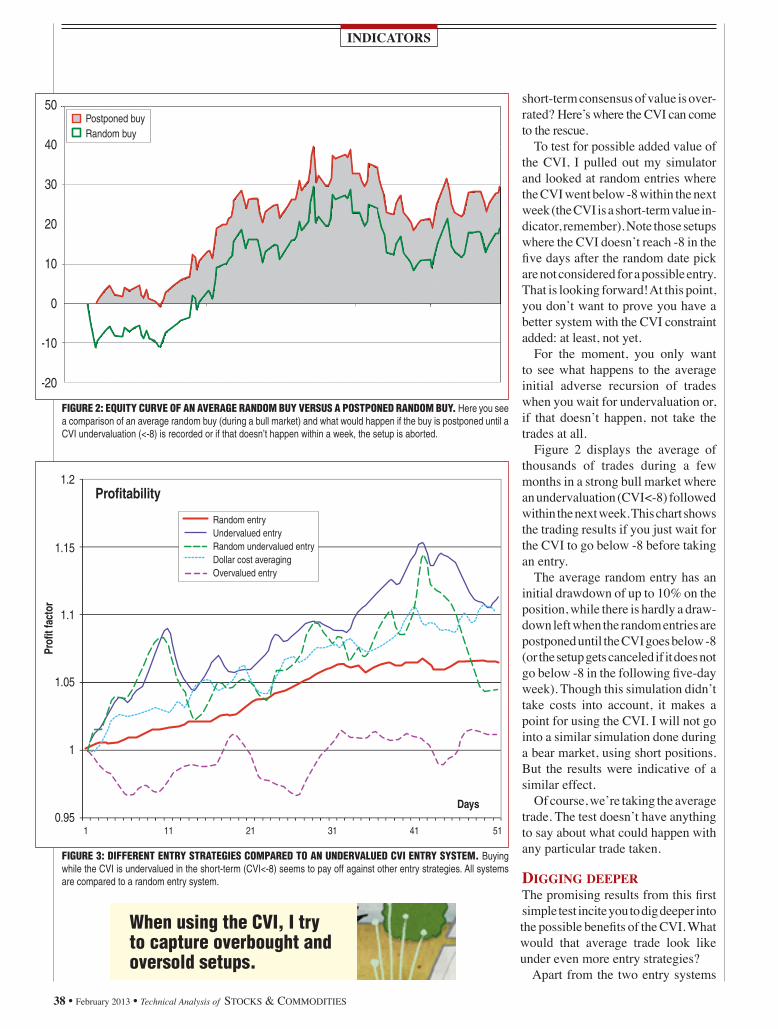
Figure 2 displays the average of thousands of trades during a few months in a strong bull market where an undervaluation (CVI<-8) followed within the next week. This chart shows the trading results if you just wait for the CVI to go below -8 before taking an entry.
The average random entry has an initial drawdown of up to 10% on the position, while there is hardly a draw-down left when the random entries are postponed until the CVI goes below -8 (or the setup gets canceled if it does not go below ‑8 in the following five‑day week). Though this simulation didn’t take costs into account, it makes a point for using the CVI. I will not go into a similar simulation done during a bear market, using short positions. But the results were indicative of a similar effect.
Of course, we’re taking the average trade. The test doesn’t have anything to say about what could happen with any particular trade taken.
Digging DeeperThe promising results from this first simple test incite you to dig deeper into the possible benefits of the CVI. What would that average trade look like under even more entry strategies?
Apart from the two entry systems
Figure 2: equity curve oF an average random buy versus a postponed random buy. Here you see a comparison of an average random buy (during a bull market) and what would happen if the buy is postponed until a CVI undervaluation (<-8) is recorded or if that doesn’t happen within a week, the setup is aborted.
Figure 3: diFFerent entry strategies compared to an undervalued cvi entry system. Buying while the CVI is undervalued in the short-term (CVI<-8) seems to pay off against other entry strategies. All systems are compared to a random entry system.
INDICATORS
When using the cvi, i try to capture overbought and oversold setups.
50
40
30
20
10
0
-10
-20
Postponed buyRandom buy
1 11 21 31 41 51
Profitability
Prof
it fa
ctor
Days
1.2
1.15
1.1
1.05
1
0.95
Random entryUndervalued entry Random undervalued entryDollar cost averagingOvervalued entry
1 11 21 31 41 51
Profitability
Prof
it fa
ctor
Days
1.2
1.15
1.1
1.05
1
0.95
Random entryUndervalued entry Random undervalued entryDollar cost averagingOvervalued entry
February 2013 • Technical Analysis of StockS & commoditieS • 39
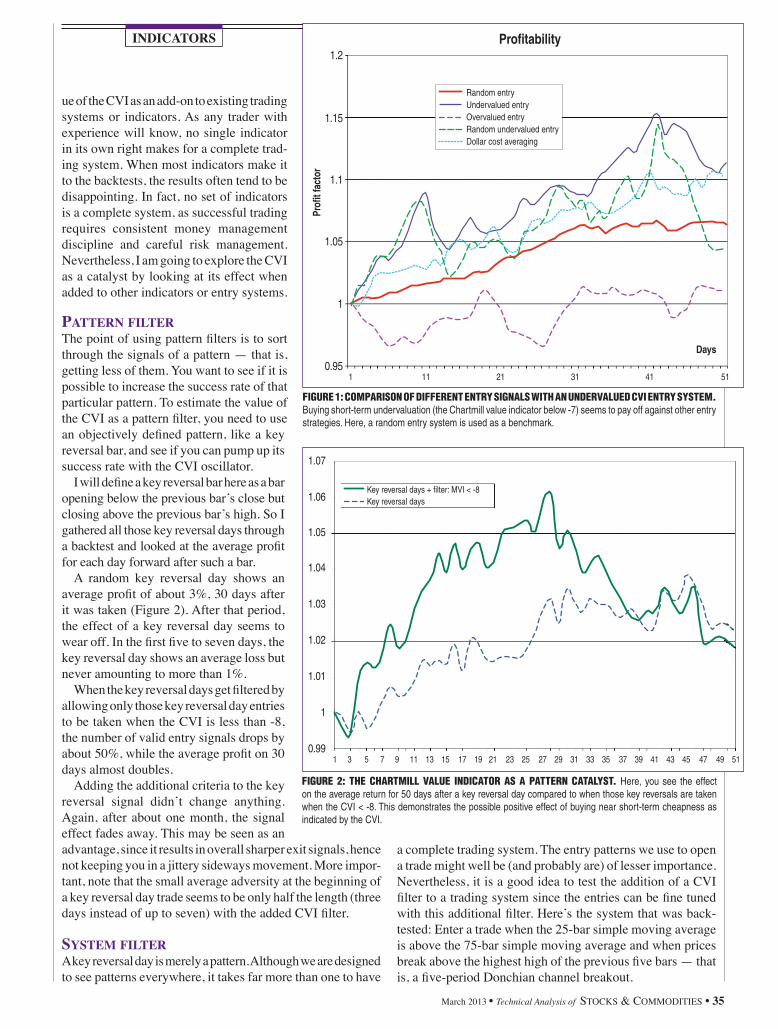
already compared (random entry and random entry when undervalued), I added three more entry strategies to the mix. One was to take entries that weren’t random but instead on every undervaluation. I also went to the other extreme and looked at entries each time they were overvalued (to see what would happen if I only accepted entries in the presence of short-term overvaluation).
Next, I took dollar cost averaging and bought on the first day of each month. At the end I compared five strategies and ran the tests in a pure bull market. I compared all strategies on a 50-day basis after each entry. You can see the results in Figure 3. The entry systems had, on average, the following CVI value on entry:
Random entry -0.01Undervalued -7.70Overvalued 7.53Dollar cost averaging -0.84Undervalued random entry -8.09
As a bull market, the test period doesn’t seem to help the overvalued entry system, which is barely able to make money with several large periods in the red zone. The dollar cost averaging entry system performs a lot better, even better than the random entry system. This is expected since, theoretically, you could benefit from buying more shares at lower prices and fewer shares at higher prices. The best-performing system is, as hoped, the entry system buying only on undervaluation. It performs best over almost the entire period.
Combining undervaluation with random entry seems to improve the random entry system. However, the equity curve becomes more volatile, which could be the reason for the big performance drop at the end compared to that of the random entry.
The overall conclusion might be that buying on undervalu-ation, as indicated by the Chartmill value indicator, results in a better overall performance, perhaps a higher win frequency and, at worst, far less time of the trade initially being spent in red territory.
ConClusionIf time is money, it should be extended to the concept of timing is money. There is evidence supporting the idea that the Chartmill value indicator has discernible added value in measuring any short-term valuation consensus. Much more important is its ability to act as a valuable system add-on, catalyzing a lower frequency of losers by lowering the overall frequency of trades and dumping the ones with a poor profit/loss ratio.
That a possible initial drawdown on trades can be kept smaller will translate to fewer positions getting stopped out because of initial adverse recursion. In the next and final part of this series of articles, I will discuss the effect of the CVI as a possible trade system enhancer, taking only the under-valued setups.
Dirk Vandycke has been actively and independently studying
the markets since 1995 with a focus on technical analysis, market dynamics, and behavioral finance. He writes articles and develops software partly available at www.chartmill.com. He holds master’s degrees in both electronics engineering and computer science and teaches software development and statistics at a Belgian university. He may be reached at [email protected]. The CVI is freely available on charts and in scanners at www.chartmill.com.
suggested readingHelweg, Mark, and David Stendhal [2002]. Dynamic Trading
Indicators, John Wiley & Sons.Vandycke, Dirk [2013]. “The Chartmill Value Indicator,”
Technical Analysis of StockS & commoditieS, Volume 31: January.
_____ [2012]. “Adaptive And Optimized Channels,” Technical Analysis of StockS & commoditieS, Volume 30: July.
Wilder, J. Welles [1978]. New Concepts In Technical Trading Systems, Trend Research.
‡Chartmill
†See Traders’ Glossary for definition‡See Editorial Resource Index
Thank you for voting
NeuroShell Trader #1Artificial Intelligence Software
10 yeArS In A row!
Just announced ChaosHunter Trader
ChaosHunter.com
NeuroShell.com 301.662.7950
®
VERSION 1
34 • March 2013 • Technical Analysis of StockS & commoditieS
objective in its definition and hence is ideal for algo‑rithmic implementation in software.
Hence, it becomes nec‑essary to have an objec‑tive interpretation of the CVI. In this article, you will find out if the CVI has any real and statistically significant usefulness.
RecapThe CVI going below ‑8 (two standard deviations) is considered oversold or short‑term undervalued, while having it above +8 would be overbought and short‑term overvalued. If necessary, you can con‑sider smaller intervals to increase the number of samples like [‑7, +7], as [‑8, +8] might give too few signals while backtesting. In addition, the interval used doesn’t have to be symmetrical. In a bull mar‑ket, you could consider anything below ‑6 already oversold. But the indicator seems to perform well us‑ing [‑8, +8]. The changes in the interval are merely to drive up sample size in backtests and generate more signals.
In my previous article, I showed that selling while an indicator is overvalued may help a short trade. Likewise, long trades can be more successful when you enter the trade when the CVI is undervalued. Look at Figure 1. Pure entry systems (that is, nontechnical entries) are compared during a bull market. Clearly, the entry system based on entries on undervaluation, as mea‑sured with the CVI, seems to make a difference.
This illustrates the val‑
Enhancing And Nonenhancing
The Chartmill Value Indicator
Part 3
In the final article of this series, you’ll find more ways to apply the Chartmill value indicator and determine if it enhances the indicators you already use.
by Dirk Vandycke
Chartmill value indicator (CVI) is a short‑term oscillator which, like dozens of other oscillators, tries to capture overbought and oversold situations. Because it is created using a statistical normalization procedure, it is unlike most other well‑known oscillators. For
one, it doesn’t suffer from the stickiness that keeps other range‑bound oscillators in overbought and oversold zones while a strong trend is developing. Second, the CVI copes nicely with the lag that moving average–based oscillators have. Finally, because it doesn’t use any parameters, it is
The
March 2013 • Technical Analysis of StockS & commoditieS • 35
ue of the CVI as an add-on to existing trading systems or indicators. As any trader with experience will know, no single indicator in its own right makes for a complete trad-ing system. When most indicators make it to the backtests, the results often tend to be disappointing. In fact, no set of indicators is a complete system, as successful trading requires consistent money management discipline and careful risk management. Nevertheless, I am going to explore the CVI as a catalyst by looking at its effect when added to other indicators or entry systems.
Pattern filterThe point of using pattern filters is to sort through the signals of a pattern — that is, getting less of them. You want to see if it is possible to increase the success rate of that particular pattern. To estimate the value of the CVI as a pattern filter, you need to use an objectively defined pattern, like a key reversal bar, and see if you can pump up its success rate with the CVI oscillator.
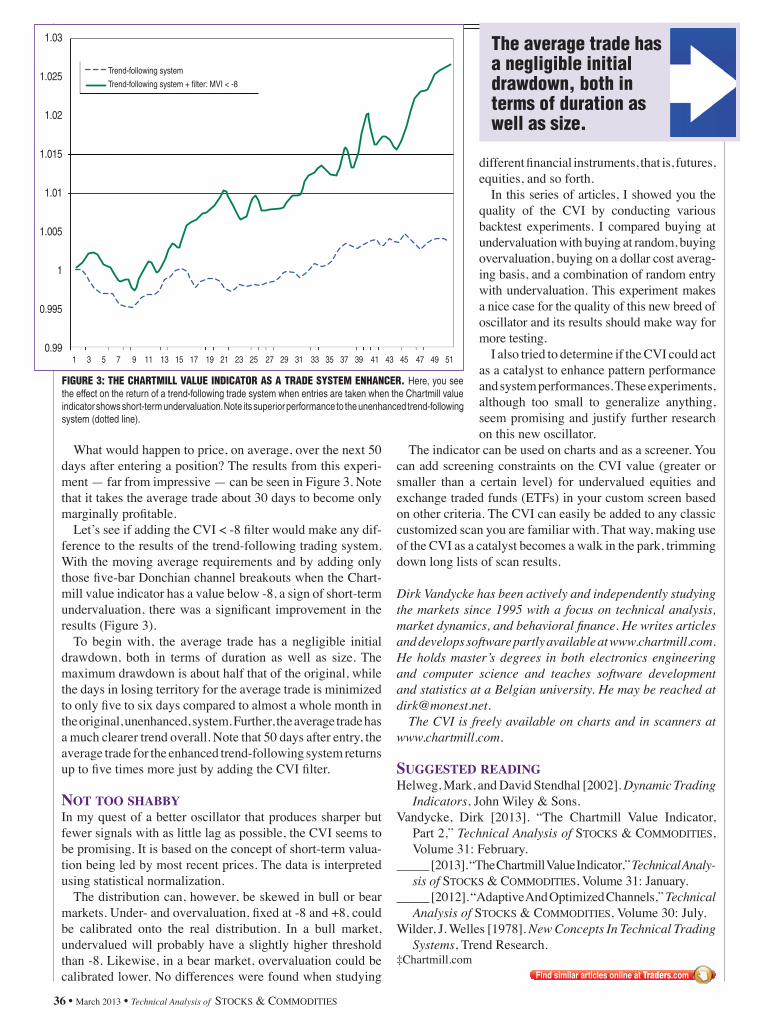
I will define a key reversal bar here as a bar opening below the previous bar’s close but closing above the previous bar’s high. So I gathered all those key reversal days through a backtest and looked at the average profit for each day forward after such a bar.
A random key reversal day shows an average profit of about 3%, 30 days after it was taken (Figure 2). After that period, the effect of a key reversal day seems to wear off. In the first five to seven days, the key reversal day shows an average loss but never amounting to more than 1%.
When the key reversal days get filtered by allowing only those key reversal day entries to be taken when the CVI is less than -8, the number of valid entry signals drops by about 50%, while the average profit on 30 days almost doubles.
Adding the additional criteria to the key reversal signal didn’t change anything. Again, after about one month, the signal effect fades away. This may be seen as an advantage, since it results in overall sharper exit signals, hence not keeping you in a jittery sideways movement. More impor-tant, note that the small average adversity at the beginning of a key reversal day trade seems to be only half the length (three days instead of up to seven) with the added CVI filter.
SyStem filterA key reversal day is merely a pattern. Although we are designed to see patterns everywhere, it takes far more than one to have
INDICATORS
1 11 21 31 41 51
Profitability
Prof
it fa
ctor
Days
1.2
1.15
1.1
1.05
1
0.95
Random entryUndervalued entry Overvalued entryRandom undervalued entryDollar cost averaging
1 3 5 7 9 11 13 15 17 19 21 23 25 27 29 31 33 35 37 39 41 43 45 47 49 51
1.07
1.06
1.05
1.04
1.03
1.02
1.01
1
0.99
Key reversal days + filter: MVI < -8Key reversal days
Figure 1: COMPAriSON OF DiFFereNT eNTrY SigNALS WiTH AN uNDerVALueD CVi eNTrY SYSTeM. Buying short-term undervaluation (the Chartmill value indicator below -7) seems to pay off against other entry strategies. Here, a random entry system is used as a benchmark.
Figure 2: THe CHArTMiLL VALue iNDiCATOr AS A PATTerN CATALYST. Here, you see the effect on the average return for 50 days after a key reversal day compared to when those key reversals are taken when the CVI < -8. This demonstrates the possible positive effect of buying near short-term cheapness as indicated by the CVI.
a complete trading system. The entry patterns we use to open a trade might well be (and probably are) of lesser importance. Nevertheless, it is a good idea to test the addition of a CVI filter to a trading system since the entries can be fine tuned with this additional filter. Here’s the system that was back-tested: Enter a trade when the 25-bar simple moving average is above the 75-bar simple moving average and when prices break above the highest high of the previous five bars — that is, a five-period Donchian channel breakout.
36 • March 2013 • Technical Analysis of StockS & commoditieS
The average trade has a negligible initial drawdown, both in terms of duration as well as size.
What would happen to price, on average, over the next 50 days after entering a position? The results from this experi-ment — far from impressive — can be seen in Figure 3. Note that it takes the average trade about 30 days to become only marginally profitable.
Let’s see if adding the CVI < ‑8 filter would make any dif-ference to the results of the trend-following trading system. With the moving average requirements and by adding only those five‑bar Donchian channel breakouts when the Chart-mill value indicator has a value below -8, a sign of short-term undervaluation, there was a significant improvement in the results (Figure 3).
To begin with, the average trade has a negligible initial drawdown, both in terms of duration as well as size. The maximum drawdown is about half that of the original, while the days in losing territory for the average trade is minimized to only five to six days compared to almost a whole month in the original, unenhanced, system. Further, the average trade has a much clearer trend overall. Note that 50 days after entry, the average trade for the enhanced trend-following system returns up to five times more just by adding the CVI filter.
Not too shabbyIn my quest of a better oscillator that produces sharper but fewer signals with as little lag as possible, the CVI seems to be promising. It is based on the concept of short-term valua-tion being led by most recent prices. The data is interpreted using statistical normalization.
The distribution can, however, be skewed in bull or bear markets. Under‑ and overvaluation, fixed at ‑8 and +8, could be calibrated onto the real distribution. In a bull market, undervalued will probably have a slightly higher threshold than -8. Likewise, in a bear market, overvaluation could be calibrated lower. No differences were found when studying
different financial instruments, that is, futures, equities, and so forth.
In this series of articles, I showed you the quality of the CVI by conducting various backtest experiments. I compared buying at undervaluation with buying at random, buying overvaluation, buying on a dollar cost averag-ing basis, and a combination of random entry with undervaluation. This experiment makes a nice case for the quality of this new breed of oscillator and its results should make way for more testing.
I also tried to determine if the CVI could act as a catalyst to enhance pattern performance and system performances. These experiments, although too small to generalize anything, seem promising and justify further research on this new oscillator.
The indicator can be used on charts and as a screener. You can add screening constraints on the CVI value (greater or smaller than a certain level) for undervalued equities and exchange traded funds (ETFs) in your custom screen based on other criteria. The CVI can easily be added to any classic customized scan you are familiar with. That way, making use of the CVI as a catalyst becomes a walk in the park, trimming down long lists of scan results.
Dirk Vandycke has been actively and independently studying the markets since 1995 with a focus on technical analysis, market dynamics, and behavioral finance. He writes articles and develops software partly available at www.chartmill.com. He holds master’s degrees in both electronics engineering and computer science and teaches software development and statistics at a Belgian university. He may be reached at [email protected].
The CVI is freely available on charts and in scanners at www.chartmill.com.
suggested readiNgHelweg, Mark, and David Stendhal [2002]. Dynamic Trading
Indicators, John Wiley & Sons.Vandycke, Dirk [2013]. “The Chartmill Value Indicator,
Part 2,” Technical Analysis of StockS & commoditieS, Volume 31: February.
_____ [2013]. “The Chartmill Value Indicator,” Technical Analy-sis of StockS & commoditieS, Volume 31: January.
_____ [2012]. “Adaptive And Optimized Channels,” Technical Analysis of StockS & commoditieS, Volume 30: July.
Wilder, J. Welles [1978]. New Concepts In Technical Trading Systems, Trend Research.
‡Chartmill.com
1 3 5 7 9 11 13 15 17 19 21 23 25 27 29 31 33 35 37 39 41 43 45 47 49 51
1.03
1.025
1.02
1.015
1.01
1.005
1
0.995
0.99
Trend-following system
Trend-following system + filter: MVI < -8
FIGURE 3: ThE ChaRTmIll ValUE IndICaToR as a TRadE sysTEm EnhanCER. Here, you see the effect on the return of a trend-following trade system when entries are taken when the Chartmill value indicator shows short-term undervaluation. Note its superior performance to the unenhanced trend-following system (dotted line).