Embed Size (px)
Citation preview

JUMO ecoTRANS Lf 03Transmitter/Switching Device for Conductivity
Type 202732
Operating Manual
20273200T90Z001K000
V3.00/EN/00429233

Contents
1 Notes ..................................................................................... 5
2 Identifying the device version ............................................. 62.1 Type designation ................................................................................. 6
3 Installation ............................................................................ 7
4 Electrical connection ........................................................... 7
5 Commissioning .................................................................. 125.1 Fundamentals of conductivity measurement ................................... 125.2 Applying the supply voltage ............................................................. 13
6 Setting / altering the device functions ............................. 146.1 Actual-value display ......................................................................... 146.2 Operation .......................................................................................... 156.3 Function of keys ............................................................................... 156.4 Level selection .................................................................................. 176.5 The operator level (USER) ................................................................ 186.6 The administrator level (ADMIN) ....................................................... 196.7 The enabling level (RIGHT) ............................................................... 206.8 The calibration level (CALIB) ............................................................. 21
7 Setting ranges .................................................................... 22
8 Configurable parameters .................................................. 248.1 Inputs ................................................................................................ 258.1.1 Measurement input for conductivity (submenu CON) ....................... 258.1.2 Measurement input for temperature (submenu TEMP) ...................... 298.2 Relay / open-collector ...................................................................... 318.2.1 Logic output 1 (submenu BIN.1) ........................................................ 318.2.2 Logic output 2 - option (submenu BIN.2) .......................................... 348.3 Analog outputs ................................................................................. 378.3.1 Conductivity (submenu CO.OUT) ...................................................... 378.3.2 Temperature (submenu TE.OUT) ....................................................... 39
9 Calibration .......................................................................... 429.1 General ............................................................................................. 429.1.1 Measurements in highly-purified water .............................................. 439.2 Activating the calibration mode ........................................................ 44
Contents
9.3 Selecting the calibration procedure .................................................. 459.4 Calibrating the temperature coefficient using
automatic temperature measurement 469.5 Calibrating the temperature coefficient using
manual temperature entry 499.6 Calibrating the relative cell constant ................................................ 51
10 Analog output .................................................................... 5410.1 Response of the output signal during calibration ............................. 5410.2 Response of the output signal to a fault condition ........................... 5410.3 Output signal in fault condition ......................................................... 5510.4 Response of the output signal on leaving the
scaling range 5610.5 Manual operation of the analog output ............................................ 56
11 Relay output / open-collector ........................................... 5711.1 Response of the relay ....................................................................... 5711.2 Manual operation of the relay outputs .............................................. 5711.3 Response of the relay during calibration .......................................... 5911.4 Pulse function of the relay output ..................................................... 5911.5 Response of the relay in fault condition ........................................... 5911.6 Fault detection .................................................................................. 60
12 The USP contact (for high-purity water) .......................... 6212.1 USP pre-alarm .................................................................................. 63
13 Display and LED messages .............................................. 6413.1 Operating states of the JUMO ecoTrans Lf 03 ................................. 6413.2 Underrange ....................................................................................... 6413.3 Overrange ......................................................................................... 6413.4 Probe break ...................................................................................... 6413.5 Short circuit ...................................................................................... 6513.6 Initialization of dependent parameters ............................................. 6513.7 Calibration timer has run down ........................................................ 65
14 Operation via setup interface ........................................... 6614.1 Operation through Setup .................................................................. 67
15 Technical data .................................................................... 68
16 Environment / waste disposal .......................................... 72
17 China RoHS ........................................................................ 74
1 Notes
To protect the device from electrostatic discharge, usersmust discharge themselves electrostatically beforetouching the device !
All necessary settings are described in this OperatingManual. However, if any difficulties should still ariseduring start-up, please do not carry out anymanipulations on the unit. You could endanger yourrights under the device warranty! Please contact thenearest subsidiary or the head office in such a case.
Please read this operating manual before starting upthe device. Keep the manual in a place which isaccessible to all users at all times. Please assist us toimprove this operating manual, where necessary.
5
2 Identifying the device version
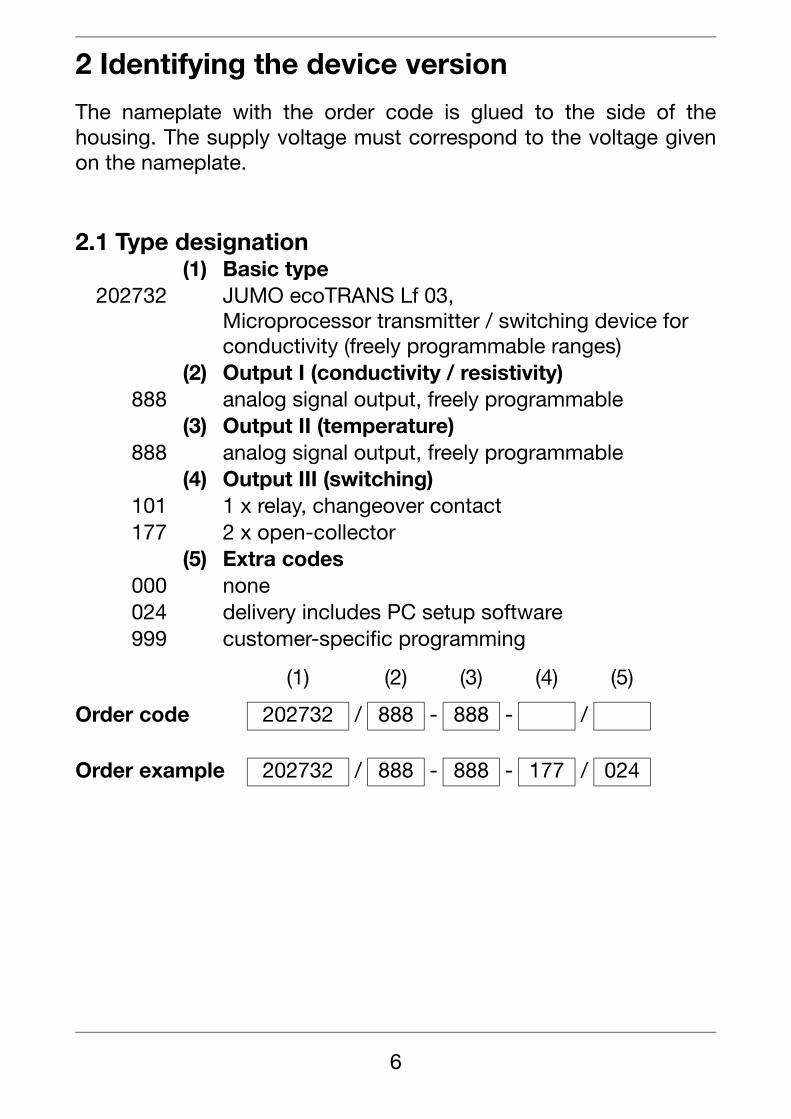
The nameplate with the order code is glued to the side of thehousing. The supply voltage must correspond to the voltage givenon the nameplate.
2.1 Type designation(1) Basic type
202732 JUMO ecoTRANS Lf 03,Microprocessor transmitter / switching device for conductivity (freely programmable ranges)
(2) Output I (conductivity / resistivity)888 analog signal output, freely programmable
(3) Output II (temperature)888 analog signal output, freely programmable
(4) Output III (switching)101 1 x relay, changeover contact177 2 x open-collector
(5) Extra codes000 none024 delivery includes PC setup software999 customer-specific programming
(1) (2) (3) (4) (5)
Order code 202732 / 888 - 888 - /
Order example 202732 / 888 - 888 - 177 / 024
6
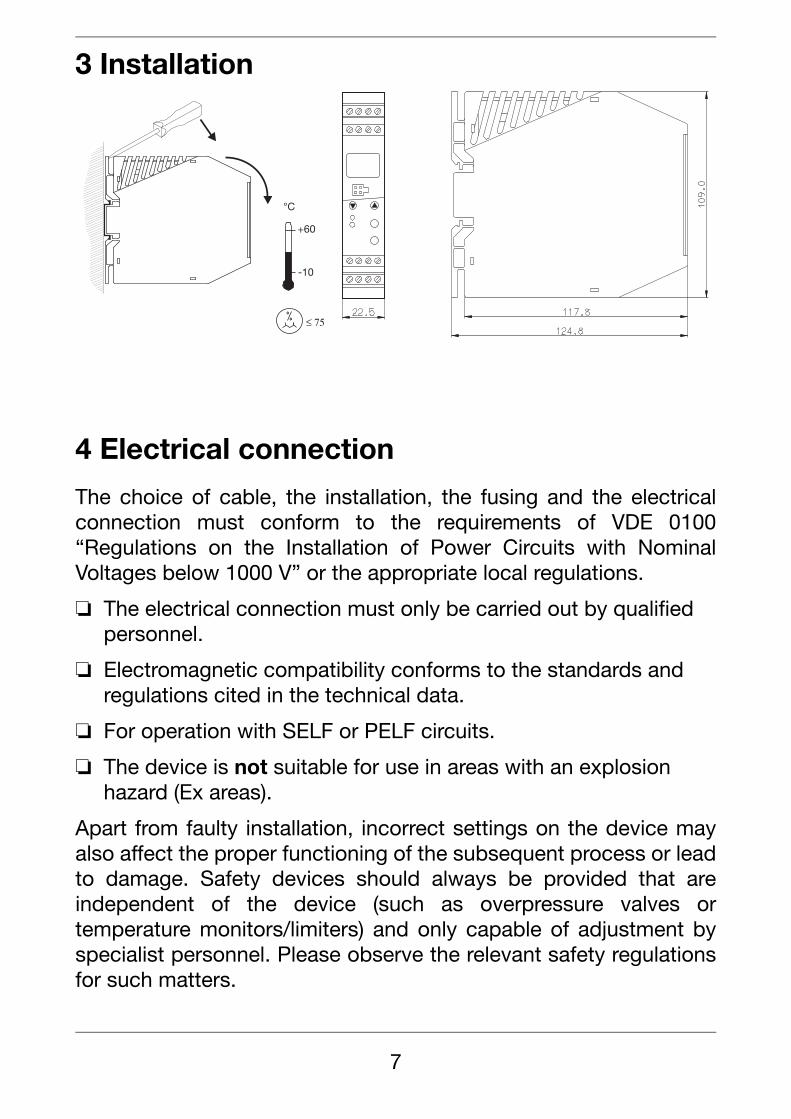
3 Installation
4 Electrical connection
The choice of cable, the installation, the fusing and the electricalconnection must conform to the requirements of VDE 0100“Regulations on the Installation of Power Circuits with NominalVoltages below 1000 V” or the appropriate local regulations.
❏ The electrical connection must only be carried out by qualified personnel.
❏ Electromagnetic compatibility conforms to the standards and regulations cited in the technical data.
❏ For operation with SELF or PELF circuits.
❏ The device is not suitable for use in areas with an explosion hazard (Ex areas).
Apart from faulty installation, incorrect settings on the device mayalso affect the proper functioning of the subsequent process or leadto damage. Safety devices should always be provided that areindependent of the device (such as overpressure valves ortemperature monitors/limiters) and only capable of adjustment byspecialist personnel. Please observe the relevant safety regulationsfor such matters.
����
-10
+60
°C
7
❏ The load circuit must be fused for the maximum relay current, in order to prevent the output relay contacts becoming welded in the event of a short circuit.
❏ The electrical energy must be supplied to the machine via a 125 mA medium time lag fuse or equivalent protection through a separate branch.
❏ Do not connect any additional loads to the screw terminals for the supply of the device.
❏ Any electrical connection other than that specified in the connection diagram may result in the destruction of the device.
❏ Run input, output and supply cables separately and not parallel to one another.
❏ Probe leads must be implemented as twisted and shielded, uninterrupted cables (do not run them via terminal blocks or similar).
❏ Supply fluctuations are only permissible within the specified tolerances (see Data Sheet 20.2732).
❏ The device must only be assembled or disassembled in the de-energized state or when the cables are not connected.
8
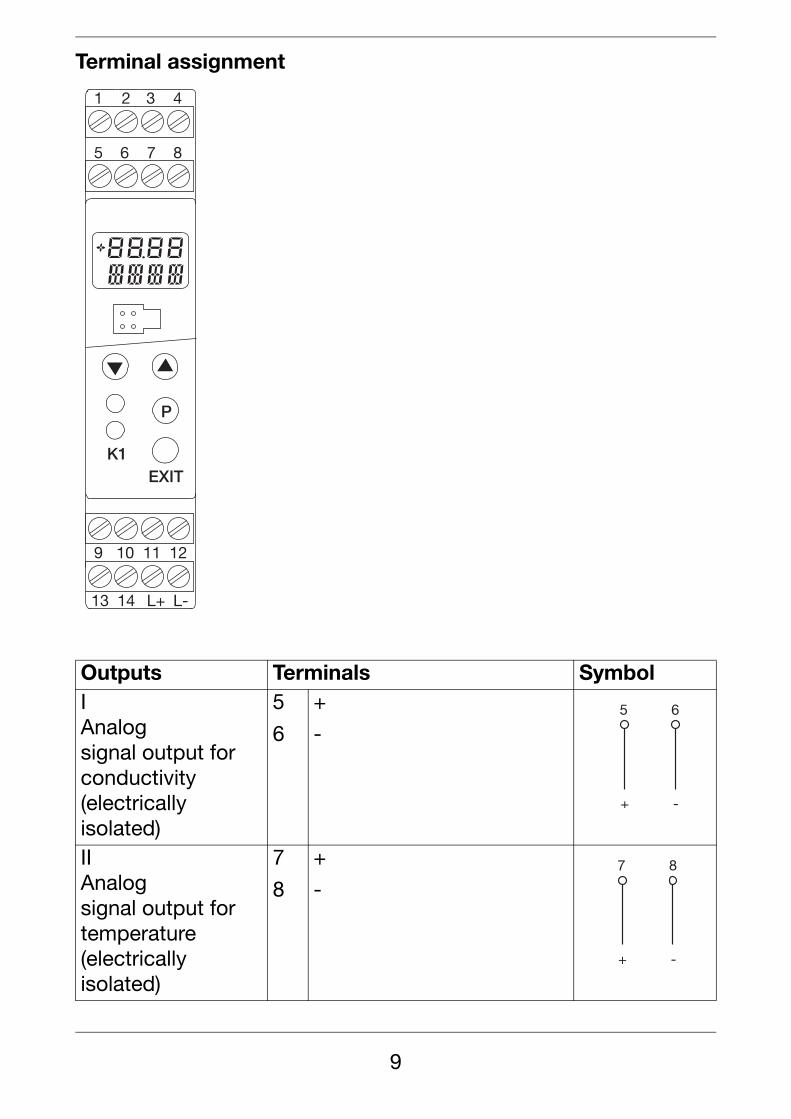
Terminal assignment
Outputs Terminals SymbolIAnalog signal output for conductivity(electrically isolated)
5
6
+
-
IIAnalog signal output for temperature(electrically isolated)
7
8
+
-
P
K1
EXIT
4321
5 876
13 L-L+14
9 121110
5 6
+ -
7 8
+ -
9
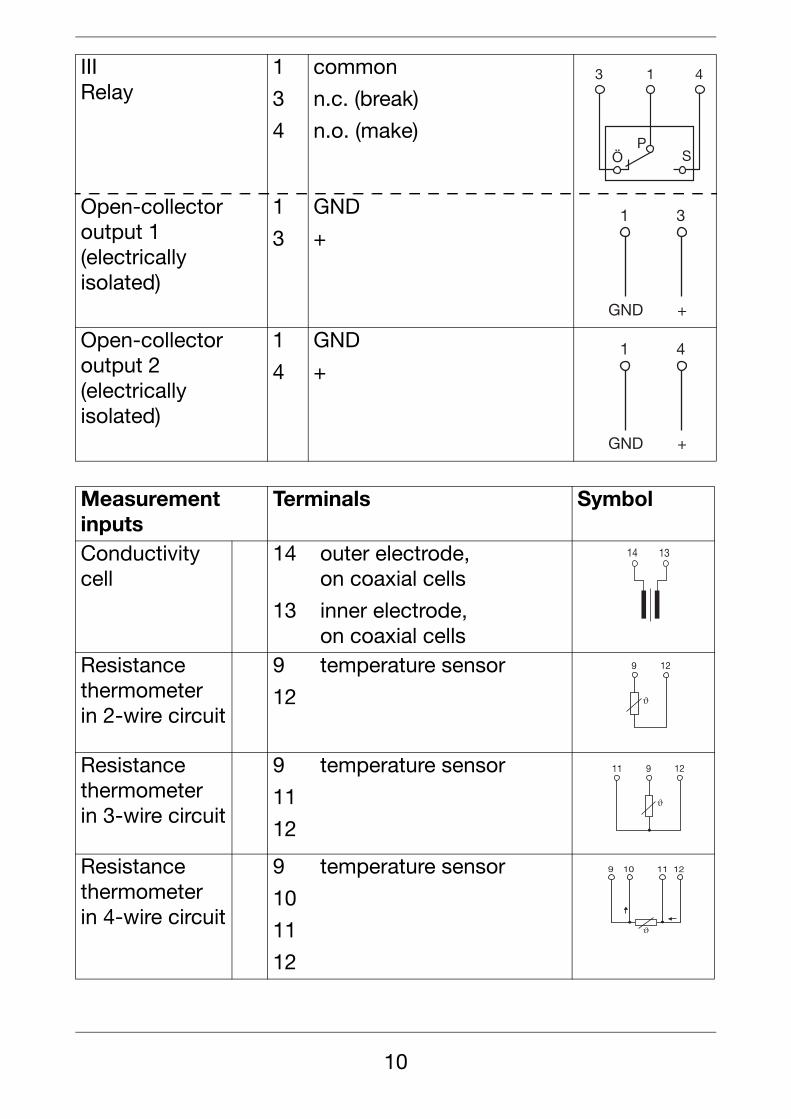
IIIRelay
1
3
4
common
n.c. (break)
n.o. (make)
Open-collector output 1(electrically isolated)
1
3
GND
+
Open-collector output 2(electrically isolated)
1
4
GND
+
Measurement inputs
Terminals Symbol
Conductivity cell
14
13
outer electrode,on coaxial cells
inner electrode,on coaxial cells
Resistance thermometerin 2-wire circuit
9
12
temperature sensor
Resistance thermometerin 3-wire circuit
9
11
12
temperature sensor
Resistance thermometerin 4-wire circuit
9
10
11
12
temperature sensor
413
PSÖ
1 3
GND +
1 4
GND +
14 13
�
9 12
�
911 12
�
11 129 10
10
Connection of the conductivity cell
* type of conection: 2-wire
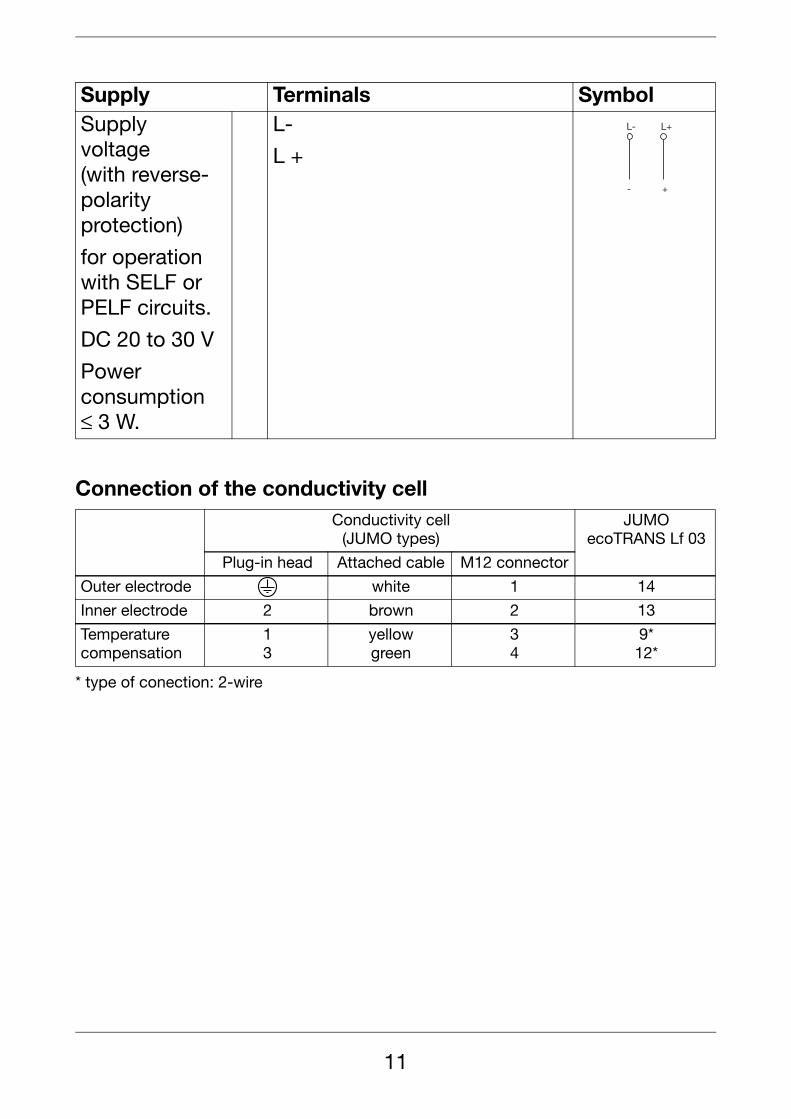
Supply Terminals SymbolSupplyvoltage(with reverse-polarity protection)
for operation with SELF or PELF circuits.
DC 20 to 30 V
Power consumption ≤ 3 W.
L-
L +
Conductivity cell(JUMO types)
JUMOecoTRANS Lf 03
Plug-in head Attached cable M12 connector
Outer electrode white 1 14
Inner electrode 2 brown 2 13
Temperature compensation
13
yellowgreen
34
9*12*
L- L+
- +
11
5 Commissioning
5.1 Fundamentals of conductivity measurement
Principle of measurement
Electrolytic conductivity measuring cells basically consist of twometal plates arranged opposite each other which are immersed in thesolution to be measured. The conductivity of the solution isdetermined through the measuring voltage and the resultingmeasuring current.
The current between the metal plates depends on their geometry(distance and area). The cell constant describes this dependence.Subject to manufacturing tolerances, or because of dirt or wear, thereal cell constant of a measuring cell often deviates from its nominalvalue. This deviation is reflected by the relative cell constant that isadjustable on the conductivity transmitter.
The conductivity of a solution depends on temperature (i.e. the con-ductivity of a solution increases with rising temperature). The tempe-rature coefficient of the solution describes the dependence of con-ductivity and temperature. Since conductivity is not always measuredat the reference temperature, automatic temperature compensationhas been integrated. The transmitter uses the temperature coefficientto calculate the conductivity that would be present at the referencetemperature from the current conductivity and the current tempera-ture, and then display this value. This process is called temperaturecompensation. Modern transmitters offer various variants to carry outthis temperature compensation:
- Linear compensation (constant temperature coefficient).This type of compensation can be used with normal water with an acceptable level of accuracy. The temperature coefficient used is then about 2,2 %/K.
- Natural water (DIN EN27888 or ISO 7888 as the case may be).In this case, a so-called non-linear temperature compensation is used. According to the above standard, the corresponding type of compensation can be applied in the case of natural ground water, mountain spring water and surface warter.The conductivity of the water is compensated in the range from
12
0°C to 36°C.
- Non-linearHere, the actual graph of the temperature coefficient during a heating-up or cooling-down process is determined by the transmitter.
- ASTM1125-95.This type of temperature compensation is employed for measurements in very pure water. Here, the extremely non-linear behavior of the temperature dependence is taken into consideration according to the above standard. The conductivity of the water is compensated in the range from 0°C to 100°C.
5.2 Applying the supply voltageWhen the device has been correctly connected, all LCD segments will be shown briefly, immediately after applying the supply voltage.
Note
After initializing the controller, the output signal is 0 V or 0 mA. The logic outputs or relays are in the quiescent state (inactive). After approx. 2 sec, the JUMO ecoTRANS Lf 03 operates according to its configuration.
13
6 Setting / altering the device functions
Alterations can be carried out in the setup program or from the keysof the JUMO ecoTRANS Lf 03.
6.1 Actual-value displayThe actual value is displayed either in the
- static mode or in the
- alternating mode
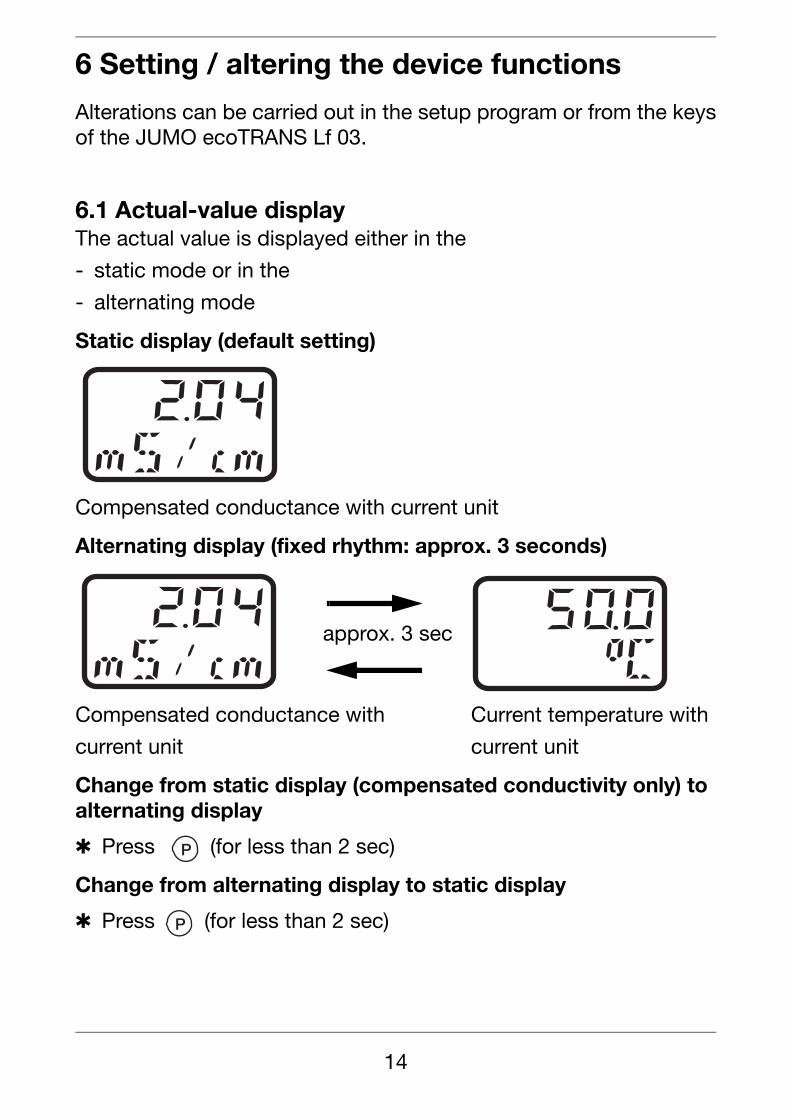
Static display (default setting)
Compensated conductance with current unit
Alternating display (fixed rhythm: approx. 3 seconds)
Compensated conductance with Current temperature with
current unit current unit
Change from static display (compensated conductivity only) to alternating display
✱ Press (for less than 2 sec)
Change from alternating display to static display
✱ Press (for less than 2 sec)
approx. 3 sec
P
P
14
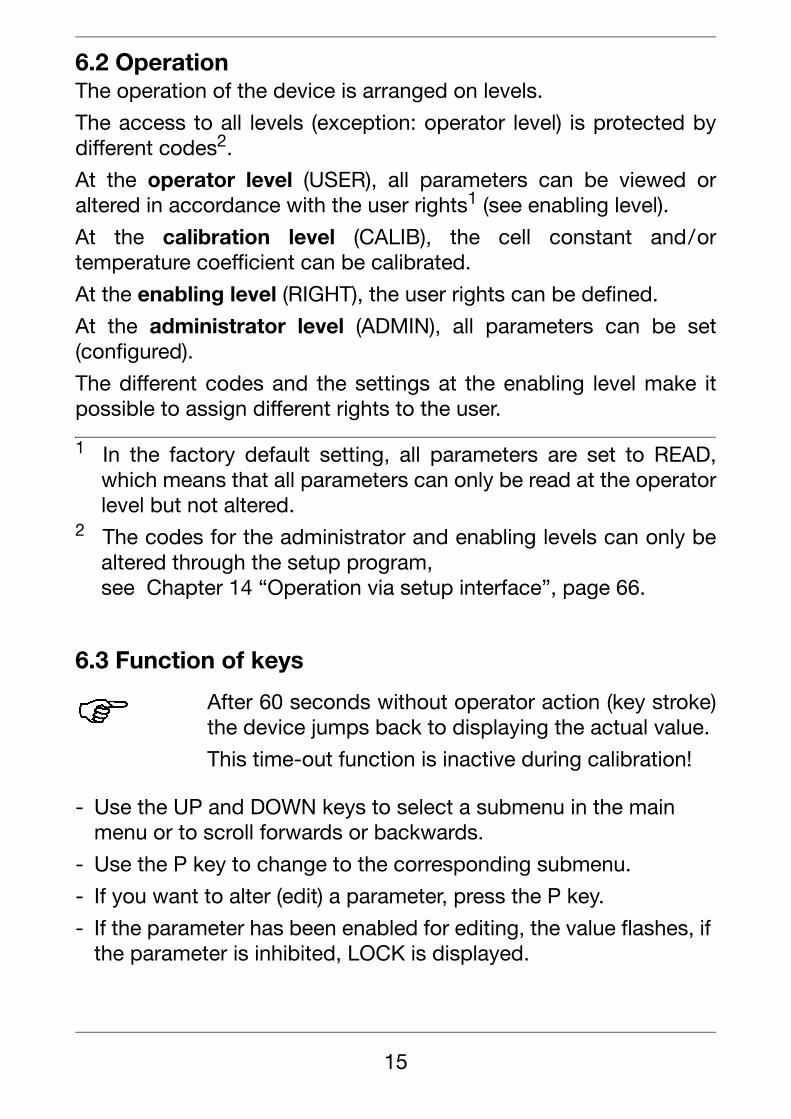
6.2 OperationThe operation of the device is arranged on levels.
The access to all levels (exception: operator level) is protected bydifferent codes2.
At the operator level (USER), all parameters can be viewed oraltered in accordance with the user rights1 (see enabling level).
At the calibration level (CALIB), the cell constant and/ortemperature coefficient can be calibrated.
At the enabling level (RIGHT), the user rights can be defined.
At the administrator level (ADMIN), all parameters can be set(configured).
The different codes and the settings at the enabling level make itpossible to assign different rights to the user.
1 In the factory default setting, all parameters are set to READ,which means that all parameters can only be read at the operatorlevel but not altered.
2 The codes for the administrator and enabling levels can only bealtered through the setup program,see Chapter 14 “Operation via setup interface”, page 66.
6.3 Function of keys
- Use the UP and DOWN keys to select a submenu in the main menu or to scroll forwards or backwards.
- Use the P key to change to the corresponding submenu.
- If you want to alter (edit) a parameter, press the P key.
- If the parameter has been enabled for editing, the value flashes, if the parameter is inhibited, LOCK is displayed.
After 60 seconds without operator action (key stroke)the device jumps back to displaying the actual value.
This time-out function is inactive during calibration!
15
- In order to alter a parameter, it must be enabled at the enabling level (set from “rEAd” to “Edit”).
- Press the UP or DOWN key to increase or decrease the value.
- Accept the value by pressing the P key.
- Use the EXIT key to cancel the entry and change to the next- higher level.
16
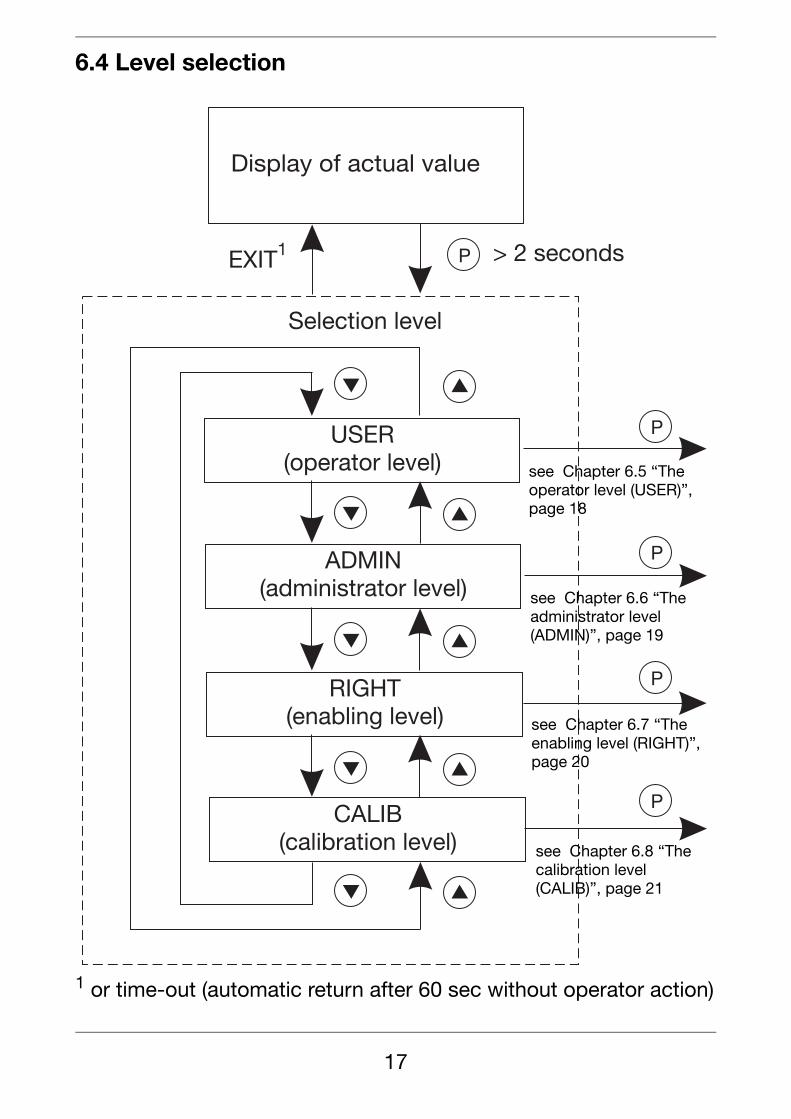
6.4 Level selection
1 or time-out (automatic return after 60 sec without operator action)
see Chapter 6.5 “The operator level (USER)”, page 18
see Chapter 6.6 “The administrator level (ADMIN)”, page 19
see Chapter 6.7 “The enabling level (RIGHT)”, page 20
see Chapter 6.8 “The calibration level (CALIB)”, page 21
17
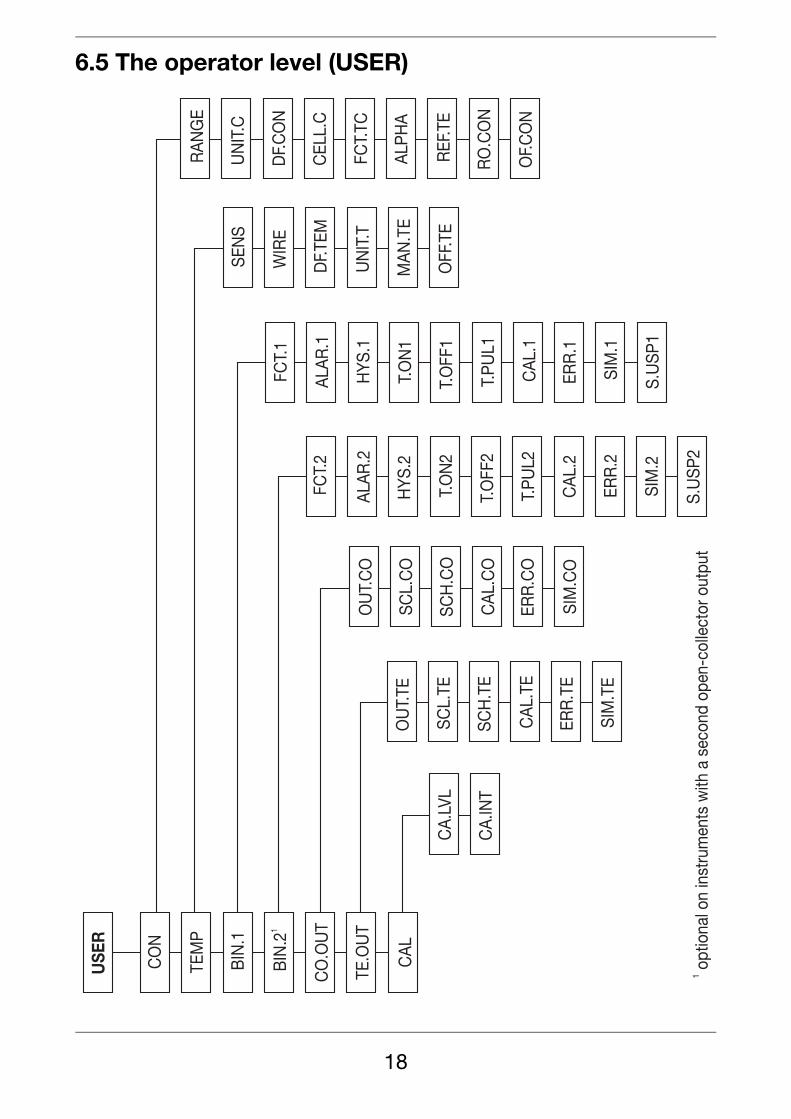
6.5 The operator level (USER)
18
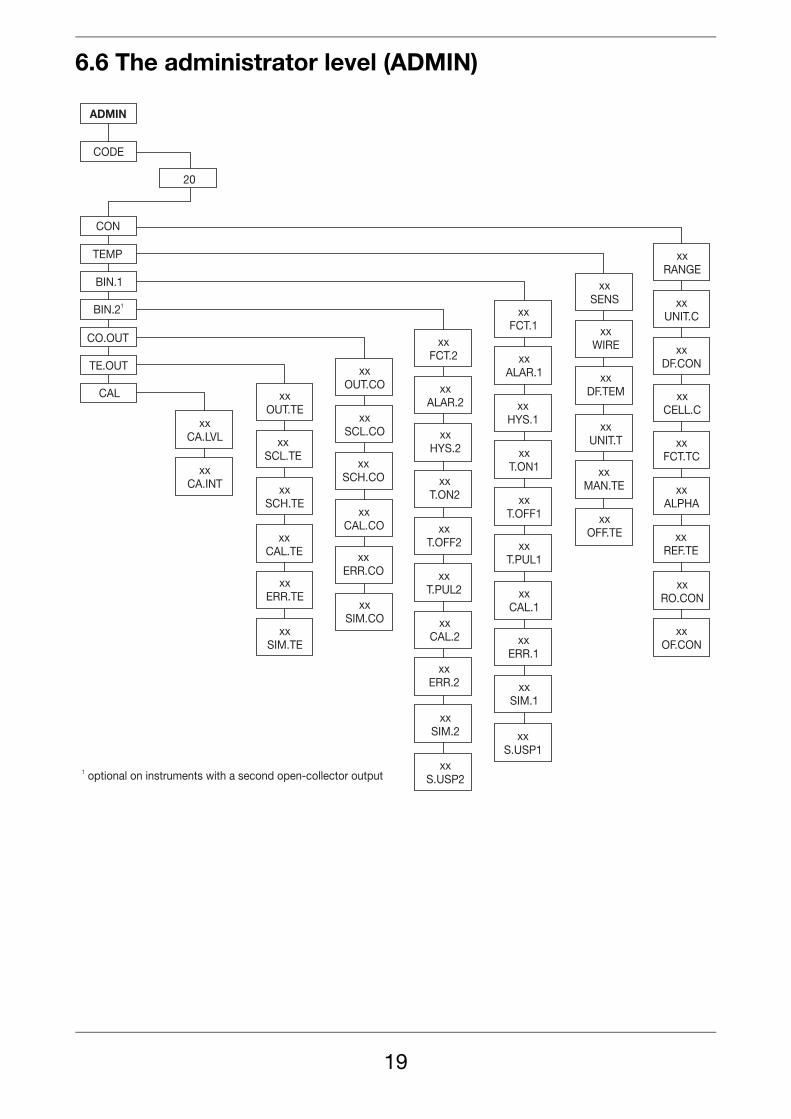
6.6 The administrator level (ADMIN)
19
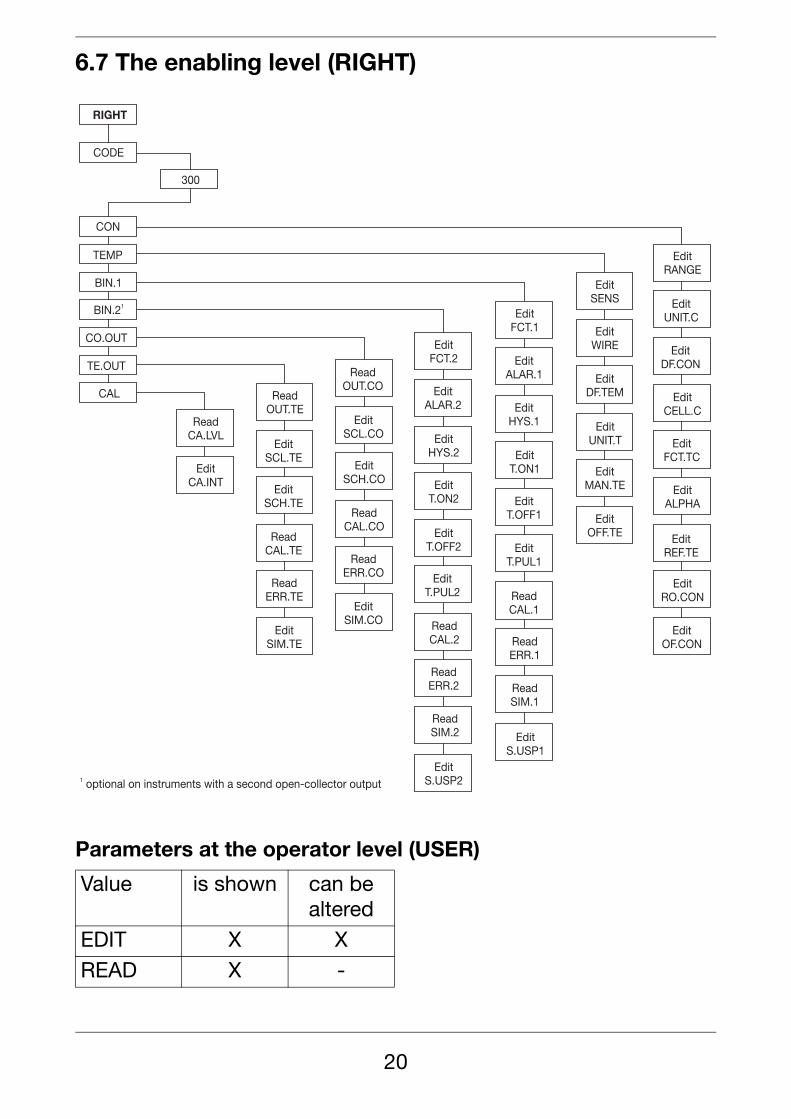
6.7 The enabling level (RIGHT)
Parameters at the operator level (USER)
Value is shown can be altered
EDIT X XREAD X -
20
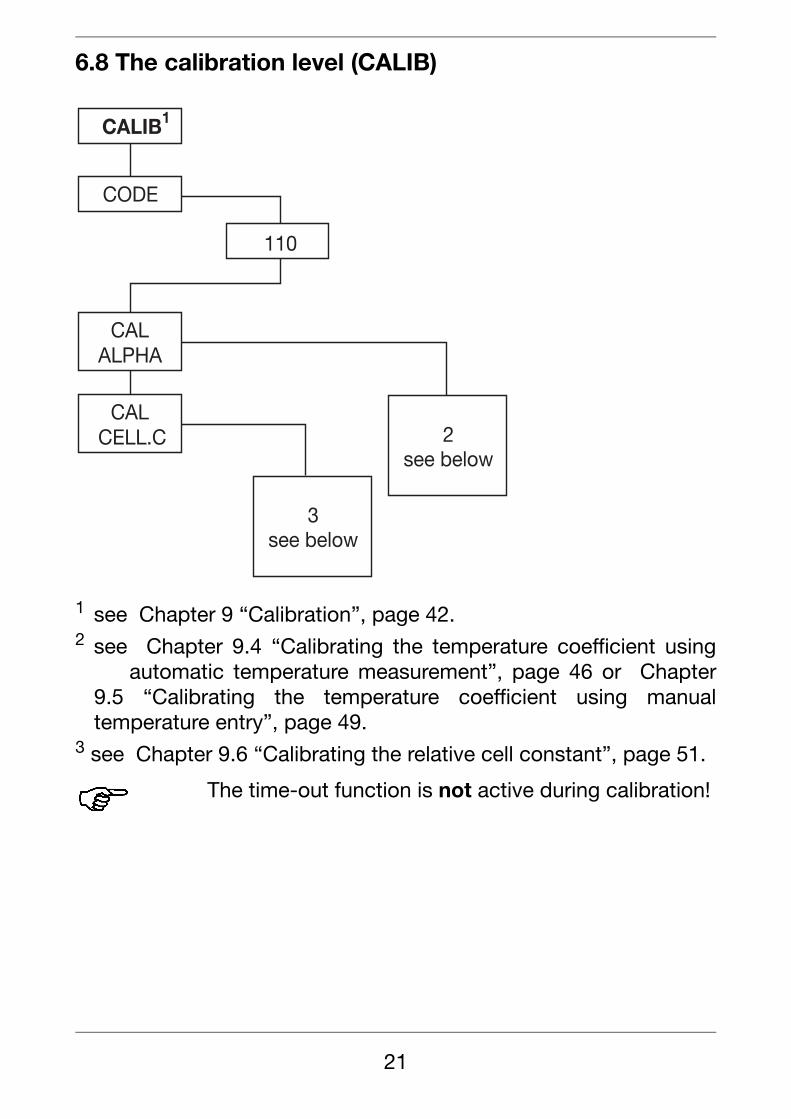
6.8 The calibration level (CALIB)
1 see Chapter 9 “Calibration”, page 42.2 see Chapter 9.4 “Calibrating the temperature coefficient using
automatic temperature measurement”, page 46 or Chapter9.5 “Calibrating the temperature coefficient using manualtemperature entry”, page 49.
3 see Chapter 9.6 “Calibrating the relative cell constant”, page 51.
The time-out function is not active during calibration!
21
22
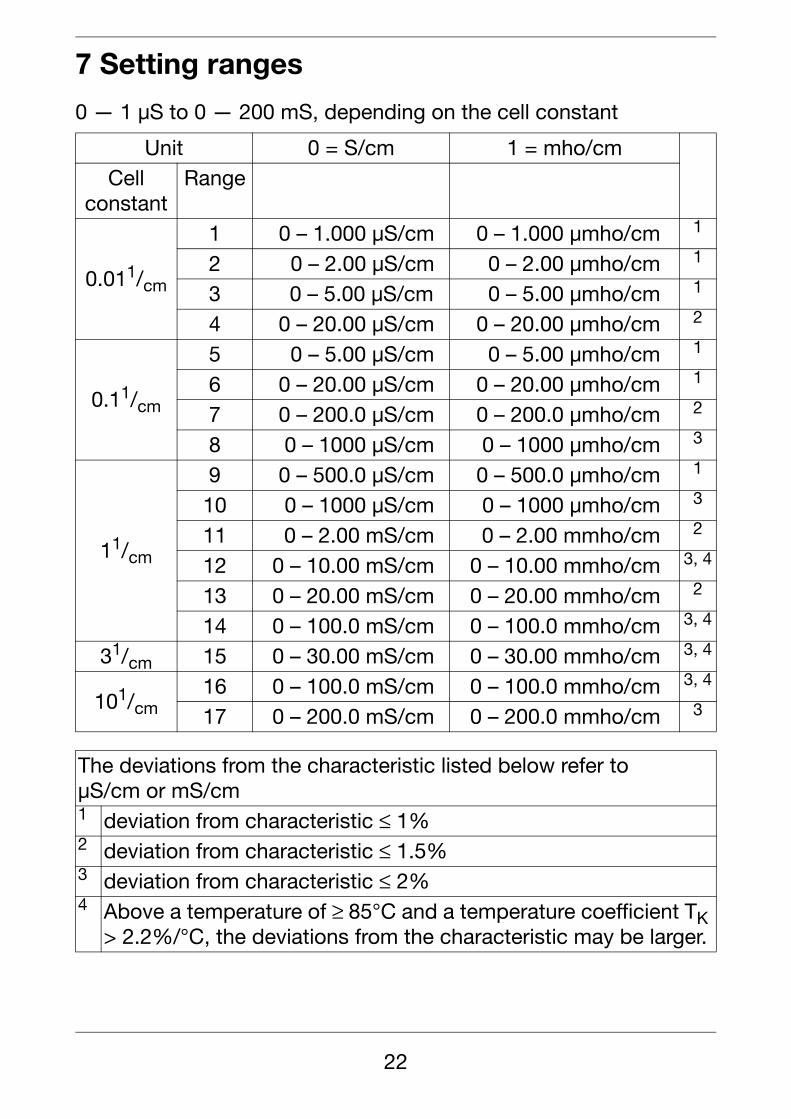
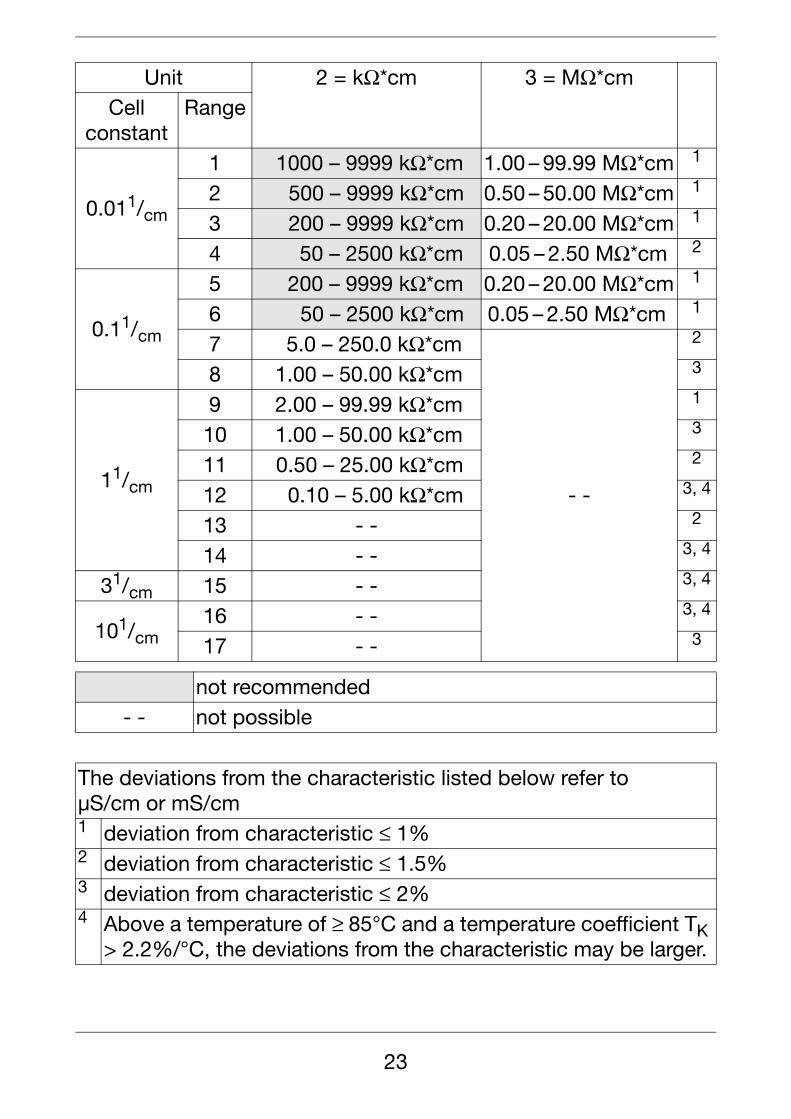
7 Setting ranges
0 — 1 µS to 0 — 200 mS, depending on the cell constant
Unit 0 = S/cm 1 = mho/cmCell
constantRange
0.011/cm
1 0 – 1.000 µS/cm 0 – 1.000 µmho/cm 1
2 0 – 2.00 µS/cm 0 – 2.00 µmho/cm 1
3 0 – 5.00 µS/cm 0 – 5.00 µmho/cm 1
4 0 – 20.00 µS/cm 0 – 20.00 µmho/cm 2
0.11/cm
5 0 – 5.00 µS/cm 0 – 5.00 µmho/cm 1
6 0 – 20.00 µS/cm 0 – 20.00 µmho/cm 1
7 0 – 200.0 µS/cm 0 – 200.0 µmho/cm 2
8 0 – 1000 µS/cm 0 – 1000 µmho/cm 3
11/cm
9 0 – 500.0 µS/cm 0 – 500.0 µmho/cm 1
10 0 – 1000 µS/cm 0 – 1000 µmho/cm 3
11 0 – 2.00 mS/cm 0 – 2.00 mmho/cm 2
12 0 – 10.00 mS/cm 0 – 10.00 mmho/cm 3, 4
13 0 – 20.00 mS/cm 0 – 20.00 mmho/cm 2
14 0 – 100.0 mS/cm 0 – 100.0 mmho/cm 3, 4
31/cm 15 0 – 30.00 mS/cm 0 – 30.00 mmho/cm 3, 4
101/cm16 0 – 100.0 mS/cm 0 – 100.0 mmho/cm 3, 4
17 0 – 200.0 mS/cm 0 – 200.0 mmho/cm 3
The deviations from the characteristic listed below refer to µS/cm or mS/cm1 deviation from characteristic ≤ 1%2 deviation from characteristic ≤ 1.5%3 deviation from characteristic ≤ 2%4 Above a temperature of ≥ 85°C and a temperature coefficient TK
> 2.2%/°C, the deviations from the characteristic may be larger.
23
Unit 2 = kΩ*cm 3 = MΩ*cmCell
constantRange
0.011/cm
1 1000 – 9999 kΩ*cm 1.00 – 99.99 MΩ*cm 1
2 500 – 9999 kΩ*cm 0.50 – 50.00 MΩ*cm 1
3 200 – 9999 kΩ*cm 0.20 – 20.00 MΩ*cm 1
4 50 – 2500 kΩ*cm 0.05 – 2.50 MΩ*cm 2
0.11/cm
5 200 – 9999 kΩ*cm 0.20 – 20.00 MΩ*cm 1
6 50 – 2500 kΩ*cm 0.05 – 2.50 MΩ*cm 1
7 5.0 – 250.0 kΩ*cm
- -
2
8 1.00 – 50.00 kΩ*cm 3
11/cm
9 2.00 – 99.99 kΩ*cm 1
10 1.00 – 50.00 kΩ*cm 3
11 0.50 – 25.00 kΩ*cm 2
12 0.10 – 5.00 kΩ*cm 3, 4
13 - - 2
14 - - 3, 4
31/cm 15 - - 3, 4
101/cm16 - - 3, 4
17 - - 3
not recommended- - not possible
The deviations from the characteristic listed below refer to µS/cm or mS/cm1 deviation from characteristic ≤ 1%2 deviation from characteristic ≤ 1.5%3 deviation from characteristic ≤ 2%4 Above a temperature of ≥ 85°C and a temperature coefficient TK
> 2.2%/°C, the deviations from the characteristic may be larger.
8 Configurable parameters
The p
aram
eter
s ca
n b
e se
t th
roug
h th
e se
tup
pro
gram
or
on t
he d
evic
e.
Whe
n al
terin
g on
e p
aram
eter
, it
may
be
nece
ssar
y to
adju
st
othe
r p
aram
eter
s as
w
ell,
bec
ause
so
me
par
amet
ers
are
affe
cted
by
othe
rs.
Exa
mp
le:
Whe
n al
terin
g th
e m
easu
ring
rang
e,
the
dis
pla
yfo
rmat
, se
tpoi
nts
and
oth
er p
aram
eter
s w
ill a
lso
be
adju
sted
.
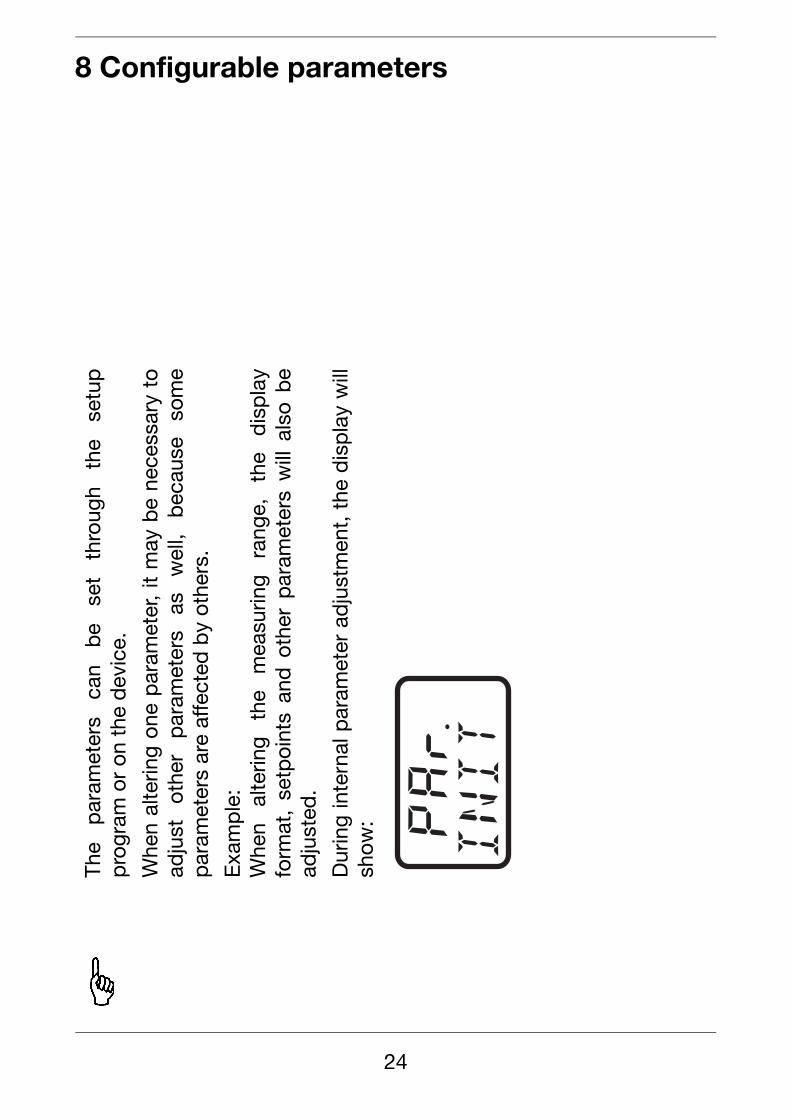
Dur
ing
inte
rnal
par
amet
er a
dju
stm
ent,
the
dis
pla
y w
illsh
ow:
24
The
def
ault
sett
ing
is s
how
n b
old
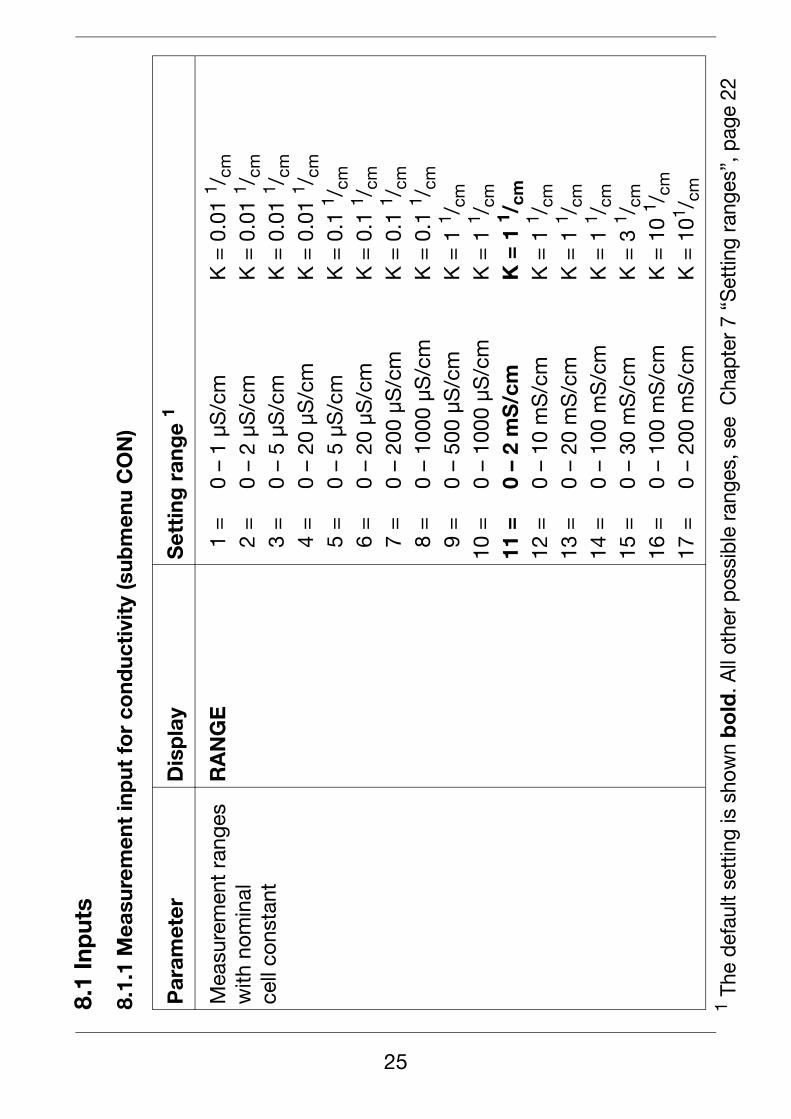
. All
othe
r pos
sibl
e ra
nges
, see
Cha
pter
7 “
Set
ting
rang
es”,
pag
e 22
8.1
Inp
uts
8.1.
1 M
easu
rem
ent
inp
ut f
or
cond
ucti
vity
(sub
men
u C
ON
)
Par
amet
erD
isp
lay
Set
ting
ran
ge
1
Mea
sure
men
t ra
nges
with
nom
inal
ce
ll co
nsta
nt
RA
NG
E01
=0
– 1
µS/c
mK
= 0
.01
1 /cm
02 =
0 –
2 µS
/cm
K =
0.0
1 1 /
cm03
=0
– 5
µS/c
mK
= 0
.01
1 /cm
04 =
0 –
20 µ
S/c
mK
= 0
.01
1 /cm
05 =
0 –
5 µS
/cm
K =
0.1
1 /cm
06 =
0 –
20 µ
S/c
mK
= 0
.1 1 /
cm07
=0
– 20
0 µS
/cm
K =
0.1
1 /cm
08 =
0 –
1000
µS
/cm
K =
0.1
1 /cm
09 =
0 –
500
µS/c
mK
= 1
1 /cm
10 =
0 –
1000
µS
/cm
K =
1 1 /
cm11
=0
– 2
mS
/cm
K =
1 1 /
cm12
=0
– 10
mS
/cm
K =
1 1 /
cm13
=0
– 20
mS
/cm
K =
1 1 /
cm14
=0
– 10
0 m
S/c
mK
= 1
1 /cm
15 =
0 –
30 m
S/c
mK
= 3
1 /cm
16 =
0 –
100
mS
/cm
K =
10
1 /cm
17 =
0 –
200
mS
/cm
K =
101 /
cm
1
25
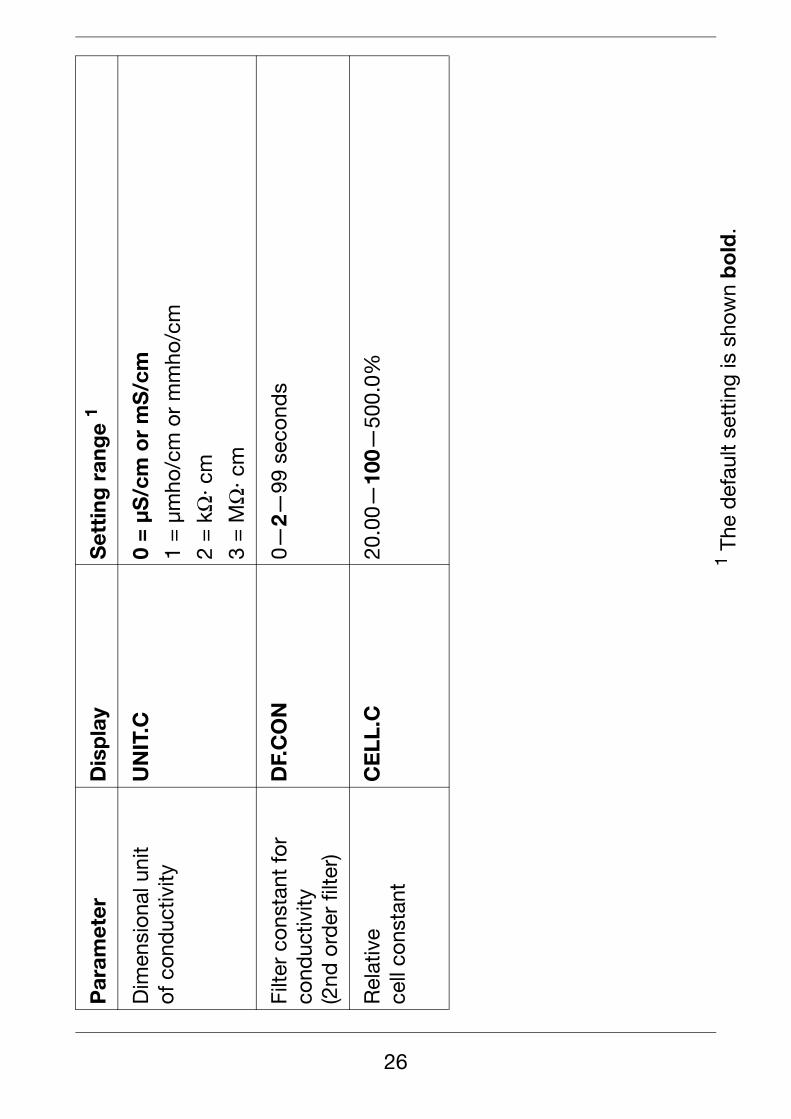
The
def
ault
sett
ing
is s
how
n b
old
.
Dim
ensi
onal
uni
tof
con
duc
tivity
UN
IT.C
0 =
µS
/cm
or
mS
/cm
1 =
µm
ho/c
m o
r m
mho
/cm
2 =
kΩ
· cm
3 =
MΩ
· cm
Filte
r co
nsta
nt fo
rco
nduc
tivity
(2nd
ord
er fi
lter)
DF.
CO
N0—
2—99
sec
ond
s
Rel
ativ
e ce
ll co
nsta
ntC
ELL
.C20
.00—
100—
500.
0%
Par
amet
erD
isp
lay
Set
ting
ran
ge
1
1
26
The
def
ault
sett
ing
is s
how
n b
old
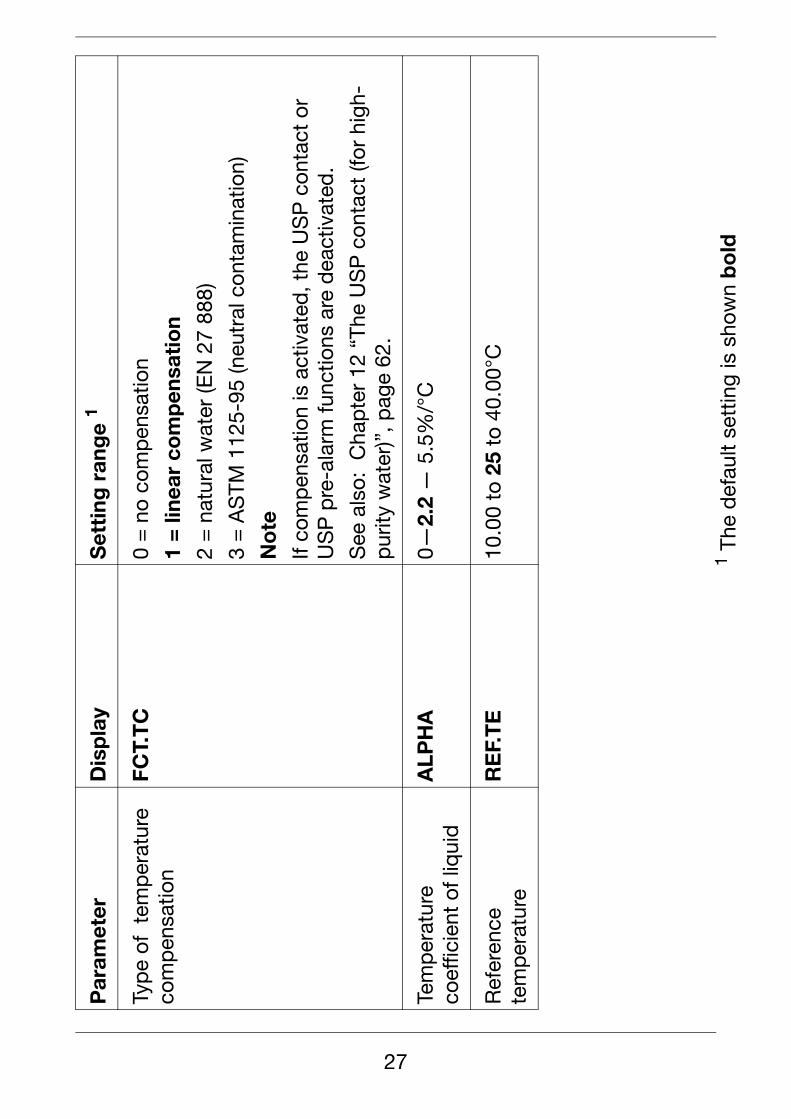
Typ
e of
tem
per
atur
e co
mp
ensa
tion
FCT.
TC
0 =
no
com
pen
satio
n
1 =
line
ar c
om
pen
sati
on
2 =
nat
ural
wat
er (E
N 2
7 88
8)
3 =
AS
TM 1
125-
95 (n
eutr
al c
onta
min
atio
n)
No
te
If co
mp
ensa
tion
is a
ctiv
ated
, the
US
P c
onta
ct o
r U
SP
pre
-ala
rm fu
nctio
ns a
re d
eact
ivat
ed.
See
als
o: C
hap
ter
12 “
The
US
P c
onta
ct (f
or h
igh-
pur
ity w
ater
)”, p
age
62.
Tem
per
atur
e co
effic
ient
of l
iqui
dA
LPH
A0—
2.2
— 5
.5%
/°C
Ref
eren
ce
tem
per
atur
eR
EF.
TE
10.0
0 to
25
to 4
0.00
°C
Par
amet
erD
isp
lay
Set
ting
ran
ge
1
1
27
The
def
ault
sett
ing
is s
how
n b
old
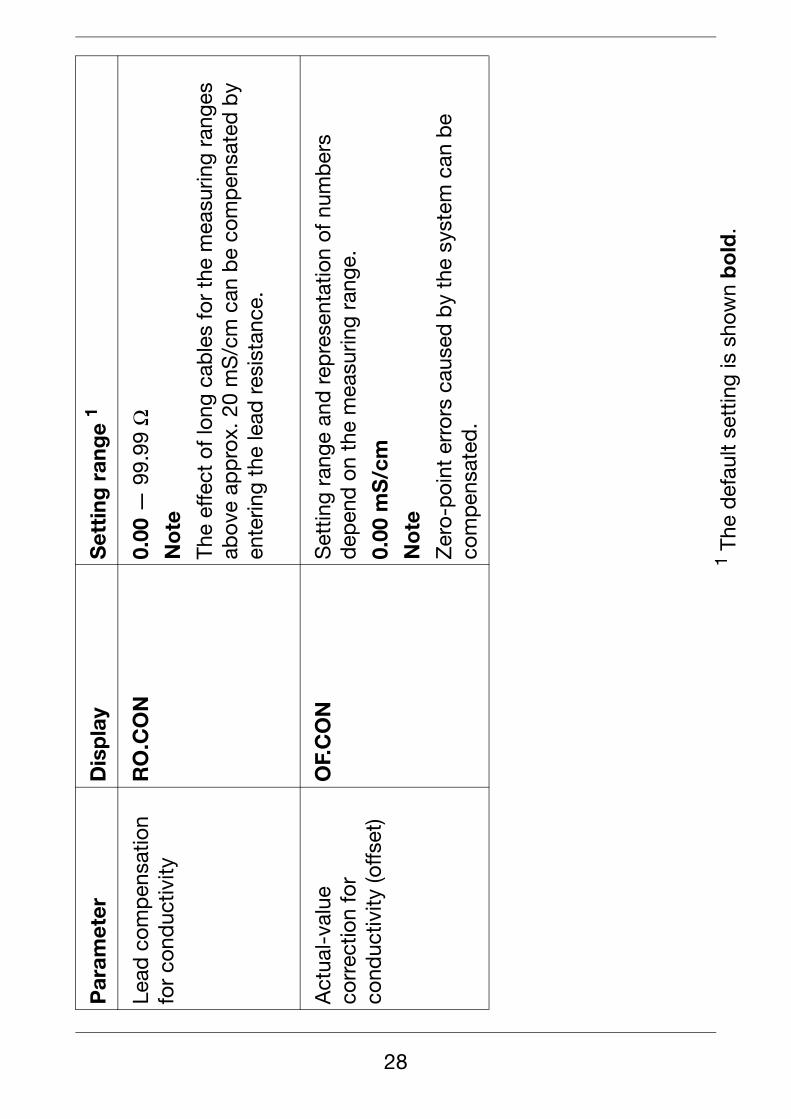
.
Lead
com
pen
satio
nfo
r co
nduc
tivity
RO
.CO
N0.
00 —
99.
99 Ω
No
te
The
effe
ct o
f lon
g ca
ble
s fo
r th
e m
easu
ring
rang
es
abov
e ap
pro
x. 2
0m
S/c
m c
an b
e co
mp
ensa
ted
by
ente
ring
the
lead
res
ista
nce.
Act
ual-
valu
e co
rrec
tion
for
cond
uctiv
ity (o
ffset
)
OF.
CO
NS
ettin
g ra
nge
and
rep
rese
ntat
ion
of n
umb
ers
dep
end
on
the
mea
surin
g ra
nge.
0.00
mS
/cm
No
te
Zer
o-p
oint
err
ors
caus
ed b
y th
e sy
stem
can
be
com
pen
sate
d.
Par
amet
erD
isp
lay
Set
ting
ran
ge
1
1
28
The
def
ault
sett
ing
is s
how
n b
old
.
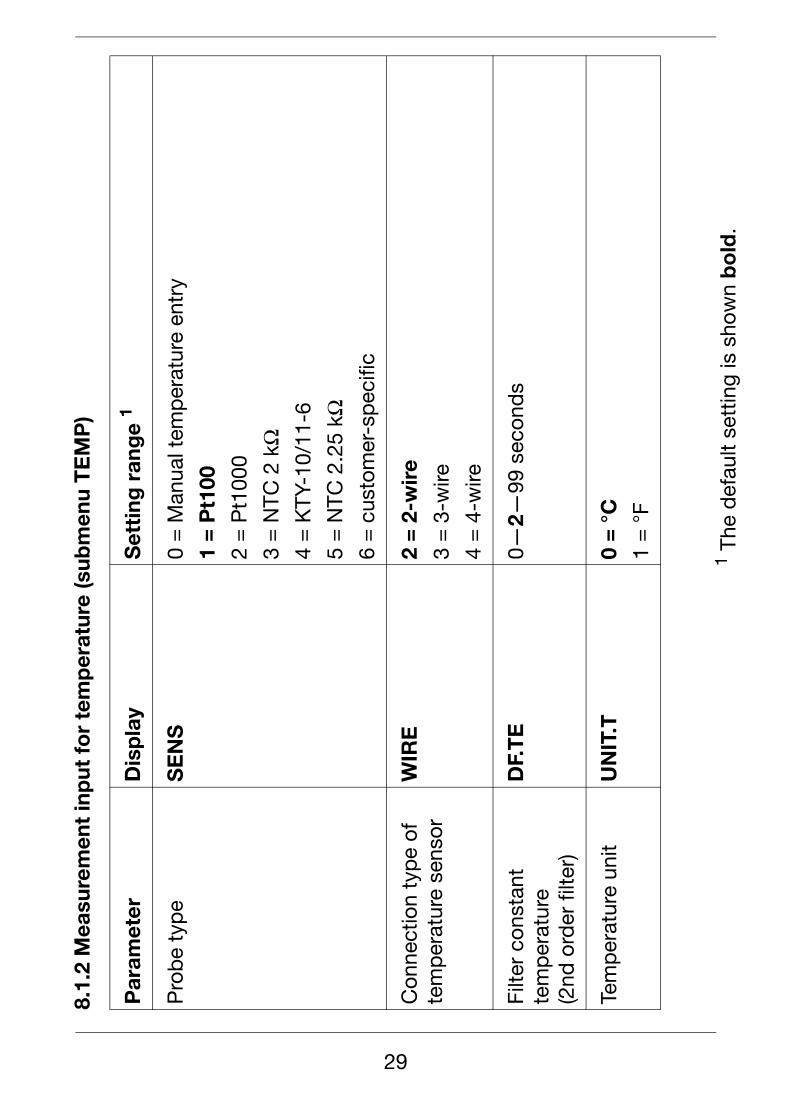
8.1.
2 M
easu
rem
ent
inp
ut f
or
tem
per
atur
e (s
ubm
enu
TE
MP
)
Par
amet
erD
isp
lay
Set
ting
ran
ge
1
Pro
be
typ
eS
EN
S0
= M
anua
l tem
per
atur
e en
try
1 =
Pt1
00
2 =
Pt1
000
3 =
NTC
2 k
Ω4
= K
TY-1
0/11
-6
5 =
NTC
2.2
5 kΩ
6 =
cus
tom
er-s
pec
ific
Con
nect
ion
typ
e of
te
mp
erat
ure
sens
orW
IRE
2 =
2-w
ire
3 =
3-w
ire
4 =
4-w
ire
Filte
r co
nsta
ntte
mp
erat
ure
(2nd
ord
er fi
lter)
DF.
TE
0—2—
99 s
econ
ds
Tem
per
atur
e un
itU
NIT
.T0
= °
C
1 =
°F
1
29
The
def
ault
sett
ing
is s
how
n b
old
.
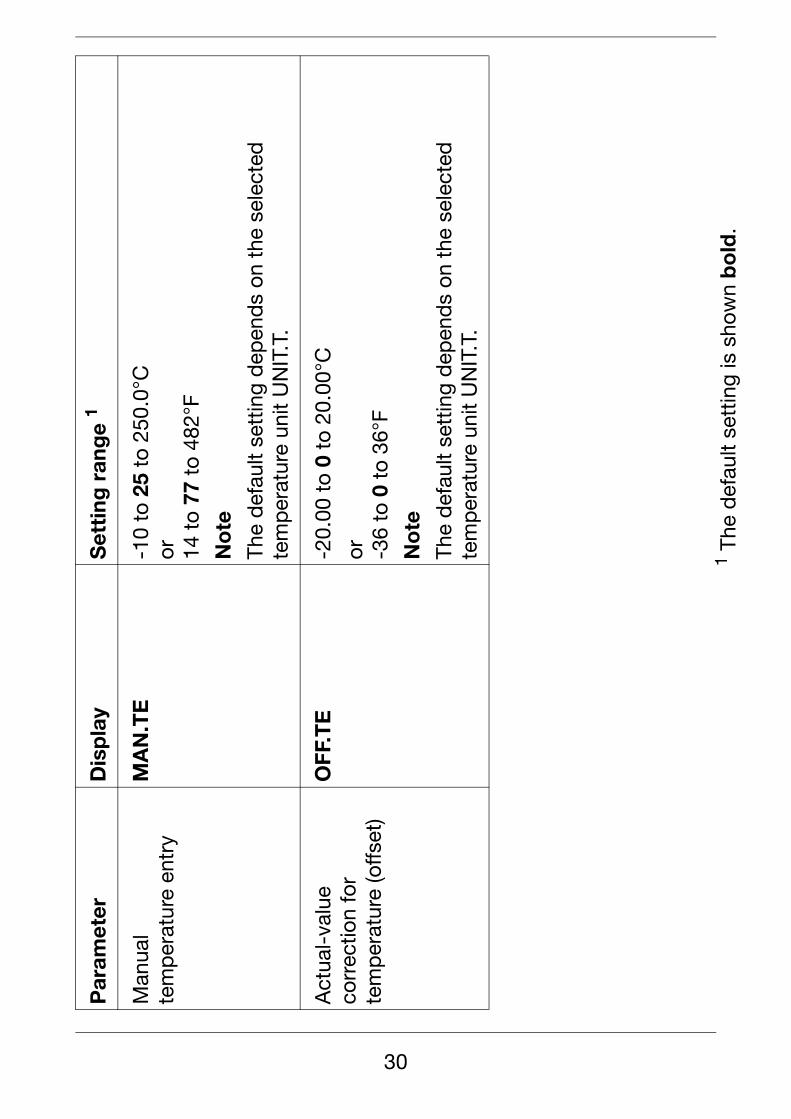
Man
ual
tem
per
atur
e en
try
MA
N.T
E-1
0 to
25
to 2
50.0
°C
or 14 t
o 77
to
482°
F
No
te
The
def
ault
sett
ing
dep
end
s on
the
sel
ecte
dte
mp
erat
ure
unit
UN
IT.T
.
Act
ual-
valu
e co
rrec
tion
for
tem
per
atur
e (o
ffset
)
OFF
.TE
-20.
00 t
o 0
to 2
0.00
°C
or -36
to 0
to
36°F
No
te
The
def
ault
sett
ing
dep
end
s on
the
sel
ecte
dte
mp
erat
ure
unit
UN
IT.T
.
Par
amet
erD
isp
lay
Set
ting
ran
ge
1
1
30
The
def
ault
sett
ing
is s
how
n bo
ld /
s
ee C
hapt
er 1
1 “R
elay
out
put /
ope
n-co
llect
or”,
pag
e 57
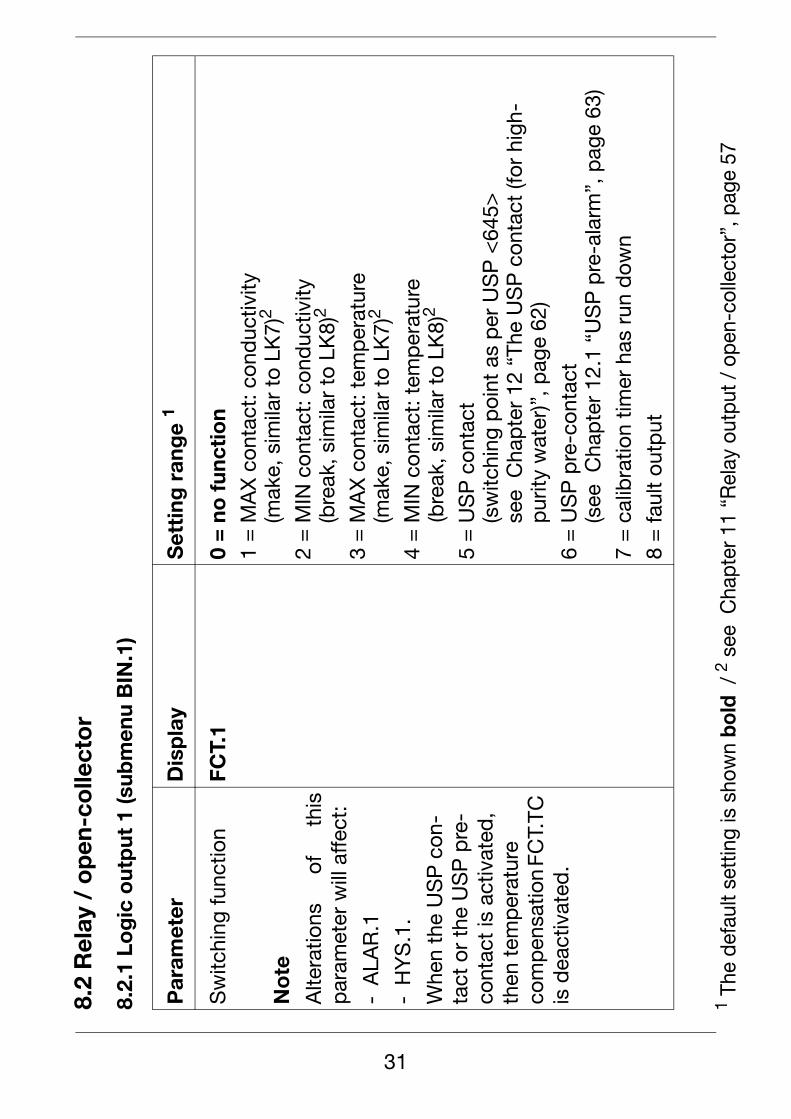
8.2
Rel
ay /
op
en-c
olle
cto
r
8.2.
1 Lo
gic
out
put
1 (s
ubm
enu
BIN
.1)
Par
amet
erD
isp
lay
Set
ting
ran
ge
1
Sw
itchi
ng fu
nctio
n
No
te
Alte
ratio
ns
of
this
par
amet
er w
ill a
ffect
:
-A
LAR
.1
-H
YS
.1.
Whe
n th
e U
SP
con
-ta
ct o
r th
e U
SP
pre
-co
ntac
t is
act
ivat
ed,
then
tem
per
atur
e co
mp
ensa
tion
FCT.
TC
is d
eact
ivat
ed.
FCT.
10
= n
o f
unct
ion
1 =
MA
X c
onta
ct: c
ond
uctiv
ity
(mak
e, s
imila
r to
LK
7)2
2 =
MIN
con
tact
: con
duc
tivity
(b
reak
, sim
ilar
to L
K8)
2
3 =
MA
X c
onta
ct: t
emp
erat
ure
(mak
e, s
imila
r to
LK
7)2
4 =
MIN
con
tact
: tem
per
atur
e (b
reak
, sim
ilar
to L
K8)
2
5 =
US
P c
onta
ct
(sw
itchi
ng p
oint
as
per
US
P <
645>
se
e C
hap
ter
12 “
The
US
P c
onta
ct (f
or h
igh-
pur
ity w
ater
)”, p
age
62)
6 =
US
P p
re-c
onta
ct
(see
Cha
pte
r 12
.1 “
US
P p
re-a
larm
”, p
age
63)
7 =
cal
ibra
tion
timer
has
run
dow
n8
= fa
ult
outp
ut
12
31
The
def
ault
sett
ing
is s
how
n b
old
.
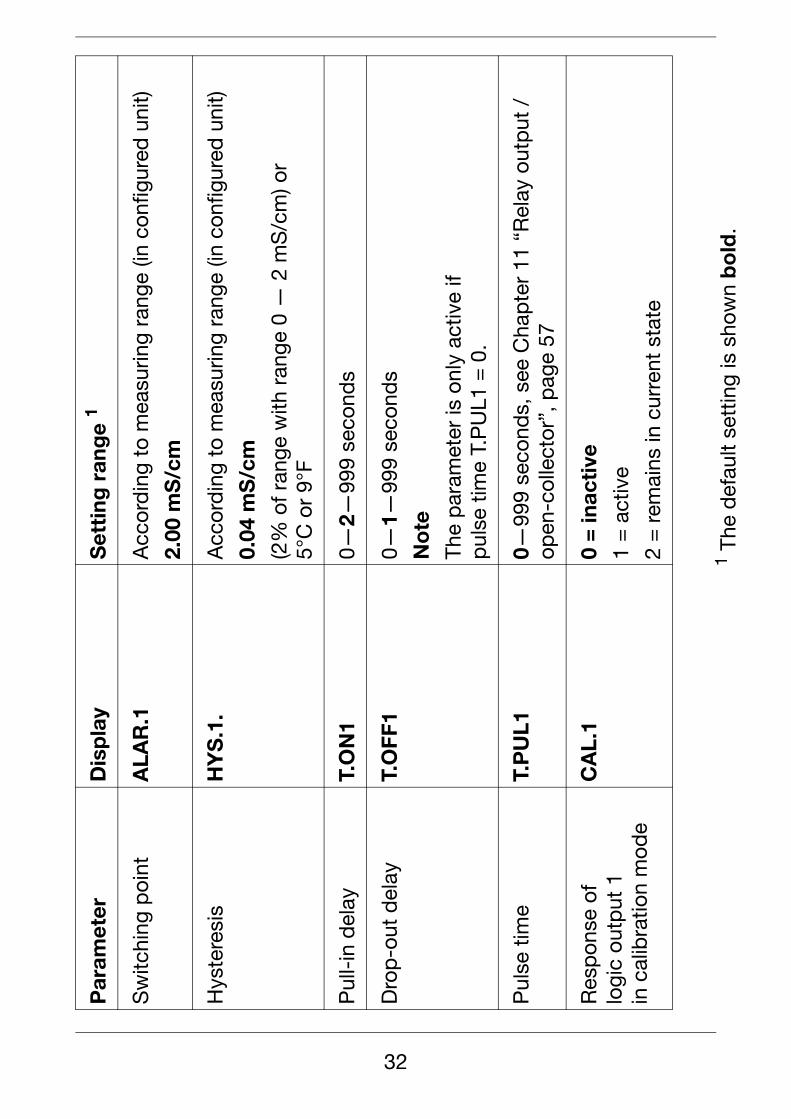
Sw
itchi
ng p
oint
ALA
R.1
Acc
ord
ing
to m
easu
ring
rang
e (in
con
figur
ed u
nit)
2.00
mS
/cm
Hys
tere
sis
HY
S.1
.A
ccor
din
g to
mea
surin
g ra
nge
(in c
onfig
ured
uni
t)
0.04
mS
/cm
(2%
of r
ange
with
ran
ge 0
— 2
mS
/cm
) or
5°C
or
9°F
Pul
l-in
del
ayT.
ON
10—
2—99
9 se
cond
s
Dro
p-o
ut d
elay
T.O
FF1
0—1—
999
seco
nds
No
te
The
par
amet
er is
onl
y ac
tive
ifp
ulse
tim
e T.
PU
L1 =
0.
Pul
se t
ime
T.P
UL1
0—99
9 se
cond
s, s
ee C
hap
ter
11 “
Rel
ay o
utp
ut /
op
en-c
olle
ctor
”, p
age
57
Res
pon
se o
flo
gic
outp
ut 1
in c
alib
ratio
n m
ode
CA
L.1
0 =
inac
tive
1 =
act
ive
2 =
rem
ains
in c
urre
nt s
tate
Par
amet
erD
isp
lay
Set
ting
ran
ge
1
1
32

The
def
ault
sett
ing
is s
how
n b
old
.
Res
pon
se t
o fa
ult
ER
R.1
0 =
inac
tive
1 =
act
ive
2 =
froz
en (r
elay
rem
ains
unc
hang
ed)
Man
ual m
ode
SIM
.1O
FF =
no
man
ual m
od
e
0 =
inac
tive
1 =
act
ive
US
P p
re-c
onta
ctS
.US
P1
0—20
—10
0%
No
te
If th
e U
SP
con
tact
or
the
US
P p
re-c
onta
ct is
ac
tivat
ed, t
emp
erat
ure
com
pen
satio
n FC
T.TC
is
dea
ctiv
ated
.
See
als
o C
hap
ter
12.1
“U
SP
pre
-ala
rm”,
pag
e 63
.
Par
amet
erD
isp
lay
Set
ting
ran
ge
1
1
33
The
def
ault
sett
ing
is s
how
n bo
ld /
s
ee C
hapt
er 1
1 “R
elay
out
put /
ope
n-co
llect
or”,
pag
e 57
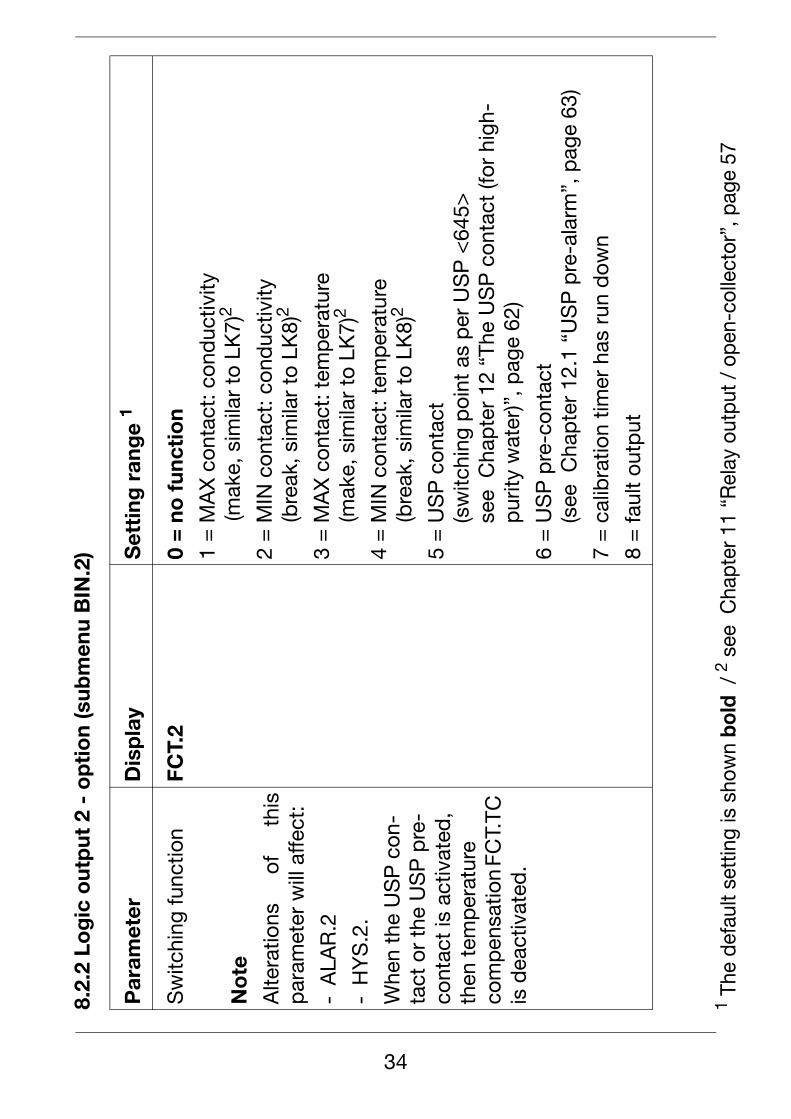
8.2.
2 Lo
gic
out
put
2 -
op
tio
n (s
ubm
enu
BIN
.2)
Par
amet
erD
isp
lay
Set
ting
ran
ge
1
Sw
itchi
ng fu
nctio
n
No
te
Alte
ratio
ns
of
this
par
amet
er w
ill a
ffect
:
-A
LAR
.2
-H
YS
.2.
Whe
n th
e U
SP
con
-ta
ct o
r th
e U
SP
pre
-co
ntac
t is
act
ivat
ed,
then
tem
per
atur
e co
mp
ensa
tion
FCT.
TC
is d
eact
ivat
ed.
FCT.
20
= n
o f
unct
ion
1 =
MA
X c
onta
ct: c
ond
uctiv
ity
(mak
e, s
imila
r to
LK
7)2
2 =
MIN
con
tact
: con
duc
tivity
(b
reak
, sim
ilar
to L
K8)
2
3 =
MA
X c
onta
ct: t
emp
erat
ure
(mak
e, s
imila
r to
LK
7)2
4 =
MIN
con
tact
: tem
per
atur
e (b
reak
, sim
ilar
to L
K8)
2
5 =
US
P c
onta
ct
(sw
itchi
ng p
oint
as
per
US
P <
645>
se
e C
hap
ter
12 “
The
US
P c
onta
ct (f
or h
igh-
pur
ity w
ater
)”, p
age
62)
6 =
US
P p
re-c
onta
ct
(see
Cha
pte
r 12
.1 “
US
P p
re-a
larm
”, p
age
63)
7 =
cal
ibra
tion
timer
has
run
dow
n
8 =
faul
t ou
tput
12
34
The
def
ault
sett
ing
is s
how
n b
old
.
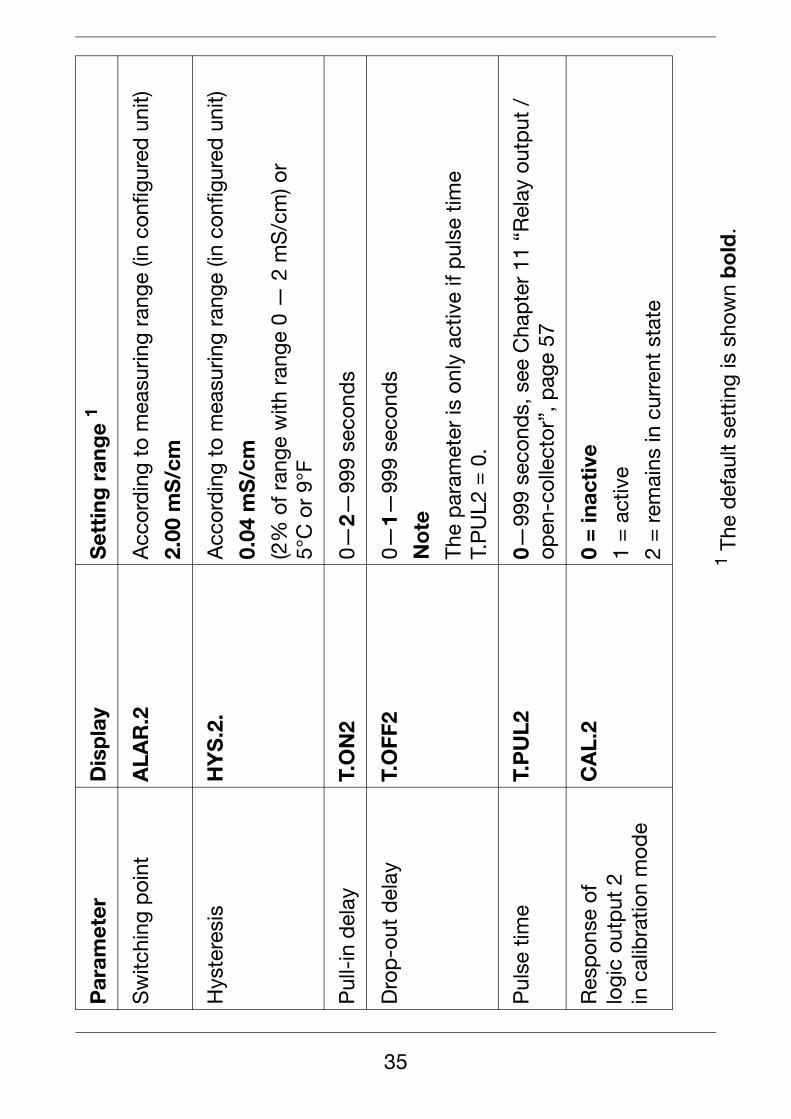
Sw
itchi
ng p
oint
ALA
R.2
Acc
ord
ing
to m
easu
ring
rang
e (in
con
figur
ed u
nit)
2.00
mS
/cm
Hys
tere
sis
HY
S.2
.A
ccor
din
g to
mea
surin
g ra
nge
(in c
onfig
ured
uni
t)
0.04
mS
/cm
(2%
of r
ange
with
ran
ge 0
— 2
mS
/cm
) or
5°C
or
9°F
Pul
l-in
del
ayT.
ON
20—
2—99
9 se
cond
s
Dro
p-o
ut d
elay
T.O
FF2
0—1—
999
seco
nds
No
te
The
par
amet
er is
onl
y ac
tive
if p
ulse
tim
eT.
PU
L2 =
0.
Pul
se t
ime
T.P
UL2
0—99
9 se
cond
s, s
ee C
hap
ter
11 “
Rel
ay o
utp
ut /
op
en-c
olle
ctor
”, p
age
57
Res
pon
se o
flo
gic
outp
ut 2
in c
alib
ratio
n m
ode
CA
L.2
0 =
inac
tive
1 =
act
ive
2 =
rem
ains
in c
urre
nt s
tate
Par
amet
erD
isp
lay
Set
ting
ran
ge
1
1
35
The
def
ault
sett
ing
is s
how
n b
old
.
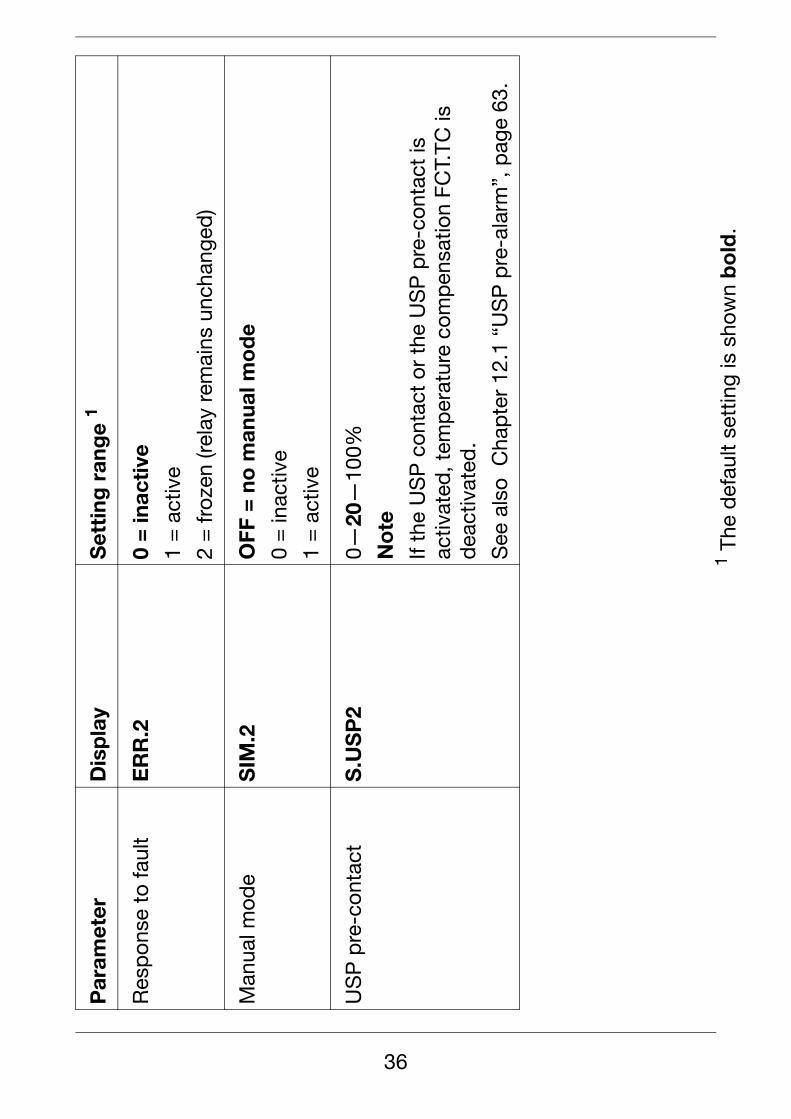
Res
pon
se t
o fa
ult
ER
R.2
0 =
inac
tive
1 =
act
ive
2 =
froz
en (r
elay
rem
ains
unc
hang
ed)
Man
ual m
ode
SIM
.2O
FF =
no
man
ual m
od
e
0 =
inac
tive
1 =
act
ive
US
P p
re-c
onta
ctS
.US
P2
0—20
—10
0%
No
te
If th
e U
SP
con
tact
or
the
US
P p
re-c
onta
ct is
ac
tivat
ed, t
emp
erat
ure
com
pen
satio
n FC
T.TC
is
dea
ctiv
ated
.
See
als
o C
hap
ter
12.1
“U
SP
pre
-ala
rm”,
pag
e 63
.
Par
amet
erD
isp
lay
Set
ting
ran
ge
1
1
36
The
def
ault
sett
ing
is s
how
n b
old
.
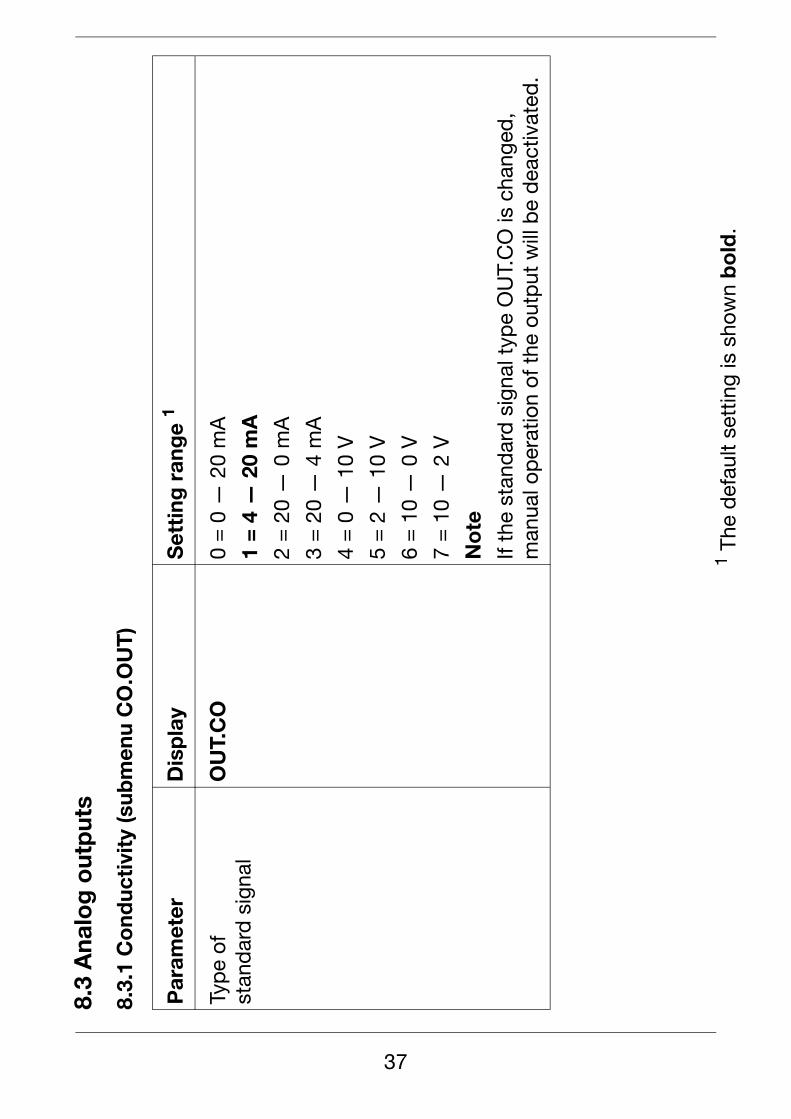
8.3
Ana
log
out
put
s
8.3.
1 C
ond
ucti
vity
(sub
men
u C
O.O
UT
)
Par
amet
erD
isp
lay
Set
ting
ran
ge
1
Typ
e of
stan
dar
d s
igna
lO
UT.
CO
0 =
0 —
20
mA
1 =
4 —
20
mA
2 =
20
— 0
mA
3 =
20
— 4
mA
4 =
0 —
10
V
5 =
2 —
10
V
6 =
10
— 0
V
7 =
10
— 2
V
No
te
If th
e st
and
ard
sig
nal t
ype
OU
T.C
O is
cha
nged
, m
anua
l op
erat
ion
of t
he o
utp
ut w
ill b
e d
eact
ivat
ed.
1
37
The
def
ault
sett
ing
is s
how
n b
old
.
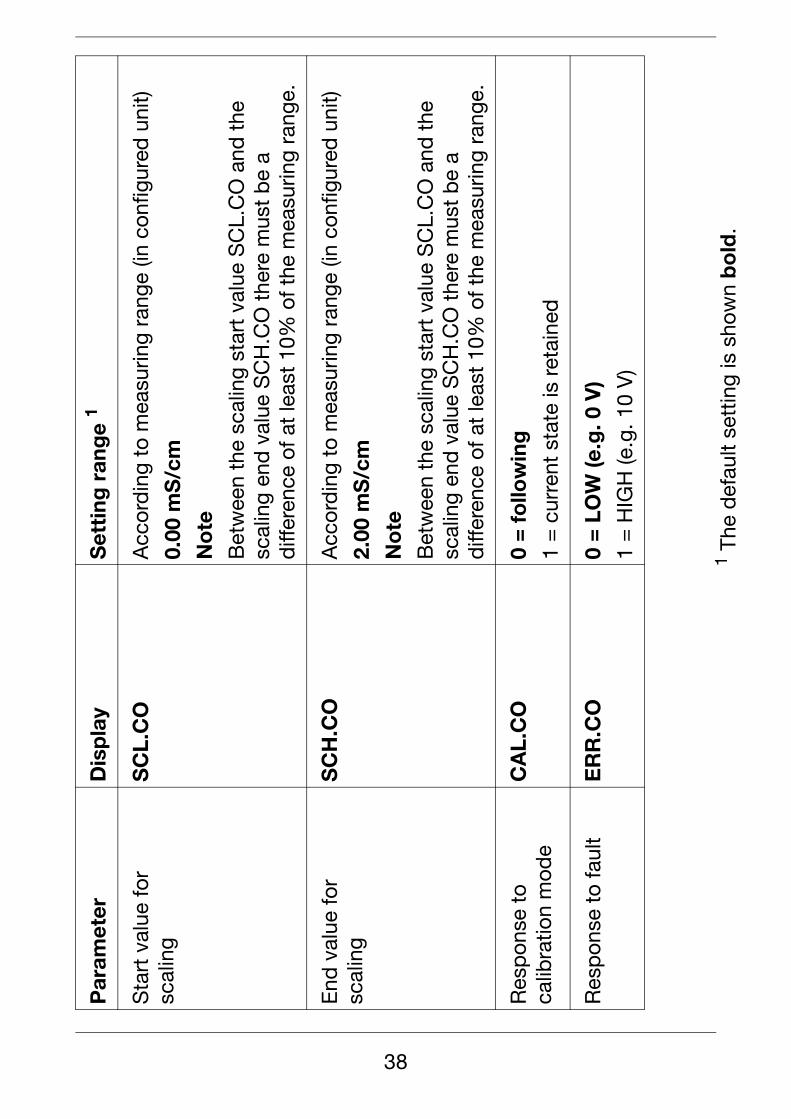
Sta
rt v
alue
for
scal
ing
SC
L.C
OA
ccor
din
g to
mea
surin
g ra
nge
(in c
onfig
ured
uni
t)
0.00
mS
/cm
No
te
Bet
wee
n th
e sc
alin
g st
art
valu
e S
CL.
CO
and
the
sc
alin
g en
d v
alue
SC
H.C
O t
here
mus
t b
e a
diff
eren
ce o
f at
leas
t 10
% o
f the
mea
surin
g ra
nge.
End
val
ue fo
rsc
alin
gS
CH
.CO
Acc
ord
ing
to m
easu
ring
rang
e (in
con
figur
ed u
nit)
2.00
mS
/cm
No
te
Bet
wee
n th
e sc
alin
g st
art
valu
e S
CL.
CO
and
the
sc
alin
g en
d v
alue
SC
H.C
O t
here
mus
t b
e a
diff
eren
ce o
f at
leas
t 10
% o
f the
mea
surin
g ra
nge.
Res
pon
se t
o ca
libra
tion
mod
eC
AL.
CO
0 =
fo
llow
ing
1 =
cur
rent
sta
te is
ret
aine
d
Res
pon
se t
o fa
ult
ER
R.C
O0
= L
OW
(e.g
. 0 V
)
1 =
HIG
H (e
.g. 1
0 V
)
Par
amet
erD
isp
lay
Set
ting
ran
ge
1
1
38
The
def
ault
sett
ing
is s
how
n b
old
.
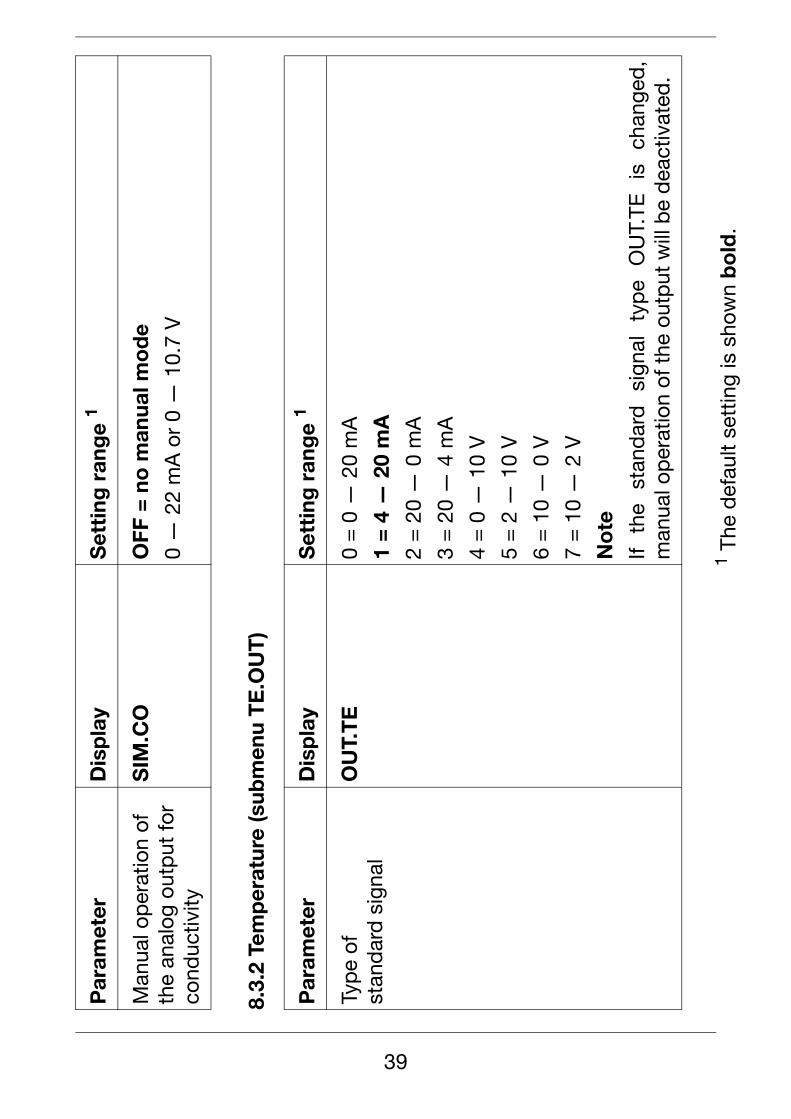
8.3.
2 Te
mp
erat
ure
(sub
men
u T
E.O
UT
)
Man
ual o
per
atio
n of
the
anal
og o
utp
ut fo
r co
nduc
tivity
SIM
.CO
OFF
= n
o m
anua
l mo
de
0 —
22
mA
or
0 —
10.
7 V
Par
amet
erD
isp
lay
Set
ting
ran
ge
1
Typ
e of
stan
dar
d s
igna
lO
UT.
TE
0 =
0 —
20
mA
1 =
4 —
20
mA
2 =
20
— 0
mA
3 =
20
— 4
mA
4 =
0 —
10
V
5 =
2 —
10
V
6 =
10
— 0
V
7 =
10
— 2
V
No
te
If th
e st
and
ard
si
gnal
ty
pe
OU
T.TE
is
ch
ange
d,
man
ual o
per
atio
n of
the
out
put
will
be
dea
ctiv
ated
.
Par
amet
erD
isp
lay
Set
ting
ran
ge
1
1
39
The
def
ault
sett
ing
is s
how
n b
old
.
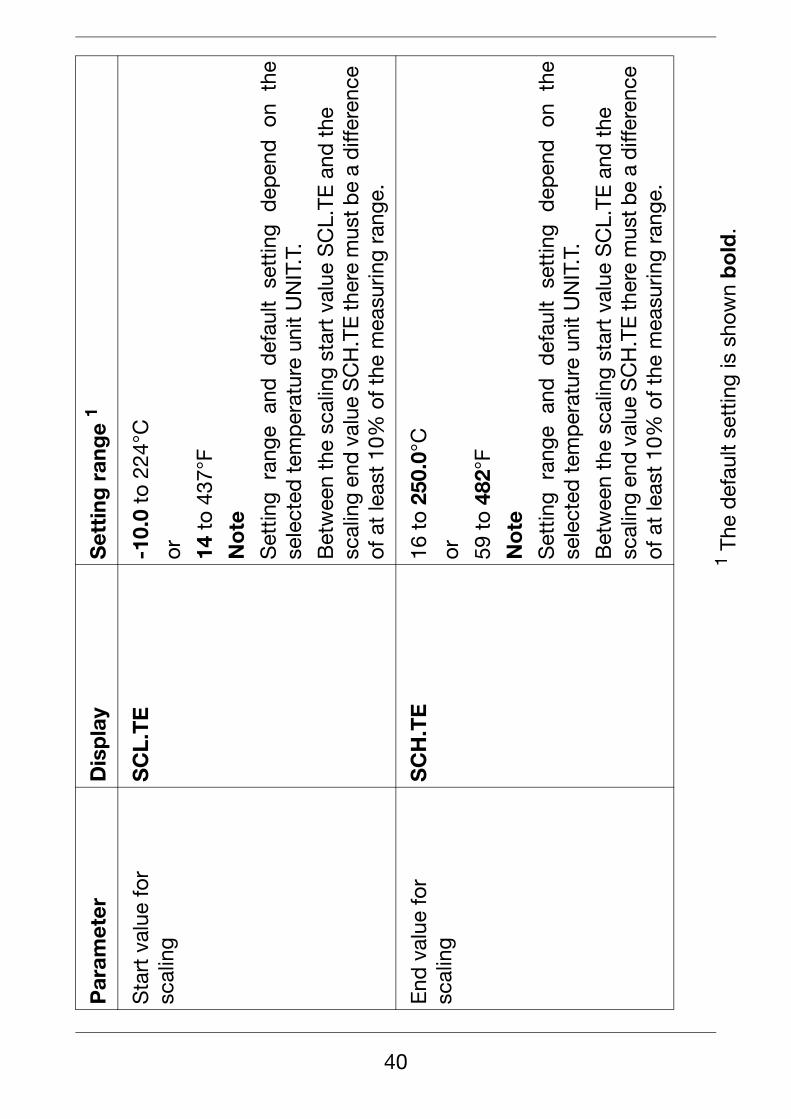
Sta
rt v
alue
for
scal
ing
SC
L.T
E-1
0.0
to 2
24°C
or 14 t
o 43
7°F
No
te
Set
ting
rang
e an
d d
efau
lt se
ttin
g d
epen
d o
n th
ese
lect
ed t
emp
erat
ure
unit
UN
IT.T
.
Bet
wee
n th
e sc
alin
g st
art
valu
e S
CL.
TE a
nd t
he
scal
ing
end
val
ue S
CH
.TE
ther
e m
ust b
e a
diff
eren
ce
of a
t le
ast
10%
of t
he m
easu
ring
rang
e.
End
val
ue fo
rsc
alin
gS
CH
.TE
16 t
o 25
0.0°
C
or 59 t
o 48
2°F
No
te
Set
ting
rang
e an
d d
efau
lt se
ttin
g d
epen
d o
n th
ese
lect
ed t
emp
erat
ure
unit
UN
IT.T
.
Bet
wee
n th
e sc
alin
g st
art
valu
e S
CL.
TE a
nd t
he
scal
ing
end
val
ue S
CH
.TE
ther
e m
ust b
e a
diff
eren
ce
of a
t le
ast
10%
of t
he m
easu
ring
rang
e.
Par
amet
erD
isp
lay
Set
ting
ran
ge
1
1
40
The
def
ault
sett
ing
is s
how
n b
old
.
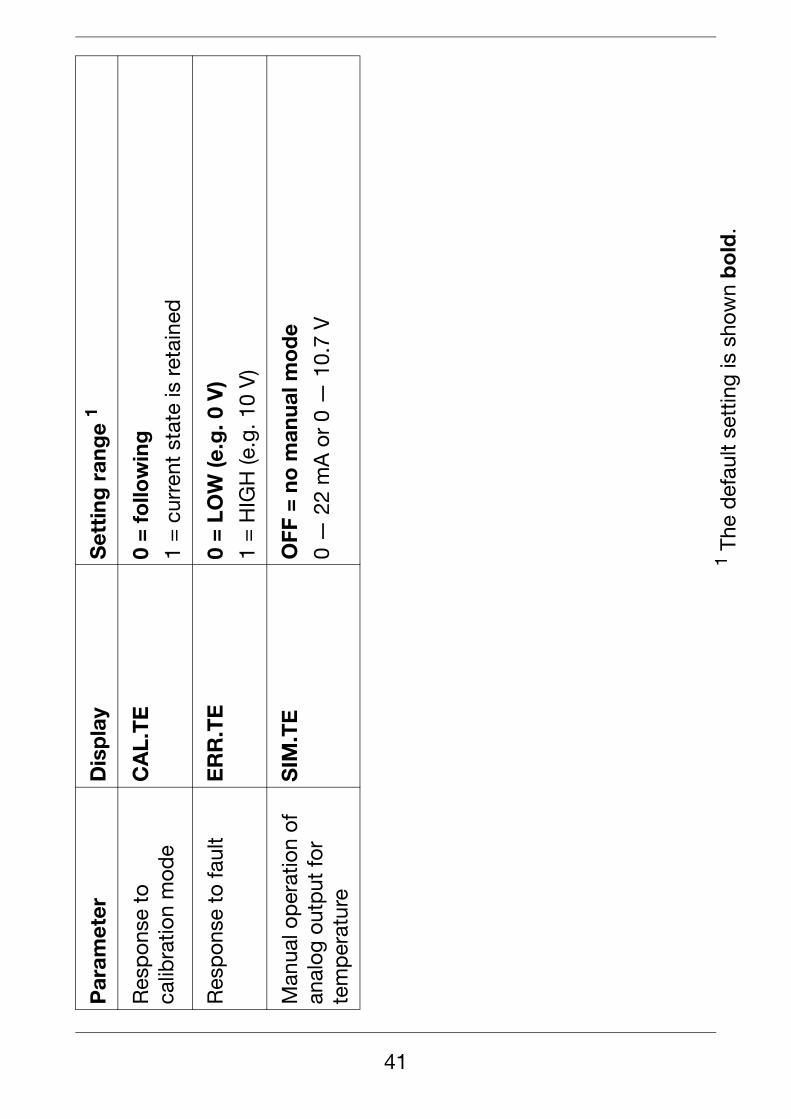
Res
pon
se t
o ca
libra
tion
mod
eC
AL.
TE
0 =
fo
llow
ing
1 =
cur
rent
sta
te is
ret
aine
d
Res
pon
se t
o fa
ult
ER
R.T
E0
= L
OW
(e.g
. 0 V
)
1 =
HIG
H (e
.g. 1
0 V
)
Man
ual o
per
atio
n of
anal
og o
utp
ut fo
r te
mp
erat
ure
SIM
.TE
OFF
= n
o m
anua
l mo
de
0 —
22
mA
or
0 —
10.
7 V
Par
amet
erD
isp
lay
Set
ting
ran
ge
1
1
41
9 Calibration
9.1 General
The cell constants of conductivity cells stray somewhat depending on the type and additionally change during operation (due to deposits such as lime, or as a result of wear). This results in a change of the output signal from the cell. It is therefore necessary that the user is able to compensate for the deviations of the cell constant from the nominal value, either by manual entry or an automatic calibration of the cell constant Krel.
The conductivity of a solution varies with the temperature, so for correct measurement both the temperature and the temperature coefficient of the solution being measured must be known. The temperature can either be measured automatically with a temperature sensor, or set manually by the user. The temperature coefficient can be determined automatically by the conductivity transmitter, or entered manually.
The device uses the non-temperature compensated measurements (TC = 0) at two different temperatures (the reference temperature, e.g. 25°C, and a second temperature that will later on be the working temperature) to determine the temperature coefficient of the solution being measured.
The time intervals between calibrations depend on the conditions in which the cell is used.The device can draw your attention to a scheduled calibration by means of the calibration timer.see Chapter 13.7 “Calibration timer has run down”, page 65.
42
9.1.1 Measurements in highly-purified waterMeasurements in highly-purified water (measured values < approx. 10 µS/cm) make special demands on the metrology and the measurement environment.
The following points should therefore be considered and checked first before attempting a calibration:
- Basically sensors with ASTM certificate are recommended for measurements in highly-purified water. Their cell constants are measured by the manufacturer and can be found in the certificate.
- Ready-to-use calibration solutions in the range < 5 µS/cm are difficult or impossible to get. Effort and error rate are very high when handling these.
- Reliable comparative measurements are often problematic due to unknown or insufficient quality of the comparison device. In addition, the reference junction is often not close enough to the actual measuring point.
- When wiring pay attention to shielding and grounding and make sure that the conduction paths are short.
- If minor measurement errors exist despite of entering the exact cell constant, these can manually be adjusted in the range of several percent by changing the relative cell constant. Possible causes are installation conditions and flow dependencies.
- Larger deviations (> approx. 10 %) mostly have other causes, such as contamination of the sensor by mishandling or EMC.
More information on highly-purified water measurementin form of a scientific paper can be found on the Internetat www.jumo.de.
For this purpose, enter the keyword "FAS 614" into thesearch box.
43
9.2 Activating the calibration mode
✱ Press the + keys
or
✱ Change to the calibration level through the menusee Chapter 6.4 “Level selection”, page 17
The setup interface and the measurement inputs for conductivity and temperature are not electrically isolated. This means that, in unfavorable conditions, equalizing currents may flow when the PC interface is connected. These equalizing currents may result in damage to the devices connected.However, there is no danger if the measurement circuit of the transmitter is electrically isolated from ground. If this is not assured, then one of the following safety measures should be taken:
1) Use a computer without electrical coupling to ground (e.g. battery-operated notebook).The computer must not be connected to a network.
2) Disconnect the measurement inputs of thetransmitter before connecting the PC interface.
The device can be calibrated through the setupprogram or from the device keys.
The temperature coefficient and cell constant canalso be manually entered.
The time-out function is not active during calibration!
Calibration mode activation from the keys must beenabled:
Press > 2 sec / set ADMIN / CAL / CA.LVL to 1.
P
P
44
or Chapter 6.8 “The calibration level (CALIB)”, page 21
or
✱ Start the calibration in the setup program.
9.3 Selecting the calibration procedure
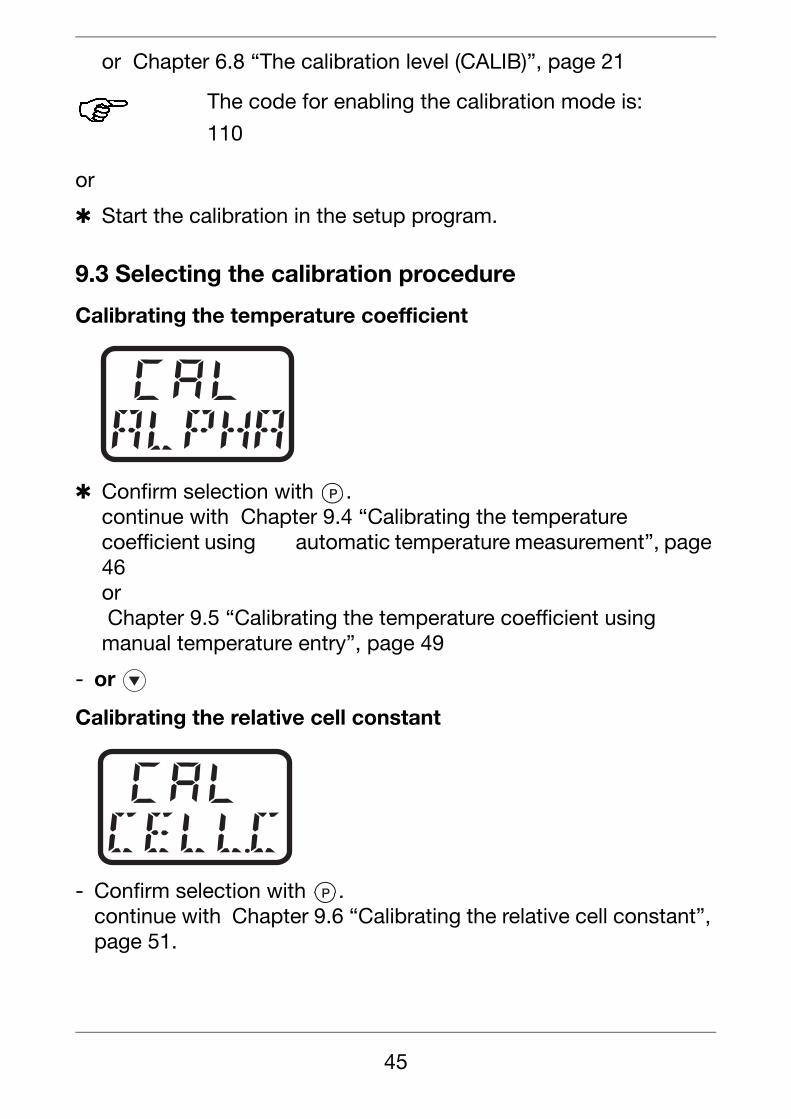
Calibrating the temperature coefficient
✱ Confirm selection with .continue with Chapter 9.4 “Calibrating the temperature coefficient using automatic temperature measurement”, page 46or Chapter 9.5 “Calibrating the temperature coefficient using manual temperature entry”, page 49
- or
Calibrating the relative cell constant
- Confirm selection with .continue with Chapter 9.6 “Calibrating the relative cell constant”, page 51.
The code for enabling the calibration mode is:
110
P
P
45
9.4 Calibrating the temperature coefficient usingautomatic temperature measurement
Note
During calibration, the reference temperature and the working temperature can be approached in any sequence.
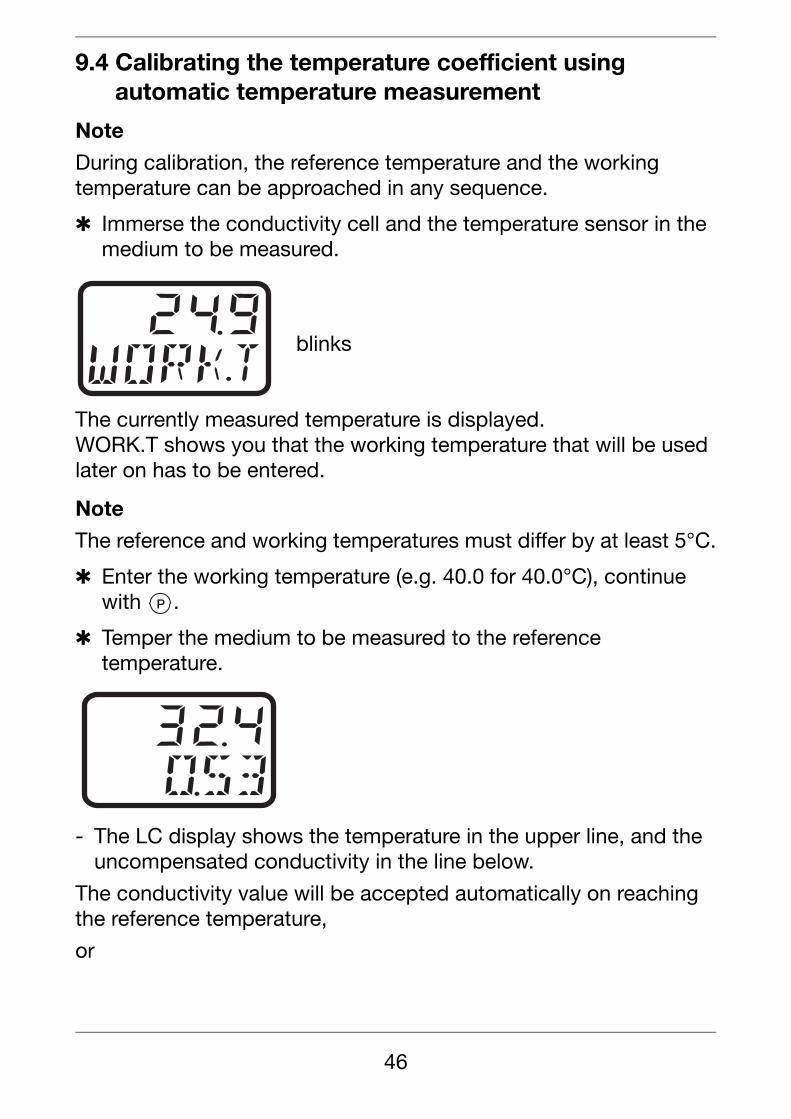
✱ Immerse the conductivity cell and the temperature sensor in the medium to be measured.
The currently measured temperature is displayed.WORK.T shows you that the working temperature that will be used later on has to be entered.
Note
The reference and working temperatures must differ by at least 5°C.
✱ Enter the working temperature (e.g. 40.0 for 40.0°C), continue with .
✱ Temper the medium to be measured to the reference temperature.
- The LC display shows the temperature in the upper line, and the uncompensated conductivity in the line below.
The conductivity value will be accepted automatically on reaching the reference temperature,
or
blinks
P
46
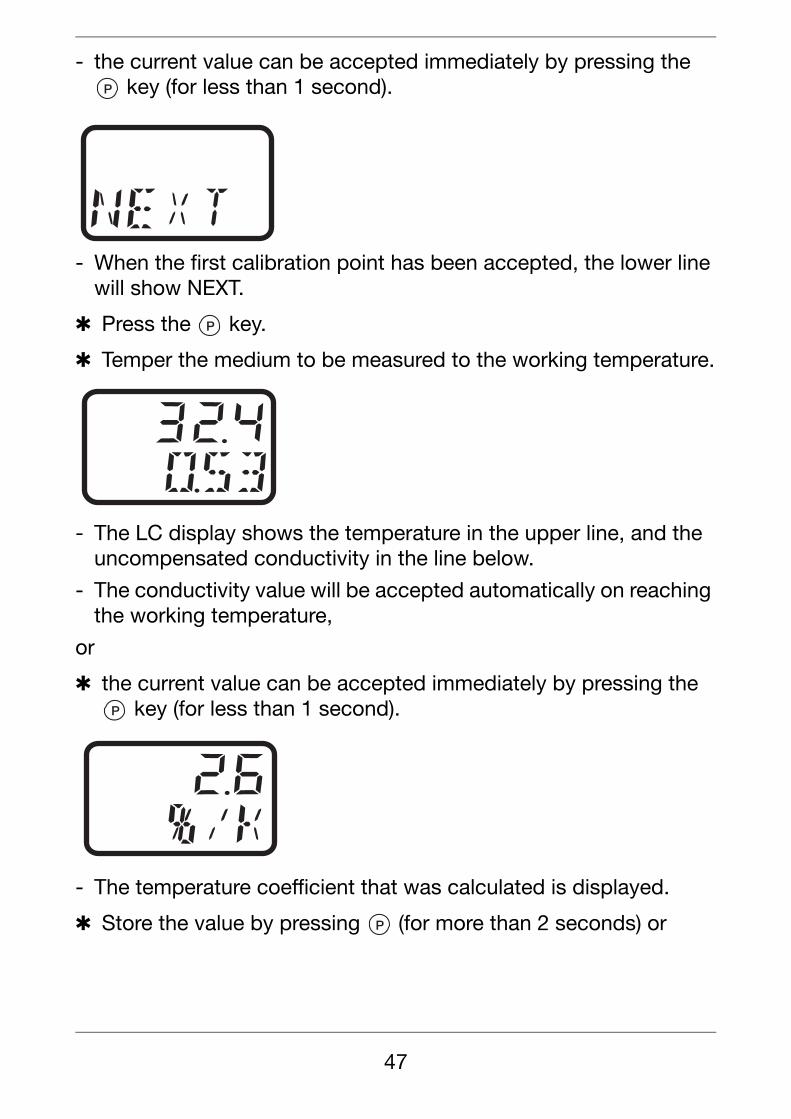
- the current value can be accepted immediately by pressing the key (for less than 1 second).
- When the first calibration point has been accepted, the lower line will show NEXT.
✱ Press the key.
✱ Temper the medium to be measured to the working temperature.
- The LC display shows the temperature in the upper line, and the uncompensated conductivity in the line below.
- The conductivity value will be accepted automatically on reaching the working temperature,
or
✱ the current value can be accepted immediately by pressing the key (for less than 1 second).
- The temperature coefficient that was calculated is displayed.
✱ Store the value by pressing (for more than 2 seconds) or
P
P
P
P
47
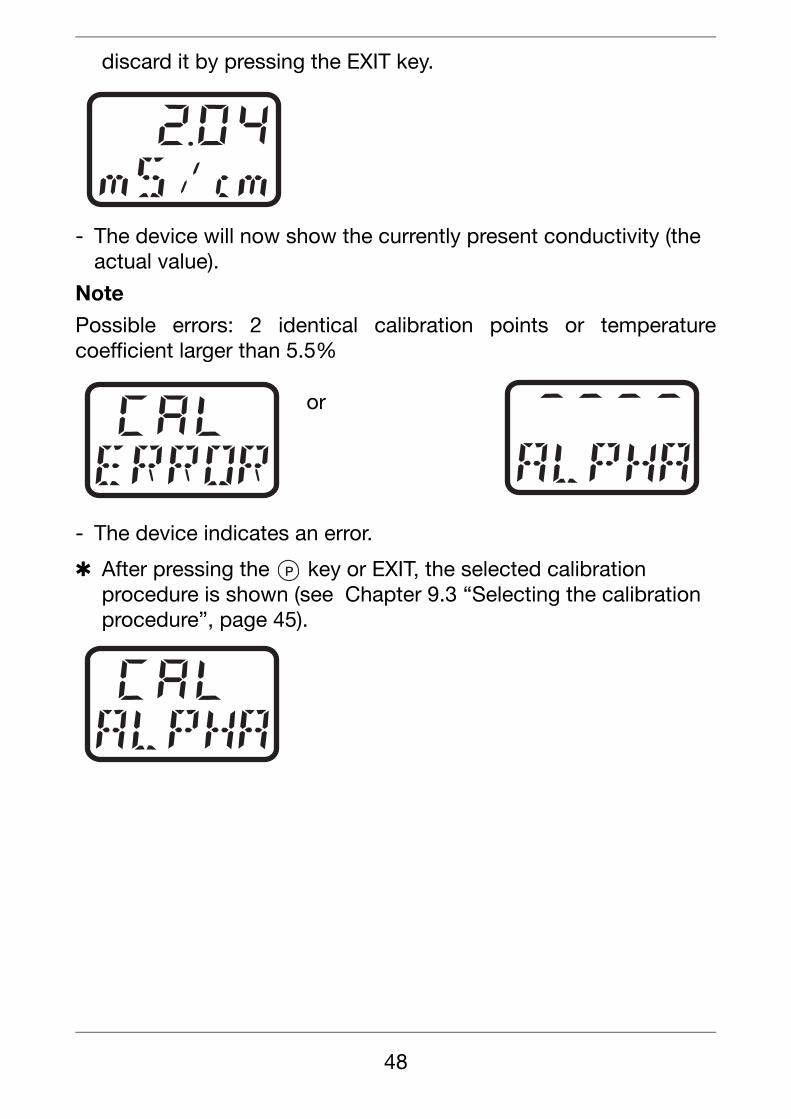
discard it by pressing the EXIT key.
- The device will now show the currently present conductivity (the actual value).
Note
Possible errors: 2 identical calibration points or temperaturecoefficient larger than 5.5%
- The device indicates an error.
✱ After pressing the key or EXIT, the selected calibration procedure is shown (see Chapter 9.3 “Selecting the calibration procedure”, page 45).
or
P
48
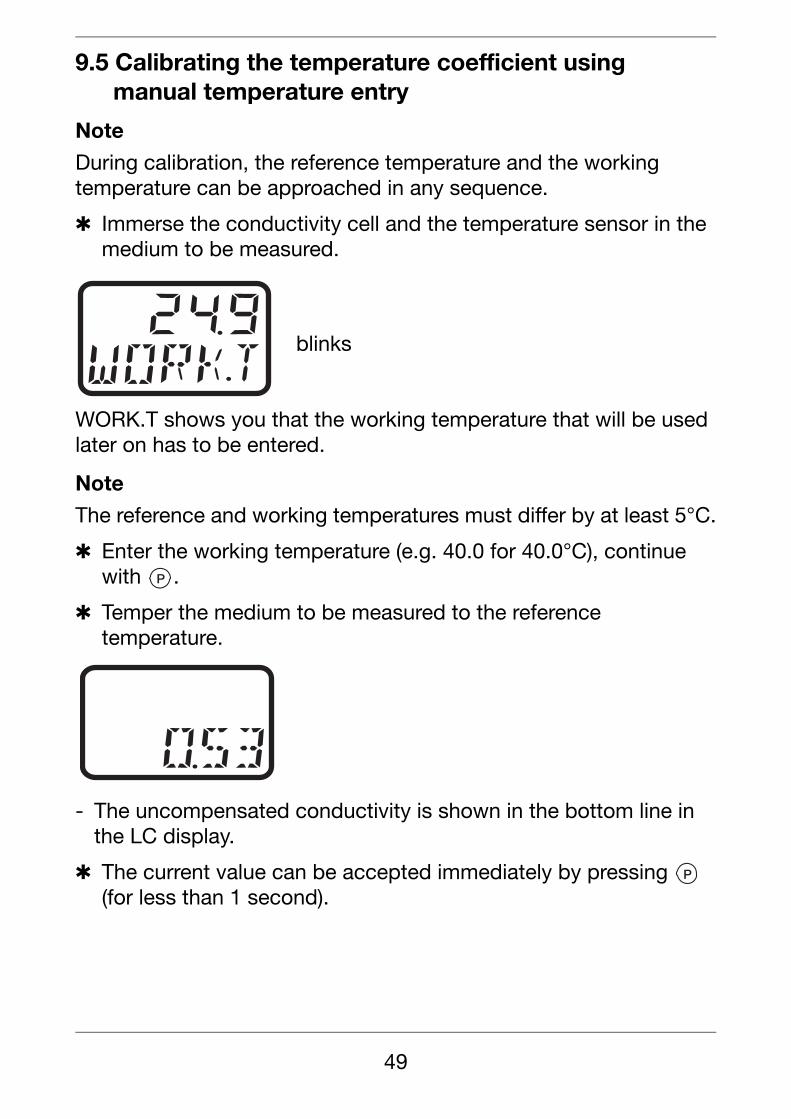
9.5 Calibrating the temperature coefficient usingmanual temperature entry
Note
During calibration, the reference temperature and the working temperature can be approached in any sequence.
✱ Immerse the conductivity cell and the temperature sensor in the medium to be measured.
WORK.T shows you that the working temperature that will be used later on has to be entered.
Note
The reference and working temperatures must differ by at least 5°C.
✱ Enter the working temperature (e.g. 40.0 for 40.0°C), continue with .
✱ Temper the medium to be measured to the reference temperature.
- The uncompensated conductivity is shown in the bottom line in the LC display.
✱ The current value can be accepted immediately by pressing (for less than 1 second).
blinks
P
P
49
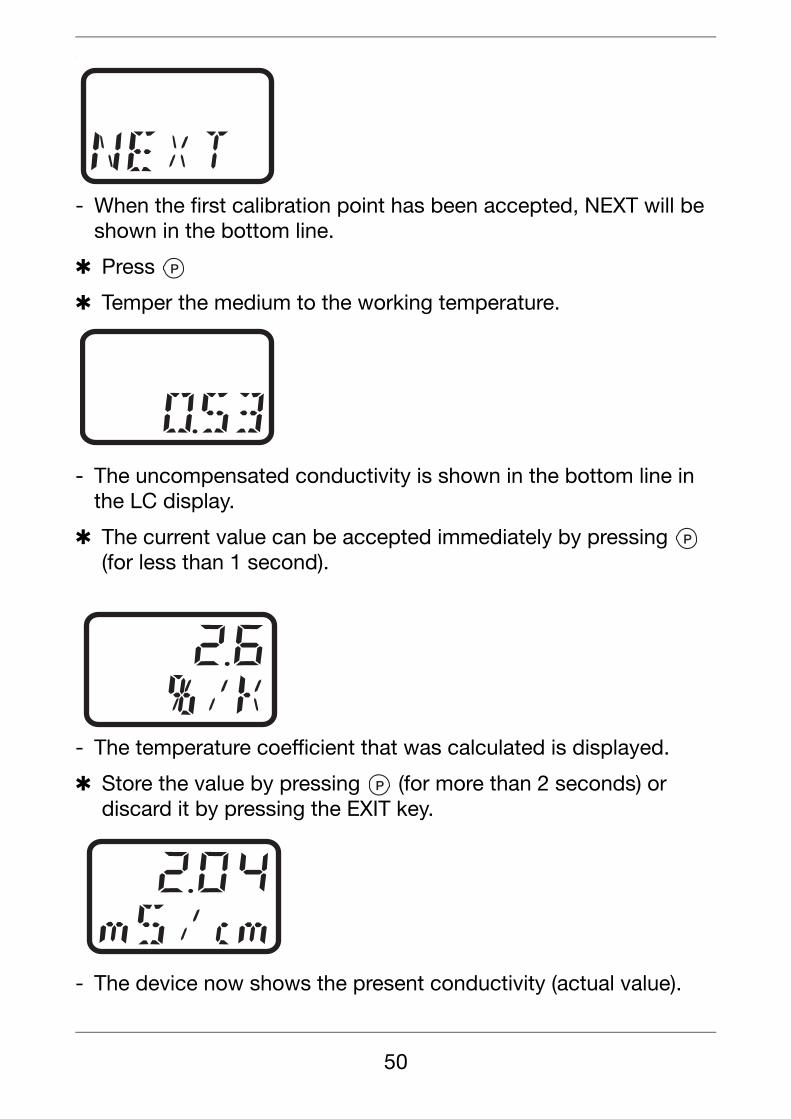
.
- When the first calibration point has been accepted, NEXT will be shown in the bottom line.
✱ Press
✱ Temper the medium to the working temperature.
- The uncompensated conductivity is shown in the bottom line in the LC display.
✱ The current value can be accepted immediately by pressing (for less than 1 second).
- The temperature coefficient that was calculated is displayed.
✱ Store the value by pressing (for more than 2 seconds) or discard it by pressing the EXIT key.
- The device now shows the present conductivity (actual value).
P
P
P
50
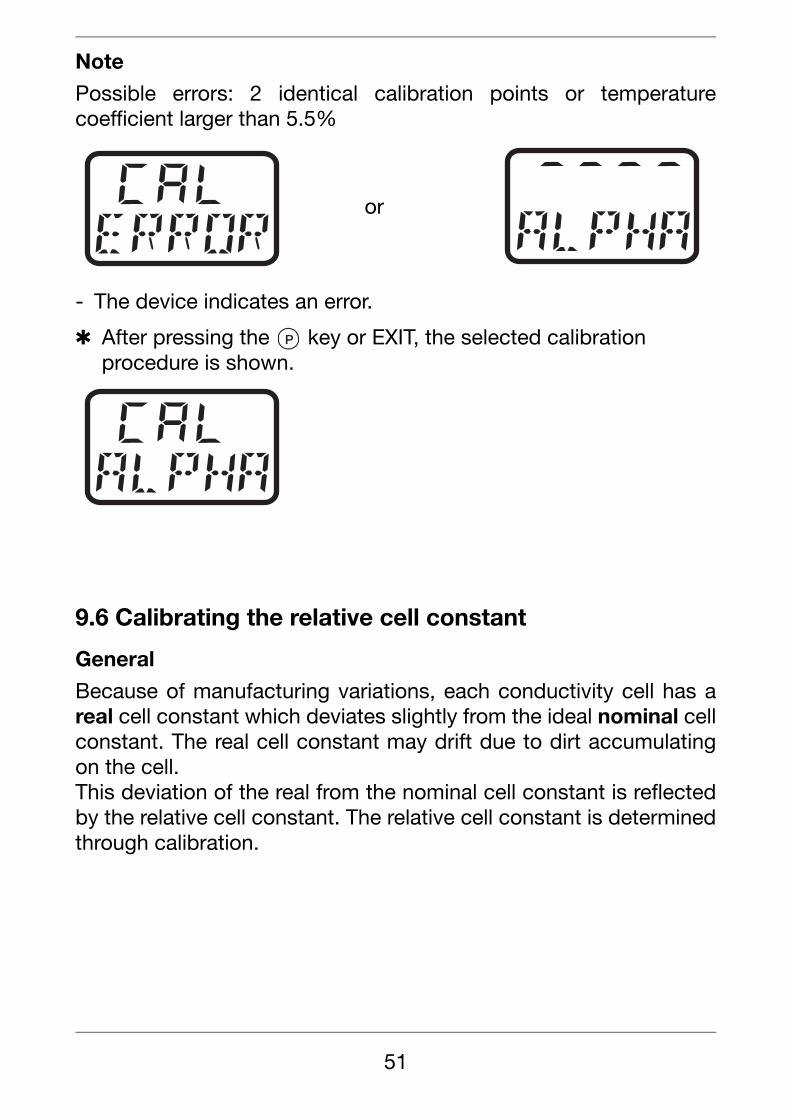
Note
Possible errors: 2 identical calibration points or temperaturecoefficient larger than 5.5%
- The device indicates an error.
✱ After pressing the key or EXIT, the selected calibration procedure is shown.
9.6 Calibrating the relative cell constant
General
Because of manufacturing variations, each conductivity cell has areal cell constant which deviates slightly from the ideal nominal cellconstant. The real cell constant may drift due to dirt accumulatingon the cell.This deviation of the real from the nominal cell constant is reflectedby the relative cell constant. The relative cell constant is determinedthrough calibration.
or
P
51
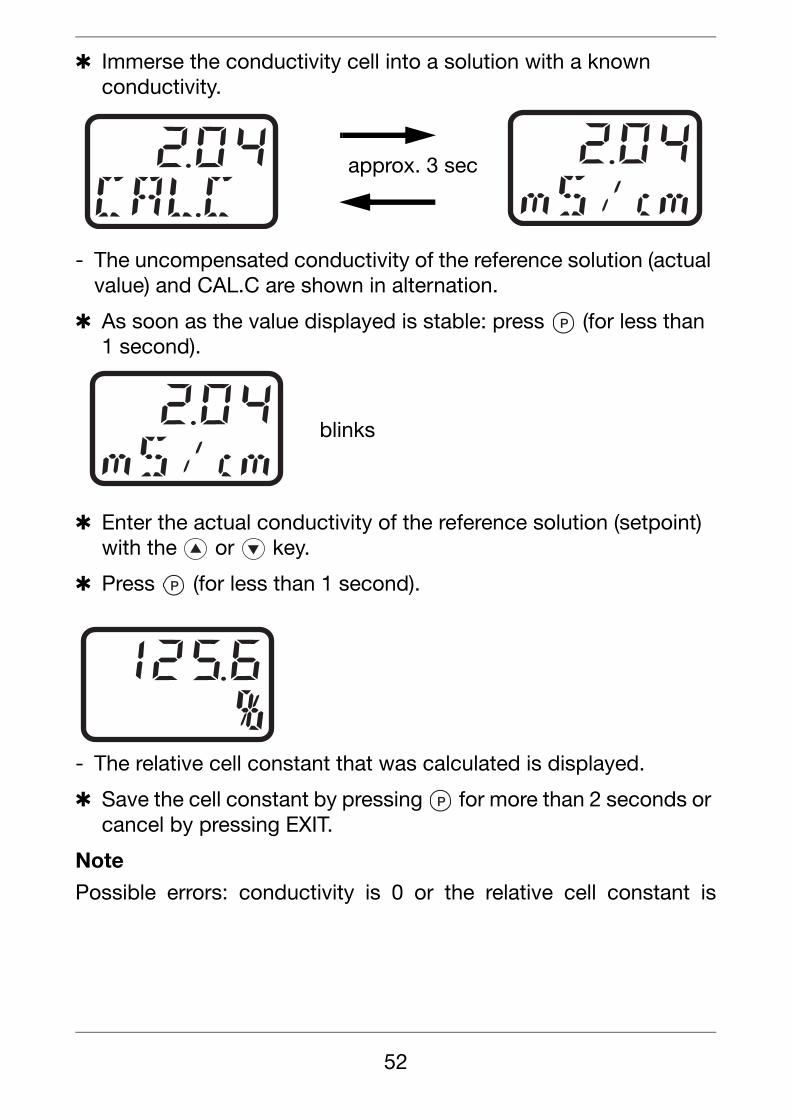
✱ Immerse the conductivity cell into a solution with a known conductivity.
- The uncompensated conductivity of the reference solution (actual value) and CAL.C are shown in alternation.
✱ As soon as the value displayed is stable: press (for less than1 second).
✱ Enter the actual conductivity of the reference solution (setpoint) with the or key.
✱ Press (for less than 1 second).
- The relative cell constant that was calculated is displayed.
✱ Save the cell constant by pressing for more than 2 seconds or cancel by pressing EXIT.
Note
Possible errors: conductivity is 0 or the relative cell constant is
approx. 3 sec
P
blinks
P
P
52
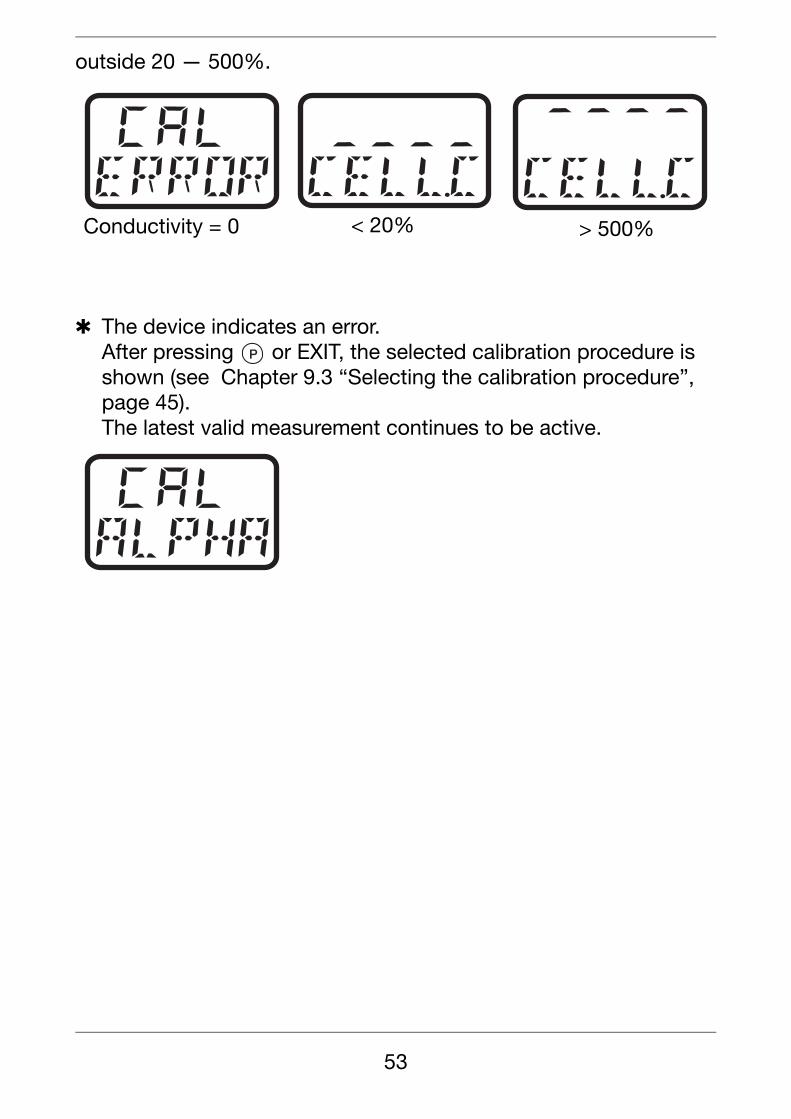
outside 20 — 500%.
✱ The device indicates an error.After pressing or EXIT, the selected calibration procedure is shown (see Chapter 9.3 “Selecting the calibration procedure”, page 45).The latest valid measurement continues to be active.
< 20%Conductivity = 0 > 500%
P
53
10 Analog output
10.1 Response of the output signal during calibrationYou can choose between “following” or “unchanged” (constant).
10.2 Response of the output signal to a fault conditionIf any of the following errors occurs, the output signal moves to adefined state (see Chapter 10.3 “Output signal in fault condition”,page 55) :
Analog output for conductivity with inactive temperaturecompensation
- Underrange, conductivity
- Overrange, conductivity
Analog output for conductivity with active temperaturecompensation
- Underrange, conductivity
- Overrange, conductivity
- Underrange, temperature
- Overrange, temperature
Analog output for temperature
- Underrange, temperature
- Overrange, temperature
The analog outputs are configured at the operatorlevel (USER) or the administrator level (ADMIN) inCO.OUT (conductivity output) and TE.OUT(temperature output) see Chapter 6.5 “The operatorlevel (USER)”, page 18.
54
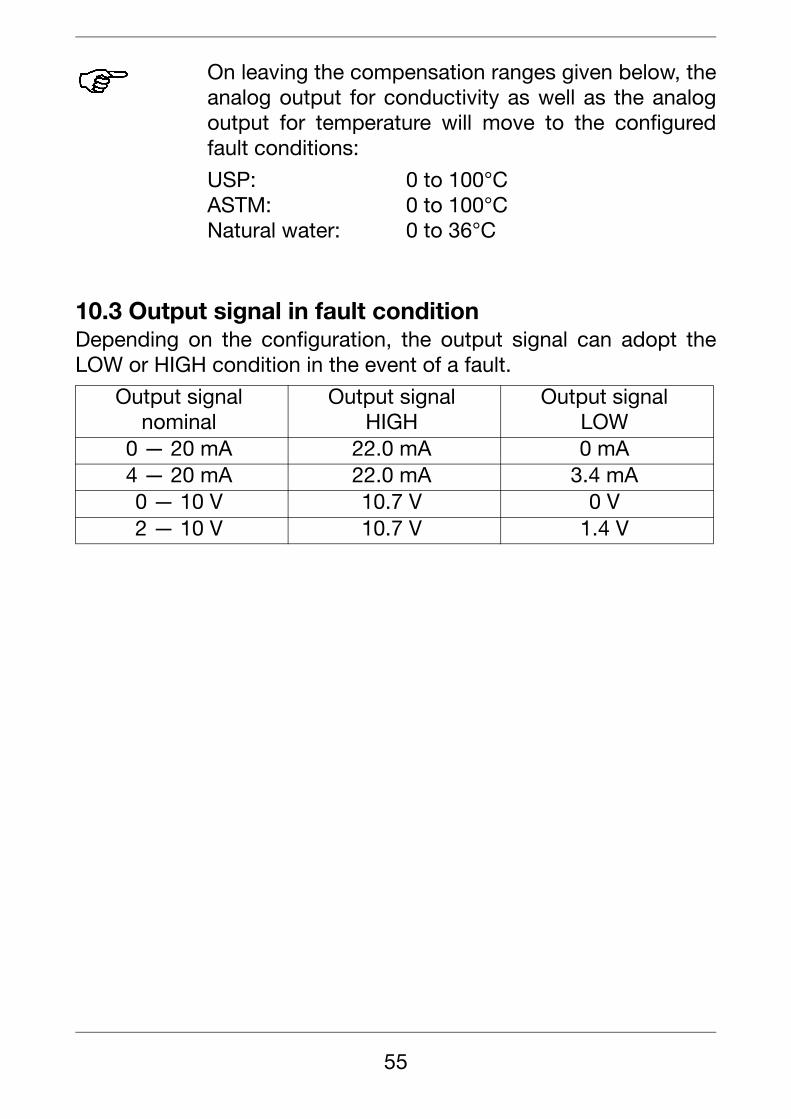
10.3 Output signal in fault conditionDepending on the configuration, the output signal can adopt theLOW or HIGH condition in the event of a fault.
On leaving the compensation ranges given below, theanalog output for conductivity as well as the analogoutput for temperature will move to the configuredfault conditions:
USP: 0 to 100°CASTM: 0 to 100°CNatural water: 0 to 36°C
Output signalnominal
Output signalHIGH
Output signalLOW
0 — 20 mA 22.0 mA 0 mA4 — 20 mA 22.0 mA 3.4 mA0 — 10 V 10.7 V 0 V2 — 10 V 10.7 V 1.4 V
55
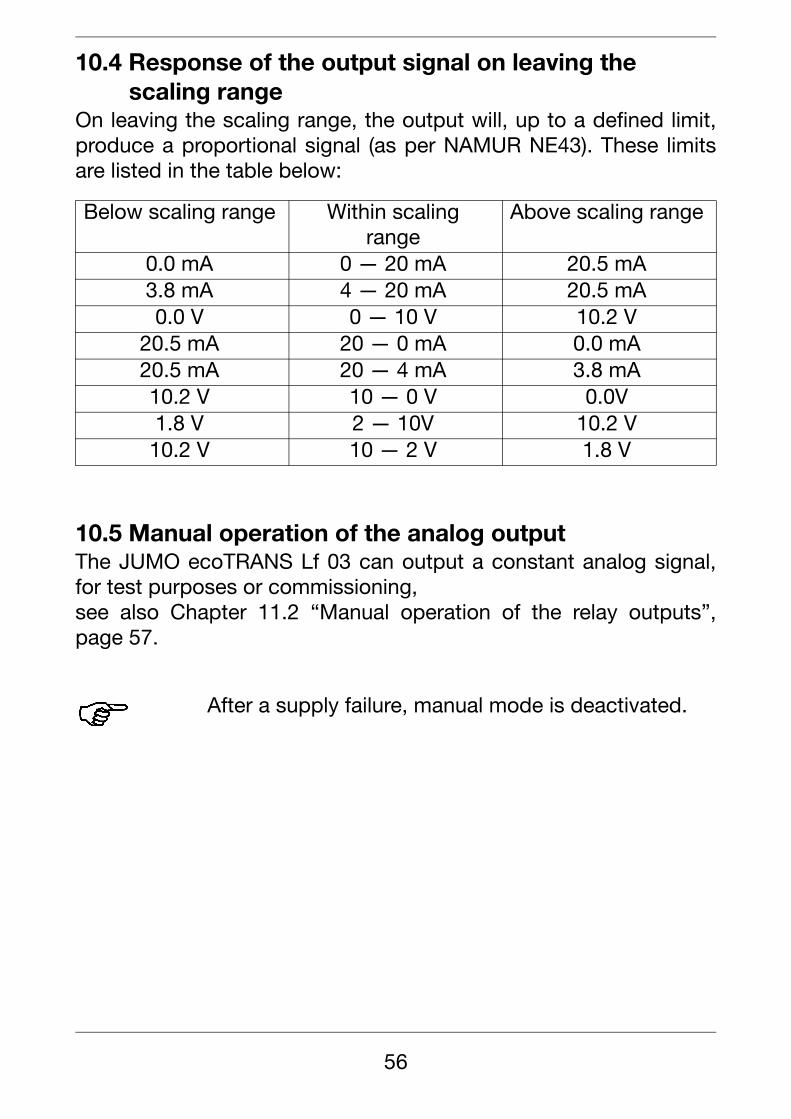
10.4 Response of the output signal on leaving thescaling range
On leaving the scaling range, the output will, up to a defined limit,produce a proportional signal (as per NAMUR NE43). These limitsare listed in the table below:
10.5 Manual operation of the analog outputThe JUMO ecoTRANS Lf 03 can output a constant analog signal,for test purposes or commissioning,see also Chapter 11.2 “Manual operation of the relay outputs”,page 57.
Below scaling range Within scalingrange
Above scaling range
0.0 mA 0 — 20 mA 20.5 mA3.8 mA 4 — 20 mA 20.5 mA0.0 V 0 — 10 V 10.2 V
20.5 mA 20 — 0 mA 0.0 mA20.5 mA 20 — 4 mA 3.8 mA10.2 V 10 — 0 V 0.0V1.8 V 2 — 10V 10.2 V
10.2 V 10 — 2 V 1.8 V
After a supply failure, manual mode is deactivated.
56
11 Relay output / open-collector
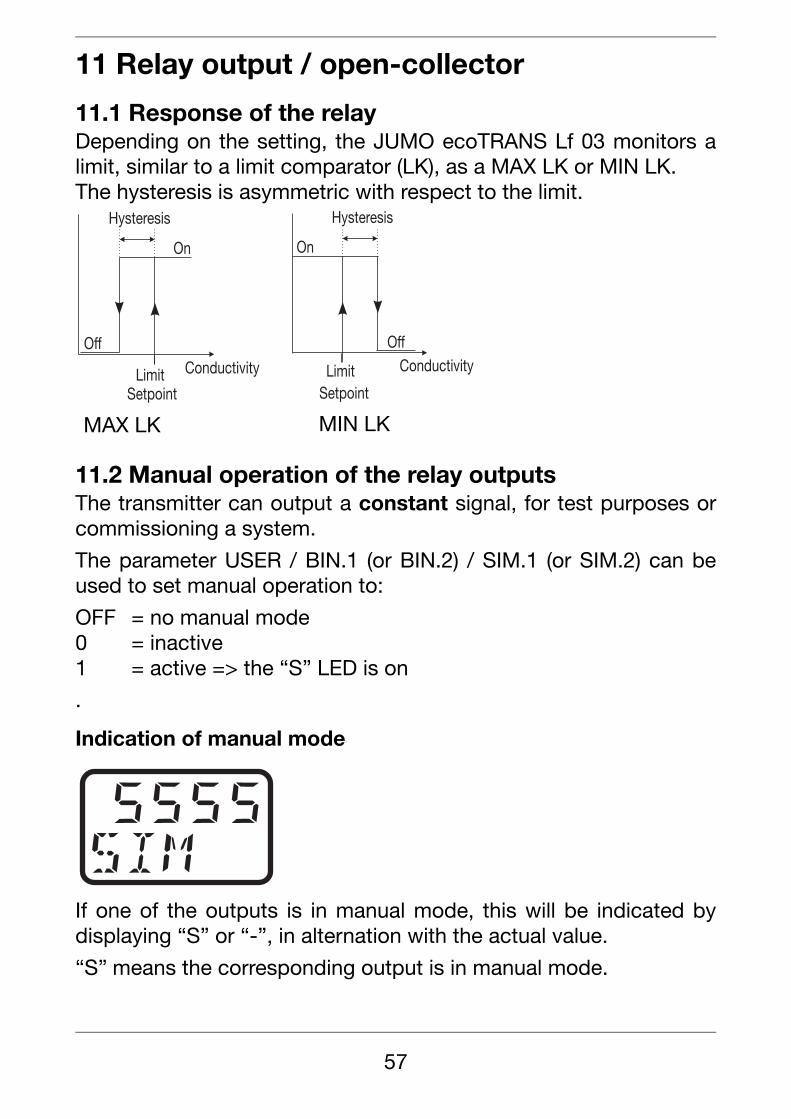
11.1 Response of the relayDepending on the setting, the JUMO ecoTRANS Lf 03 monitors alimit, similar to a limit comparator (LK), as a MAX LK or MIN LK.The hysteresis is asymmetric with respect to the limit.
11.2 Manual operation of the relay outputsThe transmitter can output a constant signal, for test purposes orcommissioning a system.
The parameter USER / BIN.1 (or BIN.2) / SIM.1 (or SIM.2) can beused to set manual operation to:
OFF = no manual mode0 = inactive1 = active => the “S” LED is on
.
Indication of manual mode
If one of the outputs is in manual mode, this will be indicated bydisplaying “S” or “-”, in alternation with the actual value.
“S” means the corresponding output is in manual mode.
MAX LK MIN LK
57
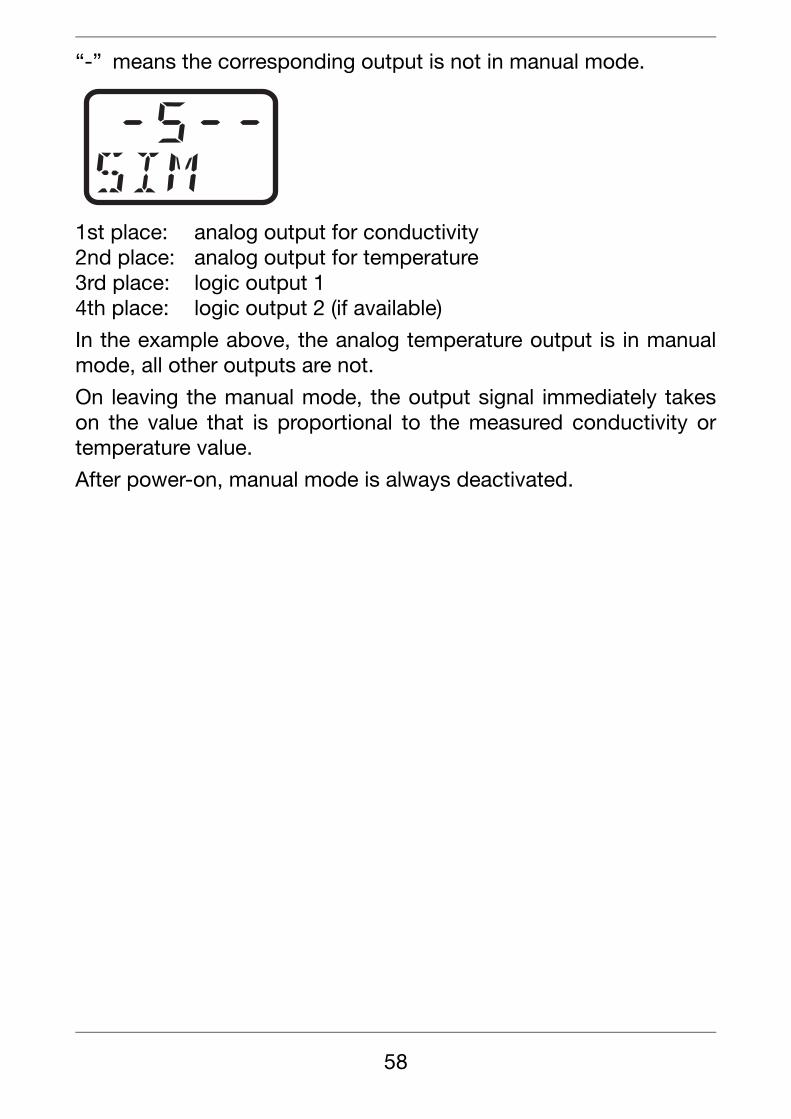
“-” means the corresponding output is not in manual mode.
1st place: analog output for conductivity2nd place: analog output for temperature3rd place: logic output 14th place: logic output 2 (if available)
In the example above, the analog temperature output is in manualmode, all other outputs are not.
On leaving the manual mode, the output signal immediately takeson the value that is proportional to the measured conductivity ortemperature value.
After power-on, manual mode is always deactivated.
58
11.3 Response of the relay during calibrationThe parameter USER / BIN.1 (or BIN.2) / CAL.1 (or CAL.2) can beused to set the relay response to:
0 = relay inactive
1 = relay active
2 = relay unchanged (during calibration, the relay remains at the status that wasvalid before the start of the calibration)
11.4 Pulse function of the relay outputThe limit comparator is reset after an adjustable pulse time. Theparameter available for this purpose is: USER / BIN.1 (or BIN.2) /T.PUL1 (or T.PUL2). It can be set from 0 = 0 seconds (no pulse function) to 999 = 999 seconds.The LED K1 is lit up red as long as the switching condition isfulfilled.
11.5 Response of the relay in fault conditionThe parameter USER / BIN.1 (or BIN.2) / ERR.1 (or ERR.2) can beused to set the relay response to:
0 = relay inactive
1 = relay active
2 = relay unchanged (during calibration, the relay remains at the status that wasvalid before the start of the calibration).
Switch-off delay is not possible in pulsed operation.
59
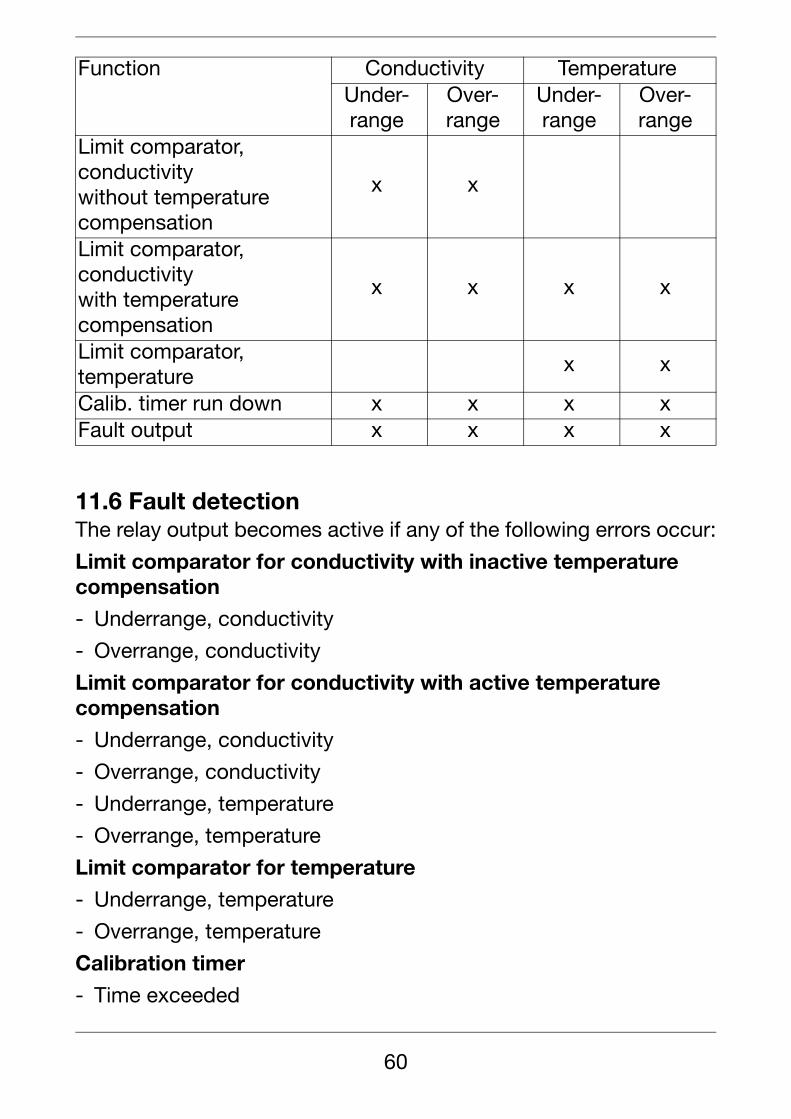
11.6 Fault detectionThe relay output becomes active if any of the following errors occur:
Limit comparator for conductivity with inactive temperature compensation
- Underrange, conductivity
- Overrange, conductivity
Limit comparator for conductivity with active temperaturecompensation
- Underrange, conductivity
- Overrange, conductivity
- Underrange, temperature
- Overrange, temperature
Limit comparator for temperature
- Underrange, temperature
- Overrange, temperature
Calibration timer
- Time exceeded
Function Conductivity TemperatureUnder-range
Over-range
Under-range
Over-range
Limit comparator, conductivitywithout temperaturecompensation
x x
Limit comparator, conductivitywith temperaturecompensation
x x x x
Limit comparator, temperature
x x
Calib. timer run down x x x xFault output x x x x
60
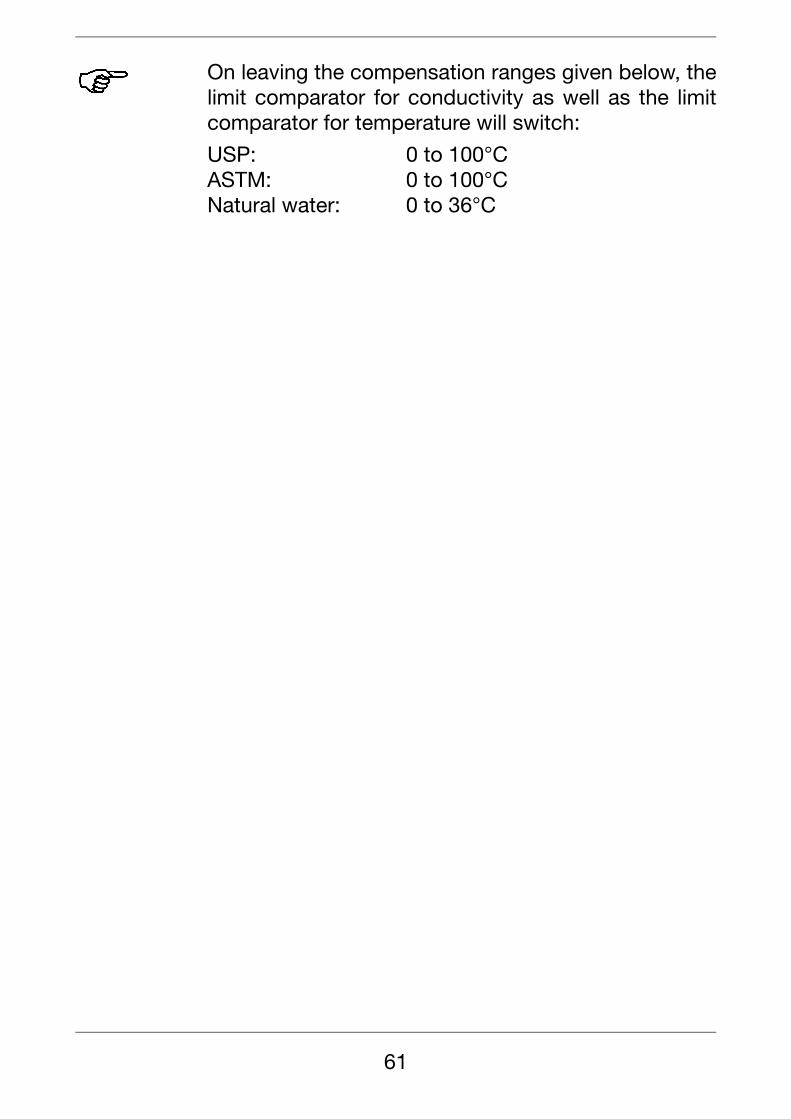
On leaving the compensation ranges given below, thelimit comparator for conductivity as well as the limitcomparator for temperature will switch:
USP: 0 to 100°CASTM: 0 to 100°CNatural water: 0 to 36°C
61
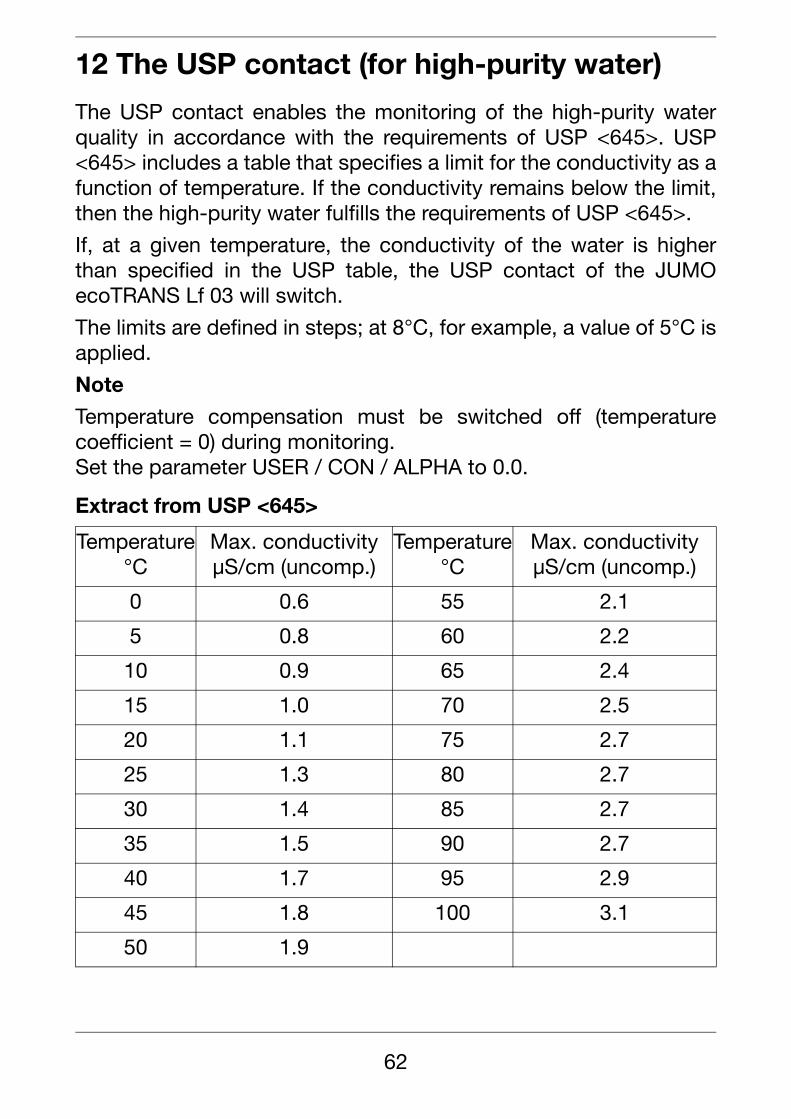
12 The USP contact (for high-purity water)
The USP contact enables the monitoring of the high-purity waterquality in accordance with the requirements of USP <645>. USP<645> includes a table that specifies a limit for the conductivity as afunction of temperature. If the conductivity remains below the limit,then the high-purity water fulfills the requirements of USP <645>.
If, at a given temperature, the conductivity of the water is higherthan specified in the USP table, the USP contact of the JUMOecoTRANS Lf 03 will switch.
The limits are defined in steps; at 8°C, for example, a value of 5°C isapplied.
Note
Temperature compensation must be switched off (temperaturecoefficient = 0) during monitoring.Set the parameter USER / CON / ALPHA to 0.0.
Extract from USP <645>
Temperature°C
Max. conductivityµS/cm (uncomp.)
Temperature°C
Max. conductivityµS/cm (uncomp.)
0 0.6 55 2.1
5 0.8 60 2.2
10 0.9 65 2.4
15 1.0 70 2.5
20 1.1 75 2.7
25 1.3 80 2.7
30 1.4 85 2.7
35 1.5 90 2.7
40 1.7 95 2.9
45 1.8 100 3.1
50 1.9
62
If the conductivity exceeds the value for the correspondingtemperature, the configured contact will switch.
12.1 USP pre-alarmThe USP pre-alarm switches before the water quality reaches theset limit. The parameter: USER / BIN.1 / S.USP1 (0 — 100) can be used todefine a margin between pre-alarm and USP limit, as a percentagevalue referred to the active limit.
63
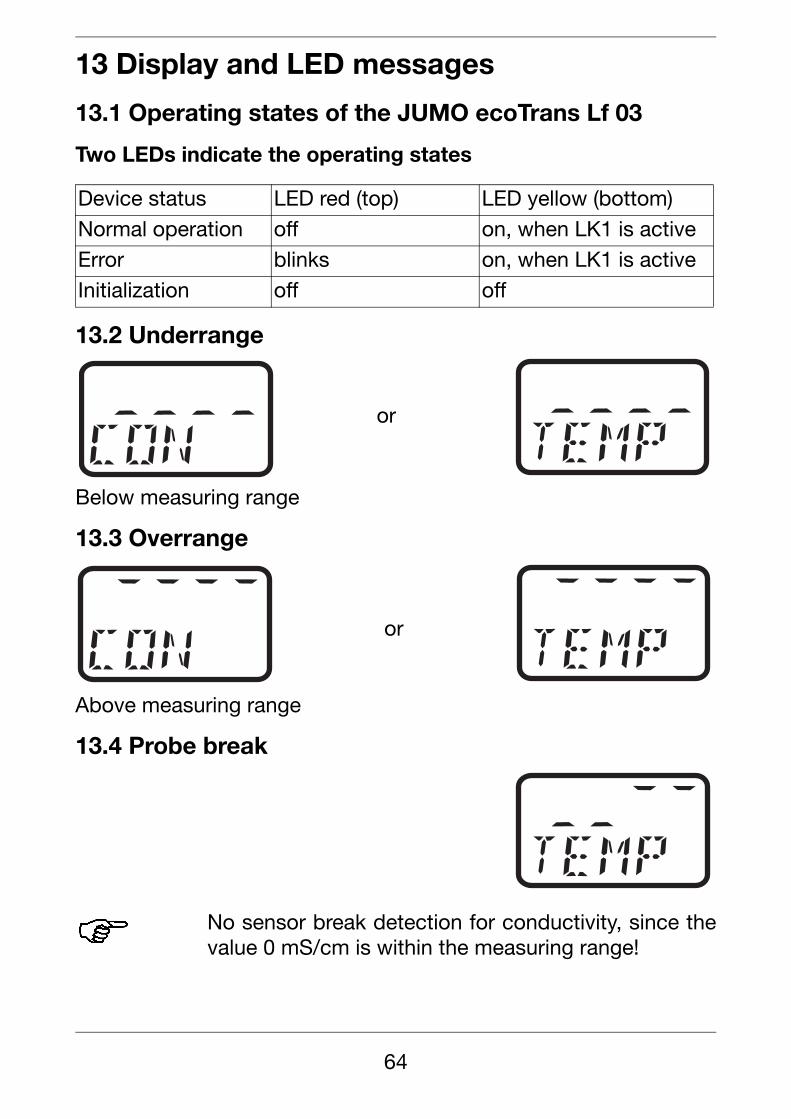
13 Display and LED messages
13.1 Operating states of the JUMO ecoTrans Lf 03
Two LEDs indicate the operating states
13.2 Underrange
Below measuring range
13.3 Overrange
Above measuring range
13.4 Probe break
Device status LED red (top) LED yellow (bottom)Normal operation off on, when LK1 is activeError blinks on, when LK1 is activeInitialization off off
No sensor break detection for conductivity, since thevalue 0 mS/cm is within the measuring range!
or
or
64
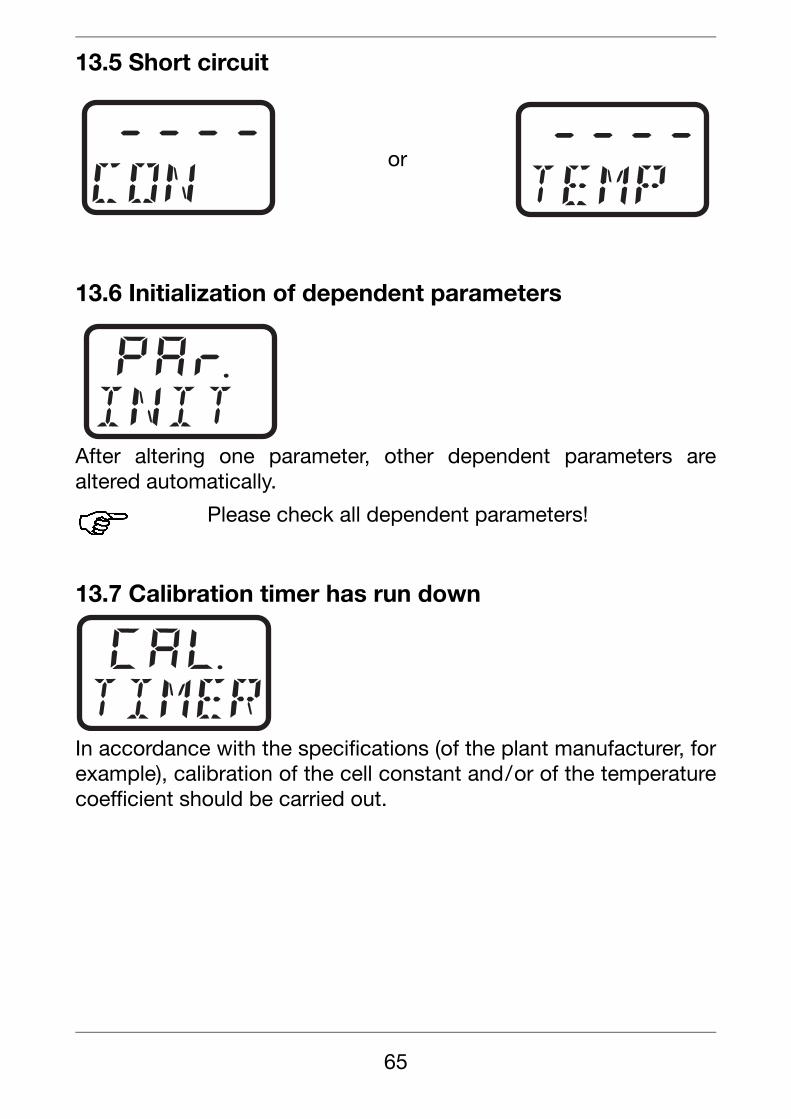
13.5 Short circuit
13.6 Initialization of dependent parameters
After altering one parameter, other dependent parameters arealtered automatically.
13.7 Calibration timer has run down
In accordance with the specifications (of the plant manufacturer, forexample), calibration of the cell constant and/or of the temperaturecoefficient should be carried out.
Please check all dependent parameters!
or
65
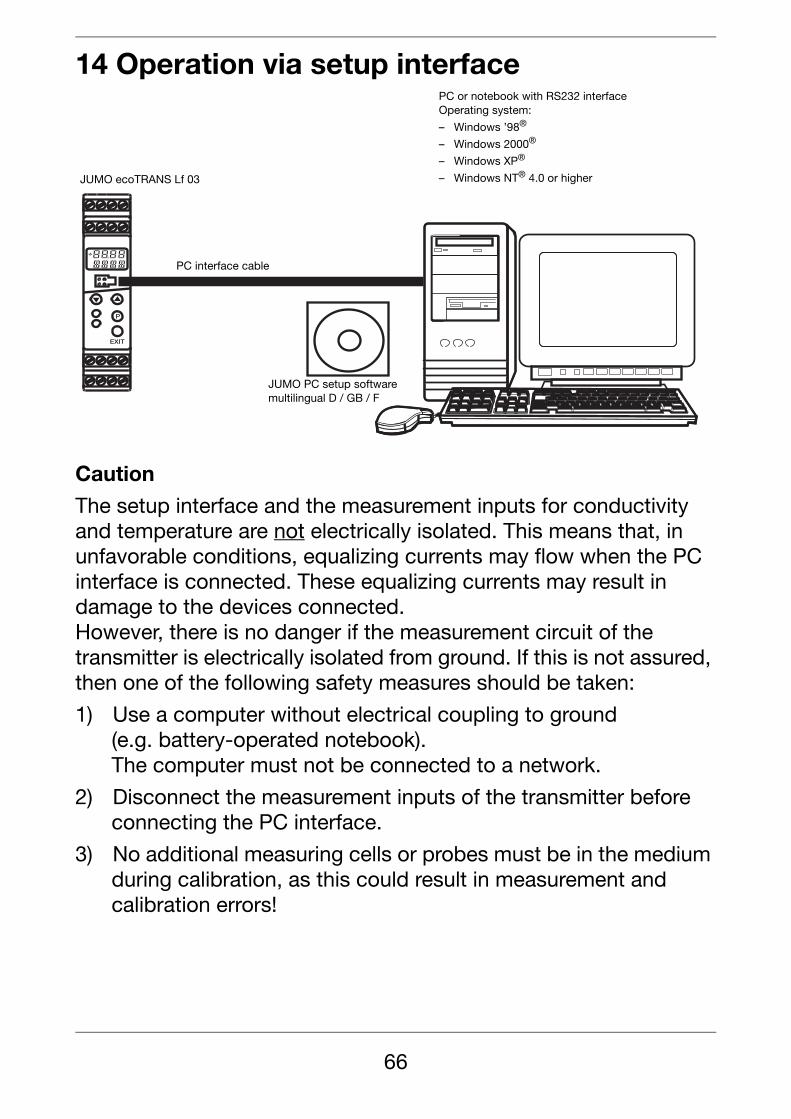
14 Operation via setup interface
Caution
The setup interface and the measurement inputs for conductivity and temperature are not electrically isolated. This means that, in unfavorable conditions, equalizing currents may flow when the PC interface is connected. These equalizing currents may result in damage to the devices connected.However, there is no danger if the measurement circuit of the transmitter is electrically isolated from ground. If this is not assured, then one of the following safety measures should be taken:
1) Use a computer without electrical coupling to ground(e.g. battery-operated notebook).The computer must not be connected to a network.
2) Disconnect the measurement inputs of the transmitter before connecting the PC interface.
3) No additional measuring cells or probes must be in the medium during calibration, as this could result in measurement and calibration errors!
P
EXIT
JUMO ecoTRANS Lf 03
PC interface cable
JUMO PC setup softwaremultilingual D / GB / F
PC or notebook with RS232 interface Operating system:
– Windows ’98®
– Windows 2000®
– Windows XP®
– Windows NT® 4.0 or higher
66
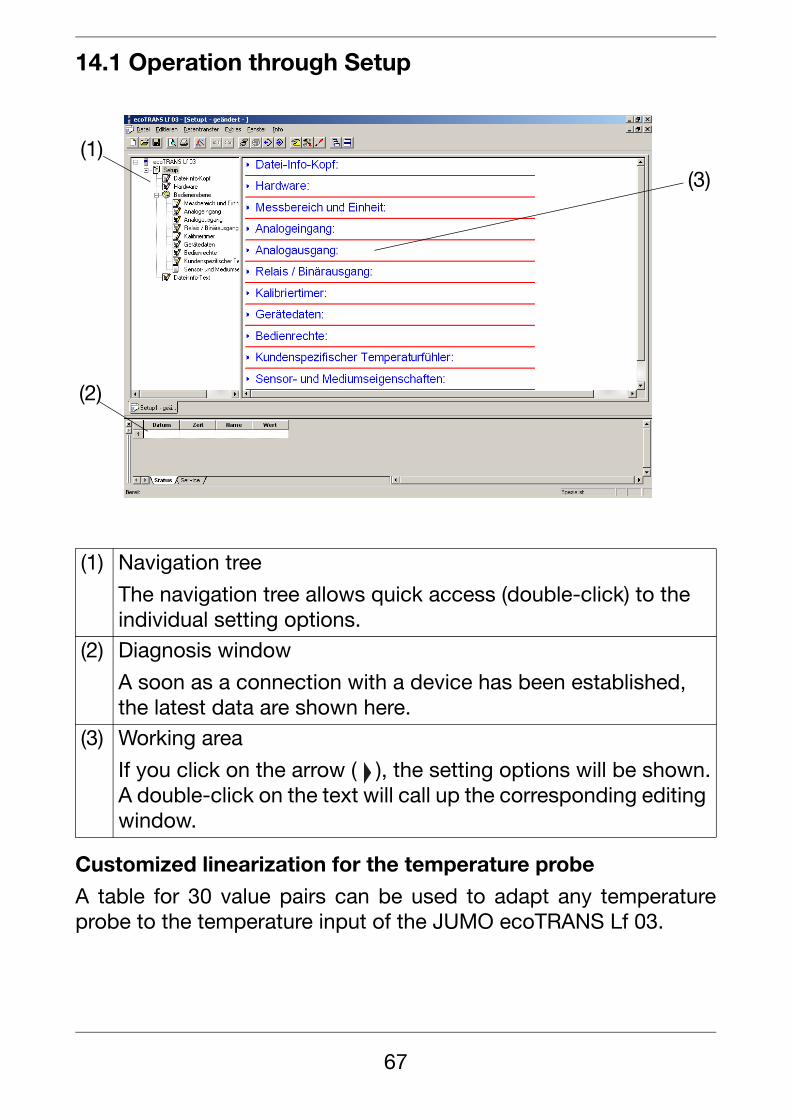
14.1 Operation through Setup
Customized linearization for the temperature probe
A table for 30 value pairs can be used to adapt any temperatureprobe to the temperature input of the JUMO ecoTRANS Lf 03.
(1) Navigation tree
The navigation tree allows quick access (double-click) to the individual setting options.
(2) Diagnosis window
A soon as a connection with a device has been established, the latest data are shown here.
(3) Working area
If you click on the arrow ( ), the setting options will be shown.A double-click on the text will call up the corresponding editing window.
(1)
(2)
(3)
67
15 Technical data
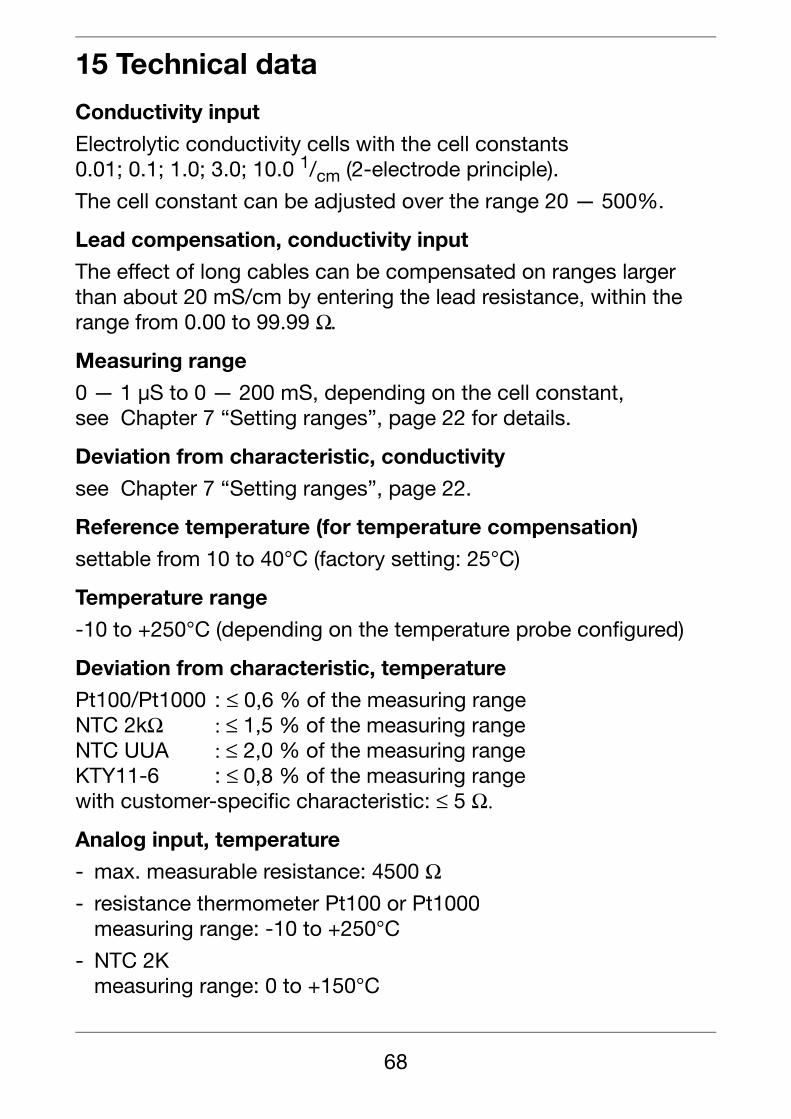
Conductivity input
Electrolytic conductivity cells with the cell constants 0.01; 0.1; 1.0; 3.0; 10.0 1/cm (2-electrode principle).
The cell constant can be adjusted over the range 20 — 500%.
Lead compensation, conductivity input
The effect of long cables can be compensated on ranges larger than about 20 mS/cm by entering the lead resistance, within the range from 0.00 to 99.99 Ω.
Measuring range
0 — 1 µS to 0 — 200 mS, depending on the cell constant,see Chapter 7 “Setting ranges”, page 22 for details.
Deviation from characteristic, conductivity
see Chapter 7 “Setting ranges”, page 22.
Reference temperature (for temperature compensation)
settable from 10 to 40°C (factory setting: 25°C)
Temperature range
-10 to +250°C (depending on the temperature probe configured)
Deviation from characteristic, temperature
Pt100/Pt1000 : ≤ 0,6 % of the measuring rangeNTC 2kΩ : ≤ 1,5 % of the measuring rangeNTC UUA : ≤ 2,0 % of the measuring rangeKTY11-6 : ≤ 0,8 % of the measuring rangewith customer-specific characteristic: ≤ 5 Ω.
Analog input, temperature
- max. measurable resistance: 4500 Ω- resistance thermometer Pt100 or Pt1000
measuring range: -10 to +250°C
- NTC 2Kmeasuring range: 0 to +150°C
68
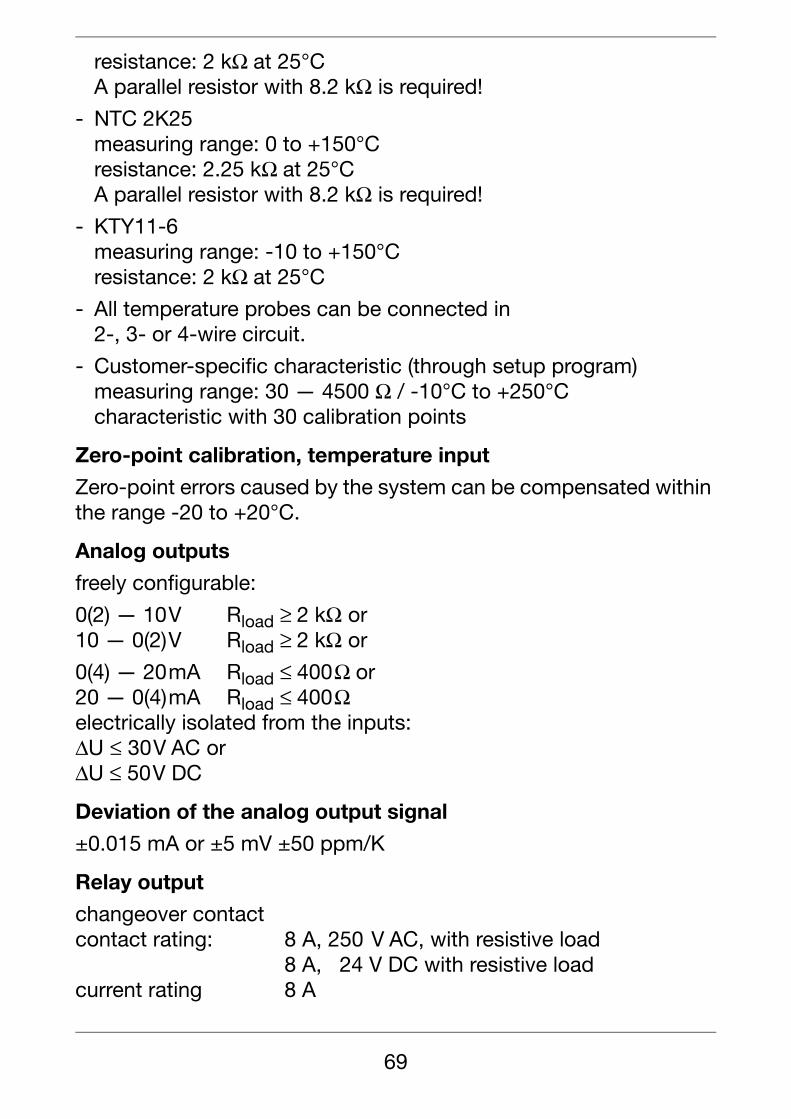
resistance: 2 kΩ at 25°CA parallel resistor with 8.2 kΩ is required!
- NTC 2K25measuring range: 0 to +150°Cresistance: 2.25 kΩ at 25°CA parallel resistor with 8.2 kΩ is required!
- KTY11-6measuring range: -10 to +150°Cresistance: 2 kΩ at 25°C
- All temperature probes can be connected in2-, 3- or 4-wire circuit.
- Customer-specific characteristic (through setup program)measuring range: 30 — 4500 Ω / -10°C to +250°Ccharacteristic with 30 calibration points
Zero-point calibration, temperature input
Zero-point errors caused by the system can be compensated within the range -20 to +20°C.
Analog outputs
freely configurable:
0(2) — 10V Rload ≥ 2 kΩ or 10 — 0(2)V Rload ≥ 2 kΩ or
0(4) — 20mA Rload ≤ 400Ω or20 — 0(4)mA Rload ≤ 400Ωelectrically isolated from the inputs:ΔU ≤ 30V AC orΔU ≤ 50V DC
Deviation of the analog output signal
±0.015 mA or ±5 mV ±50 ppm/K
Relay output
changeover contactcontact rating: 8 A, 250 V AC, with resistive load
8 A,0 24 V DC with resistive loadcurrent rating 8 A
69
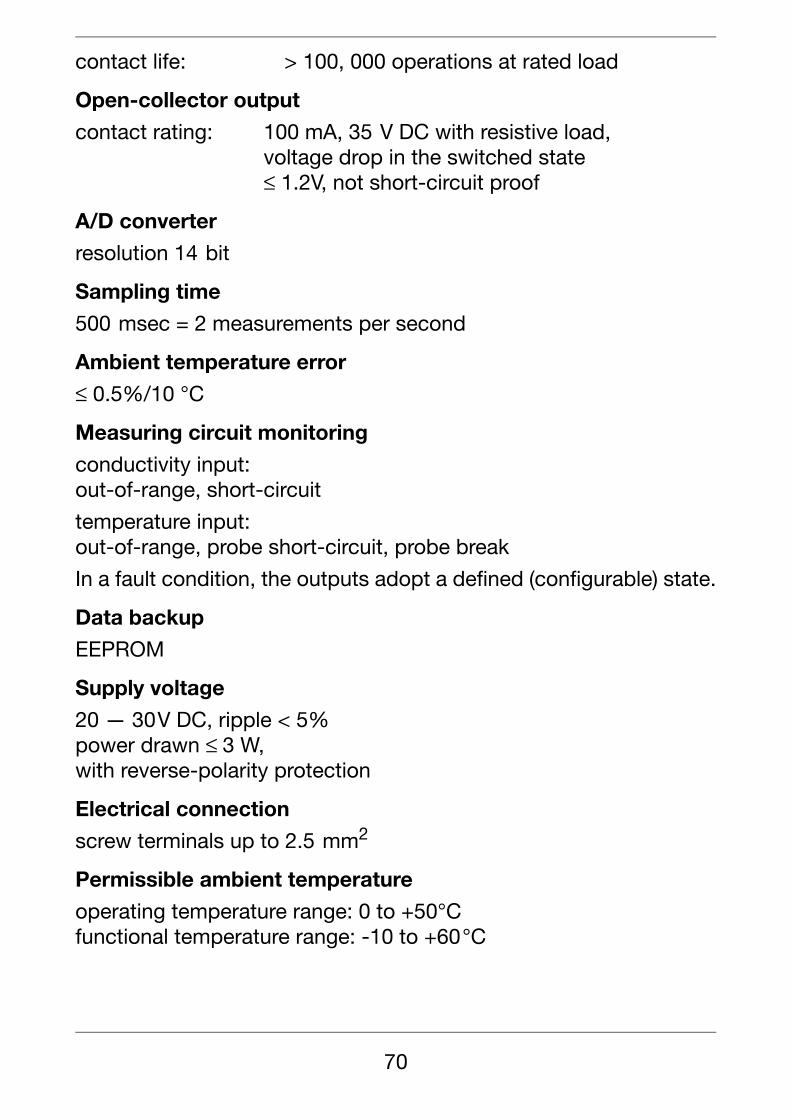
contact life: > 100, 000 operations at rated load
Open-collector output
contact rating: 100 mA, 35 V DC with resistive load,voltage drop in the switched state ≤ 1.2V, not short-circuit proof
A/D converter
resolution 14 bit
Sampling time
500 msec = 2 measurements per second
Ambient temperature error
≤ 0.5%/10 °C
Measuring circuit monitoring
conductivity input: out-of-range, short-circuit
temperature input: out-of-range, probe short-circuit, probe break
In a fault condition, the outputs adopt a defined (configurable) state.
Data backup
EEPROM
Supply voltage
20 — 30V DC, ripple < 5%power drawn ≤ 3 W,with reverse-polarity protection
Electrical connection
screw terminals up to 2.5 mm2
Permissible ambient temperature
operating temperature range: 0 to +50°Cfunctional temperature range: -10 to +60°C
70
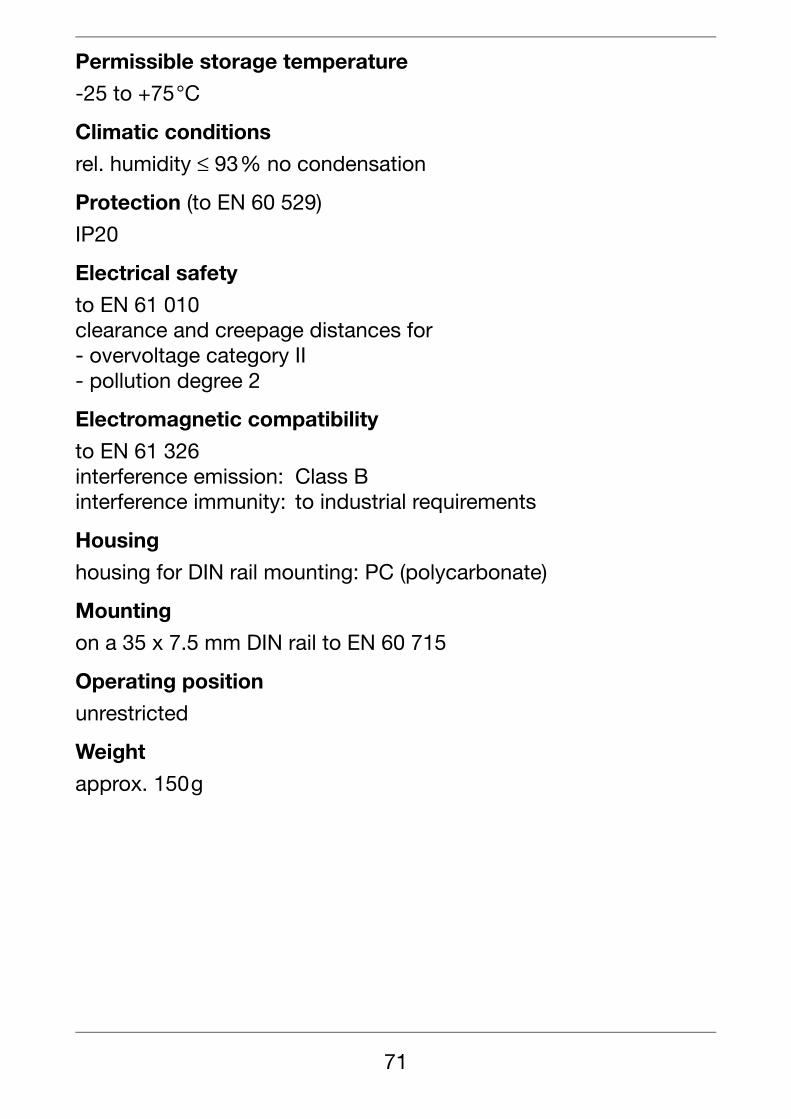
Permissible storage temperature
-25 to +75°C
Climatic conditions
rel. humidity ≤ 93% no condensation
Protection (to EN 60 529)
IP20
Electrical safety
to EN 61 010clearance and creepage distances for- overvoltage category II- pollution degree 2
Electromagnetic compatibility
to EN 61 326interference emission: Class Binterference immunity: to industrial requirements
Housing
housing for DIN rail mounting: PC (polycarbonate)
Mounting
on a 35 x 7.5 mm DIN rail to EN 60 715
Operating position
unrestricted
Weight
approx. 150g
71

16 Environment / waste disposal
Faulty devices can be returned to JUMO for proper disposal.
72

73
74
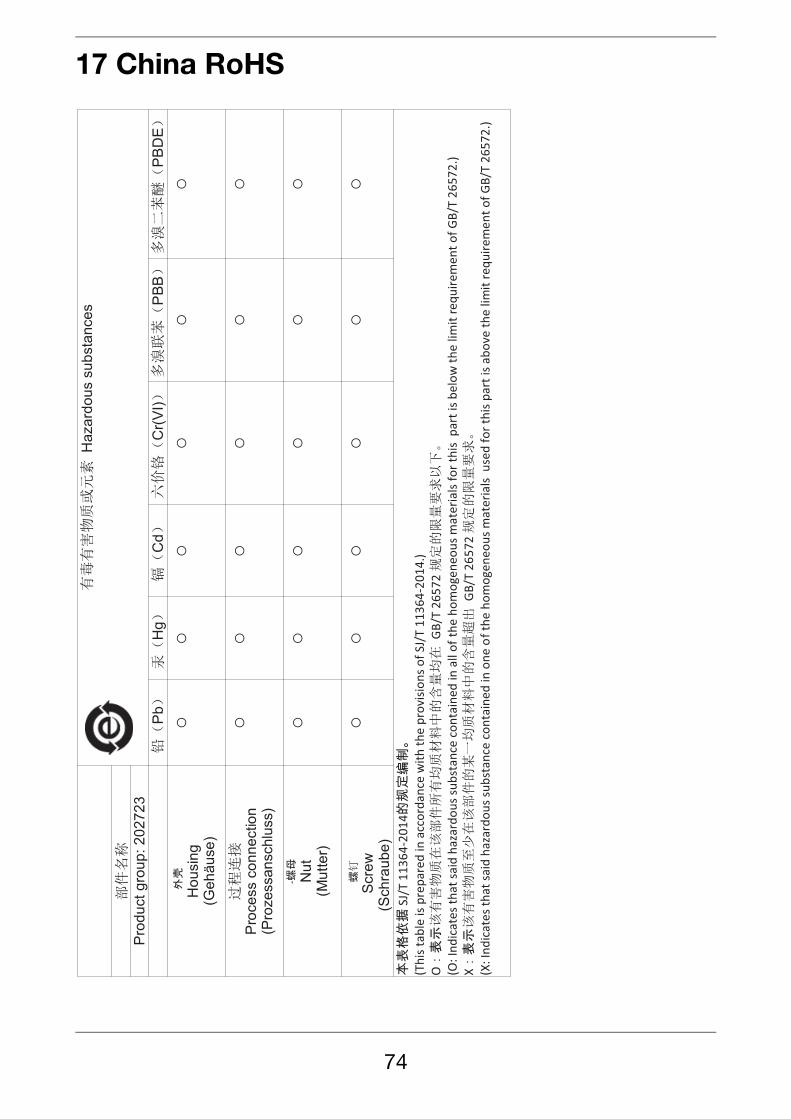
17 China RoHS


JUMO GmbH & Co. KG JUMO Instrument Co. Ltd. JUMO Process Control, Inc.Street address:Moritz-Juchheim-Straße 136039 Fulda, GermanyDelivery address:Mackenrodtstraße 1436039 Fulda, GermanyPostal address:36035 Fulda, GermanyPhone: +49 661 6003-0Fax: +49 661 6003-607Email: [email protected]: www.jumo.net
JUMO HouseTemple Bank, RiverwayHarlow, Essex CM 20 2DY, UKPhone: +44 1279 63 55 33Fax: +44 1279 62 50 29Email: [email protected]: www.jumo.co.uk
6733 Myers RoadEast Syracuse, NY 13057, USAPhone: +1 315 437 5866Fax: +1 315 437 5860Email: [email protected]: www.jumousa.com