Embed Size (px)
DESCRIPTION
Naples Area Real Estate Sales Trends for July 2009 per sunshinemls
Citation preview
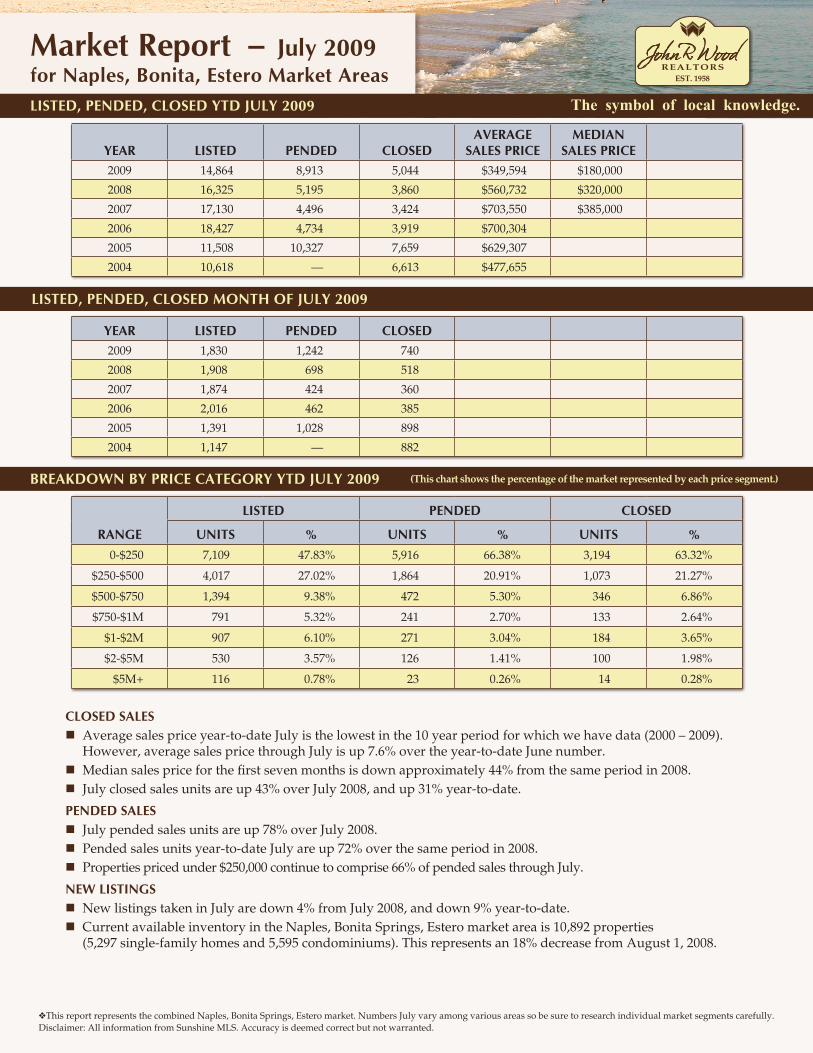
Year Listed Pended CLosedaverage
saLes PriCeMedian
saLes PriCe2009 14,864 8,913 5,044 $349,594 $180,000
2008 16,325 5,195 3,860 $560,732 $320,000
2007 17,130 4,496 3,424 $703,550 $385,000
2006 18,427 4,734 3,919 $700,304
2005 11,508 10,327 7,659 $629,307
2004 10,618 — 6,613 $477,655
Listed, Pended, CLosed Ytd JuLY 2009
Listed, Pended, CLosed Month of JuLY 2009
Breakdown BY PriCe CategorY Ytd JuLY 2009
CLosed saLesAverage sales price year-to-date July is the lowest in the 10 year period for which we have data (2000 – 2009). However, average sales price through July is up 7.6% over the year-to-date June number.Median sales price for the first seven months is down approximately 44% from the same period in 2008.July closed sales units are up 43% over July 2008, and up 31% year-to-date.
Pended saLesJuly pended sales units are up 78% over July 2008.Pended sales units year-to-date July are up 72% over the same period in 2008.Properties priced under $250,000 continue to comprise 66% of pended sales through July.
new ListingsNew listings taken in July are down 4% from July 2008, and down 9% year-to-date.Current available inventory in the Naples, Bonita Springs, Estero market area is 10,892 properties (5,297 single-family homes and 5,595 condominiums). This represents an 18% decrease from August 1, 2008.
This report represents the combined Naples, Bonita Springs, Estero market. Numbers July vary among various areas so be sure to research individual market segments carefully.Disclaimer: All information from Sunshine MLS. Accuracy is deemed correct but not warranted.
Year Listed Pended CLosed2009 1,830 1,242 740
2008 1,908 698 518
2007 1,874 424 360
2006 2,016 462 385
2005 1,391 1,028 898
2004 1,147 — 882
range
Listed Pended CLosed
units % units % units %0-$250 7,109 47.83% 5,916 66.38% 3,194 63.32%
$250-$500 4,017 27.02% 1,864 20.91% 1,073 21.27%
$500-$750 1,394 9.38% 472 5.30% 346 6.86%
$750-$1M 791 5.32% 241 2.70% 133 2.64%
$1-$2M 907 6.10% 271 3.04% 184 3.65%
$2-$5M 530 3.57% 126 1.41% 100 1.98%
$5M+ 116 0.78% 23 0.26% 14 0.28%
(This chart shows the percentage of the market represented by each price segment.)
Market report – July 2009for naples, Bonita, estero Market areas
The symbol of local knowledge.