Embed Size (px)
DESCRIPTION
July Data for Bucks County
Citation preview

If your property is currrently listed witha real estate broker, please disregard.It is not my intention to solicit the offerings ofother real estate brokers.
“I expect only the best for you” prin
ted
by O
TVon
lineM
edia
.com
For Further Details Contact:Heather JackmanColdwell Banker Hearthside215.493.9080 x119215.431.0884 cellRL#RS292094
Heather Jackman
Hearthside70 West Afton Ave Yardley PA 19067
215.493.9080 X119Call me to find out why now is a gret time to buy or sell a home.I’ll provide you with a complimentary market analysis of current sales listings in your neighborhood.I’ll also show you my state of the art marketing plan that will enableyou to receive top dollar for your home in today’s challengingmarket place.
I am ready to go to work for you and prove that knowledge,honesty, and integrity will result in a positive and successful transaction.
Visit Heather Jackman’s
Channel
Follow Heather Jackman
on Twitter
Lic in PA & NJ # 1006608

Here is some data from the report that pertains to our area:
Attic BedroomBack-Up Generator
BathroomDeck (composite)
Deck (wood)Family Room
GarageMaster Suite
SunroomTwo Story
BathroomDeck (composite)
GarageMaster Suite
ADDITIONS:
Data from Middle Atlantic States ( NJ, NY, PA)Job Cost
ResaleValue
CostRecouped
REMODELINGS:
BasementsBathroom
Home OfficeMajor KitchenMinor Kitchen
BathroomMajor Kitchen
$53,780$15,290$42,441$15,890$11,260$88,704$62,431
$111,857$76,580
$165,708
$81,166$39,270$92,962
$238,299
REPLACEMENTS:
$67,455$17,383$29,525$59,905$22,130
$55,766$115,605
$39,292$8,206
$22,272$10,404
$7,917$51,991$34,847$67,612$38,661
$107,770
$42,240$22,584$45,241
$124,774
73.1%53.7%52.5%65.5%70.3%58.6%55.8%60.4%50.5%65.0%
52.0%57.5%48.7%52.4%
$41,127$11,817$13,841$39,860$15,973
$31,862$67,988
61.0%68.0%46.9%66.5%72.2%
57.1%58.8%
Entry DoorRoofing
Siding (vinyl)Window (vinyl)
Window (wood)
Entry DoorGrand Entrance
RoofingSiding (fiber cement)
Siding (foam vinyl)Window (vinyl)
Window (wood)
$1,248$22,292$10,980$11,408$12,410
$3,632$7,855
$42,333$13,497$13,369$14,795$18,656
$1,217$14,508
$8,920$8,766$9,248
$2,316$5,013
$24,133$10,710$10,489$10,857$12,536
97.5%65.1%81.2%76.8%74.5%
63.8%63.8%57.0%79.4%78.5%73.4%67.2%
UPSCALE
UPSCALE
UPSCALE
Home improvement projects are still worth the investment according
to Remodling Magazines “Cost vs Value Report.”

b
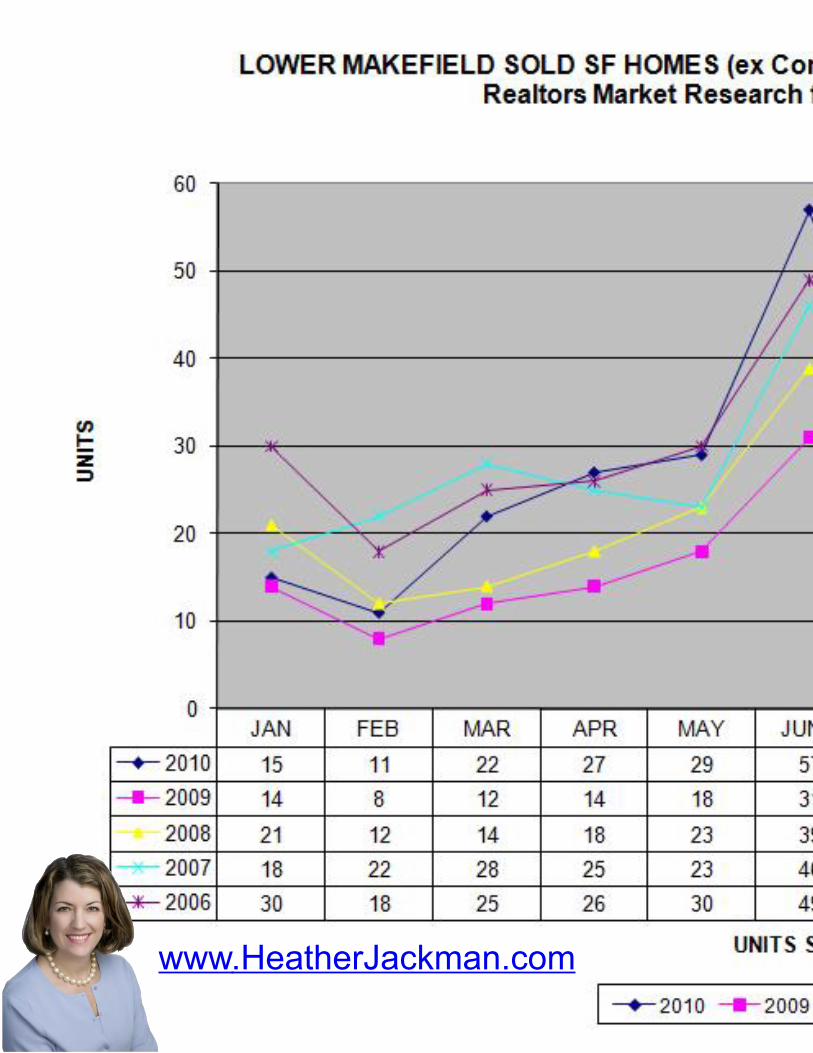
LOWER MAKEFIELD TOWNSHIP SINGLE FAMILY HOMES
Market Facts as of JULY YTD 2010 ______________
Source: COLDWELL BA�KER HEARTHSIDE REALTORS MARKET RESEARCH from TRE�D MLS Data
Inventory of homes for sale in July 2010 was 223 Inventory of homes for sale in June 2010 was 238
Inventory of homes for sale in July 2009 was 251 Unit Inventory is down 11.2% year over year,
And down 15 homes (6.3%) sequentially from June 2010
Avg. price of a home for sale in July 2010 was $520k Avg. price of a home for sale in July 2009 was $522k
List prices of homes in inventory near flat, down 0.2%
131 homes sold as of July YTD 2009 at 91% of list price 188 homes sold as of July YTD 2010 at 93% of list price
Unit Sales volume is up 43.5% year over year, contrasted with Full Year 2009 Unit Sales which were up 1.6%
Buyers achieving approx 7% avg. discount from List Price
Summary: For trend-line reference, Full Year 07 Unit Growth was 6.5%, Full Year 08 Sales recorded a lower (-33.5%) result, Full Year 09 turned modestly positive at 1.6%, while YTD 2010 is +43.5%. Inventory is at an 8.6 Month supply of homes. The Average Sold Price for the Full Year 2006 was a modest 3.6% increase, Full Year 2007 reflected a 6.4% decrease, Full Year 2008 recorded a 3.1% increase and Full Year 09 reflected a 6.7% Price decrease, YTD 2010 trend indicates an 8.6% decrease. Buyers are achieving “discount” leverage in negotiation – though the spread is narrowing versus last year. Market conditions are considered above “Balanced”, favoring the Buyer, with 8.6 Months of Homes in Inventory (Note: a Market is considered “balanced” with 6 Months Inventory).
What does this mean to a Seller? There is an 8+ Month Supply of homes on the market, generally, for longer periods of time (Average Days on Market are now 78 versus 73 last year) so competition remains challenging. It is more important now than ever to price your home right and market aggressively. You may not have enjoyed the per year appreciation in 2006-2009 versus the ~10+% experienced during the prior 4-5 years. Be realistic and remember the current market is what determines the price of your home.


Per Year Appreciation SF Homes (ex Condos) Higher Volume Markets
Source: COLDWELL BANKER HEARTHSIDE REALTORS MARKET RESEARCH from MLS data
L. Makefield Twp Newtown Twp Northampton Twp Buckingham Twp
Apprec Units Apprec Units Apprec Units Apprec Units
2009 Avg$ $462 $386 $389 $501
2009 -6.7% 255 -3.7% 224 -9.9% 287 -16.1% 174
2008 3.1% 251 -2.4% 231 -2.3% 278 -2.9% 204
2007 -6.4% 379 -0.1% 260 -3.3% 351 1.7% 252
2006 3.6% 355 10.9% 299 8.2% 376 5.2% 257
2005 11.6% 432 6.9% 354 8.9% 437 10.4% 329
2004 10.4% 465 12.0% 360 10.7% 457 10.6% 288
2003 11.7% 465 11.9% 344 5.5% 410 5.4% 279
2002 9.8% 427 14.5% 285 14.6% 398 15.2% 259
2001 13.5% 453 5.7% 321 15.3% 409 17.9% 239
2000 Avg$ $288 445 $229 307 $249 377 $329 279
Doylestown Twp Falls Twp Middletown Twp Bristol Twp
Apprec Units Apprec Units Apprec Units Apprec Units
2009 Avg$ $414 $232 $288 $179
2009 -8.2% 135 -5.9% 215 -5.3% 323 -7.6% 501
2008 -0.2% 114 -6.4% 202 -7.9% 309 -8.4% 490
2007 -5.9% 168 2.5% 284 0.4% 347 -0.1% 561
2006 1.8% 178 1.4% 282 7.5% 407 5.9% 593
2005 14.9% 189 13.6% 280 10.0% 427 15.9% 738
2004 10.2% 198 20.8% 304 11.8% 467 11.3% 711
2003 5.8% 184 12.5% 269 11.7% 406 18.1% 629
2002 21.2% 182 13.3% 279 11.9% 397 13.9% 589
2001 9.1% 164 7.3% 237 12.5% 366 5.8% 601
2000 Avg$ $266 175 $135 266 $176 369 $109 539
Bucks County Morrisville Boro
Apprec Units Apprec Units
2009 Avg$ $329 $186
2009 -6.8% 4812 -10.9% 100
2008 -6.7% 4806 -8.1% 74
2007 0.6% 6048 1.4% 103
2006 4.1% 6408 0.7% 133
2005 11.6% 7454 18.6% 144
2004 13.1% 7470 19.1% 159
2003 10.0% 6893 9.7% 144
2002 15.6% 6429 12.8% 116
2001 7.5% 6364 4.9% 138
2000 Avg$ $209 6275 $121 123
Appreciation measured by Change in Sold Average Price year over year
MLS Stats are not held beyond 2000 base year
2000 Avg$ displays Base Year Average Price for the Indicated Market
2009 Avg$ displays Average Price for the Indicated Market

f
NEWTOWN TOWNSHIP SINGLE FAMILY HOMES
Market Facts as of JULY YTD 2010 ______________
Source: COLDWELL BA�KER HEARTHSIDE REALTORS MARKET RESEARCH from TRE�D MLS Data
Inventory of homes for sale in July 2010 was 146 Inventory of homes for sale in June 2010 was 145
Inventory of homes for sale in July 2009 was 148 Unit Inventory is down 1.4% year over year, And up 1 home sequentially from June 2010
Avg. price of a home for sale in July 2010 was $474k Avg. price of a home for sale in July 2009 was $463k
List prices of homes in inventory are up 2.6%
118 homes sold as of July YTD 2009 at 93% of list price 133 homes sold as of July YTD 2010 at 95% of list price
Unit Sales volume is up 12.7% year over year, contrasted with Full Year 2009 Unit Sales which were down 3%
Buyers achieving approx 5% avg. discount from List Price
Summary: Inventory levels are down slightly and sales volume is positive. The Average Sold Price for the full year 2006 was a 10.9% increase, 2007 pricing was near flat at -0.1%, Full year 2008 Average Sold Prices reflected a 2.4% decrease and 2009 reflected a 3.7% Price decrease, YTD 2010 trend indicates a modest 0.6% decrease. Buyers still achieving “discount” leverage in negotiation – though the spread is narrowing versus last year. Market conditions are near balanced with 7.3 Months of Homes in Inventory. Note that a Market is viewed as “Balanced” between Buyers & Sellers with ~6 Months Inventory.
What does this mean to a Seller? There is a 7+ Month Supply of homes on the market, generally taking about 52 Average Days on Market to sell, so the competitive conditions are challenging. It is more important now than ever to price your home right and market aggressively. You may not have enjoyed the per year appreciation in 2007-2009 versus the ~10% experienced during most of the prior 3-4 years. Be realistic and remember the current market is what determines the price of your home.


f
DOYLESTOWN TOWNSHIP SINGLE FAMILY HOMES
Market Facts as of JULY YTD 2010 ______________
Source: COLDWELL BA�KER HEARTHSIDE REALTORS MARKET RESEARCH from TRE�D MLS Data
Inventory of homes for sale in July 2010 was 128 Inventory of homes for sale in June 2010 was 124
Inventory of homes for sale in July 2009 was 130 Unit Inventory is down 1.5% year over year,
And up 4 homes (3%) sequentially from June 2010
Avg. price of a home for sale in July 2010 was $532k Avg. price of a home for sale in July 2009 was $558k List prices of homes in inventory are down 4.8%
66 homes sold as of July YTD 2009 at 92% of list price 83 homes sold as of July YTD 2010 at 91% of list price
Unit Sales volume is up 25.8% year over year, contrasted with Full Year 2009 Unit Sales which were up 18.4%
Buyers achieving approx 9% avg. discount from List Price
Summary: Inventory levels are down and YTD unit sales volume is noticeably up. Average Sold Prices for the Full Year 2007 were down 5.9%, Full Year 2008 Average Sold Prices were near flat at a 0.2% decrease and 2009 reflected an 8.2% Price decrease, YTD 2010 trend indicates a modest 1.1% decrease. Buyers continue to achieve “discount” leverage in negotiation, with an increasing spread versus last year. At current sales pace there is a 10.1 Month Supply of Homes in Inventory. Note that a Market is viewed as “Balanced” between Buyers/Sellers, with 6 Months of Homes in Inventory.
What does this mean to a Seller?
There is a 10+ Month Supply of homes on the market, generally for longer periods of time, so the competition remains challenging. Average Days on Market is 95 days versus 85 last year. It is more important now than ever to price your home right and market aggressively. Be realistic and remember the current market is what determines the price of your home.

b
NORTHAMPTON TOWNSHIP SINGLE FAMILY HOMES
Market Facts as of JULY YTD 2010 ______________
Source: COLDWELL BA�KER HEARTHSIDE REALTORS MARKET RESEARCH from TRE�D MLS Data
Inventory of homes for sale in July 2010 was 262 Inventory of homes for sale in June 2010 was 275
Inventory of homes for sale in July 2009 was 250 Unit Inventory is up 4.8% year over year,
And down 13 homes (4.7%) sequentially from June 2010
Avg. price of a home for sale in July 2010 was $529k Avg. price of a home for sale in July 2009 was $521k
List prices of homes in inventory are up 1.5%
162 homes sold as of July YTD 2009 at 92% of list price 190 homes sold as of July YTD 2010 at 94% of list price
Unit Sales volume is up 17.3% year over year, contrasted with Full Year 2009 Unit Sales which were up 3.2%
Buyers achieving approx 6% avg. discount from List Price
Summary: Inventory is up and YTD unit sales volume is noticeably up.
The Average Sold Price for the Full Year 2006 was up a reasonable 8.4%, Full Year 2007 reflected a decrease of 3.3%, 2008 Sold Average Prices recorded a 2.3% decrease, while 2009 Prices reflected a 9.9% decrease, YTD 2010 trend indicates a 1.5% increase. Buyers are continuing to achieve discount leverage in negotiation – though the spread is narrowing versus last year. The Market is still considered a “Buyers Market” with 10 Months of Homes in Inventory. Note, that Market conditions are considered “Balanced” with 6 Months of Homes in Inventory.
What does this mean to a Seller?
There is a 10 Month Supply of homes on the market, generally for long periods of time, so the competition remains challenging. Average Days on Market is 65 days. It is more important now than ever to price your home right and market aggressively. Be realistic and remember the current market is what determines the price of your home.


MARKET STATISTICS for SELECTED MARKETS in LOWER & UPPER BUCKSSINGLE FAMILY (ex Condos) YEAR-TO-DATE JULY 2010
2010 Source: COLDWELL BANKER HEARTHSIDE R($ in 1,000s) Prior Full Yr YTD YTD 12 Mo Prior
Sold Sold Price Avg Full YAvg Price Avg Price Change % DOM Sold/List Sales $ (k) Units
2009 2010 200UPPER BUCKSPlumstead $385 $397 3.0% 96 92% $23,417 9N Hope Boro $456 $546 27.1% 170 92% $8,196 2Doyle Boro $357 $384 28.9% 109 92% $13,058 7Bedminster $388 $365 -9.3% 77 93% $12,758 4Tinicum $553 $500 5.0% 172 88% $9,499 2Springfield $400 $392 -16.9% 94 87% $5,101 3Wrightstown $580 $876 39.9% 112 90% $10,517 3LOWER BUCKSMiddletown $288 $312 7.5% 77 94% $57,142 32L.Southamp $267 $263 1.8% 65 92% $18,941 13Falls $232 $238 1.7% 55 95% $30,403 2Bucks Cty $329 $342 3.9% 86 92% $973,113 48
20092008 Full Yr 2009 200
UPPER BUCKSPlumstead $420 $385 88 91% $22,729 10N Hope Boro $620 $430 114 93% $6,021Doyle Boro $455 $298 79 88% $10,430 7Bedminster $436 $402 95 92% $9,244 5Tinicum $566 $476 157 80% $6,190 2Springfield $523 $472 131 87% $7,552 2Wrightstown $564 $627 140 88% $11,279 2LOWER BUCKSMiddletown $304 $290 74 93% $47,906 30

versus 2009REALTORS MARKET RESEARCH from TREND MLS Data
Yr YTD Yr over Yr % Change INVENTORY See notes belows Units Sales $ % Unit % Units Change Months Avg Price Change09 2010
97 59 3.0% 0.0% 138 6.2% 17.1 $645 5.3%23 15 36.1% 7.1% 41 -8.9% 20.5 $568 -25.0%72 34 25.2% -2.9% 60 -9.1% 10.1 $653 9.1%48 35 38.0% 52.2% 127 10.4% 25.4 $499 -9.2%27 19 53.5% 46.2% 60 -9.1% 21.8 $801 -1.8%34 13 -32.5% -18.8% 73 0.0% 28.3 $648 6.6%30 12 -6.8% -33.3% 50 0.0% 25.0 $870 5.2%
23 183 19.3% 10.9% 247 1.2% 8.7 $344 -3.3%33 72 1.8% 0.0% 108 -2.7% 9.7 $309 -0.2%15 128 -3.6% -5.2% 130 35.4% 7.5 $274 6.3%12 2845 15.7% 11.4% 4634 0.9% 10.9 $487 -1.7%
08 2009
02 59 130 16.1 $61319 14 45 23.5 $75771 35 66 11.0 $59952 23 115 28.8 $55028 13 66 29.3 $81629 16 73 25.8 $60821 18 50 20.0 $827
09 165 244 9.1 $356
www.HeatherJackman.com
SI�b
SOLEBURY TOWNSHIP SINGLE FAMILY HOMES
Market Facts as of JULY YTD 2010 __________________________________________________________________________________________________________________
Source: COLDWELL BA�KER HEARTHSIDE REALTORS MARKET RESEARCH from TRE�D MLS Data Inventory of homes for sale in July 2010 was 170 Inventory of homes for sale in June 2010 was 181 Inventory of homes for sale in July 2009 was 174
Inventory is down 2.3% year over year, And down 9 homes (5%) sequentially from June 2010
Avg. price of a home for sale in July 2010 - $1.39 million Avg. price of a home for sale in July 2009 - $1.25 million List prices in inventory are up 11.2%, the avg. price stat is impacted
by # of homes priced in $1-5 million, review specific property CMA for pricing direction & Median/Average Prices
42 homes sold as of July YTD 2009 at 87% of list price 63 homes sold as of July YTD 2010 at 91% of list price
Unit Sales volume up 50% year over year, contrasted with Full Year 2009 Unit Sales which were up 19.2%
Buyers achieving approx 9% discount from List Price
Summary: Inventory levels are down slightly and YTD Unit Sales are up
substantially. At current Sales pace, there is a 17.9 Month Supply of Homes in Inventory. Buyers continue to achieve significant discount leverage in negotiation – though the spread is narrowing versus last year. Market is viewed as a clear “Buyers Market”. Note that a Market is viewed as “Balanced” with 6 Months of Homes in Inventory.
What does this mean to a seller? There is a substantial inventory of homes on the market (particularly in $1-3 million range), generally for longer periods of time, so the competition is challenging. Average Days on Market is 118 (all price levels) versus 114 last year. During 2009, most (83%) of the homes sold closed at prices under $999k. Currently, 39% of the homes (66 of 170) on the market are priced above $1 million, and this represents a 60 Month Supply at current sales pace (1.1 per month). It is more important now than ever to price your home right and market aggressively. You may not have enjoyed the positive per year appreciation in 2007, 2008, 2009 that was experienced during the past few years. Be realistic and remember the current market is what determines

b
UPPER MAKEFIELD TOWNSHIP SINGLE FAMILY HOMES
Market Facts as of JULY YTD 2010 Source: COLDWELL BA�KER HEARTHSIDE REALTORS MARKET RESEARCH from TRE�D MLS Data
Inventory of homes for sale in July 2010 was 141 Inventory of homes for sale in June 2010 was 138 Inventory of homes for sale in July 2009 was 134
Inventory is up 5.2% year over year, And up 3 homes sequentially from June 2010
Avg. price of a home for sale in July 2010 - $1.27 million Avg. price of a home for sale in July 2009 - $1.29 million List prices in inventory are down 1.9%, the avg. price stat is driven by # of homes priced in $1-3+ million, review specific property CMA for pricing direction & check Median/Average Prices
38 homes sold as of July YTD 2009 at 87% of list price 61 homes sold as of July YTD 2010 at 90% of list price
Unit Sales volume is up 60.5% year over year, contrasted with Full Year 2009 Unit Sales which were up 1.4%
Buyers achieving approx 10% discount from List Price
Summary: Inventory levels are up and Unit Sales are up noticeably YTD.
Notably, at current Sales pace there is a 17.8 Month Supply of Homes in Inventory, versus 22.3 Months last year. Buyers are still achieving “discount” leverage in negotiation – though the spread is narrowing versus last year. Market is viewed as a clear “Buyers Market”. Note that a Market is viewed as “Balanced” with 6 Months of Inventory.
What does this mean to a seller? There is a substantial inventory of homes on the market (particularly in $1-3 million range), generally for longer periods of time, so the competition is challenging. Average Days on Market is 118 (all price levels). During 2009, most (82%) of the homes sold closed at prices under $999k. Currently, 47.5% of the homes (67 of 141) on the market are priced above $1 million, and this represents a 37 Month Supply at current sales pace (1.8 per month). It is more important now than ever to price your home right and market aggressively. You may not have enjoyed the positive per year appreciation in 2007/2008 that was experienced during the past few years. Be realistic and remember the current market is what determines the price of your home.

MARKET STATISTICS for PRINCIPAL MARKETS($ in 1,000s)SINGLE FAMILY (ex Condos) YEAR-TO-DATE JULY 2010
2010 Source: COLDWELL BANKER HEARTHSIDE REALTORS MPrior Full Yr YTD YTD 12 Mo Prior
Sold Sold Price Avg Full YAvg Price Avg Price Change % DOM Sold/List Sales $ (k) Units
2009 2010 2009LMT $462 $414 -8.6% 78 93% $77,865 25Morrisville $186 $169 -5.7% 96 90% $5,742 10Newtown $386 $387 -0.6% 52 95% $51,429 22UMT $762 $849 4.1% 118 90% $51,768 7Solebury $788 $629 -32.5% 118 91% $39,598 9Buckingham $501 $572 17.7% 109 92% $74,990 17Northampton $389 $402 1.5% 65 94% $76,434 28Doylestown $414 $410 -1.1% 95 91% $34,055 13Bucks Cty $329 $342 3.9% 86 92% $973,113 481
20092008 Full Yr 2009 200
LMT $495 $453 73 91% $59,355 25Morrisville $209 $179 79 90% $8,772 7Newtown $401 $389 59 93% $45,901 23UMT $791 $815 111 87% $30,965 7Solebury $763 $932 118 87% $39,132 7Buckingham $597 $486 89 91% $43,279 20Northampton $432 $396 82 92% $64,220 27Doylestown $451 $415 85 92% $27,378 11Bucks Cty $353 $329 82 92% $841,165 480
www.HeatherJackman.com

versus 2009ARKET RESEARCH from TREND MLS DATA
See NotesYr YTD Yr over Yr % Change INVENTORY below
Units Sales $ % Unit % Units Change Months Avg Price Change9 201055 188 31.2% 43.5% 223 -11.2% 8.6 $520 -0.2%00 34 -34.5% -30.6% 92 -4.2% 13.0 $209 -2.2%24 133 12.0% 12.7% 146 -1.4% 7.3 $474 2.6%72 61 67.2% 60.5% 141 5.2% 17.8 $1,266 -1.9%93 63 1.2% 50.0% 170 -2.3% 17.9 $1,393 11.2%74 131 73.3% 47.2% 240 -7.0% 13.3 $782 1.9%87 190 19.0% 17.3% 262 4.8% 10.0 $529 1.5%35 83 24.4% 25.8% 128 -1.5% 10.1 $532 -4.8%12 2845 15.7% 11.4% 4634 0.9% 10.9 $487 -1.7%
08 200951 131 251 11.8 $52274 49 96 11.5 $21331 118 148 7.9 $46371 38 134 22.3 $1,29178 42 174 22.5 $1,25204 89 258 17.8 $76778 162 250 10.5 $52114 66 130 11.6 $55806 2554 4593 11.5 $495
Absorption Methods:2010 Uses Rolling 12 MoAverage Unit Sales

Per Year Appreciation SF Homes (ex Condos) Higher Volume Markets
Source: COLDWELL BANKER HEARTHSIDE REALTORS MARKET RESEARCH from MLS data
L. Makefield Twp Newtown Twp Northampton Twp Buckingham Twp
Apprec Units Apprec Units Apprec Units Apprec Units
2009 Avg$ $462 $386 $389 $501
2009 -6.7% 255 -3.7% 224 -9.9% 287 -16.1% 174
2008 3.1% 251 -2.4% 231 -2.3% 278 -2.9% 204
2007 -6.4% 379 -0.1% 260 -3.3% 351 1.7% 252
2006 3.6% 355 10.9% 299 8.2% 376 5.2% 257
2005 11.6% 432 6.9% 354 8.9% 437 10.4% 329
2004 10.4% 465 12.0% 360 10.7% 457 10.6% 288
2003 11.7% 465 11.9% 344 5.5% 410 5.4% 279
2002 9.8% 427 14.5% 285 14.6% 398 15.2% 259
2001 13.5% 453 5.7% 321 15.3% 409 17.9% 239
2000 Avg$ $288 445 $229 307 $249 377 $329 279
Doylestown Twp Falls Twp Middletown Twp Bristol Twp
Apprec Units Apprec Units Apprec Units Apprec Units
2009 Avg$ $414 $232 $288 $179
2009 -8.2% 135 -5.9% 215 -5.3% 323 -7.6% 501
2008 -0.2% 114 -6.4% 202 -7.9% 309 -8.4% 490
2007 -5.9% 168 2.5% 284 0.4% 347 -0.1% 561
2006 1.8% 178 1.4% 282 7.5% 407 5.9% 593
2005 14.9% 189 13.6% 280 10.0% 427 15.9% 738
2004 10.2% 198 20.8% 304 11.8% 467 11.3% 711
2003 5.8% 184 12.5% 269 11.7% 406 18.1% 629
2002 21.2% 182 13.3% 279 11.9% 397 13.9% 589
2001 9.1% 164 7.3% 237 12.5% 366 5.8% 601
2000 Avg$ $266 175 $135 266 $176 369 $109 539
Bucks County Morrisville Boro
Apprec Units Apprec Units
2009 Avg$ $329 $186
2009 -6.8% 4812 -10.9% 100
2008 -6.7% 4806 -8.1% 74
2007 0.6% 6048 1.4% 103
2006 4.1% 6408 0.7% 133
2005 11.6% 7454 18.6% 144
2004 13.1% 7470 19.1% 159
2003 10.0% 6893 9.7% 144
2002 15.6% 6429 12.8% 116
2001 7.5% 6364 4.9% 138
2000 Avg$ $209 6275 $121 123
Appreciation measured by Change in Sold Average Price year over year
MLS Stats are not held beyond 2000 base year
2000 Avg$ displays Base Year Average Price for the Indicated Market
2009 Avg$ displays Average Price for the Indicated Market

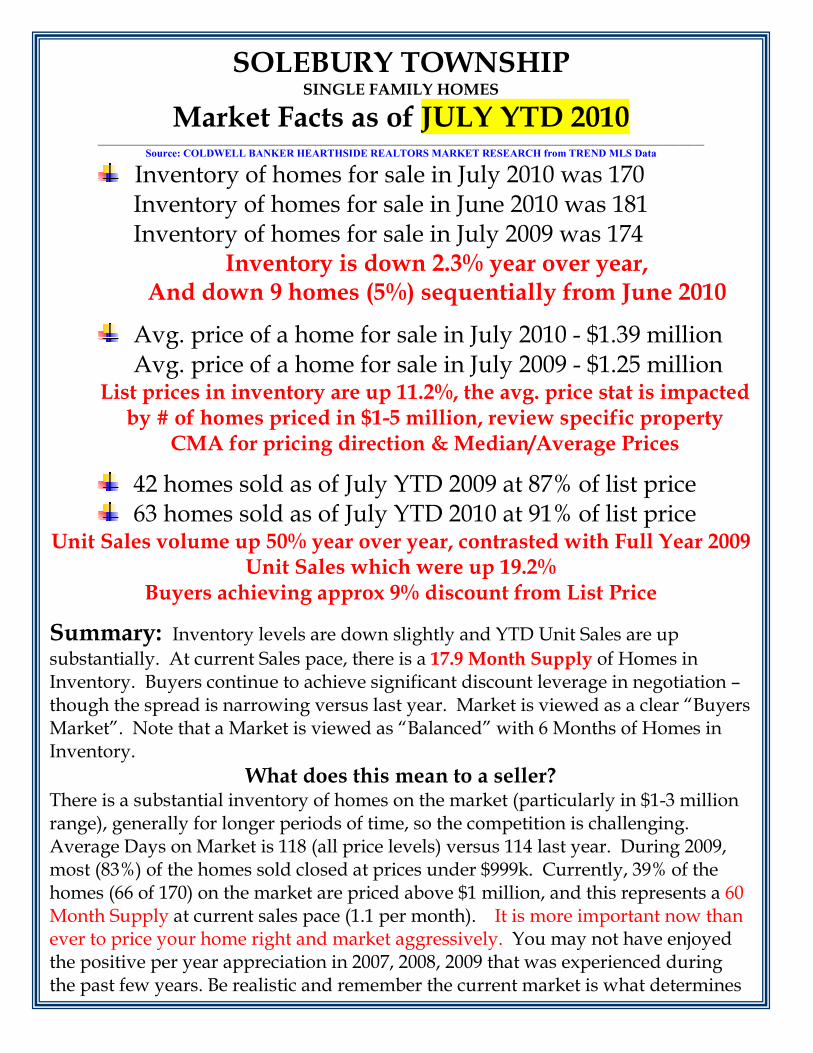
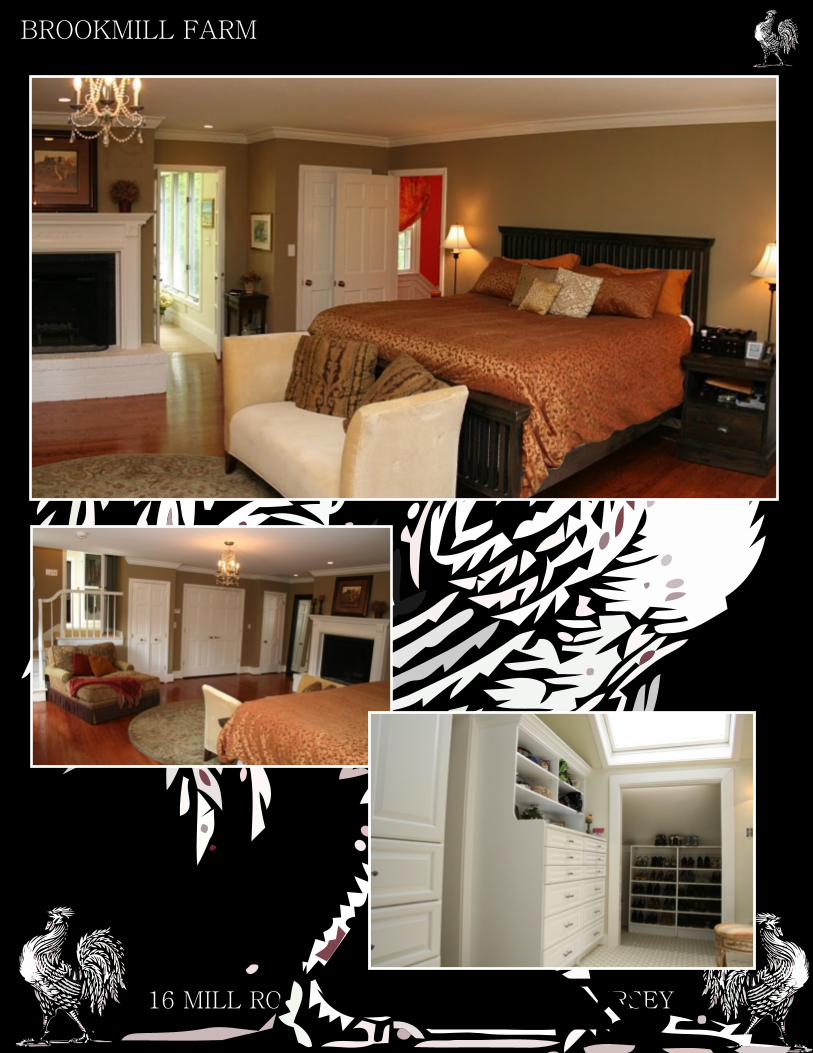
BROOKMILL FARM
16 MILL ROAD LAMBERTVILLE NEW JERSEY

BROOKMILL FARM
16 MILL ROAD LAMBERTVILLE NEW JERSEY

BROOKMILL FARM
16 MILL ROAD LAMBERTVILLE NEW JERSEY
www.BrookmillFarm.com

BROOKMILL FARM
16 MILL ROAD LAMBERTVILLE NEW JERSEY
www.BrookmillFarm.com

BROOKMILL FARM
16 MILL ROAD LAMBERTVILLE NEW JERSEY
BROOKMILL FARM
16 MILL ROAD LAMBERTVILLE NEW JERSEY

BROOKMILL FARM
16 MILL ROAD LAMBERTVILLE NEW JERSEY

BROOKMILL FARM
16 MILL ROAD LAMBERTVILLE NEW JERSEY
www.BrookmillFarm.com

BROOKMILL FARM
16 MILL ROAD LAMBERTVILLE NEW JERSEY

BROOKMILL FARM
16 MILL ROAD LAMBERTVILLE NEW JERSEY
BROOKMILL FARM
16 MILL ROAD LAMBERTVILLE NEW JERSEY

BROOKMILL FARM
16 MILL ROAD LAMBERTVILLE NEW JERSEY

BROOKMILL FARM
16 MILL ROAD LAMBERTVILLE NEW JERSEY

BROOKMILL FARM
16 MILL ROAD LAMBERTVILLE NEW JERSEY
A captivating 14-acre compound, Brookmill Farm is an historic country retreat situated an hour from Manhattan and minutes from the famous artistic communities of Lambertville, NJ and New Hope, PA. The property’s main house is a four bedroom, colonial Bank style home dating back to 1807, which boasts a new wrap-around columned porch. The recently exposed exterior with original stonework anchors an alfresco dining area under a charming pergola. Outbuildings include a large, two bedroom guest cottage, a two-stall barn with workshop and hayloft, a studio converted to a gym, and a three car garage with updated carriage-style doors. The centerpiece of the property’s summer entertainment is the pool house; the original stone building on the property, which overlooks the heated lap pool. The downstairs section of the pool house has been restored to its original “speakeasy” format, complete with custom bar, kitchenette, and half bath. The striking, nautical themed rooftop lounge area was designed in the mid 1990’s by the curator for the Museum of Modern Art in New York City.

BROOKMILL FARM
The long, stone wall lined, private driveway leads you into this dream property with mature trees, a trout-stocked pond frequented by blue heron and ducks, a babbling brook with a foot bridge over a waterfall, and another bridge leading to the tennis court. The extensive perennial gardens have been professionally redesigned and labeled by the head master gardener from the prestigious Cranbrook Institute in Bloomfield Hills, Michigan. Dramatic, tiered perennial gardens in the back of the main house are accessed by stone steps and peacefully watched over by an ancient Aphrodite-style garden fountain. The steps lead you on a path to an old rose garden and to a gazebo, the perfect spot to watch the setting sun. Brookmill Farm was once home to the theater-owning Fox family of Philadelphia, who used the property as their playground in the country. Whimsical garden decorations installed by the Fox family can still be found amongst the bucolic grounds. Stone garden frog fountains dot the property, a favorite of which has been updated with an automatic timer signaling cocktail hour. Another noteworthy resident was Brian Garfield, author of “Deathwish”, a book which later was developed into a movie starring Charles Bronson. Brian wrote the book while he owned Brookmill Farm and mailed the draft from the property. As you step inside the main house, an elegant foyer reveals a formal living room with restored original paneling, beamed ceilings, and raised panel window frames. The paneled Inglenook stone fireplace lends additional charm and warmth to this inviting space flanked by three sets of double French doors leading out to the porch. A walk-in stone fireplace anchors the dining room that is situated in the original part of the home. The Dutch door in the dining room opens to the alfresco dining porch overlooking the brook and the pond. A completely new kitchen was installed in 2010 and features Viking appliances, granite countertops, a glass tile backsplash and radiant heat floors. Original stonewalls in the adjacent gathering room are enhanced with local reclaimed barn wood. This room is flooded with sunlight as it streams in through eleven new windows in the vaulted two story section of the home. The old door on the wine cellar completes the vintage feel of the room. An authentically restored staircase appointed with era appropriate millwork leads to a sophisticated, three-room master suite. The spacious, chic master bedroom with wood burning fireplace adjoins a glass-walled sunroom that overlooks the back gardens. The five closets in the master bedroom provide ample space for two, but the real surprise for a home of this era is in the adjoining room that has been converted into a spectacular closet sanctuary. Custom glass front cabinets include 6 floor-to-ceiling wardrobes, twenty drawers and a shoe room. Two pedestal sinks, a marble tile shower and a deep, jetted tub enhance the master bath. This level also contains the laundry area with new appliances and the enchanting pink "Princess Suite" bedroom, with its own en suite bath and walk-in closet. As you descend the rear staircase, you enter the "middle" floor of the home with two more bedrooms and en suite baths. One of the bedrooms has a lovely sitting room that looks out to the back gardens and functions equally well as a family room and office. The guest cottage has two levels, featuring two bedrooms (one with wood burning fireplace), a sitting room that could easily be used as a third bedroom, a new 2010 kitchen with granite countertops, two full baths, a laundry room and a screened-in porch. The main home and out buildings have been thoroughly updated with close attention paid to the property’s colonial heritage. Property system upgrades include newer septic system, newer well pump, central air and heater in main house, cottage and pool house and a new hot water tank in the pool house. West Amwell is situated in the rolling Sourland Mountain Region of Hunterdon County, encompassing a complex ecosystem of forest, wetlands and grasslands. Less than three miles from Lambertville, New Jersey and New Hope, Pennsylvania, Brookmill Farm offers access to the recreational activities along the Delaware River, including the historic Prallsville Mills area in Stockton. Routes 202, 206 and Interstate 95 are within close proximity.

BROOKMILL FARM
16 MILL ROAD LAMBERTVILLE NEW JERSEY
HEATHER ANN JACKMANP. MICHAEL JACKMAN