Embed Size (px)
Citation preview

Page 1 of 12
PRESS EMBARGO: 8.00 AM (6.00 AM GMT), 26 September 2018
NEW COMMERCIAL VEHICLE REGISTRATIONS
EUROPEAN UNION1
July and August 2018
Commercial vehicle registrations: +4.8% eight months into 2018; +2.3% in
July and +7.3% in August
Total new commercial vehicles
New commercial vehicle registrations increased both in July and August 2018 (+2.3% and +7.3% respectively), marking the fifth consecutive month of growth. All segments performed well during the summer months. The major EU markets saw strong demand in August: Spain (+18.0%), France (+13.3%) and Germany (+11.7%) posted double‐digit increases, although the United Kingdom (+2.4%) and Italy (+1.7%) showed more modest growth.
During the first eight months of 2018, the EU market expanded by 4.8% to reach 1.6 million new commercial vehicles. Spain saw the strongest growth over this period (+10.8%), followed by France (+6.0%), Germany (+4.4%) and Italy (+1.6%). By contrast, the UK market for commercial vehicles contracted by 3.0% so far this year.
1 Malta not available

Page 2 of 12
New light commercial vehicles (LCV) up to 3.5t2
In August 2018, demand for light commercial vehicles grew by 7.5%, mainly driven by the excellent performance of the new EU member states (+14.5%). Among the five major markets, Spain (+20.2%), France (+12.7%), Germany (+12.7%) and the UK (+5.0%) did very well, but demand declined in Italy (‐3.0%). In total, 132,905 new vans were registered across the EU in August.
From January to August 2018, EU demand for vans increased by 4.8% compared to one year ago, with a total of 1,352,326 units registered so far. Results were diverse among the major EU markets, with the United Kingdom (‐2.2%) and Italy (‐0.4%) posting declines, while Spain (+11.6%), France (+5.7%) and Germany (+5.4%) all recorded growth.
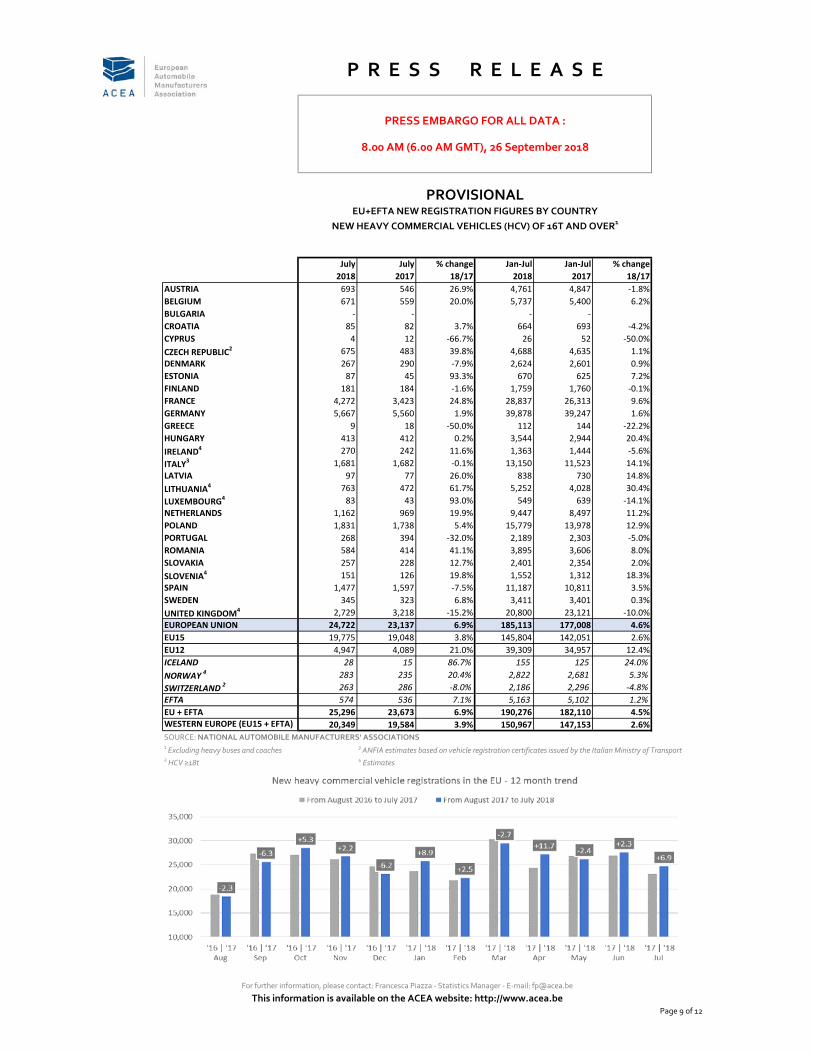
New heavy commercial vehicles (HCV) of 16t and over3
August 2018 registrations in the heavy truck segment were significantly higher (+8.6%) than one year ago. France (+15.6%), Spain (+10.7%), Germany (+9.6%) and Italy (+4.7%) contributed positively to the EU’s growth, but registrations fell in the UK (‐9.4%).
Eight months into the year, demand for new heavy trucks remained positive across the EU, registrations were up 5.1% compared to 2017. Overall, 205,628 new vehicles were registered so far in 2018. The only major market to post a decline was the United Kingdom (‐8.9%), while Italy (+13.3%), France (+10.0%), Spain (+4.2%) and Germany (+2.5%) performed well so far this year.
New medium and heavy commercial vehicles (MHCV) over 3.5t4
In August 2018, new truck registrations grew for the third consecutive month (+7.6%), counting 25,541 units. Strong growth was observed in almost all major EU markets except for the UK (‐7.9%); the French market saw the strongest increase (+16.1%) in August.
Over the first eight months of the year, EU demand for new trucks went up by 4.8% to reach 252,999 registrations across the region. Italy (+11.8%), France (+8.9%), Spain (+5.6%) and Germany (+2.0%) performed well, but new truck registrations fell in the United Kingdom (‐6.9%).
New medium and heavy buses & coaches (MHBC) over 3.5t
August 2018 results for the bus and coach segment were similar to last year, following July’s strong recovery in demand (+18.1%). The five key EU markets showed diverging trends: France (+19.3%), Germany (+23.6%) and especially Italy (+160.1%) posted excellent results, while the Spanish (‐54.9%) and UK (‐18.1%) markets faced substantial declines.
From January to August 2018, EU bus and coach registrations were slightly higher than one year ago (+1.3%), counting 27,527 new vehicles. Demand increased significantly in Italy (+35.2%), but the market contracted in the United Kingdom (‐13.0%), Germany (‐3.6%) and Spain (‐2.8%). The new EU member states made a substantial contribution (+16.1%) to the overall result.
2 Including light buses & coaches
3 Excluding heavy buses & coaches
4 Excluding medium and heavy buses & coaches

August August % change Jan‐Aug Jan‐Aug % change
2018 2017 18/17 2018 2017 18/17
AUSTRIA 3,539 3,226 9.7% 30,147 27,372 10.1%
BELGIUM 5,805 5,415 7.2% 53,664 53,970 ‐0.6%
BULGARIA 555 535 3.7% 3,907 3,579 9.2%
CROATIA 541 483 12.0% 6,148 5,949 3.3%
CYPRUS 86 99 ‐13.1% 1,218 1,282 ‐5.0%
CZECH REPUBLIC 1,784 1,876 ‐4.9% 13,013 12,499 4.1%
DENMARK 2,988 3,216 ‐7.1% 22,181 23,801 ‐6.8%
ESTONIA 441 447 ‐1.3% 3,646 3,222 13.2%
FINLAND 1,063 1,261 ‐15.7% 10,584 10,520 0.6%
FRANCE 26,204 23,241 12.7% 300,473 284,387 5.7%
GERMANY 25,203 22,361 12.7% 183,504 174,126 5.4%
GREECE 441 472 ‐6.6% 4,642 4,526 2.6%
HUNGARY 1,761 1,485 18.6% 14,249 11,754 21.2%
IRELAND3 1,418 1,380 2.8% 22,504 21,055 6.9%
ITALY4 9,000 9,274 ‐3.0% 113,245 113,739 ‐0.4%
LATVIA 245 178 37.6% 1,611 1,373 17.3%
LITHUANIA 252 334 ‐24.6% 2,466 2,214 11.4%
LUXEMBOURG 367 402 ‐8.7% 3,194 3,125 2.2%
NETHERLANDS 5,498 5,104 7.7% 55,205 51,928 6.3%
POLAND 5,210 4,744 9.8% 43,312 39,119 10.7%
PORTUGAL 2,872 2,474 16.1% 25,099 24,178 3.8%
ROMANIA 2,308 1,402 64.6% 12,359 10,468 18.1%
SLOVAKIA 758 582 30.2% 5,797 4,897 18.4%
SLOVENIA 977 859 13.7% 8,373 8,045 4.1%
SPAIN 15,414 12,826 20.2% 147,833 132,469 11.6%
SWEDEN 1,781 4,375 ‐59.3% 43,553 34,982 24.5%
UNITED KINGDOM 16,394 15,619 5.0% 220,399 225,311 ‐2.2%
EUROPEAN UNION 132,905 123,670 7.5% 1,352,326 1,289,890 4.8%
EU155 117,987 110,646 6.6% 1,236,227 1,185,489 4.3%
EU126 14,918 13,024 14.5% 116,099 104,401 11.2%
ICELAND 131 153 ‐14.4% 1,403 1,454 ‐3.5%
NORWAY 3,499 3,667 ‐4.6% 24,306 23,401 3.9%
SWITZERLAND 2,669 2,496 6.9% 21,252 20,855 1.9%
EFTA 6,299 6,316 ‐0.3% 46,961 45,710 2.7%
EU + EFTA 139,204 129,986 7.1% 1,399,287 1,335,600 4.8%WESTERN EUROPE (EU15 + EFTA) 124,286 116,962 6.3% 1,283,188 1,231,199 4.2%
SOURCE: NATIONAL AUTOMOBILE MANUFACTURERS' ASSOCIATIONS 1 Malta not available 4 ANFIA estimates2 Including light buses and coaches 5 Member states before the 2004 enlargement3 LCV ≤6t 6 Member states having joined the EU since 2004
Page 3 of 12
P R E S S R E L E A S E
PRESS EMBARGO FOR ALL DATA :
8.00 AM (6.00 AM GMT), 26 September 2018
EU+EFTA1 NEW REGISTRATION FIGURES BY COUNTRY
NEW LIGHT COMMERCIAL VEHICLES (LCV) UP TO 3.5T2
For further information, please contact: Francesca Piazza ‐ Statistics Manager ‐ E‐mail: [email protected]
This information is available on the ACEA website: http://www.acea.be Next press release on commercial vehicles to be issued on Thursday 25 October 2018
PROVISIONAL

August August % change Jan‐Aug Jan‐Aug % change
2018 2017 18/17 2018 2017 18/17
AUSTRIA 532 498 6.8% 5,293 5,345 ‐1.0%
BELGIUM 589 512 15.0% 6,326 5,912 7.0%
BULGARIA ‐ ‐ ‐ ‐
CROATIA 75 59 27.1% 739 752 ‐1.7%
CYPRUS 2 1 100.0% 28 53 ‐47.2%
CZECH REPUBLIC2 518 509 1.8% 5,206 5,144 1.2%
DENMARK 414 398 4.0% 3,038 2,999 1.3%
ESTONIA 55 48 14.6% 725 673 7.7%
FINLAND 198 219 ‐9.6% 1,957 1,979 ‐1.1%
FRANCE 2,219 1,920 15.6% 31,056 28,233 10.0%
GERMANY 5,422 4,947 9.6% 45,300 44,194 2.5%
GREECE 14 16 ‐12.5% 126 160 ‐21.3%
HUNGARY 421 354 18.9% 3,965 3,298 20.2%
IRELAND4 162 128 26.6% 1,506 1,572 ‐4.2%
ITALY3 1,161 1,109 4.7% 14,311 12,632 13.3%
LATVIA 87 68 27.9% 925 798 15.9%
LITHUANIA4 590 540 9.3% 5,842 4,568 27.9%
LUXEMBOURG4 97 71 36.6% 646 710 ‐9.0%
NETHERLANDS 919 764 20.3% 10,365 9,261 11.9%
POLAND 1,830 1,688 8.4% 17,609 15,666 12.4%
PORTUGAL 298 361 ‐17.5% 2,487 2,664 ‐6.6%
ROMANIA 531 374 42.0% 4,426 3,980 11.2%
SLOVAKIA 262 209 25.4% 2,663 2,563 3.9%
SLOVENIA4 184 143 28.7% 1,753 1,455 20.5%
SPAIN 1,335 1,206 10.7% 12,522 12,017 4.2%
SWEDEN 478 464 3.0% 3,889 3,865 0.6%
UNITED KINGDOM4 1,856 2,048 ‐9.4% 22,925 25,173 ‐8.9%
EUROPEAN UNION 20,249 18,654 8.6% 205,628 195,666 5.1%
EU15 15,694 14,661 7.0% 161,747 156,716 3.2%
EU12 4,555 3,993 14.1% 43,881 38,950 12.7%
ICELAND 21 22 ‐4.5% 176 149 18.1%
NORWAY 4 448 384 16.7% 3,270 3,065 6.7%
SWITZERLAND 2 290 330 ‐12.1% 2,476 2,626 ‐5.7%
EFTA 759 736 3.1% 5,922 5,840 1.4%
EU + EFTA 21,008 19,390 8.3% 211,550 201,506 5.0%WESTERN EUROPE (EU15 + EFTA) 16,453 15,397 6.9% 167,669 162,556 3.1%
SOURCE: NATIONAL AUTOMOBILE MANUFACTURERS' ASSOCIATIONS 1 Excluding heavy buses and coaches 3 ANFIA estimates based on vehicle registration certificates issued by the Italian Ministry of Transport2 HCV ≥18t 4 Estimates
Page 4 of 12
NEW HEAVY COMMERCIAL VEHICLES (HCV) OF 16T AND OVER1
For further information, please contact: Francesca Piazza ‐ Statistics Manager ‐ E‐mail: [email protected]
This information is available on the ACEA website: http://www.acea.be
P R E S S R E L E A S E
PRESS EMBARGO FOR ALL DATA :
8.00 AM (6.00 AM GMT), 26 September 2018
EU+EFTA NEW REGISTRATION FIGURES BY COUNTRY
PROVISIONAL

August August % change Jan‐Aug Jan‐Aug % change
2018 2017 18/17 2018 2017 18/17
AUSTRIA 590 568 3.9% 5,595 5,665 ‐1.2%
BELGIUM 703 616 14.1% 7,486 6,897 8.5%
BULGARIA ‐ ‐ ‐ ‐
CROATIA 94 83 13.3% 1,012 969 4.4%
CYPRUS 6 3 100.0% 77 76 1.3%
CZECH REPUBLIC 662 602 10.0% 6,375 6,147 3.7%
DENMARK 442 441 0.2% 3,305 3,304 0.03%
ESTONIA 59 55 7.3% 782 703 11.2%
FINLAND 260 253 2.8% 2,575 2,366 8.8%
FRANCE 2,581 2,224 16.1% 35,900 32,972 8.9%
GERMANY 7,739 7,178 7.8% 63,027 61,774 2.0%
GREECE 33 28 17.9% 244 309 ‐21.0%
HUNGARY 486 410 18.5% 4,370 3,636 20.2%
IRELAND 176 160 10.0% 1,803 1,852 ‐2.6%
ITALY2 1,510 1,396 8.2% 17,680 15,813 11.8%
LATVIA 96 73 31.5% 969 826 17.3%
LITHUANIA3595 546 9.0% 5,918 4,635 27.7%
LUXEMBOURG 99 78 26.9% 747 828 ‐9.8%
NETHERLANDS 1,020 867 17.6% 11,467 10,204 12.4%
POLAND 2,026 1,896 6.9% 19,143 17,058 12.2%
PORTUGAL 426 423 0.7% 3,119 3,212 ‐2.9%
ROMANIA 554 397 39.5% 4,612 4,191 10.0%
SLOVAKIA 306 255 20.0% 2,976 2,854 4.3%
SLOVENIA3186 153 21.6% 1,846 1,561 18.3%
SPAIN 1,636 1,539 6.3% 15,660 14,828 5.6%
SWEDEN 513 503 2.0% 4,231 4,214 0.4%
UNITED KINGDOM32,743 2,979 ‐7.9% 32,080 34,443 ‐6.9%
EUROPEAN UNION 25,541 23,726 7.6% 252,999 241,337 4.8%
EU15 20,471 19,253 6.3% 204,919 198,681 3.1%
EU12 5,070 4,473 13.3% 48,080 42,656 12.7%
ICELAND 35 35 0.0% 290 276 5.1%
NORWAY 625 546 14.5% 4,898 4,396 11.4%
SWITZERLAND 376 411 ‐8.5% 3,111 3,176 ‐2.0%
EFTA 1,036 992 4.4% 8,299 7,848 5.7%
EU + EFTA 26,577 24,718 7.5% 261,298 249,185 4.9%WESTERN EUROPE (EU15 + EFTA) 21,507 20,245 6.2% 213,218 206,529 3.2%
SOURCE: NATIONAL AUTOMOBILE MANUFACTURERS' ASSOCIATIONS 1 Excluding buses and coaches over 3.5t2 ANFIA estimates based on vehicle registration certificates issued by the Italian Ministry of Transport3 Estimates
Page 5 of 12
NEW MEDIUM AND HEAVY COMMERCIAL VEHICLES (MHCV) OVER 3.5T1
For further information, please contact: Francesca Piazza ‐ Statistics Manager ‐ E‐mail: [email protected]
This information is available on the ACEA website: http://www.acea.be
P R E S S R E L E A S E
PRESS EMBARGO FOR ALL DATA :
8.00 AM (6.00 AM GMT), 26 September 2018
EU+EFTA NEW REGISTRATION FIGURES BY COUNTRY
PROVISIONAL

August August % change Jan‐Aug Jan‐Aug % change
2018 2017 18/17 2018 2017 18/17
AUSTRIA 116 161 ‐28.0% 706 811 ‐12.9%
BELGIUM 94 101 ‐6.9% 755 691 9.3%
BULGARIA ‐ ‐ ‐ ‐
CROATIA 17 4 325.0% 195 163 19.6%
CYPRUS ‐ ‐ ‐ ‐
CZECH REPUBLIC 108 34 217.6% 754 442 70.6%
DENMARK 48 142 ‐66.2% 394 594 ‐33.7%
ESTONIA 10 15 ‐33.3% 125 190 ‐34.2%
FINLAND 91 128 ‐28.9% 355 360 ‐1.4%
FRANCE 1,266 1,061 19.3% 4,452 4,070 9.4%
GERMANY 560 453 23.6% 4,202 4,358 ‐3.6%
GREECE 17 14 21.4% 179 129 38.8%
HUNGARY 24 93 ‐74.2% 415 401 3.5%
IRELAND 25 44 ‐43.2% 343 246 39.4%
ITALY1 554 213 160.1% 3,061 2,264 35.2%
LATVIA 14 9 55.6% 88 103 ‐14.6%
LITHUANIA2100 104 ‐3.8% 438 276 58.7%
LUXEMBOURG 13 7 85.7% 185 168 10.1%
NETHERLANDS 14 46 ‐69.6% 381 473 ‐19.5%
POLAND 224 188 19.1% 1,812 1,557 16.4%
PORTUGAL 20 15 33.3% 283 274 3.3%
ROMANIA 112 110 1.8% 685 674 1.6%
SLOVAKIA 20 18 11.1% 192 208 ‐7.7%
SLOVENIA28 31 ‐74.2% 105 129 ‐18.6%
SPAIN 60 133 ‐54.9% 1,966 2,022 ‐2.8%
SWEDEN 178 485 ‐63.3% 577 962 ‐40.0%
UNITED KINGDOM2393 480 ‐18.1% 4,879 5,610 ‐13.0%
EUROPEAN UNION 4,086 4,089 ‐0.1% 27,527 27,175 1.3%
EU15 3,449 3,483 ‐1.0% 22,718 23,032 ‐1.4%
EU12 637 606 5.1% 4,809 4,143 16.1%
ICELAND 13 13 0.0% 77 127 ‐39.4%
NORWAY 51 120 ‐57.5% 848 807 5.1%
SWITZERLAND 70 71 ‐1.4% 378 396 ‐4.5%
EFTA 134 204 ‐34.3% 1,303 1,330 ‐2.0%
EU + EFTA 4,220 4,293 ‐1.7% 28,830 28,505 1.1%WESTERN EUROPE (EU15 + EFTA) 3,583 3,687 ‐2.8% 24,021 24,362 ‐1.4%
SOURCE: NATIONAL AUTOMOBILE MANUFACTURERS' ASSOCIATIONS 1 ANFIA estimates based on vehicle registration certificates issued by the Italian Ministry of Transport2 Estimates
Page 6 of 12
NEW MEDIUM AND HEAVY BUSES & COACHES (MHBC) OVER 3.5T
For further information, please contact: Francesca Piazza ‐ Statistics Manager ‐ E‐mail: [email protected]
This information is available on the ACEA website: http://www.acea.be
P R E S S R E L E A S E
PRESS EMBARGO FOR ALL DATA :
8.00 AM (6.00 AM GMT), 26 September 2018
EU+EFTA NEW REGISTRATION FIGURES BY COUNTRY
PROVISIONAL

August August % change Jan‐Aug Jan‐Aug % change
2018 2017 18/17 2018 2017 18/17
AUSTRIA 4,245 3,955 7.3% 36,448 33,848 7.7%
BELGIUM 6,602 6,132 7.7% 61,905 61,558 0.6%
BULGARIA1555 535 3.7% 3,907 3,579 9.2%
CROATIA 652 570 14.4% 7,355 7,081 3.9%
CYPRUS2 92 102 ‐9.8% 1,295 1,358 ‐4.6%
CZECH REPUBLIC 2,554 2,512 1.7% 20,142 19,088 5.5%
DENMARK 3,478 3,799 ‐8.4% 25,880 27,699 ‐6.6%
ESTONIA 510 517 ‐1.4% 4,553 4,115 10.6%
FINLAND 1,414 1,642 ‐13.9% 13,514 13,246 2.0%
FRANCE 30,051 26,526 13.3% 340,825 321,429 6.0%
GERMANY 33,502 29,992 11.7% 250,733 240,258 4.4%
GREECE 491 514 ‐4.5% 5,065 4,964 2.0%
HUNGARY 2,271 1,988 14.2% 19,034 15,791 20.5%
IRELAND 1,619 1,584 2.2% 24,650 23,153 6.5%
ITALY 11,064 10,883 1.7% 133,986 131,816 1.6%
LATVIA 355 260 36.5% 2,668 2,302 15.9%
LITHUANIA 947 984 ‐3.8% 8,822 7,125 23.8%
LUXEMBOURG 479 487 ‐1.6% 4,126 4,121 0.1%
NETHERLANDS 6,532 6,017 8.6% 67,053 62,605 7.1%
POLAND 7,460 6,828 9.3% 64,267 57,734 11.3%
PORTUGAL 3,318 2,912 13.9% 28,501 27,664 3.0%
ROMANIA 2,974 1,909 55.8% 17,656 15,333 15.2%
SLOVAKIA 1,084 855 26.8% 8,965 7,959 12.6%
SLOVENIA 1,171 1,043 12.3% 10,324 9,735 6.1%
SPAIN 17,110 14,498 18.0% 165,459 149,319 10.8%
SWEDEN 2,472 5,363 ‐53.9% 48,361 40,158 20.4%
UNITED KINGDOM 19,530 19,078 2.4% 257,358 265,364 ‐3.0%
EUROPEAN UNION 162,532 151,485 7.3% 1,632,852 1,558,402 4.8%
EU15 141,907 133,382 6.4% 1,463,864 1,407,202 4.0%
EU12 20,625 18,103 13.9% 168,988 151,200 11.8%
ICELAND 179 201 ‐10.9% 1,770 1,857 ‐4.7%
NORWAY 4,175 4,333 ‐3.6% 30,052 28,604 5.1%
SWITZERLAND 3,115 2,978 4.6% 24,741 24,427 1.3%
EFTA 7,469 7,512 ‐0.6% 56,563 54,888 3.1%
EU + EFTA 170,001 158,997 6.9% 1,689,415 1,613,290 4.7%WESTERN EUROPE (EU15 + EFTA) 149,376 140,894 6.0% 1,520,427 1,462,090 4.0%
SOURCE: NATIONAL AUTOMOBILE MANUFACTURERS' ASSOCIATIONS 1 Data for MHCV and MHBC not available2 Data for MHBC not available
Page 7 of 12
TOTAL NEW COMMERCIAL VEHICLES
For further information, please contact: Francesca Piazza ‐ Statistics Manager ‐ E‐mail: [email protected]
This information is available on the ACEA website: http://www.acea.be
P R E S S R E L E A S E
PRESS EMBARGO FOR ALL DATA :
8.00 AM (6.00 AM GMT), 26 September 2018
EU+EFTA NEW REGISTRATION FIGURES BY COUNTRY
PROVISIONAL

July July % change Jan‐Jul Jan‐Jul % change
2018 2017 18/17 2018 2017 18/17
AUSTRIA 3,338 3,408 ‐2.1% 26,608 24,146 10.2%
BELGIUM 5,172 5,392 ‐4.1% 47,859 48,555 ‐1.4%
BULGARIA 353 344 2.6% 3,352 3,044 10.1%
CROATIA 729 831 ‐12.3% 5,607 5,466 2.6%
CYPRUS 194 187 3.7% 1,132 1,183 ‐4.3%
CZECH REPUBLIC 1,418 1,331 6.5% 11,229 10,623 5.7%
DENMARK 1,894 2,071 ‐8.5% 19,193 20,585 ‐6.8%
ESTONIA 375 337 11.3% 3,205 2,775 15.5%
FINLAND 870 895 ‐2.8% 9,521 9,259 2.8%
FRANCE 33,827 32,172 5.1% 274,269 261,146 5.0%
GERMANY 21,462 21,385 0.4% 158,301 151,765 4.3%
GREECE 648 573 13.1% 4,201 4,054 3.6%
HUNGARY 1,864 1,400 33.1% 12,488 10,269 21.6%
IRELAND3 4,344 3,944 10.1% 21,086 19,675 7.2%
ITALY4 14,419 14,925 ‐3.4% 104,245 104,465 ‐0.2%
LATVIA 166 186 ‐10.8% 1,366 1,195 14.3%
LITHUANIA 276 281 ‐1.8% 2,214 1,880 17.8%
LUXEMBOURG 424 405 4.7% 2,827 2,723 3.8%
NETHERLANDS 5,744 5,269 9.0% 49,701 46,824 6.1%
POLAND 5,673 4,783 18.6% 38,103 34,375 10.8%
PORTUGAL 2,922 3,008 ‐2.9% 22,227 21,704 2.4%
ROMANIA 1,409 1,155 22.0% 10,051 9,066 10.9%
SLOVAKIA 625 479 30.5% 5,039 4,315 16.8%
SLOVENIA 1,120 960 16.7% 7,396 7,186 2.9%
SPAIN 19,089 18,119 5.4% 132,419 119,643 10.7%
SWEDEN 760 2,522 ‐69.9% 41,772 30,607 36.5%
UNITED KINGDOM 23,309 24,766 ‐5.9% 204,005 209,692 ‐2.7%
EUROPEAN UNION 152,424 151,128 0.9% 1,219,416 1,166,220 4.6%
EU155 138,222 138,854 ‐0.5% 1,118,234 1,074,843 4.0%
EU126 14,202 12,274 15.7% 101,182 91,377 10.7%
ICELAND 141 140 0.7% 1,271 1,322 ‐3.9%
NORWAY 2,247 2,460 ‐8.7% 20,807 19,734 5.4%
SWITZERLAND 2,581 2,305 12.0% 18,583 18,359 1.2%
EFTA 4,969 4,905 1.3% 40,661 39,415 3.2%
EU + EFTA 157,393 156,033 0.9% 1,260,077 1,205,635 4.5%WESTERN EUROPE (EU15 + EFTA) 143,191 143,759 ‐0.4% 1,158,895 1,114,258 4.0%
SOURCE: NATIONAL AUTOMOBILE MANUFACTURERS' ASSOCIATIONS 1 Malta not available 4 ANFIA estimates2 Including light buses and coaches 5 Member states before the 2004 enlargement3 LCV ≤6t 6 Member states having joined the EU since 2004
Page 8 of 12
P R E S S R E L E A S E
PRESS EMBARGO FOR ALL DATA :
8.00 AM (6.00 AM GMT), 26 September 2018
EU+EFTA1 NEW REGISTRATION FIGURES BY COUNTRY
NEW LIGHT COMMERCIAL VEHICLES (LCV) UP TO 3.5T2
For further information, please contact: Francesca Piazza ‐ Statistics Manager ‐ E‐mail: [email protected]
This information is available on the ACEA website: http://www.acea.be
PROVISIONAL
July July % change Jan‐Jul Jan‐Jul % change
2018 2017 18/17 2018 2017 18/17
AUSTRIA 693 546 26.9% 4,761 4,847 ‐1.8%
BELGIUM 671 559 20.0% 5,737 5,400 6.2%
BULGARIA ‐ ‐ ‐ ‐
CROATIA 85 82 3.7% 664 693 ‐4.2%
CYPRUS 4 12 ‐66.7% 26 52 ‐50.0%
CZECH REPUBLIC2 675 483 39.8% 4,688 4,635 1.1%
DENMARK 267 290 ‐7.9% 2,624 2,601 0.9%
ESTONIA 87 45 93.3% 670 625 7.2%
FINLAND 181 184 ‐1.6% 1,759 1,760 ‐0.1%
FRANCE 4,272 3,423 24.8% 28,837 26,313 9.6%
GERMANY 5,667 5,560 1.9% 39,878 39,247 1.6%
GREECE 9 18 ‐50.0% 112 144 ‐22.2%
HUNGARY 413 412 0.2% 3,544 2,944 20.4%
IRELAND4 270 242 11.6% 1,363 1,444 ‐5.6%
ITALY3 1,681 1,682 ‐0.1% 13,150 11,523 14.1%
LATVIA 97 77 26.0% 838 730 14.8%
LITHUANIA4 763 472 61.7% 5,252 4,028 30.4%
LUXEMBOURG4 83 43 93.0% 549 639 ‐14.1%
NETHERLANDS 1,162 969 19.9% 9,447 8,497 11.2%
POLAND 1,831 1,738 5.4% 15,779 13,978 12.9%
PORTUGAL 268 394 ‐32.0% 2,189 2,303 ‐5.0%
ROMANIA 584 414 41.1% 3,895 3,606 8.0%
SLOVAKIA 257 228 12.7% 2,401 2,354 2.0%
SLOVENIA4 151 126 19.8% 1,552 1,312 18.3%
SPAIN 1,477 1,597 ‐7.5% 11,187 10,811 3.5%
SWEDEN 345 323 6.8% 3,411 3,401 0.3%
UNITED KINGDOM4 2,729 3,218 ‐15.2% 20,800 23,121 ‐10.0%
EUROPEAN UNION 24,722 23,137 6.9% 185,113 177,008 4.6%
EU15 19,775 19,048 3.8% 145,804 142,051 2.6%
EU12 4,947 4,089 21.0% 39,309 34,957 12.4%
ICELAND 28 15 86.7% 155 125 24.0%
NORWAY 4 283 235 20.4% 2,822 2,681 5.3%
SWITZERLAND 2 263 286 ‐8.0% 2,186 2,296 ‐4.8%
EFTA 574 536 7.1% 5,163 5,102 1.2%
EU + EFTA 25,296 23,673 6.9% 190,276 182,110 4.5%WESTERN EUROPE (EU15 + EFTA) 20,349 19,584 3.9% 150,967 147,153 2.6%
SOURCE: NATIONAL AUTOMOBILE MANUFACTURERS' ASSOCIATIONS 1 Excluding heavy buses and coaches 3 ANFIA estimates based on vehicle registration certificates issued by the Italian Ministry of Transport2 HCV ≥18t 4 Estimates
Page 9 of 12
NEW HEAVY COMMERCIAL VEHICLES (HCV) OF 16T AND OVER1
For further information, please contact: Francesca Piazza ‐ Statistics Manager ‐ E‐mail: [email protected]
This information is available on the ACEA website: http://www.acea.be
P R E S S R E L E A S E
PRESS EMBARGO FOR ALL DATA :
8.00 AM (6.00 AM GMT), 26 September 2018
EU+EFTA NEW REGISTRATION FIGURES BY COUNTRY
PROVISIONAL

July July % change Jan‐Jul Jan‐Jul % change
2018 2017 18/17 2018 2017 18/17
AUSTRIA 746 582 28.2% 5,005 5,097 ‐1.8%
BELGIUM 821 678 21.1% 6,783 6,281 8.0%
BULGARIA ‐ ‐ ‐ ‐
CROATIA 136 117 16.2% 918 886 3.6%
CYPRUS 12 12 0.0% 71 73 ‐2.7%
CZECH REPUBLIC 851 585 45.5% 5,713 5,545 3.0%
DENMARK 287 327 ‐12.2% 2,863 2,863 0.0%
ESTONIA 98 51 92.2% 723 648 11.6%
FINLAND 262 241 8.7% 2,315 2,113 9.6%
FRANCE 5,099 4,068 25.3% 33,319 30,748 8.4%
GERMANY 8,085 7,750 4.3% 55,288 54,596 1.3%
GREECE 17 51 ‐66.7% 211 281 ‐24.9%
HUNGARY 472 447 5.6% 3,884 3,226 20.4%
IRELAND 287 291 ‐1.4% 1,627 1,692 ‐3.8%
ITALY2 2,153 2,163 ‐0.5% 16,170 14,417 12.2%
LATVIA 101 84 20.2% 873 753 15.9%
LITHUANIA3780 479 62.8% 5,323 4,089 30.2%
LUXEMBOURG 90 61 47.5% 648 750 ‐13.6%
NETHERLANDS 1,330 1,090 22.0% 10,449 9,337 11.9%
POLAND 2,037 1,905 6.9% 17,116 15,162 12.9%
PORTUGAL 368 488 ‐24.6% 2,693 2,789 ‐3.4%
ROMANIA 612 439 39.4% 4,058 3,794 7.0%
SLOVAKIA 298 257 16.0% 2,670 2,599 2.7%
SLOVENIA3155 141 9.9% 1,639 1,408 16.4%
SPAIN 1,985 1,955 1.5% 14,024 13,289 5.5%
SWEDEN 371 351 5.7% 3,718 3,711 0.2%
UNITED KINGDOM33,856 4,250 ‐9.3% 28,983 31,460 ‐7.9%
EUROPEAN UNION 31,309 28,863 8.5% 227,084 217,607 4.4%
EU15 25,757 24,346 5.8% 184,096 179,424 2.6%
EU12 5,552 4,517 22.9% 42,988 38,183 12.6%
ICELAND 41 34 20.6% 255 239 6.7%
NORWAY 495 427 15.9% 4,273 3,850 11.0%
SWITZERLAND 350 339 3.2% 2,735 2,765 ‐1.1%
EFTA 886 800 10.8% 7,263 6,854 6.0%
EU + EFTA 32,195 29,663 8.5% 234,347 224,461 4.4%WESTERN EUROPE (EU15 + EFTA) 26,643 25,146 6.0% 191,359 186,278 2.7%
SOURCE: NATIONAL AUTOMOBILE MANUFACTURERS' ASSOCIATIONS 1 Excluding buses and coaches over 3.5t2 ANFIA estimates based on vehicle registration certificates issued by the Italian Ministry of Transport3 Estimates
Page 10 of 12
NEW MEDIUM AND HEAVY COMMERCIAL VEHICLES (MHCV) OVER 3.5T1
For further information, please contact: Francesca Piazza ‐ Statistics Manager ‐ E‐mail: [email protected]
This information is available on the ACEA website: http://www.acea.be
P R E S S R E L E A S E
PRESS EMBARGO FOR ALL DATA :
8.00 AM (6.00 AM GMT), 26 September 2018
EU+EFTA NEW REGISTRATION FIGURES BY COUNTRY
PROVISIONAL

July July % change Jan‐Jul Jan‐Jul % change
2018 2017 18/17 2018 2017 18/17
AUSTRIA 106 74 43.2% 590 650 ‐9.2%
BELGIUM 51 61 ‐16.4% 661 590 12.0%
BULGARIA ‐ ‐ ‐ ‐
CROATIA 10 12 ‐16.7% 178 159 11.9%
CYPRUS ‐ ‐ ‐ ‐
CZECH REPUBLIC 93 23 304.3% 646 408 58.3%
DENMARK 66 45 46.7% 346 452 ‐23.5%
ESTONIA 12 5 140.0% 115 175 ‐34.3%
FINLAND 73 31 135.5% 264 232 13.8%
FRANCE 732 547 33.8% 3,186 3,009 5.9%
GERMANY 415 470 ‐11.7% 3,642 3,905 ‐6.7%
GREECE 22 16 37.5% 162 115 40.9%
HUNGARY 37 26 42.3% 391 308 26.9%
IRELAND 89 14 535.7% 318 202 57.4%
ITALY1 343 196 75.0% 2,507 2,051 22.2%
LATVIA 5 4 25.0% 74 94 ‐21.3%
LITHUANIA229 8 262.5% 338 172 96.5%
LUXEMBOURG 21 6 250.0% 172 161 6.8%
NETHERLANDS 85 23 269.6% 367 427 ‐14.1%
POLAND 165 216 ‐23.6% 1,588 1,369 16.0%
PORTUGAL 18 27 ‐33.3% 263 259 1.5%
ROMANIA 89 78 14.1% 573 564 1.6%
SLOVAKIA 6 4 50.0% 172 190 ‐9.5%
SLOVENIA215 4 275.0% 111 98 13.3%
SPAIN 209 209 0.0% 1,906 1,889 0.9%
SWEDEN 42 139 ‐69.8% 399 477 ‐16.4%
UNITED KINGDOM2425 435 ‐2.3% 4,384 5,067 ‐13.5%
EUROPEAN UNION 3,158 2,673 18.1% 23,353 23,023 1.4%
EU15 2,697 2,293 17.6% 19,167 19,486 ‐1.6%
EU12 461 380 21.3% 4,186 3,537 18.3%
ICELAND 7 17 ‐58.8% 64 113 ‐43.4%
NORWAY 166 81 104.9% 797 687 16.0%
SWITZERLAND 42 41 2.4% 308 325 ‐5.2%
EFTA 215 139 54.7% 1,169 1,125 3.9%
EU + EFTA 3,373 2,812 20.0% 24,522 24,148 1.5%WESTERN EUROPE (EU15 + EFTA) 2,912 2,432 19.7% 20,336 20,611 ‐1.3%
SOURCE: NATIONAL AUTOMOBILE MANUFACTURERS' ASSOCIATIONS 1 ANFIA estimates based on vehicle registration certificates issued by the Italian Ministry of Transport2 Estimates
Page 11 of 12
NEW MEDIUM AND HEAVY BUSES & COACHES (MHBC) OVER 3.5T
For further information, please contact: Francesca Piazza ‐ Statistics Manager ‐ E‐mail: [email protected]
This information is available on the ACEA website: http://www.acea.be
P R E S S R E L E A S E
PRESS EMBARGO FOR ALL DATA :
8.00 AM (6.00 AM GMT), 26 September 2018
EU+EFTA NEW REGISTRATION FIGURES BY COUNTRY
PROVISIONAL

July July % change Jan‐Jul Jan‐Jul % change
2018 2017 18/17 2018 2017 18/17
AUSTRIA 4,190 4,064 3.1% 32,203 29,893 7.7%
BELGIUM 6,044 6,131 ‐1.4% 55,303 55,426 ‐0.2%
BULGARIA1353 344 2.6% 3,352 3,044 10.1%
CROATIA 875 960 ‐8.9% 6,703 6,511 2.9%
CYPRUS2 206 199 3.5% 1,203 1,256 ‐4.2%
CZECH REPUBLIC 2,362 1,939 21.8% 17,588 16,576 6.1%
DENMARK 2,247 2,443 ‐8.0% 22,402 23,900 ‐6.3%
ESTONIA 485 393 23.4% 4,043 3,598 12.4%
FINLAND 1,205 1,167 3.3% 12,100 11,604 4.3%
FRANCE 39,658 36,787 7.8% 310,774 294,903 5.4%
GERMANY 29,962 29,605 1.2% 217,231 210,266 3.3%
GREECE 687 640 7.3% 4,574 4,450 2.8%
HUNGARY 2,373 1,873 26.7% 16,763 13,803 21.4%
IRELAND 4,720 4,249 11.1% 23,031 21,569 6.8%
ITALY 16,915 17,284 ‐2.1% 122,922 120,933 1.6%
LATVIA 272 274 ‐0.7% 2,313 2,042 13.3%
LITHUANIA 1,085 768 41.3% 7,875 6,141 28.2%
LUXEMBOURG 535 472 13.3% 3,647 3,634 0.4%
NETHERLANDS 7,159 6,382 12.2% 60,517 56,588 6.9%
POLAND 7,875 6,904 14.1% 56,807 50,906 11.6%
PORTUGAL 3,308 3,523 ‐6.1% 25,183 24,752 1.7%
ROMANIA 2,110 1,672 26.2% 14,682 13,424 9.4%
SLOVAKIA 929 740 25.5% 7,881 7,104 10.9%
SLOVENIA 1,290 1,105 16.7% 9,146 8,692 5.2%
SPAIN 21,283 20,283 4.9% 148,349 134,821 10.0%
SWEDEN 1,173 3,012 ‐61.1% 45,889 34,795 31.9%
UNITED KINGDOM 27,590 29,451 ‐6.3% 237,372 246,219 ‐3.6%
EUROPEAN UNION 186,891 182,664 2.3% 1,469,853 1,406,850 4.5%
EU15 166,676 165,493 0.7% 1,321,497 1,273,753 3.7%
EU12 20,215 17,171 17.7% 148,356 133,097 11.5%
ICELAND 189 191 ‐1.0% 1,590 1,674 ‐5.0%
NORWAY 2,908 2,968 ‐2.0% 25,877 24,271 6.6%
SWITZERLAND 2,973 2,685 10.7% 21,626 21,449 0.8%
EFTA 6,070 5,844 3.9% 49,093 47,394 3.6%
EU + EFTA 192,961 188,508 2.4% 1,518,946 1,454,244 4.4%WESTERN EUROPE (EU15 + EFTA) 172,746 171,337 0.8% 1,370,590 1,321,147 3.7%
SOURCE: NATIONAL AUTOMOBILE MANUFACTURERS' ASSOCIATIONS 1 Data for MHCV and MHBC not available2 Data for MHBC not available
Page 12 of 12
TOTAL NEW COMMERCIAL VEHICLES
For further information, please contact: Francesca Piazza ‐ Statistics Manager ‐ E‐mail: [email protected]
This information is available on the ACEA website: http://www.acea.be
P R E S S R E L E A S E
PRESS EMBARGO FOR ALL DATA :
8.00 AM (6.00 AM GMT), 26 September 2018
EU+EFTA NEW REGISTRATION FIGURES BY COUNTRY
PROVISIONAL