Embed Size (px)
Citation preview

Everett Farmers Market 2017 Rapid Market Assessment Page 1
July9,2017
Colleen Donovan and Karen Kinney September 27, 2017
EverettFarmersMarket 2017RapidMarketAssessmentReport

Everett Farmers Market 2017 Rapid Market Assessment Page 2
EverettFarmerMarket2017RapidMarketAssessmentReport Colleen Donovan Independent Research Partner [email protected]
Karen Kinney Washington State Farmers Market Association [email protected]
Contents
I. Introduction ............................................................................................................................. 3
I. Estimated Market Attendance ................................................................................................ 6
II. Dot Survey Results ................................................................................................................... 8
III. Constructive Comments & Observations from RMA Team .................................................. 19
IV. Conclusion & Recommendations .......................................................................................... 25
Appendix 1. Dot Survey Questions, Responses, and Counts ........................................................ 28
Appendix 2. Tapestry Demographics ............................................................................................ 30
Tables&Figures Table 1. Estimated Visitors by Hour ............................................................................................................. 6 Table 2. Estimated Visitors by Entrance....................................................................................................... 7 Table 3. Estimated Dot Survey Respondent Spending at the Farmers Market .......................................... 13 Table 4. Estimated Shopper Groups and Farmers Market Sales ................................................................ 14 Table 5. Estimated Dot Survey Respondent Spending at Other Waterfront Businesses and Restaurants 15 Table 6. Respondents’ Ideas to Make Shopping at the Everett Farmers Market Better ............................ 18 Figure 1. 2017 Everett Farmers Market RMA Team .................................................................................... 3 Figure 2. Satellite view of market site .......................................................................................................... 5 Figure 3. Market site map ............................................................................................................................ 5 Figure 4. Estimated number of market visitors by hour, 11:00 am to 3:00 pm .......................................... 7 Figure 5. Where Respondents Live by Location (N = 841) ............................................................................ 8 Figure 6. Where Respondents Live by Location (N = 841) ............................................................................ 9 Figure 7. Where Respondents Live (aggregated) by Market Hour (N=841) ................................................. 9 Figure 8. How Often Respondents Shop at the Market (N = 830) .............................................................. 10 Figure 9. Hour of the Market by Shopper Frequency (N=806) ................................................................... 11 Figure 10. Shopper Frequency by Market Hour (N=806) ............................................................................ 11 Figure 11. How Much Respondents Spent at the Farmers Market (N = 801) ............................................. 12 Figure 12. Estimated Average Farmers Market Spending by Hour ............................................................. 13 Figure 13. How Much Respondents Spent at Other Waterfront Businesses and Restaurants (N = 767) ... 15 Figure 14. Importance of Low Income People’s Ability to Shop at Farmers Market with SNAP EBT (food stamps) or WIC/Senior FMNP (N=816) ....................................................................................................... 16 Figure 15. Primary Reason for Shopping at the Market (N = 862) .............................................................. 17
Everett Farmers Market 2017 Rapid Market Assessment Page 3
I. Introduction On Sunday, July 9, 2017, a Rapid Market Assessment (or “RMA”) was conducted at the Everett Farmers Market in Everett, WA led by Colleen Donovan, in partnership with Karen Kinney of the Washington State Farmers Market Association, and Gary Purves and Karen Erickson, owners/managers of the Everett Farmers Market. This RMA is part of a research project funded through a Cooperative Agreement with the United States Department of Agriculture’s Ag Marketing Service, Local Food Research and Development Division. We are grateful for the guidance and support of Samantha Schaffstall. The purpose of a Rapid Market Assessment is to help a farmers market learn about its shoppers and collect information to improve market operations, strategies, and impacts. A RMA utilizes participatory research methods and includes three parts: 1) shopper counts, 2) a “dot” survey, and 3) constructive comments and observations from an assessment team about the market’s physical site, atmosphere, and vendor mix. The RMA team typically includes a mix of market managers, board members, agricultural professionals, students and community volunteers. Participating in a RMA provides opportunities for market managers to learn how to conduct cost‐effective research on markets, experience another market, and built their network.
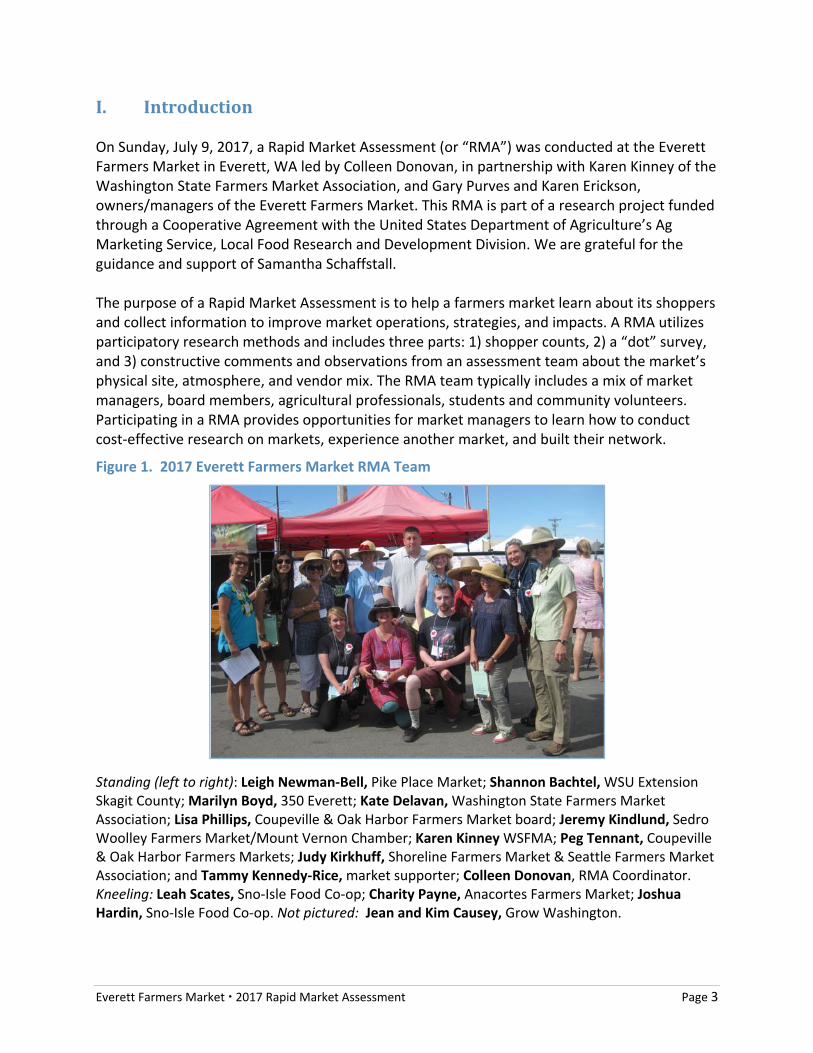
Figure 1. 2017 Everett Farmers Market RMA Team
Standing (left to right): Leigh Newman‐Bell, Pike Place Market; Shannon Bachtel, WSU Extension Skagit County; Marilyn Boyd, 350 Everett; Kate Delavan, Washington State Farmers Market Association; Lisa Phillips, Coupeville & Oak Harbor Farmers Market board; Jeremy Kindlund, Sedro Woolley Farmers Market/Mount Vernon Chamber; Karen Kinney WSFMA; Peg Tennant, Coupeville & Oak Harbor Farmers Markets; Judy Kirkhuff, Shoreline Farmers Market & Seattle Farmers Market Association; and Tammy Kennedy‐Rice, market supporter; Colleen Donovan, RMA Coordinator. Kneeling: Leah Scates, Sno‐Isle Food Co‐op; Charity Payne, Anacortes Farmers Market; Joshua Hardin, Sno‐Isle Food Co‐op. Not pictured: Jean and Kim Causey, Grow Washington.

Everett Farmers Market 2017 Rapid Market Assessment Page 4
Market Overview
Market Everett Farmers Market
Market Opened 1994
Incorporation Owner‐operator
Mission To create an environment where local farmers and other local entrepreneurs are able to sell their goods in an equitable access manner, which enables local economy, the acquisition of healthy and nutritious foods, and instills a place‐making and educational vitality.
Day & Hours Sunday, 11:00 am to 4:00 pm (5 hour)
2017 Season May 14 to October 15, 2017 (23 weeks)
Location Port of Everett Marina, Waterfront
Market Owner‐Managers Gary Purves and Karen Erickson, in 6th season
Market Staff Average of 10 part‐time, seasonal positions
Vendor Fees Flat rate plus % over $300, depending on stall location
Vendors Over 200 active vendor businesses
Currencies Accepted Credit, debit; SNAP EBT; Fresh Bucks; and WIC/Senior FMNP
Vendors Sales Estimated $1.25 million for 2017
Visitors Over 100,000 per season
Community Booths 12
Memberships Washington State Farmers Market Association, Engage Everett, Snohomish Health District, Living Healthy 2020
Website http://everettfarmersmarket.net
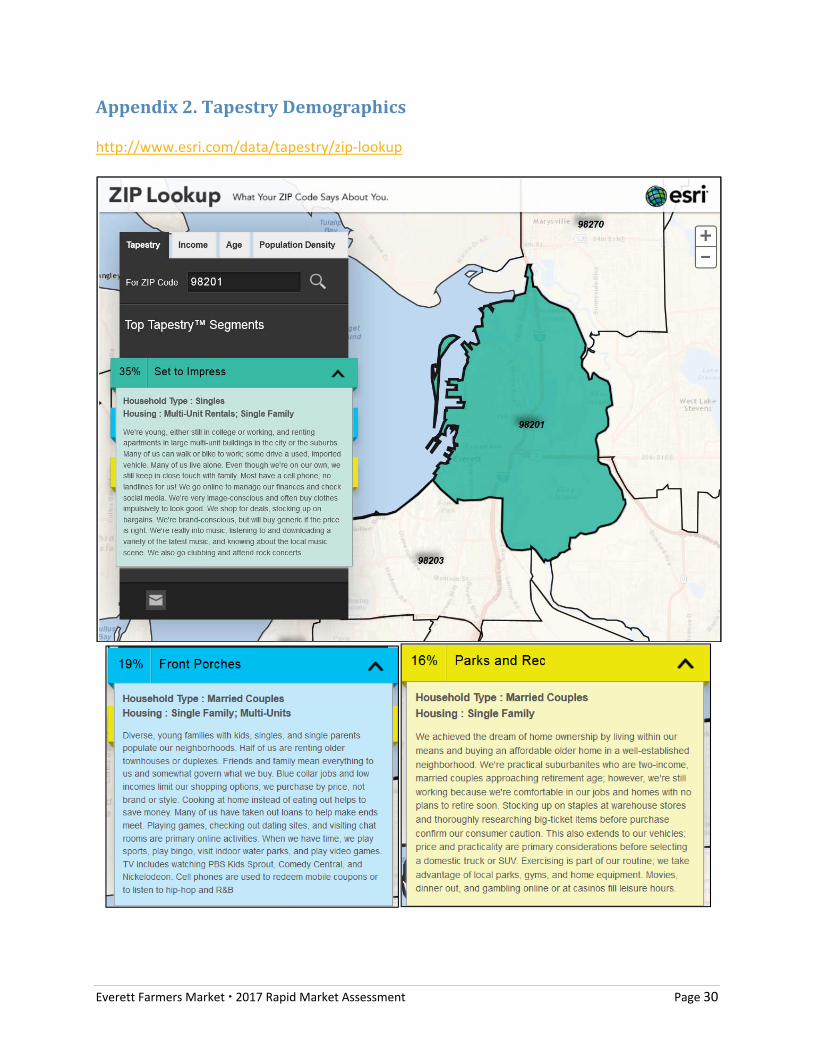
Market Community The City of Everett is located in Snohomish County, along the Interstate 5 corridor north of Seattle. Home to Boeing’s assembly plant and the Everett Naval Station, Everett’s current population is just over 109,000 (2016). According to ESRI Tapestry lookup, 35% of people fit the “Set to Impress” market segment, 19% are “Front Porches,” and 16% are “Parks and Rec” (http://www.esri.com/data/tapestry/zip‐lookup). See Appendix 2 for a full description of each market segment. The median household income is around 38K (compared to 66K for Snohomish County); median age is 36.5 (nearly the same as the county and state); and there is a population density of 1,626 people per square mile (far greater than the rest of the county). According to the 2012 Census of Agriculture, Snohomish County has 216 direct marketing farms. There are two farmers markets, one food cooperative, and a handful of farm stands (resellers) in Everett.

Everett Farmers Market 2017 Rapid Market Assessment Page 5
Market Location The Everett Farmers Market is in its 24th year at the Marina owned by the Port of Everett. It is just south of Boxcar Park, with beautiful views of the Puget Sound. The site is a mostly gravel parking lot. Feather flags and other signage direct shoppers to the market from W Marine View Dr. This is the market’s second year in this site. The current market layout includes 118 spots for booths, including market info booth, nonprofits, and kids or other educational activities.
Figure 2. Satellite view of market site
Source: Google Maps (accessed 8‐23‐2017)
Figure 3. Market site map
Piazza ParkMarket West
Everett Farmers Market 2017 Rapid Market Assessment Page 6
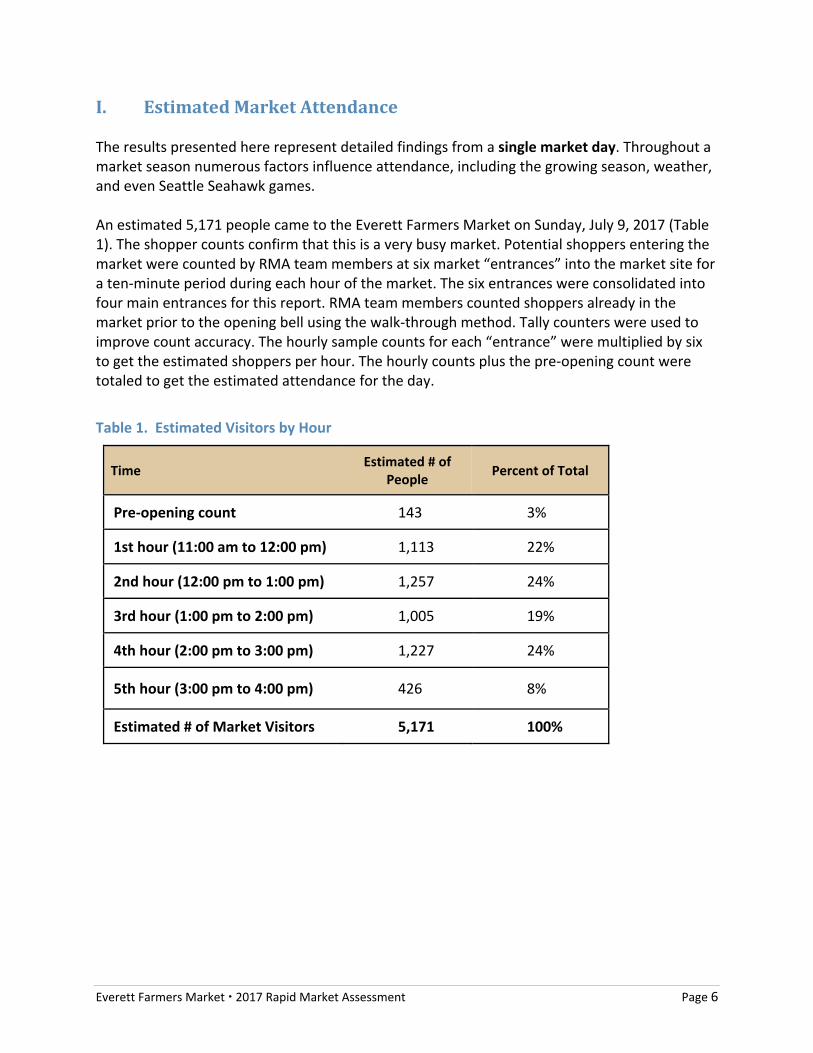
I. EstimatedMarketAttendance The results presented here represent detailed findings from a single market day. Throughout a market season numerous factors influence attendance, including the growing season, weather, and even Seattle Seahawk games. An estimated 5,171 people came to the Everett Farmers Market on Sunday, July 9, 2017 (Table 1). The shopper counts confirm that this is a very busy market. Potential shoppers entering the market were counted by RMA team members at six market “entrances” into the market site for a ten‐minute period during each hour of the market. The six entrances were consolidated into four main entrances for this report. RMA team members counted shoppers already in the market prior to the opening bell using the walk‐through method. Tally counters were used to improve count accuracy. The hourly sample counts for each “entrance” were multiplied by six to get the estimated shoppers per hour. The hourly counts plus the pre‐opening count were totaled to get the estimated attendance for the day.
Table 1. Estimated Visitors by Hour
Time Estimated # of
People Percent of Total
Pre‐opening count 143 3%
1st hour (11:00 am to 12:00 pm) 1,113 22%
2nd hour (12:00 pm to 1:00 pm) 1,257 24%
3rd hour (1:00 pm to 2:00 pm) 1,005 19%
4th hour (2:00 pm to 3:00 pm) 1,227 24%
5th hour (3:00 pm to 4:00 pm) 426 8%
Estimated # of Market Visitors 5,171 100%

Everett Farmers Market 2017 Rapid Market Assessment Page 7
Figure 4. Estimated number of market visitors by hour, 11:00 am to 3:00 pm
Table 2. Estimated Visitors by Entrance
Boxcar 13th St Main Entrance
Boxcar & 13th St West
Picnic Shelters 14th & Concessions Entrance
3,066 570 960 432
59% 11% 19% 8%
Note: The total (97%) does not include the shoppers who were already in the market when the market opened. They were included in the pre‐market count.
Visitor Count Findings and Observations: The market was very full and very busy with well over 5,000 shoppers. There was a steady flow from 11:00am to 3:00pm.The shopper counts dropped off
considerably (to 8%) during the last hour of the market. As expected the greatest number (59%) of shoppers entered through the entrance coming
from 13th Street to Boxcar Park. Less expected was that 19% of shoppers entered through the area by the picnic shelters,
close to the water. Higher traffic entrances are key locations for important market signage and for strategically placing visually enticing booth displays that lure visitors deeper into the market.
Keep in mind that higher traffic doesn’t necessarily correlate to higher sales. In some cases, larger crowds can deter shoppers who prefer “less hassle” or a quieter setting.
3%
22%24%
19%
24%
8%
0%
5%
10%
15%
20%
25%
30%
0
200
400
600
800
1000
1200
1400
Pre‐openingcount
1st hour 2nd hour 3rd hour 4th hour 5th hour
Everett Farmers Market 2017 Rapid Market Assessment Page 8
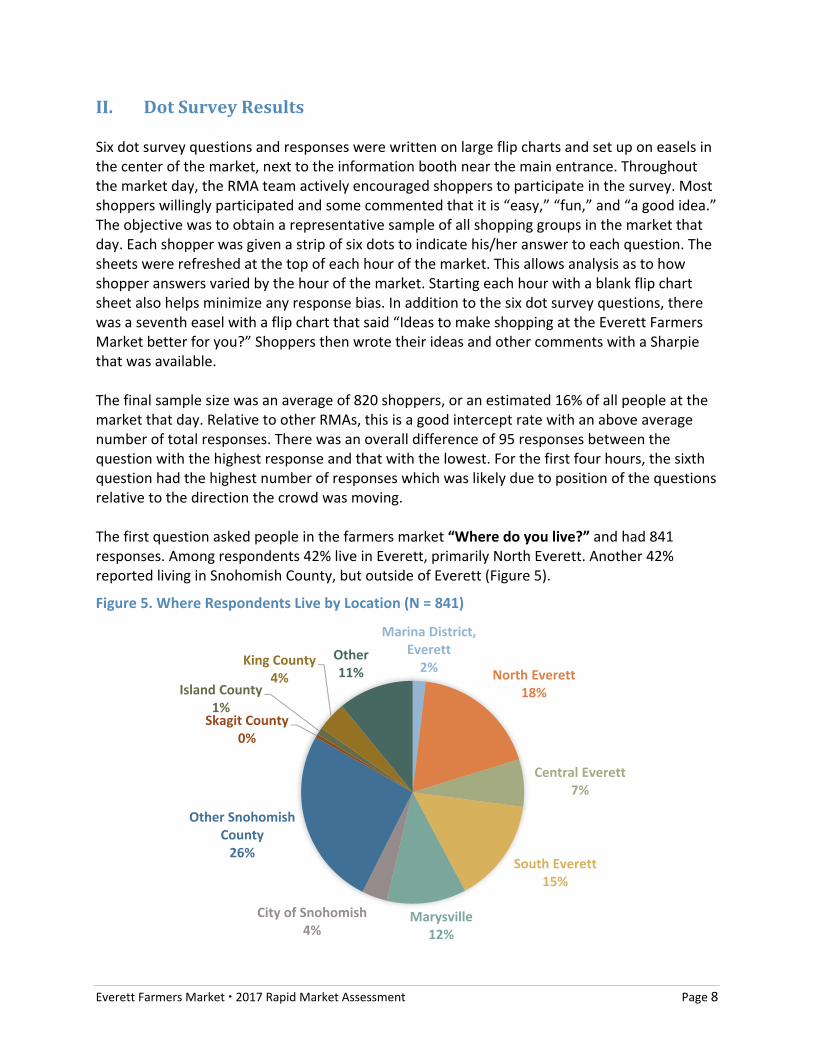
II. DotSurveyResults Six dot survey questions and responses were written on large flip charts and set up on easels in the center of the market, next to the information booth near the main entrance. Throughout the market day, the RMA team actively encouraged shoppers to participate in the survey. Most shoppers willingly participated and some commented that it is “easy,” “fun,” and “a good idea.” The objective was to obtain a representative sample of all shopping groups in the market that day. Each shopper was given a strip of six dots to indicate his/her answer to each question. The sheets were refreshed at the top of each hour of the market. This allows analysis as to how shopper answers varied by the hour of the market. Starting each hour with a blank flip chart sheet also helps minimize any response bias. In addition to the six dot survey questions, there was a seventh easel with a flip chart that said “Ideas to make shopping at the Everett Farmers Market better for you?” Shoppers then wrote their ideas and other comments with a Sharpie that was available. The final sample size was an average of 820 shoppers, or an estimated 16% of all people at the market that day. Relative to other RMAs, this is a good intercept rate with an above average number of total responses. There was an overall difference of 95 responses between the question with the highest response and that with the lowest. For the first four hours, the sixth question had the highest number of responses which was likely due to position of the questions relative to the direction the crowd was moving. The first question asked people in the farmers market “Where do you live?” and had 841 responses. Among respondents 42% live in Everett, primarily North Everett. Another 42% reported living in Snohomish County, but outside of Everett (Figure 5).
Figure 5. Where Respondents Live by Location (N = 841)
Marina District, Everett2%
North Everett18%
Central Everett7%
South Everett15%
Marysville12%
City of Snohomish4%
Other Snohomish County26%
Skagit County0%
Island County1%
King County4%
Other11%
Everett Farmers Market 2017 Rapid Market Assessment Page 9
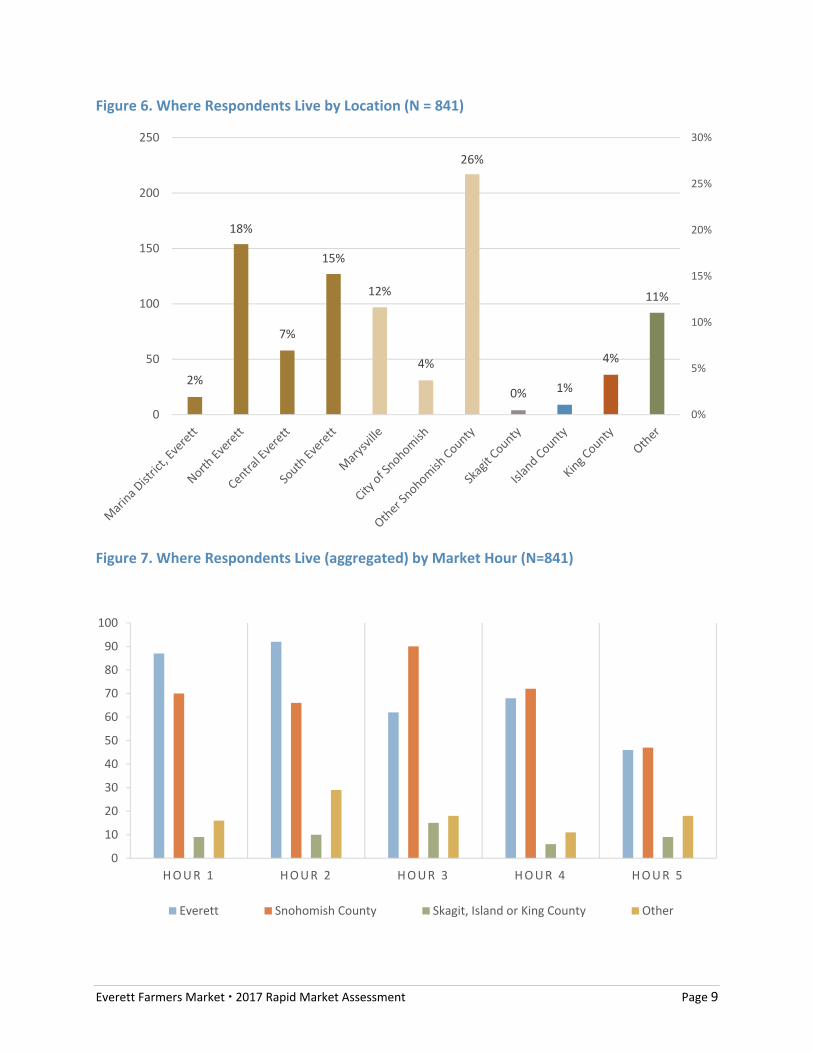
Figure 6. Where Respondents Live by Location (N = 841)
Figure 7. Where Respondents Live (aggregated) by Market Hour (N=841)
2%
18%
7%
15%
12%
4%
26%
0% 1%
4%
11%
0%
5%
10%
15%
20%
25%
30%
0
50
100
150
200
250
0
10
20
30
40
50
60
70
80
90
100
HOUR 1 HOUR 2 HOUR 3 HOUR 4 HOUR 5
Everett Snohomish County Skagit, Island or King County Other
Everett Farmers Market 2017 Rapid Market Assessment Page 10
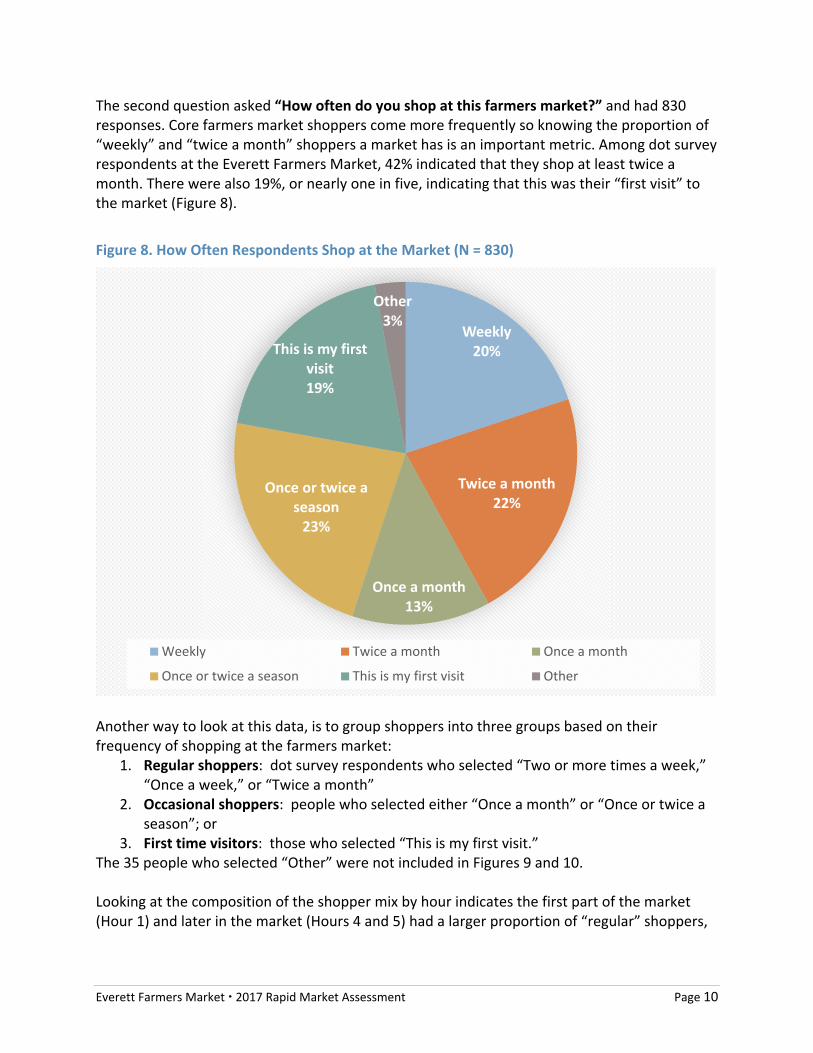
The second question asked “How often do you shop at this farmers market?” and had 830 responses. Core farmers market shoppers come more frequently so knowing the proportion of “weekly” and “twice a month” shoppers a market has is an important metric. Among dot survey respondents at the Everett Farmers Market, 42% indicated that they shop at least twice a month. There were also 19%, or nearly one in five, indicating that this was their “first visit” to the market (Figure 8).
Figure 8. How Often Respondents Shop at the Market (N = 830)
Another way to look at this data, is to group shoppers into three groups based on their frequency of shopping at the farmers market:
1. Regular shoppers: dot survey respondents who selected “Two or more times a week,” “Once a week,” or “Twice a month”
2. Occasional shoppers: people who selected either “Once a month” or “Once or twice a season”; or
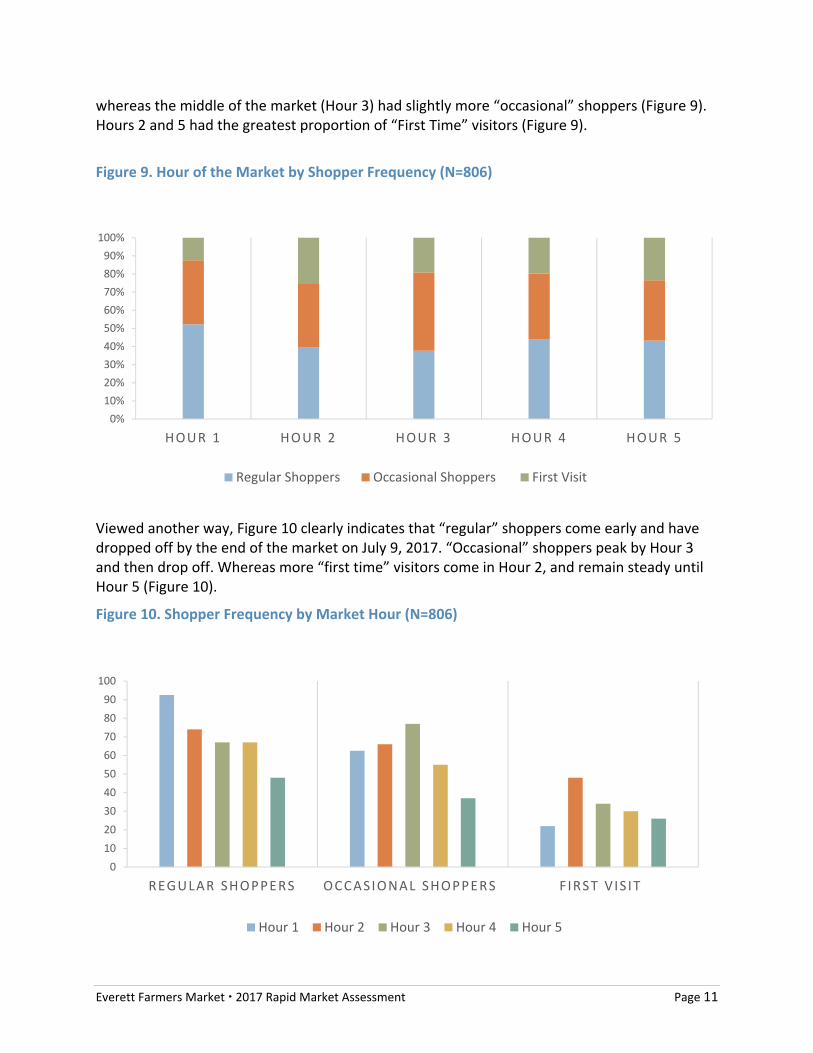
3. First time visitors: those who selected “This is my first visit.” The 35 people who selected “Other” were not included in Figures 9 and 10. Looking at the composition of the shopper mix by hour indicates the first part of the market (Hour 1) and later in the market (Hours 4 and 5) had a larger proportion of “regular” shoppers,
Weekly20%
Twice a month22%
Once a month13%
Once or twice a season23%
This is my first visit19%
Other3%
Weekly Twice a month Once a month
Once or twice a season This is my first visit Other
Everett Farmers Market 2017 Rapid Market Assessment Page 11
whereas the middle of the market (Hour 3) had slightly more “occasional” shoppers (Figure 9). Hours 2 and 5 had the greatest proportion of “First Time” visitors (Figure 9).
Figure 9. Hour of the Market by Shopper Frequency (N=806)
Viewed another way, Figure 10 clearly indicates that “regular” shoppers come early and have dropped off by the end of the market on July 9, 2017. “Occasional” shoppers peak by Hour 3 and then drop off. Whereas more “first time” visitors come in Hour 2, and remain steady until Hour 5 (Figure 10).
Figure 10. Shopper Frequency by Market Hour (N=806)
0%
10%
20%
30%
40%
50%
60%
70%
80%
90%
100%
HOUR 1 HOUR 2 HOUR 3 HOUR 4 HOUR 5
Regular Shoppers Occasional Shoppers First Visit
0
10
20
30
40
50
60
70
80
90
100
REGULAR SHOPPERS OCCASIONAL SHOPPERS F IRST VIS IT
Hour 1 Hour 2 Hour 3 Hour 4 Hour 5
Everett Farmers Market 2017 Rapid Market Assessment Page 12
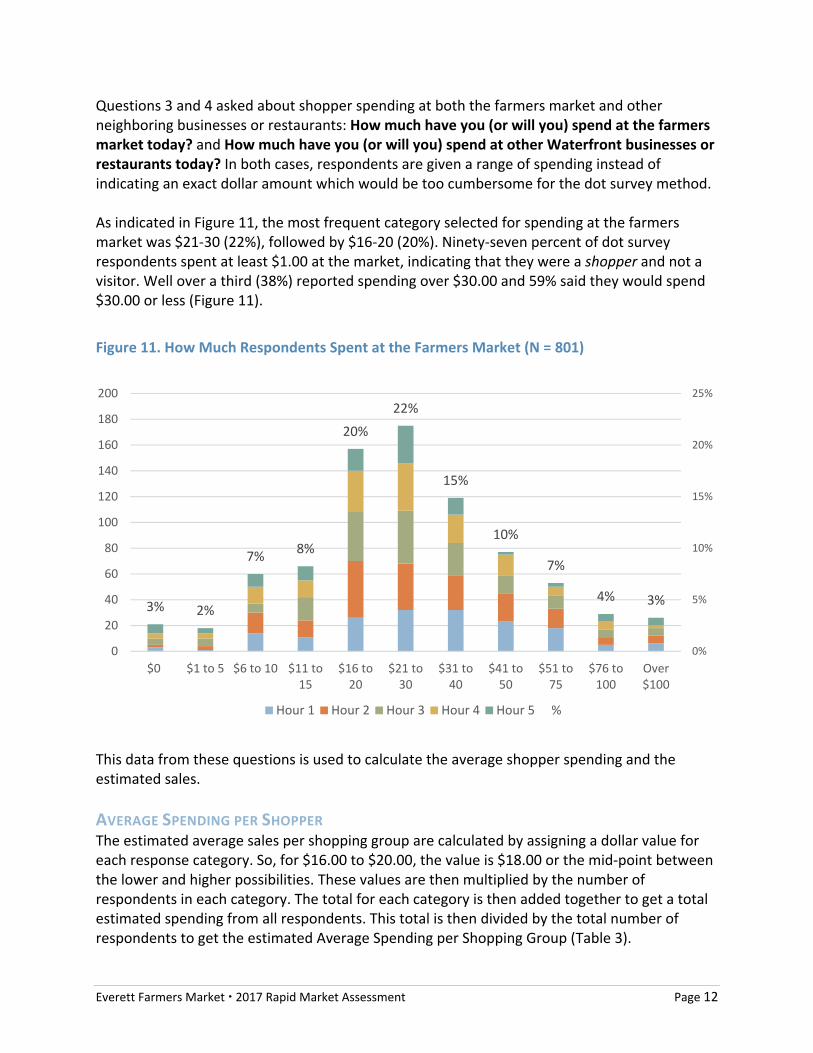
Questions 3 and 4 asked about shopper spending at both the farmers market and other neighboring businesses or restaurants: How much have you (or will you) spend at the farmers market today? and How much have you (or will you) spend at other Waterfront businesses or restaurants today? In both cases, respondents are given a range of spending instead of indicating an exact dollar amount which would be too cumbersome for the dot survey method. As indicated in Figure 11, the most frequent category selected for spending at the farmers market was $21‐30 (22%), followed by $16‐20 (20%). Ninety‐seven percent of dot survey respondents spent at least $1.00 at the market, indicating that they were a shopper and not a visitor. Well over a third (38%) reported spending over $30.00 and 59% said they would spend $30.00 or less (Figure 11).
Figure 11. How Much Respondents Spent at the Farmers Market (N = 801)
This data from these questions is used to calculate the average shopper spending and the estimated sales.
AVERAGE SPENDING PER SHOPPER The estimated average sales per shopping group are calculated by assigning a dollar value for each response category. So, for $16.00 to $20.00, the value is $18.00 or the mid‐point between the lower and higher possibilities. These values are then multiplied by the number of respondents in each category. The total for each category is then added together to get a total estimated spending from all respondents. This total is then divided by the total number of respondents to get the estimated Average Spending per Shopping Group (Table 3).
3% 2%
7%8%
20%
22%
15%
10%
7%
4% 3%
0%
5%
10%
15%
20%
25%
0
20
40
60
80
100
120
140
160
180
200
$0 $1 to 5 $6 to 10 $11 to15
$16 to20
$21 to30
$31 to40
$41 to50
$51 to75
$76 to100
Over$100
Hour 1 Hour 2 Hour 3 Hour 4 Hour 5 %
Everett Farmers Market 2017 Rapid Market Assessment Page 13
Table 3. Estimated Dot Survey Respondent Spending at the Farmers Market
Number of Dot Survey Respondents Estimated Total Farmers Market
Estimated Average Farmers Market
Spending
All Respondents 801 $24,925.50 $31.12
Respondents that spent at least $1.00
780 same $31.96
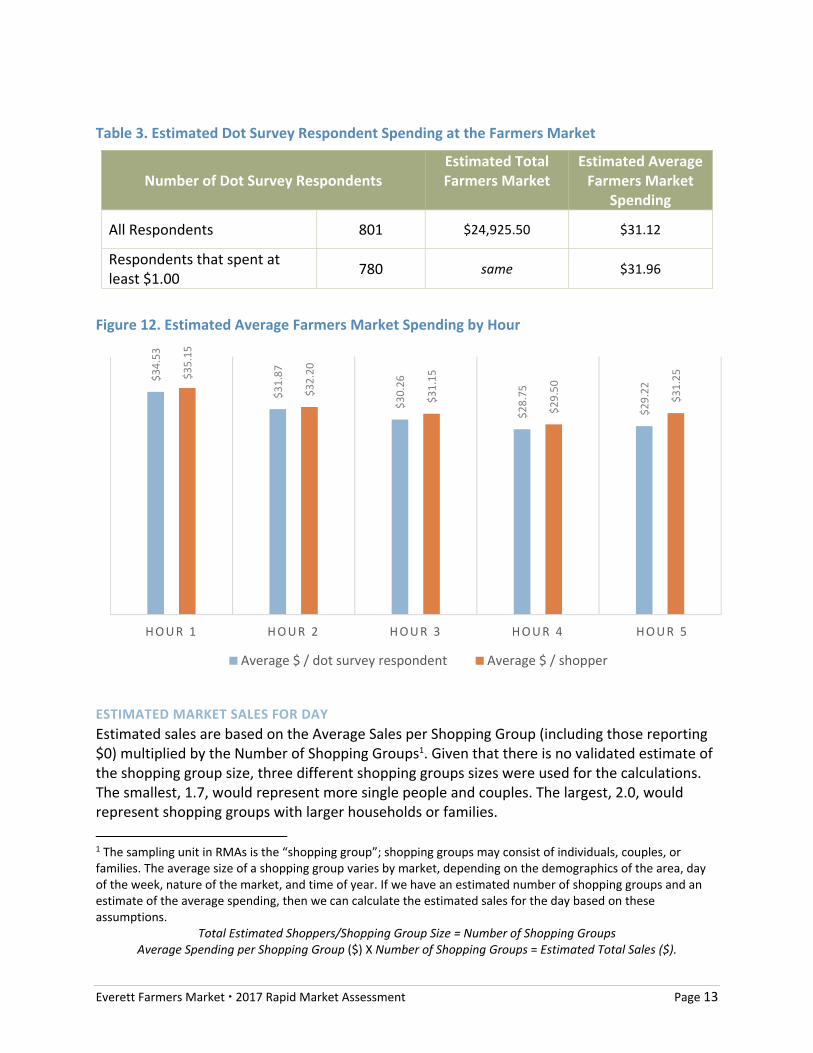
Figure 12. Estimated Average Farmers Market Spending by Hour
ESTIMATED MARKET SALES FOR DAY Estimated sales are based on the Average Sales per Shopping Group (including those reporting $0) multiplied by the Number of Shopping Groups1. Given that there is no validated estimate of the shopping group size, three different shopping groups sizes were used for the calculations. The smallest, 1.7, would represent more single people and couples. The largest, 2.0, would represent shopping groups with larger households or families.
1 The sampling unit in RMAs is the “shopping group”; shopping groups may consist of individuals, couples, or families. The average size of a shopping group varies by market, depending on the demographics of the area, day of the week, nature of the market, and time of year. If we have an estimated number of shopping groups and an estimate of the average spending, then we can calculate the estimated sales for the day based on these assumptions.
Total Estimated Shoppers/Shopping Group Size = Number of Shopping Groups Average Spending per Shopping Group ($) X Number of Shopping Groups = Estimated Total Sales ($).
$34.53
$31.87
$30.26
$28.75
$29.22 $35.15
$32.20
$31.15
$29.50
$31.25
HOUR 1 HOUR 2 HOUR 3 HOUR 4 HOUR 5
Average $ / dot survey respondent Average $ / shopper

Everett Farmers Market 2017 Rapid Market Assessment Page 14
Table 4. Estimated Shopper Groups and Farmers Market Sales
Shopping Group Size
Number of Shopping Groups
Estimated Sales for July 9, 2017
1.7 3,042 $ 94,647
1.8 2,873 $ 89,389
2.0 2,585 $ 80,450
With a total shopper estimate of 5,171, the number of shopper groups ranges from 3,042 to 2,585. Likewise, the estimated total shopper‐reported sales ranges from nearly $95,000 to $80,450 (Table 5). Methods for collecting or estimating farmers market sales vary widely and precision is a significant challenge for vendors as well as the market. Most transactions are cash, inventory controls can be hard to manage, and prices may vary throughout the day as well as by market. In addition to fatigue and imprecise real‐time accounting too, there are also potential motivations for vendors to underreport sales to markets. Customer reported sales are also problematic. Nevertheless, there does seem to be a consistent tendency for customer‐reported spending to significantly exceed vendor‐reported sales in previous RMAs. While Question 3 focused on the farmers market itself, the purpose of Question 4 is to capture “spill over” spending by farmers market shoppers at other nearby businesses or restaurants. The Port of Everett Waterfront is a large complex that includes a Yacht Club, at least eight restaurants, an Inn, and numerous free public access points.
Source: http://www.portofeverett.com/recreation/waterfront‐activity‐map (Accessed 8/28/2017)

Everett Farmers Market 2017 Rapid Market Assessment Page 15
Note that for four out of five hours, this question had the lowest number of responses giving us 767 total responses, compared to an average of 820. As indicated in Figure 12, 41% of dot survey respondents reported spending at least $1.00 at other Port of Everett Waterfront businesses and restaurants. As with the farmers market spending, the most frequent category was $21‐30 with 8%, followed by $16‐20 with 7% (Figure 12). Overall, 16% spent over $30.00 and 25% spent between $1.00 and $30.00. The estimated average spending among all respondents was $13.40. Among shoppers that had spent at least $1.00 at other Waterfront businesses or restaurants, the average was $32.52, over twice as much. If we assumed a conservative shopping group size of 1.8, this would yield an estimated total spending at the Waterfront of $38,500 (Table 5 and 6).
Figure 13. How Much Respondents Spent at Other Waterfront Businesses and Restaurants (N = 767)
Table 5. Estimated Dot Survey Respondent Spending at Other Waterfront Businesses and Restaurants
Number of Dot Survey Respondents Estimated Total Waterfront Spending
Estimated Average Waterfront Spending
All Respondents 767 $10,276.00 $13.40
Respondents that spent at least $1.00
316 same $32.52
59%
3% 3%5% 7% 8%
5% 4% 3%1% 3%
0%
10%
20%
30%
40%
50%
60%
70%
0
50
100
150
200
250
300
350
400
450
500
$0 $1 to 5 $6 to 10 $11 to15
$16 to20
$21 to30
$31 to40
$41 to50
$51 to75
$76 to100
Over$100
Hour 1 Hour 2 Hour 3 Hour 4 Hour 5 %

Everett Farmers Market 2017 Rapid Market Assessment Page 16
The fifth question was debuted at the Everett Farmers Market and was designed to collect data on how all farmers market shoppers feel about food access programs such as the Supplemental Nutrition Assistance Program (SNAP), formerly known as food stamps, and the Farmers Market Nutrition Program (FMNP). The latter includes a program for Women Infants and Children (WIC) clients and one for low income seniors.
Figure 14. Importance of Low Income People’s Ability to Shop at Farmers Market with SNAP EBT (food stamps) or WIC/Senior FMNP (N=816)
Among the over 800 respondents, 75% indicated that it was “important” or “very important” that low income people use their food nutrition benefits to shop at the Everett Farmers Market. Another 5% indicated that it was “somewhat important” and 14% selected “not important” or “no opinion.” Relatively few respondents (6%) indicated they were not familiar with these programs. The federal SNAP and Washington State FMNP logos were included on the dot survey flip chart sheet as a visual cue. There was signage in the market, including a banner at the market information booth next to the dot survey, that promoted “EBT.” We cannot assume that shoppers knew that SNAP, the Quest card, and EBT all refer to the same program.
6% 5%
18%
57%
8%6%
0%
10%
20%
30%
40%
50%
60%
70%
0
50
100
150
200
250
300
350
400
450
500
Not important Somewhatimportant
Important Very important No opinion Not familiarwith SNAP &
FMNP programs
Hour 1 Hour 2 Hour 3 Hour 4 Hour 5 %

Everett Farmers Market 2017 Rapid Market Assessment Page 17
The sixth dot survey question asked “What is your primary reason for shopping at the market today?” and had a total of 862 responses. The most frequent response (40%) was to “support a local farmer” followed by “healthy food” (13%), and “atmosphere” (12%) (Figure 14). “Prepared food,” “Affordable food,” and “crafts” were the least frequent responses with from 0% to 2% of responses. On multiple occasions the RMA Team observed shoppers expressing a desire to “pick more than one option.” Some of these shoppers opted to select “Other” rather than pick one primary reason.
Figure 15. Primary Reason for Shopping at the Market (N = 862)
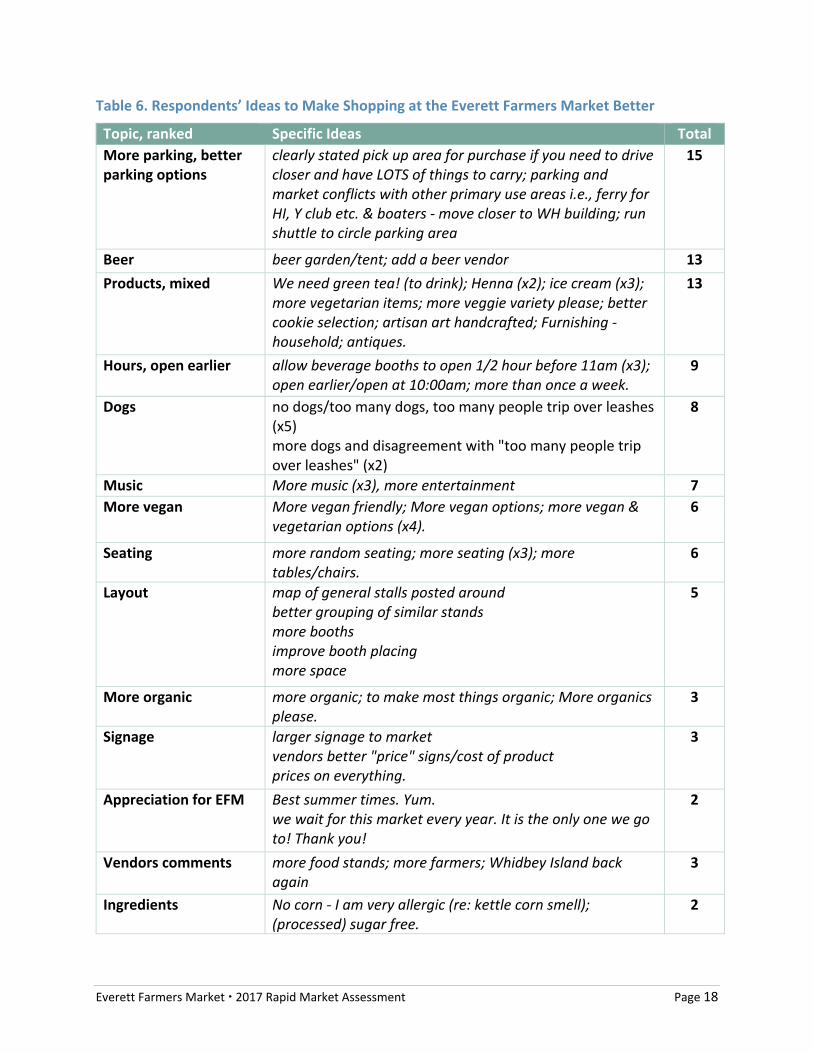
The Everett Farmers Market’s dot survey also included a seventh question that was open‐ended. Colorful Sharpies were tied on to the flip chart so that people could write their response to the question “Ideas to make shopping at the Everett Farmers Market better for you?” In all, 83 people responded with 100 comments that were coded into 15 key themes and ranked by frequency. As anticipated, the number one comment had to do with parking.
13%
5% 8%
2%
40%
5%
12%
4%2%
0%
8%
0%
5%
10%
15%
20%
25%
30%
35%
40%
45%
0
50
100
150
200
250
300
350
400
Hour 1 Hour 2 Hour 3 Hour 4 Hour 5 %
Everett Farmers Market 2017 Rapid Market Assessment Page 18
Table 6. Respondents’ Ideas to Make Shopping at the Everett Farmers Market Better
Topic, ranked Specific Ideas Total
More parking, better parking options
clearly stated pick up area for purchase if you need to drive closer and have LOTS of things to carry; parking and market conflicts with other primary use areas i.e., ferry for HI, Y club etc. & boaters ‐ move closer to WH building; run shuttle to circle parking area
15
Beer beer garden/tent; add a beer vendor 13
Products, mixed We need green tea! (to drink); Henna (x2); ice cream (x3); more vegetarian items; more veggie variety please; better cookie selection; artisan art handcrafted; Furnishing ‐ household; antiques.
13
Hours, open earlier allow beverage booths to open 1/2 hour before 11am (x3); open earlier/open at 10:00am; more than once a week.
9
Dogs no dogs/too many dogs, too many people trip over leashes (x5) more dogs and disagreement with "too many people trip over leashes" (x2)
8
Music More music (x3), more entertainment 7
More vegan More vegan friendly; More vegan options; more vegan & vegetarian options (x4).
6
Seating more random seating; more seating (x3); more tables/chairs.
6
Layout map of general stalls posted around better grouping of similar stands more booths improve booth placing more space
5
More organic more organic; to make most things organic; More organics please.
3
Signage larger signage to market vendors better "price" signs/cost of product prices on everything.
3
Appreciation for EFM Best summer times. Yum. we wait for this market every year. It is the only one we go to! Thank you!
2
Vendors comments more food stands; more farmers; Whidbey Island back again
3
Ingredients No corn ‐ I am very allergic (re: kettle corn smell); (processed) sugar free.
2

Everett Farmers Market 2017 Rapid Market Assessment Page 19
III. ConstructiveComments&ObservationsfromRMATeam As part of the RMA, each member of the assessment team was asked to note his or her observations about the market’s physical site, atmosphere, and vendor and product mix. The purpose was to offer helpful ideas from a “fresh” perspective. Below is a summary of key themes that were noted at the RMA. We understand that the market may have tried ideas before or have conditions that limit their ability to implement solutions. RMA Team comments are summarized below to share their best thinking for managers’ consideration. In some cases, differing suggestions are presented without attempts at reconciliation. Physical Site: This includes access to the market, parking, flow of people and traffic, liability issues, organization, etc. The Everett Farmers Market is in a beautiful location, next to the water and Marina, making it a “destination within a destination.” “Parking clearly a complex issue,” and one the market has invested a lot of resources into managing. RMA Team members noted that there were plenty of bathrooms and garbage cans. Recycle sites at most entrances are very nice. While it was windy near the water, vendors seem to have all the weighted tents. They liked that there were “Plenty of people who are marked like a vest or marked T‐shirt to answer questions and get directions from.” Weather was perfect today, sunny with a slight breeze! Love that the market is dense but you can escape to the park/waterfront. Market Layout The layout is expansive and one RMA Team member described it as a “Good IKEA type layout.” Overall people were impressed with how the traffic flowed, however several noted “choke points” due to vendor lines.
Aisle width seems good for number of shoppers.
Traffic seems to flow. Path convergence points and some corners got crowded. Berry and produce vendors far apart from each other. Makes it difficult to shop based on price. However, maybe good to separate vendors so that lines don't block traffic if next to each other and may create a glob of people.
Small alley between iced coffee and heavily trafficked. The curved alley with flowers and chairs was a lovely break to the perpendicular linear paths.
Congestion happens at each path convergence. Perhaps ready‐to‐eat vendors could be grouped? I think making lunchtime decisions could be easier this way… Perhaps each entrance could have a flower vendor, greetings with good smells would be nice.
Your berry vendors are swamped for first few hours. Need to be mindful of their impact on neighboring vendors.
Everett Farmers Market 2017 Rapid Market Assessment Page 20
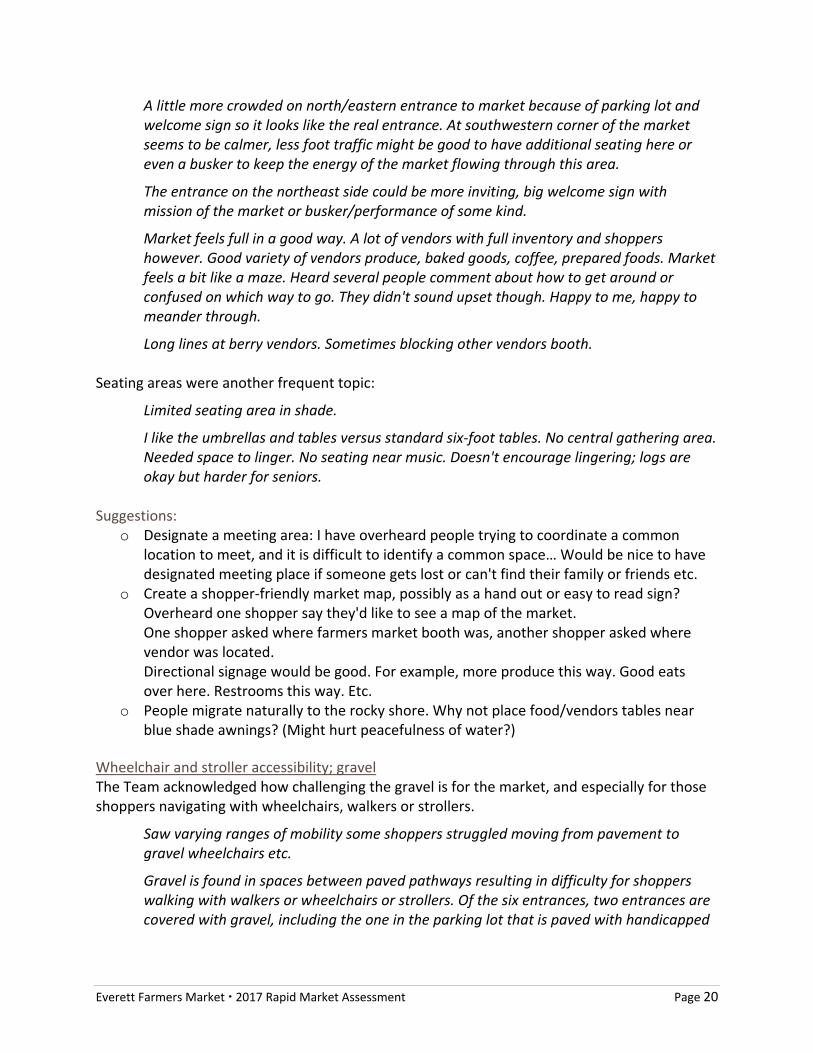
A little more crowded on north/eastern entrance to market because of parking lot and welcome sign so it looks like the real entrance. At southwestern corner of the market seems to be calmer, less foot traffic might be good to have additional seating here or even a busker to keep the energy of the market flowing through this area.
The entrance on the northeast side could be more inviting, big welcome sign with mission of the market or busker/performance of some kind.
Market feels full in a good way. A lot of vendors with full inventory and shoppers however. Good variety of vendors produce, baked goods, coffee, prepared foods. Market feels a bit like a maze. Heard several people comment about how to get around or confused on which way to go. They didn't sound upset though. Happy to me, happy to meander through.
Long lines at berry vendors. Sometimes blocking other vendors booth.
Seating areas were another frequent topic:
Limited seating area in shade.
I like the umbrellas and tables versus standard six‐foot tables. No central gathering area. Needed space to linger. No seating near music. Doesn't encourage lingering; logs are okay but harder for seniors.
Suggestions:
o Designate a meeting area: I have overheard people trying to coordinate a common location to meet, and it is difficult to identify a common space… Would be nice to have designated meeting place if someone gets lost or can't find their family or friends etc.
o Create a shopper‐friendly market map, possibly as a hand out or easy to read sign? Overheard one shopper say they'd like to see a map of the market. One shopper asked where farmers market booth was, another shopper asked where vendor was located. Directional signage would be good. For example, more produce this way. Good eats over here. Restrooms this way. Etc.
o People migrate naturally to the rocky shore. Why not place food/vendors tables near blue shade awnings? (Might hurt peacefulness of water?)
Wheelchair and stroller accessibility; gravel The Team acknowledged how challenging the gravel is for the market, and especially for those shoppers navigating with wheelchairs, walkers or strollers.
Saw varying ranges of mobility some shoppers struggled moving from pavement to gravel wheelchairs etc.
Gravel is found in spaces between paved pathways resulting in difficulty for shoppers walking with walkers or wheelchairs or strollers. Of the six entrances, two entrances are covered with gravel, including the one in the parking lot that is paved with handicapped

Everett Farmers Market 2017 Rapid Market Assessment Page 21
parking. This may affect the overall experience for older adults, handicapped, or families with small children.
On the other hand, the layout is open easy to move around seem to be wide enough areas for wheelchairs.
Keep advocating for paved parking lot and walkways to the Port. There is a large market of older adults and families who would love to benefit from it.
Parking
Good signage directing people to market when driving.
Signage at entrance off of Main Road may have caused confusion for patrons interested in shopping at the farmers market. Specifically, patrons new to the market maybe parking too far away, unaware of the parking closer to the farmers market.
Although parking sometimes a challenge/flow of people into market from different directions.
Overheard several shoppers saying they were confused about parking and or park far away either because lot was full or they didn't realize they could park in closer lot.
Disabled parking area is ample and good for shopper group. I've never seen so many wheelchairs at a farmers market before!
Handicap accessibility ‐> overflow parking inaccessible for handicap due to gravel.
Love the crossing guard! Traffic revision and signage set up is impressive! Can't comprehend the manpower to do this!
Suggestion: o Suggestion that a RMA Team Member heard from an older adult patron is to have a
location where folks can pull up and drop off handicap individuals if handicap parking is full or if driver does not have a pass.
Signage
Market isn't visible from main street. Didn't notice prominent signs on drive in.
A‐boards seem too low to ground. Should be higher. Other comments about the physical site:
Having the electrical cords etc. go in between the vendors and cars is excellent. Good placement of Porta‐Potty, but check more often, if possible.
Odd that the Porta‐Potty is next to the picnic tables, shouldn't they be off to the side?
Have you considered having a bike rack area?

Everett Farmers Market 2017 Rapid Market Assessment Page 22
Atmosphere: This includes the overall feel of the market, type of shoppers, conversations, educational activities, community connections, etc. The RMA Team appreciated the smells as well as the diversity and friendliness of shoppers and vendors. The location clearly adds to the market atmosphere: People seem to love the kites and the water and the boats nearby. People many people taking pictures and videos while eating and visiting with each other. Very warm atmosphere. Warm sunny mild day with breeze from Bay. Kettle corn aroma wafting in air. Wide variety of ages. Lots of color from flowers and fresh veggies. People are walking while snacking. Or sitting under umbrellas eating lunch. Mostly smiling shoppers, visiting/engaging with others. Wide variety of vendors. Shopper diversity and friendliness
Heard 4 different language spoken customers awesome!
Notice that about 30% of the first hour and 1/2 was true grocery/produce shopping.
Lots of talking between vendors and shoppers. Lots of talking among shoppers. Relaxed friendly feel. Lots of families and couples.
Multicultural, friendly. Age diverse! Smiles returned.
Eclectic mix of shoppers of different ethnicity and age. Large population of older adults, mostly Caucasian. Appears as though this is a venue for family outings (grandparents with grandchildren, immediate family).
Overheard a lot of great conversations about products between vendors and shoppers.
Saw a lot of produce in shoppers’ hands, bags, carts as they were leaving the market.
Cheerful conversation, some regular customers, greeting vendors by name, questions about products, heard one vendor referring shopper to another vendor. So many cute dogs, lots of families, elderly people and young people. Met lots of first‐time visitors, wonder how many repeat customers come? Maybe a little overwhelming with the dogs.
Met someone that comes every week just to talk to all the vendors and spend $50. Colorful displays.
Smells
Wonderful smells, kettle corn, sweet peas, various hot food etc.
Smells of flowers, Puget Sound, and meat.
Popcorn smell is overwhelming when standing next to it all day.
At the main entrance, patrons get the aroma of freshly made pizza, with a group gathers to get their order.
Smells are amazing from pizza to popcorn, fish (in a good way) makes you hungry.

Everett Farmers Market 2017 Rapid Market Assessment Page 23
Layout
Nice vendor mix both in variety and locations and layout. Best veggies around, aside from our produce vendors, heard in one hot food booth ‐‐ fantastic. Some areas of the market have very pleasant vibe, a few others are colder.
Layout encourages wandering.
Prepared food vendors in one general area can they be closer to water so you have to walk through market to get to them?
Very mixed vendor booths set up no specific product blocks forces customers to walk around more; nice strategic placing of vendors. For example, windchimes by the water where there is a breeze, glass craft in the sun, greens and berries in the shade.
Music
Music nice when near it.
Live music aids in the welcoming environment. Live music is in the corner, making it difficult for community to gather and listen.
Sound levels right; isn't too loud.
Maybe live music later at other end of market? Busy Market
Comments overheard I told you it was going to be busy. wow it's busy. Most turned right when they walked in. Some turn to their companion ask where do we go?
Heard several shoppers remark about the beautiful location. Market feels full in a good way.
Some slow spots in market. Some of these changed as day went on. Flower vendors friendly. Brisk business. Kites were cool bonus‐Not part of market.
Walkways were much less crowded by 2 PM. Kids Activities?
Didn't see any specific educational booths.
No educational activities, though the RMA is where the Kid Zone normally is
No kids entertainment, face paint, music, hula hoop, streamers, etc. Suggestions:
o Put no smoking signs at every entrance. Vendors and Products: This includes access to the market, parking, flow of people and traffic, liability issues, organization, etc.

Everett Farmers Market 2017 Rapid Market Assessment Page 24
Signage
There were a few booths in which signage is limited, making it difficult for the patrons to walk around and get an idea of what's available/price comparisons. Additionally, it's difficult to identify the name of some vendors easily because of banner placement, or handwritten signs. I did not see any recipe handouts or suggestions for how to use products that patrons may be unfamiliar with.
Some booths without prices listed. Some booths with signage for square credit cards accepted. Some booths signage on ground difficult to view.
Signage not clear what currency vendors accept. Some vendors said they accept cash or tokens or card but isn't consistent. Like the currency sign at the Waxwing Farm. Shows which tokens accept. It would be great to see consistency across vendors.
Some vendors don't have a visible sign about location. I would love signs that say _____ miles away!
Busy Bee received multiple compliments on their booth. Friendly vendors/Customer service
Many vendors advertised where their produce, meat, etc. was from. That seemed important to customers.
Most vendors are very professional and booths nicely displayed.
Vendors are happy to answer questions and engage with customers.
Some of the craft vendors tend to hide in the back of the space.
A lot of interaction between vendors and customers talking about products and inviting conversation. Plenty of sampling of product. Produce was fresh and presented nicely. No pressure to buy but subtle suggestion ‐ friendly vendors
Vendor Mix
LOVE that the different categories of vendors are all mixed together ‐‐ like an amazing market salad.
I like how the prepared food is separated from the rest of the vendors.
I love the mix of flowers, food crafts so that people here only for kale may be enticed into buying some soap.
Vendor Variety and Quality
Large variety of products offered, including variety of berries, edible flowers, herbs, bok choy, kale etc.
Great variety of fresh veggies, fruits, food booths, even vegan!
Everett Farmers Market 2017 Rapid Market Assessment Page 25
Berry vendors seem to be most popular. Longest line consistently throughout the day was at Skagit Sun.
Really nice mix of vendors! Don't care for carnival style foods. Lots of people carrying hot food out of market to take home or no place to eat?
Suggestion:
o Would be nice to have more greens and vegetables in general. o Skagit Sun could use second person, line was long.
IV. Conclusion&Recommendations The Everett Farmers Market is a large, seasonal, Sunday market with a mature organization and experienced managers. In 2017, over 200 unique farm, processor, prepared food, and craft businesses will vend at the Everett Farmers Market and project reported annual sales in excess of $1 million. This is Snohomish County’s largest market, and very busy with over 5,000 visitors estimated in early July (Table 1) and 97% of visitors are farmers market shoppers (Figure 11). The market primarily draws shoppers from Everett (42%) or another city in the Snohomish County (42%). Very few (5%) visitors live in neighboring Skagit, Island or King Counties (Figure 5). The farmers market is located in the expansive Port of Everett Waterfront with views of Puget Sound and vibrant boating community, reinforcing the market’s “destination” character. Most (59%) visitors entered the market through the “main entrance” from 13th Street (Table 2). The actual market site is currently a mix of pavement and gravel and subject to relocation in accordance with Waterfront development plans. The layout is “IKEA‐like,” guiding visitors through distinct, interwoven sectors of the market. Parking is a significant challenge due to the volume of people, time people stay at the Waterfront, and distance from walkable residential neighborhoods or public transportation. Some infrastructure is available to the market such as power and bathrooms at Boxcar Park. On average, market shopping groups spent an estimated $31.96 at the Everett Farmers Market on July 9, 2017 (Table 3). The estimated spending peaked during the first hour at $35.15 (Figure 12); there were also more “regular” shoppers (Figure 7) and a significant portion of Everett shoppers present during the first hour (Figure 10). Opening earlier was among the top “ideas” provided by shoppers in the open‐ended question (Table 6). Over 40% of farmers market visitors reported also shopping at other Waterfront businesses and restaurants (Figure 12). The Everett Farmers Market currently manages a token program for credit and debit cards and SNAP EBT. It is also participating in the “Fresh Bucks” incentive program; and WIC/Senior FMNP. For three‐quarters of the dot survey respondents, it is important or “very important” that low‐income people can shop at this market with their SNAP EBT and FMNP benefits (Figure 14). When asked about their primary reason for shopping at the Everett Farmers Market, the
Everett Farmers Market 2017 Rapid Market Assessment Page 26
most frequent response was “to support a local farmer” (40%), followed by “healthy food” (13%) and “atmosphere” (12%) (Figure 15).
Recommendation 1: Do a signage audit to make sure shoppers see “forest for the trees”
The Everett Farmers Market has a very high level of visual complexity – from flags guiding people to parking and the market entrances, to informing shoppers about market rules and infrastructure, to promoting various currencies, and directing visitors to vendors. The visual messaging is not just the signage but also the reflective vests (promoting safety and a notion of caring), staff name tags at the market info booth, and bits of the built environment that have nothing to do with the market. In addition, this visual complexity coinhabits the space with medley of intense, emotional smells as noted by the RMA Team. A “signage audit” is simply taking an inventory of all signage, noting the location, size, purpose, colors, materials, style, and condition. This includes the macro level and micro; moving from neighboring streets all the way to the info booth. Then try to imagine what information visitors are really “able to see.” How does that compare to what you really want to communicate? Lastly, ask if any visuals can be combined, simplified, color coordinated, or augmented by simple symbols instead of words? In the visual hierarchy, what is most important? Least important? Remember that more signage is not necessarily better. More may simply add to the mix and volume of signage that is competing for visitor’s very limited attention. And, as always, changes can only be implemented when the time and resources are available. Specific ideas include:
o Standardizing directional signage to get people to market; same colors, signage size, similar heights, easy to see when driving.
o The onsite directional parking signs can be confusing about where to go. It’s hard to know all of the market parking options. Is there more you can do to simplify it to help ensure a friendly first impression, especially for “occasional” and “first time” shoppers? Is there an easy to print PDF on “Finding the Everett Farmers Market” and “Where to park” on your website?
o Knowing shoppers’ reported interest in farmers and healthy food, how can this be highlighted in an overall signage and information strategy? Recipes with ingredients from farm vendors are popular. If any of the concessions use farm vendor products, is that being highlighted? Something that highlights “What’s Available at the Market” like a fresh sheet may be worth exploring. It’s a constant struggle, but helping all vendors have (and use) signs with their farm name, location, and clearly marked prices fosters connections and trust among shoppers.
o Consider “Welcome” signage at entrances – A‐boards that say “welcome” on one side and “Thanks for shopping, see you next week” on the back side.

Everett Farmers Market 2017 Rapid Market Assessment Page 27
Recommendation 2: Finesse the market layout to promote farm sales
The RMA Team appreciated the market layout, understanding that the gravel and parking was a challenge. There was a sense that there might be some adjustments that would make the farm vendors easier to find. This is reinforced by the dot survey responses indicating that people are coming “to support local farmers” – so helping them to do so aligns their values and market experience. Ideas include:
o Increase the visibility of farmers from market entrances by strategically using corners with long visual lines that are easy to see from afar.
o Concentrate farm vendors a bit more so it’s easier to find “the farmer area” and know that you’ve seen them all.
o Feature Island Fresh Seafoods as a producer in a visible booth, not as part of the concessions. This vendor offers unique products and ones people may not expect.
Other layout ideas:
o Knowing that this is a destination location and market, evaluate to what degree you want to encourage people to spend more time in the market or less. In general, there is no data to support the idea that more time in a market increases spending. The specifics of your market context and your experience probably give you a good idea about what works best.
o Consider creating a clear, regular market “meeting spot” so that groups of shoppers can easily find each other. Another option might be to try to train people to “look for the yellow tent” or some unique feature of the market.
Recommendation 3: Explore pros and cons of opening earlier
The RMA shopper data (Tables 1, 2 and Figure 4), indicate that 89% of the market visitors entered the market between 11:00am and 3:00pm. The second and third hours (12:00pm to 2:00pm) indicate a decrease of “Everett” shoppers and increase of “Snohomish County residents. Likewise, there is a decrease of “regular” shoppers and increase of “occasional” shoppers in this same period. Likewise, average shopper spending decreased from Hour 1 to Hour 4 and then increased again in Hour 5. Whether these trends hold over multiple market days is an open question. However, it suggests that your “core” shoppers, prefer to shop earlier. Everett Farmers Market is one of 13 Sunday markets among WSFMA markets (2015). Nine of these markets open at 10:00am and close no later than 3:00pm. Among the four that open at 11:00am, all close by 3:00pm except for Everett. A next step might be to poll vendors as to when they have the greatest sales or set up a dot survey to collect shopper input.

Everett Farmers Market 2017 Rapid Market Assessment Page 28
Appendix1.DotSurveyQuestions,Responses,andCounts
Everett Farmers Market—July 9, 2017 Rapid Market Assessment
An average of 820 people answered the dot survey questions. This represents an overall estimated intercept rate of 16%. Dot Survey Question Responses Total %
1. Where do you live? Marina District, Everett 16 2%
North Everett 154 18%
Central Everett 58 7%
South Everett 127 15%
Marysville 97 12%
City of Snohomish 31 4%
Other Snohomish County 217 26%
Skagit County 4 0%
Island County 9 1%
King County 36 4%
Other 92 11%
Total Q1 841 100%
2. How often do you shop at this farmers market?
Weekly 165 20%
Twice a month 183.5 22%
Once a month 108.5 13%
Once or twice a season 189 23%
This is my first visit 160 19%
Other 24 3%
Total Q2 830 100%
3. How much have you (or will you) spend at the farmers market today?
$0 21 3%
$1 to 5 18 2%
$6 to 10 60 7%
$11 to 15 66 8%
$16 to 20 157 20%
$21 to 30 175 22%
$31 to 40 119 15%
$41 to 50 77 10%
$51 to 75 53 7%
$76 to 100 29 4%
Over $100 26 3%
Total Q3 801 100%

Everett Farmers Market 2017 Rapid Market Assessment Page 29
Dot Survey Question Responses Total %
4. How much have you spent (or will you spend) at other waterfront businesses or restaurants today?
$0 451 59%
$1 to 5 20 3%
$6 to 10 22 3%
$11 to 15 40 5%
$16 to 20 53 7%
$21 to 30 60 8%
$31 to 40 36 5%
$41 to 50 34 4%
$51 to 75 22 3%
$76 to 100 8 1%
Over $100 21 3%
Total Q4 767 100%
5. How important is it to you that low‐income people can shop at this farmers market using SNAP (food stamps) or WIC/Senior FMNP?
Not important 53 6%
Somewhat important 41 5%
Important 145 18%
Very important 469 57%
No opinion 62 8%
Not familiar with SNAP & FMNP programs 46 6%
Total Q5 816 100%
6. What is your primary reason for shopping at this farmers market today?
Healthy food 110.5 13%
Environmentally friendly food 44 5%
Tasty food 68.5 8%
Affordable food 13 2%
Support a local farmer 346 40%
Flowers 44.5 5%
Atmosphere 104 12%
Seeing friends 37.5 4%
Crafts 19 2%
Prepared foods 2 0%
Other 73 8%
Total Q6 862 100%
A flip chart with Ideas to make shopping at the Everett Farmers Market better for you and pens available was also posted and people wrote open‐ended comments for the market. Please see Table 7 for results.
Everett Farmers Market 2017 Rapid Market Assessment Page 30
Appendix2.TapestryDemographics http://www.esri.com/data/tapestry/zip‐lookup