Embed Size (px)
Citation preview

Chad Aldeman
IDEAS | PEOPLE | RESULTS
JULY 2015
Mind the Gap: The Case for Re-Imagining the Way States Judge High School Quality
Table of Contents
Introduction 2
What Gets Measured Gets Managed in Schools Too 4
The Next Challenges 7
Policies to Meet the Next Challenges 10
Evidence from Tennessee 13
A Model High School Accountability System 19
Obstacles to and Benefits of a New Accountability System 26
Action Items and Conclusion 29
Endnotes 32
Acknowledgments 34
[ 2 ] Mind the Gap: The Case for Re-Imagining the Way States Judge High School Quality
How would a high school judge a student’s success? It might start with basic
questions, like whether he attended school regularly, took challenging courses,
earned good grades, and completed his degree on time. If he intended to go to
college, the school could ensure that he navigated the college admissions process and hope
he made a smooth transition. If he entered the world of work, the school might want to
know if he landed a job with decent wages and benefits.
How should an entire high school be judged on its success? A state or district could measure
how many of its students successfully managed these same steps, but until recently, it
would have been unimaginable for states to track the data necessary to make this possible.
The question of how to measure high school success is not merely theoretical. State and
federal policies on high schools typically reward schools that perform well on measures like
test scores and graduation rates while forcing changes on those that don’t. When these two
measures alone serve as proxies for a quality high school they paint an incomplete picture of
success, one that can reflect more on the school’s demographics than its success in educating
students and preparing them for the future. And instead of focusing on higher-order skills,
challenging coursework, and annual progress toward college and career readiness, schools
are encouraged to focus on lower-level skills and push all students through to a diploma,
regardless of what they learn.
Accountability systems reflect these choices. Ideally they would reflect what society values, not
what’s easiest to measure. In designing accountability systems, the decisions states make on
which measures to include and how much weight to give them can carry steep consequences
for which schools earn rewards and which ones face sanctions and the threat of interventions.
Introduction
[ 3 ] Mind the Gap: The Case for Re-Imagining the Way States Judge High School Quality
Fortunately, the conditions are now in place for a much richer definition of what it means to
be a successful high school. With the expansion of educational data sources, a critical mass of
new information about school quality now exists and is waiting to be put to good use. There is
now enough information to create low-cost but sophisticated portraits of high school quality.
According to the Data Quality Campaign, an education nonprofit that tracks states’ progress
in building and using state longitudinal data systems, in 2005 only 12 states could link K-12
with higher education data systems. By 2011, 49 states could.1 Not only are states creating the
theoretical ability to link K-12 with higher education, but more states are actually executing
the reports and making them public. As of 2013, 45 states were creating publicly available high
school feedback reports that provided information about high school students’ readiness for
and success in postsecondary education.2 The next step in this effort will be linking workforce
data. As of 2014, 19 states could match K-12 and workforce data, up from 11 in 2011.3
In addition to data availability, more states now have the structures and flexibility in place
to implement new, more nuanced accountability systems. Through waivers to the federal
No Child Left Behind Act as well as new state laws creating multifactor accountability
systems (such as A-F or 5-star grading systems), states can now add elements and weight
various factors in a way that NCLB’s rigid Adequate Yearly Progress rules did not allow.
But capacity hasn’t translated into action. Though states now have the power to design
their own accountability systems as part of the NCLB waiver initiative, states mostly have
stuck with the same methods of judging high schools: their graduation rates and student
test scores. Today, only a handful of states are holding schools accountable for actually
ensuring that students succeed in the next stage of life, be that college or a career. Out of
the 42 states plus the District of Columbia that received waivers, only two incorporated
high school dropout measures, 12 considered college entrance exams like the ACT or SAT,
seven added advanced course-taking, and four integrated measures of career-readiness.4
Not all the information that policymakers may desire in a school accountability system is
currently available, but there’s no need to wait for the perfect system. States should not be
afraid to move forward with the information they do have as they continue to expand data
capabilities. The new information holds promise as a way to paint a different, more colorful
picture than what current accountability systems can paint.
In the sections that follow, this paper:
1 Defines the challenges facing policymakers and explains why they should consider a
new approach for measuring high school success.
2 Uses a unique data set from one state, Tennessee, to show how current high school
accountability measures fall short.
3 Proposes a model high school accountability system and discuss trade-offs and
challenges in moving to such a system.
Which measures are
included in accountability
systems and how much
weight they’re given can
carry steep consequences
for schools.

[ 4 ] Mind the Gap: The Case for Re-Imagining the Way States Judge High School Quality
Noted management consultant Peter Drucker is credited with coining the phrase
“what gets measured gets managed,” and it’s as true in American education policy
as anywhere else. As policymakers enacted reforms aimed at improving basic
skills and increasing high school graduation rates, the added attention paid off with rising
math and reading test scores and graduation rates. But, unfortunately, those gains have
not translated into comparable improvements in higher-level academic achievement or
educational attainment rates.
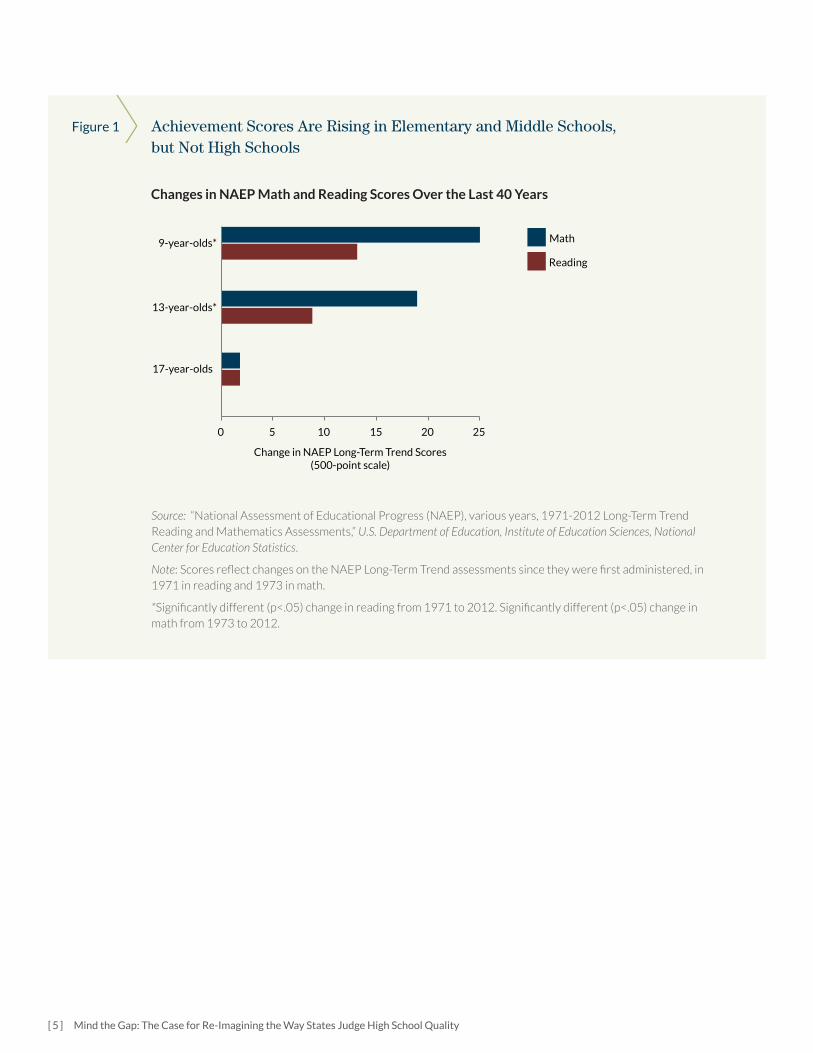
The divergences in academic gains are stark. While fourth- and eighth-grade math and
reading scores have risen the equivalent of one to two grade levels on the National
Assessment of Educational Progress (NAEP) since the first test administrations in
1973 and 1971, respectively, the scores of high school students are flat (see Figure
1).5 Internationally, Americans aged 16-34 score at or near the bottom of developed
countries on tests of literacy, numeracy, and problem-solving.6
What Gets Measured Gets Managed
in Schools Too
Reforms aimed at
increasing high school
graduation rates
and boosting reading
and math scores have
paid off.
[ 5 ] Mind the Gap: The Case for Re-Imagining the Way States Judge High School Quality
Achievement Scores Are Rising in Elementary and Middle Schools, but Not High Schools
Figure 1
Source: “National Assessment of Educational Progress (NAEP), various years, 1971-2012 Long-Term Trend Reading and Mathematics Assessments,” U.S. Department of Education, Institute of Education Sciences, National Center for Education Statistics.
Note: Scores reflect changes on the NAEP Long-Term Trend assessments since they were first administered, in 1971 in reading and 1973 in math.
*Significantly different (p<.05) change in reading from 1971 to 2012. Significantly different (p<.05) change in math from 1973 to 2012.
0 5 10 15 20
17-year-olds
13-year-olds*
9-year-olds*
Change in NAEP Long-Term Trend Scores (500-point scale)
Math
Reading
Changes in NAEP Math and Reading Scores Over the Last 40 Years
25
0
5
10
15
20
9 year olds* 13 year olds* 17 year olds*
Ch
ange
in N
AE
P L
on
g-Te
rm T
ren
d S
core
s (5
00
-po
int
scal
e)
Math
Reading
Changes in NAEP Math and Reading Scores Over the Last 40 Years
25
[ 6 ] Mind the Gap: The Case for Re-Imagining the Way States Judge High School Quality
Similarly, state and federal policies aimed at improving high school graduation rates are
a strong success. The high school graduation rate declined from 74 percent in 1990-91
to 72 percent in 2000-01. After NCLB forced states to pay more attention to high school
graduation rates, the rates began climbing and reached 81 percent by 2011-12.7 Today,
nine out of 10 adults obtain some form of high school equivalent credential, and most of
those are traditional high school diplomas. The number of dropout factories—high schools
with a graduation rate under 60 percent—declined from more than 2,007 in 2002 to 1,359
in 2012. Similarly, the number of students enrolled in those dropout factories plummeted
from 2.6 million to 1.4 million, even as the total student population nationwide increased.8
The high school dropout crisis is now primarily felt in particular schools and among
particular student populations. In 2010, 15 percent of the nation’s high schools accounted
for about half of all high school dropouts.9 And nationwide, black and Hispanic students
have graduation rates that are 17 and 13 percentage points lower than those of white
students, respectively.10
The improvements in elementary and middle school reading and math scores and
high school graduation rates are tied to state and federal efforts on these very issues.
Policymakers should be heartened that their efforts worked, at least insofar as their
narrowly tailored goals are concerned. But raising achievement levels beyond basic skills
and boosting long-term educational outcomes will require different policies than the ones
that succeeded in the past.

[ 7 ] Mind the Gap: The Case for Re-Imagining the Way States Judge High School Quality
While today’s teenagers do not score any higher on academic assessments,
they are more likely than earlier generations to at least begin postsecondary
education. Today’s families see college (meaning any form of postsecondary
education that leads to a degree or credential) as the logical next step following high school
graduation.11 Rising aspirations have translated into steadily increasing college-going
rates. In 1980, half of all U.S. high school graduates went to college, and the other half went
directly into the workforce. Today, seven out of 10 high school graduates head to college,
while only three enter the workforce.
More than half of all students who start college fail to finish any degree or certificate
program within six years. This happens for any number of reasons, but common factors
include insufficient academic preparation, the lack of financial resources to pay for school,
and the absence of a network to offer support through the social transition of college.
Many college students enroll in higher education thinking they are prepared for college-level
work, only to discover a gap between what was expected at their high school and what is
expected when they arrive on college campuses. This is common even within the same state
and even if both institutions are public schools. As many as one in five freshmen report being
placed in remedial courses12, and half of all college students eventually take at least one
remedial, not-for-credit course at some point during their college career.13 These students
face additional time and financial costs, leading to lower retention and graduation rates.
The combination of near-universal high school graduation rates and stagnant college
graduation rates results in slow growth in overall educational attainment. Americans saw
dramatic increases in educational attainment in the first half of the 20th century, but the
The Next Challenges
Many students discover
a gap between what
was expected at their
high school and what is
expected when they arrive
on college campuses.
[ 8 ] Mind the Gap: The Case for Re-Imagining the Way States Judge High School Quality
pace slowed. As the percentage of American adults with a high school diploma or GED
reached nearly 90 percent, the country failed to make progress in postsecondary education.
Other countries have dramatically increased the likelihood that their citizens will earn a
college degree, but in the U.S. it has barely risen at all.
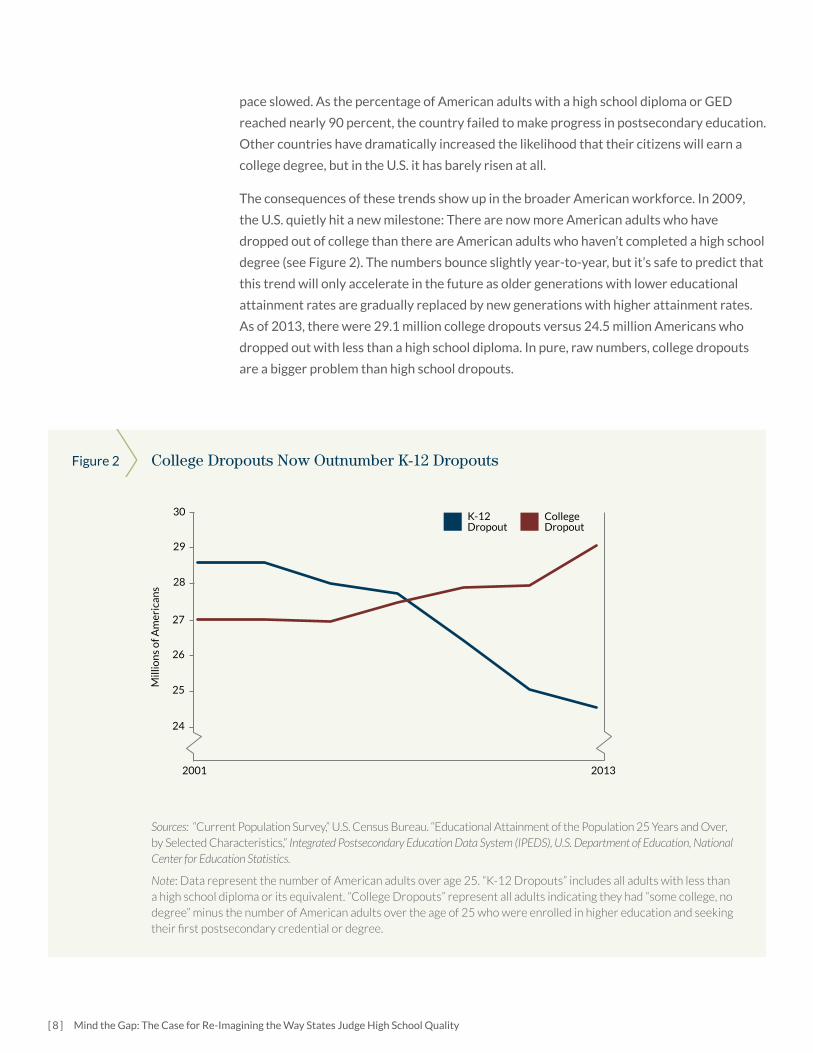
The consequences of these trends show up in the broader American workforce. In 2009,
the U.S. quietly hit a new milestone: There are now more American adults who have
dropped out of college than there are American adults who haven’t completed a high school
degree (see Figure 2). The numbers bounce slightly year-to-year, but it’s safe to predict that
this trend will only accelerate in the future as older generations with lower educational
attainment rates are gradually replaced by new generations with higher attainment rates.
As of 2013, there were 29.1 million college dropouts versus 24.5 million Americans who
dropped out with less than a high school diploma. In pure, raw numbers, college dropouts
are a bigger problem than high school dropouts.
College Dropouts Now Outnumber K-12 DropoutsFigure 2
Sources: “Current Population Survey,” U.S. Census Bureau. “Educational Attainment of the Population 25 Years and Over, by Selected Characteristics,” Integrated Postsecondary Education Data System (IPEDS), U.S. Department of Education, National Center for Education Statistics.
Note: Data represent the number of American adults over age 25. “K-12 Dropouts” includes all adults with less than a high school diploma or its equivalent. “College Dropouts” represent all adults indicating they had “some college, no degree” minus the number of American adults over the age of 25 who were enrolled in higher education and seeking their first postsecondary credential or degree.
24
25
26
27
2001 2013
K-12 Dropout
CollegeDropout
Mill
ion
s o
f Am
eric
ans
28
29
30
[ 9 ] Mind the Gap: The Case for Re-Imagining the Way States Judge High School Quality
Continuing to focus primarily on high school graduation rates at the expense of other
success indicators will not—cannot—jump-start progress. Today, even if every single
American adult without a high school diploma or its equivalent managed to earn one, the
average years of schooling could increase by less than half a year, from an average of 13.6
years of schooling to 14.0.14 In contrast, there is nearly unlimited upside potential from
getting more Americans into and through some form of postsecondary education. That
would be beneficial both to the affected individuals and for society writ large.
High schools alone cannot fix this problem. Policymakers have multiple levers at their
disposal to try to improve educational outcomes—indeed, states should not let higher
education institutions off the hook for oversubscribing students to remedial courses or for
failing to graduate large portions of their students—but state leaders should ensure that
public high schools and public colleges align their expectations about what it means to be
ready for college. High school policies also have an important role to play. States should
more clearly signal that high schools are responsible for adequately preparing students for
life after graduation.
There is nearly unlimited
upside potential from
getting more Americans
into and through some
form of postsecondary
education.

[ 10 ] Mind the Gap: The Case for Re-Imagining the Way States Judge High School Quality
American policymakers have started to pay attention to these issues. In the
name of “college and career readiness,” states have adopted more rigorous
academic standards, increased graduation requirements, and improved access
to advanced courses.
Some reformers see new, more rigorous state standards and assessments as a solution
to this problem. But the problem is not merely one of rigor; it’s also about alignment
between K-12 and higher education systems. For example, Massachusetts has
long had some of the strongest academic standards in the country—standards that
researchers found were internationally competitive and either on par with or slightly
better than the new Common Core state standards.15 But when Massachusetts studied
remediation rates at its public colleges and universities, it found that 37 percent of
public high school graduates enrolled in at least one remedial course in their first
semester in college.16 In other words, despite strong standards, Massachusetts college
freshmen actually had remediation rates that were higher than the national average.
Policies to Meet the Next Challenges
[ 11 ] Mind the Gap: The Case for Re-Imagining the Way States Judge High School Quality
The Massachusetts conundrum suggests that policy alignment between a state’s K-12
and higher education systems is at least as big a problem as the quality of the state’s
standards. As of April 2015, Delaware, Washington, and West Virginia had announced
policies ensuring that students who score at the “college-ready” level on new
assessments aligned to the Common Core would place into credit-bearing courses.17
Many other higher education leaders have expressed support for the Common Core
and higher standards in general, but they have thus far stopped short of enacting
policies ensuring alignment between K-12 standards and higher education admissions
and remediation policies.18 Even with the Common Core or other high-quality
standards, most states have not addressed the alignment issue between their K-12 and
higher education systems.
Perhaps most fundamentally, secondary schools need to move more students beyond
basic proficiency and toward higher-order skills and accomplishments. Current
K-12 accountability measures do little to solve this problem. The next section of
this paper uses a unique set of publicly available data collected by the Tennessee
State Collaborative on Reforming Education (SCORE) from the state department of
education to illustrate that while student test scores and graduation rates are a useful
proxy for longer-term outcomes, they aren’t perfect substitutes. If state leaders value
metrics like college-going in how they define a successful high school experience, they
aren’t fully capturing it with current measures.
Even with high-quality
standards, most states
have not fully aligned
their K-12 and higher
education systems.
[ 12 ] Mind the Gap: The Case for Re-Imagining the Way States Judge High School Quality
Background on the SCORE Prize Data
SCORE is an independent, nonprofit, and nonpartisan advocacy and research institution that supports Tennessee’s goal
of preparing students for college and the workforce. Among other research and policy priorities, SCORE runs an annual
competition to identify and reward schools and districts successfully preparing students for success after high school.
Each year, it recognizes one elementary school, one middle school, one high school, and one school district. All public
schools in the state are eligible, provided they have sufficient data and can be accurately placed into one of the prize
categories (e.g., a school with insufficient data or with only narrow grade configurations may not qualify).
The SCORE Prize utilizes a data set that goes beyond traditional high school accountability measures to include
college-readiness and college-going. SCORE partners with an independent, nonprofit organization to provide research,
development, and technical services. School names are de-identified to ensure that bias does not affect the SCORE
Prize review committee, composed of state and national education leaders.19 SCORE works with the Tennessee
Department of Education, Tennessee Higher Education Commission, and other organizations to collect the data and
ensure its accuracy.
SCORE collects three years’ worth of data and results on:
• Reading and math proficiency rates on the state assessment, the Tennessee Comprehensive Assessment Program
(TCAP).
• Student growth on TCAP, as calculated from the Tennessee Value-Added Assessment System (TVAAS).
• ACT scores (all Tennessee students are required to take the ACT).
• ACT growth as measured by TVAAS.
• High school graduation rates.
• College-going rates (to any public or private two- or four-year college or university across the country).
In addition, SCORE considers contextual data on the percentage of students eligible for free or reduced-price lunch
(FRPL, a proxy measure for income), school type, achievement gap sizes and changes, geographic location, attendance
rate, and the number of students who take and pass Advanced Placement courses.
After using the quantitative data to narrow the list to three finalists in each category, the committee conducts in-person
site visits in order to observe classrooms and speak with teachers and school leaders. Finally, the committee balances
the original data analyses with the qualitative reviews to select winners in each category. The winners are then honored
at a public ceremony and receive awards of $10,000 for school winners or $25,000 for the district winner.20
Sidebar 1
[ 13 ] Mind the Gap: The Case for Re-Imagining the Way States Judge High School Quality
Data collected as part of the Tennessee SCORE Prize help illustrate the problems
with the most common ways states currently use to determine high school
success. Although the SCORE Prize data do not include all potential measures
that policymakers might wish to have—metrics like the college remediation rate or the
employment rate are not yet available—they do provide sufficient information to test the
current accountability measures against other potential additions. In addition, they show
that state accountability choices matter. The measures included in state ratings, as well
as how highly those measures are weighted, lead to different conclusions about the same
school. In designing their accountability systems, states are implicitly or explicitly choosing
to value some things more strongly than others.
One way to look at how test scores and graduation rates relate to other school measures is
to consider the correlations between measures, shown in Figure 3. One notable criticism
of accountability measures is that student test scores and graduation rates are associated
with poverty rates. As the first column shows, this relationship holds true for students who
qualify for FRPL in Tennessee. Other than TVAAS, which explicitly attempts to control for
students’ incoming characteristics, the other potential accountability measures have strong
relationships with FRPL rates.
Evidence from Tennessee
In designing their
accountability systems,
states implicitly or
explicitly value some
things more strongly
than others.

[ 14 ] Mind the Gap: The Case for Re-Imagining the Way States Judge High School Quality
Correlations between High School Measures in TennesseeFigure 3
Source: Author’s calculations from Tennessee SCORE Prize data.
Figure 3 also shows the extremely strong correlation between the English and math scores
on the state’s TCAP assessments and ACT scores. As Tennessee transitions away from
the TCAP toward a new set of assessments (called TNReady) aligned to the state’s new
academic content standards, legislators should monitor this alignment and weigh the value
behind each set of assessments. For teachers and schools, TNReady may provide more
actionable feedback than the ACT about how students are progressing toward meeting
the state’s academic expectations. For students, the ACT has value in being nationally
recognized by colleges and universities, including those in Tennessee, for decisions on
admissions and placement.
Free or reduced-price
lunch
TCAP (English/
Math Proficiency)
ACT scoreTVAAS
(growth)
High school graduation
rate
College-going rate
Free or reduced-price lunch 1.00
TCAP (English/ Math Proficiency)
-0.66 1.00
ACT score -0.73 0.90 1.00
TVAAS (growth) -0.20 0.54 0.33 1.00
High school graduation rate -0.39 0.76 0.66 0.51 1.00
College-going rate -0.60 0.66 0.77 0.36 0.49 1.00
Weak Relationship Moderate Relationship Strong Relationship
[ 15 ] Mind the Gap: The Case for Re-Imagining the Way States Judge High School Quality
To further parse the data, consider which schools would be identified as strong or weak
under alternative approaches. As part of No Child Left Behind waivers granted by the
Obama administration, states identified a certain, predetermined percentage of low-
performing schools. States were required to identify at least five percent of schools as
“priority” schools—those with the lowest absolute performance over a given period
of time—plus another 10 percent as “focus” schools with large achievement gaps. The
cut points and distinctions in this “relative” approach matter, because a school in the
15th percentile may be subject to very different interventions than a school at the 16th
percentile, even if their actual results are quite similar.
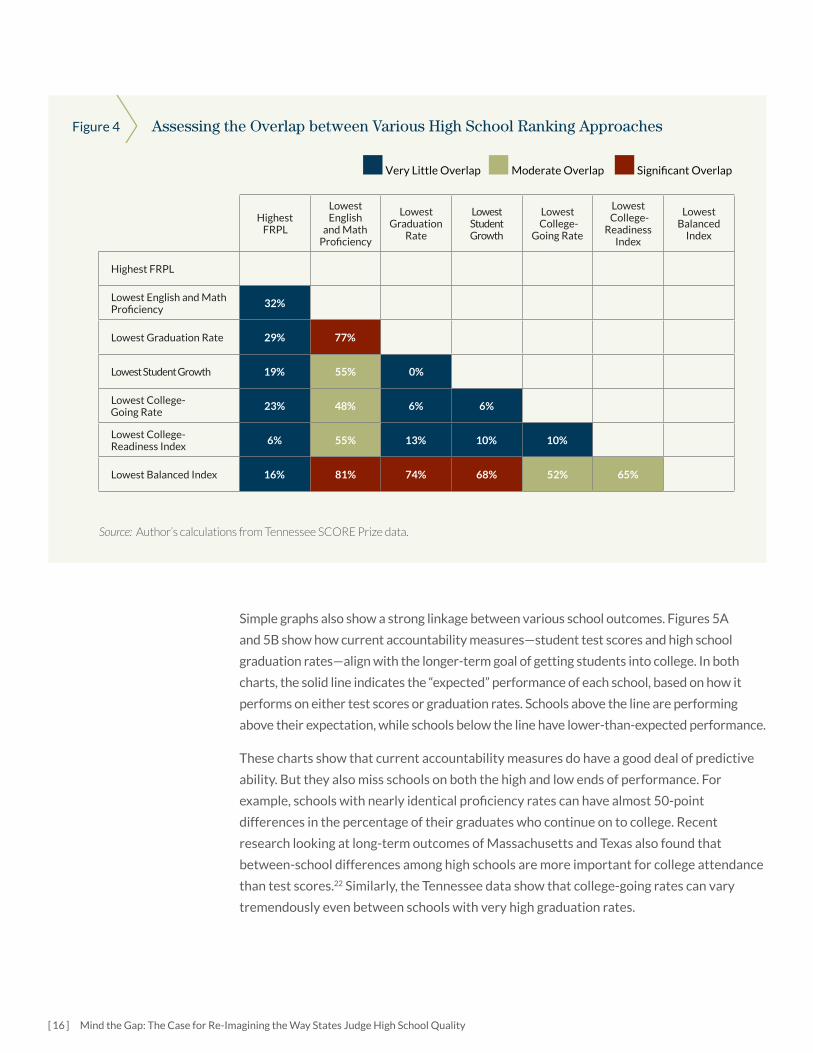
To show the impact of state choices in determining these cut points, Figure 4 compares
different relative ranking approaches. Each approach uses different sets of variables to
identify the bottom 10 percent of high schools in the SCORE Prize database.21 To be clear,
these examples use data from Tennessee but are not meant as simulations of Tennessee’s
approach. But they are illustrative in that other states can and do use similar methods to
identify schools for improvement.
The overlap in schools falling into the bottom 10 percent of high schools depends on what
variables are used to identify them. As a reference point, the first column is the 10 percent
of schools with the highest FRPL rate. Subsequent rows and columns use six other ways to
rank the bottom 10 percent of high schools:
• English and math proficiency rates.
• Graduation rates.
• The rate of student growth.
• The college-going rate.
• A College-Readiness Index that combines ACT scores, the growth between state tests
and ACT scores, the graduation rate, and the college-going rate.
• A Balanced Index that combines, in equal weights, student proficiency scores on the
state tests and ACT, student growth on the same two sets of tests, the graduation rate,
and the college-going rate.
As the table suggests, most of the lists overlap at least to some extent. None of the lists
based on student outcomes match the list based purely on student poverty rates (FRPL),
although proficiency and graduation rates have the most overlap with it. None of the
measures are not perfect substitutes for each other. For example, slightly more than half
of the schools with the lowest student growth are captured by the list of schools with low
proficiency rates. The graduation rate list has very little overlap with the list of schools that
do a poor job of preparing students to be successful in college. In short, if states care about
things like college-going rates or student growth, they aren’t fully capturing them with
existing measures.
[ 16 ] Mind the Gap: The Case for Re-Imagining the Way States Judge High School Quality
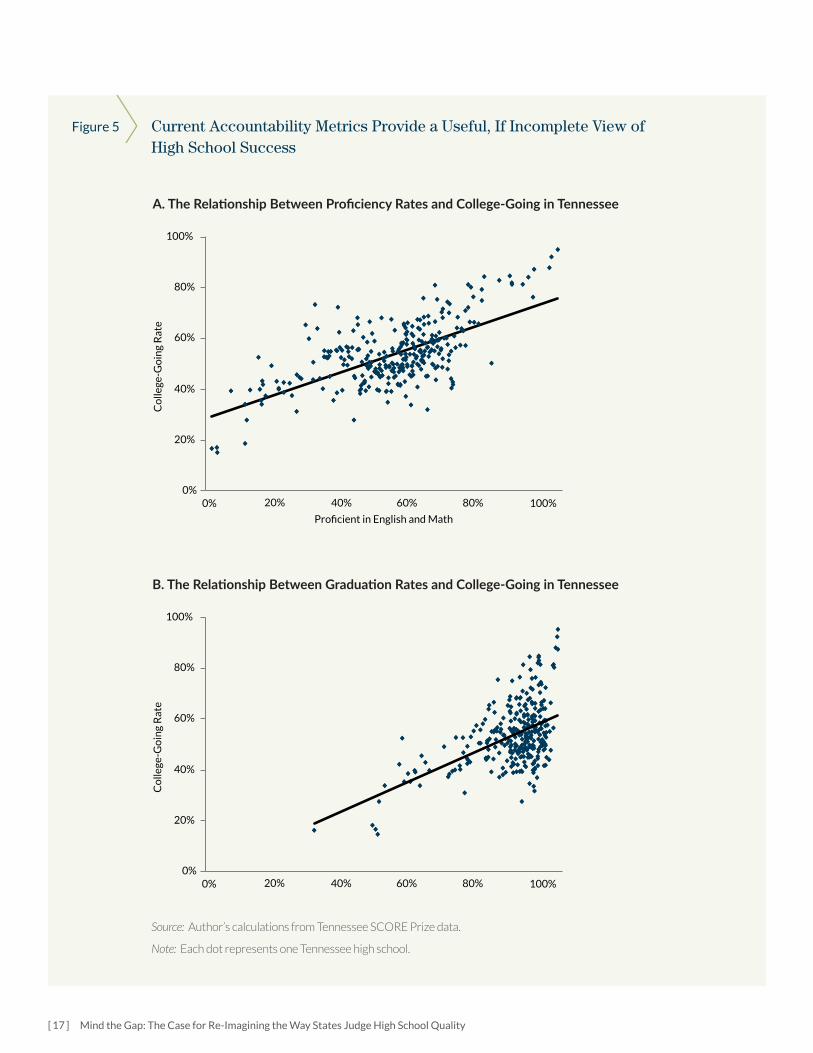
Simple graphs also show a strong linkage between various school outcomes. Figures 5A
and 5B show how current accountability measures—student test scores and high school
graduation rates—align with the longer-term goal of getting students into college. In both
charts, the solid line indicates the “expected” performance of each school, based on how it
performs on either test scores or graduation rates. Schools above the line are performing
above their expectation, while schools below the line have lower-than-expected performance.
These charts show that current accountability measures do have a good deal of predictive
ability. But they also miss schools on both the high and low ends of performance. For
example, schools with nearly identical proficiency rates can have almost 50-point
differences in the percentage of their graduates who continue on to college. Recent
research looking at long-term outcomes of Massachusetts and Texas also found that
between-school differences among high schools are more important for college attendance
than test scores.22 Similarly, the Tennessee data show that college-going rates can vary
tremendously even between schools with very high graduation rates.
Assessing the Overlap between Various High School Ranking ApproachesFigure 4
Source: Author’s calculations from Tennessee SCORE Prize data.
Highest FRPL
Lowest English
and Math Proficiency
Lowest Graduation
Rate
Lowest Student Growth
Lowest College-
Going Rate
Lowest College-
Readiness Index
Lowest Balanced
Index
Highest FRPL
Lowest English and Math Proficiency
32%
Lowest Graduation Rate 29% 77%
Lowest Student Growth 19% 55% 0%
Lowest College- Going Rate
23% 48% 6% 6%
Lowest College-Readiness Index
6% 55% 13% 10% 10%
Lowest Balanced Index 16% 81% 74% 68% 52% 65%
Very Little Overlap Moderate Overlap Significant Overlap
[ 17 ] Mind the Gap: The Case for Re-Imagining the Way States Judge High School Quality
Current Accountability Metrics Provide a Useful, If Incomplete View of High School Success
Figure 5
Source: Author’s calculations from Tennessee SCORE Prize data.
Note: Each dot represents one Tennessee high school.
0%
20%
40%
60%
80%
Co
llege
-Go
ing
Rat
e
A. The Relationship Between Proficiency Rates and College-Going in Tennessee
100%
20% 40% 60% 80% 100%
Proficient in English and Math
0%
0%
20%
40%
60%
80%
Co
llege
-Go
ing
Rat
e
B. The Relationship Between Graduation Rates and College-Going in Tennessee
100%
20% 40% 60% 80% 100%
High School Graduation Rate
0%
0%
20%
40%
60%
80%
Co
llege
-Go
ing
Rat
eA. The Relationship Between Proficiency Rates and College-Going in Tennessee
100%
20% 40% 60% 80% 100%
Proficient in English and Math
0%
0%
20%
40%
60%
80%
Co
llege
-Go
ing
Rat
e
B. The Relationship Between Graduation Rates and College-Going in Tennessee
100%
20% 40% 60% 80% 100%
High School Graduation Rate
0%
[ 18 ] Mind the Gap: The Case for Re-Imagining the Way States Judge High School Quality
Ultimately, test scores and graduation rates are useful but insufficient proxies for college-
readiness. College-going rates offer a useful indicator of how well high schools are
preparing students to succeed in postsecondary education, but astute readers may also
be asking whether all the students who go to college are actually prepared to succeed
once enrolled, or whether students who don’t go to college are finding success in the labor
market. Although the SCORE Prize data set does not allow such comparisons, the next
section discusses those trade-offs and proposes a model that states could work toward to
measure a more complete range of student outcomes.
[ 19 ] Mind the Gap: The Case for Re-Imagining the Way States Judge High School Quality
At their most basic, accountability systems are designed to create a set of incentives.
Poorly designed systems create incentives that can be “gamed” in a way that has
little relevance to what society actually values. Low-level test-based accountability
systems can run into this problem. If schools decide it’s in their best interests to spend time
on mindless test-taking strategies rather than rich academic content, schools and districts
may work toward goals that are counterproductive or worse.
Anecdotal evidence from the NCLB era suggests it has led to a “teaching to the test”
mentality in too many places, causing a backlash against testing and accountability among
teachers and parents. The trick, then, is to design a system in which schools are competing
on measures that truly matter.
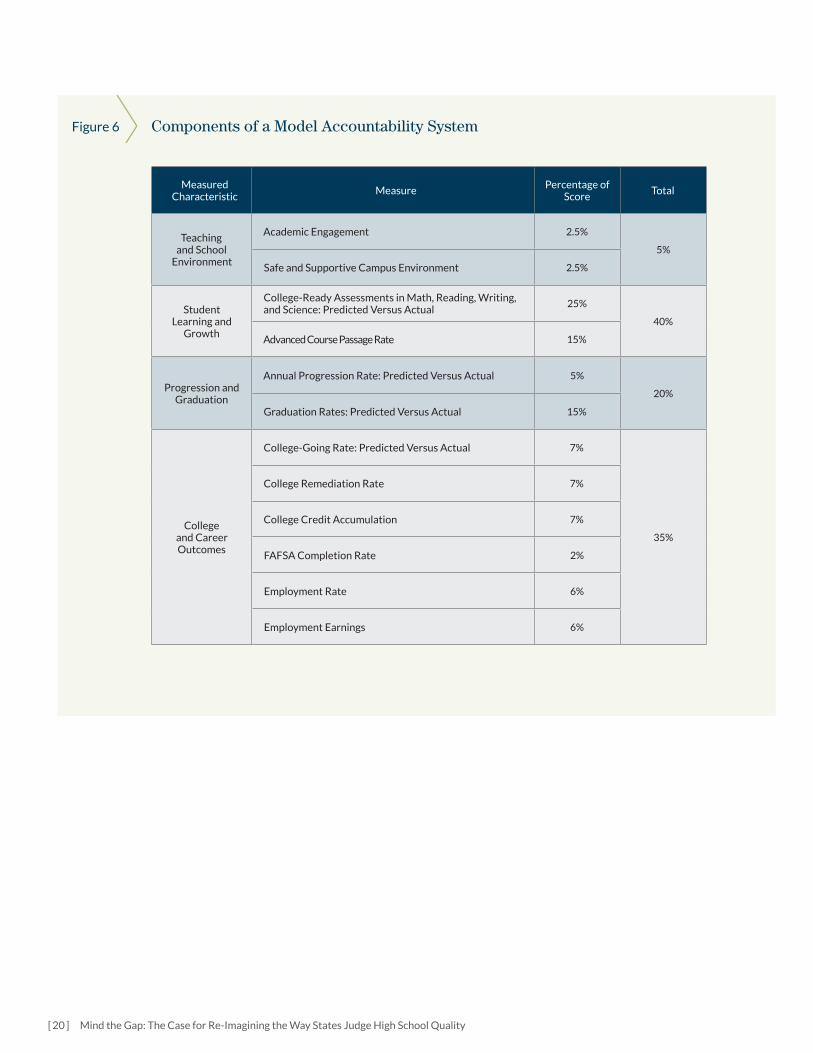
Figure 6 shows what a ranking system based on these principles could look like. It is merely
a model, meaning that states would need to adapt it for their unique contexts and stress-
test it with their own data to determine how it worked for their schools in practice. As
demonstrated in the Tennessee data above, the choices states make on which measures to
include in their accountability system and how those measures are weighted will determine
which schools are deemed successes and which are not. There is no “perfect” accountability
system, and the weights and measures included in this proposal are a reflection of its
author’s values; states may choose to weight things very differently.23 Those caveats aside,
the table offers one attempt to identify schools based on multiple measures of success:
A Model High School Accountability System
The trick is to design an
accountability system
in which schools are
competing on measures
that truly matter.
[ 20 ] Mind the Gap: The Case for Re-Imagining the Way States Judge High School Quality
Components of a Model Accountability System Figure 6
Measured Characteristic
MeasurePercentage of
ScoreTotal
Teaching and School
Environment
Academic Engagement 2.5%
5%
Safe and Supportive Campus Environment 2.5%
Student Learning and
Growth
College-Ready Assessments in Math, Reading, Writing, and Science: Predicted Versus Actual
25%
40%
Advanced Course Passage Rate 15%
Progression and Graduation
Annual Progression Rate: Predicted Versus Actual 5%
20%
Graduation Rates: Predicted Versus Actual 15%
College and Career Outcomes
College-Going Rate: Predicted Versus Actual 7%
35%
College Remediation Rate 7%
College Credit Accumulation 7%
FAFSA Completion Rate 2%
Employment Rate 6%
Employment Earnings 6%
[ 21 ] Mind the Gap: The Case for Re-Imagining the Way States Judge High School Quality
To encourage schools
to focus on a well-
rounded education, the
model system includes
assessments in math,
reading, writing, and
science.
Five percent of the new accountability system would be based on teaching and the school
environment. Rather than input-based proxy measures like faculty credentials, student-
teacher ratios, or the availability of rigorous courses, this measure would focus on students’
actual interactions with their school and their teachers. Students could complete surveys
of academic challenge and the school environment such as those offered by the Tripod
Project or other high-quality survey instruments. Researchers have found that these sorts
of student surveys are a reliable method for predicting student learning growth.24 Other
surveys, such as the High School Survey of Student Engagement, could also potentially be
used for this purpose. Created by the Center for Evaluation and Education Policy (CEEP) at
Indiana University, the HSSSE (pronounced “HESS-see”) is an open-access survey designed
to identify student engagement and comfort with the school environment.25
Some cities, charter school management organizations, and the United Kingdom have
experimented with an “inspectorate” model as one way to provide qualitative reviews of
school quality. (The SCORE Prize review team conducts its own site visits of finalists as
a way to get at the same intangible factors that cannot be observed through a school’s
raw data.) While inspectorate-style reviews may be useful to support or identify a small
subset of schools, they are also labor intensive. Another option for states to get annual,
comparative, qualitative data across all schools would be surveys. Although they do not
provide the same richness of information as inspectorate-style reviews, states could
implement statewide surveys as an inexpensive, easy, and comparable method for
examining the actual learning environment experienced by students.
A total of 40 percent of the new accountability system would be based on student learning
and growth. Most states currently rely only on math and reading proficiency rates in their
high school accountability systems. To encourage schools to focus on a well-rounded
education, the model system includes assessments in math, reading, writing, and science.
Importantly, because student proficiency rates tend to be closely linked with student
background characteristics, the model proposes an alternate approach that would give
schools credit for success with the students they’re given. It would calculate the difference
between what students were expected to score—based on their prior test results,
attendance rates, and class grades—and how they actually performed.26 This would not
explicitly measure student growth—a true student growth measure would require an
additional test in order to determine the change in student results over time—but it would
use statistical controls as a way to address potential concerns about over-reliance on
snapshot achievement measures. These calculations are especially relevant for high school
grades, where many states lack sufficient data to calculate a true student growth measure.
School and district report cards could include both the raw and adjusted figures—and
indeed, students and parents should receive both the raw scores and information on how
they performed compared with similar students—but school accountability systems should
strive to isolate the effects of the school from the effects of the student’s background
characteristics.
[ 22 ] Mind the Gap: The Case for Re-Imagining the Way States Judge High School Quality
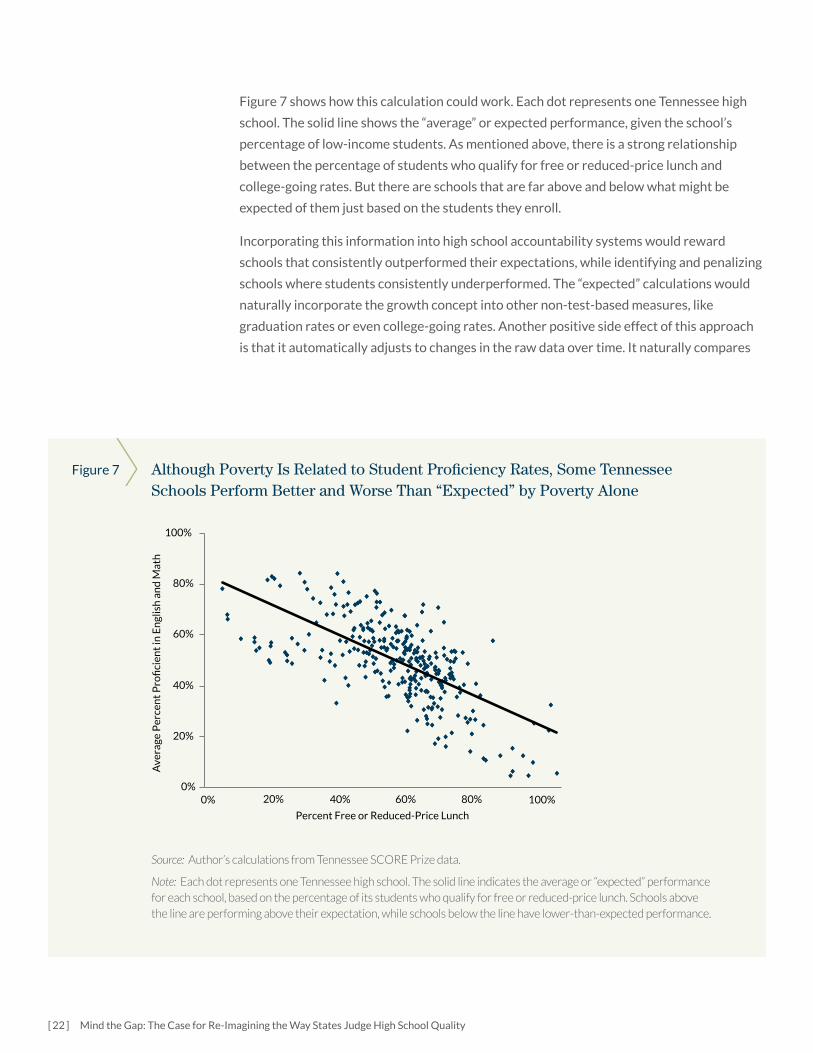
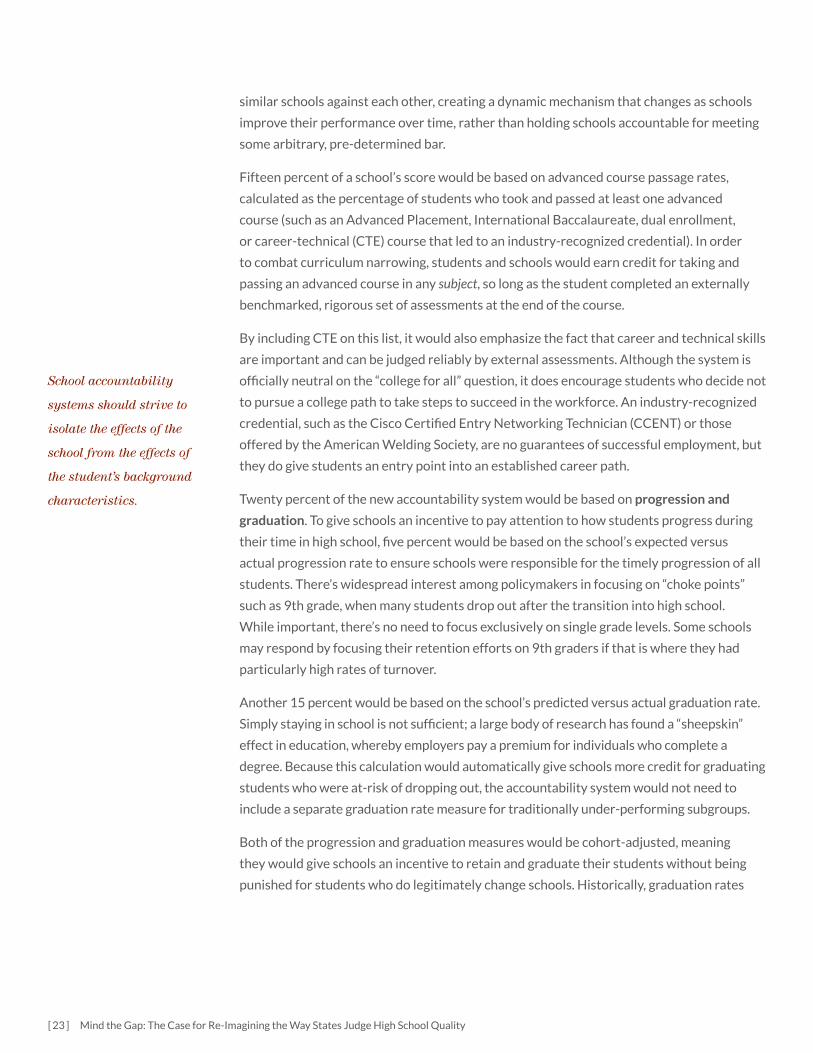
Although Poverty Is Related to Student Proficiency Rates, Some Tennessee Schools Perform Better and Worse Than “Expected” by Poverty Alone
Figure 7
Source: Author’s calculations from Tennessee SCORE Prize data.
Note: Each dot represents one Tennessee high school. The solid line indicates the average or “expected” performance for each school, based on the percentage of its students who qualify for free or reduced-price lunch. Schools above the line are performing above their expectation, while schools below the line have lower-than-expected performance.
Figure 7 shows how this calculation could work. Each dot represents one Tennessee high
school. The solid line shows the “average” or expected performance, given the school’s
percentage of low-income students. As mentioned above, there is a strong relationship
between the percentage of students who qualify for free or reduced-price lunch and
college-going rates. But there are schools that are far above and below what might be
expected of them just based on the students they enroll.
Incorporating this information into high school accountability systems would reward
schools that consistently outperformed their expectations, while identifying and penalizing
schools where students consistently underperformed. The “expected” calculations would
naturally incorporate the growth concept into other non-test-based measures, like
graduation rates or even college-going rates. Another positive side effect of this approach
is that it automatically adjusts to changes in the raw data over time. It naturally compares
0%
20%
40%
60%
80%
Ave
rage
Per
cen
t P
rofi
cien
t in
En
glis
h a
nd
Mat
h
100%
20% 40% 60% 80% 100%
Percent Free or Reduced-Price Lunch
0%
[ 23 ] Mind the Gap: The Case for Re-Imagining the Way States Judge High School Quality
School accountability
systems should strive to
isolate the effects of the
school from the effects of
the student’s background
characteristics.
similar schools against each other, creating a dynamic mechanism that changes as schools
improve their performance over time, rather than holding schools accountable for meeting
some arbitrary, pre-determined bar.
Fifteen percent of a school’s score would be based on advanced course passage rates,
calculated as the percentage of students who took and passed at least one advanced
course (such as an Advanced Placement, International Baccalaureate, dual enrollment,
or career-technical (CTE) course that led to an industry-recognized credential). In order
to combat curriculum narrowing, students and schools would earn credit for taking and
passing an advanced course in any subject, so long as the student completed an externally
benchmarked, rigorous set of assessments at the end of the course.
By including CTE on this list, it would also emphasize the fact that career and technical skills
are important and can be judged reliably by external assessments. Although the system is
officially neutral on the “college for all” question, it does encourage students who decide not
to pursue a college path to take steps to succeed in the workforce. An industry-recognized
credential, such as the Cisco Certified Entry Networking Technician (CCENT) or those
offered by the American Welding Society, are no guarantees of successful employment, but
they do give students an entry point into an established career path.
Twenty percent of the new accountability system would be based on progression and
graduation. To give schools an incentive to pay attention to how students progress during
their time in high school, five percent would be based on the school’s expected versus
actual progression rate to ensure schools were responsible for the timely progression of all
students. There’s widespread interest among policymakers in focusing on “choke points”
such as 9th grade, when many students drop out after the transition into high school.
While important, there’s no need to focus exclusively on single grade levels. Some schools
may respond by focusing their retention efforts on 9th graders if that is where they had
particularly high rates of turnover.
Another 15 percent would be based on the school’s predicted versus actual graduation rate.
Simply staying in school is not sufficient; a large body of research has found a “sheepskin”
effect in education, whereby employers pay a premium for individuals who complete a
degree. Because this calculation would automatically give schools more credit for graduating
students who were at-risk of dropping out, the accountability system would not need to
include a separate graduation rate measure for traditionally under-performing subgroups.
Both of the progression and graduation measures would be cohort-adjusted, meaning
they would give schools an incentive to retain and graduate their students without being
punished for students who do legitimately change schools. Historically, graduation rates
[ 24 ] Mind the Gap: The Case for Re-Imagining the Way States Judge High School Quality
were calculated by dividing the total number of graduates in a given year by the total
number of students who started as a freshman cohort four years before. A cohort-adjusted
measure, in contrast, adds in any incoming transfer students and subtracts out students
who transfer to another school.
Thirty-five percent of the new accountability system would be based on college and
career outcomes. Since roughly two-thirds of high school students now go directly to
college, roughly two-thirds of this outcome measure (21 out of 35) would be based on
the percentage of students who go on to college, avoid remediation classes, and begin to
accumulate college credit on the path toward college completion. This would not be limited
solely to students attending four-year liberal arts colleges. Instead, it would include all
students attending any form of postsecondary education, including those pursuing two-
year associate degrees or shorter certificate programs.
Another two percent would be based on FAFSA completion rates, the percentage of students
who complete the Free Application for Federal Student Aid. Although the index is neutral on
whether students actually go to college, it does encourage schools to ensure that all students
are prepared for it. The FAFSA is one important step of that preparation. Research suggests
that students are more likely to attend college if they know how much aid they’re eligible for;
helping students complete a FAFSA can increase the number of students who receive financial
aid, the amount of aid they receive, and even the proportion of students who enroll in college.
The American Council on Education estimates that nearly one in five low-income students
enrolled in college who would be eligible for federal Pell Grants never completes a FAFSA.27
FAFSA completion rates are included here because they’re freely available and are a powerful
symbolic message to send to schools and students. But, they’re weighted at just two percent
in the index because they could quickly become a freebie in places that made a concerted
effort to drive up their rates. Some states or cities that have strong incentive programs
such as scholarship funds already place a priority on FAFSA completion. For example, when
Tennessee introduced a free community college program that relied on the FAFSA for
eligibility, FAFSA completion rates jumped from 42 percent to 61 percent in a single year.28
In order to account for students who chose not to attend some form of college, another
12 percent of the accountability system would be based on the percentage of graduates
employed in full-time jobs earning at least enough to avoid qualifying for federal food
stamps (the income threshold for aid from the Supplemental Nutrition Assistance Program
for individuals is currently set at $15,180 per year), as measured one and three years after
high school graduation. This measure would give high schools credit for students who
choose not to go to college so long as they were on a path that did not need government
support. States could choose to set more ambitious income targets, but students who join
the military or are otherwise gainfully employed in a job paying a living wage should not
count against a high school.
States are relying on
imperfect substitutes that
will never fully bridge the
gap between K-12, higher
education, and
the workforce.
[ 25 ] Mind the Gap: The Case for Re-Imagining the Way States Judge High School Quality
If a state wanted to be entirely neutral over whether students went to college, it could
readjust these allocations to be entirely even. Alternatively, if a state wanted to further
encourage students to attend some form of postsecondary education, it could boost the
value of the college outcomes component.
States should, however, alter the weighting of their accountability systems based on their
unique situations. The model presented above is merely one option, and states or districts
could choose to vary it in key ways based on their own context, priorities, and data availability.
Some states have begun creating accountability systems that look similar, on their face, to
this proposal but which differ in key ways. They typically do not attempt to measure growth
through adaptations such as comparing predicted-versus-actual outcomes. They tend to
place too heavy of an emphasis on math and reading test score proficiency rates, and they
stop short of truly holding schools accountable for their students’ success in college or
careers. In sum, states are relying on imperfect substitutes that will never fully bridge the
gap between K-12, higher education, and the workforce.29
[ 26 ] Mind the Gap: The Case for Re-Imagining the Way States Judge High School Quality
Although there would be costs associated with this system, most of the items listed
above are free or are already covered under existing state systems. For example,
the Tripod Project and HSSSE surveys are now freely available to anyone who
would like to use them; administration and analysis would take some staff time, but there
would be no design costs. On the flip side, there would be some start-up costs associated
with determining the initial formulas for the “expected” test scores, progression rates, and
college-going rates. But once those have been estimated, states could keep the formulas
more or less in place and revisit them only every few years.
Many of the other elements are already in place. As part of the requirements of NCLB,
states are already administering some form of reading and math accountability test in high
school. Those tests could stay the same under this proposal, or they could shift to external
providers like the ACT or SAT that are already recognized by colleges and universities.
Similarly, all states as part of the 2009 stimulus act committed to tracking and reporting
college-going and credit accumulation rates. And the U.S. Department of Education now
releases school-level FAFSA completion data in real-time each spring.30
Most states would need to invest in data systems to compile and sort the data and to track
high school students transitioning into the workforce. But evidence from Florida, which
has been publicly reporting employment and earnings information since the mid-2000s,
suggests that it need not be cost prohibitive. Florida incurred a cost of $6 million to link
over 10 million individual student records when it began reporting the data.31
Obstacles to and Benefits of a New
Accountability System
[ 27 ] Mind the Gap: The Case for Re-Imagining the Way States Judge High School Quality
Although Florida’s experience may be atypical, and the workforce component may be
particularly challenging for other states to replicate, there are at least cost-effective
ways to get the higher education data. For example, the National Student Clearinghouse,
a nonprofit that originally began as a way for colleges to easily verify student enrollment
and completions, now has enrollment, persistence, and completion information from 3,300
colleges and universities covering more than 93 percent of all postsecondary students
in the U.S. For a fee of $425 per school, the Clearinghouse will provide high schools with
detailed reports on up to eight years of graduates.32 With roughly 25,000 high schools in
the United States, the Clearinghouse could provide every single high school with college
enrollment, persistence, and completion rates for $10.6 million. That is not a small figure,
but it’s far less than states and districts currently spend on testing ($1.7 billion33), and it’s
tiny compared with the $594 billion that K-12 schools spend in the aggregate each year.34
There are political and logistical challenges to implementing all of the data elements
envisioned under a model accountability system. This is especially true in the short term,
but costs alone should not prevent states from implementing other elements of the system.
Another challenge is the fact that some measures of a school’s success may not be available
for years down the road, limiting the utility of the information for rapid response. But the
philosophical question about how to weight, think about, and use data on student outcomes
suggests that it’s important to include a mix of outcomes. Accountability systems must
balance both shorter-term indicators with almost immediate results (like student surveys
and FAFSA completion data, which are now available on a weekly basis) and longer-term
outcomes from student experiences in college and careers. In the long run, including
multiple years of data and focusing on multiyear averages will lead to more stable results.
Besides, longer-term outcomes on things that are more meaningful may help drive a greater
sense of accomplishment (or urgency to change) that are lacking when relying only on
shorter-term results.
When incorporating multiple years of data into one summative rating, states must also
mitigate against schools being trapped in bad cycles where one or two years of bad
outcomes becomes part of the school’s record for several more years. A similar challenge
applies to new schools without sufficient long-term results. In moving to an accountability
system with multiple years of data, states must implement processes and decision rules
about what to do in these circumstances. For instance, a state may want to hold off rating a
new school until it has sufficient data. For other schools, a state could incorporate multiple
years of data into its rating system but place higher weights on more recent data.
Accountability opponents may suggest that a better alternative to slowly improving
accountability systems would simply be no accountability system. But a system without
a formal accountability structure still operates within its own set of informal incentives.
Without good information about school success, parents, students, and policymakers
A system without a formal
accountability structure
still operates within
its own set of informal
incentives.
[ 28 ] Mind the Gap: The Case for Re-Imagining the Way States Judge High School Quality
must make decisions based on secondhand information from third-party sources. Low-
income families will be the most disadvantaged. Schools with larger concentrations of
disadvantaged students will appear worse simply because they have older facilities or
because they have lower scores on achievement tests. But those have little to do with the
quality of learning that goes on within the school walls. Until states design accountability
systems that parents and families trust to measure what matters to them, decisions
based on superficial appearances will prevail. Low-information, low-income families will
continue to lose out.
Replacing current high school accountability systems with new, more robust ones would
have a number of important benefits.
First, although there has been a push in recent years toward more commonality across
states, measures like AP, IB, SAT, and ACT tests bring trusted, third-party verification and
greater national comparability than what exists today.
Second, the pipeline from high school to college and careers will never be seamless unless
policies attempt to clear out barriers. By explicitly linking K-12 with what comes next for
students, the schools and districts will have an incentive and a responsibility to ensure
that their offerings align with college and careers. It may also encourage them to embrace
partnerships with local colleges and universities. Data linkages alone won’t solve the
problems but would at least bring needed attention to the issue and begin to break down
unnecessary silos between K-12, higher education, and the workforce.
Third, one of the most oft-repeated criticisms of NCLB is that it placed too much emphasis
on low-level standardized tests. The accountability system proposed above would be much
tougher to game, and it would reward schools that did a good job of preparing well-rounded
students. Schools that were exclusively focused on low-level math and reading tests would
likely not score well on surveys of student engagement, and they may have difficulty
showing sufficient student progress. Perhaps most importantly, there’s simply no way for a
high school to artificially boost student success rates in college and careers. The only viable
path would be to help all students become prepared academically and socially. It may even
encourage schools to focus on more of the soft skills—like perseverance, grit, and higher-
order thinking skills—that are essential to success in life. The goal should be to create a
set of incentives for schools to improve on things that matter in the real world, to society,
employers, parents, and individual students. Public school accountability systems should
measure what society values out of its public schools.
Public school
accountability systems
should measure what
society values out of its
public schools.

[ 29 ] Mind the Gap: The Case for Re-Imagining the Way States Judge High School Quality
After decades of attention on basic skills tests and graduation rates, policymakers
should now begin to address the next generation of challenges. They should
recognize the large college dropout problem as troubling for both the affected
individuals and for the United States as a country. Improving student preparation at the
high school level will not be sufficient to solve all of the problems that ail our educational
system, but it is an underutilized tool for improvement. If the United States truly embraced
the goal of college and career readiness, its policymakers would think differently about how
students are prepared and how high schools are held accountable for results. Federal and
state policymakers would make different decisions about high schools.
At the federal level, policymakers should:
• Design the broad parameters of high school accountability rules but leave the
particulars up to individual states. For example, when NCLB is finally reauthorized,
federal officials should encourage states to include at least student proficiency rates,
student growth, graduation rates, and college- and career-readiness measures. That
would set a framework for a broad base of measures while allowing states to develop
their own systems tailored to their unique contexts and needs.
• Address graduation rates differently. Concentrated pockets of low graduation rates
require a different set of policy solutions than whole-scale problems. In recent years,
the U.S. Department of Education—justifiably—drove more resources and attention
toward high school dropout factories, but it did this with a blunt rule. In asking states
to identify their bottom five percent of schools for the most intense interventions and
Action Items and Conclusion

[ 30 ] Mind the Gap: The Case for Re-Imagining the Way States Judge High School Quality
support, the federal government also required all states to identify any high school with
a graduation rate less than 60 percent. Sixty percent is a commonly accepted definition
of a high school dropout factory, but it applies very differently in states like Maryland
or Virginia, with statewide graduation rates of 84 percent and 83 percent, respectively,
than it does in Washington, D.C., with its 59 percent statewide average. This rule
meant far more high schools were identified for improvement in places like D.C. than in
Maryland or Virginia.
• Ensure that high schools are adequately included in accountability systems. Federal
and state accountability rules have historically placed a disproportionate focus
on elementary and middle schools. Existing requirements, like the 60 percent rule
mentioned above, have done little to change this situation. For example, according
to data compiled by Tennessee SCORE, only 10 Tennessee high schools have a
graduation rate falling below the federal cut-off for more intense interventions of
60 percent. That’s only about three percent of all high schools in the state, or 0.56
percent of the total number of schools in the SCORE statewide database. Without
additional parameters, high schools would continue being the forgotten link in the K-12
pipeline. Instead, when states are required to select certain percentages of schools for
intervention efforts, they should be asked to identify at least a proportionate share of
schools across all grade levels.
• Continue funding investments in data systems. Congress has invested more than
$500 million in state data systems in recent years, providing states the opportunity
to upgrade their data infrastructure. What’s largely still missing and should be more
integral in future grants is helping states use the new data systems to develop processes
that drive continuous improvement among schools and districts.
States deserve much of the blame for the failure to advance high school accountability
systems. They have yet to use the dividends of the federal government’s investments in
data systems. Even when given the option to design new accountability systems as part of
the NCLB waiver initiative, few states incorporated actual measures of college and career
success. Leading states should be applauded for their efforts so far, but nearly every state
could improve its high school policies by:
• Creating richer, more accurate, more multidimensional measures of high school
success. They could start by using old data in new ways, such as using multiple years
of student achievement results instead of relying on a single year or “predicting”
school results based on prior student outcomes and rewarding schools for exceeding
expectations. Next, they could add freely available data sources like FAFSA completion
rates or Advanced Placement test-taking and passing rates.
Over time, states should develop a plan to incorporate new data elements such as
college-going and success rates, and employment outcomes. By phasing new indicators
in over time, states can signal what they value and then introduce new measures as
[ 31 ] Mind the Gap: The Case for Re-Imagining the Way States Judge High School Quality
they become available. As states add new measures, at first they might want to share
data for informational purposes only and then slowly increase the weighting in the
index. That would help build buy-in for the system and ensure that schools and districts
have a chance to see the information and get familiar with the data before they’re
actually held accountable for it.
• Investing in their own data systems. Although the federal government has been a large
investor in state data systems, states should take responsibility for expanding their
own capacity. They should lay out a careful plan to collect data elements that will be put
to use and to use the data in responsible ways that protect student privacy. But states
could be collecting much more information and using existing data sources in much
more creative ways.
• Fully aligning the state’s public education systems. Some states have “P-20” councils
that seek to tackle issues that cross early childhood, elementary and secondary
education, and postsecondary education sectors. But states could do much more to
ensure that expectations are aligned across their public institutions of education. At
a minimum, states should ensure that their K-12 schools and colleges and universities
are using the same definition of “college-ready” so that students do not have to spend
unnecessary time and expense taking remedial coursework on college campuses.
These steps would help get the American educational system out of a strange paradox.
Reading and math achievement levels are increasing for 4th- and 8th-graders but have
barely budged for high school students. High school graduation rates are at all-time
highs, and more students are going to and persisting in college. Meanwhile, overall
educational attainment levels have slowed considerably, to the point that the United
States is now 14th on a measure in which it used to lead the world.35
State and federal policymakers must use a different set of policies to address these
new challenges. The focus on low-level academic skills and high school graduation
rates were useful proxy measures, but they won’t be sufficient to drive dramatic
improvements going forward. Instead, states must develop new ways of defining
success and ensure that high schools are truly preparing students for college or careers.
[ 32 ] Mind the Gap: The Case for Re-Imagining the Way States Judge High School Quality
Endnotes1 “State Analysis by Essential Element,” Data Quality Campaign, 2011, http://dataqualitycampaign.org/your-
states-progress/10-essential-elements?element=nine.
2 “Challenges in Matching Student and Worker Information Raise Concerns about Longitudinal Data Systems,” U.S. Government Accountability Office, November 2014.
3 “Paving the Path to Success,” Data Quality Campaign, http://dataqualitycampaign.org/files/SUMMARY_DataForAction2014.pdf.
4 Michele McNeil, “Many States Left Key NCLB Flexibility on the Table,” Education Week, April 10, 2014, http://www.edweek.org/ew/articles/2014/04/10/28multiple.h33.html.
5 The lack of progress at the high school level cannot simply be due to the statistical quirk known as “Simpson’s Paradox,” where changes over time in demographics can mask changes among particular groups. NAEP scores of white, Hispanic, and black students have all risen faster than the overall average at all three grade levels. Although the demographic make-up of 17-year-old test-takers has changed over time, the same is true for 9- and 13-year-olds. The divergence among grade levels also cannot be simply due to differences in motivation. NAEP is not just multiple choice—it also requires students to engage with the material and respond in writing. On those portions of NAEP, high school students have similar response and engagement rates as elementary and middle school students have, suggesting that older students are not less motivated to perform than younger students.
6 “Overall Results: Millennials,” Educational Testing Service, http://www.ets.org/s/research/30079/millennials.html.
7 “State Nonfiscal Survey of Public Elementary/Secondary Education, 1986-2008,” U.S. Department of Education, National Center for Education Statistics, Common Core of Data, 2013. “State Dropout and Completion Data File, 2005-10,” Common Core of Data, 2013. “The Averaged Freshman Graduation Rate for Public High Schools, 2002-04,” Common Core of Data, 2013. “Public School Graduates and Dropouts, 2007-09,” Common Core of Data, 2013. “NCES State Dropout and Graduation Rate Data File, School Year 2010-11, Provisional 1a and School Year 2011-12, Preliminary Version 1a,” Common Core of Data, 2013. “Averaged Freshman Graduation Rates for Public Secondary Schools, 1990-2010,” Digest of Education Statistics, 2012. “Annual Diploma Counts and the Averaged Freshmen Graduation Rate in the United States by Race/Ethnicity, 2007-12,” Common Core of Data, http://nces.ed.gov/ccd/tables/AFGR0812.asp.
8 Robert Balfanz, John Bridgeland, Joanna Fox, Jennifer DePaoli, Erin Ingram, Mary Maushard, “Building a Grad Nation: Progress and Challenge in Ending the High School Dropout Epidemic,” Civic Enterprises, Johns Hopkins University, America’s Promise Alliance, Alliance for Excellent Education, April 2014, http://gradnation.org/sites/default/files/17548_BGN_Report_FinalFULL_5.2.14.pdf.
9 Robert Balfanz, John Bridgeland, Laura Moore, Joanna Fox, “Building a Grad Nation,” Civic Enterprises, Johns Hopkins University, November 2010, http://www.americaspromise.org/sites/default/files/Building%20a%20Grad%20Nation_FullReport_FINAL%2011-30-10_0.pdf.
10 Marie Stetser and Robert Stillwell, “Public High School Four-Year On-Time Graduation Rates and Event Dropout Rates: School Years 2010–11 and 2011–12 (NCES 2014-391),” U.S. Department of Education, National Center for Education Statistics, Washington, DC, April 2014.
11 Terris Ross, Grace Kena, Amy Rathbun, Angelina Kewal Ramani, Jijun Zhang, Paul Kristapovich, and Eileen Manning, “Higher Education: Gaps in Access and Persistence Study,” US Department of Education, National Center for Education Statistics, 2012.
12 Dinah Sparks and Nat Malkus, “Statistics in Brief: First-Year Undergraduate Remedial Coursetaking: 1999-2000, 2003-2004, 2007-2008,” National Center for Education Statistics, 2013.
13 “An Overview of Classes Taken and Credits Earned by Postsecondary Students,” National Center for Education Statistics, 2012.
14 Author’s calculations from the U.S. Census Bureau’s Current Population Survey, 2012.
15 “Lining Up: The Relationship between the Common Core State Standards and Five Sets of Comparison Standards,” Educational Policy Improvement Center, https://www.epiconline.org/publications/documents/LiningUp-FullReport_2011.pdf.
16 “Massachusetts School-to-College Report High School Class of 2005,” Massachusetts Department of Education and Board of Higher Education, 2008, http://www.mass.edu/library/Reports/2005SchoolToCollegeStateReport.pdf.
[ 33 ] Mind the Gap: The Case for Re-Imagining the Way States Judge High School Quality
17 Catherine Gewertz, “Washington State Universities Will Use Smarter Balanced Test Scores for Placement, Education Week Blog, October 8, 2014, http://blogs.edweek.org/edweek/curriculum/2014/10/Washington_higher_ed_will_use_SBAC_scores_for_placement.html?cmp=SOC-SHR-TW. Matthew Albright, “Test scores could help kids get out of remedial classes,” The News Journal, April 15, 2015.
18 See, for example: “Higher Ed for Higher Standards,” Collaborative for Student Success, http://higheredforhigherstandards.org/.
19 Disclosure: The author served on the SCORE Prize committee in 2013 and 2014.
20 “The Score Prize,” State Collaborative on Reforming Education, 2011, http://tnscore.org/scoreprize/learn.php.
21 Per federal guidance, Tennessee identifies five percent of its Title I schools as priority schools. Schools are identified if they are in the bottom five percent of the state in terms of academic achievement, regardless of grade level.
22 Jennifer Jennings, et al., “Do Differences in School Quality Matter More Than We Thought? New Evidence on Educational Opportunity in the Twenty-First Century,” Sociology of Education 88, no.1 (2015): 56–82.
23 All measures could be standardized, meaning that all schools and districts would be compared with each other to provide accurate comparisons across measures and years. In addition, this method would give schools incentives to continue boosting their performance even if they were far above their peers, because what would matter most would be relative performance.
24 “Gathering Feedback for Teaching: Combining High-Quality Observations with Student Surveys and Achievement Gains,” Bill & Melinda Gates Foundation, January 2012, http://www.metproject.org/downloads/MET_Gathering_Feedback_Research_Paper.pdf.
25 For more information, see: “High School Survey of Student Engagement,” Indiana University, http://ceep.indiana.edu/hssse/index.shtml.
26 The calculations would not control for race/ethnicity, disability status, or English Language Learner status so as to avoid setting expectations based on demographic factors. Besides the principle against setting different expectations based on a student’s race/ethnicity, researchers have found little value in controlling for demographic factors after controlling for prior test scores or other observed behaviors.
27 Jenny Nagaoka, Melissa Roderick, and Vanessa Coca, “Barriers to College Attainment: Lessons from Chicago,” Center for American Progress, January 2009, http://cdn.americanprogress.org/wp-content/uploads/issues/2009/01/pdf/ChicagoSchools.pdf.
28 Ashley A. Smith, “The Impact of Tuition,” InsideHigherEd, March 17, 2015.
29 A state with a comprehensive plan would align all of its public institutions along these transition points, including middle schools to high schools, high schools to colleges, and higher education to the workforce.
30 “FAFSA Completion by High School,” U.S. Department of Education, https://studentaid.ed.gov/sa/about/data-center/student/application-volume/fafsa-completion-high-school.
31 Kevin Carey, “College Rankings Reformed: The Case for a New Order in Higher Education,” Education Sector, September 2006, http://www.educationsector.org/usr_doc/CollegeRankingsReformed.pdf. “Florida Education and Training Placement Information Program (FETPIP),” Florida Department of Education, http://www.fldoe.org/fetpip/high.asp.
32 For more information, see: “StudentTracker for High Schools,” http://www.studentclearinghouse.org/high_schools/files/STHS_OverviewFlyer.pdf.
33 Matthew Chingos, “Testing Costs a Drop in the Bucket,” Brookings, http://www.brookings.edu/blogs/up-front/posts/2015/02/02-standardized-tests-chingos.
34 Mark Dixon, “Public Education Finances: 2012,” U.S. Census Bureau, http://www2.census.gov/govs/school/12f33pub.pdf.
35 Organization for Economic Co-operation and Development (OECD), “Education at a Glance 2012: OECD Indicators,” OECD Publishing, 2012, http://dx.doi.org/10.1787/eag-2012-en.
[ 34 ] Mind the Gap: The Case for Re-Imagining the Way States Judge High School Quality
The author would like to thank the individuals who shared their knowledge
and perspectives for this paper, including Brad Jupp, Christy Hovanetz, Rae
Ann Knopf, Bill Tucker, Anne Hyslop, Michael Dannenberg, Cory Curl, and
Alissa Peltzman. I’m particularly grateful to Drew Jacobs, SCORE’s Director
of Data and Research, for his collaboration on this project and feedback on
earlier drafts. I would also like to thank my Bellwether colleagues Sara Mead
and Andy Rotherham for their support and input on this work.
Finally, I would like to thank the Bill & Melinda Gates Foundation for providing
funding for this project and Tennessee SCORE for supplying de-identified
data on Tennessee’s schools. The views and analysis in this report are the
responsibility of the author alone and do not necessarily reflect the views
of the Bill & Melinda Gates Foundation, SCORE, the Tennessee Department
of Education, or the Tennessee Higher Education Commission. Any opinions
expressed herein are those of the author alone, as are any errors of fact or
analysis, and should not be attributed to any other individual or organization.
Acknowledgments
[ 35 ] Mind the Gap: The Case for Re-Imagining the Way States Judge High School Quality
About the AuthorMead
Chad Aldeman
Chad Aldeman is an Associate Partner with Bellwether Education Partners.
About Bellwether Education Partners
Bellwether Education Partners is a nonprofit dedicated to helping education
organizations—in the public, private, and nonprofit sectors—become more effective
in their work and achieve dramatic results, especially for high-need students. To do
so, we provide a unique combination of exceptional thinking, talent, and hands-on
strategic support.
IDEAS | PEOPLE | RESULTS
© 2015 Bellwether Education Partners
This report carries a Creative Commons license, which permits noncommercial re-use of content when proper attribution is provided. This means you are free to copy, display and distribute this work, or include content from this report in derivative works, under the following conditions:
Attribution. You must clearly attribute the work to Bellwether Education Partners, and provide a link back to the publication at http://bellwethereducation.org/.
Noncommercial. You may not use this work for commercial purposes without explicit prior permission from Bellwether Education Partners.
Share Alike. If you alter, transform, or build upon this work, you may distribute the resulting work only under a license identical to this one.
For the full legal code of this Creative Commons license, please visit www.creativecommons.org. If you have any questions about citing or reusing Bellwether Education Partners content, please contact us.