Embed Size (px)
Citation preview
RESEARCH
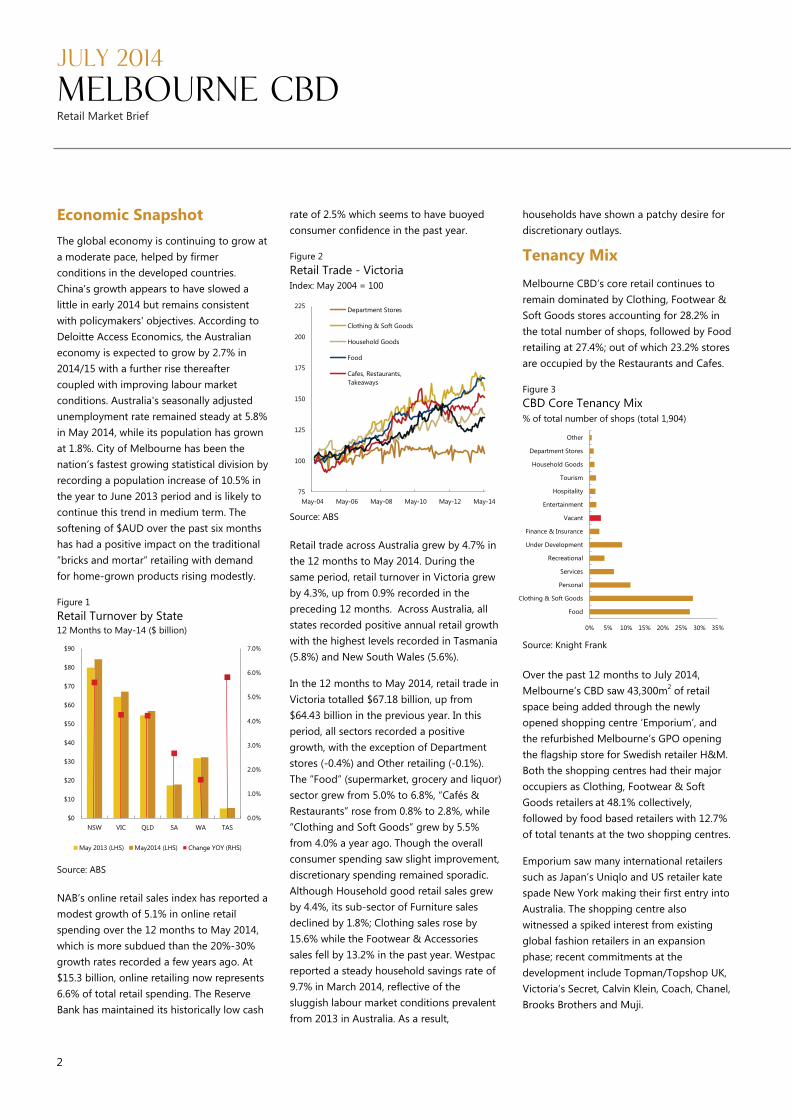
JULY 2014
MELBOURNE CBD Retail Market Brief
HIGHLIGHTS • Within the Knight Frank CBD core retail survey of 1,904 shops, 58 were recorded
as vacant resulting in a vacancy rate of 3.02%, down from 3.97% recorded in January 2014. Over the past six months, vacancy within Shopping Centres fell from 4.19% to 2.32% and decreased from 4.43% to 3.76% in Street Front shops. The vacancy rate in Arcades rose from 2.32% to 2.93%.
• Clothing, Footwear & Soft goods traders and Food retailers clearly dominate the Melbourne CBD retail core precinct with a collective proportion of 55.6% in the total stock. Recent incoming tenants into the CBD include Topman/Topshop UK, Victoria’s Secret, Calvin Klein, Coach, Brooks Brothers, Muji and Uniqlo at Emporium and, H&M at Melbourne’s GPO.
• The total value of CBD retail sales (>$1 million) in the 12 months to June 2014 totalled $210.3 million across 21 properties, a growth of 157% compared to the sales recorded a year ago. Offshore buyers (67%) were the dominant purchaser group followed by private investors (17%).
JULY 2014
MELBOURNE CBD Retail Market Brief
2
0.0%
1.0%
2.0%
3.0%
4.0%
5.0%
6.0%
7.0%
$0
$10
$20
$30
$40
$50
$60
$70
$80
$90
NSW VIC QLD SA WA TAS
May 2013 (LHS) May2014 (LHS) Change YOY (RHS)
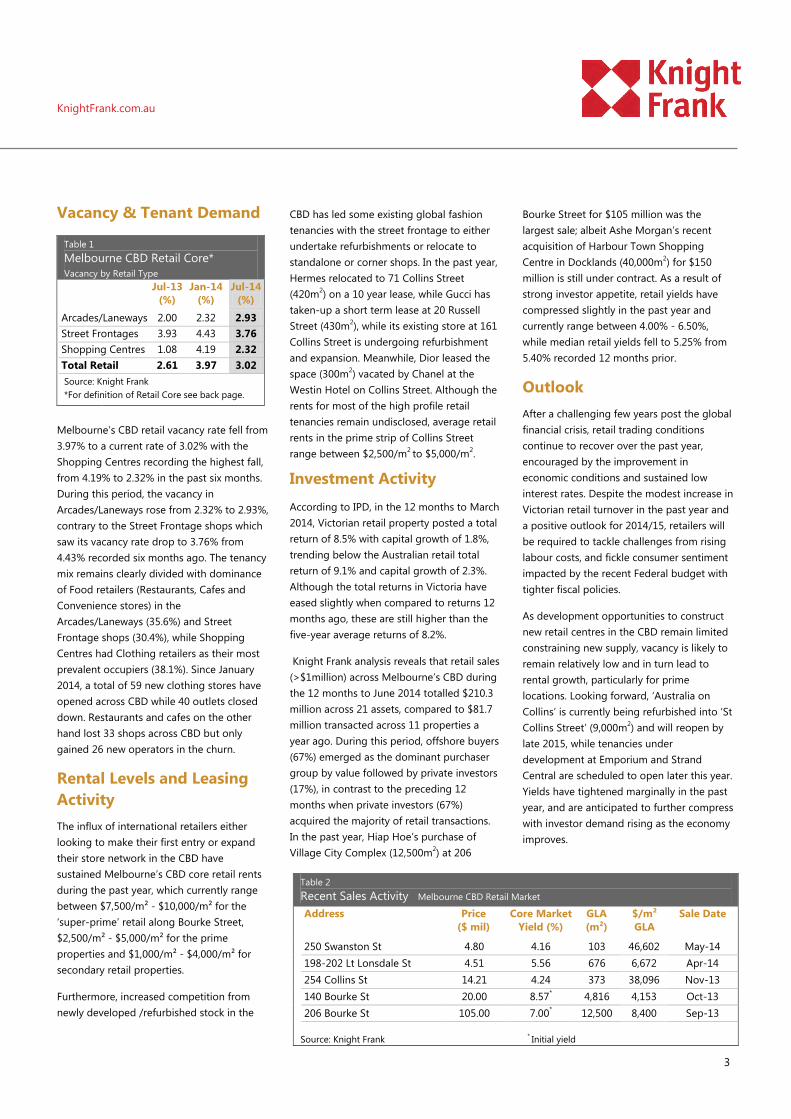
Economic Snapshot The global economy is continuing to grow at a moderate pace, helped by firmer conditions in the developed countries. China's growth appears to have slowed a little in early 2014 but remains consistent with policymakers' objectives. According to Deloitte Access Economics, the Australian economy is expected to grow by 2.7% in 2014/15 with a further rise thereafter coupled with improving labour market conditions. Australia's seasonally adjusted unemployment rate remained steady at 5.8% in May 2014, while its population has grown at 1.8%. City of Melbourne has been the nation’s fastest growing statistical division by recording a population increase of 10.5% in the year to June 2013 period and is likely to continue this trend in medium term. The softening of $AUD over the past six months has had a positive impact on the traditional “bricks and mortar” retailing with demand for home-grown products rising modestly.
Figure 1 Retail Turnover by State 12 Months to May-14 ($ billion)
Source: ABS
NAB’s online retail sales index has reported a modest growth of 5.1% in online retail spending over the 12 months to May 2014, which is more subdued than the 20%-30% growth rates recorded a few years ago. At $15.3 billion, online retailing now represents 6.6% of total retail spending. The Reserve Bank has maintained its historically low cash
rate of 2.5% which seems to have buoyed consumer confidence in the past year.
Figure 2 Retail Trade - Victoria Index: May 2004 = 100
Source: ABS
Retail trade across Australia grew by 4.7% in the 12 months to May 2014. During the same period, retail turnover in Victoria grew by 4.3%, up from 0.9% recorded in the preceding 12 months. Across Australia, all states recorded positive annual retail growth with the highest levels recorded in Tasmania (5.8%) and New South Wales (5.6%).
In the 12 months to May 2014, retail trade in Victoria totalled $67.18 billion, up from $64.43 billion in the previous year. In this period, all sectors recorded a positive growth, with the exception of Department stores (-0.4%) and Other retailing (-0.1%). The “Food” (supermarket, grocery and liquor) sector grew from 5.0% to 6.8%, “Cafés & Restaurants” rose from 0.8% to 2.8%, while “Clothing and Soft Goods” grew by 5.5% from 4.0% a year ago. Though the overall consumer spending saw slight improvement, discretionary spending remained sporadic. Although Household good retail sales grew by 4.4%, its sub-sector of Furniture sales declined by 1.8%; Clothing sales rose by 15.6% while the Footwear & Accessories sales fell by 13.2% in the past year. Westpac reported a steady household savings rate of 9.7% in March 2014, reflective of the sluggish labour market conditions prevalent from 2013 in Australia. As a result,
households have shown a patchy desire for discretionary outlays.
Tenancy Mix
Melbourne CBD’s core retail continues to remain dominated by Clothing, Footwear & Soft Goods stores accounting for 28.2% in the total number of shops, followed by Food retailing at 27.4%; out of which 23.2% stores are occupied by the Restaurants and Cafes.
Figure 3 CBD Core Tenancy Mix % of total number of shops (total 1,904)
Source: Knight Frank
Over the past 12 months to July 2014, Melbourne’s CBD saw 43,300m2 of retail space being added through the newly opened shopping centre ‘Emporium’, and the refurbished Melbourne’s GPO opening the flagship store for Swedish retailer H&M. Both the shopping centres had their major occupiers as Clothing, Footwear & Soft Goods retailers at 48.1% collectively, followed by food based retailers with 12.7% of total tenants at the two shopping centres.
Emporium saw many international retailers such as Japan’s Uniqlo and US retailer kate spade New York making their first entry into Australia. The shopping centre also witnessed a spiked interest from existing global fashion retailers in an expansion phase; recent commitments at the development include Topman/Topshop UK, Victoria’s Secret, Calvin Klein, Coach, Chanel, Brooks Brothers and Muji.
0% 5% 10% 15% 20% 25% 30% 35%
Food
Clothing & Soft Goods
Personal
Services
Recreational
Under Development
Finance & Insurance
Vacant
Entertainment
Hospitality
Tourism
Household Goods
Department Stores
Other
75
100
125
150
175
200
225
May-04 May-06 May-08 May-10 May-12 May-14
Department Stores
Clothing & Soft Goods
Household Goods
Food
Cafes, Restaurants,Takeaways
KnightFrank.com.au
3
Vacancy & Tenant Demand
Melbourne’s CBD retail vacancy rate fell from 3.97% to a current rate of 3.02% with the Shopping Centres recording the highest fall, from 4.19% to 2.32% in the past six months. During this period, the vacancy in Arcades/Laneways rose from 2.32% to 2.93%, contrary to the Street Frontage shops which saw its vacancy rate drop to 3.76% from 4.43% recorded six months ago. The tenancy mix remains clearly divided with dominance of Food retailers (Restaurants, Cafes and Convenience stores) in the Arcades/Laneways (35.6%) and Street Frontage shops (30.4%), while Shopping Centres had Clothing retailers as their most prevalent occupiers (38.1%). Since January 2014, a total of 59 new clothing stores have opened across CBD while 40 outlets closed down. Restaurants and cafes on the other hand lost 33 shops across CBD but only gained 26 new operators in the churn.
Rental Levels and Leasing Activity The influx of international retailers either looking to make their first entry or expand their store network in the CBD have sustained Melbourne’s CBD core retail rents during the past year, which currently range between $7,500/m² - $10,000/m² for the ‘super-prime’ retail along Bourke Street, $2,500/m² - $5,000/m² for the prime properties and $1,000/m² - $4,000/m² for secondary retail properties.
Furthermore, increased competition from newly developed /refurbished stock in the
CBD has led some existing global fashion tenancies with the street frontage to either undertake refurbishments or relocate to standalone or corner shops. In the past year, Hermes relocated to 71 Collins Street (420m2) on a 10 year lease, while Gucci has taken-up a short term lease at 20 Russell Street (430m2), while its existing store at 161 Collins Street is undergoing refurbishment and expansion. Meanwhile, Dior leased the space (300m2) vacated by Chanel at the Westin Hotel on Collins Street. Although the rents for most of the high profile retail tenancies remain undisclosed, average retail rents in the prime strip of Collins Street range between $2,500/m2 to $5,000/m2.
Investment Activity
According to IPD, in the 12 months to March 2014, Victorian retail property posted a total return of 8.5% with capital growth of 1.8%, trending below the Australian retail total return of 9.1% and capital growth of 2.3%. Although the total returns in Victoria have eased slightly when compared to returns 12 months ago, these are still higher than the five-year average returns of 8.2%.
Knight Frank analysis reveals that retail sales (>$1million) across Melbourne’s CBD during the 12 months to June 2014 totalled $210.3 million across 21 assets, compared to $81.7 million transacted across 11 properties a year ago. During this period, offshore buyers (67%) emerged as the dominant purchaser group by value followed by private investors (17%), in contrast to the preceding 12 months when private investors (67%) acquired the majority of retail transactions. In the past year, Hiap Hoe’s purchase of Village City Complex (12,500m2) at 206
Bourke Street for $105 million was the largest sale; albeit Ashe Morgan’s recent acquisition of Harbour Town Shopping Centre in Docklands (40,000m2) for $150 million is still under contract. As a result of strong investor appetite, retail yields have compressed slightly in the past year and currently range between 4.00% - 6.50%, while median retail yields fell to 5.25% from 5.40% recorded 12 months prior.
Outlook After a challenging few years post the global financial crisis, retail trading conditions continue to recover over the past year, encouraged by the improvement in economic conditions and sustained low interest rates. Despite the modest increase in Victorian retail turnover in the past year and a positive outlook for 2014/15, retailers will be required to tackle challenges from rising labour costs, and fickle consumer sentiment impacted by the recent Federal budget with tighter fiscal policies.
As development opportunities to construct new retail centres in the CBD remain limited constraining new supply, vacancy is likely to remain relatively low and in turn lead to rental growth, particularly for prime locations. Looking forward, ‘Australia on Collins’ is currently being refurbished into ‘St Collins Street’ (9,000m2) and will reopen by late 2015, while tenancies under development at Emporium and Strand Central are scheduled to open later this year. Yields have tightened marginally in the past year, and are anticipated to further compress with investor demand rising as the economy improves.
Table 1 Melbourne CBD Retail Core* Vacancy by Retail Type
Jul-13 (%)
Jan-14 (%)
Jul-14 (%)
Arcades/Laneways 2.00 2.32 2.93 Street Frontages 3.93 4.43 3.76 Shopping Centres 1.08 4.19 2.32 Total Retail 2.61 3.97 3.02
Source: Knight Frank *For definition of Retail Core see back page.
Table 2 Recent Sales Activity Melbourne CBD Retail Market Address Price
($ mil) Core Market
Yield (%) GLA (m²)
$/m² GLA
Sale Date
250 Swanston St 4.80 4.16 103 46,602 May-14 198-202 Lt Lonsdale St 4.51 5.56 676 6,672 Apr-14 254 Collins St 14.21 4.24 373 38,096 Nov-13 140 Bourke St 20.00 8.57* 4,816 4,153 Oct-13 206 Bourke St 105.00 7.00* 12,500 8,400 Sep-13
Source: Knight Frank * Initial yield
4
RESEARCH
Americas USA Bermuda Brazil Caribbean Chile
Australasia Australia New Zealand
Europe UK Belgium Czech Republic France Germany Hungary Ireland Italy Monaco Poland Portugal Russia Spain The Netherlands Ukraine
Africa Botswana Kenya Malawi Nigeria South Africa Tanzania Uganda Zambia Zimbabwe
Asia Cambodia China Hong Kong India Indonesia Macau Malaysia Singapore South Korea Thailand Vietnam
Middle East Bahrain Qatar United Arab Emirates
Knight Frank Research Matt Whitby National Director, Head of Research & Consulting +61 2 9036 6616 [email protected] Richard Jenkins Director – Research Victoria +61 3 9604 4713 [email protected] Monica Mondkar Research Analyst – Victoria +61 3 9604 4608 [email protected] Knight Frank Valuations Joe Perillo Joint Managing Director – Valuations +61 3 9604 4617 [email protected] Michael Schuh Director – Valuations +61 3 9604 4726 [email protected]
Agency Contacts Gary Loo Director – Retail Leasing +61 3 9604 4743 [email protected] Marcus Quinn Director – Commercial Sales +61 3 9604 4638 [email protected] Langton McHarg Director – Commercial Sales +61 3 9604 4619 [email protected] Rita Carney Associate Director Asset Management Services +61 3 9604 4660 [email protected] James Templeton Managing Director – Victoria +61 3 9604 4724 [email protected]
Retail Core Definition: Knight Frank’s survey covers the key CBD retail precinct as defined as the Core. The
CBD retail Core includes all retail premises within the broad boundaries of La Trobe Street to the North,
Flinders Street to the South, Spring Street to the East and Elizabeth Street to the West. Knight Frank Research provides strategic advice, consultancy services and forecasting to a wide range of clients worldwide including developers, investors, financial and corporate institutions. All recognise the need for the provision of expert independent advice customised to their specific needs. Knight Frank Research reports are also available at KnightFrank.com.au
© Knight Frank 2014 This report is published for general information only. Although high standards have been used in the preparation of the information, analysis, views and projections presented in this report, no legal responsibility can be accepted by Knight Frank Research or Knight Frank for any loss or damage resultant from the contents of this document. As a general report, this material does not necessarily represent the view of Knight Frank in relation to particular properties or projects. Reproduction of this report in whole or in part is not permitted without prior consent of, and proper reference to Knight Frank Research.