Embed Size (px)
DESCRIPTION
Monthly real estate market statistics with colourful graphs that breathe life into cold hard data. Serving the communities of Wasaga Beach, Collingwood, Blue Mountain and Tiny Beaches
Citation preview

HomeHuntthewith Bruce Johnson
MARKETREPORT
Bruc
e Jo
hnso
n
JULY2012
Wasaga Beach•Collingwood•Blue Mountain•Tiny Beaches
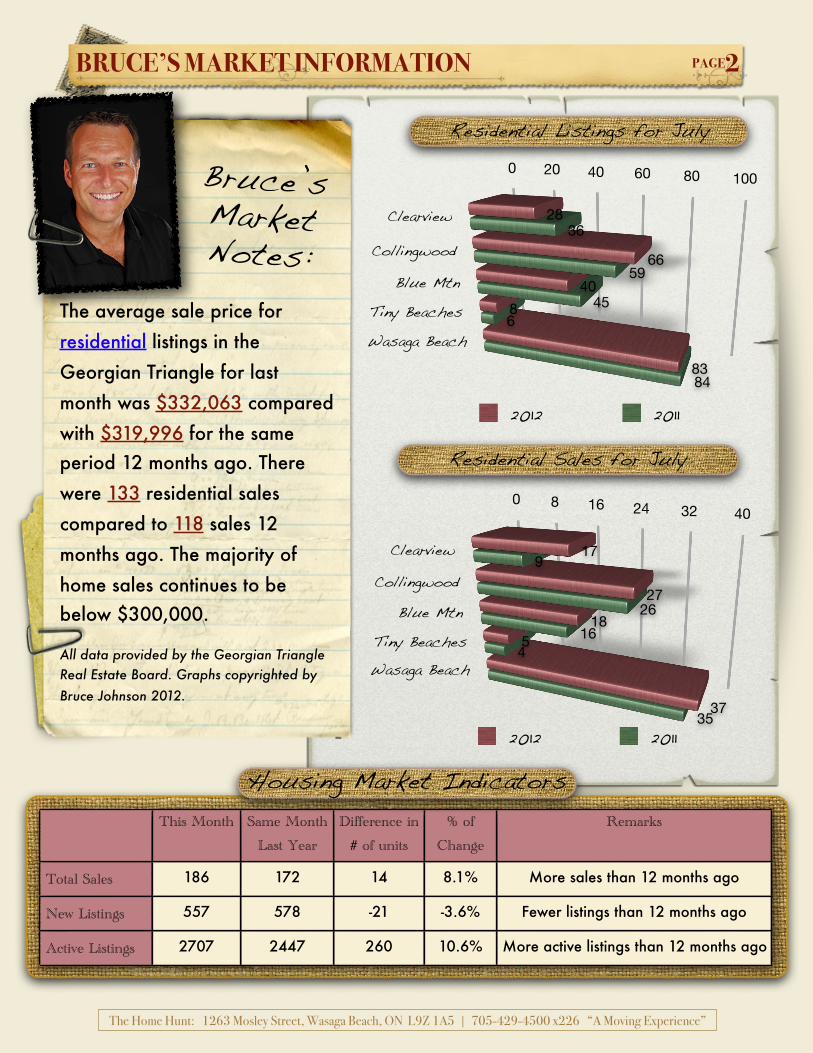
The average sale price for residential listings in the Georgian Triangle for last month was $332,063 compared with $319,996 for the same period 12 months ago. There were 133 residential sales compared to 118 sales 12 months ago. The majority of home sales continues to be below $300,000.
All data provided by the Georgian Triangle Real Estate Board. Graphs copyrighted by Bruce Johnson 2012.
This Month Same Month Last Year
Difference in # of units
% of Change
Remarks
Total Sales 186 172 14 8.1% More sales than 12 months ago
New Listings 557 578 -21 -3.6% Fewer listings than 12 months ago
Active Listings 2707 2447 260 10.6% More active listings than 12 months ago
Residential Sales for July
Residential Listings for July
Housing Market Indicators
BRUCE’S MARKET INFORMATION PAGE2
Bruce’s Market Notes:
The Home Hunt: 1263 Mosley Street, Wasaga Beach, ON L9Z 1A5 | 705-429-4500 x226 “A Moving Experience”
0 8 16 24 32 40
17
27
185
37
9
2616
4
35
Clearview
Collingwood
Blue MtnTiny BeachesWasaga Beach
2012 2011
0 20 40 60 80 100
28
66
408
83
36
59
456
84
Clearview
Collingwood
Blue MtnTiny BeachesWasaga Beach
2012 2011
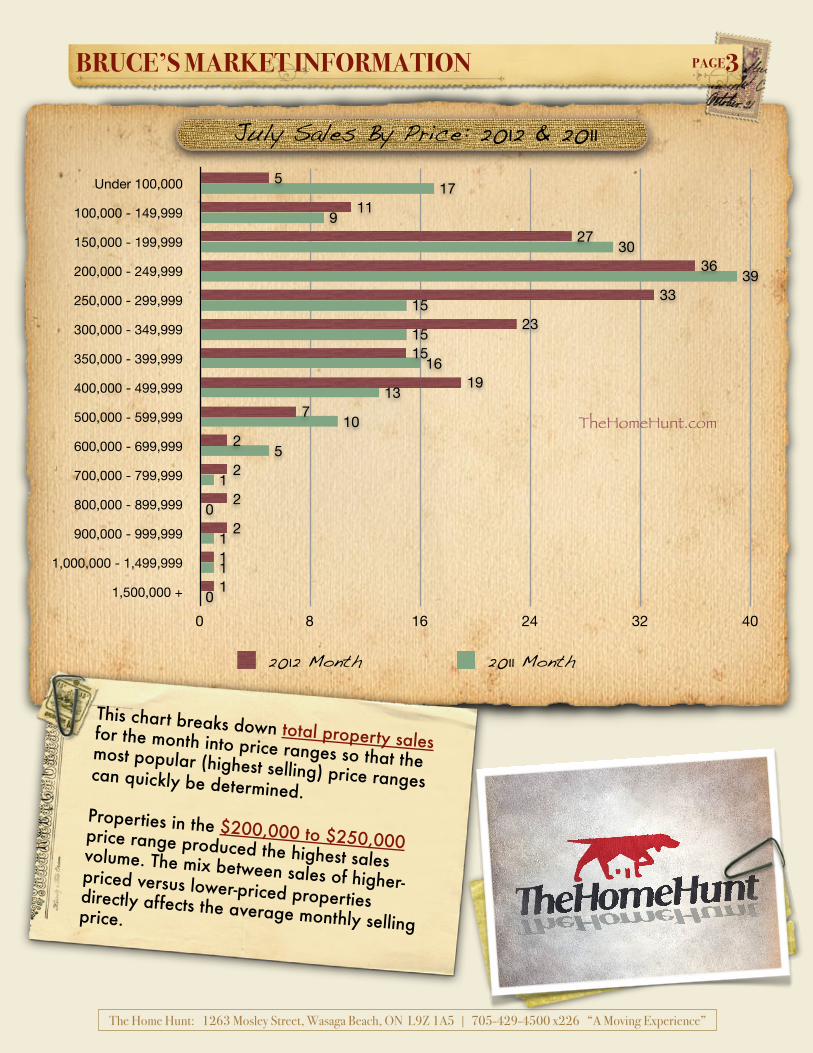
This chart breaks down total property sales for the month into price ranges so that the most popular (highest selling) price ranges can quickly be determined. Properties in the $200,000 to $250,000 price range produced the highest sales volume. The mix between sales of higher-priced versus lower-priced properties directly affects the average monthly selling price.
BRUCE’S MARKET INFORMATION PAGE3
July Sales By Price: 2012 & 2011
The Home Hunt: 1263 Mosley Street, Wasaga Beach, ON L9Z 1A5 | 705-429-4500 x226 “A Moving Experience”
Under 100,000
100,000 - 149,999
150,000 - 199,999
200,000 - 249,999
250,000 - 299,999
300,000 - 349,999
350,000 - 399,999
400,000 - 499,999
500,000 - 599,999
600,000 - 699,999
700,000 - 799,999
800,000 - 899,999
900,000 - 999,999
1,000,000 - 1,499,999
1,500,000 +
0 8 16 24 32 400
1
1
0
1
5
10
13
16
15
15
39
30
9
17
1
1
2
2
2
2
7
19
15
23
33
36
27
11
5
TheHomeHunt.com
2012 Month 2011 Month
BRUCE’S MARKET INFORMATION PAGE4
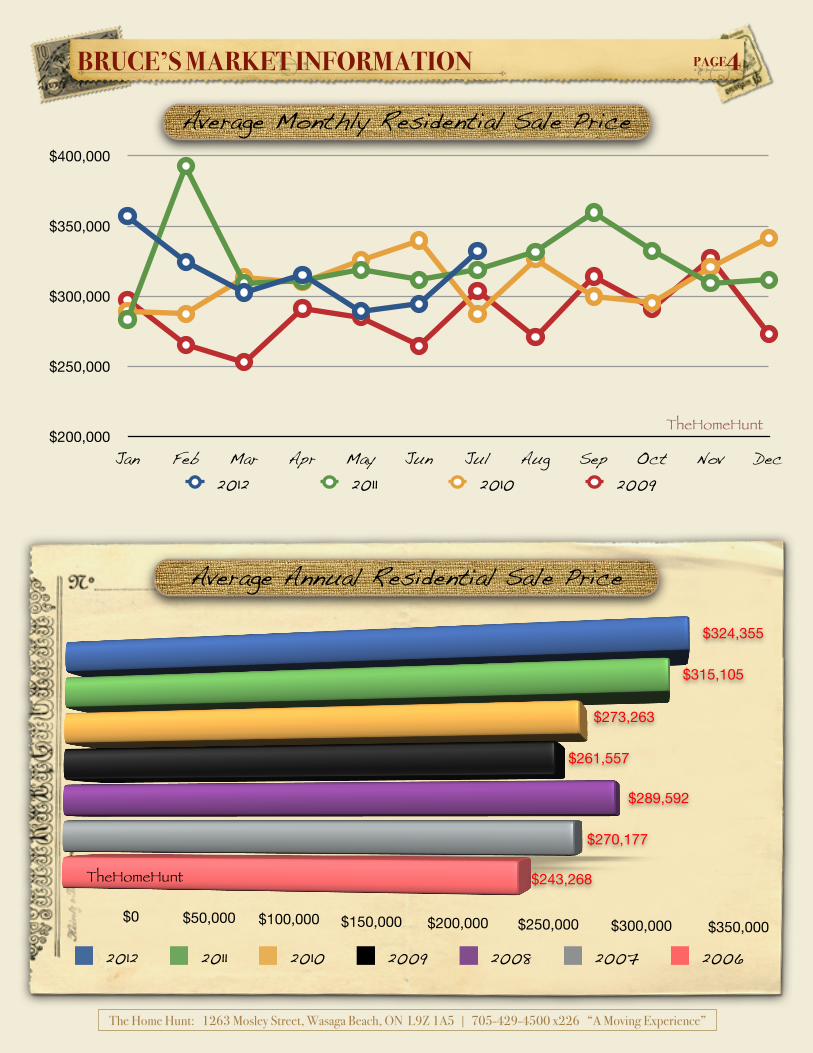
Average Monthly Residential Sale Price
Average Annual Residential Sale Price
The Home Hunt: 1263 Mosley Street, Wasaga Beach, ON L9Z 1A5 | 705-429-4500 x226 “A Moving Experience”
$200,000
$250,000
$300,000
$350,000
$400,000
Jan Feb Mar Apr May Jun Jul Aug Sep Oct Nov Dec2012 2011 2010 2009
TheHomeHunt
$0 $50,000 $100,000 $150,000 $200,000 $250,000 $300,000 $350,000
$324,355
$315,105
$273,263
$261,557
$289,592
$270,177
$243,268
2012 2011 2010 2009 2008 2007 2006
TheHomeHunt
BRUCE’S MARKET INFORMATION PAGE5
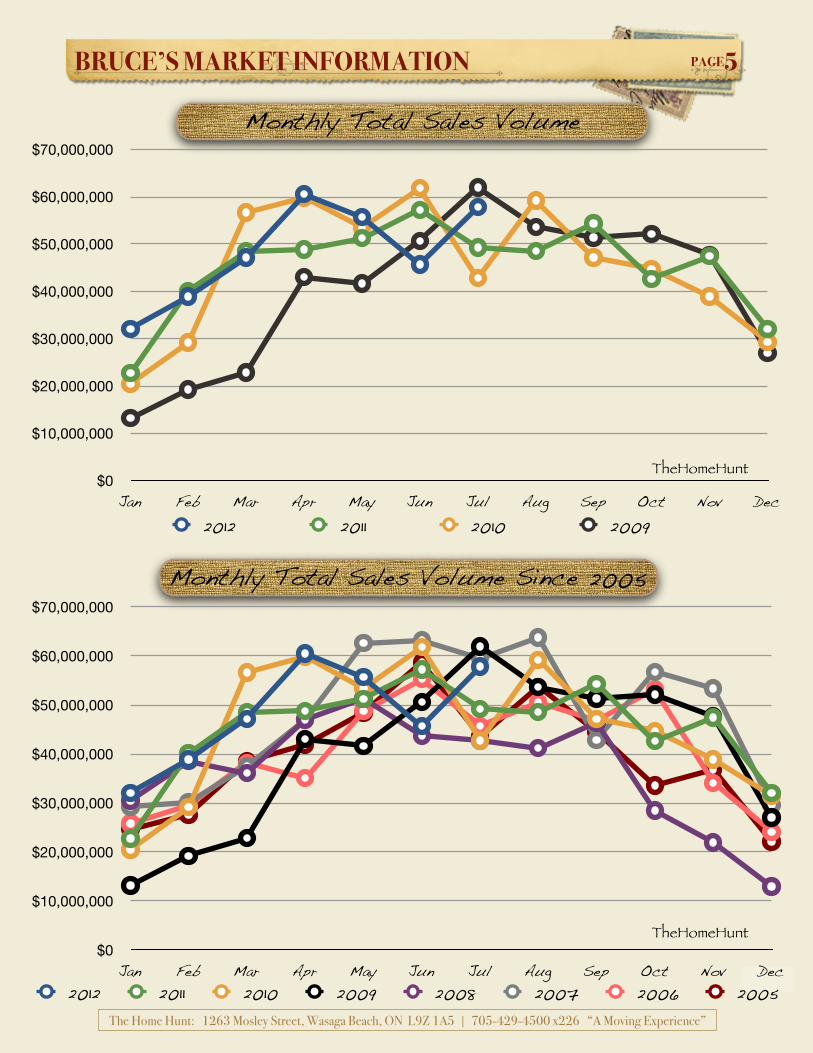
Monthly Total Sales Volume
Monthly Total Sales Volume Since 2005
The Home Hunt: 1263 Mosley Street, Wasaga Beach, ON L9Z 1A5 | 705-429-4500 x226 “A Moving Experience”
$0
$10,000,000
$20,000,000
$30,000,000
$40,000,000
$50,000,000
$60,000,000
$70,000,000
Jan Feb Mar Apr May Jun Jul Aug Sep Oct Nov Dec2012 2011 2010 2009
TheHomeHunt
TheHomeHunt$0
$10,000,000
$20,000,000
$30,000,000
$40,000,000
$50,000,000
$60,000,000
$70,000,000
Jan Feb Mar Apr May Jun Jul Aug Sep Oct Nov Dec2012 2011 2010 2009 2008 2007 2006 2005
TheHomeHunt
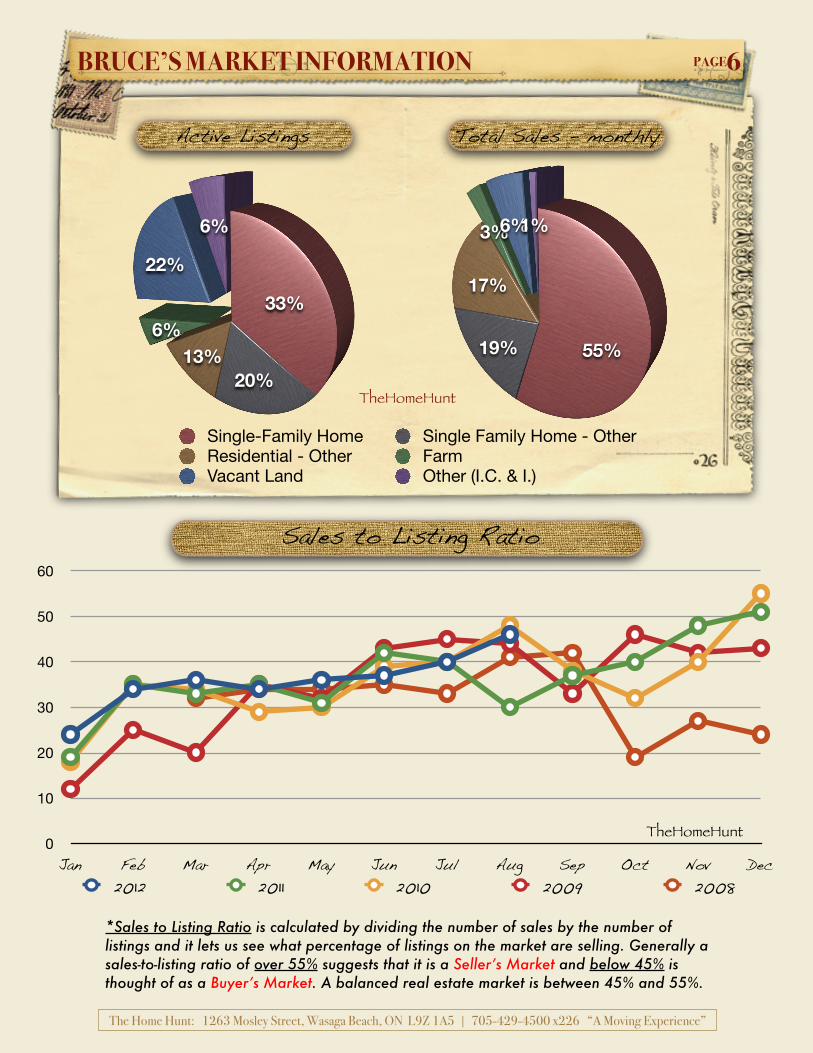
Total Sales - monthlyActive Listings
BRUCE’S MARKET INFORMATION PAGE6
Sales to Listing Ratio
*Sales to Listing Ratio is calculated by dividing the number of sales by the number of listings and it lets us see what percentage of listings on the market are selling. Generally a sales-to-listing ratio of over 55% suggests that it is a Seller’s Market and below 45% is thought of as a Buyer’s Market. A balanced real estate market is between 45% and 55%.
The Home Hunt: 1263 Mosley Street, Wasaga Beach, ON L9Z 1A5 | 705-429-4500 x226 “A Moving Experience”
33%
20%13%
6%
22%
6%
Single-Family Home Single Family Home - OtherResidential - Other FarmVacant Land Other (I.C. & I.)
55%19%
17%
3%6%1%
0
10
20
30
40
50
60
Jan Feb Mar Apr May Jun Jul Aug Sep Oct Nov Dec2012 2011 2010 2009 2008
TheHomeHunt
BRUCE’S MARKET INFORMATION PAGE7
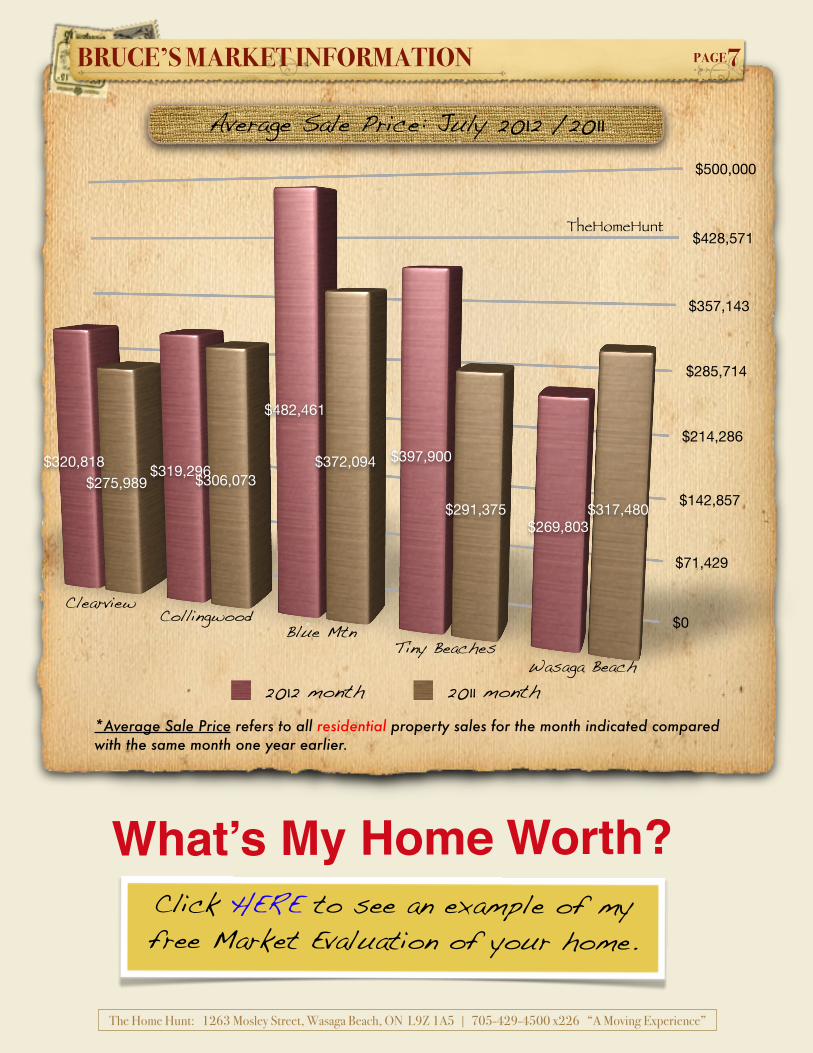
Average Sale Price: July 2012 /2011
*Average Sale Price refers to all residential property sales for the month indicated compared with the same month one year earlier.
The Home Hunt: 1263 Mosley Street, Wasaga Beach, ON L9Z 1A5 | 705-429-4500 x226 “A Moving Experience”
$0
$71,429
$142,857
$214,286
$285,714
$357,143
$428,571
$500,000
$320,818 $319,296
$482,461
$397,900
$269,803
$275,989 $306,073$372,094
$291,375 $317,480
ClearviewCollingwood
Blue MtnTiny Beaches
Wasaga Beach
TheHomeHunt
2012 month 2011 month
What’s My Home Worth?Click HERE to see an example of my free Market Evaluation of your home.
BRUCE’S MARKET INFORMATION PAGE8
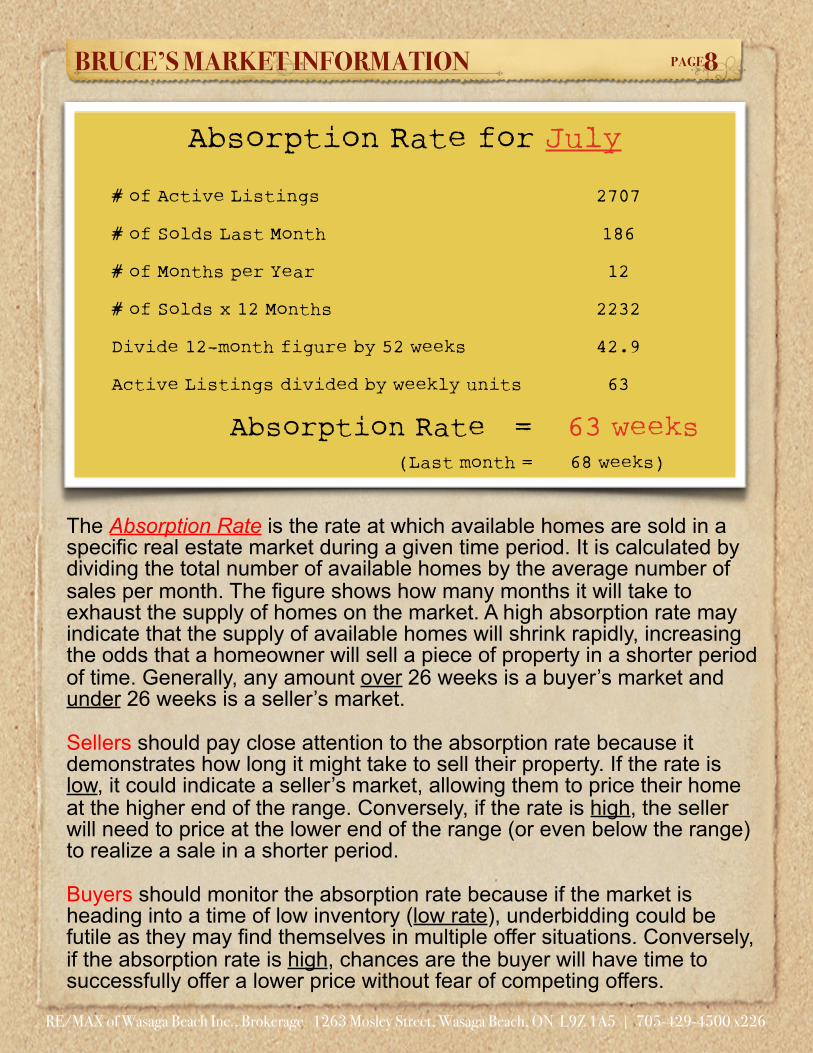
The Absorption Rate is the rate at which available homes are sold in a specific real estate market during a given time period. It is calculated by dividing the total number of available homes by the average number of sales per month. The figure shows how many months it will take to exhaust the supply of homes on the market. A high absorption rate may indicate that the supply of available homes will shrink rapidly, increasing the odds that a homeowner will sell a piece of property in a shorter period of time. Generally, any amount over 26 weeks is a buyer’s market and under 26 weeks is a seller’s market.
Sellers should pay close attention to the absorption rate because it demonstrates how long it might take to sell their property. If the rate is low, it could indicate a seller’s market, allowing them to price their home at the higher end of the range. Conversely, if the rate is high, the seller will need to price at the lower end of the range (or even below the range) to realize a sale in a shorter period.
Buyers should monitor the absorption rate because if the market is heading into a time of low inventory (low rate), underbidding could be futile as they may find themselves in multiple offer situations. Conversely, if the absorption rate is high, chances are the buyer will have time to successfully offer a lower price without fear of competing offers.
Absorption Rate for July
# of Active Listings 2707
# of Solds Last Month 186
# of Months per Year 12
# of Solds x 12 Months 2232
Divide 12-month figure by 52 weeks 42.9
Active Listings divided by weekly units 63
Absorption Rate = 63 weeks
(Last month = 68 weeks)
RE/MAX of Wasaga Beach Inc., Brokerage 1263 Mosley Street, Wasaga Beach, ON L9Z 1A5 | 705-429-4500 x226

RE/MAX of Wasaga Beach Inc., Brokerage 1263 Mosley Street, Wasaga Beach, ON L9Z 1A5 | 705-429-4500 x226
HomeHuntthe
Mary Johnson
Bruce Johnson
Certified Staging Professional Sales Representative
Click for contact info
705-429-4500 x226
RE/MAX OF WASAGA BEACH
INC. BROKERAGE
Click here for client reviews仝
仝
仝
Bruce JohnsonMary Johnson
TheHomeHunt Market Report is copyrighted by Bruce Johnson 2012.

HomeHuntthewith Bruce Johnson
www.TheHomeHunt.com
Call Bruceabout listing the house705-429-4500x226
A Moving Experience