Embed Size (px)
DESCRIPTION
Local Area Market Stats
Citation preview

Monthly Indicators
July 2011 Quick Facts
A RESEARCH TOOL PROVIDED BY THE HILTON HEAD AREA ASSOCIATION OF REALTORS®
- 22.3%
Change inMedian Sales Price
At the height of summer, we're finally beginning to move beyond comparisons to the 2010 incentive market. Even so, sudden changes in sales volumes are likely due to factors occurring at this time last year. Qualified buyers may find more attractive opportunities now than during either of the recent tax credits. Interest rates should hold their ground around five percent, though the shift in the federal credit rating could change that Some indicators suggest improving
- 20.7%
Change inInventory
+ 0.9%
Change inClosed Sales
23456789
101112
All data from the Multiple Listing Service of Hilton Head Island. Provided by the Hilton Head Area Association of REALTORS® and South Carolina REALTORS®. Powered by 10K Research and Marketing. | 1
Closed SalesPending SalesNew ListingsMarket Overview
Days On Market Until Sale
Click on desired metric to jump to that page.
the federal credit rating could change that. Some indicators suggest improving conditions, but let’s see just how we’re faring locally.
New Listings in the Hilton Head region decreased 30.9 percent to 346. Pending Sales were up 6.6 percent to 273. Inventory levels shrank 20.7 percent to 2,996 units, but consumers are still finding terrific opportunities. Strong affordability is partly driving purchase demand.
Prices softened a bit. The Median Sales Price declined 22.3 percent to $213,750. Days on Market increased 11.3 percent to 140 days. Absorption rates improved as Months Supply of Inventory was down 27.8 percent to 12.5 months.
Second quarter GDP growth was just 1.3 percent after a meager 0.4 percent gain in the first quarter. We added 117,000 new jobs in July, a stronger gain than expected after an embarrassing June. Even though a budget deal has been reached, several challenges persist. Changes to Fannie, Freddie and the mortgage interest deduction are still in play. As consumers absorb distressed inventory and labor market conditions improve, the wheels of recovery grind on.
Months Supply of InventoryInventory of Homes for SaleHousing Affordability IndexPercent of List Price ReceivedAverage Sales PriceMedian Sales Price

Market Overview
Key Metrics Historical Sparklines 7-2010 7-2011 + / – YTD 2010 YTD 2011 + / –
Key market metrics for the current month and year-to-date figures.
+ 11.3% 132 145 + 10.0%
- 13.8%
256 273 + 6.6% 1,642 1,895 + 15.4%
3,243501 346 - 30.9% 3,760
220 222 + 0.9% 1,486
New Listings
Pending Sales
Closed Sales
Days on Market Until Sale
1,553 + 4.5%
126 140
7-2008 7-2009 7-2010 7-2011
7-2008 7-2009 7-2010 7-2011
7-2008 7-2009 7-2010 7-2011
7-2008 7-2009 7-2010 7-2011
All data from the Multiple Listing Service of Hilton Head Island. Provided by the Hilton Head Area Association of REALTORS® and South Carolina REALTORS®. Powered by 10K Research and Marketing. | Click for Cover Page | 2
124
--
-- --
--
--17.3
139 + 26.8%
- 20.7%
- 27.8%
2,996
12.5
- 22.3% $237,180 $225,000
- 0.6%
- 5.1%
+ 0.1% 94.2% 93.6%
Months Supplyof Homes for Sale
Median Sales Price
Average Sales Price
Percent of List Price Received
$401,054 $298,544 - 25.6%
93.5% 93.6%
Housing Affordability Index
Inventory of Homes for Sale
109
3,779
133 + 6.6%
--
$357,383 $325,816 - 8.8%
$275,145 $213,750
7-2008 7-2009 7-2010 7-2011
7-2008 7-2009 7-2010 7-2011
7-2008 7-2009 7-2010 7-2011
7-2008 7-2009 7-2010 7-2011
7-2008 7-2009 7-2010 7-2011
7-2008 7-2009 7-2010 7-2011

New Listings
MonthPrior Year
Current Year
+ / –
August 476 520 +9.2%
September 493 493 0.0%
October 451 400 -11.3%
November 409 337 -17.6%
December 350 304 -13.1%
January 454 424 -6.6%
February 515 499 -3.1%
March 675 568 -15.9%
April 617 552 -10.5%
May 482 446 -7.5%
June 516 408 -20.9%
July 501 346 -30.9%
A count of the properties that have been newly listed on the market in a given month.
481501
346
July3,769 3,760
3,243
Year To Date
-13.8%+4.2% -30.9% -0.2%
12-Month Avg 495 441 -10.8%
All data from the Multiple Listing Service of Hilton Head Island. Provided by the Hilton Head Area Association of REALTORS® and South Carolina REALTORS®. Powered by 10K Research and Marketing. | Click for Cover Page | 3
2009 2010 2011
200
300
400
500
600
700
800
1-2007 1-2008 1-2009 1-2010 1-2011
Historical New Listing Activity
2009 2010 2011

Pending Sales
MonthPrior Year
Current Year
+ / –
August 219 210 -4.1%
September 215 213 -0.9%
October 234 187 -20.1%
November 183 208 +13.7%
December 184 175 -4.9%
January 185 242 +30.8%
February 199 265 +33.2%
March 263 306 +16.3%
April 280 264 -5.7%
May 232 261 +12.5%
June 227 284 +25.1%
July 256 273 +6.6%
A count of the properties on which contracts have been accepted in a given month.
194
256273
July
1,257
1,642
1,895
Year To Date
+15.4%+32.0% +6.6% +30.6%
12-Month Avg 223 241 +7.9%
All data from the Multiple Listing Service of Hilton Head Island. Provided by the Hilton Head Area Association of REALTORS® and South Carolina REALTORS®. Powered by 10K Research and Marketing. | Click for Cover Page | 4
2009 2010 2011
50
100
150
200
250
300
350
1-2007 1-2008 1-2009 1-2010 1-2011
Historical Pending Sales Activity
2009 2010 2011
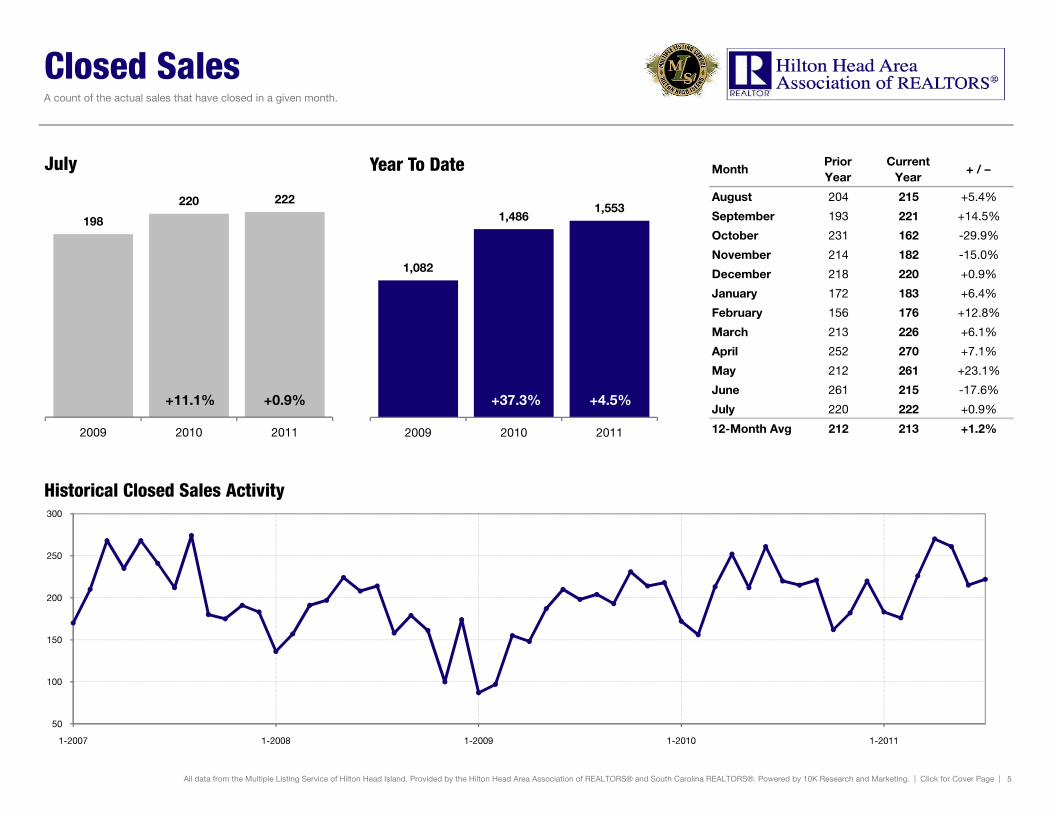
Closed Sales
MonthPrior Year
Current Year
+ / –
August 204 215 +5.4%
September 193 221 +14.5%
October 231 162 -29.9%
November 214 182 -15.0%
December 218 220 +0.9%
January 172 183 +6.4%
February 156 176 +12.8%
March 213 226 +6.1%
April 252 270 +7.1%
May 212 261 +23.1%
June 261 215 -17.6%
July 220 222 +0.9%
A count of the actual sales that have closed in a given month.
198
220 222
July
1,082
1,4861,553
Year To Date
+4.5%+11.1% +0.9% +37.3%
12-Month Avg 212 213 +1.2%
All data from the Multiple Listing Service of Hilton Head Island. Provided by the Hilton Head Area Association of REALTORS® and South Carolina REALTORS®. Powered by 10K Research and Marketing. | Click for Cover Page | 5
2009 2010 2011
50
100
150
200
250
300
1-2007 1-2008 1-2009 1-2010 1-2011
Historical Closed Sales Activity
2009 2010 2011

Days on Market Until Sale
MonthPrior Year
Current Year
+ / –
August 151 126 -16.9%
September 162 121 -25.3%
October 153 144 -5.6%
November 157 141 -10.2%
December 138 136 -1.5%
January 131 133 +1.3%
February 145 156 +7.9%
March 140 143 +2.1%
April 128 152 +18.8%
May 113 133 +17.5%
June 141 158 +12.0%
July 126 140 +11.3%
Average number of days between when a property is listed and when an offer is accepted in a given month.
150
126
140
July
146
132
145
Year To Date
+10.0%-16.5% +11.3% -10.0%
12-Month Avg 148 150 +0.9%
All data from the Multiple Listing Service of Hilton Head Island. Provided by the Hilton Head Area Association of REALTORS® and South Carolina REALTORS®. Powered by 10K Research and Marketing. | Click for Cover Page | 6
2009 2010 2011
95
105
115
125
135
145
155
165
1-2007 1-2008 1-2009 1-2010 1-2011
Historical Days on Market Until Sale
2009 2010 2011

Median Sales Price
MonthPrior Year
Current Year
+ / –
August $260,000 $214,000 -17.7%
September $239,000 $218,393 -8.6%
October $290,000 $240,000 -17.2%
November $262,750 $228,750 -12.9%
December $279,000 $250,000 -10.4%
January $231,000 $250,000 +8.2%
February $215,000 $188,200 -12.5%
March $265,000 $210,000 -20.8%
April $224,000 $270,000 +20.5%
May $237,090 $250,000 +5.4%
June $240,000 $233,000 -2.9%
July $275,145 $213,750 -22.3%
Median price point for all closed sales, not accounting for seller concessions, in a given month.
$255,000$275,145
$213,750
July
$267,000
$237,180$225,000
Year To Date
-5.1%+7.9% -22.3% -11.2%
12-Month Avg $250,000 $227,500 -9.0%
All data from the Multiple Listing Service of Hilton Head Island. Provided by the Hilton Head Area Association of REALTORS® and South Carolina REALTORS®. Powered by 10K Research and Marketing. | Click for Cover Page | 7
2009 2010 2011
$150,000
$200,000
$250,000
$300,000
$350,000
$400,000
$450,000
1-2007 1-2008 1-2009 1-2010 1-2011
Historical Median Sales Price
2009 2010 2011

Average Sales Price
MonthPrior Year
Current Year
+ / –
August $467,169 $300,997 -35.6%
September $344,085 $347,477 +1.0%
October $394,110 $321,857 -18.3%
November $361,187 $327,176 -9.4%
December $375,862 $310,895 -17.3%
January $329,121 $303,936 -7.7%
February $395,687 $291,285 -26.4%
March $338,453 $328,279 -3.0%
April $352,849 $346,612 -1.8%
May $364,834 $339,727 -6.9%
June $330,841 $353,623 +6.9%
July $401,054 $298,544 -25.6%
Average sales price for all closed sales, not accounting for seller concessions, in a given month.
$361,904
$401,054
$298,544
July
$375,892$357,383
$325,816
Year To Date
- 8.8%+ 10.8% - 25.6% - 4.9%
12-Month Avg $370,277 $324,178 -12.5%
All data from the Multiple Listing Service of Hilton Head Island. Provided by the Hilton Head Area Association of REALTORS® and South Carolina REALTORS®. Powered by 10K Research and Marketing. | Click for Cover Page | 8
2009 2010 2011
$250,000
$300,000
$350,000
$400,000
$450,000
$500,000
$550,000
$600,000
$650,000
1-2007 1-2008 1-2009 1-2010 1-2011
Historical Average Sales Price
2009 2010 2011

Percent of List Price Received
MonthPrior Year
Current Year
+ / –
August 93.9% 93.4% -0.5%
September 93.3% 93.4% +0.1%
October 93.7% 94.1% +0.5%
November 93.0% 92.4% -0.7%
December 93.2% 93.2% +0.0%
January 93.5% 92.8% -0.8%
February 94.3% 93.8% -0.5%
March 93.8% 93.2% -0.7%
April 94.2% 93.8% -0.5%
May 94.9% 93.5% -1.4%
June 94.7% 94.3% -0.5%
July 93.5% 93.6% +0.1%
Percentage found when dividing a property’s sales price by its last list price, then taking the average for all properties sold in a given month, not accounting for seller concessions.
93.3% 93.5% 93.6%
July
93.2% 94.2% 93.6%
Year To Date
-0.6%+0.2% +0.1% +1.1%
12-Month Avg 93.8% 93.5% -0.4%
All data from the Multiple Listing Service of Hilton Head Island. Provided by the Hilton Head Area Association of REALTORS® and South Carolina REALTORS®. Powered by 10K Research and Marketing. | Click for Cover Page | 9
2009 2010 2011
90%
91%
92%
93%
94%
95%
96%
1-2007 1-2008 1-2009 1-2010 1-2011
Historical Percent of List Price Received
2009 2010 2011

Housing Affordability Index
MonthPrior Year
Current Year
+ / –
August 109 138 +26.5%
September 118 136 +14.7%
October 100 126 +26.1%
November 111 132 +19.2%
December 101 120 +18.9%
January 122 117 -4.1%
February 130 149 +14.6%
March 108 136 +26.1%
April 125 111 -11.7%
May 119 120 +1.0%
June 121 129 +7.0%
This index measures housing affordability for the region. An index of 120 means the median household income was 120% of what is necessary to qualify for the median-priced home under prevailing interest rates. A higher number means greater affordability.
108 109
139
July
104
124133
Year To Date
+6 6%+0 9% +26 8% +19 6%July 109 139 +26.8%
12-Month Avg 114 129 +13.8%
All data from the Multiple Listing Service of Hilton Head Island. Provided by the Hilton Head Area Association of REALTORS® and South Carolina REALTORS®. Powered by 10K Research and Marketing. | Click for Cover Page | 10
2009 2010 2011
60
80
100
120
140
160
1-2007 1-2008 1-2009 1-2010 1-2011
Historical Housing Affordability Index
2009 2010 2011
+6.6%+0.9% +26.8% +19.6%

Inventory of Homes for Sale
MonthPrior Year
Current Year
+ / –
August 4,039 3,775 -6.5%
September 3,890 3,761 -3.3%
October 3,752 3,648 -2.8%
November 3,659 3,493 -4.5%
December 3,409 3,198 -6.2%
January 3,405 3,127 -8.2%
February 3,523 3,136 -11.0%
March 3,716 3,177 -14.5%
April 3,786 3,243 -14.3%
May 3,796 3,221 -15.1%
June 3,820 3,113 -18.5%
July 3,779 2,996 -20.7%
The number of properties available for sale in active status at the end of a given month.
4,1143,779
2,996
July
-20.7%-8.1%
12-Month Avg 3,715 3,324 -10.5%
All data from the Multiple Listing Service of Hilton Head Island. Provided by the Hilton Head Area Association of REALTORS® and South Carolina REALTORS®. Powered by 10K Research and Marketing. | Click for Cover Page | 11
2009 2010 2011
1,000
1,500
2,000
2,500
3,000
3,500
4,000
4,500
1-2007 1-2008 1-2009 1-2010 1-2011
Historical Inventory of Homes for Sale

Months Supply of Inventory
MonthPrior Year
Current Year
+ / –
August 25.1 16.9 -32.6%
September 23.6 16.9 -28.3%
October 22.2 16.4 -26.0%
November 20.5 16.0 -21.7%
December 18.5 14.5 -21.4%
January 17.8 14.2 -20.1%
February 18.1 14.0 -22.6%
March 18.6 13.8 -25.6%
April 18.3 13.9 -23.9%
May 17.7 13.9 -21.8%
June 17.7 13.3 -25.0%
July 17.3 12.5 -27.8%
The inventory of homes for sale at the end of a given month, divided by the average monthly pending sales from the last 12 months.
26.1
17.3
12.5
July
-27.8%-33.5%
12-Month Avg 19.6 14.7 -25.0%
All data from the Multiple Listing Service of Hilton Head Island. Provided by the Hilton Head Area Association of REALTORS® and South Carolina REALTORS®. Powered by 10K Research and Marketing. | Click for Cover Page | 12
2009 2010 2011
0
5
10
15
20
25
30
1-2007 1-2008 1-2009 1-2010 1-2011
Historical Months Supply of Inventory