Embed Size (px)
Citation preview

1
Single Electricity Market Operator – Training Module
Market Processes: Bid to Bill
July 2007 (Revision 6)

Market Processes: Bid to Bill March 2007
2
Click to edit Master title styleDISCLAIMER
COPYRIGHT NOTICEAll rights reserved. This entire publication is subject to the laws of copyright. This publication may not be reproduced or transmitted in any form or by any means, electronic or manual, including photocopying without the prior written permission of EirGrid plc and SONI Limited.
DOCUMENT DISCLAIMEREvery care and precaution is taken to ensure the accuracy of the information provided herein but such information is provided without warranties express, implied or otherwise howsoever arising and EirGrid plc and SONI Limited to the fullest extent permitted by law shall not be liable for any inaccuracies, errors, omissions or misleading information contained herein.
Market Processes: Bid to Bill March 2007
3
Click to edit Master title styleLearning Objectives
Learning objectives for this module:
ØAn overview of the bidding processØA simple example of how the ex-ante and ex-post UUC workØAn explanation of the key differences between ex-ante and ex-
post scheduling ØAn example of the settlement outcomes
Note: Please review the separate handoutfor reference data and definitions

Market Processes: Bid to Bill March 2007
4
Click to edit Master title style
A. BID SECTION
B. SETTLEMENT SECTION

Market Processes: Bid to Bill March 2007
5
Click to edit Master title style
2. Bids
1. Setting the Scene
3. Ex Ante Generation Requirement
4. Ex Ante UUC Solution
7. Ex Post Processing of Bids
8. Ex Post Generation Requirement
9. Ex Post UUC Solution
6. Meter Data
5. Interconnectors & Dispatch Schedules
A. BID SECTION
B. SETTLEMENT SECTION
Market Processes: Bid to Bill March 2007
6
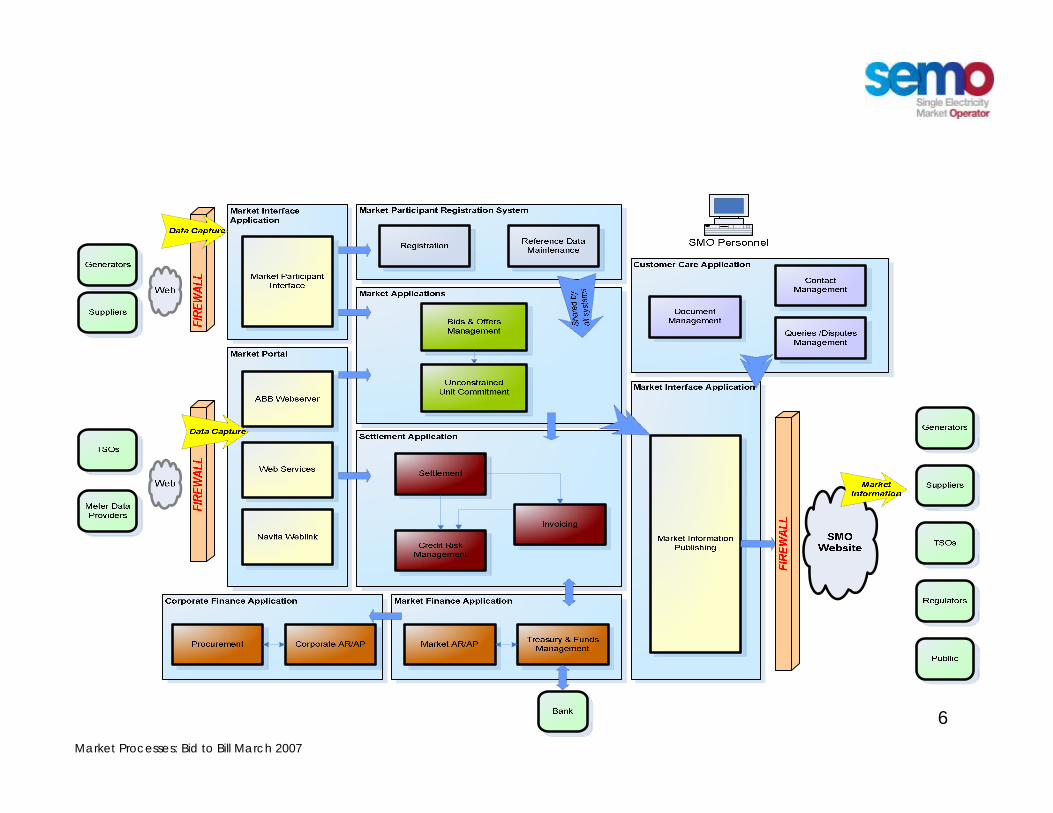
Click to edit Master title styleWhat We Are Not Covering
Market Processes: Bid to Bill March 2007
7
Click to edit Master title styleMarket Timeline
Bid
ding
IMS
Trad
ing
Day
EPU
S R
UN
SIn
itial
In
dica
tive
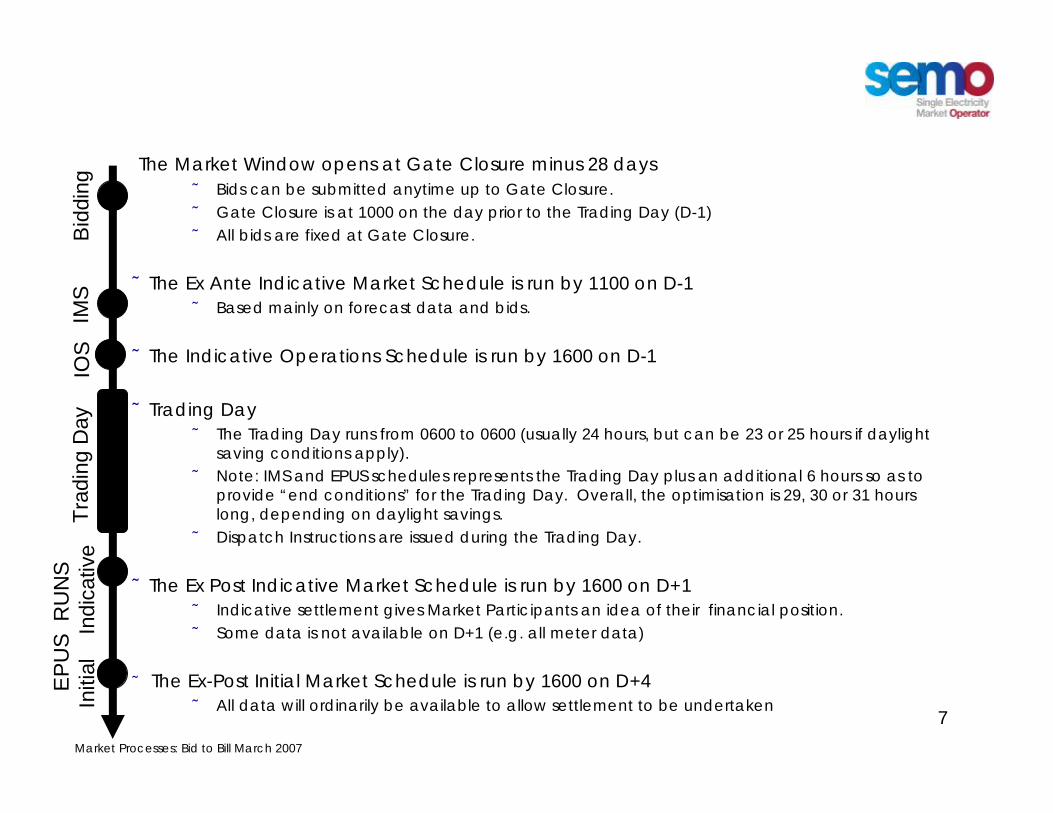
The Market Window opens at Gate Closure minus 28 daysÄ Bids can be submitted anytime up to Gate Closure.Ä Gate Closure is at 1000 on the day prior to the Trading Day (D-1)Ä All bids are fixed at Gate Closure.
ÄThe Ex Ante Indicative Market Schedule is run by 1100 on D-1Ä Based mainly on forecast data and bids.
ÄThe Indicative Operations Schedule is run by 1600 on D-1
ÄTrading DayÄ The Trading Day runs from 0600 to 0600 (usually 24 hours, but can be 23 or 25 hours if daylight
saving conditions apply).Ä Note: IMS and EPUS schedules represents the Trading Day plus an additional 6 hours so as to
provide “end conditions” for the Trading Day. Overall, the optimisation is 29, 30 or 31 hours long, depending on daylight savings.
Ä Dispatch Instructions are issued during the Trading Day.
ÄThe Ex Post Indicative Market Schedule is run by 1600 on D+1Ä Indicative settlement gives Market Participants an idea of their financial position.Ä Some data is not available on D+1 (e.g. all meter data)
Ä The Ex-Post Initial Market Schedule is run by 1600 on D+4 Ä All data will ordinarily be available to allow settlement to be undertaken
IOS
Market Processes: Bid to Bill March 2007
8
Click to edit Master title styleRegistration Data & Standing Bids
Ä In the following example registration data and standing bids are ignored.
Ä Standing bid data is bid data defined for a given weekday which is used for that day if no bid has been submitted.
Ä Standing bid data becomes “live” at the time of gate opening (28 days before gate closure)
Ä If a Market Participant wants or needs to change bid data after that time then it must replace the data within the bidding systems using the normal bid process.
ÄRegistration data can generally be submitted up to gate closure.Ä There are a few exceptions to this for data that is used in other processes

Market Processes: Bid to Bill March 2007
9
Click to edit Master title styleInterconnector Capacity
During previous monthsÄ Interconnector Administrator periodically allocates capacity to Interconnector Users based
on an auction.Ä During Window for Bidding
Ä Interconnector Users can bid like any other participant, but may not have certainty over their final capacity holdings.
Ä Day D-2Ä Interconnector Administrator determines the Active Import Capacity Holdings and Active
Export Capacity Holders for each Interconnector User for Trading Day D.Ä SMO (Single Market Operator) publishes capacity
Ä Day D-1Ä The ex ante IMS only uses only bids within the Active Import/Export Capacity HoldingsÄ The ex ante IMS run determines the total flow on the interconnectorÄ If the I/C is ramp constrained, the MITS system allocates total scheduled flow between
interconnector users based on their right holdings
Moyle Interconnector BETTASEM

Market Processes: Bid to Bill March 2007
10
Click to edit Master title styleEx-Ante versus Ex-Post UUC
The Ex-Ante IMS is produced following Gate Closure. It is based on:• Participant Bids for Price Maker Units (within the Window)• Unit forecast availabilities, minimum stable generation and minimum output• Price Taker Nominations• Composite Load Forecast (comprised of forecasts from ROI and NI)• Wind Unit forecasts
The Ex-Post EPUS is run after the Trading Day (indicative on D+1 and initial on D+4). It is based mainly on actual data from the Trading Day, including:•The same Participant Bids•Actual availabilities, minimum stable generation and minimum output•Actual generation (metered output)
Bid
ding
IMS
Trad
ing
Day
EP
D+4
, D+1

Market Processes: Bid to Bill March 2007
11
Click to edit Master title styleIntroduction to the ExampleHighlight the bidding and scheduling process with a numeric example
ÄMore detail on the formal workings of systems in other presentations
Ä The example serves to illustrate the concepts while avoiding the specificsÄ Only 3 half-hour periods are consideredÄ Focus only on bids, availability, energy limits and the demand to be met. There are many
other parameters available to participants.Ä Pump storage units are covered in a stand-alone example
Ä Transmission loss factors are assumed to be 1Ä No impact on the scheduling examples as transmission loss factors are not usedÄ But does simplify the settlement examples.
Ä The example follows a mixture of price makers and price takers through the bidding, scheduling and settlement process.Ä A Price Maker is a generating unit that is scheduled in IMS/EPUS and which can set prices.Ä A Price Taker is a self scheduled generating unit that cannot set prices.

Market Processes: Bid to Bill March 2007
12
Click to edit Master title styleThe Price Maker Generators in Our Example
Unit 1Thermal Generator
(e.g. gas or coal fired)
This unit has a fully controllable output and can be scheduled based on bids. Unit 1 is a “Predictable Price Maker”
Unit 2Hydro Generator(water powered)
While generation is controllable, Unit 2 has very limited storage so its ability to generate depends on water availability. It is a “Variable Price Maker” (and is also an Energy Limited Generator Unit)
Units 3a and 3bInterconnector Units
(e.g. imported/exported energy)
Two participants in BETTA can buy or sell across the Moyle Interconnector. One trader has Unit 3a, the other Unit 3b. These units are obliged to supply or consume so are “Predictable Price Makers”.
Unit 4Demand Side Unit
(e.g. curtailable load)
Demand side units are treated as being fully controllable and can be scheduled based on bids. Unit 4 is a “Predictable Price Maker”

Market Processes: Bid to Bill March 2007
13
Click to edit Master title styleThe Price Taker Generators in Our Example
Unit 5Thermal Generator
(e.g. gas or coal fired)
This unit is a co-generator, producing power as a by-product of another process, & while its output is predictable its operator does not want to have to change its output based on price. Unit 5 is a “Predictable Price Taker”
Unit 6Thermal Generator
(e.g gas or coal fired)
This unit is a smaller co-generator, with less predictable output. It can be thought of as a “Variable Price Taker”, but the term used for Unit 6 is that it is a “Variable Price Taker”(non-wind powered)
Unit 7Wind Unit
(e.g. wind unit, wind farm)
Unit 7 is a wind farm and as such cannot predict its output. Unit 7 is a “Variable Price Taker” (wind powered)
Unit 8Wind Unit
(e.g. wind unit, wind farm)
Unit 8 is an individual wind unit that only wants to have limited involvement in the market. Unit 8 is an “Autonomous Generator”.

Market Processes: Bid to Bill March 2007
14
Click to edit Master title styleThe Units Used in Our Example
ForecastAutonomous GeneratorWind8
ForecastVariable Price Taker (wind)
Wind7
NominationVariable Price Taker (non-wind)
Thermal6NominationPredictable Price TakerThermal5
BidsPredictable Price MakerDemand Side Unit4
BidsPredictable Price MakerInterconnector Unit3b
BidsPredictable Price MakerInterconnector Unit3a
BidsVariable Price Maker (Energy Limited)
Hydro2BidsPredictable Price MakerThermal1How ScheduledNatureTypeUnit
Market Processes: Bid to Bill March 2007
15
Click to edit Master title style
1. Setting the Scene
3. Ex Ante Generation Requirement
4. Ex Ante UUC Solution
7. Ex Post Processing of Bids
8. Ex Post Generation Requirement
9. Ex Post UUC Solution
6. Meter Data
5. Interconnectors & Dispatch Schedules
A. BID SECTION
B. SETTLEMENT SECTION
2. Bids
Market Processes: Bid to Bill March 2007
16
Click to edit Master title style
15020
10015
5010
205
Quantity (MW)
Price (€/MWh)
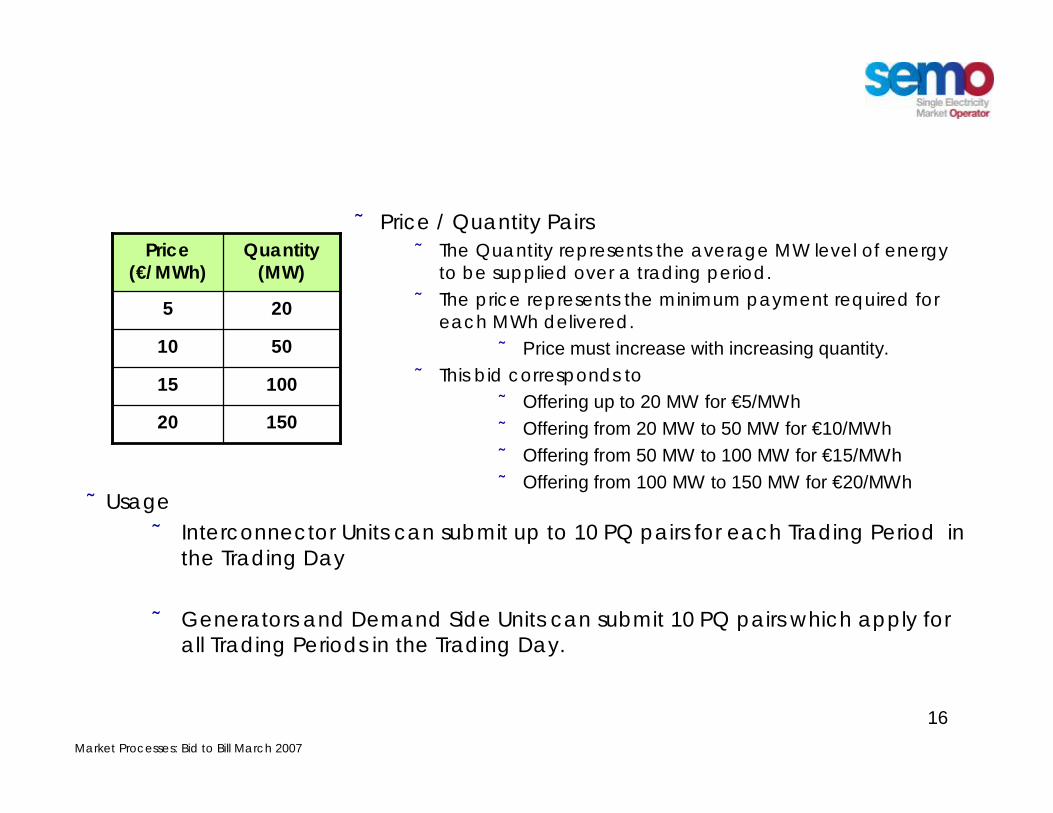
Ä Price / Quantity PairsÄ The Quantity represents the average MW level of energy
to be supplied over a trading period.Ä The price represents the minimum payment required for
each MWh delivered.Ä Price must increase with increasing quantity.
Ä This bid corresponds toÄ Offering up to 20 MW for €5/MWhÄ Offering from 20 MW to 50 MW for €10/MWh Ä Offering from 50 MW to 100 MW for €15/MWh Ä Offering from 100 MW to 150 MW for €20/MWh
ÄUsageÄ Interconnector Units can submit up to 10 PQ pairs for each Trading Period in
the Trading Day
Ä Generators and Demand Side Units can submit 10 PQ pairs which apply for all Trading Periods in the Trading Day.
PQ Pairs
Market Processes: Bid to Bill March 2007
17
Click to edit Master title styleMore on PQ Pairs
15020100155010205
Quantity (MW)
Price (€/MWh)
10020015
-2010
-505
Quantity (MW)
Price (€/MWh)
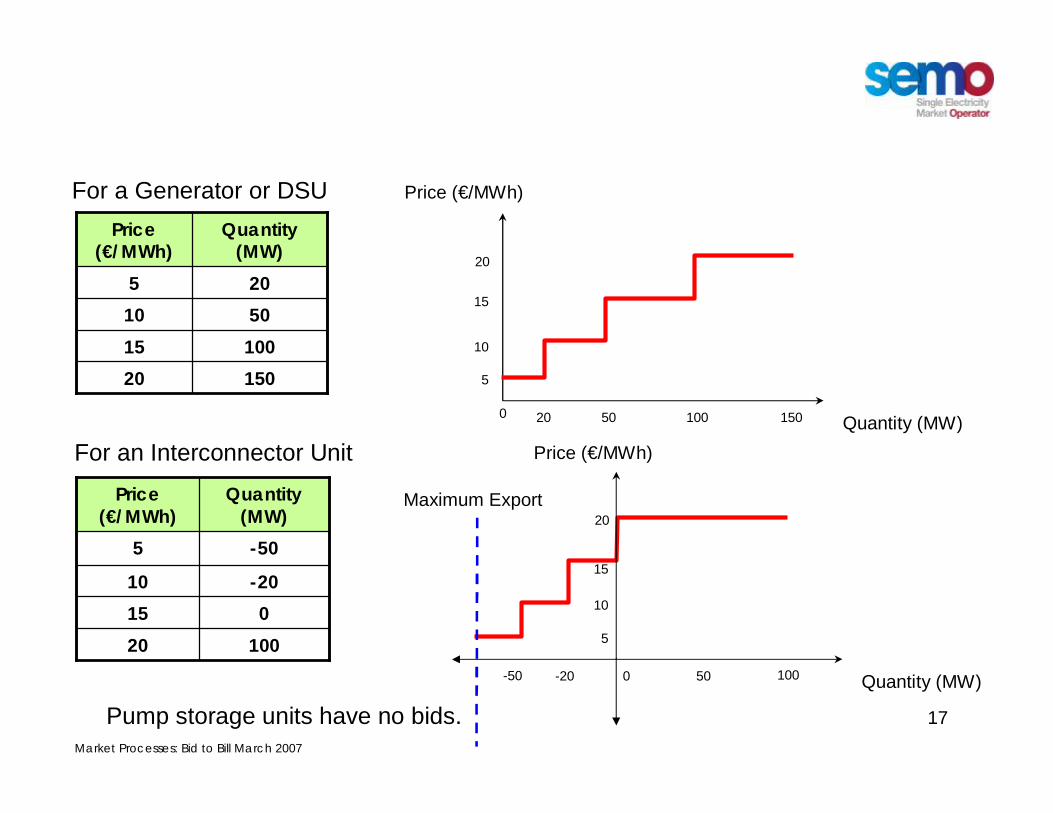
For a Generator or DSU
For an Interconnector Unit
Pump storage units have no bids.
Quantity (MW)
Price (€/MWh)
20 50 100 150
5
10
15
20
Quantity (MW)
Price (€/MWh)
-20 0 50 100
5
10
15
20
0
-50
Maximum Export

Market Processes: Bid to Bill March 2007
18
Click to edit Master title styleEx-Ante IMS
Unit 1 (Thermal Unit) Data
30030
2002010010
Quantity (MW)
Price (€/MWh)
0
50250
1
0
50250
2
0Forecast Min Output (MW)50Forecast Min Stable Generation (MW)200Forecast Availability (MW)3Trading Period
UNIT 1 DATA
50No Load Cost (€/hour)1,000Start-up Cost per start (€)
Periods N/AN/AN/A N/AEnergy Limit (MWh)
Ä Each time Unit 1 is turned on a cost of €1000 will be incurred.Ä Each hour it is on, Unit 1 incurs a no load cost of €50 irrespective of its output.Ä When committed, Unit 1 operates at not less than its minimum stable generation of
50 MW.Ä Unit 1 has 250 MW of capacity available in periods 1 and 2, but due to
maintenance its capacity drops to 200 MW in period 3.Ä Minimum output is zero for all Generator Units except for Pump Storage Units. Ä No energy limits apply (only energy limited hydro units may use these).

Market Processes: Bid to Bill March 2007
19
Click to edit Master title styleEx-Ante IMS
Unit 1 (Thermal Unit) Data
30030
2002010010
Quantity (MW)
Price (€/MWh)
0
50250
1
0
50250
2
0Forecast Min Output (MW)50Forecast Min Stable Generation (MW)200Forecast Availability (MW)3Trading Period
50305030
10020100201002050105010501050Any *50Any*50Any*
Inc QuantityPriceInc QuantityPriceInc QuantityPricePeriod 3Period 2Period 1
THIS PARTICIPANT DATA
IMPLIES THIS UUC INPUT
50No Load Cost (€/hour)1,000Start-up Cost per start (€)
25 Energy Limit (MWh) N/ANo Load Cost (€/period)1,000Start-up Cost per start (€)
Periods N/AN/AN/A N/AEnergy Limit (MWh)
* In all our examples, “Any” means the quantity applies at any price provided that the unit is committed.

Market Processes: Bid to Bill March 2007
20
Click to edit Master title styleEx-Ante IMS
Unit 2 (Hydro Unit) Data
20025
100205010
Quantity (MW)
Price (€/MWh)
0
60200
1
0
60200
2
0Forecast Min Output (MW)60Forecast Min Stable Generation (MW)200Forecast Availability (MW)3Trading Period
UNIT 2 DATA
0No Load Cost (€/hour)0Start-up Cost per start (€)
Periods üü120 üEnergy Limit (MWh)
Ä This unit happens to have start-up and no-load costs of zero. Ä When committed, Unit 2 operates at not less than its minimum stable generation of
60 MW.Ä Unit 2 has 200 MW of capacity available in all periods. This equates to 100 MWh
per half hour period or 300 MWh of potential energy over the three periods.Ä But unit 2 has an energy limit of 120 MWh so will not be scheduled for more than
this over the three periods. Ä If committed, the generation output of Unit 2 above Min Stable Generation is
based on the submitted PQ pairs.

Market Processes: Bid to Bill March 2007
21
Click to edit Master title styleEx-Ante IMS
Unit 2 (Hydro Unit) Data
20025
100205010
Quantity (MW)
Price (€/MWh)
0
60200
1
0
60200
2
0Forecast Min Output (MW)60Forecast Min Stable Generation (MW)200Forecast Availability (MW)3Trading Period
THIS PARTICIPANT DATA
IMPLIES THIS UUC INPUT
0No Load Cost (€/hour)0Start-up Cost per start (€)
0 Energy Limit (MWh) 120No Load Cost (€/period)0Start-up Cost per start (€)
Periods üü120 üEnergy Limit (MWh)
Energy Limited PeriodEnergy Limited PeriodEnergy Limited Period
10025100251002540204020402060Any60Any60Any
Inc QuantityPriceInc QuantityPriceInc QuantityPricePeriod 3Period 2Period 1

Market Processes: Bid to Bill March 2007
22
Click to edit Master title styleEx-Ante IMS
Units 3a and 3b: Interconnector Bids
Ä Interconnector unit bids apply between the Export and Import Capacity set by the interconnector user.
Ä BUT, where this capacity violates the participants the active import or export capacity holdings, the active export or import capacity holding is used (as applicable)
Active Import Capacity Holding
(set by interconnector administrator)
Active Export Capacity Holding
(set by interconnector administrator)
Import Capacity (set by interconnector user)
Export Capacity(set by interconnector user)
Active Import Capacity Holding
(set by interconnector administrator)
Active Export Capacity Holding
(set by interconnector administrator)
Import Capacity (set by interconnector user)
Export Capacity(set by interconnector user)
MW
MW
Range of InterconnectorUnit Bids

Market Processes: Bid to Bill March 2007
23
Click to edit Master title styleEx-Ante IMS
Unit 3a : Interconnector Bids
40502040
-205
Quantity (MW)
Price (€/MWh)
40502040
-205
Quantity (MW)
Price (€/MWh)
0
0
1
-40
40
2
0Max(Export Capacity, Active Export Capacity Holding) (MW)0Min(Import Capacity, Active Import Capacity Holding) (MW)
3Trading Period
INTERCONNECTOR USER DATA
4050
2040-205
Quantity (MW)
Price (€/MWh)Period 1 Period 2 Period 3
Ä This interconnector unit will be treated like a generator with a zero start up cost and no-load cost.
Ä Negative quantities are exports.Ä The interconnector user submits its desired import and export capacity, but the
capacity range used is limited by the active import and export capacity holdings.Ä Unit 3a has no import or export capacity in periods 1 and 3.

Market Processes: Bid to Bill March 2007
24
Click to edit Master title styleEx-Ante IMS
Unit 3a : Interconnector Bids
40502040
-205
Quantity (MW)
Price (€/MWh)
40502040
-205
Quantity (MW)
Price (€/MWh)
0
0
1
-40
40
2
0Max(Export Capacity, Active Export Capacity Holding) (MW)0Min(Import Capacity, Active Import Capacity Holding) (MW)
3Trading Period
THIS INTERCONNECTOR USER DATA
4050
2040-205
Quantity (MW)
Price (€/MWh)Period 1 Period 2 Period 3
20504040205
00-40Any00Inc QuantityPriceInc QuantityPriceInc QuantityPrice
Period 3Period 2Period 1
IMPLIES THIS UUC INPUT

Market Processes: Bid to Bill March 2007
25
Click to edit Master title styleEx-Ante IMS
Unit 3b : Interconnector Bids
6065
055
Quantity (MW)
Price (€/MWh)
6065
055
Quantity (MW)
Price (€/MWh)
0
0
1
-60
60
2
0Max(Export Capacity, Active Export Capacity Holding) (MW)0Min(Import Capacity, Active Import Capacity Holding) (MW)
3Trading Period
INTERCONNECTOR USER DATA
6065055
Quantity (MW)
Price (€/MWh)Period 1 Period 2 Period 3
Ä This interconnector unit will be treated like a generator with a zero start up cost and no-load cost.
Ä This interconnector unit is bidding a positive price for quantities below zero (exports), meaning it is prepared to pay to purchase energy to export.
Ä The interconnector user submits its desired import and export capacity, but the capacity range used is limited by the active import and export capacity holdings.
Ä Unit 3b has no import or export capacity in periods 1 and 3.

Market Processes: Bid to Bill March 2007
26
Click to edit Master title styleEx-Ante IMS
Unit 3b : Interconnector Bids
6065
055
Quantity (MW)
Price (€/MWh)
6065
055
Quantity (MW)
Price (€/MWh)
0
0
1
-60
60
2
0Max(Export Capacity, Active Export Capacity Holding) (MW)0Min(Import Capacity, Active Import Capacity Holding) (MW)
3Trading Period
THIS INTERCONNECTOR USER DATA
6065055
Quantity (MW)
Price (€/MWh)Period 1 Period 2 Period 3
60656055
00-60Any00Inc QuantityPriceInc QuantityPriceInc QuantityPrice
Period 3Period 2Period 1
IMPLIES THIS UUC INPUT

Market Processes: Bid to Bill March 2007
27
Click to edit Master title styleEx-Ante IMS
Unit 4 (Demand Unit) Data
100120
Quantity (MW)
Price (€/MWh)
0
0100
1
0
0100
2
0Forecast Min Output (MW)0Forecast Min Stable Generation (MW)
100Forecast Availability (MW)3Trading Period
UNIT 4 DATA
N/ANo Load Cost (€/hour)500Shut Down Cost per stop (€)
Periods N/AN/AN/A N/AEnergy Limit (MWh)
Ä If the price reaches €120/MWh then Unit 4 will reduce its load by up to 100 MW.Ä A shut down cost of €500 will be incurred in the first of each contiguous group of
periods where the Demand Side Unit supplies load reduction.Ä Unit 4 has availability in all periods.Ä Unit 4 has no energy limits (only hydro units can have these)Ä When this data is converted into the form used in the UUC the unit will be modelled
as a generator with a start-up cost and a zero no load cost.

Market Processes: Bid to Bill March 2007
28
Click to edit Master title styleEx-Ante IMS
Unit 4 (Demand Unit) Data
100120
Quantity (MW)
Price (€/MWh)
0
0100
1
0
0100
2
0Forecast Min Output (MW)0Forecast Min Stable Generation (MW)
100Forecast Availability (MW)3Trading Period
100120100120100120
Inc QuantityPriceInc QuantityPriceInc QuantityPricePeriod 3Period 2Period 1
THIS PARTICIPANT DATA
IMPLIES THIS UUC INPUT
N/ANo Load Cost (€/hour)500Shut Down Cost per stop (€)
0 Energy Limit (MWh) N/ANo Load Cost (€/period)500Start-up Cost per start (€)
Periods N/AN/AN/A N/AEnergy Limit (MWh)

Market Processes: Bid to Bill March 2007
29
Click to edit Master title styleTie-Breaking and Priority Dispatch
Ä In the above data both Units 1 and 2 have bid steps priced at €20/MWhÄ How these units are treated depends on their Priority Dispatch status.Ä We assume Unit 1 has priority dispatch and Unit 2 does not.
ÄThe costs of these units are modified:
Ä Priority Dispatch units have their tied bid prices reduced fractionally by a small random amount. Ä E.g. Unit 1’s €20/MWh price changes to €19.999/MWh. Ä If this sets the price, the price will be reported as €20.00/MWh
Ä Non-Priority Dispatch units have their tied bid prices increased fractionally by a small random amount. Ä E.g. Unit 2’s €20/MWh price changes to €20.001/MWh. Ä If this sets the price, the price will be reported as €20.00/MWh
Ä This ensures that in the event of tied bids.Ä Priority Dispatch units are scheduled ahead of non-priority dispatch units.Ä But within each group (priority dispatch, non-priority dispatch) ties are resolved
randomly.

Market Processes: Bid to Bill March 2007
30
Click to edit Master title styleTie-Breaking and Priority Dispatch
50305030
10019.99910019.99910019.99950105010501050Any50Any50Any
Inc QuantityPriceInc QuantityPriceInc QuantityPricePeriod 3Period 2Period 1
UNIT 1 DATA WITH PRIORITY DISPATCH
25 Energy Limit (MWh) N/ANo Load Cost (€/period)1,000Start-up Cost per start (€)
UNIT 2 DATA WITHOUT PRIORITY DISPATCH
0 Energy Limit (MWh)
120No Load Cost (€/period)
0Start-up Cost per start (€)
Energy Limited PeriodEnergy Limited PeriodEnergy Limited Period
1002510025100254020.0014020.0014020.00160Any60Any60Any
Inc QuantityPriceInc QuantityPriceInc QuantityPricePeriod 3Period 2Period 1

Market Processes: Bid to Bill March 2007
31
Click to edit Master title style
1. Setting the Scene
3. Ex Ante Generation Requirement
4. Ex Ante UUC Solution
7. Ex Post Processing of Bids
8. Ex Post Generation Requirement
9. Ex Post UUC Solution
6. Meter Data
5. Interconnectors & Dispatch Schedules
A. BID SECTION
B. SETTLEMENT SECTION
2. Bids

Market Processes: Bid to Bill March 2007
32
Click to edit Master title style
Composite TSODemand Forecast
(Demand + Transmission Losses– Non-Wind Autonomous
Generation)
Generation Requirements: Ex Ante
Ex-Ante Generation Requirement:
Minus Price Taker Nominations (non-wind)
Minus TSO Wind Generation Forecast
Ex Ante Generation Requirement(To be supplied by Price Maker Generator
Units)

Market Processes: Bid to Bill March 2007
33
Click to edit Master title styleEx Ante Generation Requirement Example
428368311Composite TSO Load Forecasts
400340280Ex-Ante Generation Requirement to be met by Price Makers282831Total Price Taker Nominations & Wind Unit Forecasts666Unit 8 (autonomous generator forecast - wind)
222Unit 7 (variable price-taker forecast - wind)
558Unit 6 (variable price taker nomination – non-wind)
151515Unit 5 (predictable price taker nomination)
Less
Period 3 (MW)
Period 2 (MW)
Period 1 (MW)

Market Processes: Bid to Bill March 2007
34
Click to edit Master title style
1. Setting the Scene
3. Ex Ante Generation Requirement
4. Ex Ante UUC Solution
7. Ex Post Processing of Bids
8. Ex Post Generation Requirement
9. Ex Post UUC Solution
6. Meter Data
5. Interconnectors & Dispatch Schedules
A. BID SECTION
B. SETTLEMENT SECTION
2. Bids

Market Processes: Bid to Bill March 2007
35
Click to edit Master title styleAssumptions & NotesThe real problem involves solving a Unit Commitment
Ä Not just a question of determining an optimal schedule given a “merit order” (or list of bids in order of increasing price), but a problem of determining the optimal cost mix of generators, interconnector units and demand side units to consider in forming the merit order given there are costs of starting these units and keeping them available.
ÄTo keep it simple we assume:Ä Units 1 and 2 are committed for all three periods and incur any associated start up costs.Ä Units 3a and 3b are committed for the one period (Period 2) they are available – they
have no start up or no load costs.Ä Only Unit 4’s commitment is determined in this example. This is an easier problem – given
everything else is committed and Unit 4 has the highest bid price we will only commit Unit 4 if we have no other supply options.
ÄRemember Unit 2 is energy limited to 120 MWhÄ It is committed & has a minimum stable generation of 60 MW, meaning it must generate
30 MWh per period.Ä Over three periods its minimum stable generation accounts for 90 MWh.Ä It only has 30 MWh available to be scheduled above minimum load.Ä We will see that the price in period 3 is the highest & all 30 MWh is scheduled then.Ä Hence seemingly cheap Unit 2 bids are not scheduled in Periods 1 and 2.

Market Processes: Bid to Bill March 2007
36
Click to edit Master title styleEx-Ante Merit Order – Trading Period 1
Cumulative MSQ
MSQIncremental Quantity
PriceUnit
505050Any11106060Any2160505010126010010019.999126004020.00122600100252280205030128001001204280TOTAL
Ä Generation Requirement = 280MWÄ Units 1 and 2 are assumed to be
committed so must cover their minimum stable generation (50 MW and 60 MW at any price)
Ä The interconnector units have no availability for this period.
Ä Unit 1’s €10 & priority dispatch adjusted €20 bids scheduled next.
Ä We need 20 MW more to cover the demand.
Ä Unit 2 has the next cheapest bids, but Unit 2 is energy limited and makes more money in period 3.
Ä Hence Unit 1’s €30 bid supplies the last 20 MW & sets the shadow price.
Ä Unit 4 is too expensive and is not needed.Ä Shadow Price is €30/MWh

Market Processes: Bid to Bill March 2007
37
Click to edit Master title styleEx-Ante Merit Order - Trading Period 2
Cumulative MSQ
MSQIncremental Quantity
PriceUnit
505050Any11106060Any270-40-40Any3a10-60-60Any3b30202053a805050101
18010010019.999118004020.0012180010025223050503012704040403a2902020503a3405060553b340060653b34001001204340TOTAL
Ä Generation Requirement = 340MWÄ Units 1 and 2 are assumed to be
committed so must cover their minimum stable generation (50 MW and 60 MW at any price)
Ä Units 3a and 3b are assumed to be committed so will provide their maximum export at any price (-40 MW and -60 MW)
Ä We continue up the merit order skipping Unit 2 again because of its energy limit.
Ä Units 1 and 3a are scheduled to capacity while Unit 3b has 50 MW scheduled beyond its maximum export implying a net flow of -10 MW.
Ä Unit 4 is too expensive and is not needed.Ä Shadow Price is €55/MWh

Market Processes: Bid to Bill March 2007
38
Click to edit Master title styleEx-Ante Merit Order – Trading Period 3
400TOTAL40080100120432020100252300404020.001226010010019.999116050501011106060Any2505050Any1
Cumulative MSQ
MSQIncremental Quantity
PriceUnitÄ Generation Requirement = 400MWÄ Units 1 and 2 are assumed to be
committed so must cover their minimum stable generation (50 MW and 60 MW at any price)
Ä The interconnector units have no availability for this period.
Ä Unit 1’s €10 & priority dispatch adjusted €20 bids scheduled next.
Ä Unit 2 provides all its 30 MWh of available energy in this period by supplying 60 MW for 30 minutes.
Ä We still need to cover 80 MW of load, so must commit Unit 4, incurring its start-up cost of €500. The bid price of Unit 4 sets the price in this period.
Ä Shadow Price is €120/MWh

Market Processes: Bid to Bill March 2007
39
Click to edit Master title styleEx Ante UUC Solution
1205530Shadow Price (€/MWh)
321Period
Period 3 MSQ (MW)
Period 2 MSQ (MW)
Period 1 MSQ (MW)
Unit
800040-1003b04003a
120606022002502201
Market Processes: Bid to Bill March 2007
40
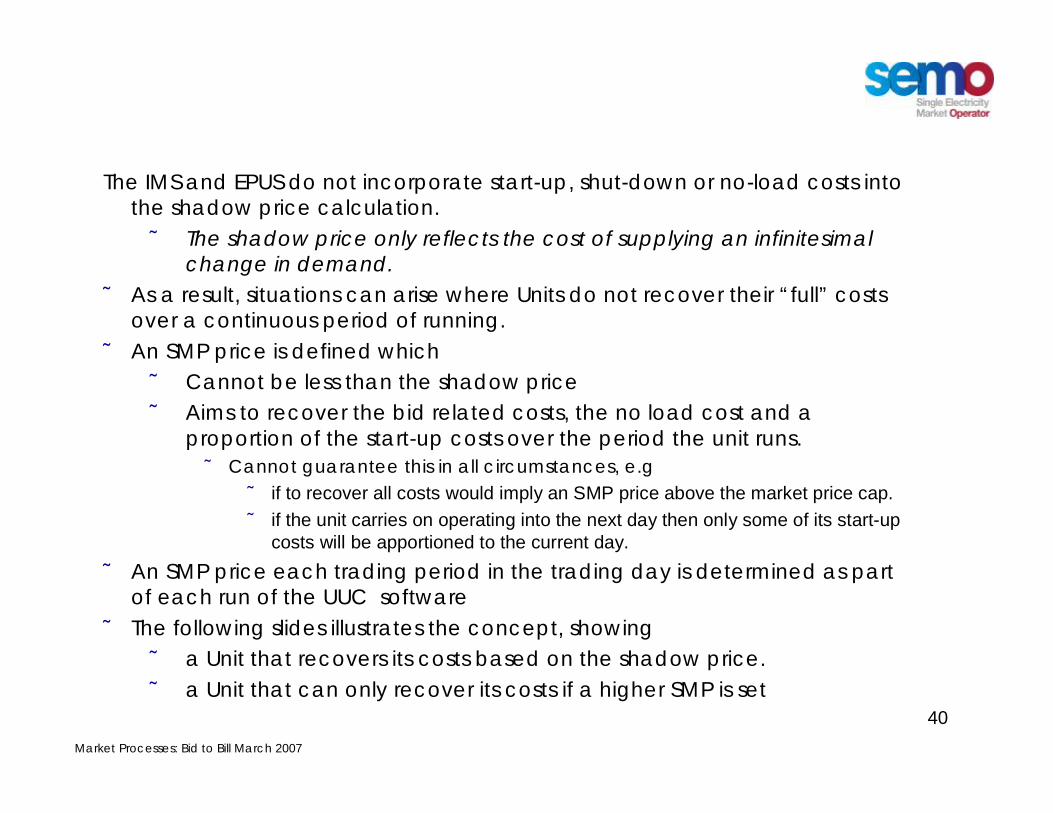
Click to edit Master title styleShadow Prices and SMPThe IMS and EPUS do not incorporate start-up, shut-down or no-load costs into
the shadow price calculation.Ä The shadow price only reflects the cost of supplying an infinitesimal
change in demand.Ä As a result, situations can arise where Units do not recover their “full” costs
over a continuous period of running.Ä An SMP price is defined which
Ä Cannot be less than the shadow priceÄ Aims to recover the bid related costs, the no load cost and a
proportion of the start-up costs over the period the unit runs.Ä Cannot guarantee this in all circumstances, e.g
Ä if to recover all costs would imply an SMP price above the market price cap.Ä if the unit carries on operating into the next day then only some of its start-up
costs will be apportioned to the current day.Ä An SMP price each trading period in the trading day is determined as part
of each run of the UUC softwareÄ The following slides illustrates the concept, showing
Ä a Unit that recovers its costs based on the shadow price.Ä a Unit that can only recover its costs if a higher SMP is set

Market Processes: Bid to Bill March 2007
41
Click to edit Master title styleEx Ante UUC Solution: Unit 1
100125110Schedule Quantities in MWh
1200068753300Earnings at shadow price
1205530Shadow price (€/MWh)
298.508373.134328.358Start up cost pro-rated by MSQ1823.5082648.1342153.358Per period cost (Total)
150022501800Running Cost (a function of P and Q)200250220Schedule Quantities (MSQ) in MW252525No load
ONONONStatus321Period
Ä A Start-Up cost for Unit 1 = €1000 is incurred at the start of the day.
Ä Unit 1 recovers its costs in each periodÄ Earnings=MSQ * Shadow PriceÄ Hence the unit recovers its costs at the
Shadow Price and makes a profit.Any higher SMP will just increase the units profit.
Running Cost =
1800Total Running Cost3003020/2 = 10
100020100/2 = 5050010100/2 = 50
CostBid Price
Quantity (MWh)
Market Processes: Bid to Bill March 2007
42
Click to edit Master title styleEx Ante UUC Solution: Units 2, 3a and 3b
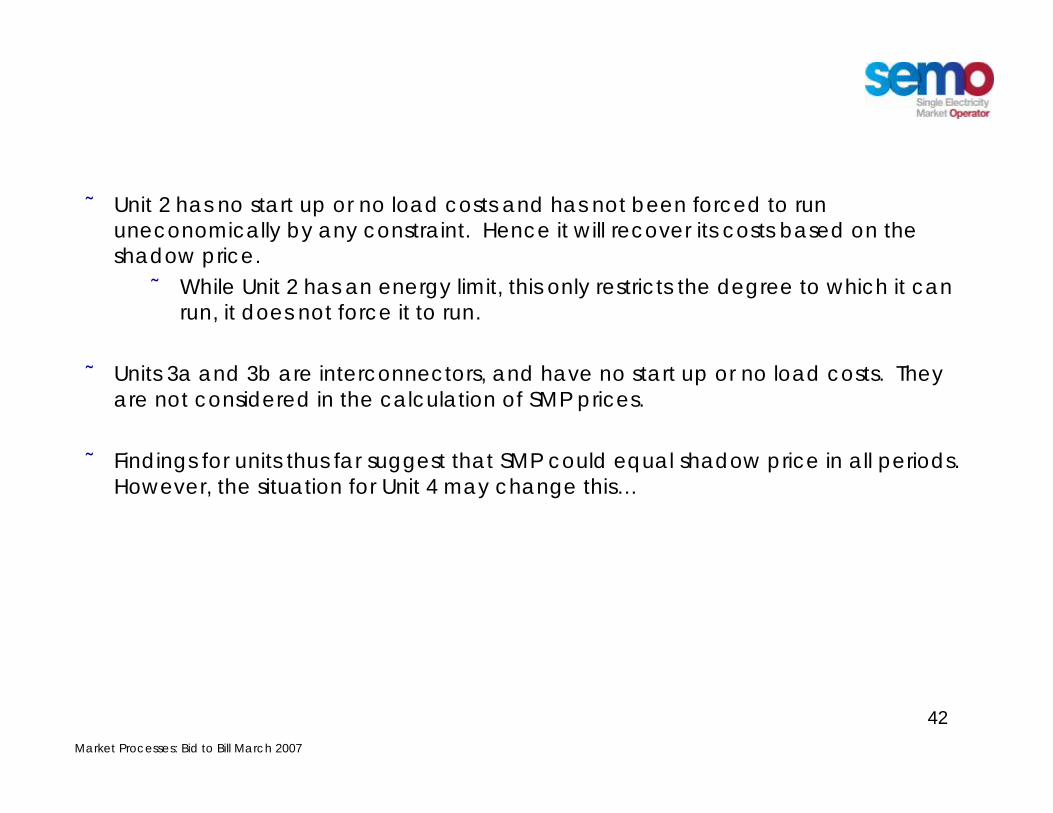
Ä Unit 2 has no start up or no load costs and has not been forced to run uneconomically by any constraint. Hence it will recover its costs based on the shadow price.Ä While Unit 2 has an energy limit, this only restricts the degree to which it can
run, it does not force it to run.
Ä Units 3a and 3b are interconnectors, and have no start up or no load costs. They are not considered in the calculation of SMP prices.
Ä Findings for units thus far suggest that SMP could equal shadow price in all periods. However, the situation for Unit 4 may change this…

Market Processes: Bid to Bill March 2007
43
Click to edit Master title styleEx Ante UUC Solution: Unit 4
4000Schedule Quantities in MWh
480000Earnings at shadow price
1205530Shadow price (€/MWh)
50000Start up cost pro-rated by MSQ530000Per period cost (Total)
480000Running Cost (a function of P and Q)8000Schedule Quantities (MSQ) in MW
000No loadONOFFOFFStatus
321PeriodÄ A Start-Up cost for Unit 4 = €500 is incurred in that one period it operates.
Ä Unit 4 does not recover its fuel costs Ä For period 3, SMP must be set to at least:
€120/MWh * (5300/4800) = €132.5/MWh Ä SMP at this level ensures that Unit 4 breaks
even, but this same price applies to all units.Ä While this is the correct SMP value, the
method we have used is a simplification.
Running Cost =
4800Total Running Cost
480012080/2 = 40
CostBid Price
Quantity (MWh)

Market Processes: Bid to Bill March 2007
44
Click to edit Master title style
1. Setting the Scene
3. Ex Ante Generation Requirement
4. Ex Ante UUC Solution
7. Ex Post Processing of Bids
8. Ex Post Generation Requirement
9. Ex Post UUC Solution
6. Meter Data
5. Interconnectors & Dispatch Schedules
A. BID SECTION
B. SETTLEMENT SECTION
2. Bids

Market Processes: Bid to Bill March 2007
45
Click to edit Master title styleModified Interconnector User Nominations (MIUNs)
0300TOTAL
0-1003b
04003a
Period 3 (MW)
Period 2 (MW)
Period 1 (MW)Unit
Ä The Moyle Interconnector Trading System (MITS) determines modified interconnector user nominations (MIUNs)Ä MIUNs are effectively the interconnector capacity available to each
interconnector user in real-time.
Ä MITS essentially allocates the total flows on the interconnector between the interconnector units in proportion to their right holdings.
Ä In this example there is no ramp restriction on the interconnector and MITS does not change the solution.

Market Processes: Bid to Bill March 2007
46
Click to edit Master title styleDispatch Instructions
Period 3(MW)
Period 2(MW)
Period 1(MW)
Unit
8092
020
04
0-1003b
04003a
12060602
200250212
2201941
Period 3: Demand higher than expected
Period 2: Demand lower than expected so Unit 1 backs off.Plus a transmission constraint limits Unit 1’s output, shifting output to Unit 4.
Period 1: Demand lower than expected so Unit 1 backed off.
IMS ScheduleDispatch Schedule
Ä Real-time scheduling is performed by operators assisted by the Reserve Constrained Unit Commitment (RCUC) model.

Market Processes: Bid to Bill March 2007
47
Click to edit Master title stylePrice Maker Dispatch Schedules
9220040-1003b04003a
120606022002121941
Period 3(MW)
Period 2(MW)
Period 1(MW)Unit
Ä Dispatch instructions are instructions to move to a specific output in a specific time.Ä The market systems include an Instruction Profiling function that converts these
instructions into an average MW dispatch instruction quantity per trading intervalÄ Note that while we have shown all price makers here:
Ä Interconnector “dispatch values” are just their MIUN valuesÄ Demand side unit dispatch quantities are used as their metered quantities.
Dispatch Schedule
Market Processes: Bid to Bill March 2007
48
Click to edit Master title style
1. Setting the Scene
3. Ex Ante Generation Requirement
4. Ex Ante UUC Solution
7. Ex Post Processing of Bids
8. Ex Post Generation Requirement
9. Ex Post UUC Solution
6. Meter Data
5. Interconnectors & Dispatch Schedules
A. BID SECTION
B. SETTLEMENT SECTION
2. Bids
Market Processes: Bid to Bill March 2007
49
Click to edit Master title styleSummary of Metered Quantities (MWh)
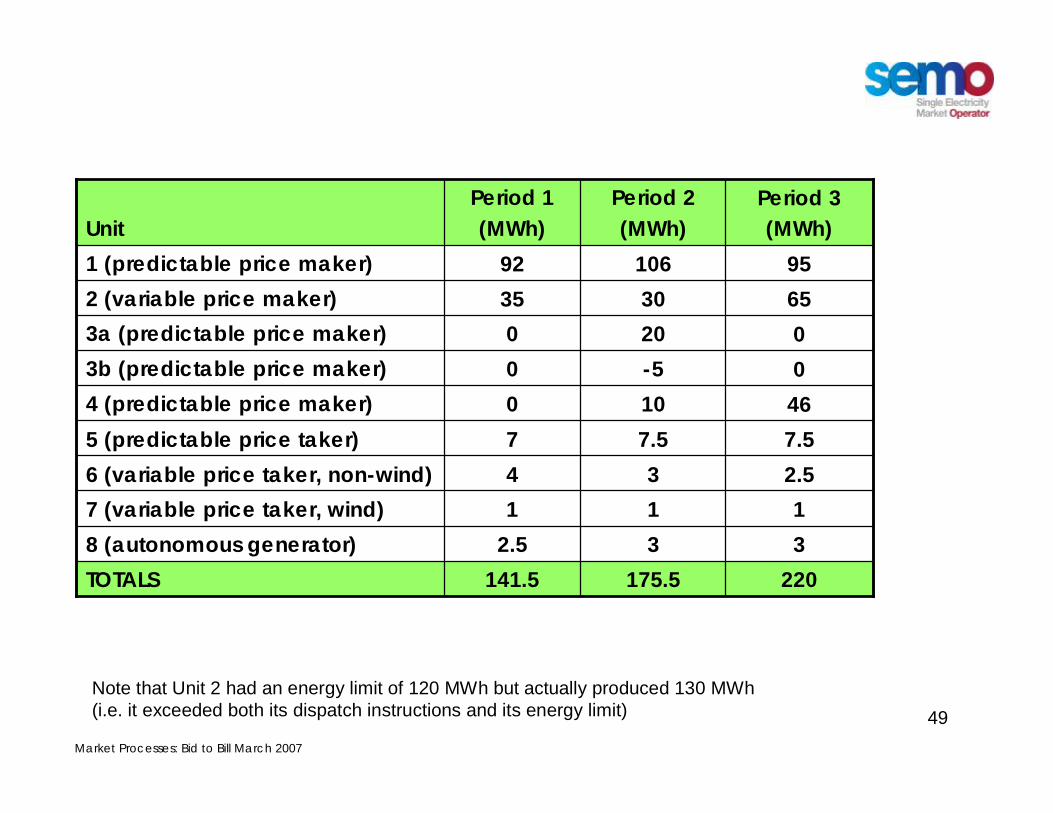
332.58 (autonomous generator)220175.5141.5TOTALS
1117 (variable price taker, wind)2.5346 (variable price taker, non-wind)7.57.575 (predictable price taker)461004 (predictable price maker)0-503b (predictable price maker)02003a (predictable price maker)
6530352 (variable price maker)95106921 (predictable price maker)
Period 3(MWh)
Period 2(MWh)
Period 1(MWh)Unit
Note that Unit 2 had an energy limit of 120 MWh but actually produced 130 MWh(i.e. it exceeded both its dispatch instructions and its energy limit)
Market Processes: Bid to Bill March 2007
50
Click to edit Master title styleMetered Quantities Converted to MW
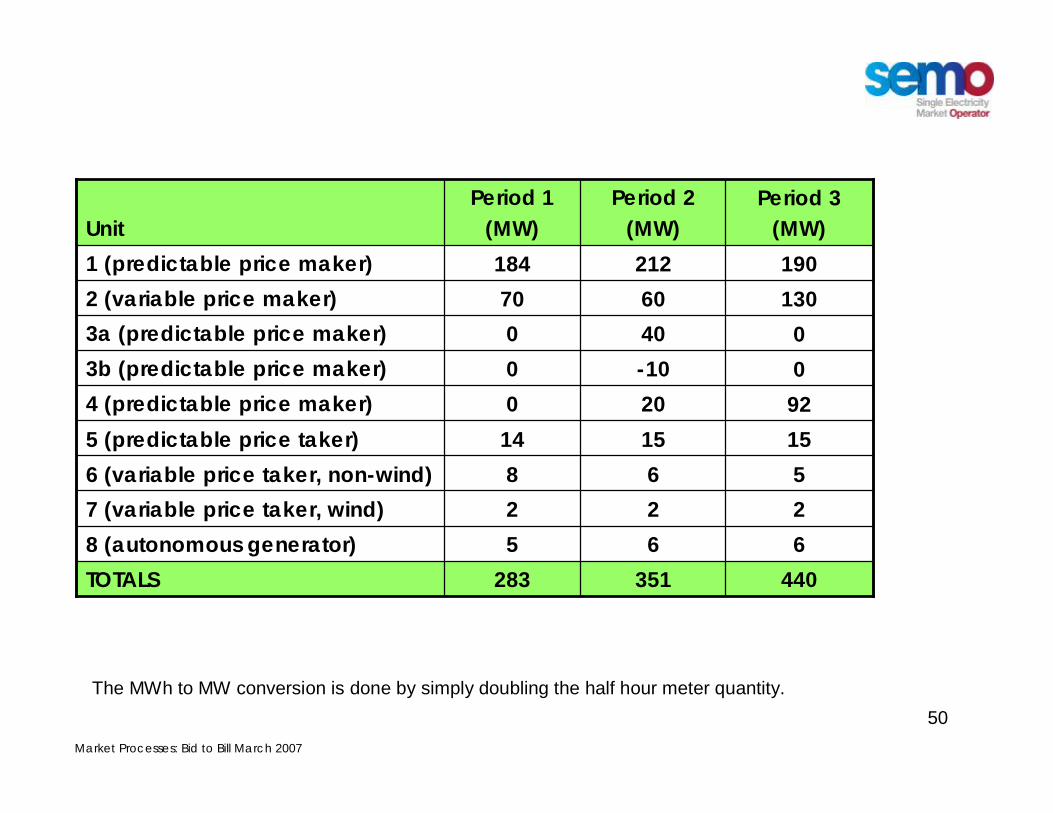
6658 (autonomous generator)440351283TOTALS
2227 (variable price taker, wind)5686 (variable price taker, non-wind)
1515145 (predictable price taker)922004 (predictable price maker)0-1003b (predictable price maker)04003a (predictable price maker)
13060702 (variable price maker)1902121841 (predictable price maker)
Period 3(MW)
Period 2(MW)
Period 1(MW)Unit
The MWh to MW conversion is done by simply doubling the half hour meter quantity.

Market Processes: Bid to Bill March 2007
51
Click to edit Master title styleSummary of Price Maker Schedules
Period 3(MW)
Period 2(MW)
Period 1(MW)
Unit
8092
020
04
0-1003b
04003a
120
130
6060
702
200
190
250212
220194184
1
Period 1: Unit 1 supplies less than it was supposed to, but Unit 2 supplies more.
IMS ScheduleDispatch ScheduleMetered Schedule
Period 3: Unit 1 supplies less than it was suppose to, but Unit 2 supplies more.
Note: Only results that differ from expectation are shown.
In settlements, the non-compliance in each period is discouraged by charging Unit 1 an “imbalance price” greater than the market price for its 10 MW shortfall, while paying Unit 2 an “imbalance price” less than the market price for its 10 MW supply.

Market Processes: Bid to Bill March 2007
52
Click to edit Master title stylePrice Taker Meter Data and their “Dispatch Instructions”
Period 3(MW)
Period 2(MW)
Period 1(MW)
Unit
66
66
658
22
22
227
55
56
886
1515
1515
15145
Ex Ante Forecasts/NominationsDispatch Schedule = Metered Schedule
Ä For settlement purposes, the price taker meter data is used as their dispatch instructions.

Market Processes: Bid to Bill March 2007
53
Click to edit Master title styleSummary of Dispatch Schedules
6658 (autonomous generator)440351283TOTAL
2227 (variable price taker, wind)5686 (variable price taker, non-wind)
1515145 (predictable price taker)922004 (predictable price maker)0-1003b (predictable price maker)04003a (predictable price maker)
12060602 (variable price maker)2002121941 (predictable price maker)
Period 3(MW)
Period 2(MW)
Period 1(MW)Unit

Market Processes: Bid to Bill March 2007
54
Click to edit Master title styleSupplier Unit Metering
-37-32-35Supplier Unit 2-180-140-100Supplier Unit 1
Period 3(MWh)
Period 2(MWh)
Period 1(MWh)Unit
Ä Supplier Unit metering is not used in the pricing and scheduling process.
Ä It only becomes available to the Single Market Operator after all scheduling has been completed and is only used in Settlement .

Market Processes: Bid to Bill March 2007
55
Click to edit Master title style
1. Setting the Scene
3. Ex Ante Generation Requirement
4. Ex Ante UUC Solution
7. Ex Post Processing of Bids
8. Ex Post Generation Requirement
9. Ex Post UUC Solution
6. Meter Data
5. Interconnectors & Dispatch Schedules
A. BID SECTION
B. SETTLEMENT SECTION
2. Bids

Market Processes: Bid to Bill March 2007
56
Click to edit Master title styleIndicative and Initial Ex Post Schedule
Ä There are two ex post schedulesÄ Indicative produced on day D+1
Ä Uses some approximate data where no meter data is available.Ä Initial produced on day D+4
Ä All data available.
Ä The Generator Requirements in these runs only make use of meter data for Generators.Ä Demand-side meter data is only required for settlement
Ä In this example we assume that we are running an Initial Ex Post Schedule
Ä All that is different for an indicative Ex Post Schedule is the source of some of the data.

Market Processes: Bid to Bill March 2007
57
Click to edit Master title styleEx-Post EPUS
Unit 1 (Thermal Unit) Data
30030
2002010010
Quantity (MW)
Price (€/MWh)
0
50250
1
0
50250
2
0Actual Min Output (MW)50Actual Min Stable Generation (MW)200Actual Availability (MW)3Trading Period
50305030
10020100201002050105010501050Any50Any50Any
Inc QuantityPriceInc QuantityPriceInc QuantityPricePeriod 3Period 2Period 1
THIS DATA
IMPLIES THIS UUC INPUT
50No Load Cost (€/hour)1,000Start-up Cost per start (€)
25 Energy Limit (MWh) N/ANo Load Cost (€/period)1,000Start-up Cost per start (€)
Periods N/AN/AN/A N/AEnergy Limit (MWh)
(There has been no change relative to the IMS run)

Market Processes: Bid to Bill March 2007
58
Click to edit Master title styleEx-Post EPUS
Unit 2 (Hydro Unit) Data
20025
100205010
Quantity (MW)
Price (€/MWh)
0
60200
1
0
60190
2
0Actual Min Output (MW)60Actual Min Stable Generation (MW)200Actual Availability (MW)3Trading Period
THIS DATA
IMPLIES THIS UUC INPUT
0No Load Cost (€/hour)0Start-up Cost per start (€)
0 Energy Limit (MWh) 130No Load Cost (€/period)0Start-up Cost per start (€)
Periods üü130 üEnergy Limit (MWh)
Energy Limited PeriodEnergy Limited PeriodEnergy Limited Period
1002590251002540204020402060Any60Any60Any
Inc QuantityPriceInc QuantityPriceInc QuantityPricePeriod 3Period 2Period 1
(Energy Limit increased to reflect higher meter data, while availability in period 2 decreased)
Market Processes: Bid to Bill March 2007
59
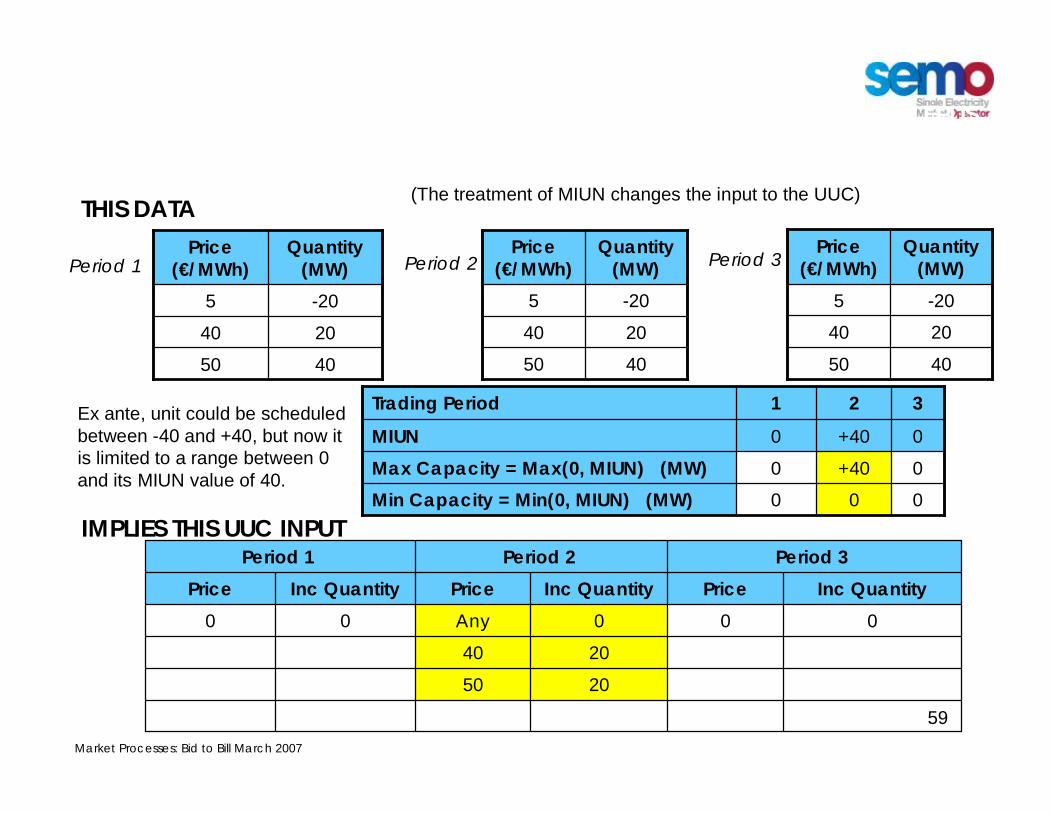
Click to edit Master title styleEx-Post EPUS
Unit 3a : Interconnector Bids
40502040
-205
Quantity (MW)
Price (€/MWh)
40502040
-205
Quantity (MW)
Price (€/MWh)
0+400MIUN
00
1
0+40
2
0Min Capacity = Min(0, MIUN) (MW)0Max Capacity = Max(0, MIUN) (MW)
3Trading Period
THIS DATA
4050
2040-205
Quantity (MW)
Price (€/MWh)Period 1 Period 2 Period 3
2050
2040
000Any00
Inc QuantityPriceInc QuantityPriceInc QuantityPricePeriod 3Period 2Period 1
IMPLIES THIS UUC INPUT
Ex ante, unit could be scheduled between -40 and +40, but now it is limited to a range between 0 and its MIUN value of 40.
(The treatment of MIUN changes the input to the UUC)

Market Processes: Bid to Bill March 2007
60
Click to edit Master title styleEx-Post EPUS
Unit 3b : Interconnector Bids
6065
055
Quantity (MW)
Price (€/MWh)
6065
055
Quantity (MW)
Price (€/MWh)
THIS DATA
6065055
Quantity (MW)
Price (€/MWh)Period 1 Period 2 Period 3
1055
00-10Any00Inc QuantityPriceInc QuantityPriceInc QuantityPrice
Period 3Period 2Period 1
0-100MIUN
0
0
1
-10
0
2
0Min Capacity = Min(0, MIUN) (MW)0Max Capacity = Max(0, MIUN) (MW)
3Trading PeriodEx ante, unit could be scheduled between -60 and +60, but now it is limited to a range between 0 and its MIUN value of -10 MW.
IMPLIES THIS UUC INPUT
(The treatment of MIUN changes the input to the UUC)

Market Processes: Bid to Bill March 2007
61
Click to edit Master title styleEx-Post EPUS
Unit 4 (Demand Unit) Data
100120
Quantity (MW)
Price (€/MWh)
0
0100
1
0
0100
2
0Actual Min Output (MW)0Actual Min Stable Generation (MW)
100Actual Availability (MW)3Trading Period
100120100120100120
Inc QuantityPriceInc QuantityPriceInc QuantityPricePeriod 3Period 2Period 1
THIS PARTICIPANT DATA
IMPLIES THIS UUC INPUT
N/ANo Load Cost (€/hour)500Shut Down Cost per stop (€)
0 Energy Limit (MWh) N/ANo Load Cost (€/period)500Start-up Cost per start (€)
Periods N/AN/AN/A N/AEnergy Limit (MWh)
(There has been no change relative to the IMS run)

Market Processes: Bid to Bill March 2007
62
Click to edit Master title styleTie-Breaking and Priority Dispatch
50305030
10019.99910019.99910019.99950105010501050Any50Any50Any
Inc QuantityPriceInc QuantityPriceInc QuantityPricePeriod 3Period 2Period 1
UNIT 1 DATA WITH PRIORITY DISPATCH
25 Energy Limit (MWh) N/ANo Load Cost (€/period)1,000Start-up Cost per start (€)
UNIT 2 DATA WITHOUT PRIORITY DISPATCH
0 Energy Limit (MWh) 130No Load Cost (€/period)0Start-up Cost per start (€)
Energy Limited PeriodEnergy Limited PeriodEnergy Limited Period
100259025100254020.0014020.0014020.00160Any60Any60Any
Inc QuantityPriceInc QuantityPriceInc QuantityPricePeriod 3Period 2Period 1
Market Processes: Bid to Bill March 2007
63
Click to edit Master title style
1. Setting the Scene
3. Ex Ante Generation Requirement
4. Ex Ante UUC Solution
7. Ex Post Processing of Bids
8. Ex Post Generation Requirement
9. Ex Post UUC Solution
6. Meter Data
5. Interconnectors & Dispatch Schedules
A. BID SECTION
B. SETTLEMENT SECTION
2. Bids

Market Processes: Bid to Bill March 2007
64
Click to edit Master title styleGeneration Requirements: Ex Post
Ex Post Generation Requirement
MWMeter Generation Price Maker Units APlus Meter Generation I/C Units BPlus Meter Generation Demand Side Units CPlus Load Shedding Estimate DPlus DQ for Interconnector Residual Capacity Unit* EMinus Constrained Up/Down for Price Takers F
Ex Post Generation Requirement A+B+C+D+E-F
* This is effectively the inter-jurisdictional trade across the interconnector. We assume this is 0 MW.

Market Processes: Bid to Bill March 2007
65
Click to edit Master title styleEx-Post Generation Requirement
000Dispatch Quantity for Interconnector Residual Capacity Unit (E)
000Load Shedding Estimate (D)
Metered DSU Generation (Calculated)92200Unit 492200Total (C)
0300Total (B)0-100Unit 3b0400Unit 3a
Metered IU Generation (Calculated)320272254Total (A)1306070Unit 2190212184Unit 1
Metered Price Maker Generation (non DSU/IU)Period 3Period 2Period 1
All measurements in MW.
Market Processes: Bid to Bill March 2007
66
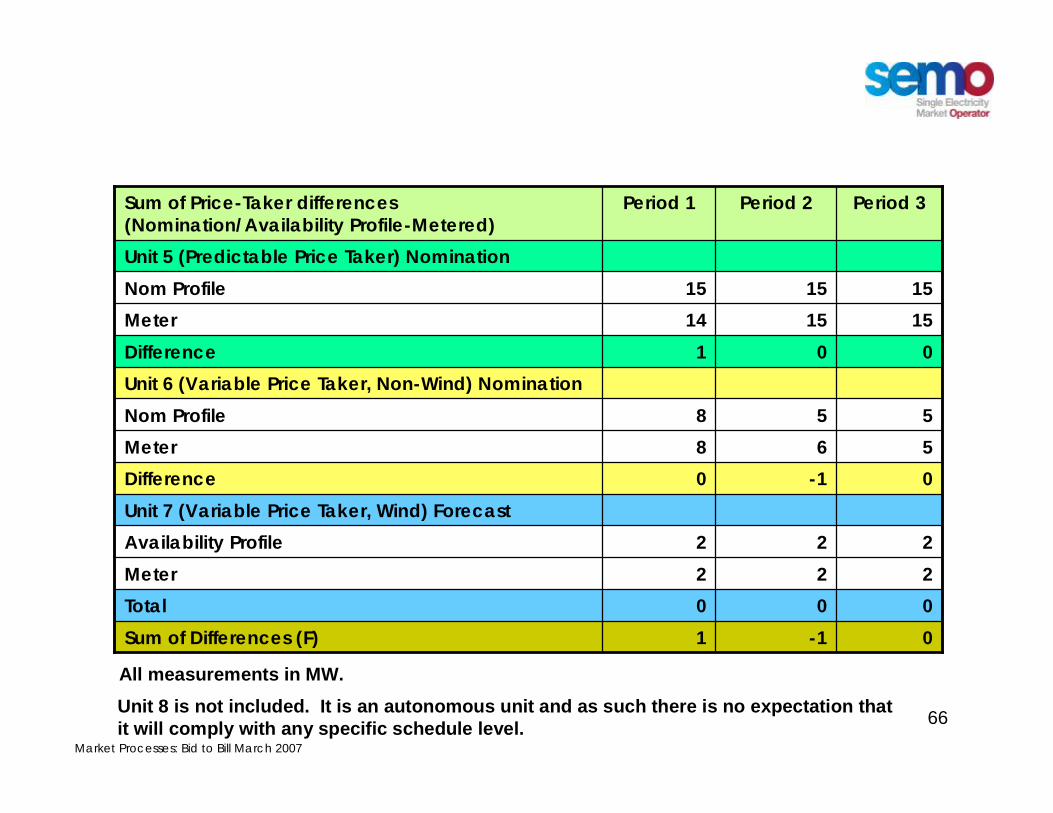
Click to edit Master title styleEx-Post Generation Requirement (continued)
000Total0-11Sum of Differences (F)
Unit 7 (Variable Price Taker, Wind) Forecast222Availability Profile 222Meter
0-10Difference568Meter 558Nom Profile
Unit 6 (Variable Price Taker, Non-Wind) Nomination001Difference
151514Meter151515Nom Profile
Unit 5 (Predictable Price Taker) Nomination
Period 3Period 2Period 1Sum of Price-Taker differences (Nomination/Availability Profile-Metered)
Unit 8 is not included. It is an autonomous unit and as such there is no expectation that it will comply with any specific schedule level.
All measurements in MW.
Market Processes: Bid to Bill March 2007
67
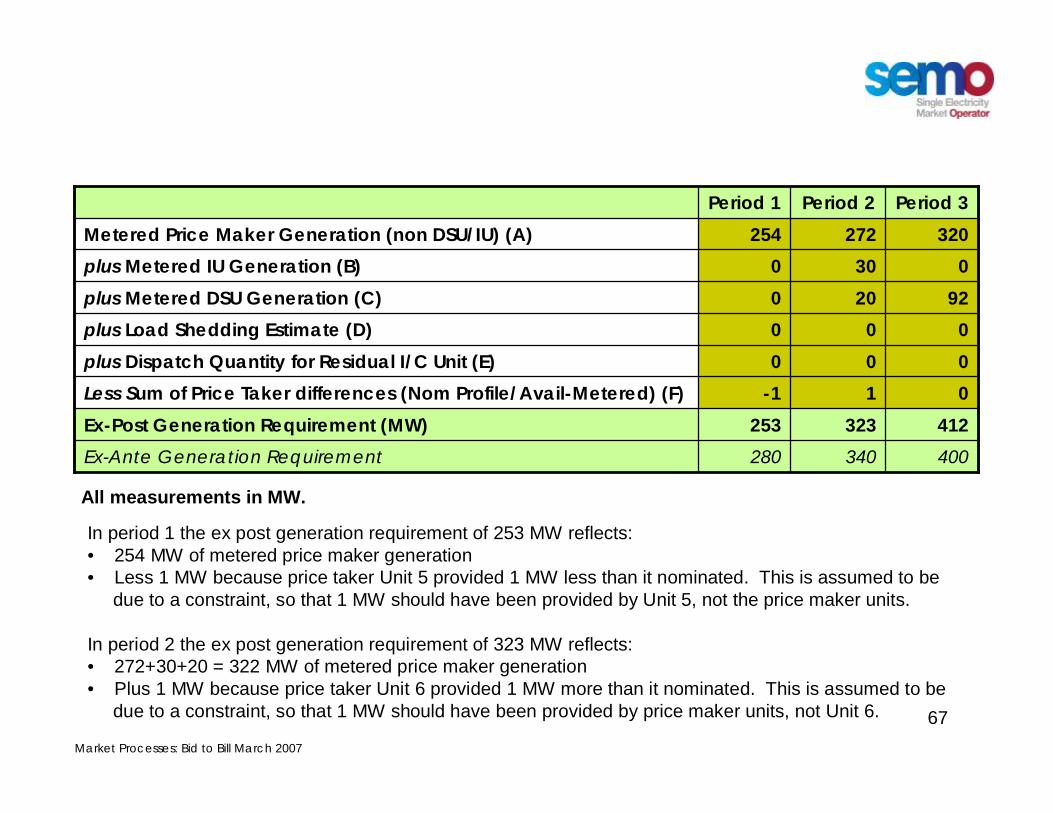
Click to edit Master title styleGeneration Requirements: Ex Post
400340280Ex-Ante Generation Requirement
01-1Less Sum of Price Taker differences (Nom Profile/Avail-Metered) (F) 412323253Ex-Post Generation Requirement (MW)
000plus Dispatch Quantity for Residual I/C Unit (E) 000plus Load Shedding Estimate (D)
92200plus Metered DSU Generation (C) 0300plus Metered IU Generation (B)
320272254Metered Price Maker Generation (non DSU/IU) (A) Period 3Period 2Period 1
In period 1 the ex post generation requirement of 253 MW reflects:• 254 MW of metered price maker generation• Less 1 MW because price taker Unit 5 provided 1 MW less than it nominated. This is assumed to be
due to a constraint, so that 1 MW should have been provided by Unit 5, not the price maker units.
In period 2 the ex post generation requirement of 323 MW reflects:• 272+30+20 = 322 MW of metered price maker generation• Plus 1 MW because price taker Unit 6 provided 1 MW more than it nominated. This is assumed to be
due to a constraint, so that 1 MW should have been provided by price maker units, not Unit 6.
All measurements in MW.
Market Processes: Bid to Bill March 2007
68
Click to edit Master title style
1. Setting the Scene
3. Ex Ante Generation Requirement
4. Ex Ante UUC Solution
7. Ex Post Processing of Bids
8. Ex Post Generation Requirement
9. Ex Post UUC Solution
6. Meter Data
5. Interconnectors & Dispatch Schedules
A. BID SECTION
B. SETTLEMENT SECTION
2. Bids

Market Processes: Bid to Bill March 2007
69
Click to edit Master title styleEx-Post Merit Order- Trading Period 1
Cumulative MSQ
MSQIncremental Quantity
PriceUnit
505050Any11106060Any216050501012539310019.999125304020.0012253010025225305030125301001204253TOTAL
Ä Generation Requirement = 253MWÄ Units 1 and 2 are assumed to be
committed so must cover their minimum stable generation (50 MW and 60 MW at any price)
Ä The interconnector units have no availability for this period.
Ä Unit 1’s €10 bid is scheduled next.Ä Unit 1’s priority dispatch adjusted €20
bid supplies the last 93 MW required and sets the price.
Ä The remaining bids are too expensive.Ä Note that the tie between bids from
Units 1 and 2 has been resolved in favour of the unit with priority dispatch.
Ä Shadow Price is €20/MWh
Market Processes: Bid to Bill March 2007
70
Click to edit Master title styleEx-Post Merit Order- Trading Period 2
32301001204
150505010125010010019.999125004020.001225009025230050503013202020403a323320503a323010553b
Cumulative MSQ
MSQIncremental Quantity
PriceUnit
505050Any11106060Any211000Any3a100-10-10Any3b
323TOTAL
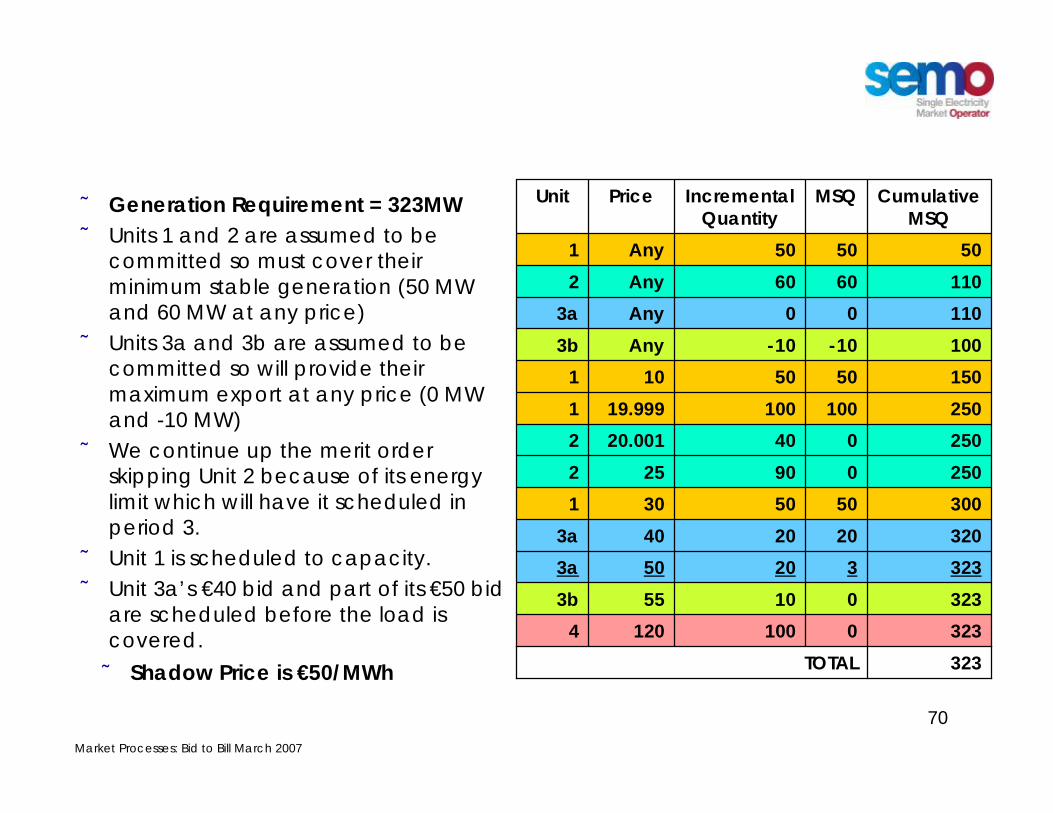
Ä Generation Requirement = 323MWÄ Units 1 and 2 are assumed to be
committed so must cover their minimum stable generation (50 MW and 60 MW at any price)
Ä Units 3a and 3b are assumed to be committed so will provide their maximum export at any price (0 MW and -10 MW)
Ä We continue up the merit order skipping Unit 2 because of its energy limit which will have it scheduled in period 3.
Ä Unit 1 is scheduled to capacity.Ä Unit 3a’s €40 bid and part of its €50 bid
are scheduled before the load is covered.Ä Shadow Price is €50/MWh

Market Processes: Bid to Bill March 2007
71
Click to edit Master title styleEx-Post Merit Order- Trading Period 3
412TOTAL41272100120434040100252300404020.001226010010019.999116050501011106060Any2505050Any1
Cumulative MSQ
MSQIncremental Quantity
PriceUnitÄ Generation Requirement = 412MWÄ Units 1 and 2 are assumed to be
committed so must cover their minimum stable generation (50 MW and 60 MW at any price)
Ä The interconnector units have no availability for this period.
Ä Unit 1’s €10 & priority dispatch adjusted €20 bids scheduled next.
Ä Unit 2 provides all its 40 MWh of available energy in this period by supplying 80 MW for 30 minutes.
Ä We still need to cover 72 MW of load, so must commit Unit 4, incurring its start-up cost of €500. The bid price of Unit 4 sets the price in this period.
Ä Shadow Price is €120/MWh

Market Processes: Bid to Bill March 2007
72
Click to edit Master title styleEx Post UUC Solution
1205020Ex Post Shadow Price (€/MWh)
1205530Ex Ante Shadow Price (€/MWh)
321Period
Period 3 MSQ (MW)
Period 2 MSQ (MW)
Period 1 MSQ (MW)
Unit
720040-1003b02303a
140606022002501931

Market Processes: Bid to Bill March 2007
73
Click to edit Master title styleEx Post UUC Solution: Unit 1
10012596.5Schedule Quantities in MWh
1200062501930Earnings at shadow price
1205020Shadow price (€/MWh)
311.042388.803300.155Start up cost pro-rated by MSQ1836.0422663.8031755.155Per period cost (Total)
150022501430Running Cost (a function of P and Q)200250193Schedule Quantities (MSQ) in MW252525No load
ONONONStatus321Period
Ä A Start-Up cost for Unit 1 = €1000 is incurred at the start of the day.
Ä Unit 1 recovers its costs in each periodÄ Earnings=MSQ * Shadow PriceÄ Hence the unit recovers its costs at the
Shadow Price and makes a profit.Any higher SMP will just increase the units profit.
Running Cost =
1430Total Running Cost
9302093/2 = 46.550010100/2 = 50
CostBid Price
Quantity (MWh)

Market Processes: Bid to Bill March 2007
74
Click to edit Master title styleEx Post UUC Solution: Unit 4
3600Schedule Quantities in MWh
432000Earnings at shadow price
1205530Shadow price (€/MWh)
50000Start up cost pro-rated by MSQ482000Per period cost (Total)
432000Running Cost (a function of P and Q)7200Schedule Quantities (MSQ) in MW
000No loadONOFFOFFStatus
321PeriodÄ A Start-Up cost for Unit 4 = €500 is incurred in that one period it operates.
Ä Unit 4 does not recover its fuel costs Ä For period 3, SMP must be set to at least:
€120/MWh * (4820/4320) = €133.89/MWh Ä SMP at this level ensures that Unit 4 breaks
even, but this same price applies to all units.
Running Cost =
4320Total Running Cost
432012072/2 = 36
CostBid Price
Quantity (MWh)

Market Processes: Bid to Bill March 2007
75
Click to edit Master title styleEx Post SMP Prices
133.895020Ex Post SMP (€/MWh)
132.55530Ex Ante SMP (€/MWh)
321Period

Market Processes: Bid to Bill March 2007
76
Click to edit Master title styleSummary of Schedules – Period 2 Only
68 (autonomous generator)368TOTAL
27 (variable price taker, wind)56 (variable price taker, non-wind)
155 (predictable price taker)04 (predictable price maker)
-103b (predictable price maker)403a (predictable price maker)602 (variable price maker)
2501 (predictable price maker)
Ex Ante Schedule
(MW)Unit
Changes due to constraints and lower demand than forecast
Changes due to re-optimising schedule with different interconnector limits.Changes due to 1 MW over-supply by price takers. Unit 3A now supplies that 1 MW so it is priced.
351626
1520-104060
212
Meter Schedule
(MW)
6351
26
1520-104060
212
DSQ(MW)
352626
150
-102360
250
Ex Post Schedule
(MW)

Market Processes: Bid to Bill March 2007
77
Click to edit Master title styleA Diversion: Pump Storage Units
Ä We have not considered these so far due to the complexity of the inter-temporal relationships.Ä Our pump storage unit which can pump at 50 MW or generate at 50 MWÄ 1 MWh of pumping raises reservoir by 0.5 MWhÄ 1 MWh of generation lowers reservoir by 1 MWhÄ In this example, no net change in reservoir level is allowed over the day.
Ä In this example we assume some shadow prices to illustrate how the unit is scheduled (note the they are settled based on SMP prices)
Price
€100
€60
€40Pump at 50 MWh for 1 hour, raise reservoir by 25 MWh(Cost = €2,000)
Do nothing
Generate at 50 MWhfor 1 hour, lower reservoir by 50 MWh
(Gain = €5,000) Do nothing
Pump at 50 MWh for 1 hour, raise reservoir by 25 MWh(Cost = €2,000)

Market Processes: Bid to Bill March 2007
78
Click to edit Master title styleA Diversion: Pump Storage Units
Ä Note that the unit cannot make money by pumping at €40 and generating at €60, or by pumping at €60 and generating at €100 because it must pump 2 MWh for each 1 MWh it generates. This is not profitable at these prices.
Ä It will only generate or pump at €60 if the reservoir level is forced to increase or fall over the day (due to end of day targets) of if some other constraint applies to it.
Ä Total gain over day at the shadow price is €1000Ä But this is based on the shadow prices over the optimisation horizonÄ Actually settled on SMP prices, and only settled for first 24 hours.Ä A pump storage unit may under-recover or over-recover the pumping costs
it incurs in a Trading Day (depending on when it pumps, when it generates, and the differences between the SMP and shadow prices).Price
€100
€60
€40Pump at 50 MWh for 1 hour, raise reservoir by 25 MWh(Cost = €2,000)
Do nothing
Generate at 50 MWhfor 1 hour, lower reservoir by 50 MWh
(Gain = €5,000) Do nothing
Pump at 50 MWh for 1 hour, raise reservoir by 25 MWh(Cost = €2,000)
Market Processes: Bid to Bill March 2007
79
Click to edit Master title style
2. Energy Payments and Charges
3. Capacity Payments and Charges
1. Introduction
5. Payment Timeline
4. Market Operator Charges
A. BID SECTION
B. SETTLEMENT SECTION

Market Processes: Bid to Bill March 2007
80
Click to edit Master title styleSettlements Data Inputs
Single MarketOperator
Meter DataProvider
System Operator
Settlement
System
From Ex Post EPUS
SMP & MSQ
Indicative (D+1) Initial (D+4)
Indicative (D+1)
Indicative and Initial (D+1)
Dispatch Quantities
Metered Generation Values
Metered Demand Values
Initial: Gen Values (D+3)Initial: Dem Values (D+ 4WD*)
*WD = Working Days

Market Processes: Bid to Bill March 2007
81
Click to edit Master title styleSettlement Statements and InvoicesÄ Settlement StatementsÄ Issued on the same days as Indicative and Initial Settlement RunsÄ Issued electronicallyÄ Has settlement data by Trading Period by Generating Unit / Supplier UnitÄ Most of the details shown in our example are at the level of detail that
would appear on Settlement StatementsÄ Sign convention for payments and charges on Settlement Statements
Ä A positive number is a positive payment to a participant by the SMO while a negative number is a positive payment by a participant to the SMO.
Ä InvoicesÄ Issued less frequently, at the end of each Billing PeriodÄ Different types of invoices for different payments/chargesÄ Issued electronically and by mailÄ Has aggregate total data for the Billing Period for all Generating Units and
(on separate invoices) for all Supplier UnitsÄ Sign convention for payments and charges on Invoices
Ä The reverse of Settlement Statements. A positive number is an amount owed to the SMO while a negative number is an amount owed by the SMO.)

Market Processes: Bid to Bill March 2007
82
Click to edit Master title styleKey Simplifications
Ä Transmission Loss Adjustment FactorsÄ To keep things simple, these are all assumed to have values of 1.0
Ä Settlement ReallocationÄ One participant can re-allocate its settlement obligations to another
participant. This option is ignored
Ä Simplified representation of Trading SitesÄ We ignore of complexities associated with Trading Sites
Ä Smaller set of Generating Units and Supplier UnitsÄ In examples we only consider Generator Units 1 & 2 and Supplier Units 1 & 2Ä All diagrams of invoices show Generator Unit 1 data or Supplier Unit 1 data,
depending on the type of invoice.
Ä Where we use values not shown in the earlier scheduling examples, the numbers used are entirely made up and should NOT be viewed as representative of real values that might arise in the market.
Market Processes: Bid to Bill March 2007
83
Click to edit Master title style
2. Energy Payments and Charges
3. Capacity Payments and Charges
1. Introduction
5. Payment Timeline
4. Market Operator Charges
A. BID SECTION
B. SETTLEMENT SECTION

Market Processes: Bid to Bill March 2007
84
Click to edit Master title styleEnergy Settlement TimelineTiming of Indicative, Initial and Revised Settlement for a Billing Period
§ A Settlement Day is calendar day which includes the last 6 hours of one Trading Day and the first 18 hours of the next.
§ Indicative Settlement occurs 1 Working Day after the Settlement Day
§ Initial Settlement occurs 5 Working Days after the Settlement Day
§ A Billing Period is one weekSun 4 Nov 2007
Mon 5 Nov 2007
Tue 6 Nov 2007
Wed 7 Nov 2007
Thu 8 Nov 2007
Fri 9 Nov 2007
Sat 10 Nov 2007
Sun 11 Nov 2007
Mon 12 Nov 2007
Tue 13 Nov 2007
Wed 14 Nov 2007
Thu 15 Nov 2007
Fri 16 Nov 2007
SUN MON TUE WED THU FRI SAT
SUN MON TUE WED THU FRISAT
SUN MON TUE WED THU FRISAT
Initial Settlement
Revised Settlement
Revised Settlement
Billing Period OneSettlement Days
Indicative Settlement
Issue Initial Invoice Billing Period One
Four Months
Thirteen Months

Market Processes: Bid to Bill March 2007
85
Click to edit Master title styleAn Example Generator Energy Invoice

Market Processes: Bid to Bill March 2007
86
Click to edit Master title styleAn Example Supplier Energy Invoice
Market Processes: Bid to Bill March 2007
87
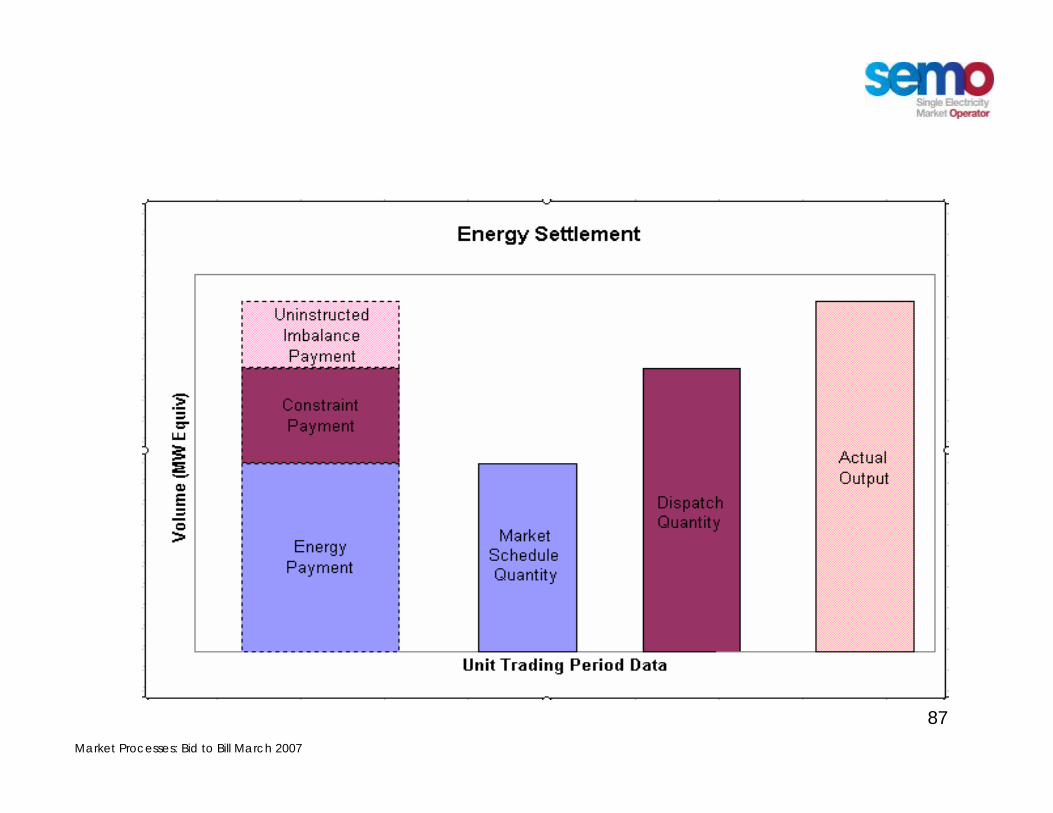
Click to edit Master title styleThe Basics of Generator Payments

Market Processes: Bid to Bill March 2007
88
Click to edit Master title styleAnother Permutation of Generator Energy SettlementThe purpose of this slide is to show that there are many permutations as to how Energy Payments, Constraint Payments and Uninstructed Imbalance Payments can interact.

Market Processes: Bid to Bill March 2007
89
Click to edit Master title styleGenerator Energy Payments

Market Processes: Bid to Bill March 2007
90
Click to edit Master title styleGenerator Energy Payments for Units 1 & 2
9,372.22 1,500.00 600.00 2
13,388.89 6,250.00 1,930.00 1
Period 3 (€)
Period 2 (€)
Period 1(€)Unit
€20/MWhSMP193 MWMSQPeriod 1UNIT 1
€50/MWhSMP60 MWMSQPeriod 2UNIT 2
Energy Payment = 0.5 x Market Schedule Quantity x System Marginal Price
The factor of 0.5 converts the Market Schedule Quantity from MW to MWh
Market Processes: Bid to Bill March 2007
91
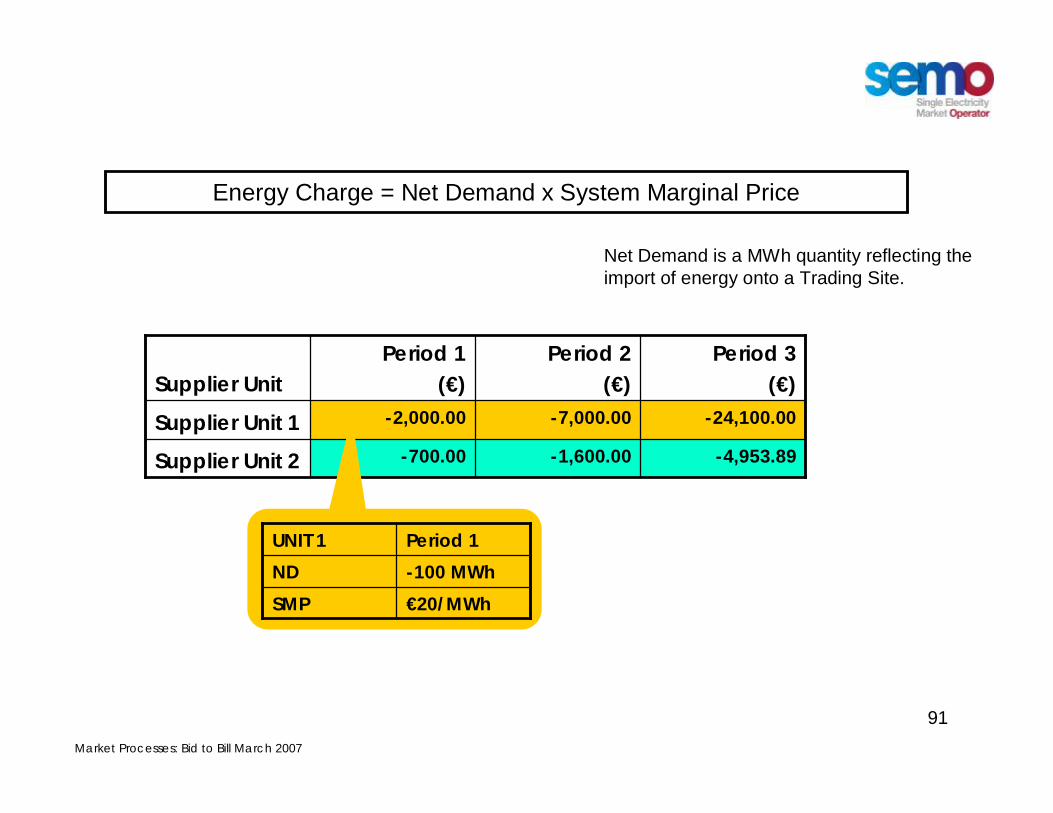
Click to edit Master title styleSupplier Energy Charges for Supplier Units 1 & 2
-4,953.89 -1,600.00 -700.00 Supplier Unit 2
-24,100.00 -7,000.00 -2,000.00 Supplier Unit 1
Period 3 (€)
Period 2 (€)
Period 1(€)Supplier Unit
€20/MWhSMP-100 MWhNDPeriod 1UNIT 1
Energy Charge = Net Demand x System Marginal Price
Net Demand is a MWh quantity reflecting the import of energy onto a Trading Site.

Market Processes: Bid to Bill March 2007
92
Click to edit Master title styleGenerator Constraint Payments
Constraint Payments
DispatchQuantity
Market Processes: Bid to Bill March 2007
93
Click to edit Master title styleGenerator Constraint Payments
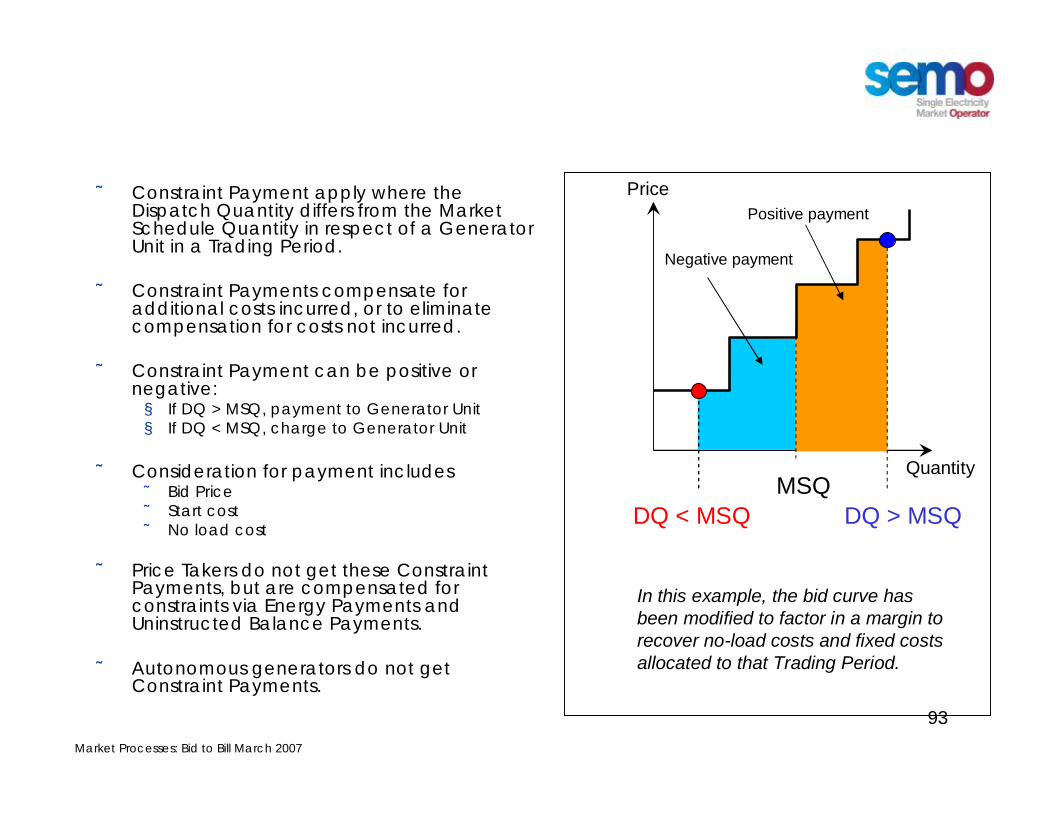
Ä Constraint Payment apply where the Dispatch Quantity differs from the Market Schedule Quantity in respect of a Generator Unit in a Trading Period.
Ä Constraint Payments compensate for additional costs incurred, or to eliminate compensation for costs not incurred.
Ä Constraint Payment can be positive or negative:§ If DQ > MSQ, payment to Generator Unit§ If DQ < MSQ, charge to Generator Unit
Ä Consideration for payment includes Ä Bid PriceÄ Start costÄ No load cost
Ä Price Takers do not get these Constraint Payments, but are compensated for constraints via Energy Payments and Uninstructed Balance Payments.
Ä Autonomous generators do not get Constraint Payments.
MSQ
In this example, the bid curve has been modified to factor in a margin to recover no-load costs and fixed costs allocated to that Trading Period.
Price
Quantity
Negative payment
Positive payment
DQ < MSQ DQ > MSQ

Market Processes: Bid to Bill March 2007
94
Click to edit Master title styleGenerator Constraint Payments for Units 1 & 2
-250.00 --2- 2,000.00 - 570.00 10.00 1
Period 3 (€)
Period 2(€)
Period 1(€)Unit
120 MWDQ140 MWMSQPeriod 3UNIT 2
60 MWDQ60 MWMSQPeriod 1UNIT 2
194 MWDQ193 MWMSQPeriod 1UNIT 1
Here we just show the volume difference. To determine the results shown it is necessary to consider the bid curve relative to the quantities shown for each period.

Market Processes: Bid to Bill March 2007
95
Click to edit Master title styleGenerator Uninstructed Imbalance Payment
Uninstructed Imbalances

Market Processes: Bid to Bill March 2007
96
Click to edit Master title styleThe Concept: Uninstructed Imbalance Payments
Ä If the Actual Output (meter data) of a Generator Unit differs from the Dispatch Quantity then an Uninstructed Imbalance Payment (UNIMP) will be calculated.
Ä Value of UNIMP depends on the variation between the Actual Output and the Dispatch Quantity, and whether that variation is within the Tolerance Bands.
Ä The tolerance varies by Trading Period and Generating Unit based on Generating Unit characteristics and the state of the power system at that time.
Time
Quantity
Period 1 Period 2 Period 3
Actual Output
Dispatch Quantity
Tolerance Range
Uninstructed Imbalance Payments

Market Processes: Bid to Bill March 2007
97
Click to edit Master title styleThe Concept: Uninstructed Imbalance Payments
Ä The value of the Uninstructed Imbalance Payment is determined for each Trading Period and varies depending on whether the deviation is inside or outside the tolerance, or up or down.
Ä Uninstructed imbalances apply to Price Makers and Price Takers (relative to their nominations) but not Autonomous Generators.
Actual Output minusDispatch Schedule
Tolerance for Over Generation
Tolerance for Under Generation
0
Payment based on deviation multiplied by Min(SMP, bid price)
Additional payment based on additional deviation multiplied by Min(SMP, bid price) multiplied by a factor < 1.
Payment based on deviation multiplied by Max (SMP, bid price)
Additional payment based on additional deviation multiplied by Max (SMP, bid price)multiplied by a factor > 1
PaymentPositive DeviationNegative Deviation
For pumped storageUnits SMP is used as they have no bid prices.

Market Processes: Bid to Bill March 2007
98
Click to edit Master title styleUninstructed Imbalances Unit 1
-€669.450-€100Payment within Tolerance Range000Payment beyond Tolerance Range
(assuming a factor of 1.04)
-5 MWh0 MWh-5 MWhDeviation Quantity (MWh)
UnderNeither Under Over or Under Generation?
181.6193.5175.7Lower Tolerance Limit
202214.5195.9Upper Tolerance Limit
2.02.51.9Tolerance for Over Generation (TOLOG)-18.4 -18.5 -18.3 Tolerance for Under Generation (TOLUG)
€133.89/MWhN/A€20/MWhMax (SMP, Bid Price)
-€669.450-€100Imbalance Payment
-10 MW0 MW -10 MW Deviation Quantity (MW)
190212184Actual Quantity
200212194Dispatch Schedule Quantity
Period 3Period 2Period 1

Market Processes: Bid to Bill March 2007
99
Click to edit Master title styleUninstructed Imbalances Unit 2
€17.7€0€10Payment within Tolerance Range€25/MWhN/A€20/MWhMin (SMP, Bid Price)
5 MWh0 MWh5 MWhDeviation Quantity (MWh)
OverNeither Over Over or Under Generation?
107.948.148.1Lower Tolerance Limit
121.461.061.0Upper Tolerance Limit
1.41.01.0Tolerance for Over Generation (TOLOG)-12.1 -11.9 -11.9 Tolerance for Under Generation (TOLUG)
€103.2€0€86.4Payment beyond Tolerance Range(assuming a factor of 0.96)
€120.9€0€96.4Imbalance Payment
10 MW0 MW 10 MW Deviation Quantity (MW)
1306070Actual Quantity
1206060Dispatch Schedule Quantity
Period 3Period 2Period 1

Market Processes: Bid to Bill March 2007
100
Click to edit Master title styleGenerator Uninstructed Imbalance
Payments for Units 1 & 2
120.9 -96.4 2
-669.45 --100 1
Period 3 (€)
Period 2 (€)
Period 1(€)Generator Unit

Market Processes: Bid to Bill March 2007
101
Click to edit Master title styleGenerator Make Whole Payments for Units 1 & 2
Ä What is a Make Whole Payment?Ä A payment made to a Generator if, across a Billing Period, the total Energy
Payment to that generator is less than its scheduled production costs.Ä The scheduled production cost is based on:
Ä The Price-Quantity Pairs, Ä Start Costs Ä No-Load CostsÄ Market Schedule Quantities
Ä It is not available to Pumped Storage Generator Units (which do not bid) or to Price Taker and Autonomous Generator Units
Ä In this example we assume that the Generator Make Whole Payments are zero.
02
01
Billing Period(€)Generator Unit

Market Processes: Bid to Bill March 2007
102
Click to edit Master title styleSupplier Imperfection Charges
for Supplier Units 1 & 2
Ä Charge levied on suppliers to recover Constraint Payments, Uninstructed Imbalance Payments and Make Whole Payments.
Ä The Imperfections Price is a charge per MWh estimated in advance of each year.
-92.50 -80.00 -87.50 Supplier Unit 2
-450.00 -350.00 -250.00 Supplier Unit 1
Period 3 (€)
Period 2 (€)
Period 1(€)Supplier Unit
€2.50/MWhImperf. Price-100MWhNDPeriod 1UNIT 1
Imperfections Charge = Net Demand x Imperfections Price

Market Processes: Bid to Bill March 2007
103
Click to edit Master title styleAn Example Generator Energy Invoice

Market Processes: Bid to Bill March 2007
104
Click to edit Master title style
2. Energy Payments and Charges
3. Capacity Payments and Charges
1. Introduction
5. Payment Timeline
4. Market Operator Charges
A. BID SECTION
B. SETTLEMENT SECTION

Market Processes: Bid to Bill March 2007
105
Click to edit Master title styleCapacity Payments
Ä Spare Capacity is required to ensure the reliable operation of the SEM. Ä Capacity Payments are made to Generator Units for the supply of
generation availability.
Ä The mechanism provides short to medium signals to existing participants so that they can optimise their availability based where it is needed most
Ä Capacity Payments also provide a degree of financial certainty for participants, thus encouraging and facilitating new investment.
Ä Capacity market is settlement is on a calendar month basis.

Market Processes: Bid to Bill March 2007
106
Click to edit Master title styleGenerator Capacity Payment Invoice
Market Processes: Bid to Bill March 2007
107
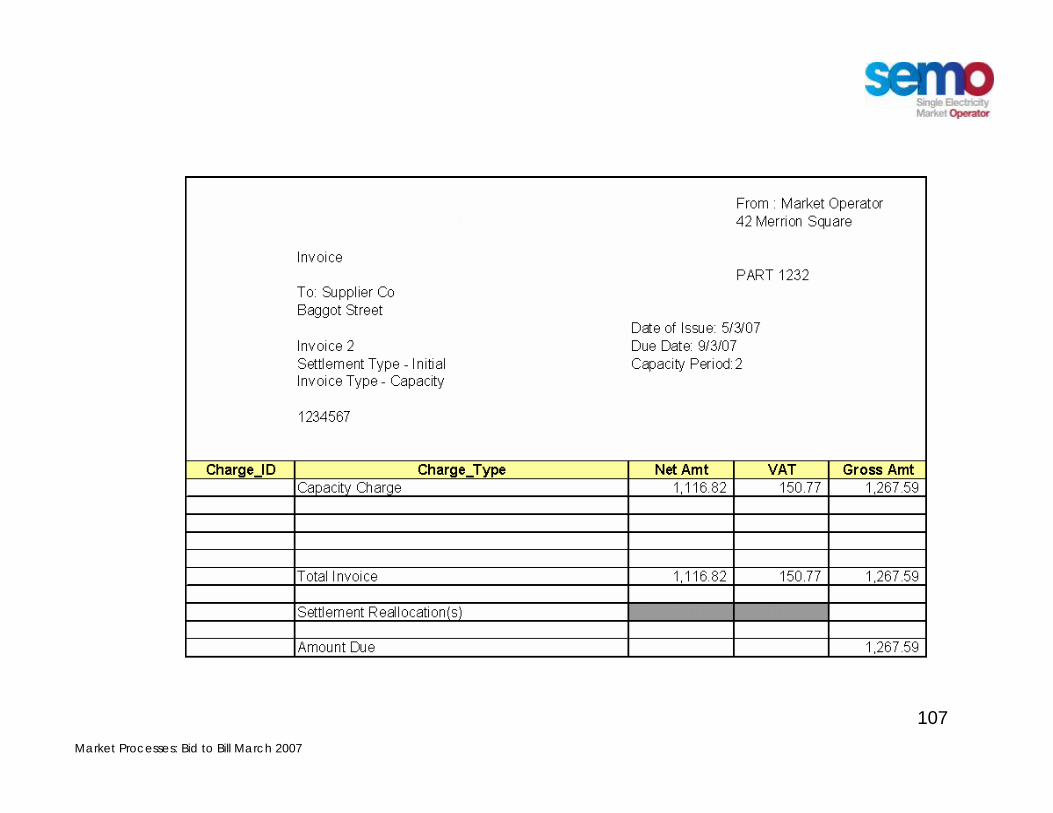
Click to edit Master title styleSupplier Capacity Charge Invoice

Market Processes: Bid to Bill March 2007
108
Click to edit Master title styleCapacity Payment Mechanism
Jan Feb Mar Apr May Jun Jul Aug Sep Oct Nov Dec
Annual Capacity Payment Sum
€3,900,000
Ä Annual Capacity Payment Sum is broken down into 12 Capacity Period Payment Sums
€400
,000
€450
,000
€350
,000
€300
,000
€250
,000
€200
,000
€200
,000
€250
,000
€300
,000
€350
,000
€400
,000
€450
,000

Market Processes: Bid to Bill March 2007
109
Click to edit Master title styleCapacity Payment Mechanism
February
Capacity Period Payment Sum
€400,000
Fixed Payment Sum
€160,000
Variable Payment Sum
€120,000
Ex Post Payment Sum
€120,000
Fixed Capacity Payment Proportion
E.g. 40%
Ex Post Payment Proportion
E.g. 30%
Variable Capacity Payment Proportion
E.g. 30%

Market Processes: Bid to Bill March 2007
110
Click to edit Master title styleCapacity Payment Mechanism
Fixed Payment Sum
€160,000
Variable Payment Sum
€120,000
Ex Post Payment Sum
€120,000
Ex Post Price
€0.34/MWh
Fixed Price€0.33/MWh
Ex Ante Price
€0.44/MWh
Year ahead Load Forecast
Ex-Ante Loss of Load Probability
Ex-Post Loss of Load Probability
Monthly values
These prices vary by
Trading Period
Eligible Availability
Conceptually, each component is determined in the same way - the fixed amount for the month is converted into a per MWh payment based on the Eligible Availability in the system and the “factor” for each Trading Period relative to the sum over the month of those “factors”. The three approaches use different “factors” – year ahead forecast Trading Period demand or loss of load probabilities.

Market Processes: Bid to Bill March 2007
111
Click to edit Master title styleGenerator Capacity Payments
Generation Payment
• For each Trading Period
Ø Aggregate the component prices to the Capacity Payment Generation Price (CPGP).
Ø Apply the Price to the Eligible Availability for each Generator Unit to calculate the Capacity Payment.
Capacity Payment Generation Price
€1.11/MWh
Ex Post Price
€0.34/MWh
Fixed Price€0.33/MWh
Ex Ante Price
€0.44/MWh
Each month the sum of the Capacity Payments equals the Capacity Period Payment Sum for that month.
These prices vary by
Trading Period

Market Processes: Bid to Bill March 2007
112
Click to edit Master title styleEligible Availability for Units 1 & 2
ÄMethodologyÄ For most units (e.g. Unit 1)
Ä Eligible Availability equals its ex post availability, i.e. itsAvailability Profile used in the Ex Post UUC Calculation
Ä Special rules for Energy Limited Generator Units (e.g. Unit 2)Ä Simplistically, the lesser of the Market Schedule Quantity
and its Availability Profile is used.Ä The actual methodology is more complicated.
200250250Eligible Availability (Unit 1)200200200
Availability Profile (Unit 2)
1406060Eligible Availability (Unit 2)
1406060Market Schedule Quantity (Unit 2)
200250250Availability Profile (Unit 1)
Period 3 (MW)
Period 2 (MW)
Period 1(MW)

Market Processes: Bid to Bill March 2007
113
Click to edit Master title styleGenerator Capacity Payments for Units 1 & 2
102.58 34.39 33.29 2
146.54 143.29 138.67 1
Period 3 (€)
Period 2 (€)
Period 1(€)Unit
€1.11/MWhCPGP250 MWEAPeriod 1UNIT 1
€1.47 /MWhCPGP140 MWEAPeriod 3UNIT 2
Capacity Payment = 0.5 x Eligible Availability x Capacity Payment Generation Price
The factor of 0.5 converts the Eligible Availability from MW to MWh

Market Processes: Bid to Bill March 2007
114
Click to edit Master title styleSupplier Capacity Charges
Capacity Period
Demand Price€1.88/MWh
Supplier Charge
Year ahead Load Forecast
FebruaryCapacity Period
Payment Sum€400,000
Ø Capacity Charges are levied on Supplier Units to fund Capacity Payments made to Generator Units.
Ø The Capacity Charge amount per Trading Period is based on the Annual Forecast Demand
Each month the sum of the Capacity Charges equals the Capacity Period Payment Sum for that month.

Market Processes: Bid to Bill March 2007
115
Click to edit Master title styleSupplier Capacity Charges
for Supplier Units 1 & 2
-133.44 -63.72 -66.11 Supplier Unit 2
-649.18 -278.77 -188.87 Supplier Unit 1
Period 3 (€)
Period 2 (€)
Period 1(€)Supplier Unit
€1.88/MWhCPDP-100 MWhNDPeriod 1 UNIT 1
€3.60/MWhCPDP-37 MWhNDPeriodUNIT 2
Capacity Charge = Net Demand x Capacity Period Demand Price

Market Processes: Bid to Bill March 2007
116
Click to edit Master title style
Annual Capacity Payment Sum
Capacity Period Pot
(CP1)
Capacity Period Pot
(CP2)
Capacity Period Pot
(CP11)
Capacity Period Pot
(CP12)
Generation Payment
Ex Post Price
Fixed Payment Sum
Ex Ante Payment Sum
Ex Post Payment Sum
Fixed Price
Ex Ante Price
Demand Price
Supplier Charge
Ex-post Loss of Load Probability
Ex-ante Loss of Load Probability
Annual Load Forecast
Annual Load Forecast
Capacity Payments Mechanism
Market Processes: Bid to Bill March 2007
117
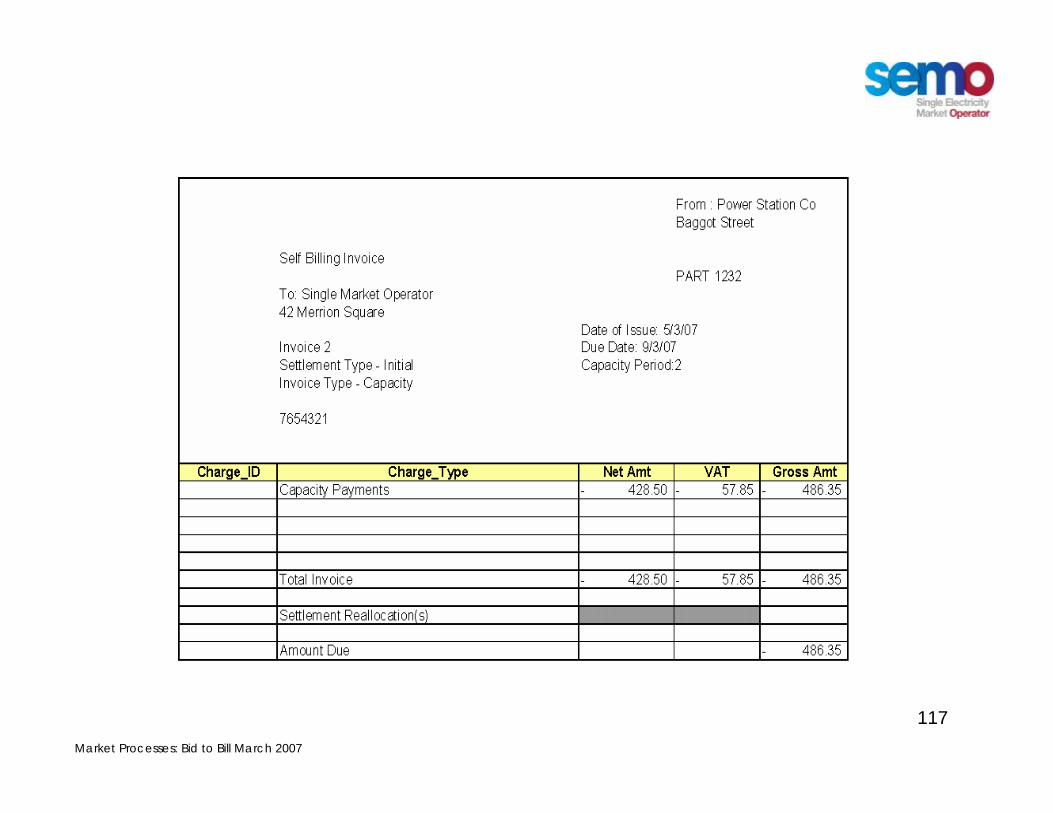
Click to edit Master title styleGenerator Capacity Payment Invoice

Market Processes: Bid to Bill March 2007
118
Click to edit Master title styleSupplier Capacity Charge Invoice
From : Market Operator42 Merrion Square
InvoicePART 1232
To: Supplier CoBaggot Street
Date of Issue: 5/3/07 Invoice 2 Due Date: 9/3/07Settlement Type - Initial
1234567
Charge_ID Charge_Type Net Amt VAT Gross AmtCapacity Charge 1,116.82 150.77 1,267.59
Total Invoice 1,116.82 150.77 1,267.59
Settlement Reallocation(s)
Amount Due 1,267.59
Capacity Period:2Invoice Type - Capacity

Market Processes: Bid to Bill March 2007
119
Click to edit Master title style
2. Energy Payments and Charges
3. Capacity Payments and Charges
1. Introduction
5. Payment Timeline
4. Market Operator Charges
A. BID SECTION
B. SETTLEMENT SECTION

Market Processes: Bid to Bill March 2007
120
Click to edit Master title styleSupplier Market Operator Charge Invoice
From : Market Operator42 Merrion Square
InvoicePART 1232
To: Supplier CoBaggot Street
Date of Issue: 23/2/07 Invoice 12 Due Date: 1/3/07Settlement Type - Initial
1234567
Charge_ID Charge_Type Net Amt VAT Gross AmtVariable Market Operator Charge 126.00 17.01 143.01
Total Invoice 126.00 17.01 143.01
Settlement Reallocation(s)
Amount Due 143.01
Billing Period: 7Invoice Type - Market Operator Charge

Market Processes: Bid to Bill March 2007
121
Click to edit Master title styleMarket Operator Charges
Ä Market Operator Charges recover the costs of operating the SMO.
Ä The Fixed Market Operator Charge is levied as an annual fee for all Generating Units and all Supplier Units. Ä It is effectively a membership fee. Ä This fee is ignored in this example.
Ä The Variable Market Operator Charge is a rate per MWh that is fixed annually.
Ä The Variable Market Operator Charge is prepared weekly and billed only to Supplier Units.

Market Processes: Bid to Bill March 2007
122
Click to edit Master title style
-11.10 -9.60 -10.50 Supplier Unit 2
-54.00 -42.00 -30.00 Supplier Unit 1
Period 3 (€)
Period 2 (€)
Period 1(€)Supplier Unit
Supplier Variable Market Operator Charges for Supplier Units 1 & 2
€0.30/MWhVMOP-100MWhNDPeriod 1Unit 1
Variable Market Operator Charge = Net Demand x Variable Market Operator Price

Market Processes: Bid to Bill March 2007
123
Click to edit Master title styleSupplier Market Operator Charge Invoice

Market Processes: Bid to Bill March 2007
124
Click to edit Master title style
2. Energy Payments and Charges
3. Capacity Payments and Charges
1. Introduction
5. Payment Timeline
4. Market Operator Charges
A. BID SECTION
B. SETTLEMENT SECTION

Market Processes: Bid to Bill March 2007
125
Click to edit Master title stylePayment Timeline
Time from the end of applicable Billing Period
(Energy) or Capacity Period (Capacity)
Issue of Invoices
Payment of Supplier Invoices
Payment of
Generator Invoices
Five Working
Days after completion of period
Eight Working
Days after completion of period
Nine Working
Days after completion of period

Market Processes: Bid to Bill March 2007
126
Click to edit Master title styleTrading Sites
Ä A “Trading Site” is a device for correctly netting energy and capacity payments when there are both generation and load at the same site.
Ä With generation & load at the same site then the final settlement position will be:Ä Energy payments are based on the NET generation.Ä Constraint payments and uninstructed imbalances are based on the GROSS generation while
Imperfection Charge are on GROSS LOAD.Ä Capacity payments are based on the NET generation.Ä Variable Operators Charge on GROSS load.
Ä The Generator Units are registered by the Market Participant at that Trading Site.Ä There can be only one Supplier Unit at a Trading Site:
Ä The example on the next slide assumes this is registered to the registered participant for the Trading Site (i.e. A Trading Site Supplier Unit)
Ä Alternatively, it could be registered to another participant (an Associated Supplier Unit) in which case the Netting Generator Unit has a zero quantity for the Trading Site participant.
Ä The Netting Generator Unit is a virtual unit, registered by the SMO on behalf of the Market Participant at that Trading Site.
Generator Units Netting Generator Unit Supplier Unit
T R A D I N G S I T E

Market Processes: Bid to Bill March 2007
127
Click to edit Master title styleTrading Sites
Ä Meter Data and MSQ for the Netting Generator Unit is negative of the lesser of:Ä The absolute value of the total metered values for the Generator Units.Ä The absolute value of the total metered values for the Supplier Units.
Ä Energy and Capacity Payments are based on Generator Unit MSQ’s and the Netting Generator (which is a negative number)
Ä Energy and Capacity Charges are based on Supplier Unit MSQ’s less Netting Generator Unit output (which is a negative number)
Ä Other settlement terms are still settled on a gross basis.
Generator Units Netting Generator Unit Supplier Units
T R A D I N G S I T E
-40-50-60Netting Generator Unit Energy/Capacity Payment MW (C)00+40Net Energy/Capacity Payment MW (A+ C)0
+40
-40-40
+40
-50-60Netting Generator Unit MW (C = -Min(¦A¦,¦B¦))+50+100Generator Unit Energy/Capacity Payment MW (A)
-300Supplier Unit Energy/Capacity Charge MW (B – C)
-80-60Supplier Unit MW (B)
+50+100Generator Unit MW (A)


![Engineering Drawing Course [Semo] FilMood](https://img.pdfslide.us/doc/110x75/577d35271a28ab3a6b8fae43/engineering-drawing-course-semo-filmood.jpg)