Embed Size (px)
Citation preview
July 2001 Zanjan, Iran 1
Atmospheric Profilers
Marc Sarazin(European Southern Observatory)
July 2001 Zanjan, Iran 2
List of Themes
How to find the ideal site...and keep it good?
• Optical Propagation through Turbulence– Mechanical and Thermal– Index of Refraction– Signature on ground based observations– Correction methods
• Integral Monitoring Techniques– Seeing Monitoring– Scintillation Monitoring
• Profiling Techniques– Microthermal Sensors– Scintillation Ranging
• Modelling Techniques
Outline
• Why do we need turbulence profiles?
• Microthermal sensing
• Sound back scattering
• Scintillation
• Mesoscale modeling
July 2001 Zanjan, Iran 4
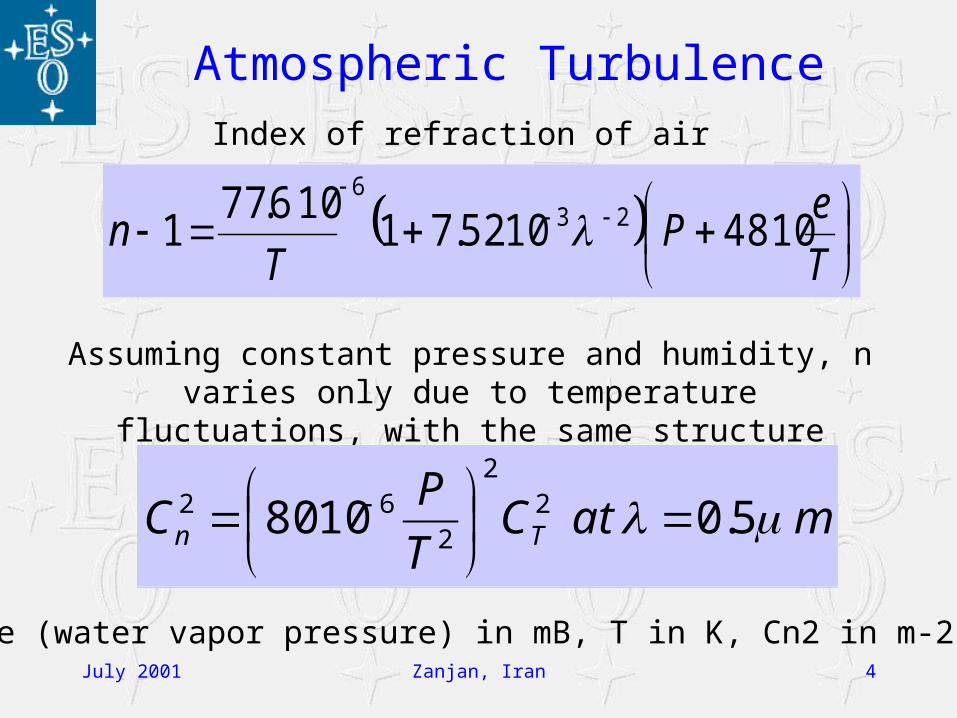
Index of refraction of air
Assuming constant pressure and humidity, n varies only due to temperature fluctuations, with the same structure function
matCT
PC Tn 5.01080 2
2
262
T
eP
Tn 48101052.71
106.771 23
6
Atmospheric Turbulence
P,e (water vapor pressure) in mB, T in K, Cn2 in m-2/3
July 2001 Zanjan, Iran 5
Turbulence Profilers
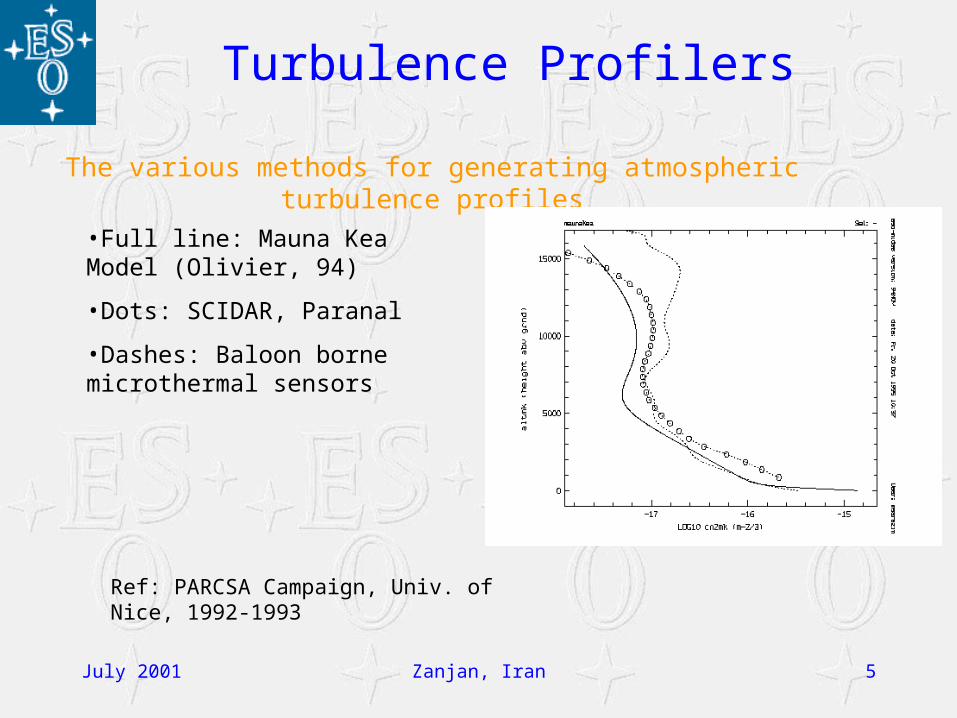
Ref: PARCSA Campaign, Univ. of Nice, 1992-1993
The various methods for generating atmospheric turbulence profiles
•Full line: Mauna Kea Model (Olivier, 94)
•Dots: SCIDAR, Paranal
•Dashes: Baloon borne microthermal sensors
July 2001 Zanjan, Iran 6
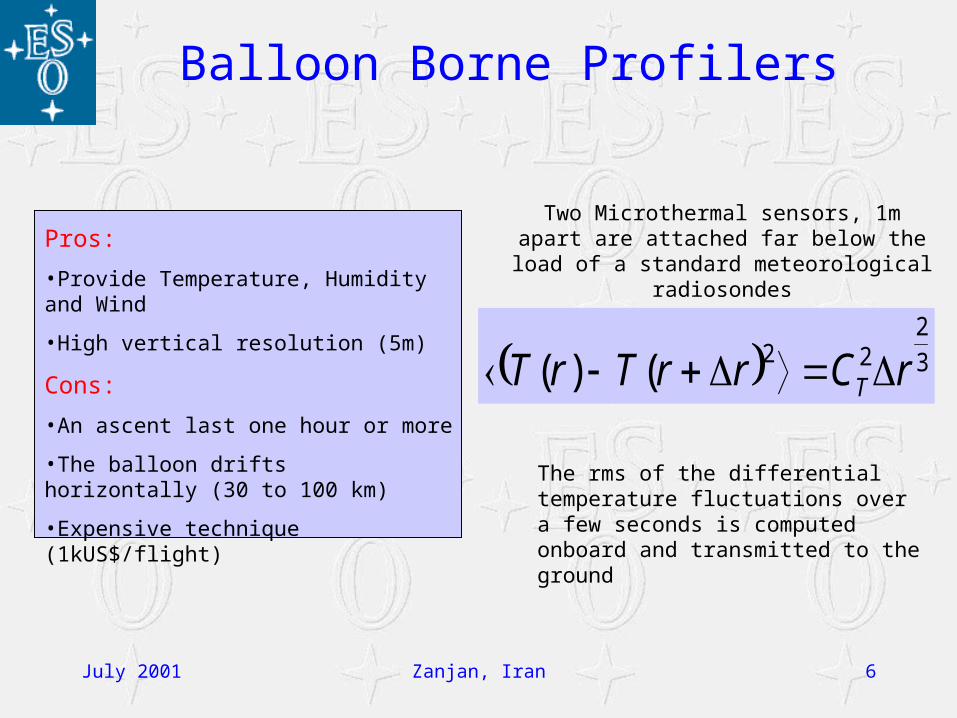
Balloon Borne Profilers
Two Microthermal sensors, 1m apart are attached far below the load of a standard meteorological
radiosondesPros:
•Provide Temperature, Humidity and Wind
•High vertical resolution (5m)
Cons:
•An ascent last one hour or more
•The balloon drifts horizontally (30 to 100 km)
•Expensive technique (1kUS$/flight)
3
222()( rCrrTrT T
The rms of the differential temperature fluctuations over a few seconds is computed onboard and transmitted to the ground
July 2001 Zanjan, Iran 7
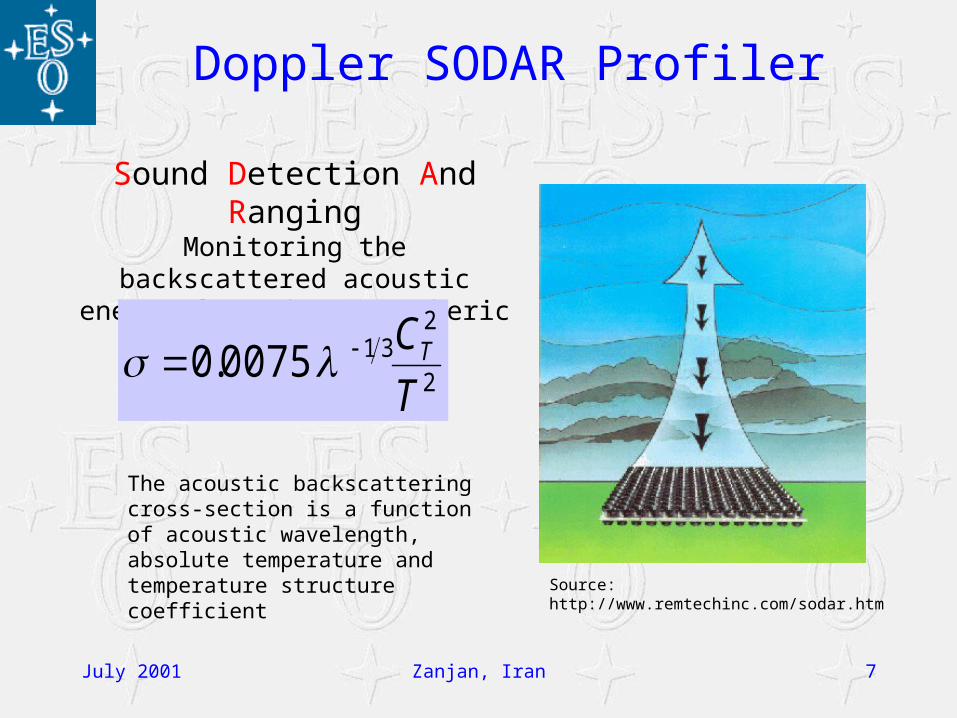
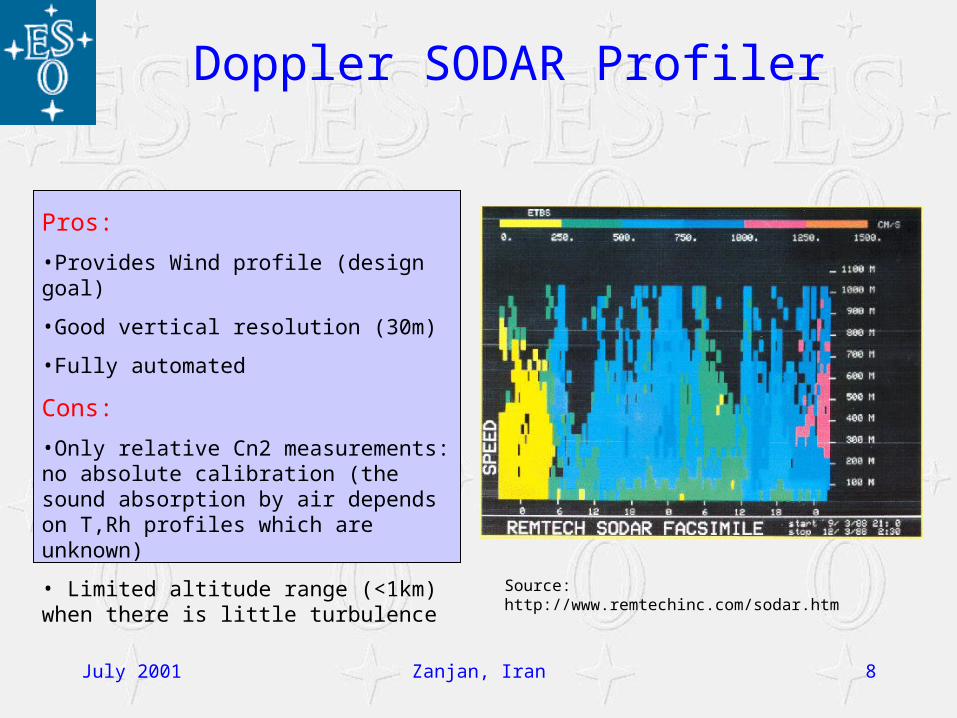
Doppler SODAR Profiler
Source: http://www.remtechinc.com/sodar.htm
Sound Detection And RangingMonitoring the backscattered acoustic
energy from the atmospheric layers
2
2310075.0T
CT
The acoustic backscattering cross-section is a function of acoustic wavelength, absolute temperature and temperature structure coefficient
July 2001 Zanjan, Iran 8
Doppler SODAR Profiler
Pros:
•Provides Wind profile (design goal)
•Good vertical resolution (30m)
•Fully automated
Cons:
•Only relative Cn2 measurements: no absolute calibration (the sound absorption by air depends on T,Rh profiles which are unknown)
• Limited altitude range (<1km) when there is little turbulence
Source: http://www.remtechinc.com/sodar.htm
July 2001 Zanjan, Iran 9
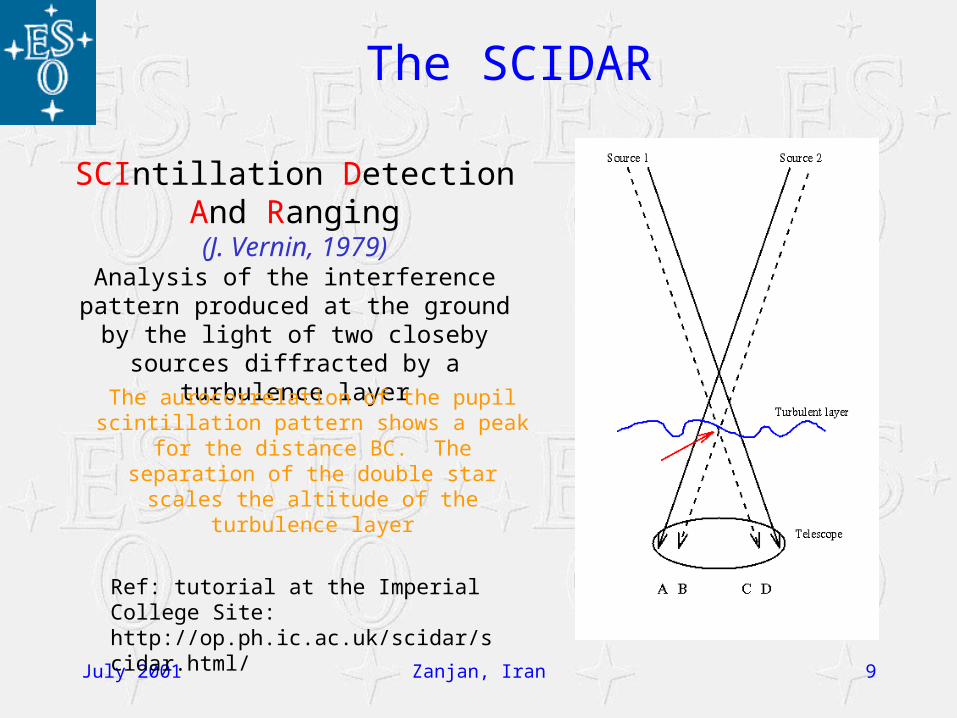
The SCIDAR
Ref: tutorial at the Imperial College Site: http://op.ph.ic.ac.uk/scidar/scidar.html/
SCIntillation Detection And Ranging
(J. Vernin, 1979)Analysis of the interference pattern produced
at the ground by the light of two closeby sources diffracted by a turbulence layer
The aurocorrelation of the pupil scintillation pattern shows a peak for the distance BC. The
separation of the double star scales the altitude of the turbulence layer
July 2001 Zanjan, Iran 10
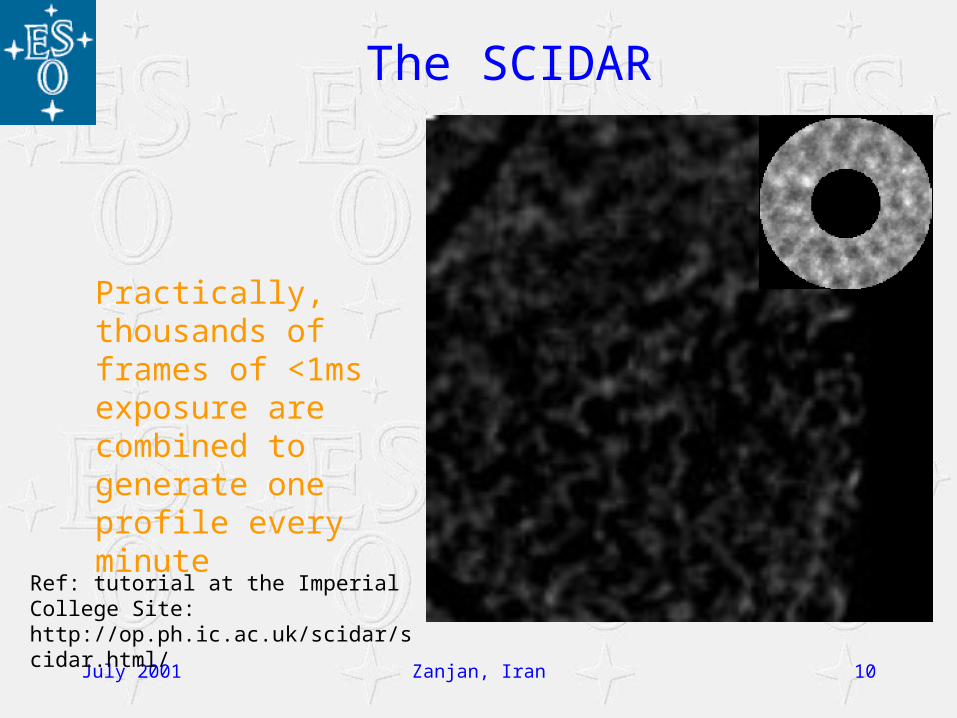
The SCIDAR
Practically, thousands of frames of <1ms exposure are combined to generate one profile every minute
Ref: tutorial at the Imperial College Site: http://op.ph.ic.ac.uk/scidar/scidar.html/

July 2001 Zanjan, Iran 11
The SCIDAR
Source: A. Tokovinin, Study of the SCIDAR concept for Adaptive Optics Applications, ESO-VLT Report TRE-UNI-17416-0003
Optical Setup:
2: focal plane with field stop
3: collimator
4: chromatic filter
5: conjugate pupil plane
6: detector
Detector and pupil plane conjugate are collocated in non generalized mode
July 2001 Zanjan, Iran 12
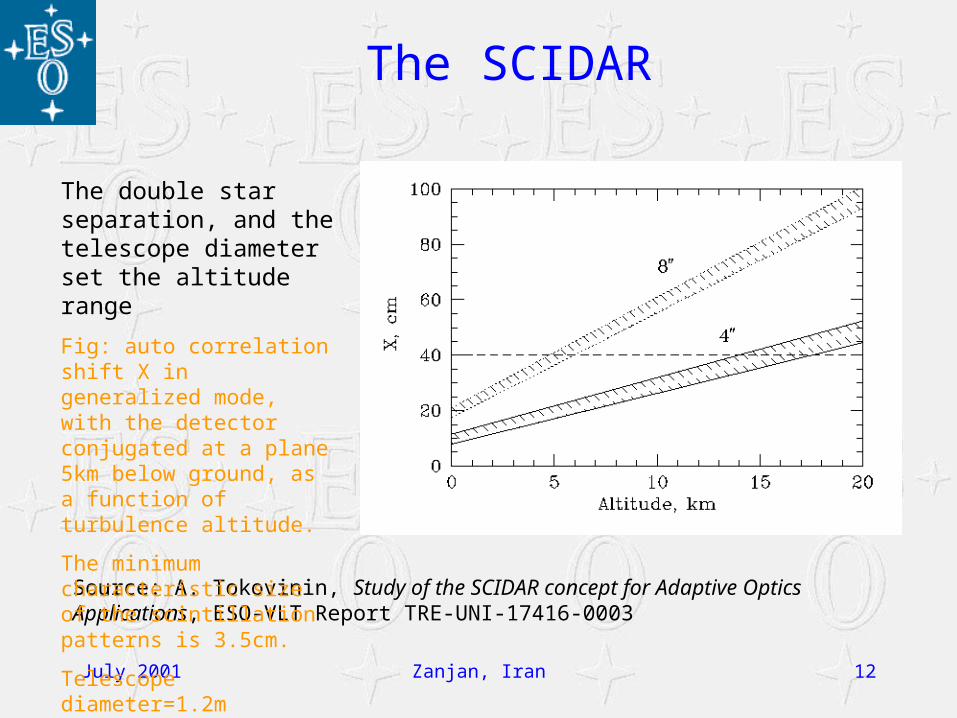
The SCIDAR
Source: A. Tokovinin, Study of the SCIDAR concept for Adaptive Optics Applications, ESO-VLT Report TRE-UNI-17416-0003
The double star separation, and the telescope diameter set the altitude range
Fig: auto correlation shift X in generalized mode, with the detector conjugated at a plane 5km below ground, as a function of turbulence altitude.
The minimum characteristic size of the scintillation patterns is 3.5cm.
Telescope diameter=1.2m Pixel size=2cm
July 2001 Zanjan, Iran 13
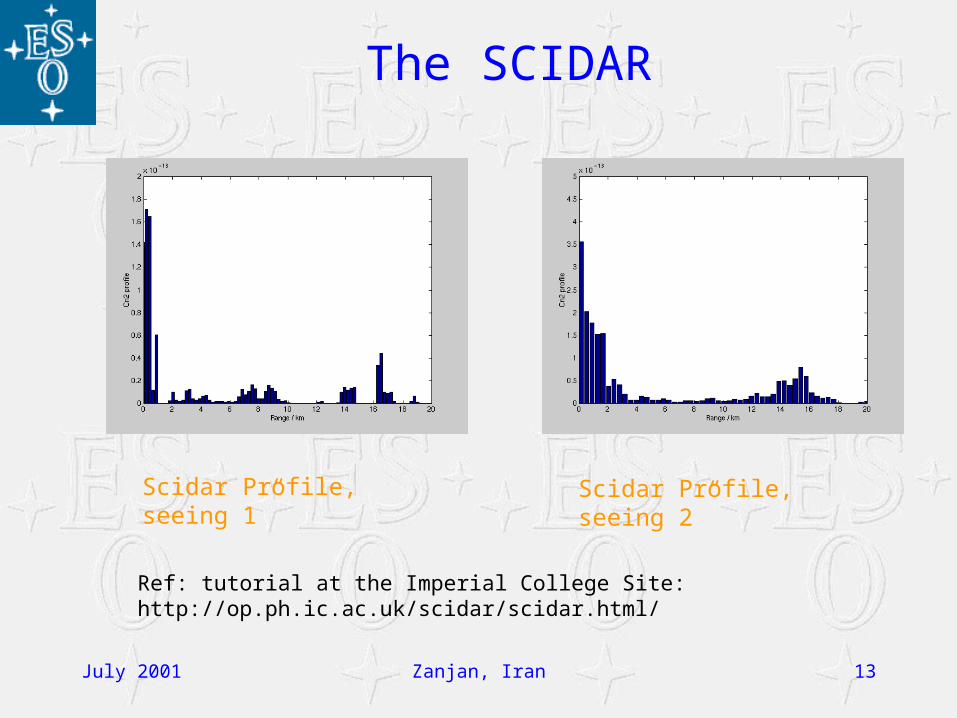
The SCIDAR
Ref: tutorial at the Imperial College Site: http://op.ph.ic.ac.uk/scidar/scidar.html/
Scidar Profile, seeing 1” Scidar Profile, seeing 2”
July 2001 Zanjan, Iran 14
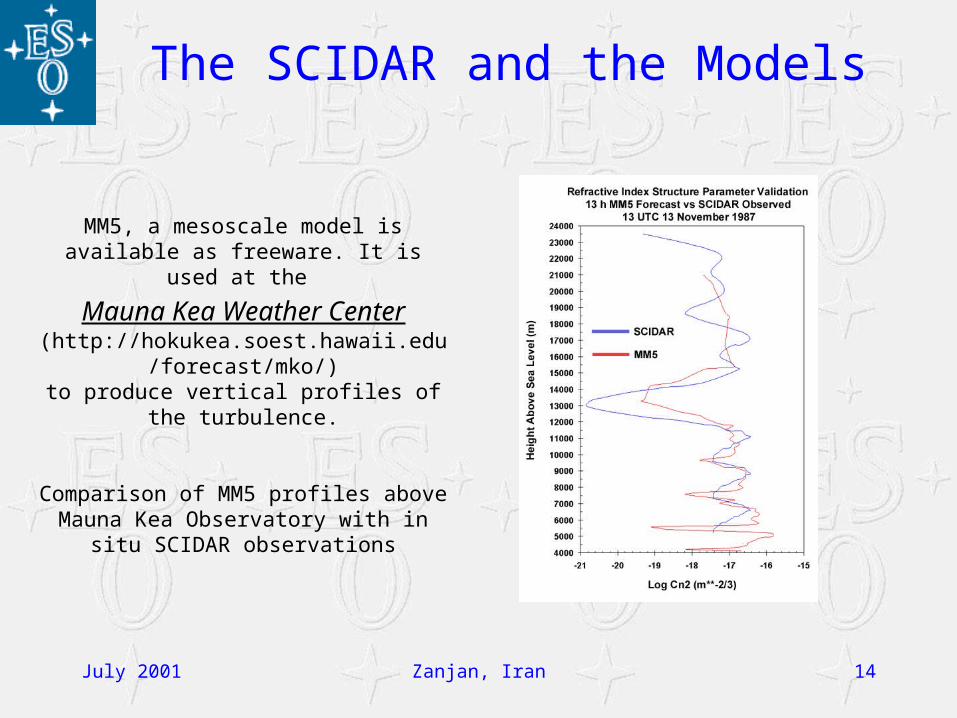
The SCIDAR and the Models
MM5, a mesoscale model is available as freeware. It is used at the
Mauna Kea Weather Center (http://hokukea.soest.hawaii.edu/forecast/mko/)
to produce vertical profiles of the turbulence.
Comparison of MM5 profiles above Mauna Kea Observatory with in situ SCIDAR observations
July 2001 Zanjan, Iran 15
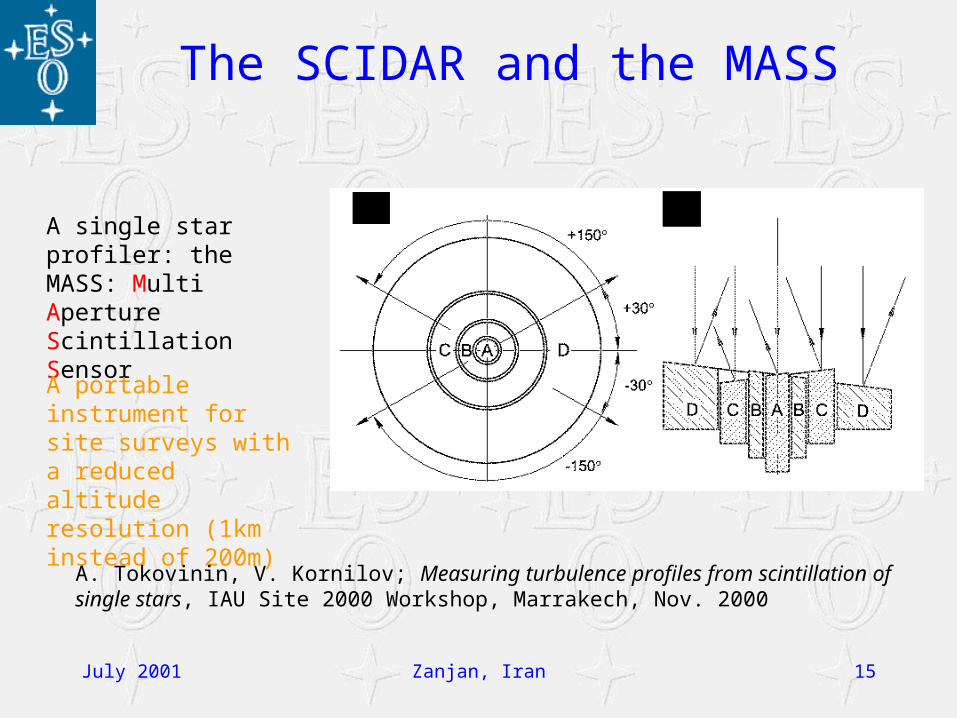
The SCIDAR and the MASS
A single star profiler: the MASS: Multi Aperture Scintillation Sensor
A portable instrument for site surveys with a reduced altitude resolution (1km instead of 200m)
A. Tokovinin, V. Kornilov; Measuring turbulence profiles from scintillation of single stars, IAU Site 2000 Workshop, Marrakech, Nov. 2000