Embed Size (px)
Citation preview

RiversidePublicUtilities.com
UTILITY 2.OR I V E R S I D E P U B L I C U T I L I T I E S
WAT E R I N F R A S T R U C T U R E R O A D M A PJULY 13, 2015

TABLE OF CONTENTS
ROAD MAPS – INFRASTRUCTURE IMPROVEMENT –WATER
Executive SummaryDetails
• System History/Background• System Assessment• Findings
– Infrastructure– Technology– Workforce
• Investment Options• Sample Recommendations

ADVANCED TECHNOLOGIES
WORKFORCE DEVELOPMENT
THRIVING FINANCIALLY
INFRASTRUCTURE IMPROVEMENTEXECUTIVE SUMMARY
ROAD MAPS – INFRASTRUCTURE IMPROVEMENT - WATER

THE PLANSRECYCLED WATER
WATER INFRASTRUCTURE
ELECTRIC INFRASTRUCTURE
FIBER BUSINESS
INTEGRATED WATER
INTEGRATED POWER RESOURCES
RPS POWER IMPLEMENTATION
WORKFORCE DEVELOPMENT
FACILITIES PLAN
TRANSMISSION RELIABILITY
FINANCIAL PRO FORMA - 10 YR
CONSERVATION AND EFFICIENCY
TECHNOLOGY
WATER INFRASTRUCTURE
ROAD MAPS – INFRASTRUCTURE IMPROVEMENT –WATER - GOALS
• Address aging infrastructure.
• Improve system safety and reliability.
• Increase the use of technology to inform future planning and increase conservation.
• Use financial pro forma to strike investment balance.

RiversidePublicUtilities.com
Water Infrastructure Assessment
Water System:• Significant improvement have been made through the CIP process, but areas of criticality
remain. • Significant pipeline replacement needed.Technology:• Leverage technology to realize increased efficiency and effectiveness.• Improve SCADA and network communication to further enhance security.Workforce:• Workforce needs training to have Utility 2.0 skill sets.• Knowledge transfer needed for aging workforce.Financials: • Strong Financial Position• Continue efficiency improvements

RiversidePublicUtilities.com
Infrastructure AssessmentAsset Criticality Last 10 Years Status Next 10 Years
Wells $20 Million On target $21-$29 Million
Treatment Plants $30 Million On target $19-$27 Million
Distribution Facilities $15 Million On target $6-$10 Million
Reservoirs $45 Million On target $5-$7 MillionTransmission Mains $35 Million Deficient $84-$102 Million
Distribution Pipelines $90 Million Deficient $107-$198 Million
Technology $15 Million Deficient $44-$64 Million
Criticality: High Moderate Low

RiversidePublicUtilities.com
Useful Life vs. Replacement Rate
0
25
50
75
100
125
150
Wells Treatment Plants Distribution Facilities Reservoirs Pipelines
Years
Useful Life Current Replacement Rate

RiversidePublicUtilities.com
Option 1: Stay the Same (reactive mode), but fall behind as costs rise.
0 20 40 60 80 100 120 140 160 180 200
Technology
Distribution Pipelines
Transmission Pipelines
Reservoirs
Distribution Facilities
Treatment Plants
Wells
$ Millions
Option 1: Status Quo
Option 1 = $170-$216 MillionOption 2 = $226-$293 MillionOption 3 = $279-$357 MillionOption 4 = $342-$437 Million
Option 1: Existing programs continue. Distribution pipeline at 130 year replacement cycle. Basic RPU technology improvements with ODMS and asset management.

RiversidePublicUtilities.com
Cost to Address Major Deficiencies
0 20 40 60 80 100 120 140 160 180 200
Technology
Distribution Pipelines
Transmission Pipelines
Reservoirs
Distribution Facilities
Treatment Plants
Wells
$ Millions
Option 2: Major Deficiencies
Option 1 = $170-$216 MillionOption 2 = $226-$293 MillionOption 3 = $279-$357 MillionOption 4 = $342-$437 Million
Option 2: Replace Techite pipe, no upsizing. Replace Distribution Pipeline at a 100-year life cycle. Construct North Waterman Treatment Plant. Upgrade SCADA System and automate distribution system.

RiversidePublicUtilities.com
Cost to Address Operational Deficiencies
0 20 40 60 80 100 120 140 160 180 200
Technology
Distribution Pipelines
Transmission Pipelines
Reservoirs
Distribution Facilities
Treatment Plants
Wells
$ Millions
Option 3: Operational Deficiencies
Option 1 = $170-$216 MillionOption 2 = $226-$293 MillionOption 3 = $279-$357 MillionOption 4 = $342-$437 Million
Option 3: Upsize Techite pipeline and address transmission bottlenecks. Install AMI meters. Replace two irrigation wells.

RiversidePublicUtilities.com
Cost for Aggressive Program
0 20 40 60 80 100 120 140 160 180 200
Technology
Distribution Pipelines
Transmission Pipelines
Reservoirs
Distribution Facilities
Treatment Plants
Wells
$ Millions
Option 4: Aggressive Program
Option 1 = $170-$216 MillionOption 2 = $226-$293 MillionOption 3 = $279-$357 MillionOption 4 = $342-$437 Million
Option 4: Replace old and undersized transmission mains. Replace distribution pipelines at 75-year life cycle. Construct the Riverside Canal Treatment Plant.

RiversidePublicUtilities.com
Summary of Investment Options
Additional financial investment is required to address current backlog and improve maintenance.
Option 2Option 1
Status QuoFall Behind Major
Deficiencies
$170 – 206 million $226 – 293 million
Operational Deficiencies
$279-357 million
Option 3
Aggressive Program
Option 4
$342-437 million

RiversidePublicUtilities.com
RPU Retirement Projections
0%
10%
20%
30%
40%
50%
60%
Now 3 years 5 Years 10 Years
Employees eligible to retire now and future
Eligible to Retire(5 years of service @55)
Most Likely to Retire(25 years of service @55)
Industry Facts:36% - 5 Years
55% - 10 Years

ADVANCED TECHNOLOGIES
WORKFORCE DEVELOPMENT
THRIVING FINANCIALLY
INFRASTRUCTURE IMPROVEMENTBACKGROUND
ROAD MAPS – INFRASTRUCTURE IMPROVEMENT - WATER

RiversidePublicUtilities.com
Background• City acquired water system in 1913• Serve population over 300,000• System replacement cost over $2 Billion• Annual revenues over $60 Million


RiversidePublicUtilities.com
Safe W.A.T.E.R. Plan (2006)
• Invested $250,000,000• Age based replacement• Last rate increase 2010• Purchasing power has diminished• Good work done / more needed

RiversidePublicUtilities.com
AVERAGE RESIDENTIAL RATE FOR 25 CCF PER MONTH (AS OF SEPT. 30, 2014)
Affordable Water Rates
$97.90 $90.16 $86.18
$81.18
$57.75 $48.92
$94.61 $100.31
$-
$20
$40
$60
$80
$100
$120
Glendale Pasadena Burbank Corona Anaheim Riverside Eastern MWD Western MWD

ADVANCED TECHNOLOGIES
WORKFORCE DEVELOPMENT
THRIVING FINANCIALLY
INFRASTRUCTURE IMPROVEMENTASSESSMENT
ROAD MAPS – INFRASTRUCTURE IMPROVEMENT -ELECTRIC

RiversidePublicUtilities.com
RPU Water System
• 49 active domestic wells• 16 storage reservoirs (109 MG)• 11 treatment plants• 3 imported water connections• 41 booster stations• 8 emergency inter-ties• 46 Hydraulic Zones (925–1750)• 954 miles pipeline (4–72 inch)• Riverside Canal and Gage Exchange system

Estimated Replacement ValueItem Quantity Unit Price Total
Water Supply Mains 180,000 ft.. $ 810 /ft.. $ 145,800,000
Transmission Pipelines 516,900 ft. $ 650 /ft. $ 335,985,000
Distribution Pipelines 4,342,300 ft. $ 250 /ft. $ 1,085,575,000
Service Laterals 67,500 ea. $ 2,000 ea. $ 135,000,000
Meters 67,500 ea. $ 250 ea. $ 16,875,000
Reservoirs 109 MG $ 1,000,000 /MG $ 108,500,000
Pump Stations 10,860 HP $ 4,000 /HP $ 43,440,000
Domestic Wells 49 ea. $ 3,000,000 ea. $ 147,000,000
Pressure Stations 60 ea. $ 300,000 ea. $ 18,000,000
Treatment Plants 6 ea. $ 12,000,000 ea. $ 72,000,000
Chlorination Facilities 6 ea. $ 1,200,000 ea. $ 7,200,000
Riverside Canal Facilities 14 miles $ 2,000,000 mi. $ 28,000,000
Control Systems LS $10,000,000 LS $ 10,000,000
Total System Valuation $ 2,153,375,000

Estimated Replacement Value

RiversidePublicUtilities.com
Infrastructure AssessmentAsset Criticality Last 10 Years Status Next 10 Years
Wells $20 Million On target $21-$29 Million
Treatment Plants $30 Million On target $19-$27 Million
Distribution Facilities $15 Million On target $6-$10 Million
Reservoirs $45 Million On target $5-$7 MillionTransmission Mains $35 Million Deficient $84-$102 Million
Distribution Pipelines $90 Million Deficient $107-$198 Million
Technology $15 Million Deficient $44-$64 Million
Criticality: High Moderate Low

RiversidePublicUtilities.com
Well Production Assessment
• $20 Million Invested– 10 wells in last 10 years (20% of capacity)– 5 built or financed by others
• $21-29 Million Needed– Replace 1 well every other year– Rehab 5 wells per year– Replace 2 irrigation wells
• On Target
RiversidePublicUtilities.com
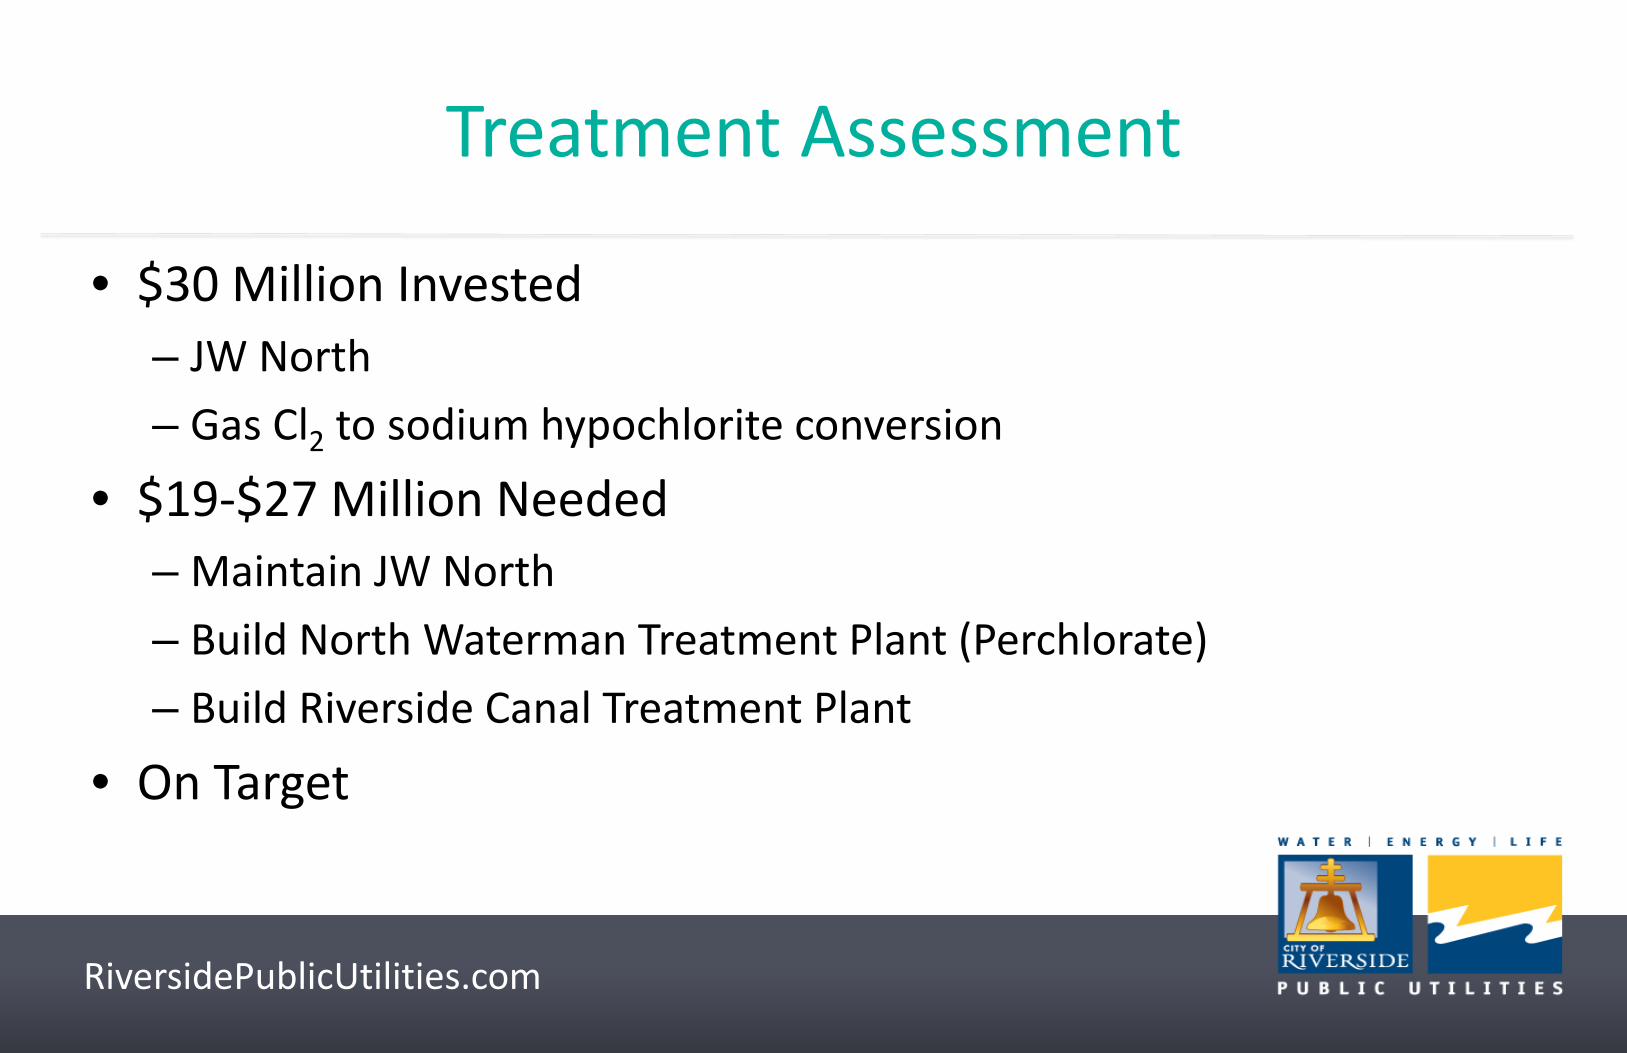
Treatment Assessment
• $30 Million Invested– JW North– Gas Cl2 to sodium hypochlorite conversion
• $19-$27 Million Needed– Maintain JW North– Build North Waterman Treatment Plant (Perchlorate)– Build Riverside Canal Treatment Plant
• On Target


RiversidePublicUtilities.com
Distribution Facilities Assessment
• $15 Million Invested• Booster Stations
– 18 of 38 stations are new or rebuilt
• Pressure Reducing Stations– 14 of 27 stations are new or rebuilt
• Meters– 35,000 of 64,000 replaced
• On Target

RiversidePublicUtilities.com
Distribution Facilities Assessment
• $6-$10 Million needed–2 booster station replacements–1 pressure reducing station replacement–4,500 meter replacements / year

Booster Pumps by Year

Meters by Age
RiversidePublicUtilities.com
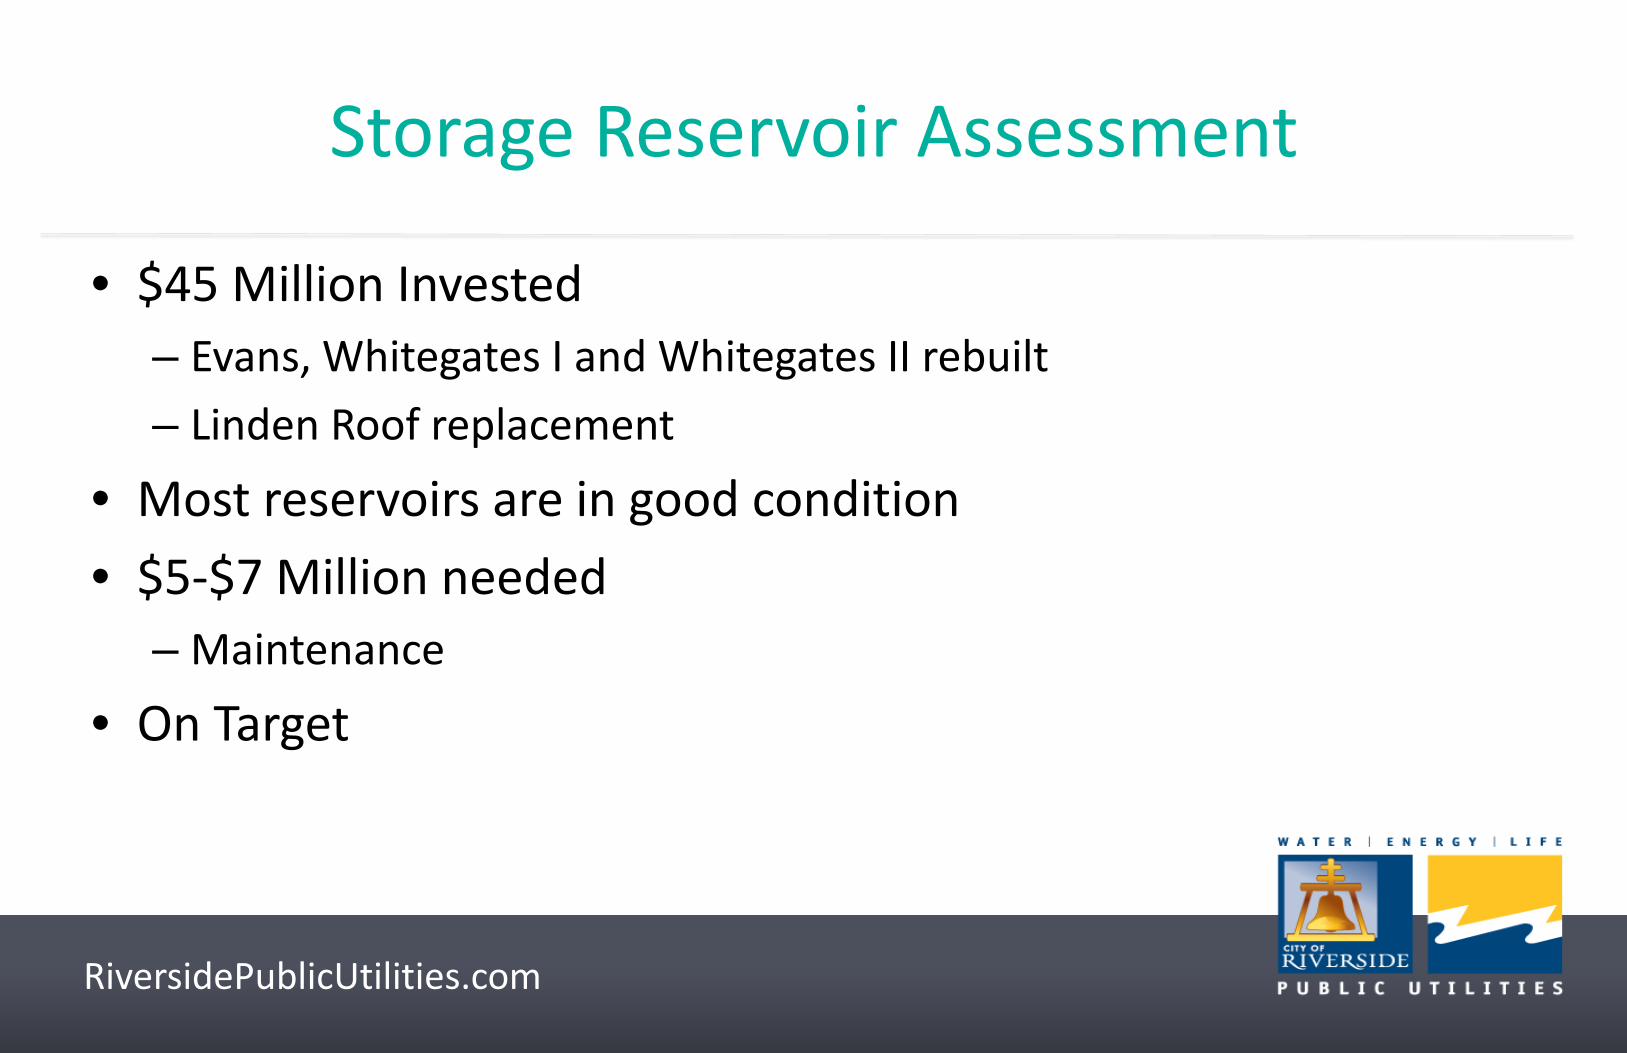
Storage Reservoir Assessment
• $45 Million Invested– Evans, Whitegates I and Whitegates II rebuilt– Linden Roof replacement
• Most reservoirs are in good condition• $5-$7 Million needed
– Maintenance
• On Target

RiversidePublicUtilities.com
Transmission Mains Assessment
• $35 Million Invested– San Bernardino TM replacements (9 projects)– Short segment of Cross town feeder (SR-91 widening)
• $84-$102 Needed– Techite Pipe should be replaced– Old and undersized pipelines– Operational deficiencies
• Deficient

Supply Transmission Mains Map

Distribution Transmission Mains Map

Distribution Transmission Mains Map (undersized)

RiversidePublicUtilities.com
Techite Pipe

RiversidePublicUtilities.com
Distribution Pipelines Assessment
• $90 Million Invested– 60 Miles replaced ($63 Million)
• 130 year replacement cycle
– System expansion, Public Works projects
• $107-$198 Million needed– Approaching “Tsunami” of Cast Iron pipe– Develop improved assessment methods
• Deficient

Annual Distribution Line Leaks
0
20
40
60
80
100
120
140
160
180
200
Leak
O
ccur
renc
e

Normalized Leak Rating
0
5
10
15
20
25
Distribution Line Leaks per 100 miles of pipeline per year

Active Leaks Map

Premature Distribution Pipeline Failure
Failed Cast Iron Distribution mains removed from service December 2014. Installed c. 1950.


RiversidePublicUtilities.com
Distribution Main Replacement Rate
• $8.6 Million/year–6.5 Miles (130-year cycle)
• $11 Million/year–8.5 Miles (100-year cycle)
• $15 Million/year–11 Miles (75-year cycle)

RiversidePublicUtilities.com
Infrastructure Assessment SummarySignificant Progress with CIP
– Most areas are making good progress• Wells, Treatment Plants, Distribution Facilities, Reservoirs
Some areas need attention (10 years)– Transmission Mains ($84-$102 Million)– Distribution Pipelines ($107-$198 Million)

ADVANCED TECHNOLOGIES
WORKFORCE DEVELOPMENT
THRIVING FINANCIALLY
INFRASTRUCTURE IMPROVEMENTTECHNOLOGY ASSESSMENT
ROAD MAPS – INFRASTRUCTURE IMPROVEMENT -ELECTRIC

NETWORKMODERNIZATION
~ELECTRIC
SUSTAINABILITYWATER
RESILIENCY
EFFICIENCYSERVICES
FIBERBUSINESS
SUSTAINABLEPOWER
FLEXIBLEENERGY
SERVICES
ENHANCEDUSAGE
MEASUREMENTCOMPETITIVE
RATESRESILIENT
WATERSUPPLY
WOW!CUSTOMER
SERVICE
CUSTOMEREXPERIENCE
STABLERESOURCEPLANNING
UTIL ITY 2.0
COMMUNITYVALUE
HOW TECHNOLOGY HELPS THE WATER INFRASTRUCTURE REACH 2.0
SENSE
COMMUNICATE
CONTROL

RiversidePublicUtilities.com
Technology Assessment
• $15 Million Invested– Replaced SCADA system (10 years old)– Well automation/SCADA expansion– ODMS
• $44-$64 Million needed– Information gathering/storage/extraction/analysis– Real time and efficient system operation

RiversidePublicUtilities.com
Technology Master Plan
49

RiversidePublicUtilities.com
Technology Assessment
• ODMS– Underway– Store operational data– Interact with multiple databases– Platform for dashboards– Segue way for advanced analysis
and decision making
• Asset Management– Underway– Fully utilize existing software– Automate gathering of field data– Streamline maintenance– Refine CIP program

RiversidePublicUtilities.com
Technology Assessment
• Communication Upgrade– Remote facilities– High failure rate– Low bandwidth
• Distribution Automation– Optimize system operation– Added level of reliability– Reduce energy costs
• Advanced Metering Infrastructure (AMI)– Enhance customer service– Leak detection– Real time monitoring of system– Non-revenue water detection– Advanced meters

ADVANCED TECHNOLOGIES
WORKFORCE DEVELOPMENT
THRIVING FINANCIALLY
INFRASTRUCTURE IMPROVEMENTWORKFORCE ASSESSMENT
ROAD MAPS – INFRASTRUCTURE IMPROVEMENT -ELECTRIC

RiversidePublicUtilities.com
Workforce Assessment
• RPU has strong competency for today’s needs• Improved processes may require new skillsets
– Changes in workforce make-up?
• Retiring employees• Onboard/train incoming staff• Continuous education

RiversidePublicUtilities.com
Workforce Assessment Summary
• Participate in Utility 2.0 development• Provide continuous training
– Water University (technical staff)– Soft skills development (supervisors, managers)– Technology utilization skills
• Increased CIP?– Reduce 20% vacancy rate

ADVANCED TECHNOLOGIES
WORKFORCE DEVELOPMENT
THRIVING FINANCIALLY
INFRASTRUCTURE IMPROVEMENTFINDINGS
ROAD MAPS – INFRASTRUCTURE IMPROVEMENT - WATER

RiversidePublicUtilities.com
Infrastructure AssessmentAsset Criticality Last 10 Years Status Next 10 Years
Wells $20 Million On target $21-$29 Million
Treatment Plants $30 Million On target $19-$27 Million
Distribution Facilities $15 Million On target $6-$10 Million
Reservoirs $45 Million On target $5-$7 MillionTransmission Mains $35 Million Deficient $84-$102 Million
Distribution Pipelines $90 Million Deficient $107-$198 Million
Technology $15 Million Deficient $44-$64 Million
Criticality: High Moderate Low

RiversidePublicUtilities.com
Useful Life vs. Replacement Rate
0
25
50
75
100
125
150
Wells Treatment Plants Distribution Facilities Reservoirs Pipelines
Years
Useful Life Current Replacement Rate
RiversidePublicUtilities.com
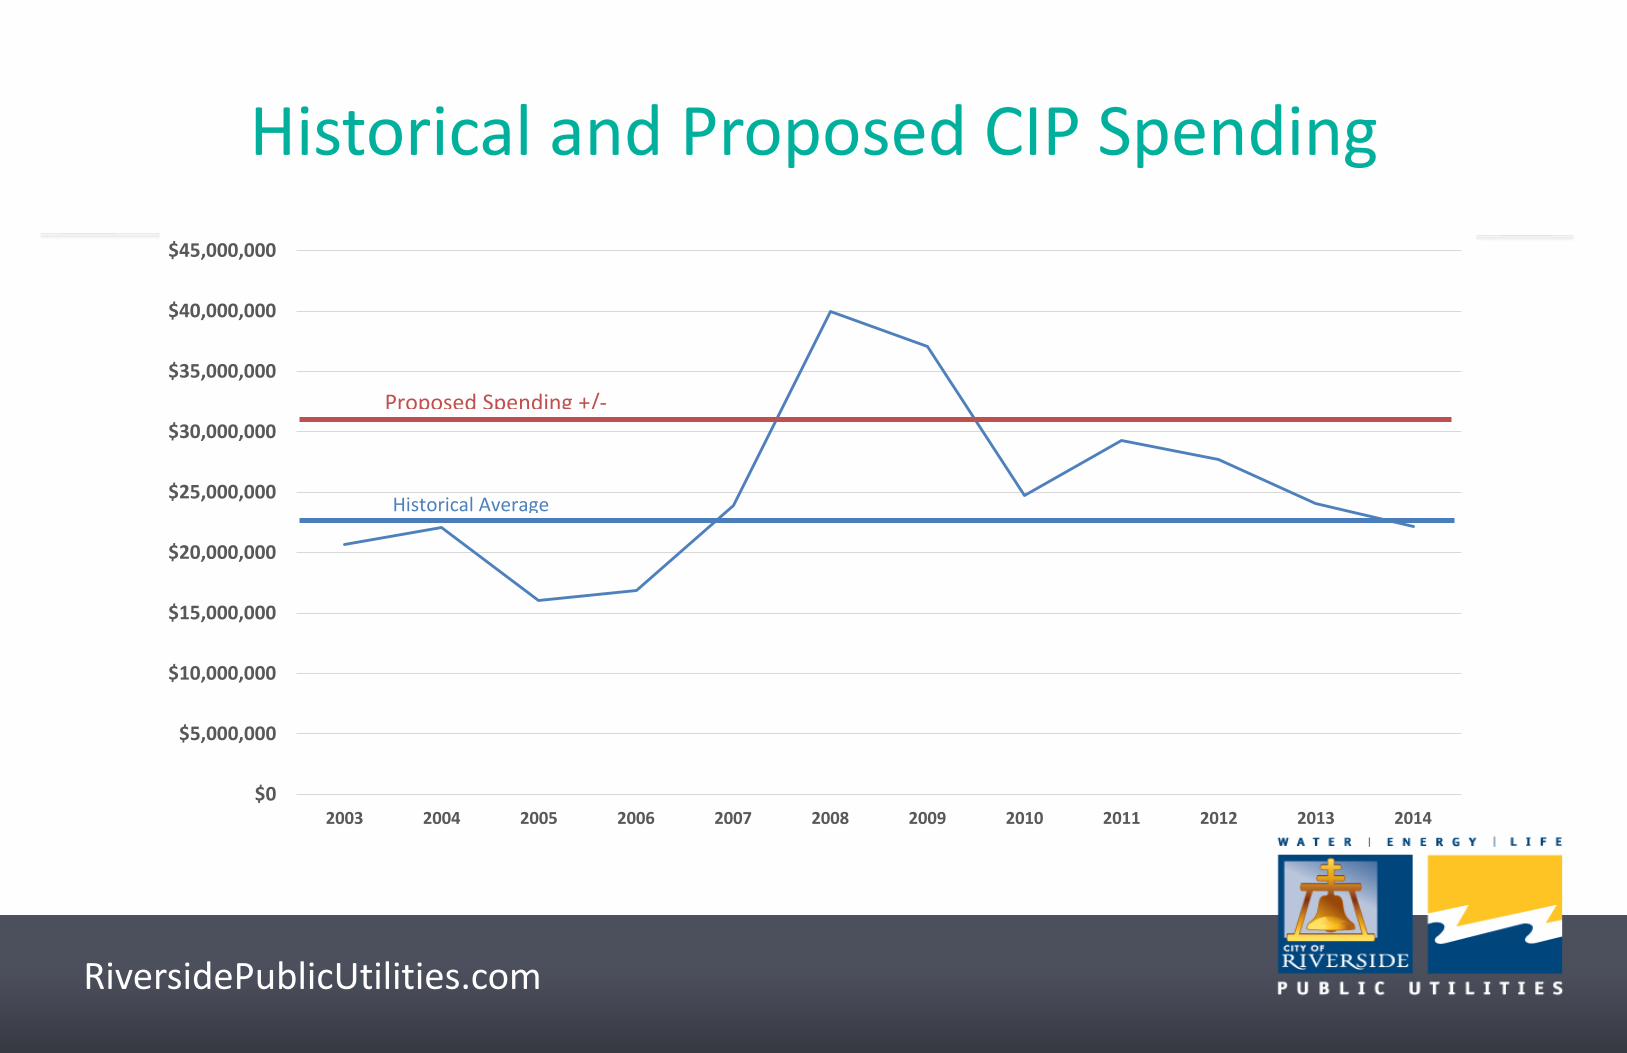
Historical and Proposed CIP Spending
$0
$5,000,000
$10,000,000
$15,000,000
$20,000,000
$25,000,000
$30,000,000
$35,000,000
$40,000,000
$45,000,000
2003 2004 2005 2006 2007 2008 2009 2010 2011 2012 2013 2014
Historical Average
Proposed Spending +/-

ADVANCED TECHNOLOGIES
WORKFORCE DEVELOPMENT
THRIVING FINANCIALLY
INFRASTRUCTURE IMPROVEMENTOPTIONS
ROAD MAPS – INFRASTRUCTURE IMPROVEMENT - WATER

RiversidePublicUtilities.com
Option 1: Stay the Same (reactive mode), but fall behind as costs rise.
0 20 40 60 80 100 120 140 160 180 200
Technology
Distribution Pipelines
Transmission Pipelines
Reservoirs
Distribution Facilities
Treatment Plants
Wells
$ Millions
Option 1: Status Quo
Option 1 = $170-$216 MillionOption 2 = $226-$293 MillionOption 3 = $279-$357 MillionOption 4 = $342-$437 Million
Option 1: Existing programs continue. Distribution pipeline at 130 year replacement cycle. Basic RPU technology improvements with ODMS and asset management.

RiversidePublicUtilities.com
Cost to Address Major Deficiencies
0 20 40 60 80 100 120 140 160 180 200
Technology
Distribution Pipelines
Transmission Pipelines
Reservoirs
Distribution Facilities
Treatment Plants
Wells
$ Millions
Option 2: Major Deficiencies
Option 1 = $170-$216 MillionOption 2 = $226-$293 MillionOption 3 = $279-$357 MillionOption 4 = $342-$437 Million
Option 2: Replace Techite pipe, no upsizing. Replace Distribution Pipeline at a 100-year life cycle. Construct North Waterman Treatment Plant. Upgrade SCADA System and automate distribution system.

RiversidePublicUtilities.com
Cost to Address Operational Deficiencies
0 20 40 60 80 100 120 140 160 180 200
Technology
Distribution Pipelines
Transmission Pipelines
Reservoirs
Distribution Facilities
Treatment Plants
Wells
$ Millions
Option 3: Operational Deficiencies
Option 1 = $170-$216 MillionOption 2 = $226-$293 MillionOption 3 = $279-$357 MillionOption 4 = $342-$437 Million
Option 3: Upsize Techite pipeline and address transmission bottlenecks. Install AMI meters. Replace two irrigation wells.

RiversidePublicUtilities.com
Cost for Aggressive Program
0 20 40 60 80 100 120 140 160 180 200
Technology
Distribution Pipelines
Transmission Pipelines
Reservoirs
Distribution Facilities
Treatment Plants
Wells
$ Millions
Option 4: Aggressive Program
Option 1 = $170-$216 MillionOption 2 = $226-$293 MillionOption 3 = $279-$357 MillionOption 4 = $342-$437 Million
Option 4: Replace old and undersized transmission mains. Replace distribution pipelines at 75-year life cycle. Construct the Riverside Canal Treatment Plant.

RiversidePublicUtilities.com
Summary of Investment Options
Additional financial investment is required to address current backlog and improve maintenance.
Option 2Option 1
Status QuoFall Behind Major
Deficiencies
$170 – 206 million $226 – 293 million
Operational Deficiencies
$279-357 million
Option 3
Aggressive Program
Option 4
$342-437 million

ADVANCED TECHNOLOGIES
WORKFORCE DEVELOPMENT
THRIVING FINANCIALLY
INFRASTRUCTURE IMPROVEMENTRECOMMENDATIONS
ROAD MAPS – INFRASTRUCTURE IMPROVEMENT - WATER

RiversidePublicUtilities.com
Sample Short-Term Recommendations – Year 1
WaterInfrastructure
• Continue with current asset replacement program• Finalize plans and rollout timing of Recycled Water System• Rubber Dam EIR and permitting process
TechnologyInfrastructure
• Initial ODMS rollout• Initiate SCADA and communications upgrades• Input facilities into OWAM and begin automated capturing of field data• Refine and implement five dashboards
Workforce • Assess personnel needs to implement Water Utility 2.0

RiversidePublicUtilities.com
Sample Mid-Term Recommendations – Years 2-5
WaterInfrastructure
• Identify and utilize advanced pipeline characterizations to refine replacement program• Replace and upsize Crosstown Feeder and Magnolia Main (Techite)• Complete phase I of recycled water program. • Complete Rubber Dam • Study and pilot test the North Waterman Treatment Plant
TechnologyInfrastructure
• Rollout AMR/AMI system• ODMS to interface with all major systems• Complete GIS and SCADA and communication upgrades• Fully implement automated field data gathering• Fully operational asset management system• Automate production/distribution system
Workforce• Implement continuous technical, technological and soft skills training• Revise job classifications and employee allocations for Utility 2.0
RiversidePublicUtilities.com
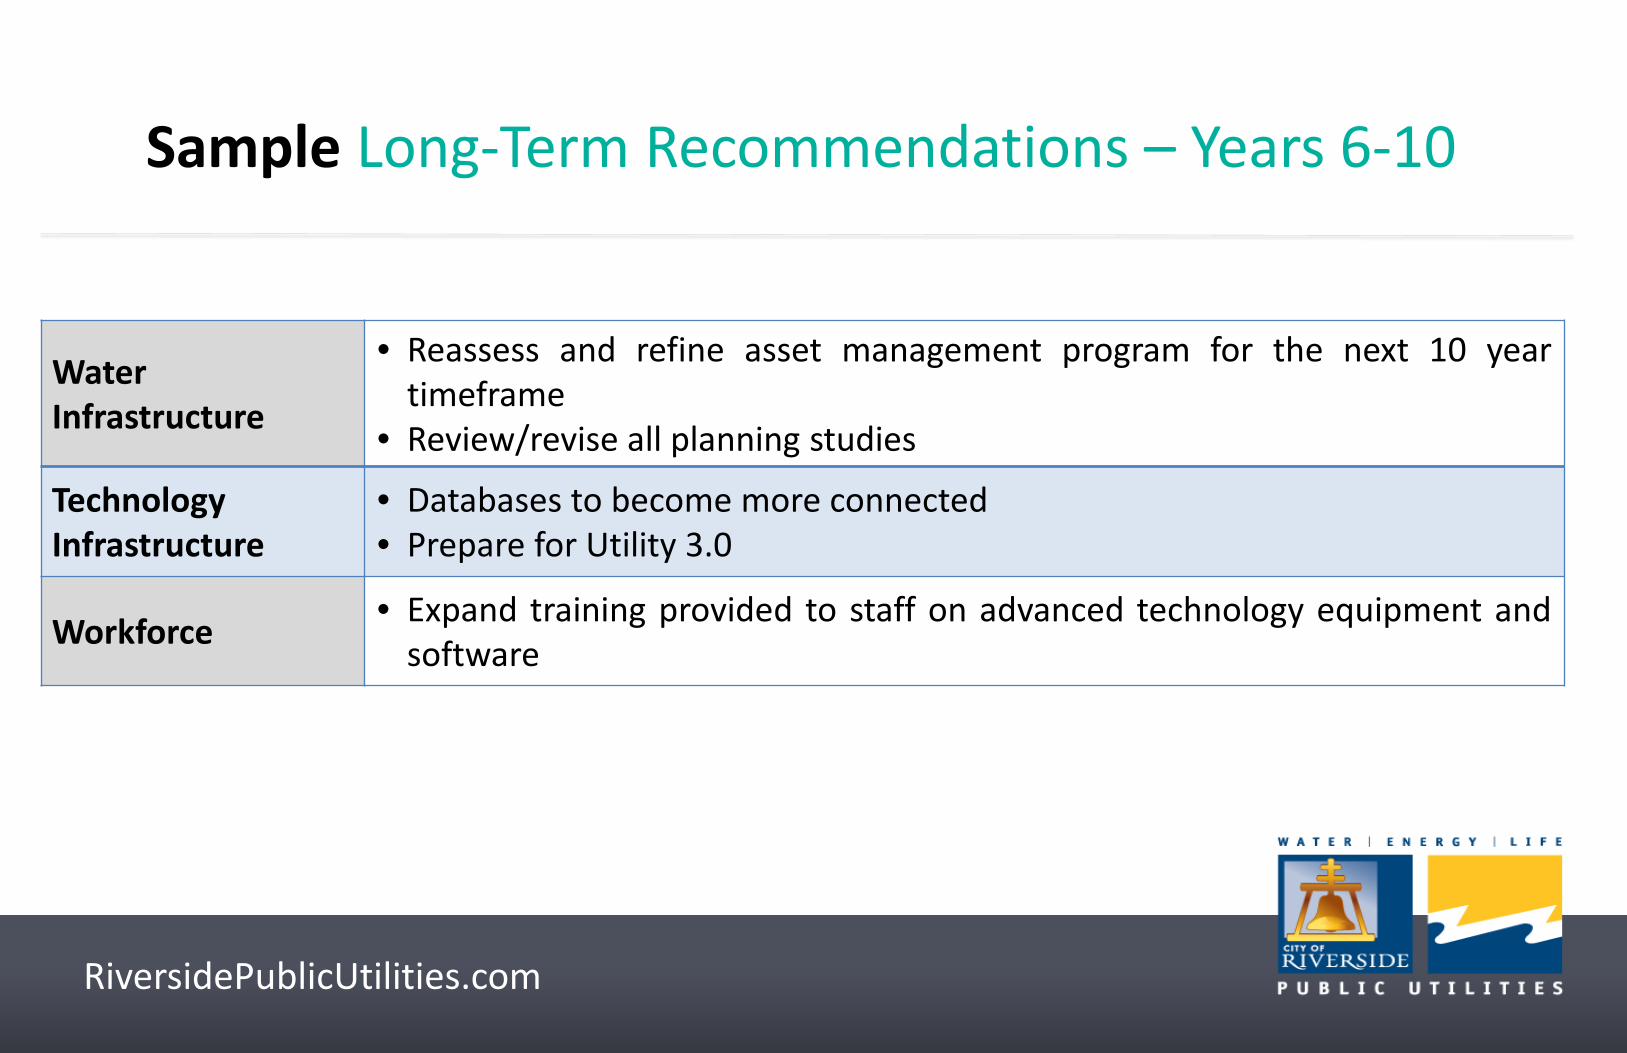
Sample Long-Term Recommendations – Years 6-10
WaterInfrastructure
• Reassess and refine asset management program for the next 10 yeartimeframe
• Review/revise all planning studies
TechnologyInfrastructure
• Databases to become more connected• Prepare for Utility 3.0
Workforce • Expand training provided to staff on advanced technology equipment andsoftware

RiversidePublicUtilities.com
Options & Recommendations Decided from Feedback
Reactive
Reactive plus Projected
Repairs
Proactive
Highly Proactive
Short-TermRecommendations
Mid-TermRecommendations
Long-TermRecommendations
FeedbackFeedback

RiversidePublicUtilities.com
Next Steps
• Incorporate Comments
• Formulate Detailed recommendations
• Review
• Report Back


![UNIVERSITY OF CALIFORNIA RIVERSIDE arXiv:1403 ... › pdf › 1403.1864v1.pdfarXiv:1403.1864v1 [math.AG] 7 Mar 2014 UNIVERSITY OF CALIFORNIA RIVERSIDE Deformations of Compact Holomorphic](https://img.pdfslide.us/doc/110x75/5f0c14bb7e708231d433a5f2/university-of-california-riverside-arxiv1403-a-pdf-a-1403-arxiv14031864v1.jpg)