Embed Size (px)
Citation preview

Julie SieversIowa DNR Field Office 3

Ammonia, NH3 Organic Nitrogen, TKN Nitrite, NO2
Nitrate, NO3
Monochloramine, NH2Cl Dichloramine, NHCl2 Combined Chlorine Trichloramine, NCl3 Free Chlorine, OCl- (hypochlorite) or HOCl
(hypochlorous acid) – dependent on pH Total Chlorine = Free + Combined Free Available Ammonia, need to know form
(NH3 or NH3-N)Do you know which of these are present in your system?

Chlorine typically added as gas chlorine or sodium hypochlorite (liquid chlorine)
Disassociates based on pH (and temperature)
Chlorine Hypochlorous Acid Hypochlorite Ion

Monochloramine Dichloramine Trichloramine
If you add ammonia or have it present in the raw water, these reactions occur:

There are competing reactions
Cl2 + H2O → HOCl + Cl- + H+
NH2Cl + HOCl → NHCl2 + H2O
NHCl2 + HOCl → NCl3 + H2O
NH3 + HOCl → NH2Cl + H2O
NaOCl + H2O → HOCl + NaOH Liquid chlorine
Gas chlorine
Monochloramine
Dichloramine
Trichloramine

For typical, traditional chloramination, the system adds chlorine and ammonia◦ The system can control both chlorine feed rate and
ammonia feed rate
◦ Chlorine is added first, then ammonia
In systems with naturally occurring ammonia, chloraminating due to ammonia in source water◦ System can control chlorine feed rate BUT have no to
limited ability to change or control ammonia level
Do you have ammonia in your raw water?
Do you add ammonia?

Ammonia reacts with chlorine to form monochloramine, dichloramine, and trichloramine
Formation is dependent on the pH and chlorine to ammonia ratio
Monochloramine, dichloramine, and trichloramine are measured as a part of the total chlorine residual and are weak disinfectants
Trichloramine = Nitrogen trichloride

Monochloramine and dichloramine exist together at pH of 6.5 to 7.5◦ Chlorine to ammonia ratio determine which is
formed
Dichloramine and trichloramine cause taste and odor problems
Small amounts of trichloramines may exist past the breakpoint and may also cause taste and odor problems

From Bob Spon, OpFlow Article, June 2008

Ammonia results from a certified lab are for total ammonia
Free ammonia testing must be done immediately and is done on-site
Total chlorine = free + combined Combined chlorine = monochloramine +
dichloramine + trichloramine Free chlorine = hypochlorite ion +
hypochlorous acid Free chlorine in the presence of chloramines
is “false” free

Minimum levels dependent on where you are at on the curve
Minimum of 0.3 mg/L free chlorine residual if on the breakpoint side of the curve
Minimum of 1.5 mg/L total chlorine residual if chloraminating
Maximum of 4.0 mg/L total chlorine

From Bob Spon, OpFlow Article, June 2008

Determine where you are at on the curve
Measure free chlorine immediately and at 30 second intervals to 2 minutes◦ Are the readings stable?
◦ Do the readings increase? If so, you are on the chloramine side of the curve & do NOT have free chlorine. This is often referred to as “false” free
Measure total chlorine residual◦ Rule of thumb is if the free residual is stable and
80% of total, you are on the breakpoint side and have “true” free residual

“False” Free Chlorine Residuals
Zero Immediately = 0.08 30 seconds = 0.20
60 seconds = 0.36 90 seconds = 0.52 120 seconds= 0.76
All in mg/L


Ammonia, NH3
Ammonium ion, NH4
◦ In neutral or acidic natural waters, ammonia is present as ammonium ion
Nitrite, NO2
Nitrate, NO3
Organic Nitrogen, TKN

Pidwirny, M. (2006). "The Nitrogen Cycle". Fundamentals of Physical Geography, 2nd Edition.


Ammonia
in Well
Treatment
Plant Ammonia,
Nitrite or
Nitrate
depending on
conditions
Nitrosomas and Nitrobacter
Storage and
Distribution Ammonia,
Nitrite or Nitrate
depending on
conditions

Naturally occurring in Iowa When the nitrogen present in the well is
ammonia it is not from surface source◦ Surface source is nitrified to nitrate before
reaches aquifer = nitrate in well, not ammonia
Believe from mineralization of organic material present from when aquifer was formed◦ Mineralization of organic matter to ammonium by
microorganisms in presence of organic carbon sources in an anaerobic (without oxygen) environment
◦ Most of Iowa was shallow seas
Found in all aquifers

Levels of 1 to 5 mg/L common◦ DNR/UHL study
◦ GSB data
◦ USGS data
◦ Ambient water quality data
◦ DNR 2013 study
◦ Raw water monitoring
Levels as high as 9 mg/L
Ammonia is NOT regulated in Iowa
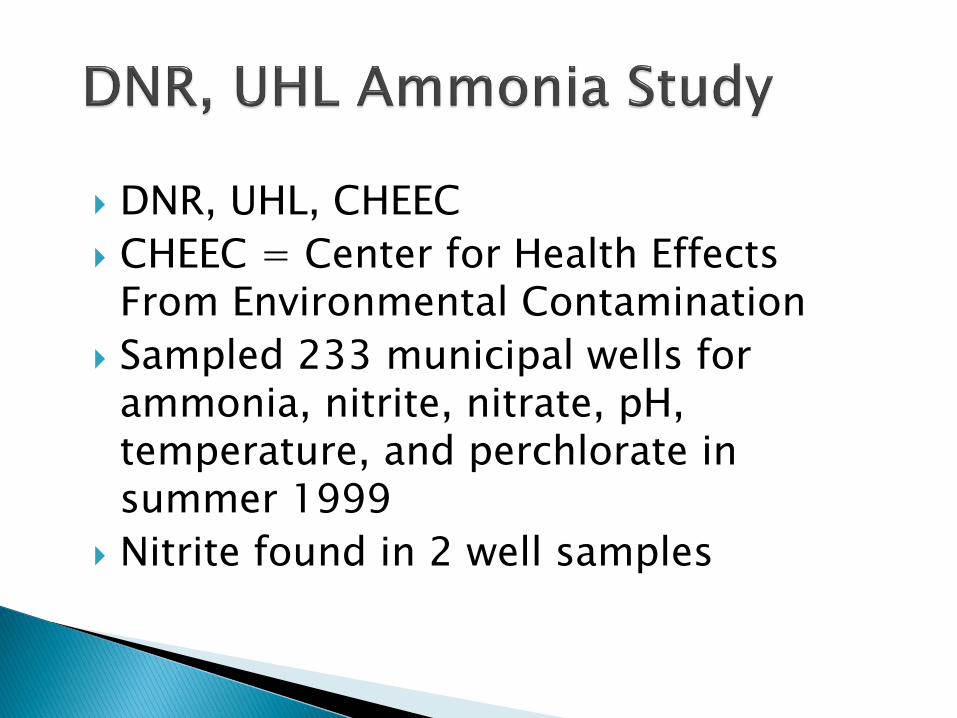
DNR, UHL, CHEEC
CHEEC = Center for Health Effects From Environmental Contamination
Sampled 233 municipal wells for ammonia, nitrite, nitrate, pH, temperature, and perchlorate in summer 1999
Nitrite found in 2 well samples

Ammonia Levels in 233 Wells: 114 samples below detectable
68 samples with <1 mg/L
31 samples between 1 and 2.5 mg/L
16 samples between 2.5 and 5 mg/L
4 samples >5 mg/L

Data from GSB and USGS groundwater monitoring program
1982 – 1996
2,529 samples from 1,158 different wells
Not all sampled for nitrogen compounds each sampling period
841 wells sampled for nitrogen compounds
Range <0.1 to 7.5 mg/L

3000+ samples
1984 - 2010
Various aquifers
1348 samples with ammonia below the detection level (0.1 mg/L)
1603 samples with ammonia
Levels range from 0.11 – 11 mg/L

66 samples
All aquifers, known well construction
17 samples with ammonia levels below detection (0.05 mg/L)
49 samples with ammonia levels between 0.05 – 6.1 mg/L

Ammonia has a huge chlorine demand Need to know what form of disinfectant you are
using◦ Must meet minimum levels to protect public
health Taste and odor issues Nitrification Disinfection byproducts violations or issues◦ TTHM/HAA5 for free chlorine; Nitrosamines for
chloramines
Water quality impacts
Do you know where you are at on the curve?

Courtesy of Hach disinfection serieshttp://www.hach.com/DisinfectionSeries06
Where are You on the BP Curve?
Test Results = 3.0 mg/L total chlorine

From Bob Spon, OpFlow Article, June 2008
What else do you need to know?


What do we need to measure?
Where is the best spot to test for it?
What results are we looking for?
What do we do if we don’t get them?

Free chlorine residual◦ Determine if true or false free◦ For systems adding ammonia, measure free chlorine
prior to ammonia addition to determine how much ammonia to add
Total chlorine residual Free Ammonia◦ For chloraminating systems to determine location
on the curve
Monochloramine ◦ This is the target disinfectant for chloraminating
systems◦ Total residual = Monochloramine
In systems that add ammonia, you can achieve this

Chloraminating systems also need to measure nitrite and nitrate ◦ Important to determine if nitrification is occurring◦ Measure nitrite and nitrate separately◦ More on this later, including locations where to measure
Total ammonia◦ In systems with naturally-occurring ammonia, to
measure raw water fluctuations Seasonal changes
Water levels
Usage, pumping rates
Well rotation
If no total ammonia but indications, test TKN
Chlorine dosage

Courtesy of Hach disinfection serieshttp://www.hach.com/DisinfectionSeries06
Testing Along the Curve
Assume a 1 mg/L ammonia-N dose

Dependent on system and location of chlorine addition
Always measure at the SEP
Always measure in the distribution system◦ Important to know residuals and levels at different
water age locations
May need to measure at specific treatment processes◦ More on this later

For chloraminating systems: The key is the chlorine to ammonia ratio◦ In systems that add ammonia, chlorine should be added
first, then ammonia Free chlorine residual (not dose)
Ammonia dose
◦ In systems with natural ammonia, minimizing free ammonia as much as possible
Other factors◦ How much excess chlorine is present◦ pH◦ Temperature
Minimum total residual of 1.5 mg/L◦ If can show consistent treatment, may not be required to
measure free chlorine (false) – discuss with DNR FO

For free chlorine systems:
The key is to always stay on the breakpoint side of the curve
Free residuals are stable and within 80% of the total residuals throughout the system
Minimum free residual of 0.3 mg/L

Courtesy of Hach disinfection serieshttp://www.hach.com/DisinfectionSeries06
I Am Here!
NH2Cl = TCF NH3N > 0
NH2Cl < TCF NH3N = 0
TC > 0
NH2Cl = 0F NH3N = 0
TC = Total ChlorineF NH3N = Free Ammonia

Factors to consider:
Change in ammonia or chlorine levels◦ Calculate the chlorine dose, has it changed, if so,
why?
Chlorine Gas Dosage, mg/L = Chlorine Used, lbs/day__ (Flow, MGD) (8.34 lbs/gal)
Liquid Chlorine Dosage, mg/L = (lbs of chlorine) (% available chlorine as decimal)
(Flow, MGD) (8.34 lbs/gal) OR Liquid Chlorine Dosage, mg/L = (gallons of chlorine) (% available chlorine as decimal)
(MGD)

Factors to consider:
Change in ammonia or chlorine levels◦ Have the ammonia levels changed?
Decrease in the chlorine residuals or areas where the minimum levels cannot be maintained◦ Nitrification or the bacterial conversion of ammonia
to nitrite to nitrate
◦ Chloramine decay in distribution, especially in low use and dead end areas

Systems that add ammonia can control the dosage of chlorine and ammonia
Free Chlorine = Target Monochloramine (NH2Cl) level before the ammonia injection point
Free Ammonia 0.04 – 0.1 mg/L
Monochloramine (NH2Cl) at the target
Total Chlorine = Monochloramine (NH2Cl)

• NH2Cl too high• Reduce NH3
• Reduce Cl2
• TC dropped after
NH3 addition• Increase NH3
• Reduce Cl2
• FAA too high• Reduce NH3
• Increase Cl2
• TC > NH2Cl• Reduce Cl2
IT’S A BALANCING ACT

Drop in total chlorine residuals in storage and distribution
Free ammonia can convert to nitrite and nitrate
Taste and odor issues if form di or trichloramines

Hypochlorous Acid 20 mg/L
Monochloramine 5 mg/L
Dichloramine 0.8 mg/L
Trichloramine 0.02 mg/L
Typically “swimming pool” or other “chemical” or “chlorine” type smell

Know your raw water ammonia levels◦ If you blend or rotate wells, do this is a way to get
the most consistent ammonia levels possible
◦ May need to have different chlorine dosages for different wells or combination of wells
Goal is to either chloraminate or use free chlorine – NO yo-yoing back and forth
Determine target chlorine residuals based on your system and work to meet them
Consistent chlorine residuals throughout the distribution system

On to nitrification…

Result of bacterial nitrification of free ammonia
Result of contamination◦ When found in raw water samples (directly from well)
indicates close source of contamination or recent contamination
Conversion within transmission line, treatment plant, storage or distribution system
Up to one nitrite formed for each ammonia◦ 1 mg/L of ammonia can form 1 mg/L of nitrite
MCL in drinking water of 1.0 mg/L - ACUTEhealth concern
Currently “one time only” sampling at S/EP unless greater than 0.5 mg/L (1/2 of MCL) or assigned distribution monitoring if detects

Result of bacterial nitrification of nitrite
Result of contamination from surface activity◦ Find in raw water samples
MCL of 10 mg/L - ACUTE health concern
Often find present with ammonia and nitrite if nitrification is incomplete
One nitrate formed for each nitrite
Sampling at SEP:◦ 1/year
◦ 1/quarter if >5.0 mg/L <10
◦ 1/month if > 10

Health concerns the same for each but at different levels, both are ACUTEcontaminants◦ Nitrite = 1.0 mg/L◦ Nitrate = 10 mg/L
Blue baby syndrome◦ Difficult to identify◦ State non-reportable disease
Failure to thrive Many times appears to be formula
intolerance◦ Change to premade formula and symptoms
disappear
Some links to bladder and other cancers

Nitrosomonas convert ammonia to nitrite
Nitrobacter convert nitrite to nitrate
Present in treatment plants◦ Aerators, detention tanks, filters
Present in storage and distribution systems◦ Biofilm
Common in soil and environment
Not detected as part of total coliform test
Not always detected as part of HPC (heterotrophic or other total plate count)

Convert ammonia to nitrite
Lives in biofilm, sediments, filter media
Resistant to chloramines
Less sensitive to chlorine
If established, can protect themselves in presence of high chlorine residuals

Very sensitive to ammonia ◦ Any ammonia not consumed by Nitrosomonas will
inhibit Nitrobacter
Very sensitive to chlorine and chloramines◦ Will be dormant (hibernate) in presence of chlorine
or chloramines, usually will not be killed except at high levels
Thrive in narrow pH range – 7.6 to 7.8

Ammonia can convert to nitrite at 1:1 ratio
Nitrite can convert to nitrate at 1:1 ratio
IF no limiting factors present
Highest risk during low water use and warm water temperatures ◦ Spring and fall when warm water due to time in
tower/storage and low use
◦ Summer of 2014 had issues with nitrification in systems that had not had previous problems due to low water use and warm temperatures

Amount of dissolved oxygen (DO) Chlorine residuals Temperature Detention/retention time Amount of free ammonia present pH Light Microbial community composition

Alkalinity Phosphate level
Carbon or TOC levels
Type of filter media
Backwash water – chlorinated or nonchlorinated
Others

Factor Nitrosomonas Nitrobacter
pH 5.8 – 9.5 5.7 – 10.2
Optimum pH 7.5 – 8.0 7.6 – 7.8
Temperature 5 – 30 C 5 – 40 C
Optimum Temp 30 C 28 C
Chlorine Less sensitive Very sensitive
Ammonia Consume Very sensitive

For complete nitrification (conversion of ammonia to nitrate), 4.57 mg/L of oxygen is consumed per each 1 mg/L of ammonia◦ This is in addition to the oxygen needed for
oxidation of iron and other contaminants
For complete nitrification, 7.1 mg/L (as CaCO3) of alkalinity is needed for each 1 mg/L of ammonia◦ Used to build cell walls by nitrifying bacteria

Drop in total chlorine residuals or no chlorine residual in ends or portions of the distribution system◦ May also be in the middle of a loop (water moving
from both directions with oldest water in the middle of the loop and little water movement)
Fluctuations in chlorine residuals with no apparent cause or reason such as changes wells or high service pumps
Decrease (drop) in pH and/or alkalinity in areas of distribution system
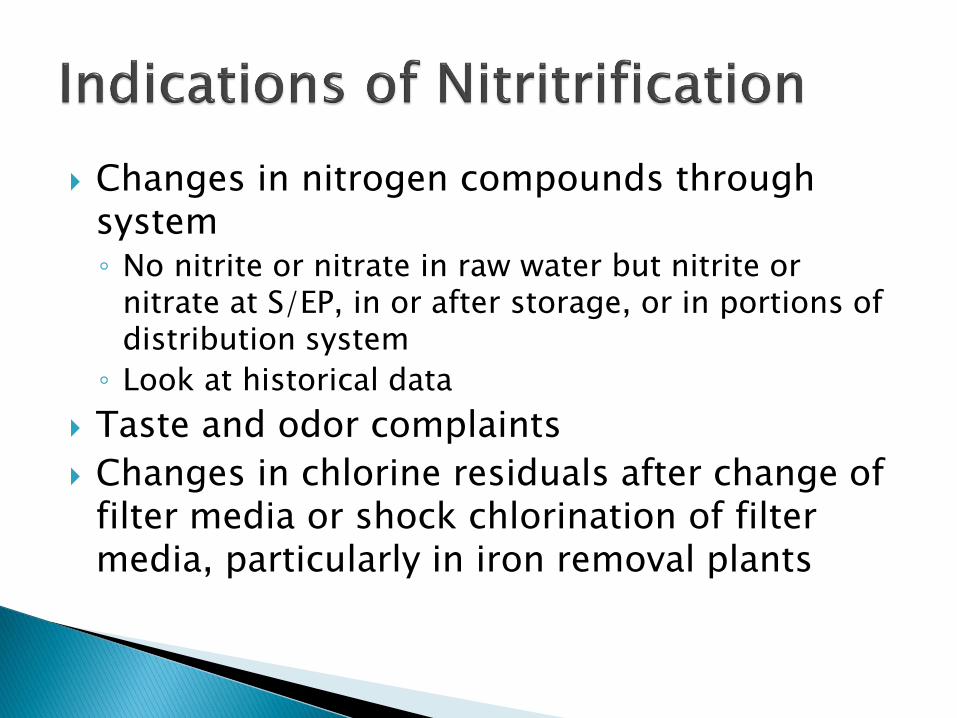
Changes in nitrogen compounds through system◦ No nitrite or nitrate in raw water but nitrite or
nitrate at S/EP, in or after storage, or in portions of distribution system
◦ Look at historical data
Taste and odor complaints
Changes in chlorine residuals after change of filter media or shock chlorination of filter media, particularly in iron removal plants

Disinfection depletion
Nitrite/nitrate formation
Dissolved oxygen (DO) depletion
Reduction in pH
Reduction in alkalinity
DBP formation changes
“Dirty water” complaints
Corrosion issues, commonly seen as lead and copper exceedances

On to control options…

Ammonia removal◦ Running filters in “bio” mode, also called
biological ammonia treatment
Breakpoint chlorination◦ No ammonia to nitrify
Combination of oxidants
Chloramination with operational control

Biological removal of ammonia through nitrification
Ammonia to nitrite to nitrate◦ No ammonia or nitrite in finished water◦ Free chlorine residuals – breakpoint side of curve
Typically occurs in filters but may occur in aeration, detention – before SEP
No chlorination prior to filters Care must be taken during establishing to
protect nitrifying bacteria◦ Backwash rate◦ Backwash water – chlorinated or not chlorinated
Typically takes 8 – 12 or more weeks to establish

Limiting factor! Dissolved oxygen◦ If ammonia is greater than ~2 mg/L, there will not
be enough oxygen for complete nitrification◦ About 4.5 mg/L of oxygen is needed to completely
nitrify 1 mg/L of ammonia◦ Conversion stops at nitrite if not enough oxygen◦ Often have nitrite MCL violations at SEP as not
enough oxygen to get from nitrite to nitrate
Systems now operating with oxygen injection to get ammonia removal with higher levels of ammonia

Destroys all ammonia so no “food” for the nitrifying bacteria◦ Ammonia to nitrogen gas
Disinfection by free chlorine – breakpoint side of curve
Requires large dose of chlorine◦ In practice, 10 to 12 mg/L (or more) of
chlorine per 1 mg/L of ammonia is common
TTHM/HAA5 concerns◦ Many systems with raw water ammonia have
high raw water TOC levels

Breakpoint chlorination may not be possible◦ Often cannot add enough chlorine to meet
demand
May not be enough reaction time◦ Reaction time dependent on pH and temperature
◦ Must go through all reactions to get to free chlorine (past breakpoint)
◦ If reaction not complete, unstable water entering the system
Taste and odor complaints
Dirty water and corrosion issues common

Combination of oxidants◦ Consider use of multiple oxidants
◦ Permanganate, chlorine, others
Other oxidants◦ MIOX (Mixed oxidants) is in use in some systems
◦ Uses a salt mixture and DC cell to form oxidants, including ozone, hydrogen peroxide, chlorine, chlorine dioxide, etc.
Not common practice to control as has many operational challenges
Addition of sodium chlorite◦ Very specific monitoring requirements
◦ Must do pilot and show operational control

Minimize free ammonia as much as possible◦ For systems adding ammonia, target
0.02 – 0.1 mg/L free ammonia
◦ For systems with natural ammonia, target consistent ammonia levels and maximum chlorine to ammonia ratio
Target disinfectant◦ Monochloramine = Total Chlorine

Increase residuals to control nitrifying bacteria◦ Necessary levels vary by system – typically 2
mg/L of higher (total chlorine residual)◦ May need to go to breakpoint for a few weeks
each spring and/or fall to kill biofilm and then maintain higher chloramine residuals to inhibit growth Notify DNR FO if change disinfection practice
May still have free ammonia present so may have nitrite formation in low use areas, dead-ends, and storage facilities◦ Reversion to ammonia (breakdown of
chloramines)

Other changes in operation depending on where conversion is taking place, such as ◦ Changes to backwash
◦ Increased flushing program
◦ Addition of booster chlorine/ammonia feed
◦ Loop deadends
◦ Periodic forcing of water to move one direction through looped areas
◦ Changing to free chlorine periodically
Frequency and duration varies

Nitrosamine formation◦ Nitrosamines are DBPs in chloraminating systems
◦ N-nitrosodimethylamine (NDMA) is most common
◦ Much on-going research
◦ Formation from reaction of natural organic matter (NOM), use of quaternary amine-based coagulants and anion exchange resins, or wastewater-impaired source waters (tertiary amine-containing pharmaceuticals or personal care products)
EPA is currently reviewing the existing microbial and disinfection byproducts regulations as part of the six year review process (SY3)◦ Review to be completed by end of 2015

Very specific to each system
No magic fix that will work for all systems
Must know what disinfection practice you are using and where you are on the curve!

Many factors impact decision on how to control ammonia
Work with your engineer and/or technical service provider
Need to weigh all of the options and consequences – many unintended consequences such as nitrification, L/C corrosion, chlorine residuals, etc.
Communicate with DNR

On to system specific examples…

Court
esy o
f M
ikael Bro
wn,
Bart
lett
and W
est,
Inc.
Plant A

Courtesy of Mikael Brown, Bartlett and West, Inc. Raw Water NH3 = 1.69
Plant A

• Chlorine demand measured over time
• At pH of 7.6, reaction 90% complete in 20 minutes
• At pH of 10.5, reaction 90% complete in 600 minutes (10 hours)
Courtesy of Mikael Brown, Bartlett and West, Inc.
Plant A

Courtesy of Mikael Brown, Bartlett and West, Inc.
Plant B

Courtesy of Mikael Brown, Bartlett and West, Inc.
Plant B

Courtesy of Mikael Brown, Bartlett and West, Inc.
Plant B

3 Dakota Wells
NH3 = 1.2 - 2.2NO2 = <0.02NO3 = <0.1
Aeration
Lime SofteningNH3 = 1.1
NO2 = <0.02NO3 = <0.1
Top of FiltersNH3 = 1.1
NO2 = <0.02-0.12NO3 = <0.1
Bottom of FiltersNH3 = 0.7 - 0.9
NO2 = 0.26 - 0.46NO3 = <0.1
Plant 1 – Natural Ammonia

S/EPNH3 = 0.4
NO2 = <0.02 - 0.24NO3 = 0.27
High Usage Area in
Distribution System
NH3 = 0.4NO2 = 0.32NO3 = 0.26
Dead EndNH3 = 0.1
NO2 = 0.19NO3 = 0.72

Location Ammonia Nitrite Nitrate
Well #1 1.5 <0.1 <0.5
Well #2 1.2 <0.1 <0.5
Well #3 2.2 <0.1 <0.5
Wells are in the same aquiferWells are within about 2 blocks of each other – common to see variation in ammonia levels in wells in same aquifer

Location Ammonia Nitrite Nitrate
Raw 1.2 <0.02 <0.1
After lime
softening
1.1 <0.02 <0.1
Top of Filters 1.1 – 1.2 <0.02 – 0.12 <0.1
Bottom of
Filters
0.7 – 0.9 0.26 – 0.46 <0.1
S/EP 0.4 <0.02 – 0.24 0.27
End of System
High Usage
0.4 0.32 0.26
Deadend 0.1 0.19 0.72
Data - Plant 1
All results in mg/L

Initially using raw water to backwash Now using chlorinated water to backwash
filters Flushing system regularly Frequent monitoring (self-monitoring) to
determine nitrite levels Nitrite levels now typically <0.1 mg/L◦ During low use, warm temps 0.1 to 0.3 mg/L
Total chlorine ~2.2 – 3.0 in system “False” free chlorine Disinfection = chloramination

Location Ammonia Nitrite Nitrate
Well 7 2.1 <0.1 <0.5
Well 8 2.1 <0.1 <0.5
Well 9 2.2 <0.1 <0.5
Well 10 1.9 <0.1 <0.5
S/EP <0.05 <0.1 1.62

Jordan Wells Treatment = Aeration, filtration, zeolite
softening, chlorination, caustic soda addition
Saw significant decrease in chlorine levels when filter media was changed◦ No free, low total residual
Nitrifying bacteria re-established and conversion to nitrite to nitrate in filters
Total chlorine ~0.8 - 1.2 in system Free chlorine ~ 0.6 - 1.1 in system Disinfection = Free chlorine

Location Ammonia TKN Nitrite Nitrate
Well 3 <0.2 2.0 <0.1 <0.5
Well 4 <0.2 1.8 <0.1 <0.5
Filter
Effluent
<0.2 Not tested <0.1 1.6
S/EP <0.2 Not tested <0.1 1.6
All results in mg/L

Testing indicated no ammonia
No nitrite or nitrate in wells
Nitrate in SEP result
Nitrification occurring in the filters
Disinfectant = Free chlorine

2 Dakota Wells
NH3 = 3.4 - 3.8 NO2 = <0.02NO3 = <0.1
AerationNH3 = 3.5 NO2 = <0.02NO3 = <0.1 Detention
NH3 = 3.6NO2 = <0.02NO3 = <0.1
After FiltersNH3 = 2.5 - 2.9
NO2 = 0.66 - 0.85NO3 = <0.1 - 0.10
S/EPNH3 = 2.5
NO2 = 0.29NO3 = 0.55
Free chlorine = 0.3Total chlorine = 2.6

After TowerNH3 = 2.1
NO2 = 0.41NO3 = 0.72
Free chlorine = 0.1Total chlorine = 1.2
Dist System -Near Tower
NH3 = 2.0NO2 = 0.70NO3 = 0.59
Free chlorine = 0.2Total chlorine = 1.4
Dist System -Looped Line
NH3 = 2.2NO2 = 0.44NO3 = 0.67
Free chlorine = 0.2Total chlorine = 1.4
Dist System -Dead-end
NH3 = 0.51 - 1.1NO2 = 1.1 - 2.1
NO3 = 0.54 - 0.59Free chlorine = 0.1
Total chlorine = ND – 0.4

Tower with 2½ average day capacity Tried breakpoint chlorination to control -
could not feed enough chlorine to reach breakpoint, could not get reaction to be complete in plant/clearwell
Used MIOX to eliminate ammonia until unit failed
Now chloraminating◦ Shocking filters and flushing to control nitrification
Exceeded lead and copper action levels Capital improvement project to inject oxygen
for ammonia removal◦ Successful pilot completed

2 Buried Sand &
Gravel WellsNH3 = 3.3 - 3.6
NO2 = <0.02NO3 = <0.1
Line to TowerNH3 = 3.4
NO2 = <0.02NO3 = <0.1
Total Chlorine = 2.7
S/EPNH3 = 3.0
NO2 = <0.02NO3 = <0.1
Total Chlorine = 2.0
Treatment is an in-line air stone (atomerator), liquid chlorine addition, and pressure sand filtration
The water flows to the tower with splash aeration in the tower, then to the distribution system

Dist System - AverageNH3 = 2.1
NO2 = 0.59NO3 = <1.0
Total chlorine = 1.7
Dist System - Dead-endNH3 = 1.8NO2 = 1.2
NO3 = <1.0Total chlorine = 0.64

Tried breakpoint chlorination to control -could not feed enough chlorine to reach breakpoint with the time they have for the reaction
Too high of ammonia to get ammonia removal through nitrification in the plant◦ Did not have enough oxygen present in the filters
to be able to sustain complete nitrification
Aggressive flushing program to control nitrite formation

Surface Water Plant Clearwell
Prior to NH3 AddFree Chlorine =
0.8 – 1.0
Pump Station 1Consecutive System
Total NH3 = <1.0NO2 = 1.0NO3 = 0.9
Total Chlorine = 2.7
Surface Water Plant SEP
Free NH3 = 0.43Monochloramine =
3.00

Dist System - DownstreamTotal NH3 = 0.34Free NH3 = 0.28
NO2 = >0.69Total chlorine = 0.63
Monochloramine = 0.21
Dist System - Dead-endTotal NH3 = 0.17Free NH3 = 0.10
NO2 = >0.69Total chlorine = 0.17
Monochloramine = <0.12

Tried flushing – could not get velocity to strip biofilm and did not increase chlorine residuals
Switched to breakpoint chlorination to control nitrification◦ Stopped feeding ammonia, increased chlorine feed
After 8 weeks, started adding ammonia◦ Targets:◦ Free ammonia <0.1◦ Monochloramine = total chlorine◦ All total chlorine residuals >1.5

Very specific to each system No magic fix that will work for all systems
Must know what disinfection practice you are using and where you are on the curve!

On to testing…