Embed Size (px)
Citation preview
Julian Simon Lecture Series
Experiences of the Common Nordic Labour Market
No. VII
Eskil Wadensjö 2010
Institute for the Study of LaborAN
NU
AL
MIG
RA
TIO
N M
EE
TIN
G
Julian Simon Lecture Series

Julian Simon Lecture Series
Julian Simon Lecture Series
2010
Presented at the IZA Annual Migration Meeting, June 2010, Bonn
Experiences of the Common Nordic Labour Market
Eskil WadensjöSwedish Institute for Social Research (SOFI), Stockholm Uni-
versity, Stockholm University Linnaeus Center for Integration Studies
(SULCIS),IZA – Institute for the Study of Labor (Bonn),
Abstract
The Common Nordic Labour Market was the first common labour market to be established. Consequently, the length of its existence makes its expe-riences of interest to those who want to know more about common labour markets established later. Although formally started in 1954, it in practice had been partially established before that and continued to develop after its formal starting date. That a common labour market is formally established does not mean that all hindrances to mobility disappear. In this paper, the development of the Common Nordic Labour Market, the migration flows and their determinants, and the economic integration of inter-Nordic mi-grants are presented and analyzed. Of special interest in connection with this is that the Nordic countries have become part of the EU/EES Common Labour Market.
In the first decades after the establishment of the Common Nordic Labour Market, Sweden was the main country of destination and Fin-
Julian Simon Lecture Series
land the main country of origin. Higher incomes and many job vacancies made moving to Sweden attractive. In the 1970s, intra-Nordic migration declined, and Sweden gradually lost its dominant position as the country of destination. The income differences had diminished or disappeared. In-stead, Norway gradually became more important as a country of destina-tion. In the 2000s, commuting across the borders increased. However, the commuting and migration across borders is still much smaller than the commuting and migration within the countries.
The character of the migration has also changed over time. At the start, it was largely a migration of blue-collar workers. The migration now has a much more diverse composition. The economic situation of the mi-grants has also changed. The wage rates of new migrants coming from Nordic countries to Sweden are no longer lower than those of natives, but slightly higher, even if controlling for education and other individual char-acteristics.
Keywords: international migration, immigrants, common labour market, earnings, employmentJEL Codes: J15, J31, J61
Julian Simon Lecture Series – About AM2 and Julian Simon Lecture
About the IZA Annual Migration Meeting (AM2) and the Julian Simon Lecture:
In June 2004, IZA hosted the first Annual Migration Meeting (AM2) in Bonn. It was created to foster migration research by bringing together in-ternational researchers and establishing the IZA migration group. AM2 established the Julian Simon Keynote Lecture in honor of Julian Simon, in recognition of his research on the economic effects of population change.
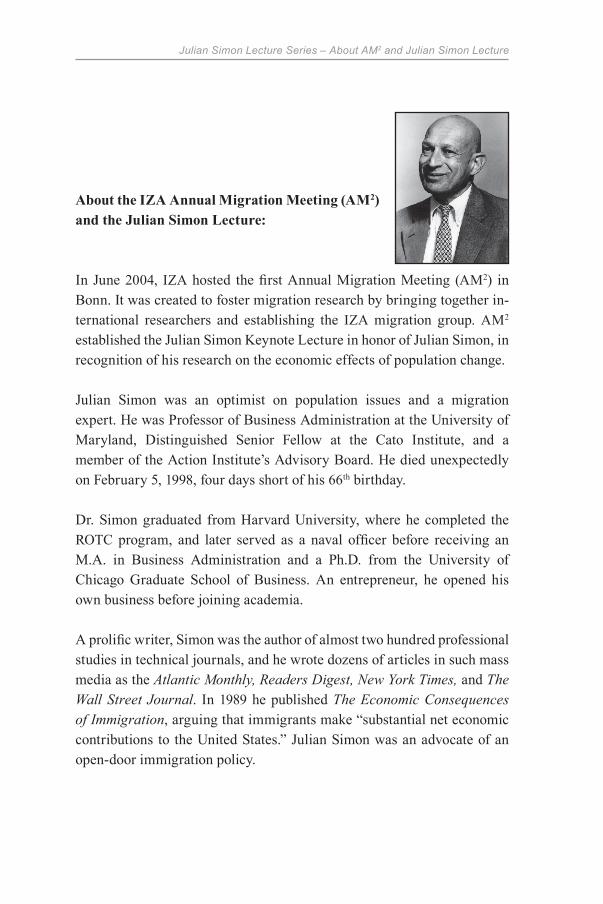
Julian Simon was an optimist on population issues and a migration expert. He was Professor of Business Administration at the University of Maryland, Distinguished Senior Fellow at the Cato Institute, and a member of the Action Institute’s Advisory Board. He died unexpectedly on February 5, 1998, four days short of his 66th birthday.
Dr. Simon graduated from Harvard University, where he completed the ROTC program, and later served as a naval officer before receiving an M.A. in Business Administration and a Ph.D. from the University of Chicago Graduate School of Business. An entrepreneur, he opened his own business before joining academia.
A prolific writer, Simon was the author of almost two hundred professional studies in technical journals, and he wrote dozens of articles in such mass media as the Atlantic Monthly, Readers Digest, New York Times, and The Wall Street Journal. In 1989 he published The Economic Consequences of Immigration, arguing that immigrants make “substantial net economic contributions to the United States.” Julian Simon was an advocate of an open-door immigration policy.
Julian Simon Lecture Series – About the Author
About the Author
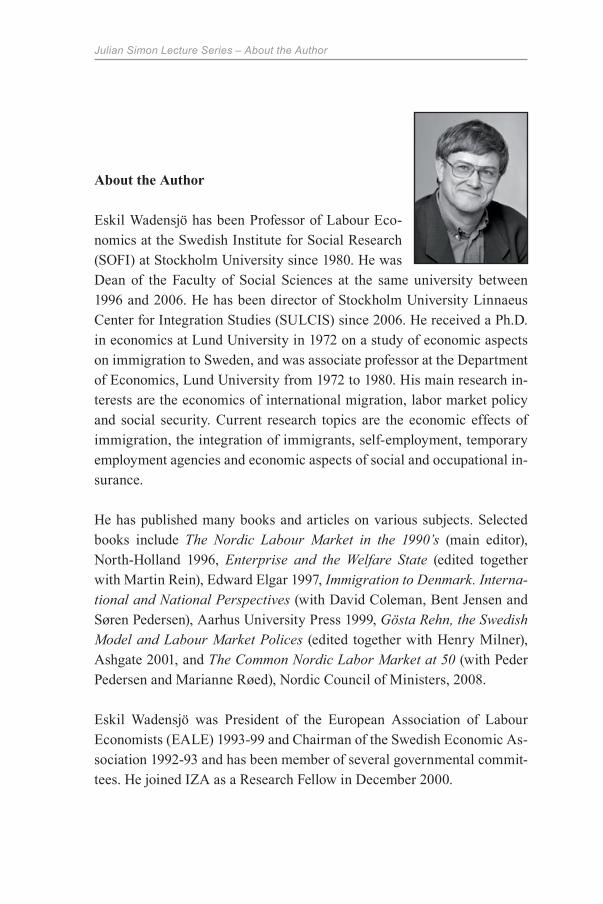
Eskil Wadensjö has been Professor of Labour Eco-nomics at the Swedish Institute for Social Research (SOFI) at Stockholm University since 1980. He was Dean of the Faculty of Social Sciences at the same university between 1996 and 2006. He has been director of Stockholm University Linnaeus Center for Integration Studies (SULCIS) since 2006. He received a Ph.D. in economics at Lund University in 1972 on a study of economic aspects on immigration to Sweden, and was associate professor at the Department of Economics, Lund University from 1972 to 1980. His main research in-terests are the economics of international migration, labor market policy and social security. Current research topics are the economic effects of immigration, the integration of immigrants, self-employment, temporary employment agencies and economic aspects of social and occupational in-surance.
He has published many books and articles on various subjects. Selected books include The Nordic Labour Market in the 1990’s (main editor), North-Holland 1996, Enterprise and the Welfare State (edited together with Martin Rein), Edward Elgar 1997, Immigration to Denmark. Interna-tional and National Perspectives (with David Coleman, Bent Jensen and Søren Pedersen), Aarhus University Press 1999, Gösta Rehn, the Swedish Model and Labour Market Polices (edited together with Henry Milner), Ashgate 2001, and The Common Nordic Labor Market at 50 (with Peder Pedersen and Marianne Røed), Nordic Council of Ministers, 2008.
Eskil Wadensjö was President of the European Association of Labour Economists (EALE) 1993-99 and Chairman of the Swedish Economic As-sociation 1992-93 and has been member of several governmental commit-tees. He joined IZA as a Research Fellow in December 2000.
Julian Simon Lecture Series – Eskil Wadensjö
7
Introduction1
There is a general tendency to reduce or eliminate hinders for mobility between different countries for goods and services as well as for factors of production. This tendency is strong regarding the mobility of goods and services but much weaker regarding the mobility of labour. There are, however, developments that facilitate labour mobility also over interna-tional borders including the foundation of common labour markets. The most well-known example of a common labour market is that of the Eu-ropean Union2, but there are tendencies in that direction in other parts of the world, for example Mercosur in South America with rules facilitating entry for those moving between countries belonging to this organization. The oldest common labour market, however, is the Common Nordic La-bour Market (CNLM), which was formally established in July 1954 after an agreement had been reached in May the same year.3 It could therefore be a good idea to try to learn from the experiences of the CNLM.
Even if the CNLM was established in 1954, the development towards a common Nordic labour market started much earlier and it was not com-plete with the decision taken in 1954. Many restrictions for mobility re-mained even after that. Some of these hinders for mobility were eliminated later but some are still there. On a few occasions new policies have even been introduced with the intention to diminish mobility between the Nor-dic countries.
The inter-Nordic migration from the start of the CNLM in 1954 up to the early 1970s, and even before that, was to a very high extent a migration to Sweden with Finland as main source country, but also many from the other Nordic countries moved to Sweden. In the 1970s, the pattern gradu-ally changed due to business cycle variations and gradually smaller wage differences or even reversed wage differences between the Nordic coun-
1 I rely to a high extent on a joint study with Peder Pedersen and Marianne Røed (see Pedersen, Røed and Wadensjö, 2008) on the first 50 years of the Common Nordic Labour Market and on Boguslaw (forthcoming) on the development of the regulation of immigra-tion and immigrants over time in Sweden. I want to thank Christer Gerdes for help with estimations based on the SIEPS data base.
2 See Kahanec and Zimmermann (2009) and Black et al. (forthcoming) for a number of articles on the European Union Common Labour Market.
3 Iceland joined the CNLM in 1955, one year later than the other Nordic countries.
Experiences of the Common Nordic Labour Market
8
tries. All the time a large migration flow in one direction was followed by a large return migration flow in the other direction in the years to follow. Many of the inter-Nordic migrants lived in the country of destination for only a short period and many moved back and forth several times.
The labour market situation for foreign born workers is a hot politi-cal issue today in all Nordic countries like it is in many other countries in Western Europe. In these discussions, the conditions of those coming from other Nordic countries are mostly not mentioned (just like the conditions for immigrants who were born in other Western European countries). An implicit assumption is that there are no reasons to worry about the condi-tions of the immigrants coming from neighbouring countries. This has not always been the case, however. In the 1960s and early 1970s, the situation of labour migrants from Finland was in focus for the political debate in both Sweden and Finland.
Sweden is still the country with most immigrants from other Nordic countries. I will present some information on the current labour market situation in Sweden for immigrants from the other Nordic countries and try to answer the question if there are any reasons to be worried about their labour market situation.
A fairly recent phenomenon is that many do not actually change their residence from one Nordic country to another but instead commute over the border – living in one country and working in another. This could either be on a daily basis (common between Sweden and Denmark) or on a weekly basis or for even longer periods (common between Sweden and Norway). Many also move from Denmark to Sweden but continue to work in Denmark. I will discuss that phenomenon later on.
The Prehistory of the Common Nordic Labour Market
The history of economic cooperation between the Nordic countries is long. It started already in the 19th century. One example is the currency union which was agreed between Denmark and Sweden in 1873 with Norway joining in 1875.4 In that period Finland was a part of the Russian Empire and Iceland was a part of Denmark and by that included in the currency
4 See Bergman, Gerlach and Jonung (1993).
Julian Simon Lecture Series – Eskil Wadensjö
9
union. The currency union lasted in practice to the end of the 1910s.5 The economic development during WW1 led to that the three member coun-tries chose separate economic policy regimes making it impossible for them to continue to have a common currency. The history of the Scandi-navian currency union and its decline and fall is of interest for the present discussion of European economic affairs.
The late 19th century was characterized by open borders in Europe. Passports and visas were not required and those who were offered a job could take it without special permits from the state. The worries of the Scandinavian countries were instead mainly regarding emigration to over-seas countries.6 Attempts were made to reduce the outflow of people of active age. The open borders did not mean that those coming from other Nordic countries had a right to support if out of work, but at that time even those living in the country of citizenship were not covered by income transfer programs – the welfare state had not yet come into being.
The migration flows at that time were mainly from Europe, including the Scandinavian countries, to the United States and other overseas coun-tries. The propensity to emigrate was much larger in Norway and Swe-den than in Denmark.7 At the same time there were rather large migration flows within Scandinavia. They went mainly from Sweden to Denmark and Norway. Many left for seasonal work and others for longer periods of stay. Those migrating to neighbouring countries are mainly to be found among those who did not have means to finance the journey to the United States. Many went from the southern part of Sweden to Denmark and from the western part of Sweden to Norway (mainly to the Oslo area). Some also moved from southern Sweden to the northern part of Germany. In the period 1860 to 1910, 81,000 moved from Sweden to Denmark, 66,000 to Norway and 28,000 to Germany.
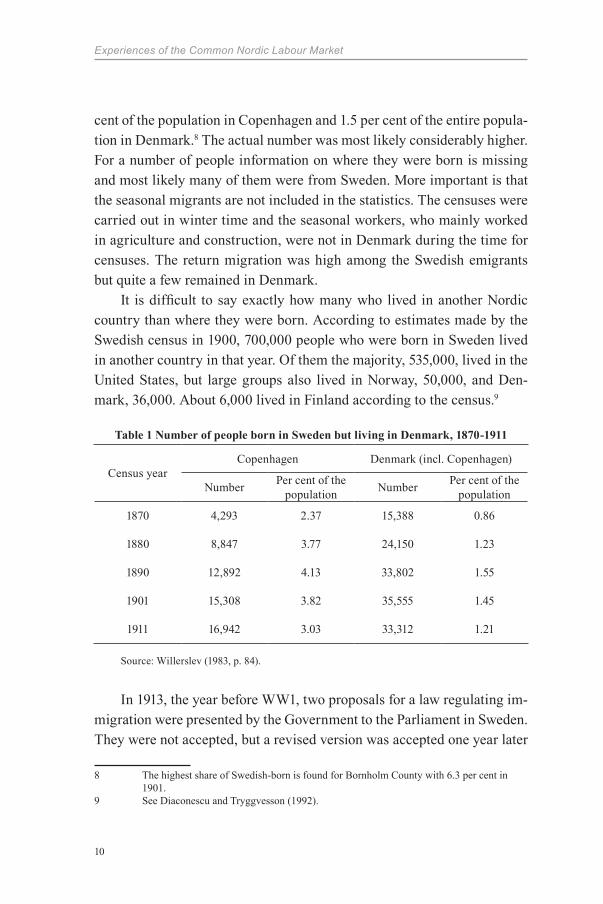
Table 1 gives the numbers of people who were born in Sweden but liv-ing in Denmark according to the Danish censuses in the period between 1870 and 1911. At the peak, the Swedish-born constituted more than 4 per 5 The agreement on the currency union was valid until 1972 in a formal sense, but in prac-
tice it ended much earlier. 6 See Wadensjö (2008) for a presentation of the discussion in the early 20th century. 7 See the many studies of Emigrationsutredningen, a Swedish governmental commission,
which delivered its final report on emigration from Sweden in 1913. See especially Emi-grationsutredningen (1913).
Experiences of the Common Nordic Labour Market
10
cent of the population in Copenhagen and 1.5 per cent of the entire popula-tion in Denmark.8 The actual number was most likely considerably higher. For a number of people information on where they were born is missing and most likely many of them were from Sweden. More important is that the seasonal migrants are not included in the statistics. The censuses were carried out in winter time and the seasonal workers, who mainly worked in agriculture and construction, were not in Denmark during the time for censuses. The return migration was high among the Swedish emigrants but quite a few remained in Denmark.
It is difficult to say exactly how many who lived in another Nordic country than where they were born. According to estimates made by the Swedish census in 1900, 700,000 people who were born in Sweden lived in another country in that year. Of them the majority, 535,000, lived in the United States, but large groups also lived in Norway, 50,000, and Den-mark, 36,000. About 6,000 lived in Finland according to the census.9
Table 1 Number of people born in Sweden but living in Denmark, 1870-1911
Census yearCopenhagen Denmark (incl. Copenhagen)
Number Per cent of the population Number Per cent of the
population
1870 4,293 2.37 15,388 0.86
1880 8,847 3.77 24,150 1.23
1890 12,892 4.13 33,802 1.55
1901 15,308 3.82 35,555 1.45
1911 16,942 3.03 33,312 1.21
Source: Willerslev (1983, p. 84).
In 1913, the year before WW1, two proposals for a law regulating im-migration were presented by the Government to the Parliament in Sweden. They were not accepted, but a revised version was accepted one year later
8 The highest share of Swedish-born is found for Bornholm County with 6.3 per cent in 1901.
9 See Diaconescu and Tryggvesson (1992).
Julian Simon Lecture Series – Eskil Wadensjö
11
by the Parliament. This law was not a result of worries regarding labour migration but of perceived social problems and problems regarding inter-nal and external security. A more important change was introduced dur-ing WW1 by requiring a passport and visa for those coming to Sweden. 10 The main intention was to increase security in a war period. For citizens from Denmark, Iceland and Norway a passport but not a visa was required from 1921 on. The policy introduced during WW1 was retained in most parts after the war, but the visa requirement was abolished after bilateral agreements in the inter-war period for citizens of a number of countries in the 1920s. An agreement was reached with Finland in 1928. From 1926 a work permit was required for non-Swedish citizens employed in Sweden.
The history of immigration policy changes during WW1 was repeated during WW2. Visas were required for non-Swedish citizens wanting to enter Sweden even for citizens of countries Sweden had bilateral agree-ments with. The visa requirement was reintroduced as a response to the involvement of gradually more countries in the war. For citizens in Ger-many, Austria and Czechoslovakia the visa requirement was reintroduced in 1938 and for all other countries than the Nordic ones in 1939. For Danish citizens it was reintroduced from April 12, 1940, for Norwegian citizens from May 21, 1940 and for Finnish citizens from June 13, 1941.
During WW2 many refugees arrived from the neighbouring Nordic countries to Sweden. Many stayed for long periods until the end of the war. A decision valid from October 1, 1943 was taken that citizens from the Nordic countries did not need a work permit. This may be seen as the first step to the modern version of a common Nordic labour market. This facilitated for refugees to get jobs during their stay in Sweden.
10 There were exceptions from the passport requirement for those living in the border re-gions of Denmark and Norway.
Experiences of the Common Nordic Labour Market
12
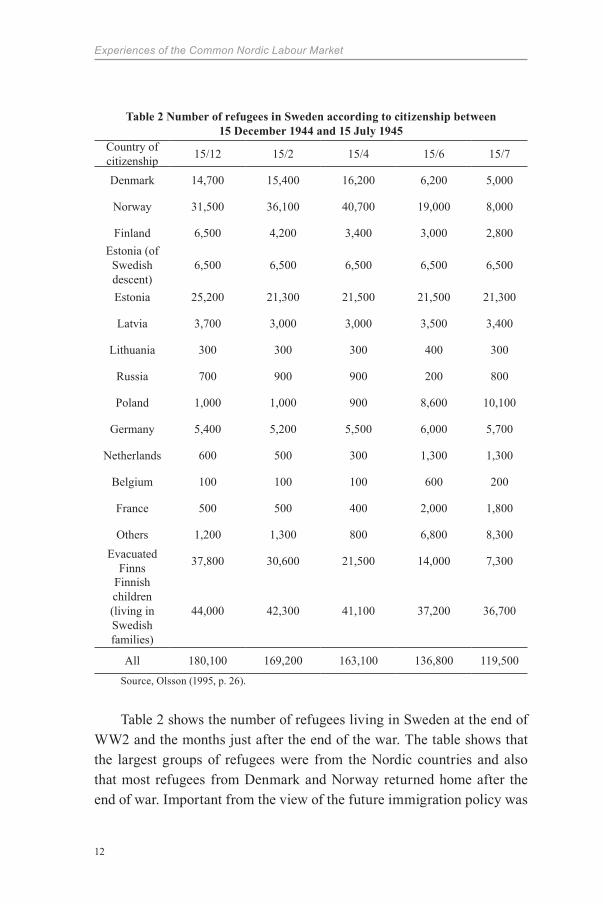
Table 2 Number of refugees in Sweden according to citizenship between 15 December 1944 and 15 July 1945
Country of citizenship 15/12 15/2 15/4 15/6 15/7
Denmark 14,700 15,400 16,200 6,200 5,000
Norway 31,500 36,100 40,700 19,000 8,000
Finland 6,500 4,200 3,400 3,000 2,800Estonia (of
Swedish descent)
6,500 6,500 6,500 6,500 6,500
Estonia 25,200 21,300 21,500 21,500 21,300
Latvia 3,700 3,000 3,000 3,500 3,400
Lithuania 300 300 300 400 300
Russia 700 900 900 200 800
Poland 1,000 1,000 900 8,600 10,100
Germany 5,400 5,200 5,500 6,000 5,700
Netherlands 600 500 300 1,300 1,300
Belgium 100 100 100 600 200
France 500 500 400 2,000 1,800
Others 1,200 1,300 800 6,800 8,300Evacuated
Finns 37,800 30,600 21,500 14,000 7,300
Finnish children (living in Swedish families)
44,000 42,300 41,100 37,200 36,700
All 180,100 169,200 163,100 136,800 119,500
Source, Olsson (1995, p. 26).
Table 2 shows the number of refugees living in Sweden at the end of WW2 and the months just after the end of the war. The table shows that the largest groups of refugees were from the Nordic countries and also that most refugees from Denmark and Norway returned home after the end of war. Important from the view of the future immigration policy was
Julian Simon Lecture Series – Eskil Wadensjö
13
that Sweden changed from being a country of emigration to a country of immigration during the war. Many people in Sweden grew accustomed to that people from other countries lived in Sweden.
The Foundation and Development of the Framework of the Common Nordic Labour Market11
Already in the 1930s negotiations started regarding an agreement on a common Nordic labour market. They were interrupted by the war but started again in 1945 with a meeting of the ministers of social affairs in Copenhagen. An agreement was reached on abolishing work permits for intra-Nordic migrants but this agreement was only ratified by Denmark and Sweden and therefore not implemented.
Sweden abolished the visa requirement in August 1945 for citizens from Denmark, Iceland and Norway and in December 1949 also for Finn-ish citizens. Denmark did the same for Swedish citizens in 1946 and Ice-landic and Norwegian citizens in 1952. At the time of the founding of the CNLM, Denmark only had visa requirements for migrants from Finland.
The Nordic Council was founded in 1952. The Nordic Council is the official inter-parliamentary body in the Nordic Region. Political discus-sions are held with members of the governments of the five Nordic coun-tries (Denmark, Finland, Iceland, Norway and Sweden) and the three au-tonomous territories (Faeroe Islands, Greenland and Åland) at the annual Session of the Nordic Council. It can be seen as a policy to strengthen co-operation between the Nordic countries. One of the first visible results of this cooperation was the foundation of the Common Nordic Labour Mar-ket in May 1954. The agreement meant that a citizen of a Nordic country who moved to another Nordic country should have the same rights as the citizens of the country they were staying in. In 1957, passport controls for those travelling between the Nordic countries were abolished.
This development did not mean that the obstacles for mobility be-tween the Nordic countries were reduced to the same level as those for mo-bility within the countries. On the contrary, many impediments for mobil-ity were still there. One major impediment for mobility between countries
11 See Boguslaw (forthcoming) for details.
Experiences of the Common Nordic Labour Market
14
is that credentials from one country are not always accepted in another country. It may lead to that people do not migrate and that those who mi-grate have to take jobs outside the occupation they are trained for or to repeat all or parts of their education. Such restrictions were important, for example in the health sector, and they were not abolished by the general agreement of a common labour market for the Nordic countries in 1954. For the health sector separate agreements were reached regarding medical doctors in 1960, dentists in 1964 and nurses in 1968 and for other health sector occupations in the 1970s and the 1980s implying that degrees from other Nordic countries should be accepted. A general agreement for all oc-cupations in the health sector was reached in 1993. Agreements for other occupations were also reached, for example for primary and secondary school teachers.
Another example of the gradual development is a convention regard-ing social security that was decided on in September 1955. This conven-tion and other conventions and agreements reduce mobility costs but do not mean that all of them are eliminated.
Immigration to Sweden expanded rapidly in the 1960s and became an important issue in the political debate. The policy regarding work per-mits was changed. A prospective migrant was required to apply for a work permit and get it approved before entering the country, and the imple-mentation of the law gradually became stricter. This did not concern the migration from the other Nordic countries to Sweden as the CNLM was still in force. The migration flow from Finland, which was the largest one, increased instead and reached its all time high in 1970. A discussion on how to reduce the immigration from Finland started and two new policies were introduced wholly or partially with the intention to reduce labour migration from Finland to Sweden.
One of those policies was the law on 240 hours of lessons in the Swed-ish language for foreign employees with the wages for those hours paid by the employer. It was passed by the Parliament in 1972 and became effective from July 1, 1973. It covered all foreign citizens who did not have Swedish, Danish or Norwegian as their mother tongue. This law covered in practice all foreign citizens from countries outside the CNLM but also the large
Julian Simon Lecture Series – Eskil Wadensjö
15
majority of immigrants from Finland.12 Those from Denmark and Norway were not covered, however. The similarity between the three Scandinavian languages was the motivation for the exception. The aims of the law were two: First, to improve Swedish language proficiency among immigrants and thereby make it easier for them to integrate into the Swedish society, and second to make the employers less eager to recruit workers from Fin-land by increasing their costs. The intention stated in the proposal from the Government to the Parliament was to only include immigrants who ar-rived after the law became valid but this was changed by the Parliament so that even those who had arrived earlier were included. In the recession of the early 1970s, the unemployment rose much more for immigrants from Finland than for immigrants from Denmark and Norway. One explanation could be the increased costs for employers of hiring Finnish citizens as a result of the new law. This development, however, started before the law went into force, but the employers could have acted as a response to the information they had on the likely outcome of the political process in Par-liament.13 Estimations on migration flows determinants show that this law led to a decline in immigration from Finland.14
The second policy intended to diminish migration between Finland and Sweden was introduced on the same date as the first one, July 1, 1973. Labour migration from Finland to Sweden in the 1950s and 1960s was mainly a migration of workers. In the 1960s most migrants were men from the countryside in northern Finland moving from jobs in agriculture to jobs in the manufacturing sector in Sweden. It was easier to find a job, the wages were higher and the housing situation was better in Sweden than in southern Finland, the alternative migration destination. Around 1970, Swedish employers also started to actively recruit people with higher than just basic educations. Young people with secondary education or higher education were recruited. Some employers recruited more or less all of the students in classes that completed their exams at secondary engineering schools or nursing schools. Finnish employers protested and got support from the Swedish trade unions. An agreement was reached between the
12 Finland has two official languages, Finnish and Swedish. About 95 per cent of the popula-tion has Finnish as their mother tongue. Most of them are not fluent in Swedish.
13 See Wadensjö (1975).14 See Wadensjö (1976).
Experiences of the Common Nordic Labour Market
16
employer associations, the trade unions and governmental authorities in the two countries. The main part of the agreement was that the Swedish employers should not actively recruit workers themselves in Finland, but should instead make use of the services of the employment offices. The implicit assumption that the employment offices would be less efficient in recruiting workers from another country was not mentioned in the text of the agreement.
The content of this agreement was later included in the revised agree-ment on the CNLM from 1982, valid from August 1, 1983. This new ver-sion included also the content of other Nordic agreements decided on from 1954 on. In the new version of the CNLM agreement it was declared that the employment offices should be used for recruitment by all employ-ers wanting to recruit workers from another Nordic country, not only by Swedish employers recruiting in Finland. The revised version of the agreement also includes a statement that each country should dimension its educational system with the intention to balance demand and supply so that as many persons are educated for different occupations, for example engineers and nurses, as there is demand for in the country.
Variations in the Size and Composition of Migration Flows over Time
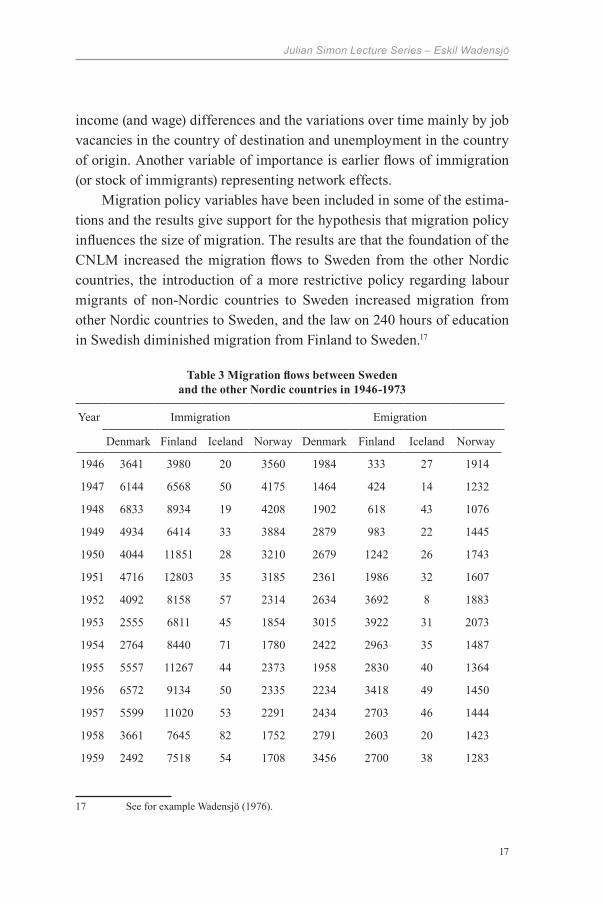
The migration in the end of the 1940s and the 1950s up to the founding of CNLM was mainly labour migration to Sweden and it continued in that way up to the early 1970s. Table 3 gives the basic data. Finland became the largest country of origin already in the 1940s. An all-time high was reached in 1970.15 After that the migration from Finland declined very much. The table also shows that there were also large migration flows back from Sweden to Finland.
There are a number of studies on the determinants of the migration flows.16 They show that the direction of the flows is determined mainly by
15 A part of the increase in 1970 may be due to the introduction of a common registration system for migration between the Nordic counties introduced from October 1, 1969.
16 For some examples see Eriksson (1989), Hietala (1978), Lundborg (1991), Nyberg (1980), Ohlsson (1975), Pedersen (1996), Røed (1996) and Wadensjö (1973, 1975 and 1976). For a survey and some new estimations see Pedersen, Røed and Wadensjö (2008).
Julian Simon Lecture Series – Eskil Wadensjö
17
income (and wage) differences and the variations over time mainly by job vacancies in the country of destination and unemployment in the country of origin. Another variable of importance is earlier flows of immigration (or stock of immigrants) representing network effects.
Migration policy variables have been included in some of the estima-tions and the results give support for the hypothesis that migration policy influences the size of migration. The results are that the foundation of the CNLM increased the migration flows to Sweden from the other Nordic countries, the introduction of a more restrictive policy regarding labour migrants of non-Nordic countries to Sweden increased migration from other Nordic countries to Sweden, and the law on 240 hours of education in Swedish diminished migration from Finland to Sweden.17
Table 3 Migration flows between Sweden and the other Nordic countries in 1946-1973
17 See for example Wadensjö (1976).
Year Immigration Emigration
Denmark Finland Iceland Norway Denmark Finland Iceland Norway
1946 3641 3980 20 3560 1984 333 27 1914
1947 6144 6568 50 4175 1464 424 14 1232
1948 6833 8934 19 4208 1902 618 43 1076
1949 4934 6414 33 3884 2879 983 22 1445
1950 4044 11851 28 3210 2679 1242 26 1743
1951 4716 12803 35 3185 2361 1986 32 1607
1952 4092 8158 57 2314 2634 3692 8 1883
1953 2555 6811 45 1854 3015 3922 31 2073
1954 2764 8440 71 1780 2422 2963 35 1487
1955 5557 11267 44 2373 1958 2830 40 1364
1956 6572 9134 50 2335 2234 3418 49 1450
1957 5599 11020 53 2291 2434 2703 46 1444
1958 3661 7645 82 1752 2791 2603 20 1423
1959 2492 7518 54 1708 3456 2700 38 1283
Experiences of the Common Nordic Labour Market
18
Source: Wadensjö (1974).
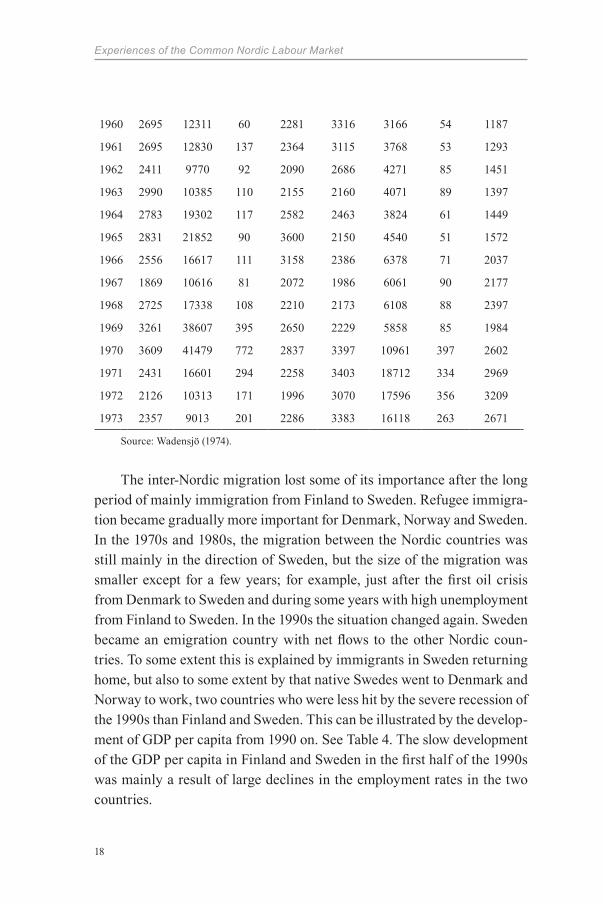
The inter-Nordic migration lost some of its importance after the long period of mainly immigration from Finland to Sweden. Refugee immigra-tion became gradually more important for Denmark, Norway and Sweden. In the 1970s and 1980s, the migration between the Nordic countries was still mainly in the direction of Sweden, but the size of the migration was smaller except for a few years; for example, just after the first oil crisis from Denmark to Sweden and during some years with high unemployment from Finland to Sweden. In the 1990s the situation changed again. Sweden became an emigration country with net flows to the other Nordic coun-tries. To some extent this is explained by immigrants in Sweden returning home, but also to some extent by that native Swedes went to Denmark and Norway to work, two countries who were less hit by the severe recession of the 1990s than Finland and Sweden. This can be illustrated by the develop-ment of GDP per capita from 1990 on. See Table 4. The slow development of the GDP per capita in Finland and Sweden in the first half of the 1990s was mainly a result of large declines in the employment rates in the two countries.
1960 2695 12311 60 2281 3316 3166 54 1187
1961 2695 12830 137 2364 3115 3768 53 1293
1962 2411 9770 92 2090 2686 4271 85 1451
1963 2990 10385 110 2155 2160 4071 89 1397
1964 2783 19302 117 2582 2463 3824 61 1449
1965 2831 21852 90 3600 2150 4540 51 1572
1966 2556 16617 111 3158 2386 6378 71 2037
1967 1869 10616 81 2072 1986 6061 90 2177
1968 2725 17338 108 2210 2173 6108 88 2397
1969 3261 38607 395 2650 2229 5858 85 1984
1970 3609 41479 772 2837 3397 10961 397 2602
1971 2431 16601 294 2258 3403 18712 334 2969
1972 2126 10313 171 1996 3070 17596 356 3209
1973 2357 9013 201 2286 3383 16118 263 2671
Julian Simon Lecture Series – Eskil Wadensjö
19
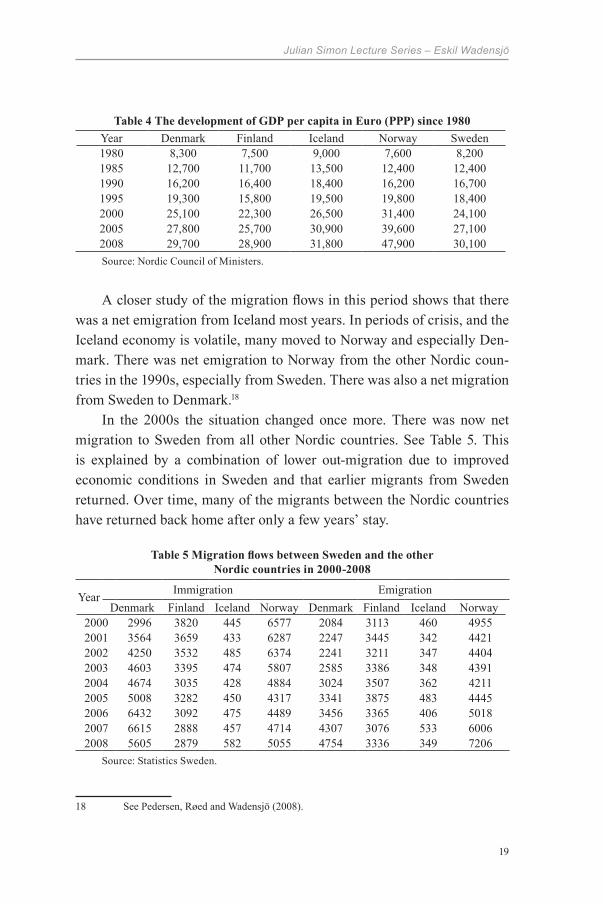
Table 4 The development of GDP per capita in Euro (PPP) since 1980Year Denmark Finland Iceland Norway Sweden1980 8,300 7,500 9,000 7,600 8,2001985 12,700 11,700 13,500 12,400 12,4001990 16,200 16,400 18,400 16,200 16,7001995 19,300 15,800 19,500 19,800 18,4002000 25,100 22,300 26,500 31,400 24,1002005 27,800 25,700 30,900 39,600 27,1002008 29,700 28,900 31,800 47,900 30,100Source: Nordic Council of Ministers.
A closer study of the migration flows in this period shows that there was a net emigration from Iceland most years. In periods of crisis, and the Iceland economy is volatile, many moved to Norway and especially Den-mark. There was net emigration to Norway from the other Nordic coun-tries in the 1990s, especially from Sweden. There was also a net migration from Sweden to Denmark.18
In the 2000s the situation changed once more. There was now net migration to Sweden from all other Nordic countries. See Table 5. This is explained by a combination of lower out-migration due to improved economic conditions in Sweden and that earlier migrants from Sweden returned. Over time, many of the migrants between the Nordic countries have returned back home after only a few years’ stay.
Table 5 Migration flows between Sweden and the other Nordic countries in 2000-2008
Source: Statistics Sweden.
18 See Pedersen, Røed and Wadensjö (2008).
Year Immigration EmigrationDenmark Finland Iceland Norway Denmark Finland Iceland Norway
2000 2996 3820 445 6577 2084 3113 460 49552001 3564 3659 433 6287 2247 3445 342 44212002 4250 3532 485 6374 2241 3211 347 44042003 4603 3395 474 5807 2585 3386 348 43912004 4674 3035 428 4884 3024 3507 362 42112005 5008 3282 450 4317 3341 3875 483 44452006 6432 3092 475 4489 3456 3365 406 50182007 6615 2888 457 4714 4307 3076 533 60062008 5605 2879 582 5055 4754 3336 349 7206
Experiences of the Common Nordic Labour Market
20
The increase in migration from Denmark to Sweden is a different story. Many of the migrants were Danish citizens. One part of the explana-tion is that a bridge over Öresund between Copenhagen and Malmö was completed in June 2000. The fact that housing prices are much lower in Malmö than in Copenhagen led to that a number of people moved from the Copenhagen area to the Malmö area but in most cases continued to work in Copenhagen. Another explanation is the introduction in Denmark of restrictive rules regarding marriage migration. It became much more dif-ficult for young first and second generation immigrants to marry someone from their own or their parents’ home country and get a permit for both spouses to live in Denmark.19 For example, a rule of a minimum age of 25 at marriage for allowing the spouse to enter Denmark was introduced. One solution for such couples was that the partner living in Denmark and being a Danish citizen moved to Sweden (having the right to do so being Danish citizens) and then marry. The less restrictive Swedish rules make it pos-sible for the spouse to move to Sweden. After getting Swedish citizenship after five years the couple has an option to move to Denmark. It is possible to see the effects in the statistics. The increase in mobility to Sweden has been much larger among those aged 20-24 years than among others, and the increase has been especially high among those living in the suburban municipalities to Copenhagen, where many first and second generation immigrants live.
The Labour Market Situation of the Migrants
We will now turn to the situation of labour migrants who have moved from one Nordic country to another. Is the immigrants’ labour market situation worse than that of the natives due to discrimination or other causes? We will use data for Sweden, the country with most immigrants from other Nordic countries. The data contains information for 2006 on all immi-grants from the Nordic countries and native Swedes living in Sweden. The individuals included are those who are registered as living in Sweden at the end of the year. The information on if a person is employed or not is from November, and the information on wages is from September or No-
19 See Schultz-Nielsen (2010).
Julian Simon Lecture Series – Eskil Wadensjö
21
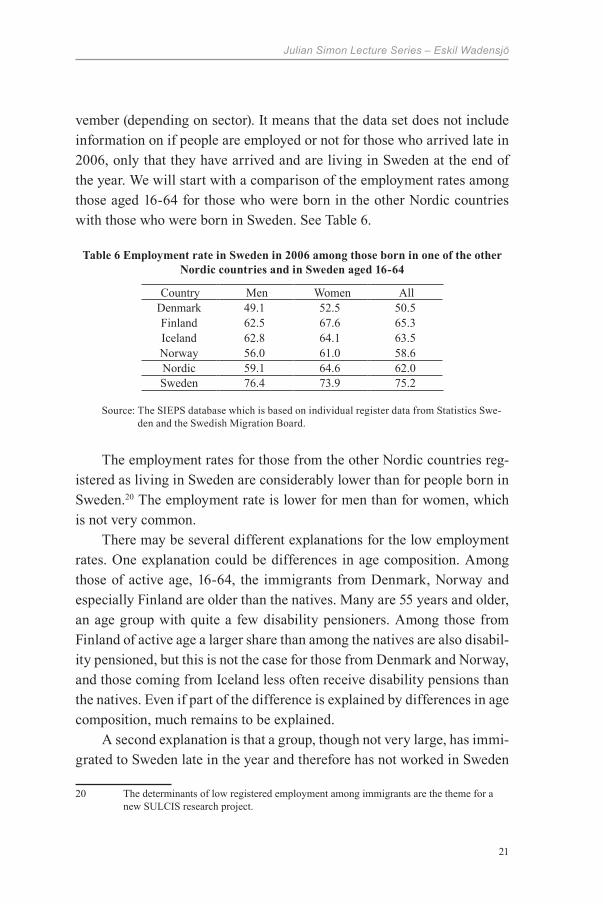
vember (depending on sector). It means that the data set does not include information on if people are employed or not for those who arrived late in 2006, only that they have arrived and are living in Sweden at the end of the year. We will start with a comparison of the employment rates among those aged 16-64 for those who were born in the other Nordic countries with those who were born in Sweden. See Table 6.
Table 6 Employment rate in Sweden in 2006 among those born in one of the other Nordic countries and in Sweden aged 16-64
Source: The SIEPS database which is based on individual register data from Statistics Swe-den and the Swedish Migration Board.
The employment rates for those from the other Nordic countries reg-istered as living in Sweden are considerably lower than for people born in Sweden.20 The employment rate is lower for men than for women, which is not very common.
There may be several different explanations for the low employment rates. One explanation could be differences in age composition. Among those of active age, 16-64, the immigrants from Denmark, Norway and especially Finland are older than the natives. Many are 55 years and older, an age group with quite a few disability pensioners. Among those from Finland of active age a larger share than among the natives are also disabil-ity pensioned, but this is not the case for those from Denmark and Norway, and those coming from Iceland less often receive disability pensions than the natives. Even if part of the difference is explained by differences in age composition, much remains to be explained.
A second explanation is that a group, though not very large, has immi-grated to Sweden late in the year and therefore has not worked in Sweden
20 The determinants of low registered employment among immigrants are the theme for a new SULCIS research project.
Country Men Women AllDenmark 49.1 52.5 50.5Finland 62.5 67.6 65.3Iceland 62.8 64.1 63.5Norway 56.0 61.0 58.6Nordic 59.1 64.6 62.0Sweden 76.4 73.9 75.2
Experiences of the Common Nordic Labour Market
22
in November, the month employment is measured, but is registered as liv-ing in the country at the end of the year.
A third explanation and maybe the most important one is that immi-grants have (re)emigrated without notifying the tax authorities about it and that the registration of emigration is delayed due to that. Our estimations for 2005 show that this group is most likely at least 6.5 per cent of those from Denmark, 1.1 per cent of those from Finland, 2.2 per cent of those from Iceland and 4.0 per cent of those from Norway. The share is highest among those aged 25-35 years, an age group characterized by high mobil-ity.
A fourth explanation is that some of the immigrants are students who do not combine studies with work, but the share who are students is prob-ably lower than among natives due to the age composition.
A fifth explanation is that immigrants are registered as immigrants in Sweden but only work part of the year, for example seasonal work in the summer (and not in November the month employment is measured in the register statistics). This group is most likely small among those coming from other Nordic countries (but much larger for those coming from coun-tries who became members of the European Union in 2004).
A sixth explanation is that some immigrants who are not working are supported by other family members. They may be housewives for ex-ample. This group is also most likely small among those coming from the other Nordic countries.
A seventh explanation is that people work in the unregistered part of the economy (the shadow economy). This is also most likely a very small group among immigrants from the Nordic countries.
An eighth explanation is that people who live in Sweden work in an-other country and therefore are not registered as working in Sweden. This is quite common among those who are from Denmark and may explain why the registered employment rate is considerably lower among those who were born in Denmark than among those who were born in other Nordic countries.
There are only a few studies on the employment in recent years among immigrants from the other Nordic countries. A study of Finnish immi-grants who have lived in Sweden for many years, Saarela and Roth (2006),
Julian Simon Lecture Series – Eskil Wadensjö
23
shows that Finnish immigrant men have considerably lower employment rates than men born in Sweden. The corresponding employment differ-ence between immigrant women born in Finland and women born in Swe-den is much smaller. A comparison of the employment rates of immigrants from the two language groups in Finland, Finnish and Swedish speaking, show that men from the Swedish speaking group perform more or less like the Swedish born men but that the Finnish speaking ones are doing worse. See Saarela and Finnäs (2006).
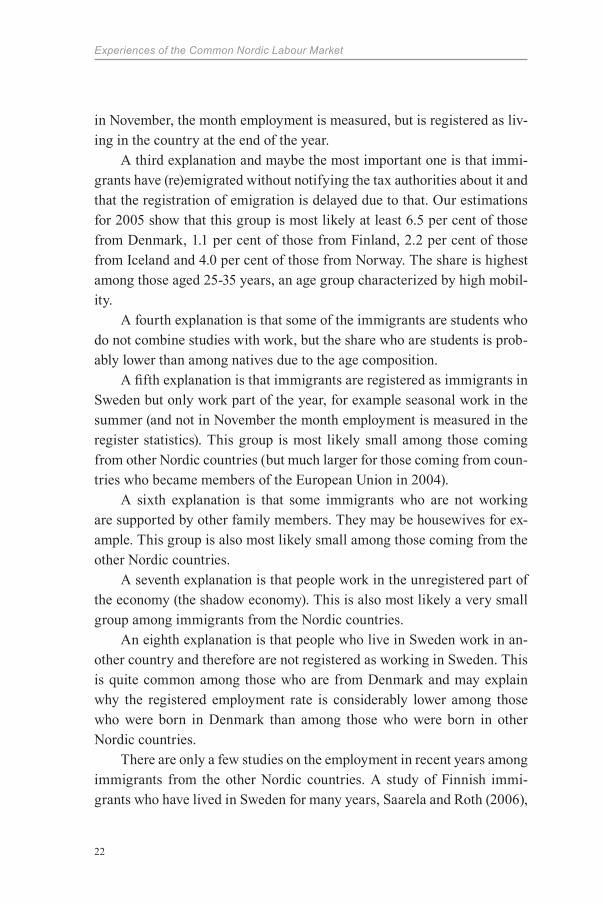
The employment rate estimations have to be interpreted with care, but information on working hours, wages, industry and education for those employed does not suffer from the same problems. In Table 7 information on working hours in 2006 is shown. There are only small differences be-tween those born in Sweden and those born in the other Nordic countries.
Table 7 Working hours in Sweden in 2006 among those born in one of the Nordic countries and in Sweden aged 16-64
Note. Only those employed are included. Source: The SIEPS database which is based on individual register data from Statistics Sweden
and the Swedish Migration Board.
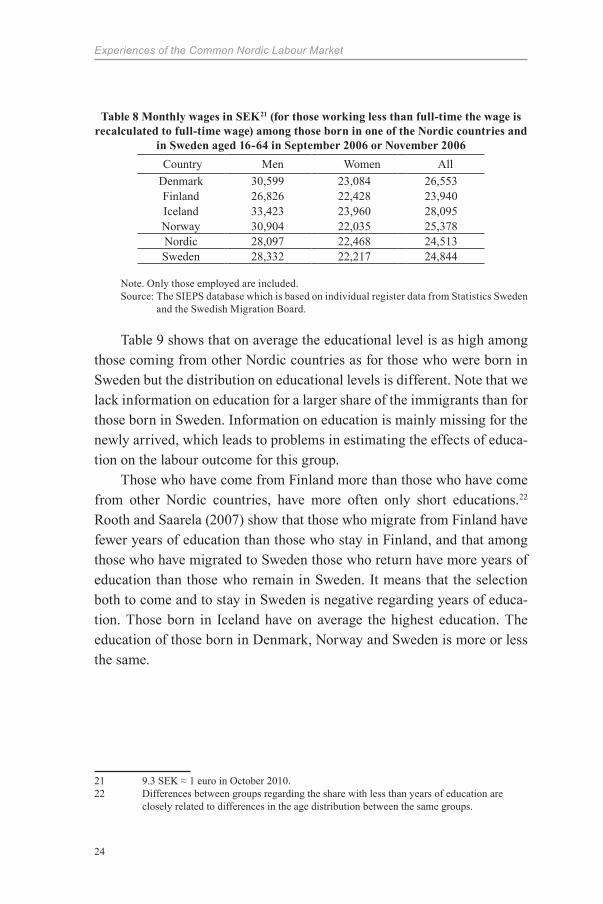
Table 8 shows the monthly average wage (recalculated to full-time monthly wage for those not working full-time) for people who were born in the other Nordic countries and those who were born in Sweden. The average monthly wage is slightly lower for men and slightly higher for women for those born in other Nordic countries than Sweden. There are differences however between those coming from different Nordic coun-tries. Men from Finland have on average lower wages than those who were born in Sweden, who on the other hand have lower wages on average than those who were born in the three other Nordic countries. Differences in the composition according to age and education may contribute to explain the differences.
Country Men Women AllDenmark 134.9 118.1 125.9Finland 139.2 122.9 128.5Iceland 132.5 112.8 121.4Norway 137.2 115.7 123.8Nordic 138.1 121.3 127.4Sweden 138.7 117.9 126.8
Experiences of the Common Nordic Labour Market
24
Table 8 Monthly wages in SEK21 (for those working less than full-time the wage is recalculated to full-time wage) among those born in one of the Nordic countries and
in Sweden aged 16-64 in September 2006 or November 2006
Note. Only those employed are included.Source: The SIEPS database which is based on individual register data from Statistics Sweden
and the Swedish Migration Board.
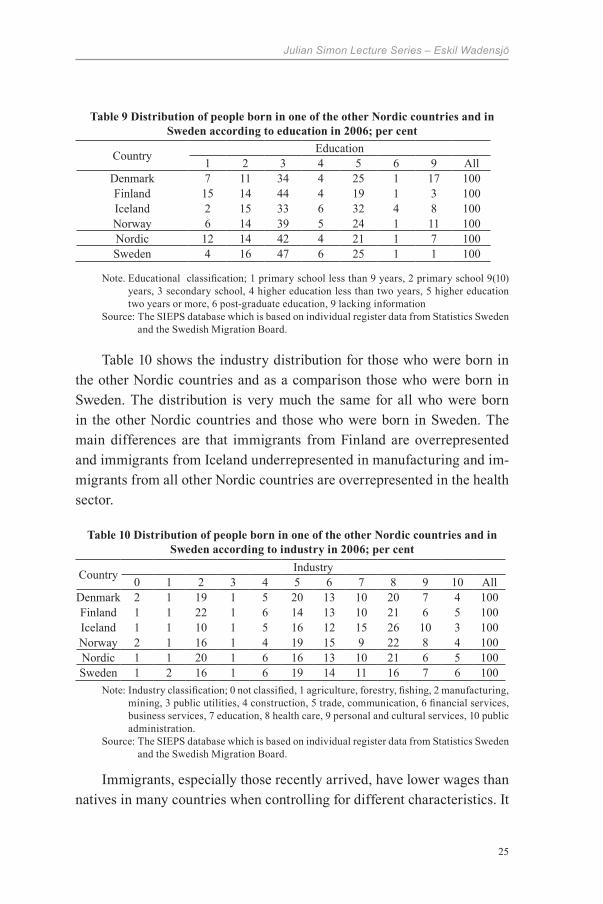
Table 9 shows that on average the educational level is as high among those coming from other Nordic countries as for those who were born in Sweden but the distribution on educational levels is different. Note that we lack information on education for a larger share of the immigrants than for those born in Sweden. Information on education is mainly missing for the newly arrived, which leads to problems in estimating the effects of educa-tion on the labour outcome for this group.
Those who have come from Finland more than those who have come from other Nordic countries, have more often only short educations.22 Rooth and Saarela (2007) show that those who migrate from Finland have fewer years of education than those who stay in Finland, and that among those who have migrated to Sweden those who return have more years of education than those who remain in Sweden. It means that the selection both to come and to stay in Sweden is negative regarding years of educa-tion. Those born in Iceland have on average the highest education. The education of those born in Denmark, Norway and Sweden is more or less the same.
21 9.3 SEK ≈ 1 euro in October 2010.22 Differences between groups regarding the share with less than years of education are
closely related to differences in the age distribution between the same groups.
Country Men Women AllDenmark 30,599 23,084 26,553Finland 26,826 22,428 23,940Iceland 33,423 23,960 28,095Norway 30,904 22,035 25,378Nordic 28,097 22,468 24,513Sweden 28,332 22,217 24,844
Julian Simon Lecture Series – Eskil Wadensjö
25
Table 9 Distribution of people born in one of the other Nordic countries and in Sweden according to education in 2006; per cent
Country Education1 2 3 4 5 6 9 All
Denmark 7 11 34 4 25 1 17 100Finland 15 14 44 4 19 1 3 100Iceland 2 15 33 6 32 4 8 100Norway 6 14 39 5 24 1 11 100Nordic 12 14 42 4 21 1 7 100Sweden 4 16 47 6 25 1 1 100
Note. Educational classification; 1 primary school less than 9 years, 2 primary school 9(10) years, 3 secondary school, 4 higher education less than two years, 5 higher education two years or more, 6 post-graduate education, 9 lacking information
Source: The SIEPS database which is based on individual register data from Statistics Sweden and the Swedish Migration Board.
Table 10 shows the industry distribution for those who were born in the other Nordic countries and as a comparison those who were born in Sweden. The distribution is very much the same for all who were born in the other Nordic countries and those who were born in Sweden. The main differences are that immigrants from Finland are overrepresented and immigrants from Iceland underrepresented in manufacturing and im-migrants from all other Nordic countries are overrepresented in the health sector.
Table 10 Distribution of people born in one of the other Nordic countries and in Sweden according to industry in 2006; per cent
Note: Industry classification; 0 not classified, 1 agriculture, forestry, fishing, 2 manufacturing, mining, 3 public utilities, 4 construction, 5 trade, communication, 6 financial services, business services, 7 education, 8 health care, 9 personal and cultural services, 10 public administration.
Source: The SIEPS database which is based on individual register data from Statistics Sweden and the Swedish Migration Board.
Immigrants, especially those recently arrived, have lower wages than natives in many countries when controlling for different characteristics. It
Country Industry0 1 2 3 4 5 6 7 8 9 10 All
Denmark 2 1 19 1 5 20 13 10 20 7 4 100Finland 1 1 22 1 6 14 13 10 21 6 5 100Iceland 1 1 10 1 5 16 12 15 26 10 3 100Norway 2 1 16 1 4 19 15 9 22 8 4 100Nordic 1 1 20 1 6 16 13 10 21 6 5 100Sweden 1 2 16 1 6 19 14 11 16 7 6 100
Experiences of the Common Nordic Labour Market
26
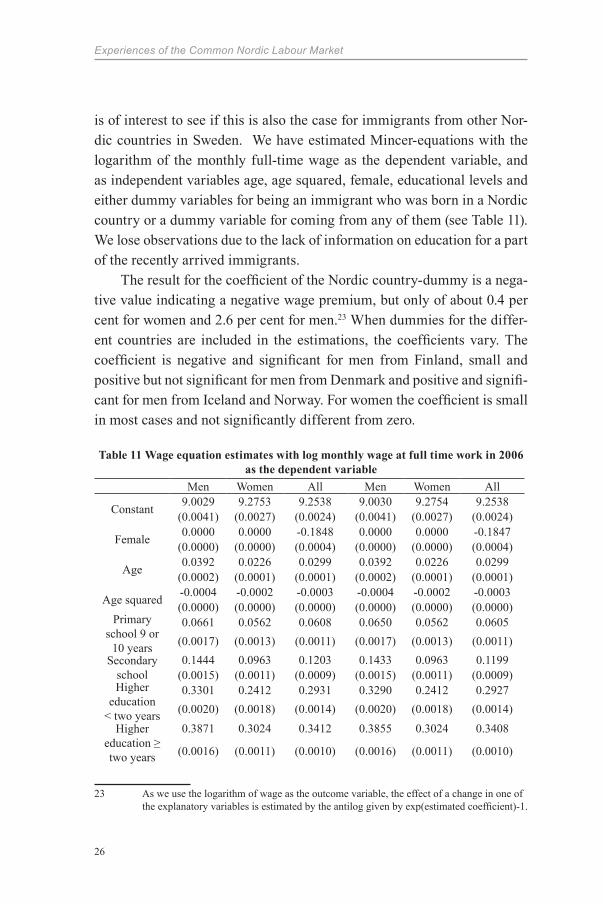
is of interest to see if this is also the case for immigrants from other Nor-dic countries in Sweden. We have estimated Mincer-equations with the logarithm of the monthly full-time wage as the dependent variable, and as independent variables age, age squared, female, educational levels and either dummy variables for being an immigrant who was born in a Nordic country or a dummy variable for coming from any of them (see Table 11). We lose observations due to the lack of information on education for a part of the recently arrived immigrants.
The result for the coefficient of the Nordic country-dummy is a nega-tive value indicating a negative wage premium, but only of about 0.4 per cent for women and 2.6 per cent for men.23 When dummies for the differ-ent countries are included in the estimations, the coefficients vary. The coefficient is negative and significant for men from Finland, small and positive but not significant for men from Denmark and positive and signifi-cant for men from Iceland and Norway. For women the coefficient is small in most cases and not significantly different from zero.
Table 11 Wage equation estimates with log monthly wage at full time work in 2006 as the dependent variable
Men Women All Men Women All
Constant 9.0029 9.2753 9.2538 9.0030 9.2754 9.2538(0.0041) (0.0027) (0.0024) (0.0041) (0.0027) (0.0024)
Female 0.0000 0.0000 -0.1848 0.0000 0.0000 -0.1847(0.0000) (0.0000) (0.0004) (0.0000) (0.0000) (0.0004)
Age 0.0392 0.0226 0.0299 0.0392 0.0226 0.0299(0.0002) (0.0001) (0.0001) (0.0002) (0.0001) (0.0001)
Age squared -0.0004 -0.0002 -0.0003 -0.0004 -0.0002 -0.0003(0.0000) (0.0000) (0.0000) (0.0000) (0.0000) (0.0000)
Primary school 9 or
10 years
0.0661 0.0562 0.0608 0.0650 0.0562 0.0605(0.0017) (0.0013) (0.0011) (0.0017) (0.0013) (0.0011)
Secondary school
0.1444 0.0963 0.1203 0.1433 0.0963 0.1199(0.0015) (0.0011) (0.0009) (0.0015) (0.0011) (0.0009)
Higher educa tion
< two years
0.3301 0.2412 0.2931 0.3290 0.2412 0.2927(0.0020) (0.0018) (0.0014) (0.0020) (0.0018) (0.0014)
Higher education ≥ two years
0.3871 0.3024 0.3412 0.3855 0.3024 0.3408
(0.0016) (0.0011) (0.0010) (0.0016) (0.0011) (0.0010)
23 As we use the logarithm of wage as the outcome variable, the effect of a change in one of the explanatory variables is estimated by the antilog given by exp(estimated coefficient)-1.
Julian Simon Lecture Series – Eskil Wadensjö
27
Post-graduation education
0.6286 0.6200 0.6211 0.6263 0.6199 0.6203(0.0030) (0.0034) (0.0022) (0.0030) (0.0034) (0.0022)
Denmark0.0035 -0.0027 0.0006
(0.0052) (0.0033) (0.0030)
Finland-0.0434 -0.0031 -0.0190
(0.0019) (0.0010) (0.0009)
Iceland0.0352 0.0134 0.0234
(0.0125) (0.0073) (0.0069)
Norway0.0206 -0.0115 0.0012
(0.0054) (0.0025) (0.0026)
Nordic-0.0259 -0.0039 -0.0132
(0.0017) (0.0009) (0.0009)R-squared 0.248 0.267 0.304 0.249 0.267 0.304Number of
observations 703,387 920,930 1,624,317 703,387 920,930 1,624,317
Note. Standard errors within parentheses. People born in Sweden and immigrants born in Nor-dic countries are included in the estimations. Those with less than 9 years of education are the reference educational category.
Source: The SIEPS database which is based on individual register data from Statistics Sweden and the Swedish Migration Board.
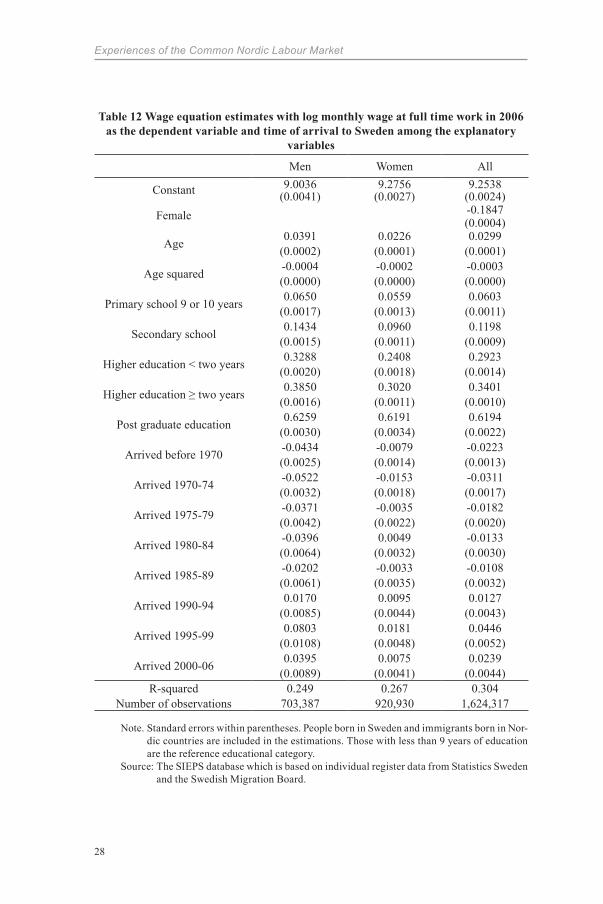
We have re-estimated the equations with dummies for the period of arrival (see Table 12). Maybe a bit surprisingly we found that the coeffi-cient for men from Nordic countries is negative for those who arrived be-fore 1990 but positive for those who arrived after 1990. The effect is rather large for those who arrived after 1995. There may be several explanations for that: 1) differences between different cohorts, 2) selective return mi-gration, 3) an adjustment to the mean for those who have stayed in Sweden for a long period. For women the tendencies go in the same direction, but the values of the coefficients are much smaller and not always significantly different from zero.
Experiences of the Common Nordic Labour Market
28
Table 12 Wage equation estimates with log monthly wage at full time work in 2006 as the dependent variable and time of arrival to Sweden among the explanatory
variables
Men Women All
Constant 9.0036 9.2756 9.2538(0.0041) (0.0027) (0.0024)
Female -0.1847(0.0004)
Age 0.0391 0.0226 0.0299(0.0002) (0.0001) (0.0001)
Age squared -0.0004 -0.0002 -0.0003(0.0000) (0.0000) (0.0000)
Primary school 9 or 10 years 0.0650 0.0559 0.0603(0.0017) (0.0013) (0.0011)
Secondary school 0.1434 0.0960 0.1198(0.0015) (0.0011) (0.0009)
Higher education < two years 0.3288 0.2408 0.2923(0.0020) (0.0018) (0.0014)
Higher education ≥ two years 0.3850 0.3020 0.3401(0.0016) (0.0011) (0.0010)
Post graduate education 0.6259 0.6191 0.6194(0.0030) (0.0034) (0.0022)
Arrived before 1970 -0.0434 -0.0079 -0.0223(0.0025) (0.0014) (0.0013)
Arrived 1970-74 -0.0522 -0.0153 -0.0311(0.0032) (0.0018) (0.0017)
Arrived 1975-79 -0.0371 -0.0035 -0.0182(0.0042) (0.0022) (0.0020)
Arrived 1980-84 -0.0396 0.0049 -0.0133(0.0064) (0.0032) (0.0030)
Arrived 1985-89 -0.0202 -0.0033 -0.0108(0.0061) (0.0035) (0.0032)
Arrived 1990-94 0.0170 0.0095 0.0127(0.0085) (0.0044) (0.0043)
Arrived 1995-99 0.0803 0.0181 0.0446(0.0108) (0.0048) (0.0052)
Arrived 2000-06 0.0395 0.0075 0.0239(0.0089) (0.0041) (0.0044)
R-squared 0.249 0.267 0.304Number of observations 703,387 920,930 1,624,317
Note. Standard errors within parentheses. People born in Sweden and immigrants born in Nor-dic countries are included in the estimations. Those with less than 9 years of education are the reference educational category.
Source: The SIEPS database which is based on individual register data from Statistics Sweden and the Swedish Migration Board.
Julian Simon Lecture Series – Eskil Wadensjö
29
Related to this issue is the situation for the children of the immigrants and their children, the second and third generations of immigrants.24 Ham-marstedt (2009) has studied the earnings of first generation immigrants in Sweden in 1968 (who lived in Sweden in 1960), and their children in 1980 and their grandchildren in 2003 compared to natives. The choice of pe-riod means that the study in practice covers immigration to Sweden from other European countries (mainly other Nordic countries). He finds that the first generation immigrants had significantly higher earnings than na-tives in 1968 when controlling for different characteristics (education, age, etc.). The second generation of immigrants’ earnings did not differ from those of the natives in 1980, but the earnings of the third generation of immigrants were significantly lower than those of the natives (in 2003). If the immigrants in the estimations are divided after countries of origin the signs of the coefficients are the same, but the coefficients are not always significantly different from zero. For immigrants from Finland the effect for the first generation is significant and positive and for those coming from other Nordic countries than Finland the effect for the third generation is significant and negative. The later result is difficult to explain.
Commuting over the Borders25
Migration to another Nordic country is not a necessary condition for being active in a national labour market other than in the country of residence. One possibility is to commute on a daily or weekly basis, working in one Nordic country and living in another. Another possibility is to work for em-ployers in another Nordic country in periods without changing residence. The last option is widely used for example by nurses and physicians, doing temporary work in another country than their home country.
There are a number of recent reports that give details on the current situation regarding commuting, and statistics on commuting over the na-tional borders are now continuously published on the websites of the statis-tical central bureaus of the Nordic countries. The information is the result
24 See SCB (2010) for a study covering many different aspects of the situation of second generation immigrants in Sweden.
25 See Andersson Joona and Wadensjö (2008) and Pedersen, Røed and Wadensjö (2008) for more detailed information.
Experiences of the Common Nordic Labour Market
30
of a joint project between the statistical bureaus that is built on administra-tive registers which make it possible to determine which residents in each of the Nordic countries who have had salaries or wages earned from an employer in another Nordic country. A summary of this information is presented in the following.
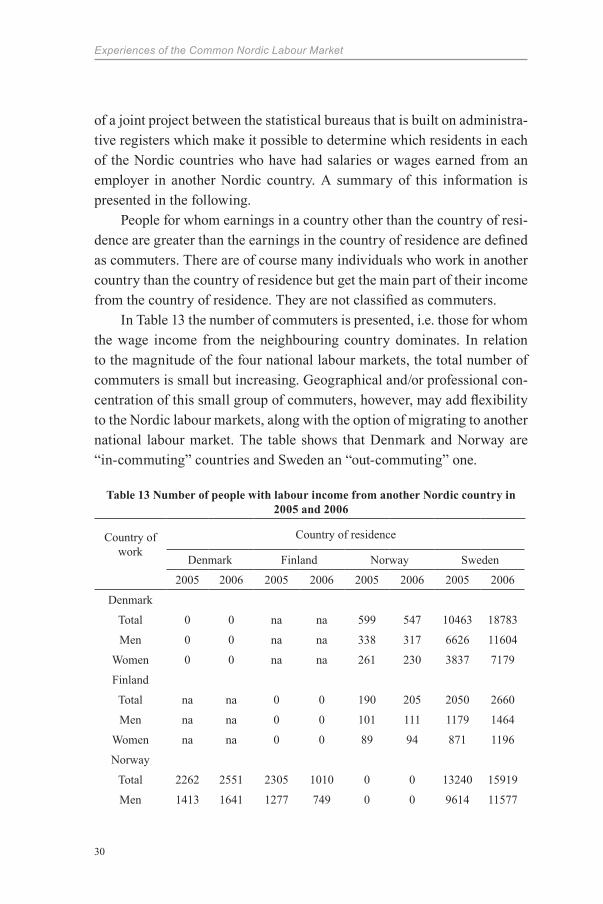
People for whom earnings in a country other than the country of resi-dence are greater than the earnings in the country of residence are defined as commuters. There are of course many individuals who work in another country than the country of residence but get the main part of their income from the country of residence. They are not classified as commuters.
In Table 13 the number of commuters is presented, i.e. those for whom the wage income from the neighbouring country dominates. In relation to the magnitude of the four national labour markets, the total number of commuters is small but increasing. Geographical and/or professional con-centration of this small group of commuters, however, may add flexibility to the Nordic labour markets, along with the option of migrating to another national labour market. The table shows that Denmark and Norway are “in-commuting” countries and Sweden an “out-commuting” one.
Table 13 Number of people with labour income from another Nordic country in 2005 and 2006
Country of work
Country of residence
Denmark Finland Norway Sweden
2005 2006 2005 2006 2005 2006 2005 2006
Denmark
Total 0 0 na na 599 547 10463 18783
Men 0 0 na na 338 317 6626 11604
Women 0 0 na na 261 230 3837 7179
Finland
Total na na 0 0 190 205 2050 2660
Men na na 0 0 101 111 1179 1464
Women na na 0 0 89 94 871 1196
Norway
Total 2262 2551 2305 1010 0 0 13240 15919
Men 1413 1641 1277 749 0 0 9614 11577
Julian Simon Lecture Series – Eskil Wadensjö
31
Women 849 910 1028 261 0 0 3626 4342Sweden
Total 1838 1980 2305 3244 1987 1961 0 0
Men 1089 1168 1277 1806 1065 1073 0 0
Women 749 812 1028 1438 922 888 0 0
Source: Nordic Council of MinistersNote: na = not available
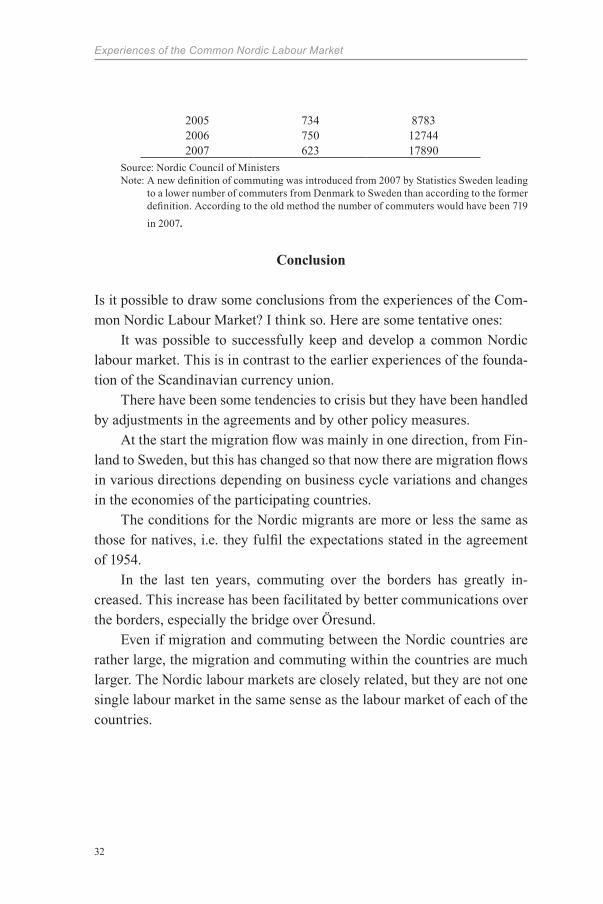
The fastest development in commuting has been that between Sweden and Denmark. Table 14 shows the development between 1997 and 2007. Important factors behind this development are the bridge over Öresund which was completed in June 2000, and restrictive rules regarding mar-riage migration introduced in Denmark in the beginning of the 2000s.
Of those who commuted from Skåne (the most southern province of Sweden, which includes the Malmö area) to the eastern part of Denmark (which includes the Copenhagen area) in 2007, 39.1 per cent were born in Denmark, 39.5 per cent in Sweden and 21.4 per cent in another country. Most of those who were born in a country other than Denmark and Swe-den are Danish or Swedish citizens.26
Even if the commuting between the countries is large and growing, it is not large in comparison with the commuting inside each country. As an example, it can be mentioned that 173,000 commuted to Copenhagen mu-nicipality from other municipalities in Denmark and 111,000 commuted from Copenhagen municipality to other Danish municipalities in 2007.
Table 14 Commuting between Denmark and Sweden between 1997 and 2007
26 Ny fra Danmarks Statistik, nr. 278, 17. juni 2009.
Year From Denmark to Sweden
From Sweden to Denmark
1997 166 21301998 188 23651999 204 25842000 281 30102001 539 37512002 533 46972003 536 56832004 692 7160
Experiences of the Common Nordic Labour Market
32
Source: Nordic Council of MinistersNote: A new definition of commuting was introduced from 2007 by Statistics Sweden leading
to a lower number of commuters from Denmark to Sweden than according to the former definition. According to the old method the number of commuters would have been 719
in 2007.
Conclusion
Is it possible to draw some conclusions from the experiences of the Com-mon Nordic Labour Market? I think so. Here are some tentative ones:
It was possible to successfully keep and develop a common Nordic labour market. This is in contrast to the earlier experiences of the founda-tion of the Scandinavian currency union.
There have been some tendencies to crisis but they have been handled by adjustments in the agreements and by other policy measures.
At the start the migration flow was mainly in one direction, from Fin-land to Sweden, but this has changed so that now there are migration flows in various directions depending on business cycle variations and changes in the economies of the participating countries.
The conditions for the Nordic migrants are more or less the same as those for natives, i.e. they fulfil the expectations stated in the agreement of 1954.
In the last ten years, commuting over the borders has greatly in-creased. This increase has been facilitated by better communications over the borders, especially the bridge over Öresund.
Even if migration and commuting between the Nordic countries are rather large, the migration and commuting within the countries are much larger. The Nordic labour markets are closely related, but they are not one single labour market in the same sense as the labour market of each of the countries.
2005 734 87832006 750 127442007 623 17890
Julian Simon Lecture Series – Eskil Wadensjö
33
References
Andersson Joona, Pernilla and Eskil Wadensjö (2008), Arbetskraftens rör-lighet i Norden – Drivkrafter och effekter, TemaNord 2008:524, Copenha-gen: Nordic Councils of Ministers.
Bergman, Michael, Stefan Gerlach and Lars Jonung (1993), “The rise and fall of the Scandinavian Currency Union 1873-1920”, European Economic Review, Vol. 37, pp. 507-517.
Black, Richard, Godfried Enghersen, Marek Okólski and Cristina Pantîru (forthcoming), A continent moving West? EU enlargement and labour mi-gration from Central and Eastern Europe, Amsterdam: Amsterdam Uni-versity Press.
Boguslaw, Julia (forthcoming), ”In- och utvandringspolitiskt kalendari-um”, Stockholm: SULCIS.
Diaconescu, Viorica and Tryggvesson, Rune (1992), ”Utvandrare – Vem är det?”, Demografiska rapporter 1992:2, SCB.
Emigrationsutredningen (1913), Betänkande i utvandringsfrågan och därmed samman häng an de spörsmål jämlikt Kungl. Brefvet den 30 januari 1907 afgivet af Gustav Sundbärg, Stockholm.
Eriksson, Tor (1989), “International Migration and Regional Differentials in Unemployment and Wages: Some empirical evidence from Finland”, in Ian Gordon and Anthony P. Thirlwall (Eds.), European Factor Mobility; Trends and Consequences, London: Macmillan.
Fisher, Peter A. and Thomas Straubhaar (1996), Migration and Economic Integration in the Nordic Common Labour Market, Nord 1996:2, Copen-hagen: Nordic Councils of Ministers.
Experiences of the Common Nordic Labour Market
34
Hammarstedt, Mats (2009), “Intergenerational Mobility and the Earnings Position of First-, Second and Third-Generation Immigrants”, Kyklos, Vol. 62, pp. 275-292.
Hietala, Kari (1978), “Migration Flows between the Nordic Countries in 1963-1975. An Econometric Analysis of the Factors behind them”, in Finn-ish Contributions to the IUSSP Conference on Economic and Demograph-ic Change: Issues for the 1980s. Helsinki.
Kahanec, Martin and Klaus F. Zimmermann (Eds.) (2009), EU Labor Markets After Post-Enlargement Migration, Springer Verlag, Berlin.
Lundborg, Per (1991), “Determinants of Migration in the Nordic Labor Market”, Scandinavian Journal of Economics, Vol. 93, pp. 363-376.
Lundborg, Per (2006), “EU enlargement, migration and labour market in-stitutions”, Zeit schrift für Arbeitsmarktforschung, Vol. 39, pp. 24-34.
Nyberg, Peter (1980), Emigration, ekonomisk tillväxt och stabilitet: en teo-retisk undersökning kring emigrationens orsaker och effekter på medel-lång sikt, PhD thesis, Åbo Akademi, Helsingfors: Finlands bank.
Ohlsson, Rolf (1975), Invandrarna på arbetsmarknaden, PhD thesis, Skrifter utgivna av Ekonomisk-historiska föreningen i Lund, Vol. 16.
Olsson, Lars (1995), På tröskeln till folkhemmet, Lund: Förlaget Morgon-rodnad.
Pedersen, Peder J. (1996), “Aggregated Intra-Nordic and Nordic-EC Mo-bility”, in Peder J. Pedersen (Ed.), Scandinavians without Borders – Skill Migration and the European Integration Process in Eskil Wadensjö (Ed.), The Nordic Labour Markets in the 1990’s, Part 2, Amsterdam: North-Hol-land.
Julian Simon Lecture Series – Eskil Wadensjö
35
Pedersen, Peder J., Røed, Marianne and Eskil Wadensjö (2008), The Com-mon Nordic Labor Market at 50, TemaNord 2008:506, Copenhagen: Nor-dic Councils of Ministers.
Rooth, Dan-Olof and Jan Saarela (2007), “Selection and return migration: Evidence from micro data”, Economic Letters, Vol. 94, pp. 90-95.
Røed, Marianne (1996), “Educational background and migratory behav-iour in the Scandi na vian labour market”, in Peder J. Pedersen (Ed.), Scan-dinavians without Borders - Skill Migration and the European Integra-tion Process, in Eskil Wadensjö (Ed.), The Nordic Labour Markets in the 1990’s, Part 2, Amsterdam: North-Holland.
Saarela, Jan and Fjalar Finnäs (2006), “Adjustment failures in an immi-grant population: Finns in Sweden”, Social Indicators Research, Vol. 82, pp. 545-563.
Saarela, Jan and Dan-Olof Rooth (2006), “How integrated are Finns in the Swedish Labour Market? Outcomes of Free Labour Mobility”, Interna-tional Migration, Vol. 44, pp. 119-150.
SCB (2010), “Född i Sverige – ändå olika. Betydelsen av föräldrarnas födelseland”, Demografiska rap por ter 2010:2.
Schröder, Lena (1996), “Scandinavian Skill Migration in the 1980s”, in Peder J. Pedersen (Ed.), Scandinavians without Borders - Skill Migration and the European Integration Process, in Eskil Wadensjö (Ed.), The Nor-dic Labour Markets in the 1990’s, Part 2, Amsterdam: North-Holland.
Schultz-Nielsen, Marie Louise (2010), Essays in Migration and Fertil-ity, PhD thesis, Department of Economics, Aarhus School of Business, Aarhus University.
Wadensjö, Eskil (1973), Immigration och samhällsekonomi, Lund: Stu-dentlitteratur.
Experiences of the Common Nordic Labour Market
36
Wadensjö, Eskil (1974), ”Immigrationen” in SOU 1974:29, Att utvärdera arbetsmarknads politik.
Wadensjö, Eskil (1975), “Lagstiftningen om 240 timmars svenskunder-visning och arbetslösheten bland utlänningar”, Ekonomisk Debatt, Vol. 3, pp. 51-55.
Wadensjö, Eskil (1976), “Factors Determining International Migration”, in Åke E. Andersson and Ingvar Holmberg (Eds.), Demographic, Economic and Social Interactions, Cambridge, Mass: Ballinger Publishing Company.
Wadensjö, Eskil (2008), “De svenska ekonomerna och utvandringen till Amerika”, in Anders Gustavsson, Sonja Olin Lauritzen and Per-Johan Öd-man, Främlingskap och tolkning – en vänbok till Charles Westin, Stock-holm: Stockholm University Press.
Willerslev, Richard (1983), Den glemte indvandring. Den svenske indvan-dring til Danmark 1850-1914, Copenhagen: Gyldendal.

IZAP.O. Box 7240
D-53072 Bonn
Germany
phone: +49-(228) 38 94 0
fax: +49-(228) 38 94 210
email: [email protected]
web: www.iza.org
AnnuAl
MigrAtionMeeting

![CHAMPION BEER OF SHOW Simon Bourman (Qld.)aabc.org.au/stateresults/AABC2019FullResults.pdf · Julian Robinson VIC Baltic Porter [BJCP 9C] 57 Simon Tongs TAS American Porter [BJCP](https://img.pdfslide.us/doc/110x75/60205775c3833e501c5223f5/champion-beer-of-show-simon-bourman-qldaabcorgaustateresults-julian-robinson.jpg)