Embed Size (px)
Citation preview

Supporting your success
Jujube development budget and market analysis
Rachelle Johnstone, Development Officer and Peter Gartrell, Senior Economist

1
Acknowledgements
Financial support for this work has been provided by Rural Industries Research and
Development Corporation. Export market information was provided by the Western
Australia Trade & Investment Offices in China, Singapore and Dubai. The sharing of
information from jujube growers and members of the WA Jujube Growers Association
Inc. is greatly appreciated.
Important disclaimer
The Chief Executive Officer of the Department of Primary Industries and Regional
Development and the State of Western Australia accept no liability whatsoever by
reason of negligence or otherwise arising from the use or release of this information
or any part of it.
Copyright © Western Australian Agriculture Authority, 2017

2
Contents
Introduction .................................................................................................... 3
Outline of analysis ......................................................................................... 3
Situation ........................................................................................................ 3
Capital investment ........................................................................................ 3
Methodology and interpretation ................................................................... 4
Market........................................................................................................... 4
Production .................................................................................................... 4
Development expenses ................................................................................ 4
Operating expenses ..................................................................................... 5
Analysis of jujube orchard development ..................................................... 5
Costs ............................................................................................................ 5
Income .......................................................................................................... 7
Results .......................................................................................................... 8
Sensitivity analysis ..................................................................................... 11
Recommendations and conclusions .......................................................... 14
Appendix – Jujube development budget tables ........................................ 15

3
Introduction
Jujubes (Ziziphus jujuba Mill.) are a relatively new crop in Australia but are showing
great potential to be a profitable and sustainable industry. Western Australia (WA) is
currently leading jujube production in Australia with around 40 growers with an
estimated 12 500 trees on 20 ha, producing around 25 tonnes of fresh fruit in 2014.
The bulk of commercial orchards are less than 5 years old, with many yet to produce,
hence the low production at present. Approximately 3,000 new trees are being
planted each year. In the eastern states jujubes are currently grown in New South
Wales, South Australia, Victoria and Queensland. The fruit’s drought and salinity
tolerance and multiple uses indicate great potential for many areas of Australia.
Jujubes are mostly sold as a fresh fruit in the Australian market, mainly at speciality
stores and via internet orders. WA’s proximity to South-East Asia and its counter
season production to the northern hemisphere provide an opportunity to market
product for the increasing demand especially during festivals in January and
February. However, we do not currently have the volume of fruit or the premium
varieties required.
This report is an outline for a jujube development budget. It is intended as a guide
only and is not the probable case for many producers. There is much variation
between producers due to a wide range of production systems, management
techniques, varieties and market options.
Outline of analysis
Situation
The base assumption for this report is examining the expansion of an existing
orchard. It assumes the existing business is expanding from 32 to 40 hectares.
Evaluation is over a period of 15 years. Planting forecast is four hectares in each of
the first two years.
Capital investment
The level of initial capital expenditure is a significant component in the profitability of
an activity. For an orchard expansion exercise, it is assumed that a majority of
machinery is available. Some additional capital is required to accommodate the
increase in demand (an extra tractor for example). The analysis includes the
assumptions that:
Irrigation source is sufficient
Prices are net of packing, packaging, storage and transport costs
Some machinery is owned and replacement cost is apportioned to this activity
Land lease is costed to the enterprise at $533 per hectare per annum
A discount rate of 7 per cent is used in the calculation of net present values
Managers drawings of $16,000 per annum and consultancy fees of $3,000
Labour is calculated at $25.80 per hour (including superannuation, workers
compensation and administration cost of 20 per cent)
Tractor operations costed at $20 per hour (includes fuel, oils, repairs and
maintenance).
4
Methodology and interpretation
An annual cash flow development budget is used to appraise the overall profitability
of the activity. This is used due to the relative long-term development for jujubes as a
perennial fruit crop.
Market
The target markets for a crop should be well understood before taking on a new
enterprise. Product price will be influenced by:
Supply changes
Produce quality
Timing of supply
Produce presentation
Consumer demand shifts
Product recognition
Most of these mechanisms are difficult to forecast with any accuracy for any one
year. As jujubes are a relatively new industry in Australia there is not a lot of
information on price and volume trends so a best estimate has been used based on
knowledge available.
The target markets used in this analysis include the domestic market and export
markets in China, Singapore and the United Arab Emirates (UAE). Export prices
were determined using information gathered by the Western Australian Trade Office.
More detailed data is required for each market (weekly or monthly for fresh produce).
Data must be examined in line with the expected timing of supply, protocol
requirements and postharvest capacity. The Singapore pricing appears to conflict
with the other markets but has still been used in average pricing.
For this analysis a net farm gate price is used. This means that the post-harvest
costs are deducted from the gross price (packing, packaging, storage and transport).
Production
Yield estimates have been based on current production knowledge of jujubes in
Western Australia. Yields will vary with different varieties and growing region.
Similarly the percentage split of quality or market grades should be estimated with
caution. The sensitivity of the budget to likely shifts in yield and pack-out should be
tested.
Development expenses
All development expenses are those required for the expansion of the enterprise.
These are one-off costs and equipment purchases. Development costs for this
analysis include:
Irrigation construction, equipment and installation (water source and major
headwork is assumed to be sufficient)
Machinery purchases (cost of new and specialised equipment and
replacement of existing equipment when required)
Site preparation

5
Plant material and planting
Establishment fertiliser and chemicals
Trellis and netting purchase and installation
Machinery and equipment purchases are outlined in the ‘Capital Investment’ section
above. Development costs include labour and material components.
Operating expenses
These are costs that are directly incurred as a result of the operation. The costs and
demand for labour can vary significantly and are often difficult to estimate without
some practical experience. An orchard’s variable costs typically include:
Tree pruning, thinning and training
Pest control and fertiliser
Irrigation operation and maintenance
Harvest and post-harvest costs
All these operating cost categories include the material and labour components. Any
tractor requirements include fuel, oil, maintenance and cost provisions. In addition to
these typical operating expenses are the overhead, overdraft, management and
consultancy expenses.
Overhead costs are those that are incurred as a result of general business operating.
They largely remain static for the business regardless of production income or cost
changes. They typically include general fuel and oil, repairs and maintenance,
electricity, rates, phones, insurance and accountant costs.
The overdraft has been calculated at a ratio of 60 per cent of expenses held on
account for 6 months with an interest rate of 11 per cent.
Management and consultancy costs are estimated for the activity. Management
payment is for time (labour) in managing the orchard including logistical co-
ordination, technical research, marketing, planning, office management and other
essential but indirect production costs. For this analysis the annual provision for
management and consultancy is $16,000 and $3,000 respectively (8 of 40 hectares
for $80,000 and $15,000 respectively).
Analysis of jujube orchard development
Costs
See the appendix for detailed budget tables.
Development costs
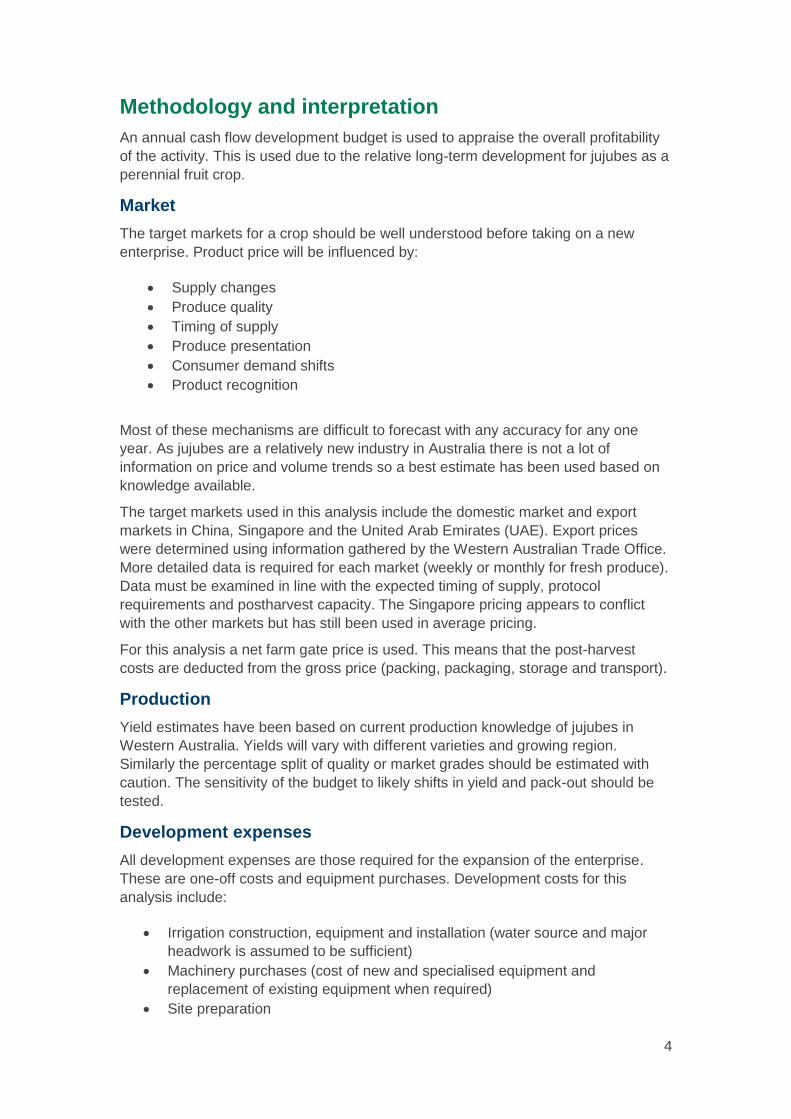
Total development cost over the first five years is $891,403 or $111,425 per hectare
(Table 1). Thirty-eight per cent of this cost is trellising and netting and 32.5 per cent is
plants and planting costs (Figure 1).
Tree plantings are based on 4m row with 3m between trees. This equates to 833
trees per hectare at $40 per tree, a total cost of $33,333 per hectare plus 111 hours
of labour to plant at a cost of $2,864 per hectare.
6
Trellising and netting is the highest portion of the development costs. Permanent
netting is costed at $35,000 per hectare while temporary netting is costed annually at
$4,500 per hectare.
Irrigation costs do not include water source construction, main lines or pumping
equipment. Maintenance of these structures are realised in the pumping cost
provision.
Table 1 Development costs for the first 5 years of the jujube expansion
ITEM TOTAL $/HA
Plants & Planting $289,577 $36,197
Trellising & Netting $338,876 $42,360
Irrigation $69,657 $8,707
Plant and machinery $146,200 $18,275
Site Development Costs $47,093 $5,887
Total Development Costs for first 5 years $891,403 $111,426
Figure 1 Breakdown of development costs for the first 5 years
Operating costs
Operating costs increase from $9,089 per hectare in the first year to $31,074 per
hectare in the mature crop starting year eight (Table 2). The most significant
increasing cost is harvesting which equates to 58 per cent of the total operating costs
(Figure 2). The harvest costs are mainly for labour.
Pruning, thinning and inspection costs make up 13 per cent of the total operating
costs for the mature crop at year 8.
Irrigation operating and power are significant costs but are variable with the irrigation
system efficiency, source quality and location (Appendix, Table 4).
Plants & Planting
33%
Trellising & Netting
38%
Irrigation 8% Plant and
machinery 16%
Site Development
Costs 5%
7
Table 2 Operating costs for a mature jujube crop (from year 8)
ITEM TOTAL $/HA
Pruning, Inspection / Thinning, Netting $31,992 $3,999
Pest Control $10,728 $1,341
Fertiliser & Testing $9,154 $1,144
Irrigation operating, fuel & electricity $18,756 $2,345
Harvest $144,289 $18,036
Management & Consultancy $19,000 $2,375
Other Costs $14,671 $1,834
Total Mature Crop Operating Costs $248,590 $31,074
Figure 2 Breakdown of operating costs for a mature jujube crop
Income
The enterprise targets the domestic market initially until production increases enough
to supply the export market in year five (Figure 3). The quality of export produce is
generally higher than that for the other markets. Export sales will be targeted to
Singapore, China and the UAE.
The net price per kilogram used for the analysis is $4.58 for Export, $5.63 for
Domestic Grade 1 and $2.93 for Domestic Grade 2. These prices are based on
current market estimates but more detailed data is required. For more accurate
results data must be examined in line with expected timing of supply, protocol
requirements and post-harvest capacity. The Singapore pricing appears to conflict
with other markets but have still been used in average pricing.
Pruning, Inspection / Thinning, Netting
13%
Pest Control 4%
Fertiliser & Testing
4% Irrigation
operating, fuel & elect.
7%
Harvest 58%
Mgt & Consult 8%
Other Costs 6%

8
Figure 3 Progression of yield and grades over 10 years of the enterprise
Results
Mature orchard
The gross margin for the mature crop in year eight is $655,379 or $81,922 per
hectare (Table 3). This is calculated prior to taxation and capital finance.
Table 3 Cumulative bank result prior to taxation
Breakeven Year: Year 8 (2024)
Cumulative Cash flow at this time: $587,422
Cash Balance at this time - pre-tax / post finance: $748,356
YIYO Maturity Year 8 TOTAL $/HA
Total Income - excludes equity and loans $908,968 $113,621
Total Expense - excludes capital finance cost $253,589 $31,699
Gross Margin - Income less expenses $655,379 $81,922
Whole result
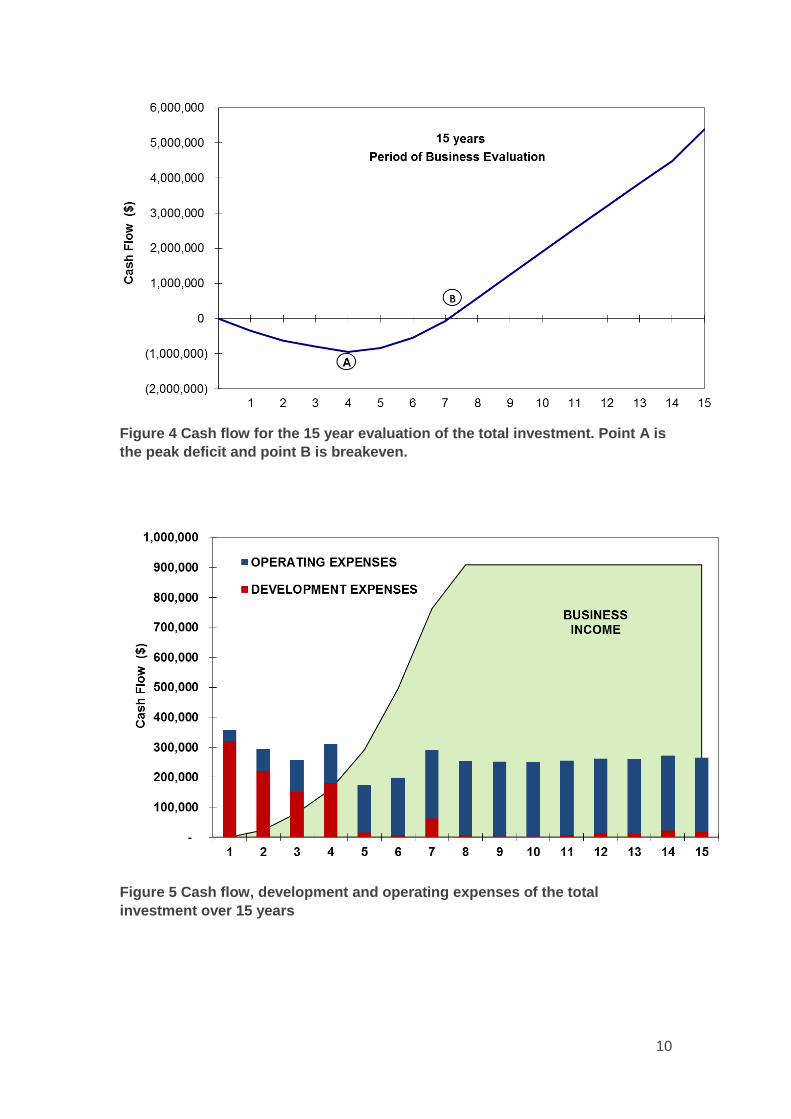
Peak cash flow deficit of $954,487 will occur at year four of the enterprise ($119,311
per hectare). Breakeven year will be expected in year seven of the development
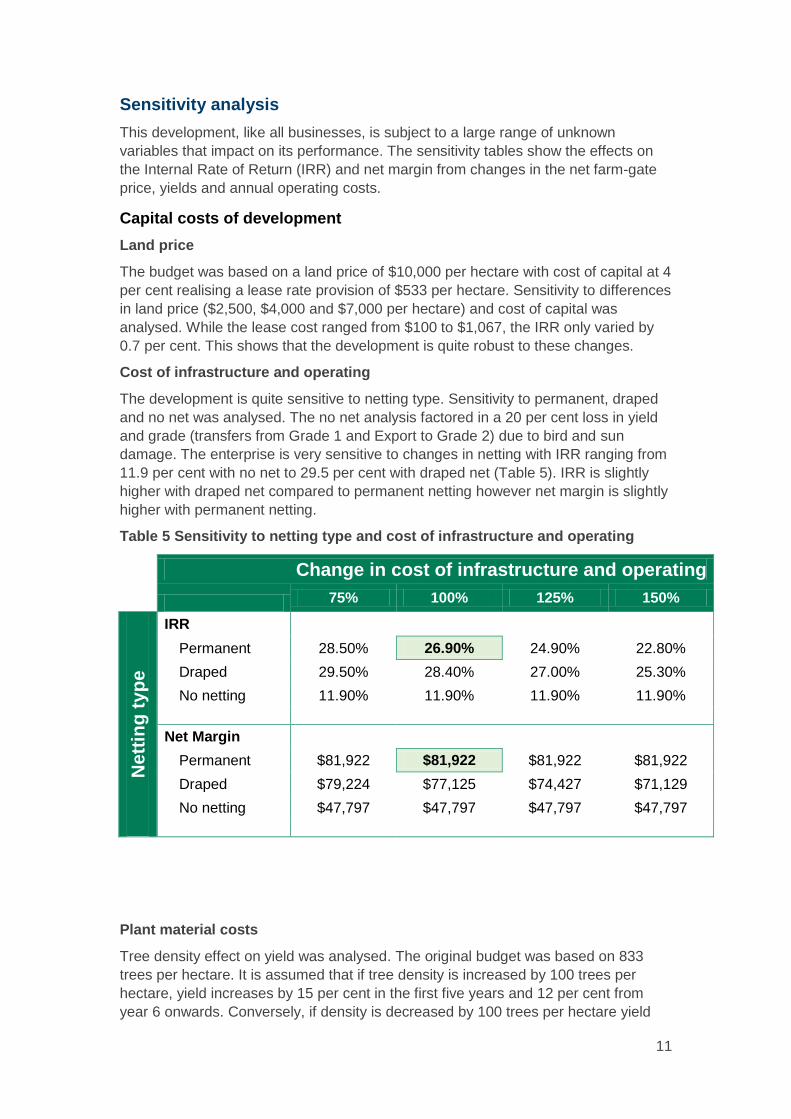
(Figure 4). Figure 5 shows the progression of income which is forecast to remain
static from year eight onwards.
Without explaining how to calculate or the nuances of the investment measures of
Internal Rate of Return (IRR), Net Present Value (NPV) and Benefit Cost Ratio
(BCR), it is best to utilise these as simplified comparative measures of an investment.
IRR is best used as comparing ‘apples with apples’, i.e. it is best to use this for
comparing similar investments or sensitivities within an investment. IRR is not a
return on capital but an indicator of investment performance. NPV and BCR are
useful when comparing ‘apples with light globes’; very different investment profiles.

9
NPV needs to be greater than 0; the higher the better. It is indicative of the overall
scale or impact of the investment. A negative result indicates loss. BCR will be
greater than 1 if NPV is positive, again the higher the better. It is indicative of a
higher return profile where investment capital is limiting.
Table 4 Key investment result measures for the jujube development
Investment result measure Value
Net Present Value ($Million) 2.26
Internal Rate of Return (%) 26.88
Benefit Cost Ratio (X:1) 1.93
Present Value of Benefits ($Million) 4.7
Present Value of Costs ($Million) 2.44
Investment results show positive outcomes for the projected performance of this
development. The NPV is greater than 0, the BCR is greater than 1, which is
indicative that the investment is positive given the discount rate used (7 per cent per
annum). This takes into account the future value of cash flows and represents the
investment return in a current sum of return or ratio.
The IRR is greater than the discount rate, which indicates a positive result. An IRR of
26.88 per cent is considered very robust. It is almost 20 per cent greater than the
discount rate, but one should consider the risk profile of the investment. The
sensitivity testing of the key elements is essential when considering the “what if?”
scenarios that may eventuate with changes to assumptions.
Agricultural investments are typically sensitive to price/yield parameters. It is
imperative that a clear understanding of risks affecting these parameters is
understood. Understanding risks (variations) in the assumptions used in the cost and
timing of key investment capital and operational costs is also very important. Analysis
should identify the likelihood and impact of any such changes.
10
Figure 4 Cash flow for the 15 year evaluation of the total investment. Point A is
the peak deficit and point B is breakeven.
Figure 5 Cash flow, development and operating expenses of the total
investment over 15 years
11
Sensitivity analysis
This development, like all businesses, is subject to a large range of unknown
variables that impact on its performance. The sensitivity tables show the effects on
the Internal Rate of Return (IRR) and net margin from changes in the net farm-gate
price, yields and annual operating costs.
Capital costs of development
Land price
The budget was based on a land price of $10,000 per hectare with cost of capital at 4
per cent realising a lease rate provision of $533 per hectare. Sensitivity to differences
in land price ($2,500, $4,000 and $7,000 per hectare) and cost of capital was
analysed. While the lease cost ranged from $100 to $1,067, the IRR only varied by
0.7 per cent. This shows that the development is quite robust to these changes.
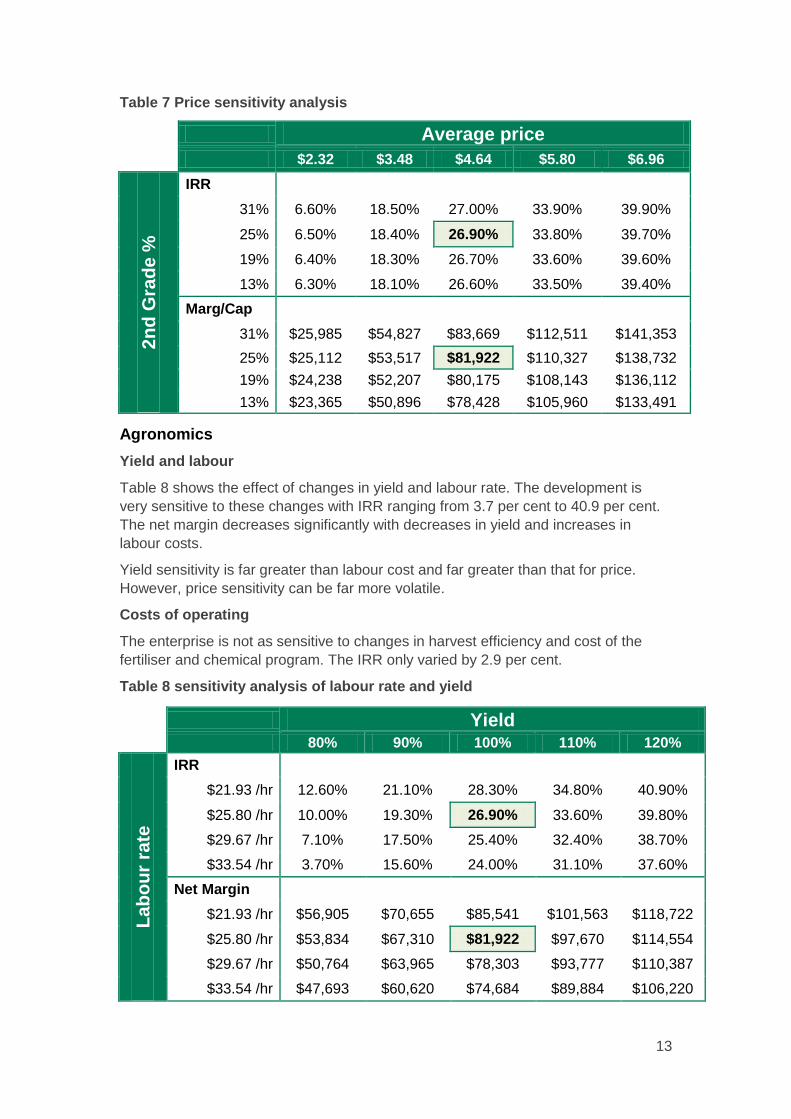
Cost of infrastructure and operating
The development is quite sensitive to netting type. Sensitivity to permanent, draped
and no net was analysed. The no net analysis factored in a 20 per cent loss in yield
and grade (transfers from Grade 1 and Export to Grade 2) due to bird and sun
damage. The enterprise is very sensitive to changes in netting with IRR ranging from
11.9 per cent with no net to 29.5 per cent with draped net (Table 5). IRR is slightly
higher with draped net compared to permanent netting however net margin is slightly
higher with permanent netting.
Table 5 Sensitivity to netting type and cost of infrastructure and operating
Change in cost of infrastructure and operating
75% 100% 125% 150%
Ne
ttin
g t
yp
e
IRR
Permanent 28.50% 26.90% 24.90% 22.80%
Draped 29.50% 28.40% 27.00% 25.30%
No netting 11.90% 11.90% 11.90% 11.90%
Net Margin
Permanent $81,922 $81,922 $81,922 $81,922
Draped $79,224 $77,125 $74,427 $71,129
No netting $47,797 $47,797 $47,797 $47,797
Plant material costs
Tree density effect on yield was analysed. The original budget was based on 833
trees per hectare. It is assumed that if tree density is increased by 100 trees per
hectare, yield increases by 15 per cent in the first five years and 12 per cent from
year 6 onwards. Conversely, if density is decreased by 100 trees per hectare yield

12
decreases by 15 per cent in the first five years and continues to decrease by 12 per
cent from year 6 onwards. Real data to support this assumption does not exist.
The budget was based on a price of $40 per tree. The effects of changes in tree price
and tree density on IRR and annual marginal return divided by capital invested
(Marg/Cap) are shown in Table 6. IRR and Marg/Cap increase as tree price reduces
and tree density increases.
Table 6 Sensitivity to tree price and density
Tree price
$20 $30 $40 $50
Tre
e d
en
sit
y
IRR
625 trees/ha 27.7% 26.4% 25.3% 24.2%
833 trees/ha 30.0% 28.4% 26.9% 25.5%
1,042 trees/ha 32.0% 30.0% 28.2% 26.6%
Marg/Cap
625 trees/ha 79% 74% 69% 65%
833 trees/ha 86% 79% 74% 68%
1,042 trees/ha 93% 84% 77% 71%
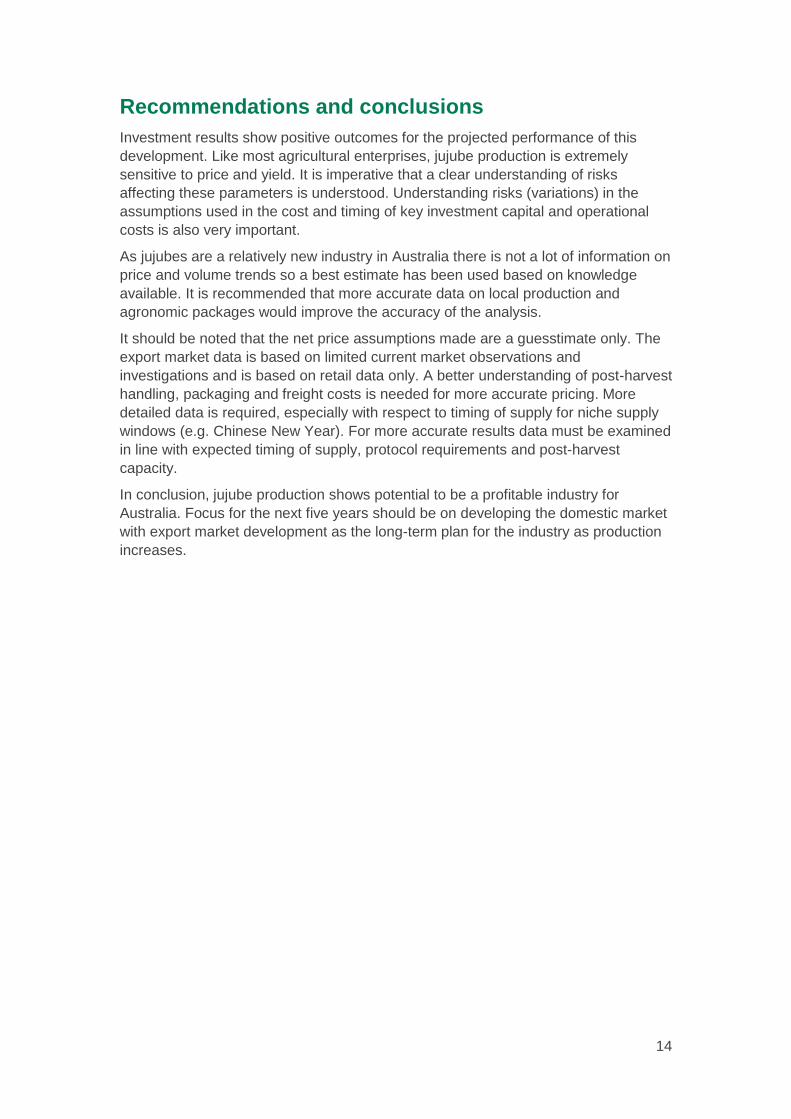
Market
Price sensitivity analysis is shown in Table 7. Net price includes packing, packaging,
freight, storage and transport costs. The base prices are based on current market
estimates but more detailed data is required. For more accurate results data must be
examined in line with expected timing of supply, protocol requirements and post-
harvest capacity.
The analysis shows the effect of changes in net price and grade on IRR and Net
Margin. The development is extremely sensitive to these changes with IRR ranging
from 6.3 per cent to 39.9 per cent. This shows that market assessment and
development will be critical for the success of the business.
13
Table 7 Price sensitivity analysis
Average price
$2.32 $3.48 $4.64 $5.80 $6.96 2
nd
Gra
de %
IRR
31% 6.60% 18.50% 27.00% 33.90% 39.90%
25% 6.50% 18.40% 26.90% 33.80% 39.70%
19% 6.40% 18.30% 26.70% 33.60% 39.60%
13% 6.30% 18.10% 26.60% 33.50% 39.40%
Marg/Cap
31% $25,985 $54,827 $83,669 $112,511 $141,353
25% $25,112 $53,517 $81,922 $110,327 $138,732
19% $24,238 $52,207 $80,175 $108,143 $136,112
13% $23,365 $50,896 $78,428 $105,960 $133,491
Agronomics
Yield and labour
Table 8 shows the effect of changes in yield and labour rate. The development is
very sensitive to these changes with IRR ranging from 3.7 per cent to 40.9 per cent.
The net margin decreases significantly with decreases in yield and increases in
labour costs.
Yield sensitivity is far greater than labour cost and far greater than that for price.
However, price sensitivity can be far more volatile.
Costs of operating
The enterprise is not as sensitive to changes in harvest efficiency and cost of the
fertiliser and chemical program. The IRR only varied by 2.9 per cent.
Table 8 sensitivity analysis of labour rate and yield
Yield 80% 90% 100% 110% 120%
La
bo
ur
rate
IRR
$21.93 /hr 12.60% 21.10% 28.30% 34.80% 40.90%
$25.80 /hr 10.00% 19.30% 26.90% 33.60% 39.80%
$29.67 /hr 7.10% 17.50% 25.40% 32.40% 38.70%
$33.54 /hr 3.70% 15.60% 24.00% 31.10% 37.60%
Net Margin
$21.93 /hr $56,905 $70,655 $85,541 $101,563 $118,722
$25.80 /hr $53,834 $67,310 $81,922 $97,670 $114,554
$29.67 /hr $50,764 $63,965 $78,303 $93,777 $110,387
$33.54 /hr $47,693 $60,620 $74,684 $89,884 $106,220
14
Recommendations and conclusions
Investment results show positive outcomes for the projected performance of this
development. Like most agricultural enterprises, jujube production is extremely
sensitive to price and yield. It is imperative that a clear understanding of risks
affecting these parameters is understood. Understanding risks (variations) in the
assumptions used in the cost and timing of key investment capital and operational
costs is also very important.
As jujubes are a relatively new industry in Australia there is not a lot of information on
price and volume trends so a best estimate has been used based on knowledge
available. It is recommended that more accurate data on local production and
agronomic packages would improve the accuracy of the analysis.
It should be noted that the net price assumptions made are a guesstimate only. The
export market data is based on limited current market observations and
investigations and is based on retail data only. A better understanding of post-harvest
handling, packaging and freight costs is needed for more accurate pricing. More
detailed data is required, especially with respect to timing of supply for niche supply
windows (e.g. Chinese New Year). For more accurate results data must be examined
in line with expected timing of supply, protocol requirements and post-harvest
capacity.
In conclusion, jujube production shows potential to be a profitable industry for
Australia. Focus for the next five years should be on developing the domestic market
with export market development as the long-term plan for the industry as production
increases.
15
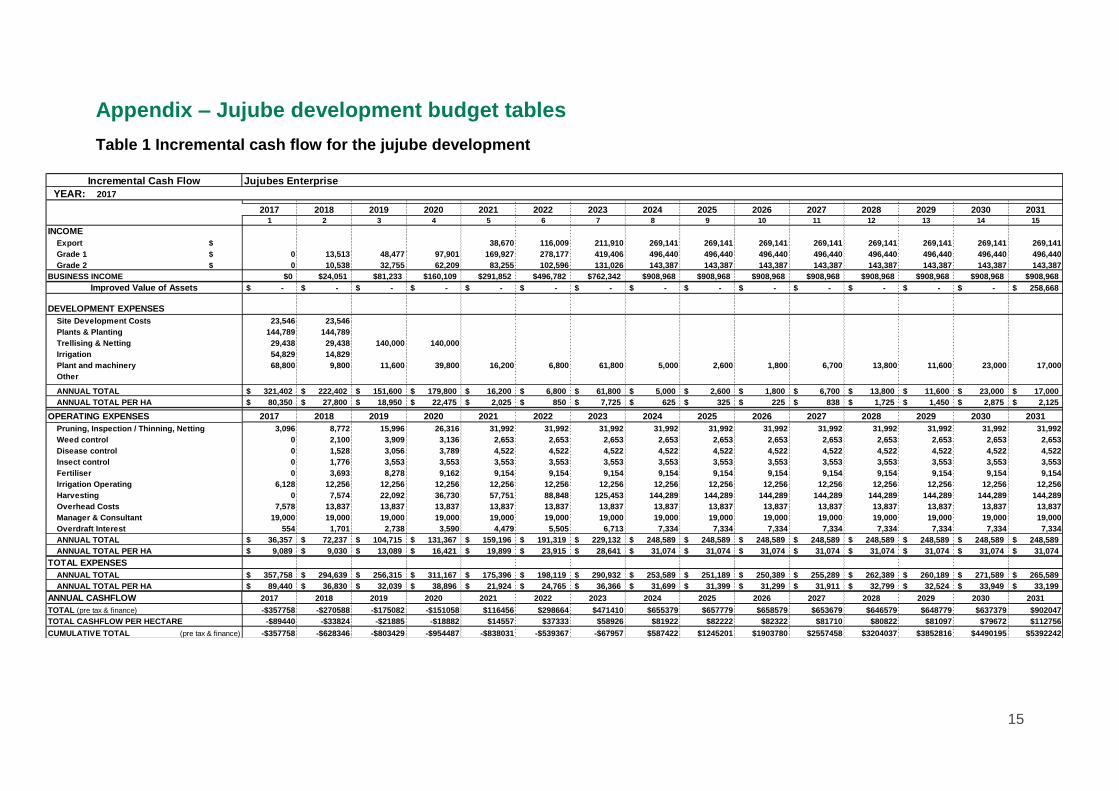
Appendix – Jujube development budget tables
Table 1 Incremental cash flow for the jujube development
Incremental Cash Flow Jujubes Enterprise
YEAR: 2017
2017 2018 2019 2020 2021 2022 2023 2024 2025 2026 2027 2028 2029 2030 20311 2 3 4 5 6 7 8 9 10 11 12 13 14 15
INCOME
Export $ 38,670 116,009 211,910 269,141 269,141 269,141 269,141 269,141 269,141 269,141 269,141
Grade 1 $ 0 13,513 48,477 97,901 169,927 278,177 419,406 496,440 496,440 496,440 496,440 496,440 496,440 496,440 496,440
Grade 2 $ 0 10,538 32,755 62,209 83,255 102,596 131,026 143,387 143,387 143,387 143,387 143,387 143,387 143,387 143,387
BUSINESS INCOME $0 $24,051 $81,233 $160,109 $291,852 $496,782 $762,342 $908,968 $908,968 $908,968 $908,968 $908,968 $908,968 $908,968 $908,968
Improved Value of Assets -$ -$ -$ -$ -$ -$ -$ -$ -$ -$ -$ -$ -$ -$ 258,668$
DEVELOPMENT EXPENSES
Site Development Costs 23,546 23,546
Plants & Planting 144,789 144,789
Trellising & Netting 29,438 29,438 140,000 140,000
Irrigation 54,829 14,829
Plant and machinery 68,800 9,800 11,600 39,800 16,200 6,800 61,800 5,000 2,600 1,800 6,700 13,800 11,600 23,000 17,000
Other
ANNUAL TOTAL 321,402$ 222,402$ 151,600$ 179,800$ 16,200$ 6,800$ 61,800$ 5,000$ 2,600$ 1,800$ 6,700$ 13,800$ 11,600$ 23,000$ 17,000$
ANNUAL TOTAL PER HA 80,350$ 27,800$ 18,950$ 22,475$ 2,025$ 850$ 7,725$ 625$ 325$ 225$ 838$ 1,725$ 1,450$ 2,875$ 2,125$
OPERATING EXPENSES 2017 2018 2019 2020 2021 2022 2023 2024 2025 2026 2027 2028 2029 2030 2031
Pruning, Inspection / Thinning, Netting 3,096 8,772 15,996 26,316 31,992 31,992 31,992 31,992 31,992 31,992 31,992 31,992 31,992 31,992 31,992
Weed control 0 2,100 3,909 3,136 2,653 2,653 2,653 2,653 2,653 2,653 2,653 2,653 2,653 2,653 2,653
Disease control 0 1,528 3,056 3,789 4,522 4,522 4,522 4,522 4,522 4,522 4,522 4,522 4,522 4,522 4,522
Insect control 0 1,776 3,553 3,553 3,553 3,553 3,553 3,553 3,553 3,553 3,553 3,553 3,553 3,553 3,553
Fertiliser 0 3,693 8,278 9,162 9,154 9,154 9,154 9,154 9,154 9,154 9,154 9,154 9,154 9,154 9,154
Irrigation Operating 6,128 12,256 12,256 12,256 12,256 12,256 12,256 12,256 12,256 12,256 12,256 12,256 12,256 12,256 12,256
Harvesting 0 7,574 22,092 36,730 57,751 88,848 125,453 144,289 144,289 144,289 144,289 144,289 144,289 144,289 144,289
Overhead Costs 7,578 13,837 13,837 13,837 13,837 13,837 13,837 13,837 13,837 13,837 13,837 13,837 13,837 13,837 13,837
Manager & Consultant 19,000 19,000 19,000 19,000 19,000 19,000 19,000 19,000 19,000 19,000 19,000 19,000 19,000 19,000 19,000
Overdraft Interest 554 1,701 2,738 3,590 4,479 5,505 6,713 7,334 7,334 7,334 7,334 7,334 7,334 7,334 7,334
ANNUAL TOTAL 36,357$ 72,237$ 104,715$ 131,367$ 159,196$ 191,319$ 229,132$ 248,589$ 248,589$ 248,589$ 248,589$ 248,589$ 248,589$ 248,589$ 248,589$
ANNUAL TOTAL PER HA 9,089$ 9,030$ 13,089$ 16,421$ 19,899$ 23,915$ 28,641$ 31,074$ 31,074$ 31,074$ 31,074$ 31,074$ 31,074$ 31,074$ 31,074$
TOTAL EXPENSES
ANNUAL TOTAL 357,758$ 294,639$ 256,315$ 311,167$ 175,396$ 198,119$ 290,932$ 253,589$ 251,189$ 250,389$ 255,289$ 262,389$ 260,189$ 271,589$ 265,589$
ANNUAL TOTAL PER HA 89,440$ 36,830$ 32,039$ 38,896$ 21,924$ 24,765$ 36,366$ 31,699$ 31,399$ 31,299$ 31,911$ 32,799$ 32,524$ 33,949$ 33,199$
ANNUAL CASHFLOW 2017 2018 2019 2020 2021 2022 2023 2024 2025 2026 2027 2028 2029 2030 2031
TOTAL (pre tax & finance) -$357758 -$270588 -$175082 -$151058 $116456 $298664 $471410 $655379 $657779 $658579 $653679 $646579 $648779 $637379 $902047
TOTAL CASHFLOW PER HECTARE -$89440 -$33824 -$21885 -$18882 $14557 $37333 $58926 $81922 $82222 $82322 $81710 $80822 $81097 $79672 $112756
CUMULATIVE TOTAL (pre tax & finance) -$357758 -$628346 -$803429 -$954487 -$838031 -$539367 -$67957 $587422 $1245201 $1903780 $2557458 $3204037 $3852816 $4490195 $5392242
16
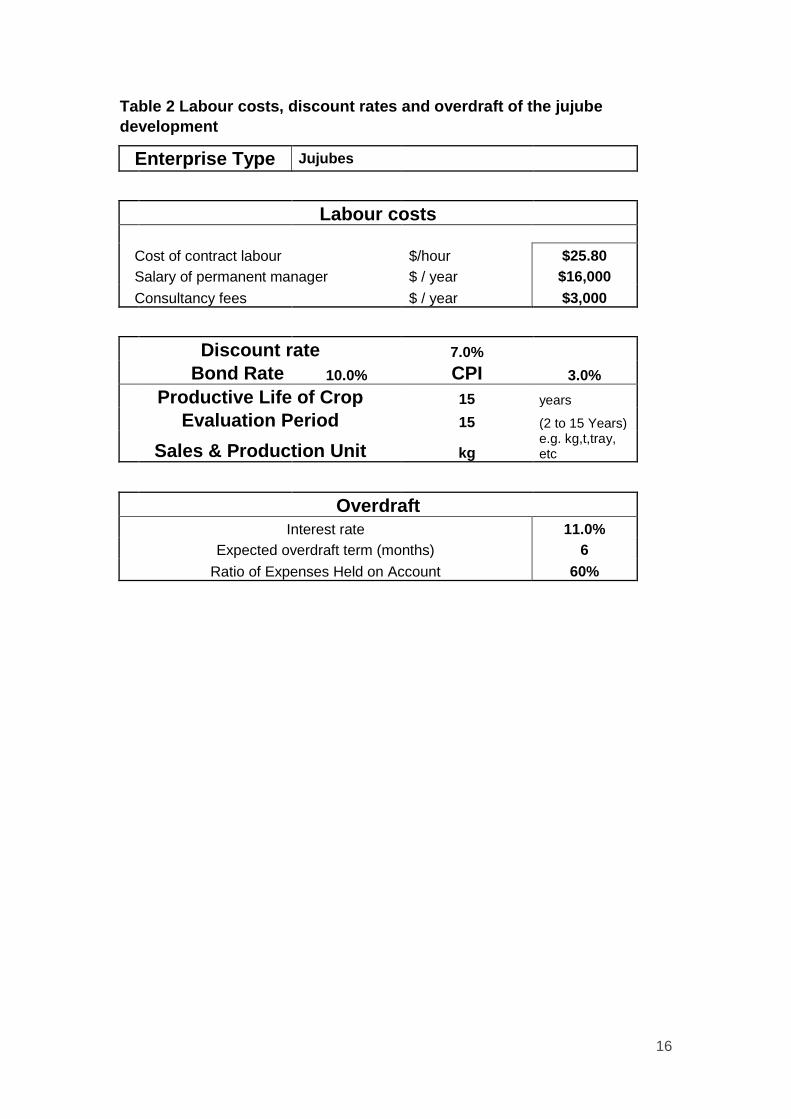
Table 2 Labour costs, discount rates and overdraft of the jujube
development
Enterprise Type Jujubes
Labour costs
Cost of contract labour $/hour $25.80
Salary of permanent manager $ / year $16,000
Consultancy fees $ / year $3,000
Discount rate 7.0%
Bond Rate 10.0% CPI 3.0%
Productive Life of Crop 15 years
Evaluation Period 15 (2 to 15 Years)
Sales & Production Unit kg e.g. kg,t,tray, etc
Overdraft
Interest rate 11.0%
Expected overdraft term (months) 6
Ratio of Expenses Held on Account 60%
17
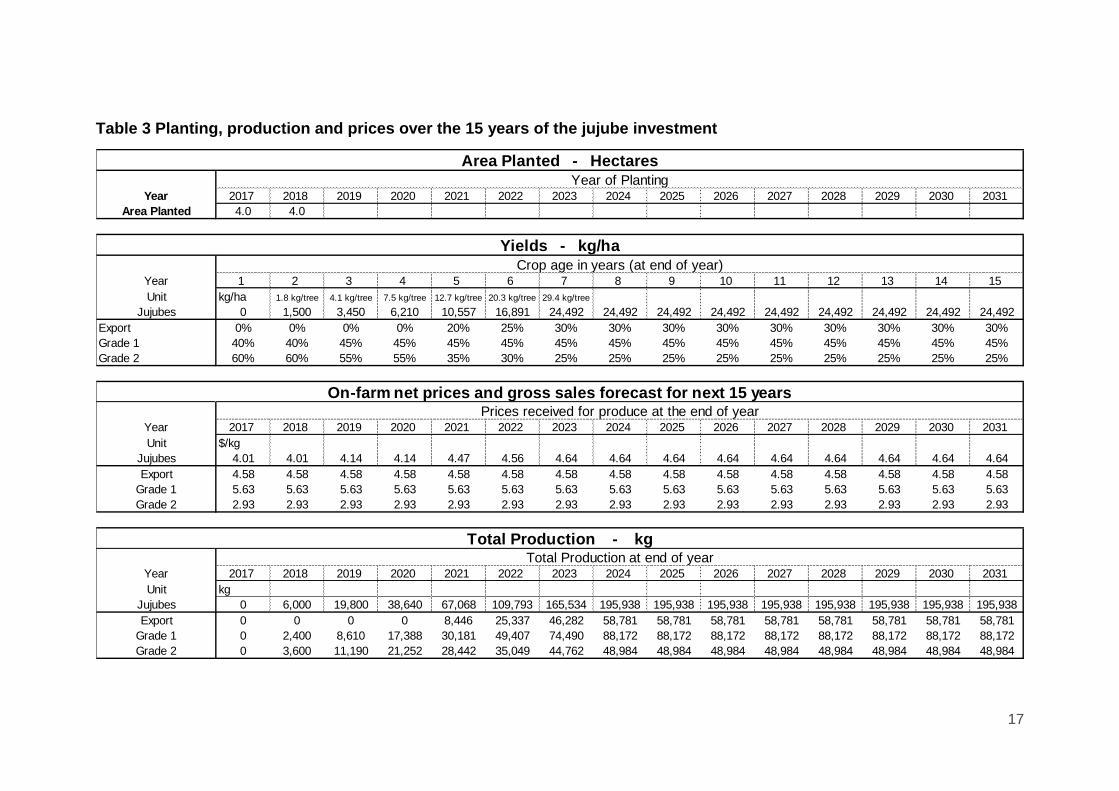
Table 3 Planting, production and prices over the 15 years of the jujube investment
Area Planted - Hectares
Year of PlantingYear 2017 2018 2019 2020 2021 2022 2023 2024 2025 2026 2027 2028 2029 2030 2031
Area Planted 4.0 4.0
Yields - kg/ha
Crop age in years (at end of year)Year 1 2 3 4 5 6 7 8 9 10 11 12 13 14 15
Unit kg/ha 1.8 kg/tree 4.1 kg/tree 7.5 kg/tree 12.7 kg/tree 20.3 kg/tree 29.4 kg/tree
Jujubes 0 1,500 3,450 6,210 10,557 16,891 24,492 24,492 24,492 24,492 24,492 24,492 24,492 24,492 24,492
Export 0% 0% 0% 0% 20% 25% 30% 30% 30% 30% 30% 30% 30% 30% 30%
Grade 1 40% 40% 45% 45% 45% 45% 45% 45% 45% 45% 45% 45% 45% 45% 45%
Grade 2 60% 60% 55% 55% 35% 30% 25% 25% 25% 25% 25% 25% 25% 25% 25%
On-farm net prices and gross sales forecast for next 15 yearsPrices received for produce at the end of year
Year 2017 2018 2019 2020 2021 2022 2023 2024 2025 2026 2027 2028 2029 2030 2031
Unit $/kg
Jujubes 4.01 4.01 4.14 4.14 4.47 4.56 4.64 4.64 4.64 4.64 4.64 4.64 4.64 4.64 4.64
Export 4.58 4.58 4.58 4.58 4.58 4.58 4.58 4.58 4.58 4.58 4.58 4.58 4.58 4.58 4.58
Grade 1 5.63 5.63 5.63 5.63 5.63 5.63 5.63 5.63 5.63 5.63 5.63 5.63 5.63 5.63 5.63
Grade 2 2.93 2.93 2.93 2.93 2.93 2.93 2.93 2.93 2.93 2.93 2.93 2.93 2.93 2.93 2.93
Total Production - kgTotal Production at end of year
Year 2017 2018 2019 2020 2021 2022 2023 2024 2025 2026 2027 2028 2029 2030 2031
Unit kg
Jujubes 0 6,000 19,800 38,640 67,068 109,793 165,534 195,938 195,938 195,938 195,938 195,938 195,938 195,938 195,938
Export 0 0 0 0 8,446 25,337 46,282 58,781 58,781 58,781 58,781 58,781 58,781 58,781 58,781
Grade 1 0 2,400 8,610 17,388 30,181 49,407 74,490 88,172 88,172 88,172 88,172 88,172 88,172 88,172 88,172
Grade 2 0 3,600 11,190 21,252 28,442 35,049 44,762 48,984 48,984 48,984 48,984 48,984 48,984 48,984 48,984
18
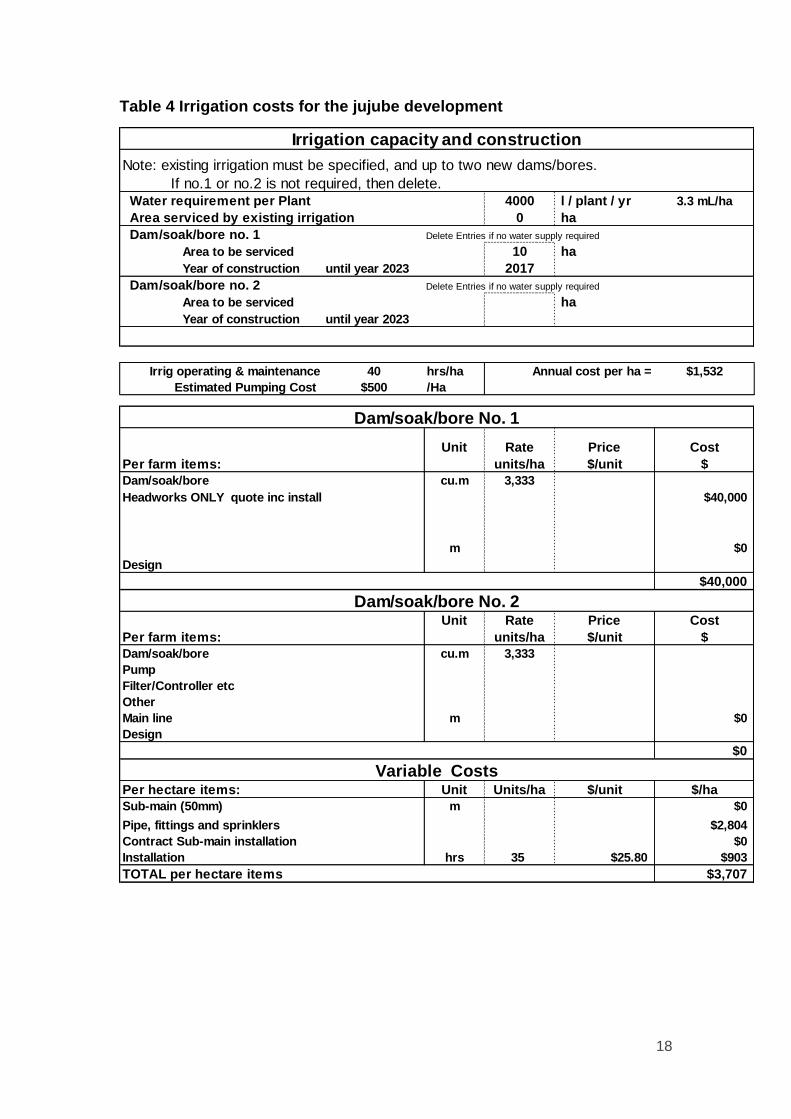
Table 4 Irrigation costs for the jujube development
Irrigation capacity and construction
Note: existing irrigation must be specified, and up to two new dams/bores.
If no.1 or no.2 is not required, then delete. Water requirement per Plant 4000 l / plant / yr 3.3 mL/ha
Area serviced by existing irrigation 0 ha
Dam/soak/bore no. 1 Delete Entries if no water supply required
Area to be serviced 10 ha
Year of construction until year 2023 2017
Dam/soak/bore no. 2 Delete Entries if no water supply required
Area to be serviced ha
Year of construction until year 2023
Irrig operating & maintenance 40 hrs/ha Annual cost per ha = $1,532
Estimated Pumping Cost $500 /Ha
Dam/soak/bore No. 1
Unit Rate Price Cost
Per farm items: units/ha $/unit $
Dam/soak/bore cu.m 3,333
Headworks ONLY quote inc install $40,000
m $0
Design
$40,000
Dam/soak/bore No. 2Unit Rate Price Cost
Per farm items: units/ha $/unit $
Dam/soak/bore cu.m 3,333
Pump
Filter/Controller etc
Other
Main line m $0
Design
$0
Variable CostsPer hectare items: Unit Units/ha $/unit $/ha
Sub-main (50mm) m $0
Pipe, fittings and sprinklers $2,804
Contract Sub-main installation $0
Installation hrs 35 $25.80 $903
TOTAL per hectare items $3,707

Table 5 Machinery costs for the jujube development
Plant and Buildings NB. give 2017 new prices. New Disposal Useful %age Use Years to Year of 1st
Buildings, Plant & Machinery Value Value % Life Yrs this Activity replacement Purchase
Tractor $75,000 40% 10 40% 4
Tractor $60,000 40% 10 40% 5
Weedsprayer $5,000 30% 12 100% 2017
Airblast Sprayer $20,000 40% 8 100% 2020
Fertiliser Spreader $3,500 20% 10 100% 2017
Truck $50,000 50% 12 20% 6
Slasher x 1 $3,000 30% 10 100% 2017
Cultivator 2nd hand $6,000 20% 20 100% 2017
Trailers $9,000 30% 10 100% 2019
Picking platforms $60,000 25% 12 100% 2023
4 x 4 motor bike $8,000 60% 6 25% 3
4 x 4 motor bike $8,000 60% 6 100% 2018
Windbreaks $12,500 0% 25 100% 2017
Sheds $25,000 0% 20 100% 2017
Coolstore
Dam/soak/bore no. 1 $40,000 20 100% 2017
Dam/soak/bore no. 2 $0 20 100% 0
Sundry Items $12,000 Annual Sundry Replacement Provision $1,800
Tractor operating costs (fuel,oil, grease) 20.00 $ / hour
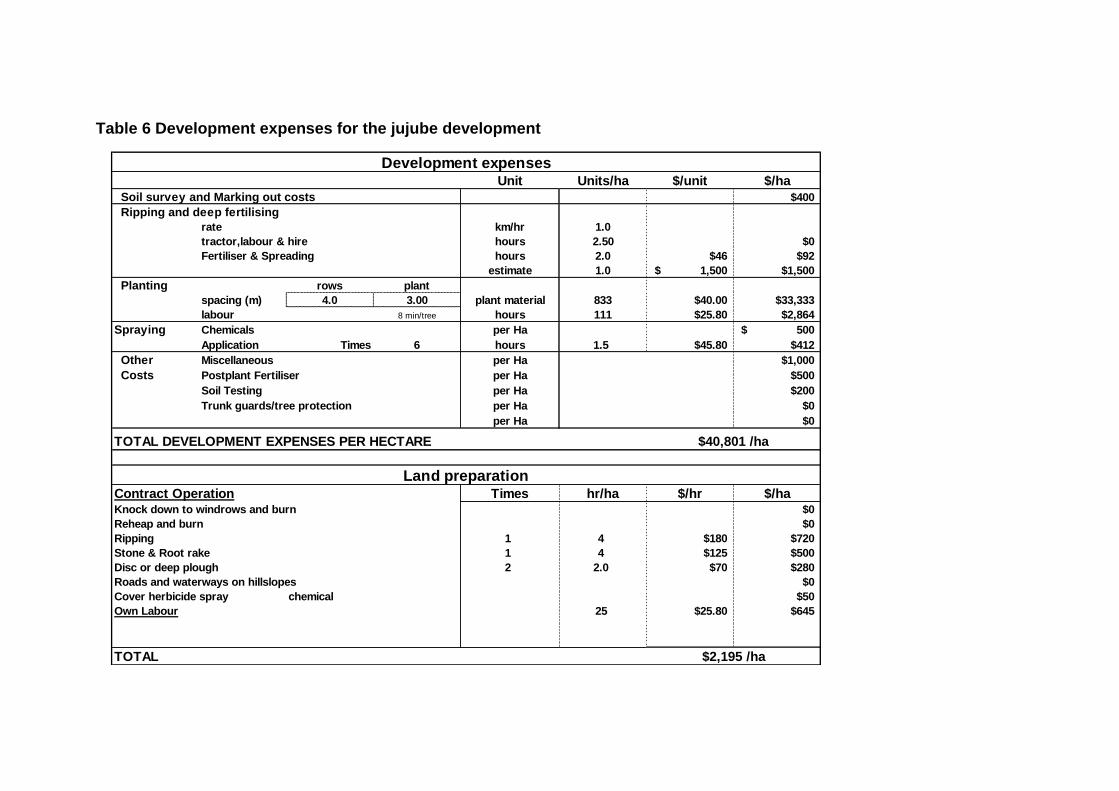
Table 6 Development expenses for the jujube development
Development expenses Unit Units/ha $/unit $/ha
Soil survey and Marking out costs $400
Ripping and deep fertilising
rate km/hr 1.0
tractor,labour & hire hours 2.50 $0
Fertiliser & Spreading hours 2.0 $46 $92
estimate 1.0 1,500$ $1,500
Planting rows plant
spacing (m) 4.0 3.00 plant material 833 $40.00 $33,333
labour 8 min/tree hours 111 $25.80 $2,864
Spraying Chemicals per Ha 500$
Application Times 6 hours 1.5 $45.80 $412
Other Miscellaneous per Ha $1,000
Costs Postplant Fertiliser per Ha $500
Soil Testing per Ha $200
Trunk guards/tree protection per Ha $0
per Ha $0
TOTAL DEVELOPMENT EXPENSES PER HECTARE $40,801 /ha
Land preparationContract Operation Times hr/ha $/hr $/haKnock down to windrows and burn $0
Reheap and burn $0
Ripping 1 4 $180 $720
Stone & Root rake 1 4 $125 $500
Disc or deep plough 2 2.0 $70 $280
Roads and waterways on hillslopes $0
Cover herbicide spray chemical $50
Own Labour 25 $25.80 $645
TOTAL $2,195 /ha

Table 7 Trellising and netting costs for the jujube development
Trellising costs (year 1)row length km row/ha rows/ ha Rate Price Cost
100 metres 2.5 25 Unit units/ha $/unit $/ha
Item
strainer posts Posts 50 $30.00 $ 1,500
posts Posts 250 $15.00 $ 3,750
labour total @ hours 40 $25.80 $ 1,032
Wire, staples and clips $ 1,078
_
_ $ -
_
TOTAL $7360 / ha
Netting costsType 1 0 if no netting 1 if permanent enclosed structure
Erect after planting 2 Yrs 2 if BirdTex (15 yr life span) & draped on rows
Item (0-4 yrs) Width Life Yrs Unit Units/Ha $/Unit Cost $/Ha
Permanent: Netting 15 sq. m -$
Support structure 35,000$
Labour hrs 25.80$ -$
35,000$
Temporary: Netting Annualised cost m 1 4,500$ 4,500$
Other Materials
Labour hrs 25.80$ -$
4,500$

Table 8 Pruning, training and thinning costs for the jujube development
Pruning, Training and Thinning
Year(s) Unit Rate Price Cost
Item units/ha $/unit $/ha
Summer Prune/train Labour 1 hrs 20 25.80 516$
2 hrs 35 25.80 903$
3 hrs 50 25.80 1,290$
4,etc hrs 60 25.80 1,548$
Winter Prune/train Labour 1 hrs 5 25.80 129$
2 hrs 10 25.80 258$
3 hrs 30 25.80 774$
4,etc hrs 55 25.80 1,419$
1 -$
2 -$
3 -$
4,etc -$
Inspection / Thinning 1 hrs 5 25.80 129$
Labour 2 hrs 10 25.80 258$
3 hrs 20 25.80 516$
4,etc hrs 40 25.80 1,032$
1 -$
2 -$
3 -$
4,etc -$
Table 9 Weed control costs for the jujube development
Weed Control
Item Year(s) Unit Units/ha Times $/Unit Cost $/ha
Spray Seed 2 L 4.0 2 13.00$ 104.00$
3 L 4.0 1 52.00$
4,etc L 4.0 -$
2 -$
3 -$
4,etc -$
Glyphosate 450 2 L 16.00$ -$
3 L 3.0 1 48.00$
4,etc L 3.0 1 48.00$
Basta 2 L 4.0 1 2.20$ 8.80$
3 L 4.0 1 8.80$
4,etc L 4.0 1 8.80$
Mow / slash 2,3 or 4 2 hrs 1.5 3 45.80$ 206.10$
Mow / slash 2,3 or 4 3 hrs 1.5 2 45.80$ 137.40$
Mow / slash 2,3 or 4 4 hrs 1.5 2 45.80$ 137.40$
2,3 or 4 -$
Spraying 2 hrs 1.5 3 45.80$ 206.10$
3 hrs 1.5 3 45.80$ 206.10$
4,etc hrs 1.5 2 45.80$ 137.40$
TOTAL 2 525$
3 452$
4,etc 332$
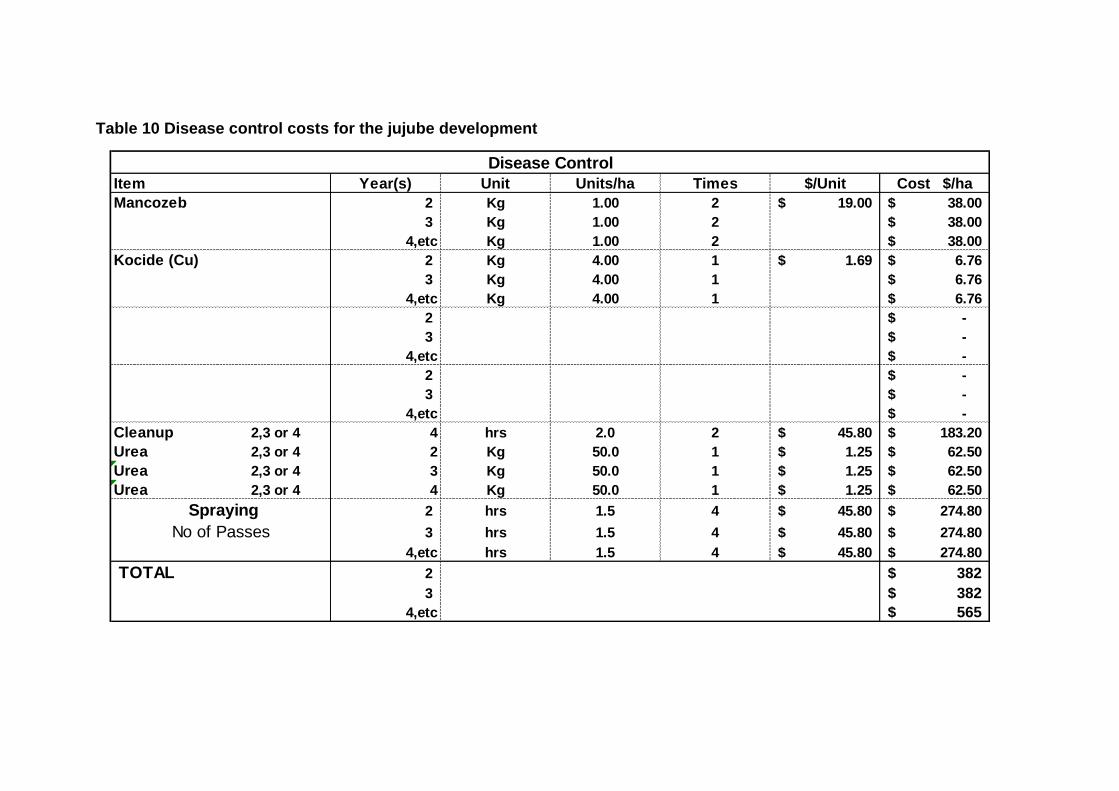
Table 10 Disease control costs for the jujube development
Disease Control
Item Year(s) Unit Units/ha Times $/Unit Cost $/ha
Mancozeb 2 Kg 1.00 2 19.00$ 38.00$
3 Kg 1.00 2 38.00$
4,etc Kg 1.00 2 38.00$
Kocide (Cu) 2 Kg 4.00 1 1.69$ 6.76$
3 Kg 4.00 1 6.76$
4,etc Kg 4.00 1 6.76$
2 -$
3 -$
4,etc -$
2 -$
3 -$
4,etc -$
Cleanup 2,3 or 4 4 hrs 2.0 2 45.80$ 183.20$
Urea 2,3 or 4 2 Kg 50.0 1 1.25$ 62.50$
Urea 2,3 or 4 3 Kg 50.0 1 1.25$ 62.50$
Urea 2,3 or 4 4 Kg 50.0 1 1.25$ 62.50$
Spraying 2 hrs 1.5 4 45.80$ 274.80$
No of Passes 3 hrs 1.5 4 45.80$ 274.80$
4,etc hrs 1.5 4 45.80$ 274.80$
TOTAL 2 382$
3 382$
4,etc 565$
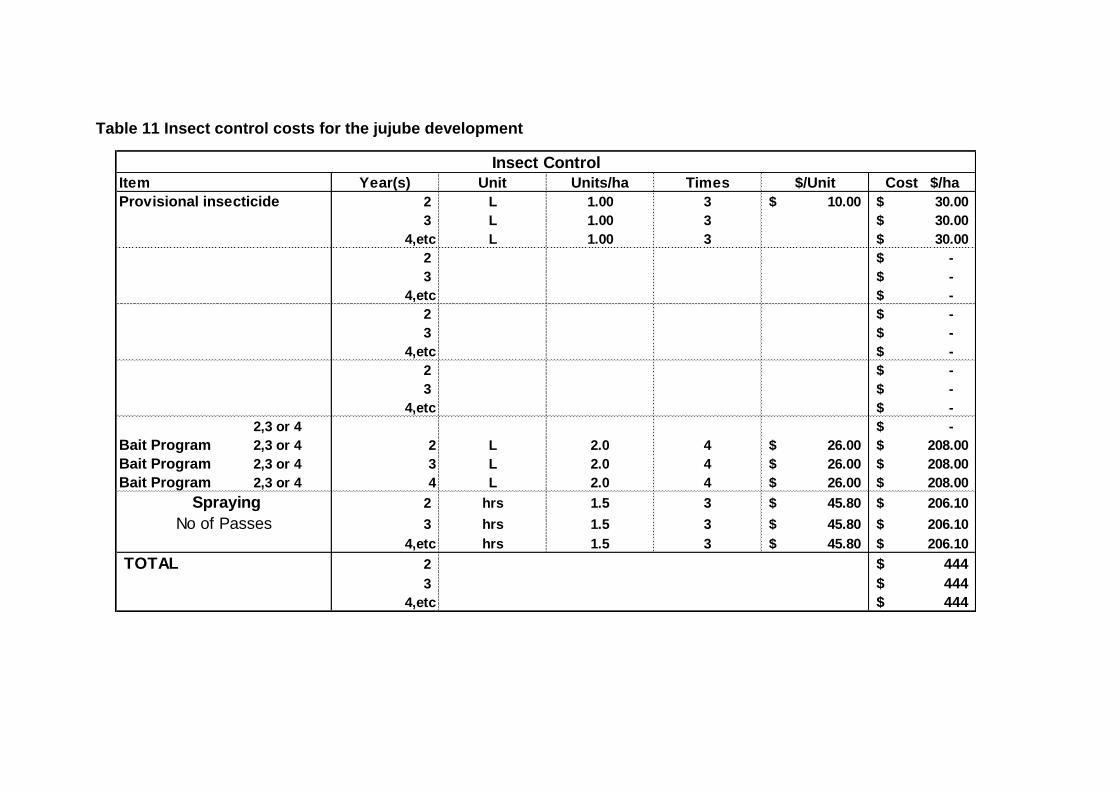
Table 11 Insect control costs for the jujube development
Insect Control
Item Year(s) Unit Units/ha Times $/Unit Cost $/ha
Provisional insecticide 2 L 1.00 3 10.00$ 30.00$
3 L 1.00 3 30.00$
4,etc L 1.00 3 30.00$
2 -$
3 -$
4,etc -$
2 -$
3 -$
4,etc -$
2 -$
3 -$
4,etc -$
2,3 or 4 -$
Bait Program 2,3 or 4 2 L 2.0 4 26.00$ 208.00$
Bait Program 2,3 or 4 3 L 2.0 4 26.00$ 208.00$
Bait Program 2,3 or 4 4 L 2.0 4 26.00$ 208.00$
Spraying 2 hrs 1.5 3 45.80$ 206.10$
No of Passes 3 hrs 1.5 3 45.80$ 206.10$
4,etc hrs 1.5 3 45.80$ 206.10$
TOTAL 2 444$
3 444$
4,etc 444$
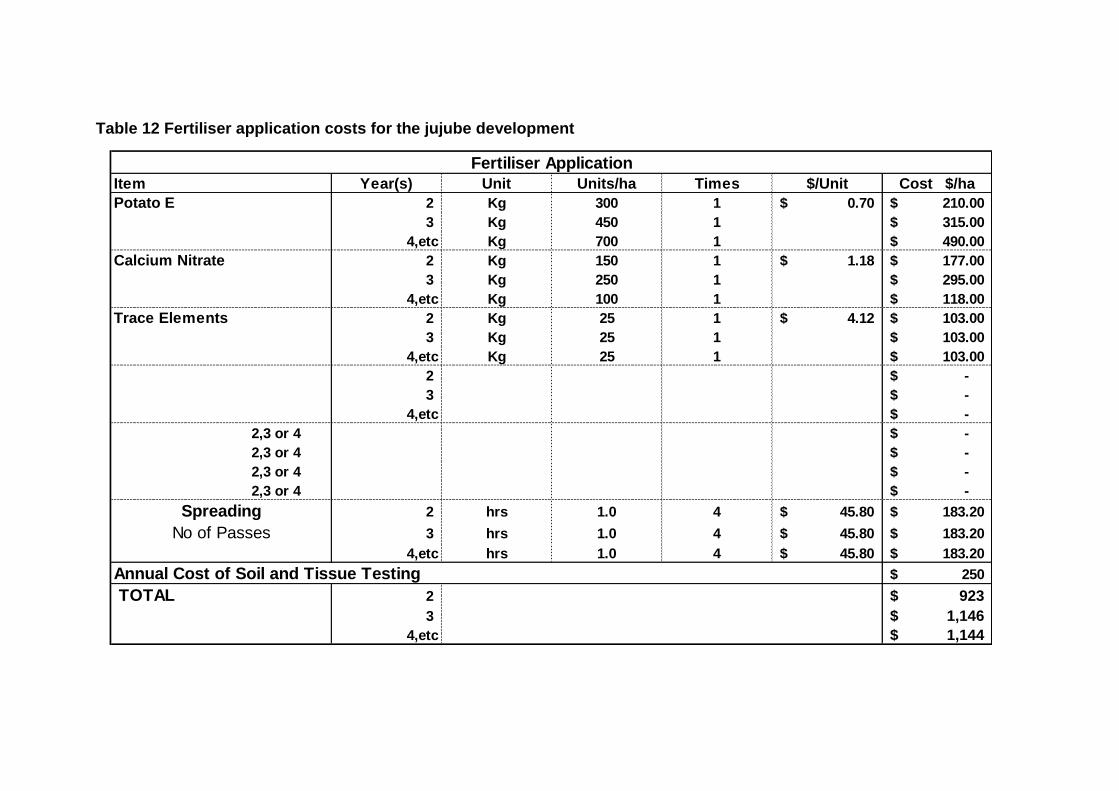
Table 12 Fertiliser application costs for the jujube development
Fertiliser Application
Item Year(s) Unit Units/ha Times $/Unit Cost $/ha
Potato E 2 Kg 300 1 0.70$ 210.00$
3 Kg 450 1 315.00$
4,etc Kg 700 1 490.00$
Calcium Nitrate 2 Kg 150 1 1.18$ 177.00$
3 Kg 250 1 295.00$
4,etc Kg 100 1 118.00$
Trace Elements 2 Kg 25 1 4.12$ 103.00$
3 Kg 25 1 103.00$
4,etc Kg 25 1 103.00$
2 -$
3 -$
4,etc -$
2,3 or 4 -$
2,3 or 4 -$
2,3 or 4 -$
2,3 or 4 -$
Spreading 2 hrs 1.0 4 45.80$ 183.20$
No of Passes 3 hrs 1.0 4 45.80$ 183.20$
4,etc hrs 1.0 4 45.80$ 183.20$
Annual Cost of Soil and Tissue Testing 250$
TOTAL 2 923$
3 1,146$
4,etc 1,144$

Table 13 Harvesting costs for the jujube development
Harvesting costs
Year Work Rate Price Cost
Hours/tonne $/hr $/kg
Picking & Quality Control labour 1 25.80$ -$
72 hrs/ha 2 48.0 25.80$ 1.238$
138 hrs/ha 3 40.0 25.80$ 1.032$
211 hrs/ha 4 34.0 25.80$ 0.877$
338 hrs/ha 5 32.0 25.80$ 0.826$
507 hrs/ha 6 30.0 25.80$ 0.774$
686 hrs/ha 7 etc 28.0 25.80$ 0.722$
Harvest machinery operating
cost per hr of harvest operation 0.50$
Cartage to store
Grading cost
Packaging cost
Storage cost
TOTAL Year Cost/kg
1 -$
2 1.26$
3 1.05$
4 0.89$
5 0.84$
6 0.79$
7 etc 0.74$
Harvest Conversion
Working Rate H S = seconds, M = minutes, H = hours
Harvest Unit tonne eg tonne, kilogram, tray, etc
No. of kg per harvest unit 1000